Article

Review on Gaps and Challenges in Prediction Outdoor Thermal Comfort Indices: Leveraging Industry 4.0 and ‘Knowledge Translation’

by
Mohamed H. Elnabawi
1,* and
Neveen Hamza
2
1
Architectural Engineering Department, College of Engineering, United Arab Emirates University, Al Ain P.O. Box 15551, United Arab Emirates
2
School of Architecture, Planning and Landscape, Newcastle University, Newcastle upon Tyne NE1 7RU, UK
*
Author to whom correspondence should be addressed.
Buildings 2024, 14(4), 879; https://doi.org/10.3390/buildings14040879
Submission received: 24 December 2023 / Revised: 7 March 2024 / Accepted: 18 March 2024 / Published: 25 March 2024

Abstract

:
The current outdoor thermal comfort index assessment is either based on thermal sensation votes collected through field surveys/questionnaires or using equations fundamentally backed by thermodynamics, such as the widely used UTCI and PET indices. The predictive ability of all methods suffers from discrepancies as multi-sensory attributes, cultural, emotional, and psychological cognition factors are ignored. These factors are proven to influence the thermal sensation and duration people spend outdoors, and are equally prominent factors as air temperature, solar radiation, and relative humidity. The studies that adopted machine learning models, such as Artificial Neural Networks (ANNs), concentrated on improving the predictive capability of PET, thereby making the field of Artificial Intelligence (AI) domain underexplored. Furthermore, universally adopted outdoor thermal comfort indices under-predict a neutral thermal range, for a reason that is linked to the fact that all indices were validated on European/American subjects living in temperate, cold regions. The review highlighted gaps and challenges in outdoor thermal comfort prediction accuracy by comparing traditional methods and Industry 4.0. Additionally, a further recommendation to improve prediction accuracy by exploiting Industry 4.0 (machine learning, artificial reality, brain–computer interface, geo-spatial digital twin) is examined through Knowledge Translation.

1. Introduction

Thermal comfort provision is a priority design consideration to provide comfortable indoor living space and reduce CO2 emissions from inefficient dependency on HVAC systems while promoting the productivity and wellness of occupants [1]. People spending more than 90% indoors further accentuates the significance of designing and controlling all the variables linked with indoor thermal comfort [2]. However, research evidence strongly advises spending at least 30 min outdoors or in open spaces daily to enable occupants to optimize their physical and mental wellness [3]. It is reported that obesity, suicide rates, anxiety, and depression rates have increased since the information age’s plethoric advancement, which became a key reason for triggering people, including children, to spend additional time indoors [4]. This will also increase the economic burden of major depressive disorder (MDD) among US adults, increasing from USD 236 billion in 2010 to USD 326 billion in 2018 [5]. Besides concerns related to wellness and rising electricity consumption, continuous exposure to air conditioners can cause cancer and respiratory illnesses as cooling/heating systems release negative ions in the indoor environment [6]. Similarly, paints, sealants, cleansers, and coatings continuously emit Volatile Organic Compounds (VOCs), which may induce a myriad of diseases like skin irritation and damage to the kidney, liver, and central nervous system [7].
Unlike indoor thermal comfort, which is related to providing a comfortable indoor space, outdoor thermal comfort estimation can generate decisions for general public health awareness, public health services, and promoting tourism to alert necessary stakeholders about outdoor thermal conditions. However, most currently used outdoor thermal comfort indices are the same as the indoor thermal comfort ones [8]. Even indices developed exclusively for outdoor thermal comforts like Universal Thermal Climate Index (UTCI) and Urban Canopy Models (UCMs) are derived from experimental data conducted in indoor climate chambers [9,10].
Moreover, validation for commonly used thermal comfort indices (indoor and outdoor) was for European/American subjects living in a colder climate [10]. A disparity occurred in the result of these indices while predicting the thermal neutral stress for people staying in a warmer climate [10]. In the past decade, numerous researchers worked on improving the simple heat-balance equation for predicting outdoor thermal comfort to reflect the complex dynamics in outdoor conditions using bio-meteorological parameters to more multi-modal or multi-segmental [11]. However, all Outdoor Thermal Comfort Indices (OTCIs) ignore influential variables like genetics, psychological cognition, and multi-sensory dimensions that play a significant role in determining thermal comfort experienced by urban dwellers [12]; a primary reason why all thermal comfort indices, indoor or outdoor, have poor predictive power (around 30–40%). A plausible secondary reason is due to the nature of research method used to estimate Thermal Sensation Vote (TSV)—surveys and questionnaires [13]. Some researchers have explicitly pointed out participants’ difficulty in casting sensation votes, especially around neutral thermal stress [11,14].
Besides all the aforementioned concerns related to the inaccuracy existing with the traditional paradigm of evaluation of thermal comfort index, some researchers highlight the need for developing regional OTCIs [15,16] rather than universally applicable ones as generic climatic conditions, clothing insulation, outdoor space design varies regionally, not globally. However, developing a region-specific outdoor thermal comfort index (OTCI), based on the traditional method of only measuring meteorological parameters and assuming clothing insulation, will not yield the required accuracy either.
As an alternative to the traditional approach of estimating OTCI, a few researchers have recently used machine learning models such as ANNs and random forest to improve the predictive accuracy of the thermal comfort index [17,18]. Other studies employing non-traditional approaches include multi-sensory design with walkability and outdoor thermal comfort [19], estimating real-time OTCI and Physiological Equivalent Temperature (PET) using IoT devices, and applying digital twins and Geographic Information Systems (GIS) to predict OTCI [12]. Overall, the studies that use an OTCI still need to be more accurate, while most studies that use Machine learning (ML) or Internet of Things (IoT) mostly try only to improve the existing OTCI [20,21] thereby making the two approaches fragmented. This incongruence forms the rationale behind this review paper that aims to assess factors, besides meteorological, in influencing the prediction accuracy of OTCIs so that both traditional paradigms and Industry 4.0 [22] can be combined to create a notable and reliable region-specific OTCI using ‘Knowledge Translation’.
There are various definitions and terminologies associated with Industry 4.0 which is an umbrella term referring to the fourth industrial revolution. However, the definition proposed in this paper to describe Industry 4.0, in relation to human-–machine interaction, refers to integration and collaboration between humans and machines. This concept emphasizes the interaction and cooperation between humans and intelligent machines, where both parties contribute their unique capabilities to achieve higher efficiency, such as AI, Internet of Things (IoT), and Virtual and Augmented reality (VR/AR). Table 1 below summarizes the most commonly used Industry 4.0 applications for outdoor thermal comfort studies. Thus, Industry 4.0 in the context of outdoor thermal comfort will guide in assimilation of information from digital twin, GIS, ML, VR, MR, and IoT simultaneously to develop an OTCI with high prediction accuracy. The objectives of this study are:
  • To determine significant factors that influence the accuracy of outdoor thermal comfort indices;
  • To explore new, improved tools and techniques from Industry 4.0 to increase the prediction accuracy of existing indices and generate region-specific ones through knowledge translation.
This paper’s originality lies in exploring the potential of using advanced technologies and methods to improve the accuracy and applicability of outdoor thermal comfort predictions. In this context, the paper critically reviews outdoor thermal comfort studies including common evaluation techniques, along with the methodology used, to identify the prediction accuracy they provide. In parallel, elements of Industry 4.0 that are sparsely used in existing research analysis are also explored to accentuate the research gap. This, followed by the proposal of a theoretical framework, demonstrates how knowledge translation, uncovered through the review process, can be applied. This framework aims to incorporate elements of Industry 4.0 for each influencing factor to address all the gaps.

2. Thermal Comfort: Development of Thermal Indices

Thermal comfort refers to the subjective state of satisfaction with the surrounding environment, encompassing both physiological and psychological aspects. Researchers have highlighted that thermal sensations can vary among individuals occupying the same space, influenced by factors such as mindset, culture, and social perceptions [22]. However, despite acknowledging these psychological influences, the examination of thermal comfort has predominantly focused on its physical aspects [34].
Since the 1900s, studies have been conducted to develop a simple index correlating how humans respond to different thermal environment. Subsequently, personal factors such as physical activity and clothing choice were also taken into account. Examples of these indices include the effective temperature index (ET), predicted mean vote (PMV), physiological equivalent temperature (PET), universal thermal climate index (UTCI), and the COMFA outdoor thermal comfort model.
Currently, two different approaches to determining thermal comfort exist: the steady-state and non-steady-state approaches, each with their own limitations and opportunities. The steady-state approach relies on data obtained from controlled climate chambers and is most notably associated with the work of Fanger (1970). On the other hand, the non-steady-state approach is based on information gathered from real-life observations of individuals in different spaces.
The Steady-State Evaluation is a set of improved indices focusing on heat balance equations which gave rise to human thermoregulatory models (HTMs), later known as rational thermal comfort indices [35]. HTMs consider two systems to predict heat transfer between the body and environment—passive (controlled) and active (controlling) systems [36]. A passive system evaluates the transfer of heat exchange between the body and surroundings via convection, conduction, and radiation based on metabolic processes occurring through different body areas through blood circulation [37]. The active systems of the models organize the body’s thermoregulation by simulation of typical thermoregulatory responses of vasoconstriction, vasodilation, shivering, and sweating [38].
Based on the number of segments used for calculation, HTMs can be single-node, multi-node, or multi-element models [11]. The infamous Predicted Mean Vote (PMV) is a one-node HTM and an empirical one derived from Fanger’s method, which defines the body’s thermal balance as heat generated through metabolism and heat exchange from the body to the environment through the skin, respiration, and sweating [39]. The applicability of PMV is restricted to steady-state and uniform thermal conditions and is found to be unreliable for outdoor thermal comfort prediction [40]. To overcome PMV’s inability to describe the thermoregulatory response of a subject, two-node HTMs were developed, which consider the human body to be subdivided into two concentric layers—core and skin—and uses two energy balance equations, one for each node [41]; e.g., New Standard Effective Temperature (SET*) and PET use two-node HTMs [11]. In 1999, SET was modified to predict outdoor thermal comfort conditions, known as OUT_SET*, by adding mean radiant temperature, while PET is the commonly used thermal index worldwide [42].
The thermal comfort models and indices mentioned above have low prediction capability as they fail to accurately capture human response to thermal variations, a function of cognitive processes including physical, psychological, emotional, and physiological [43,44]. Adaption toward thermal comfort refers to the gradual decline of the human body’s negative response to continuous exposure to environmental thermal stimulation [13]. Researchers have noted that demographics (gender, age, economic status), thermal context (season, climate, building morphology, street layout, semantics), and cognition (attitude, behavior, expectations, emotions) all can potentially contribute to one’s thermal adaption [16,45]. Therefore, it has to be combined with the non-steady-state, also known as the adaptive, approach. These models were developed based on the understanding that humans actively adapt to their environment to achieve comfort, considering behavioral adjustments, as well as physiological and psychological factors. The adaptive approach was introduced in field studies to provide a more realistic assessment of comfort levels in the thermal environment, taking into account specific contexts, occupant behavior, and expectations. This approach helps explain the significant variations in comfort temperature ranges observed between cities with similar climates, and sometimes even between different zones within the same city. These variations highlight the importance of conducting on-site questionnaires and participant observation research to gather data on outdoor users’ perceptions, including their subjective experiences of the urban environment.
Numerous researchers have acknowledged the impracticality of developing universally applicable rating systems for heat stress due to the complexity and multitude of interconnected factors involved. Some argue that outdoor thermal comfort models should be region-specific, capturing the unique thermal environmental characteristics of a particular area, rather than relying on universally applied models like PET and UTCI. In recent years, scholars such as [8,46,47,48] have recommended conducting field studies alongside laboratory studies to provide a more comprehensive understanding of urban comfort and the influence of cultural and habitual variables [49,50,51,52,53,54].

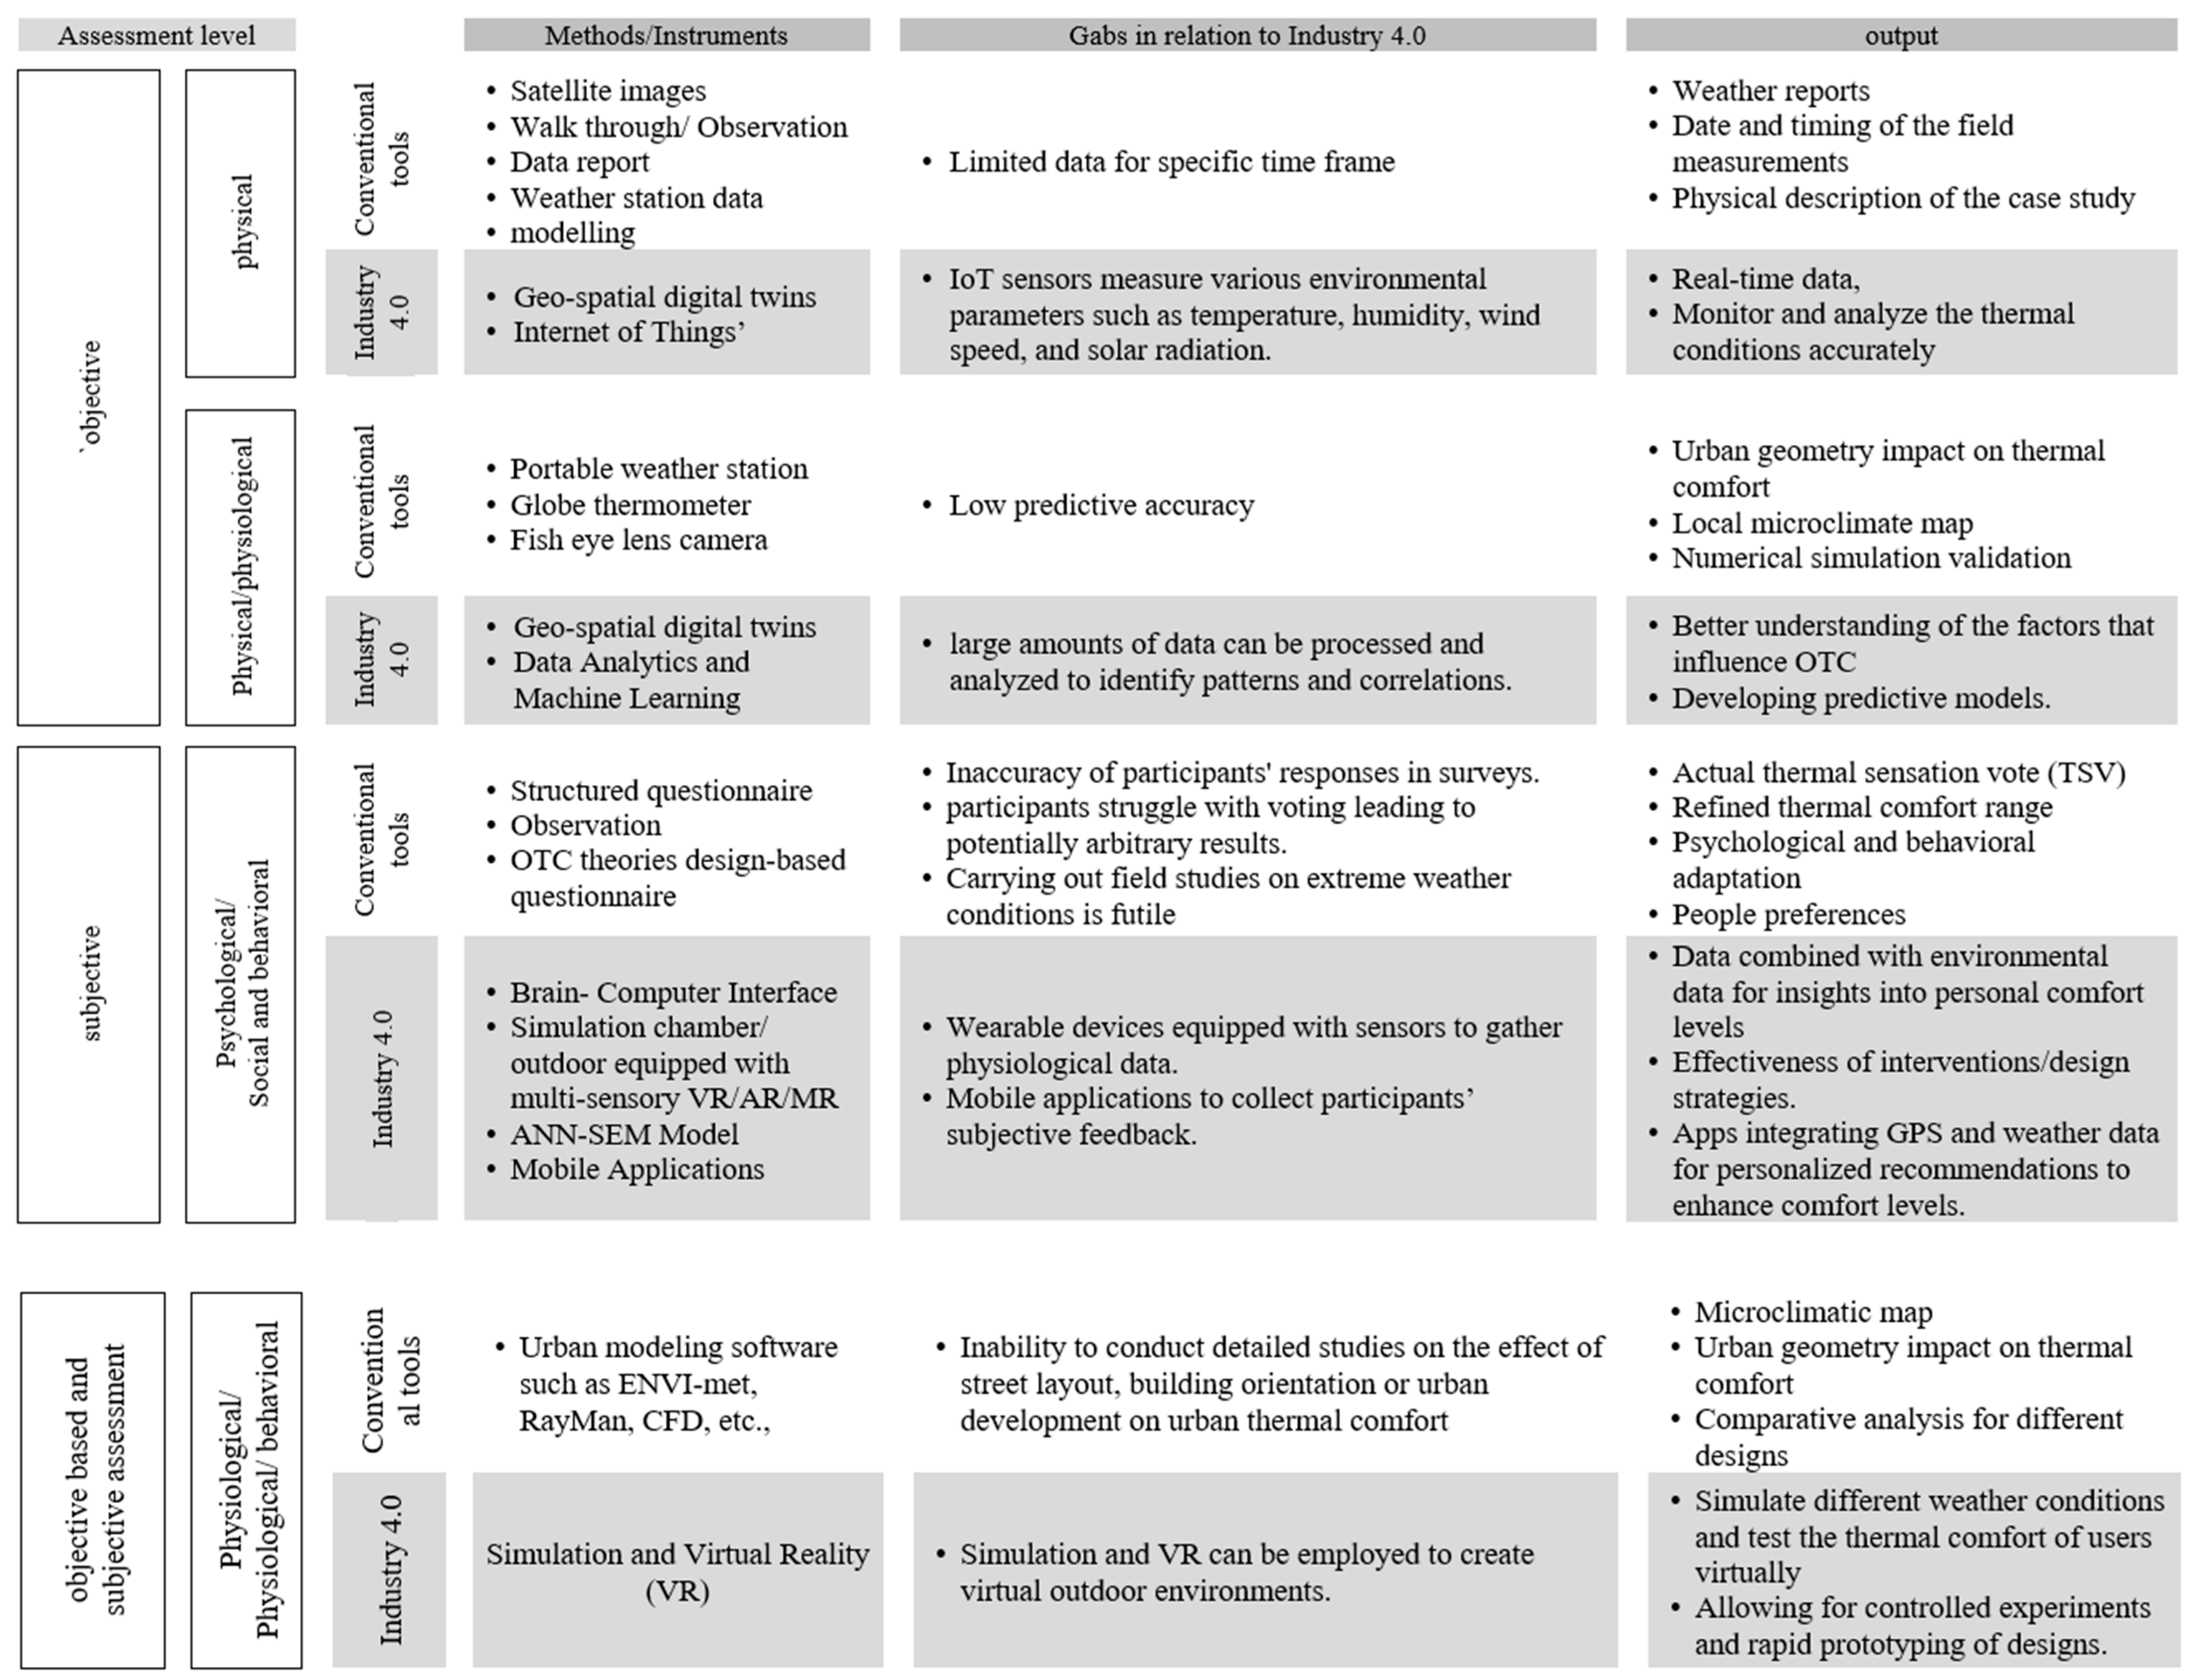
3. Assessment of OTC Studies Linking Conventional Methodology and Industry 4.0

This review paper focuses on determining the predictive ability of outdoor thermal comfort indices presently available from both traditional and Industry 4.0 perspectives. This assessment tabulates the predictive capability of outdoor thermal comfort indices from studies conducted worldwide covering different climatic scenarios. The majority of studies estimated TSV from field surveys to evaluate the effectiveness of indices. Since the advanced universally applicable bio-climatic OTCI, UTCI, was well-researched from 2010 and the first publication on machine learning, a structural equation model that considers multi-sensory and subjective assessment of participants’ response, occurred around 2015, the time frame for this review analysis was from 2015–2023. Figure 1 demonstrates the number of publications within the selected time frame. The years 2016–2019 had the maximum number of publications.
To align with the purpose of this assessment, i.e., inclusiveness of primary modalities and methodology, while seeking to examine the addition of findings brought by Industry 4.0, research articles were retrieved from three main databases—ScienceDirect, Web of Science, and Scopus. Initial search keywords included ‘Outdoor thermal comfort index’ OR ‘prediction accuracy’ OR ‘Thermal Sensation Votes’ which sufficed for around 700 articles. Refinement of keywords including ‘Outdoor thermal comfort index’ AND ‘Machine learning’ AND/OR ‘Internet of things’ OR ‘GIS’ helped to remove more than 600 articles. Inclusion criteria ensured the screening of only peer-reviewed journal articles and conferences within the selected timeframe. The articles were scrutinized to verify the methodology and results they presented. The selected articles included experimental/survey and simulation methods to give 50 articles. Table 2 summarizes climatic classification, research techniques, indices used, and timeframe of studies.
Figure 2 shows the Köppen–Geiger climatic classification of the studies. A total of 25% of the studies were conducted in Hot-summer Mediterranean climate (Csa), 19% in Monsoon-influenced humid subtropical climate (Cwa), followed by Tropical savanna, wet (Aw), Humid subtropical climate (Cfa), and Cold semi-arid (steppe) climate (Bsk), 10% each. Thus, most of the study types had warm-to-hot climatic types as opposed to the cold ones used for developing the indices. Figure 3 reveals indices for developing neutral thermal comfort or estimating prediction accuracy. Though bio-climatic UTCI is considered better than PET as the former can calculate dynamic activity levels, 28 studies used PET as the main index, and UTCI was applied by 18. TSV was evaluated by most studies (24) to compare with the prediction accuracy of the index. Several studies also used multiple indices simultaneously to determine the accuracy.

4. Examining the Accuracy of OTC: Methods and Limitations

The summary results of the studies, in Table 2, were analyzed to determine the factors influencing the prediction accuracy of outdoor thermal comfort studies besides the bio-meteorological ones generally explored by the indices. A critical examination allowed us to highlight the main factors and gaps the current methodology possessed, as explained in the sub-sections below.

4.1. Significant Predictor Variables

Traditional outdoor thermal comfort indices involve the calculation of meteorological and a few personal factors such as gender, height, and weight to derive an index. Most commonly used OTCIs like PMV, PET, and UCTI consider predictor variables exclusive of psychological or emotional cognition. Summary results from the studies indicate that these indices provided a low predictive capability. Few studies tried to overcome this shortcoming by incorporating more variables either by regression equations or altering the weightage of meteorological factors through an empirical equation. A study in Hong Kong considered solar and wind preference to be the most significant factors compared to other generic climate parameters and, based on field survey and reexamination of UTCI, developed a new OTCI called SWI [48]. Analysis of the result indicates that regions with temperate climatic types prefer solar radiation as the most influencing factor for thermal comfort [74,75,90]. Another empirically developed index was MOCI for Mediterranean climates, based on Tmrt, air temperature, relative humidity, and clothing insulation. However, it was provided with different weightage for coefficient terms compared to PET or UTCI to predict a region-specific index that is more accurate [62]. Other studies replicated field surveys and compared them with TSV, to determine more prominent factors among the common factors [55].
Few studies also confirmed a non-linear relationship between OTCI and operative air temperature [73]. Besides meteorological factors, some studies tested and confirmed the hypothesis that building orientation and street layout are prominent factors affecting outdoor thermal comfort [58,63]. Only one study directly evaluated the effect of direct psychological cognition (multi-sensory modalities) on thermal comfort using the structural equation method (SEM) [19]. Using regression techniques, Kruger and Drach (2017) assessed multiple factors like ethnicity, skin color, body mass index (BMI), and age for estimating the thermal neutral range [68]. Generally, survey reporting on comfortability was not duration-oriented, i.e., time spent outdoors by a respondent was ignored, and transient comfortability was taken as the overall comfortability experienced by the participant. Contrary to this traditional method of assessment, Cheung and Jim (2019) pointed out that the duration that a person spends outdoors determines comfortability by calculating the 1-h duration acceptable range, and prediction results of PET and UTCI based on their hypothesis showed very high accuracy [84]. Overall, all studies that tested the hypothesis of whether demographic and personal factors were prominent confirmed that they are significant along with meteorological factors [9,19,45,48,53,61,68,74,77,82].

4.2. Predictive Ability of OTCIs

The existing OTCIs were developed based on experimental studies conducted in a climatic chamber with subjects from Europe/America living in colder climates, thereby making the classification of different thermal ranges biased towards them. It was generally found that the predictive ability of OTCIs is low (30–50%) on average [10,59]. For instance, MOCI, an index developed for the Mediterranean region, gave a better accuracy rate (32.3%) than PET, PMV, UTCI, and GOCI. Another reason stated by researchers for the low predictive ability is because the thermal comfort captured by these indices is generic instead of region-specific, as results indicate that thermal comfort perceived by people will vary according to age, gender, activity level, occupation, and ethnicity. Several studies recalculated the relationship between thermal comfort and influencing factors, as explained in Section 4.1, to improve the predictive capability of OTCIs.
The prediction accuracy rate also varied among different OTCIs and the climatic regions they applied to. For example, in Csa climatic regions, typically, UTCI provided better accuracy prediction than PET or PMV [88]; contrary to this, some studies noted that actual sensation vote (ASV) or thermal sensation vote (TSV) provides better prediction than UCTI or PET [56]. Prediction results tend to underestimate neutral and warm thermal sensations for Bsk [20]. Some studies modified the existing indices to improve the accuracy, like Liu et al. (2020) who estimated and correlated skin temperature with outdoor thermal comfort to improve the forecast of UTCI by 4–7% [17]. Probit analysis and cubic regression enhanced the accuracy of ASV and UTCI to around 50% [10,56,73] in Csa climates and around 63% in Aw climatic regions. Machine learning techniques like ANN, GA, and ELM were employed for the improved predictive accuracy of PET [20]. Jeong et al. (2022) applied Bayesian hyperparameter tuning to machine learning models and found that random forest could increase prediction accuracy to 90–95% [21].

4.3. Field Survey and Accuracy of Participants’ Response

The field survey was the standard method of determining participants’ direct thermal sensations for all the studies in Table 2. The number of participants ranged from 300 to 1000 for survey responses. Some studies also carried out semi-structured or structured interviews to gain more information before allowing participants to vote on their current thermal sensation. ASHRAE’s 7-point scale was the most commonly used one, followed by ISO questionnaires. Some studies used two scales, for example, ASHRAE 7-point and McIntyre 3-point scales [10,43,62]. A few others added more voting scales to existing ASHRAE or ISO voting scales [56,84]. Generally, field surveys included participants either spending time performing outdoor activities like walking, standing, and sitting [66,73], or allotting time to spend outdoors around 10–15 min [9,56,78,83]. All studies also evaluated meteorological measurements ranging from a day to a few covering transitional seasons [10] or a few days every month [80]. Outdoor field surveys were sometimes carried out in different locations, including gardens and open streets, to draw a comparison among the trends [58,59,68,78]. Researchers often had to eliminate some survey responses, and a few authors noted that participants showed a general difficulty in voting for slightly warm/warm and slightly cool/cold, thus allowing the possibility for the results to be arbitrary [72,74,80].

4.4. Thermal Neutral Stress Range

Multiple studies focused on thermal neutral stress as it is helpful in public awareness, the tourism industry, and urban design. The majority of studies, mainly from tropical and temperate regions, had thermal neutral stress significantly higher than the neutral stress of UTCI or PET [43,55,66,71]. As noted in Section 4.1, all indices were developed for people in cold regions; thus, TSV often revealed divergent results compared to standard OTCIs [45,55]. Studies also noted that UTCI often predicted a neutral thermal range better than PET or PMV [74]. To overcome this shortcoming, a few researchers also evaluated neutral thermal range from modified PET or PMV by logistic or probit analysis [62] or machine learning techniques like ANN [20,21]. It was found that the thermal neutral range was also a function of seasonal variation [45,70] and the existing climatic zone [81]. The variation of clothing insulation in different seasons made participants perceive higher summer and lower winter temperatures to be around the neutral range.

4.5. Methodology for Estimation of OTCIs

Out of 98% of studies that compared field survey results (TSV/ASV) with universally applied OTCIs like PET or UTCI, none indicated that they generated similar results. Several indices were modified, and regression or machine learning techniques were often applied to correct the divergent results. Often, researchers concluded that the inherent error is due to improper estimation of survey results or lack of accuracy produced by the OTCI as it ignored subjective perception. One study correlated thermal comfort as a direct result of skin temperature of body parts and cross-validated it with a questionnaire survey [17]. Other studies used a hybrid method, i.e., combining machine learning techniques such as Ada Boost, Bayesian bridge, and random forest to improve PET results. It was found that the hybrid model increased the prediction accuracy to 95% [21]. Simulation methods were employed as an alternative to the traditional method for evaluating outdoor thermal comfort, outdoor space usage, and to test the influence of any demographic and social factors using fuzzy logic [91], a multi-agent system [18], or ENVI-met [71,76,85,89,92]. A few studies also tested GIS outdoor thermal comfort simulation software to yield a better map to zone out different outdoor spaces as per their daily and seasonal usage while assessing various meteorological and personal factors [53,54,82,83].

4.6. Seasonal Variation

Typically, all empirical/rational-based OTCIs and TSV assume that outdoor thermal comfort range or thermal neutrality based on any particular day corresponds to thermal sensation throughout the year and remains unchanged. However, the majority of studies evaluated OTCIs and TSV for multiple seasons, including the transitional period, some for more than one year. Overall, the results across multiple studies confirm that people are more tolerant of higher temperatures during summer than in winter [9,48,62,73]. The reason is attributed to people’s psychological conditioning of expecting higher summer temperatures than in winter, making warmer temperatures more tolerable. Pantavou (2013) considered seasonal and activity types as crucial personal factors for the perception of thermal conditions [55]. Xie et al. (2019) noted that the summer season was revealed to have the narrowest neutral thermal stress range compared to other seasons [80]. Compared to the rainy season, the dry season’s neutral and upper thermal comfort were much lower, as determined by PET and SET* [77]. GIS view tools showed that 76% of people stayed outdoors in springtime compared to 65% in summer. Studies also noted that built-up areas produced an environment with more thermal stress for both summer and winter [83].
Besides the main factors influencing the prediction accuracy of OTCIs, the review also found that age is considered for RayMan model calculations; the only study that assessed the effect of age as a primary factor reported that elderly sub-groups had a lower TSV by 0.3 units compared to the younger population [68]. This study also tested various other factors like skin color, BMI, and gender with the help of the Structural Equation Model (SEM). Another study [72] mentioned that local people can tolerate a broader range of climatic variations than non-local, but generally, ethnicity was never tested as a primary factor by the studies analyzed. A few researchers studied the street layout, building orientations, and building heights and proposed appropriate directions to improve thermal comfort [85,86]. Xu et al. (2018) studied landscape features, especially visual landscape, and concluded that these features improved thermal comfort [74]. Lastly, Acero et al. (2021) argued for a region-specific index rather than a generic one due to the complexity involved with predictive accurateness [86].
Overall, the existing common approaches to outdoor thermal comfort fail to fully explain thermal satisfaction [43,75]. These approaches are based on the thermodynamic principle and do not consider psychological or behavioral aspects in dealing with outdoor thermal conditions. In contrast, Industry 4.0 provides tools and techniques that can be integrated or used independently to develop OTCIs with enhanced and reliable prediction accuracy, accounting for the potential influences of psychological, gender, or behavioral attributes. Therefore, in the following section this paper discusses the process of ‘Knowledge Translation’ and how to better integrate elements of Industry 4.0, which are currently underutilized in published research.

5. ‘Knowledge Translation’ of Industry 4.0 to Fulfill Gaps in the Current Thermal Comfort Index Approach: Deriving Both ‘Generic’ and ‘Specific’ TSV

Traditional methods of estimating thermal comfort indices are generally confined to using ambiguous thermodynamic principles. However, by applying the process of ‘knowledge translation’ permitted by interdisciplinary analysis, the elements of Industry 4.0 can be leveraged to address the shortcomings of these methods. This is exemplified in the proposed approach, as shown in Figure 4, which is based on the comprehensive interoperability of four different levels of assessment: physical, physiological, psychological, and social/behavioral [8]. The current gaps in conventional methods are identified at each level, and the proposed development is presented based on the theoretical exploration of Industry 4.0. In this way, the framework overcomes common study limitations and, more importantly, enables the identification of overall human outdoor thermal comfort by proposing guidelines and suggesting tools or instruments for each phase. This approach has the potential to enhance the urban planners and designers’ interpretation and understanding of the microclimate and outdoor thermal comfort. Accordingly, the proposed framework is systematically composed of four different levels of assessment in one structure (Figure 4), as well as four methodology phases: preliminary data collection, on-site field measurements, a social survey, and micro-urban performance simulation.

5.1. Phase One

It is essential to gather background information on a specific urban environment. This can be achieved through activities such as site observation, walk-throughs, reviewing meteorological profiles and weather reports, conducting surveys of existing building structures and their urban morphology, and studying the types of vegetation present. This initial phase is crucial as it helps classify the characteristics of the site, requiring site-specific sampling strategies. According to the World Meteorological Organization (WMO) guide to Meteorological Instruments and Methods of Observation (WMO No. 8, 2008) [83], a site’s urban form can be simplified and categorized based on factors such as roughness length, aspect ratio of urban canyons (height-to-width ratio), and the percentage of built or hard surfaces.
However, it is very limited to a specific timeframe, time-consuming in large sites, and not every site can be simplified. This leads to the inability of traditional methods to conduct detailed studies on the effect of street layout, building orientation, or urban development on urban thermal comfort. To overcome these shortcomings, IoT, as an essential part of the digital twin of smart buildings and smart cities, gathers data continuously for big data analytics. Primarily, IoT-enabled devices or gadgets collect information from surroundings based on sensor(s) embodied in them, which is relayed to data analytics using cloud computing. After data pass through the communication model conduit, users and service providers can analyze the big data aggregation for predictive analytics in necessary domains.
Applying the concept of IoT is relatively new, and research publications are scarce, and to the best of the authors’ knowledge, the published work has mainly focused on indoor thermal comfort [33]. However, utilizing this concept is useful for predicting the outdoor thermal comfort index, particularly in collecting weather parameters, as monitoring meteorological parameters is a critical step in using a thermal comfort index, whether the index is empirical or simulation-based [33].

5.2. Phase Two

The primary objective of conducting in situ field measurements is to capture the urban geometry and materials and their impact on the local climate within the urban canopy layer (UCL). This information cannot be obtained solely from meteorological weather data. A physical site survey is essential to identify specific locations for measuring microclimatic variations within the urban canyon. To ensure human thermal comfort, certain microclimate parameters must be measured, including air temperature, solar radiation, relative humidity, wind velocity, and globe temperature [72]. These data can then be compared with local weather station data to assess the site urban heat island (UHI) condition and microclimate conditions within the urban canopy layer. The survey also helps in understanding how urban geometry factors, such as aspect ratio, vegetation, and sky view factor, affect the local climate. It is worth noting that while the accuracy of instruments and measurement methods is crucial, many recent studies on outdoor thermal comfort and microclimate fail to provide sufficient information about the equipment used, its accuracy, and response time [81]. This leads to the inability of traditional methods to conduct detailed studies on the effect of street layout, building orientation, or urban development on urban thermal comfort. To overcome these shortcomings, multiple studies in Table 1 used GIS to study different influencing factors, such as street layout and building orientation, behind thermal comfort and to estimate TSV. Using artificial realities, implementing a digital twin that can act as an exact replica of the real city, will help to study an entire cityscape’s influence rather than the few buildings currently possible with standalone GIS [91]. Juxtaposition of a geo-spatially-supported digital twin with alternate reality can further help to evaluate thermal sensation and thermal comfort ranges of any existing urban place or even an entire city based on physical factors such as age, gender, occupancy length, activity level, and clothing type. TSVs can be specially developed covering different psychological cognition categories as well.

5.3. Phase Three

During the third phase, it is important to simultaneously implement questionnaires and observations alongside physical measurements. This allows for an investigation into the influence of the microclimate within urban spaces on the duration and usage of these spaces. Additionally, it helps in gaining a local understanding of adaptive behaviors that can be adopted to mitigate heat stress [20,25]. However, one of the drawbacks of the adaptive approach is that there is no advice on how to perform or design the field survey regarding the required number of subjects, appropriate time of the day, and minimum duration for each survey. Moreover, as pointed out in Section 4, accurately gauging people’s thermal sensation remains a challenge with the traditional approach of using surveys and questionnaires. One of the main limitations of survey studies was the researchers’ inability to truly study the amount of time or activity type of participants in the field. Additionally, carrying out field studies on extreme weather conditions for a long duration is futile as participants may not cooperate. Almost all studies had participants spend 5–15 min outdoors during the field survey before perception was recorded. This method of assessing the sensation of thermal comfort can lead to erroneous results, as shown by Cheung and Jim (2019) [84]. Thus, to assess a TSV, employing better and more accurate methods may produce favorable outcomes, for example, using electroencephalography (EEG) hardware, which acts as a Brain—Computer Interface (BCI) that can record natural brain states and emotions towards an environment while providing real-time brain performance metrics [49]. Furthermore, the development of SEM-ANN for deriving OTCI prediction equations can be studied with the help of artificial realities in a multi-mediated simulation chamber, in case of extreme weathers, which is also a component of Industry 4.0.
At this level, the use of Brain–Computer Interfaces or wearable devices equipped with sensors can gather physiological data from individuals participating in outdoor thermal comfort studies. These data, combined with environmental data obtained from previous levels, can provide insights into personal comfort levels and help evaluate the effectiveness of different interventions or design strategies. For improved accuracy, the analysis could incorporate Artificial Neural Network (ANN) analysis in combination with Structural Equation Modeling (SEM). ANN is a computational model inspired by the structure and functioning of biological neural networks in the human brain. It is a type of machine learning algorithm trained to recognize and learn patterns from input data. Through backpropagation, the network adjusts the strength of connections between neurons to enhance its performance in tasks such as classification, regression, or pattern recognition. On the other hand, SEM is a statistical modeling technique used to analyze the relationships between observed and latent variables. It is widely employed in social sciences, economics, and other fields to test and validate complex theoretical models. SEM combines factor analysis and path analysis to estimate the relationships between variables and assess the goodness-of-fit of the model to the observed data. It enables researchers to determine the direct and indirect effects of variables on each other, evaluate the overall model fit, and examine the significance of relationships. SEM is particularly valuable for studying complex causal relationships and understanding latent constructs that cannot be directly measured.
Another gap identified was the need to determine zonal OTCIs or develop both generic and region-specific OTCIs to enhance thermal comfort. One of the main reasons for evaluating the outdoor thermal comfort index is to optimize the time people spend outdoors to improve their health and wellness. People’s emotional and physiological parameters are directly linked to their activity and time expended outdoors [50,51]; therefore, factors promoting one person to spend time outdoors may not suit another. In indoor thermal comfort modeling, attention was given to deriving a personal comfort model or one for a particular group of people using ML models and IoT devices since results of traditional modeling or surveys typically refer to most of the population (assuming these surveys were carried out by random sampling) [52]. To resolve the aforementioned problem, the concept of synergizing an alternate reality with geo-spatial digital twin while measuring the experiencer’s cognition and emotion via a BCI can be applied to determine both generic and specific (personal/particular category) TSVs.
A generic TSV, thus developed from random sampling in an indoor simulation chamber, can be used to design or redesign outdoor space which people of different ages, ethnic groups, activity levels, or gender may occupy. On the other hand, similar to personal thermal comfort for an indoor built environment, a specific TSV can be utilized for the design of outdoor spaces occupied by a person (open space designed for a villa) or group of people having shared physiological or psychological cognition (e.g., a school playground used by children of particular age group). Thus, specific TSVs can be employed for the design or redevelopment of places as per the attributes of people who may use them most of the time.

5.4. Phase Four

In the last phase, it is important to acknowledge that an individual’s subjective perception and response to outdoor spaces can vary based on the specific context and local cultures. However, parametric environmental performance simulation analysis offers valuable comparative analytical tools to evaluate different design proposals and their impact on human well-being. Many scholars have emphasized the pressing need to enhance the development of dependable outdoor environmental predictive tools. These tools can assist in evaluating modifications in outdoor microclimates during the design phase [18,80,81,88]. However, these predictive micro-urban performance simulations, such as ENVI-met, Computational Fluid Dynamics (CFD), RayMan, and SOLWEIG, etc., are ignoring the human dimension in the process using steady-state thermal indices and time consuming when it comes to create several scenarios. These can be addressed through employing Industry 4.0 technologies, such as simulation and virtual reality (VR), can be utilized to create virtual outdoor environments as a solution for the last two gaps. Researchers can simulate different weather conditions and virtually test the thermal comfort of users, enabling controlled experiments and rapid prototyping of designs. Additionally, smart infrastructure and adaptive systems can contribute to the development of infrastructure and systems that dynamically respond to changing environmental conditions. For example, automated shading systems or intelligent ventilation systems can be implemented to optimize thermal comfort in outdoor spaces.
In Figure 4, the proposed framework demonstrates how knowledge translation, uncovered through the review process, can be applied. This framework aims to incorporate elements of Industry 4.0 for each influencing factor. To address all the gaps, it is important to effectively measure and model the physical and physiological characteristics to provide microclimatic knowledge. Simultaneously, the psychological and social or behavioral characteristics should be clearly identified and analyzed to provide grounded theory for assessing and designing habitable outdoor spaces.

6. Conclusions

The primary gap lies in the fact that OTC is an interdisciplinary study that encompasses various phenomena, including meteorology, urban structure, psychology, and social behavior [8]. However, none of the reviewed approaches successfully conducted a comprehensive analysis, and they overlooked several key factors that have been widely recognized as the main cause of their low predictive accuracy. The few studies that tested machine learning methods (a subset of Industry 4.0) like ANN and SEM showed that accuracy can be improved even up to 90% compared to 30% for current OTCIs.
The review analysis informs that the predictive accuracy of traditional methods of assessing outdoor thermal comfort indices is generally lower than 40%. The discrepancy in the neutral thermal stress is significantly higher for warmer regions as all indices currently used for research were developed based on temperate climates with European/American subjects. Research evidence from both the traditional paradigm and Industry 4.0 concludes that subjective perception of outdoor thermal comfort, duration spent outdoors before casting survey votes, ethnicity, gender, and age are all prominent factors besides meteorological ones. Thermodynamically backed outdoor thermal comfort indices cannot capture these multi-sensory modalities, psychological and emotional cognition, a plausible reason for their low predictive accuracy. Though few studies tried to improve indices or estimate outdoor thermal comfort by leveraging Industry 4.0 (machine learning techniques, advanced GIS), the review found that Industry 4.0 is less explored in outdoor studies than indoor ones. This study also identified four main gaps existing in the current outdoor thermal comfort studies: (1) demographic/personal/multi-sensory modality factors not being fully considered; (2) field survey and indices being inaccurate; (3) lack of consideration of urban features on a city level; and (4) a generic index like UTCI or PET being unable to capture regional variations. The study theoretically further explored Industry 4.0 to develop improved tools and techniques to improve the prediction accuracy of indices. Therefore, to derive highly accurate generic and region-specific indices, exploitation of Industry 4.0 is recommended: demographic/multi-sensory modalities can be determined through BCIs; field survey can be replaced with BCIs and multi-mediated reality; geo-spatial digital twins with IoT can provide capture urban features; and, finally, machine learning techniques like SEM-ANN can aid to develop regional indices. In addition to the ease and the ability of Industry 4.0 in to instantly share and compare results with other studies that have utilized similar techniques, thus establishing a platform for outdoor thermal comfort studies and generating new knowledge, this knowledge can then guide the design and methodology of data collection and interpretation, leading to a better understanding of the true relationship between the various factors influencing thermal satisfaction [43].
In conclusion, further investigations are still required to explore the development of advanced data analytics techniques and modeling approaches for analyzing data and deriving meaningful insights. Despite the limited application thus far, future studies on outdoor thermal comfort using Industry 4.0 present an exciting avenue for research. These studies offer opportunities for more data-driven, adaptive, and personalized approaches to enhance outdoor comfort in urban environments.

Author Contributions

Conceptualization, M.H.E.; Methodology, M.H.E.; Formal analysis, M.H.E.; Data curation, N.H.; Writing—review & editing, M.H.E. and N.H.; Supervision, M.H.E.; Project administration, M.H.E.; Funding acquisition, M.H.E. All authors have read and agreed to the published version of the manuscript.

Funding

The manuscript is a part of a funded research by the United Arab Emirates University, Grant Code 12N102.

Data Availability Statement

The original contributions presented in the study are included in the article, further inquiries can be directed to the corresponding authors.

Conflicts of Interest

The authors declare no conflict of interest.

Nomenclature

AIArtificial Intelligence
ANNArtificial Neural Network
ARAugmented Reality
ASHRAEAmerican Society of Heating, Refrigerating and Air-Conditioning Engineers
ASVActual Sensation Vote
BCIBrain–Computer Interface
BIMBuilding Information Modeling
BMIBody Mass Index
CFDComputational Fluid Dynamics
CO2Carbon Emissions
CNNConvolution Neural Network
DTSDynamic Thermal Sensation
EGGElectroencephalography
ELMExtreme Learning Machines
ETEffective Temperature Index
GISGeographic Information Systems
GAGenetic Algorithm
GOCIGlobal Outdoor Comfort Index
HTMsHuman Thermoregulatory Models
HVACHeating, Ventilation, and Air Conditioning
ICTInformation and Communication Technologies
IoTInternet of Things
ISOInternational Organization for Standardization
LTSTLong Term Short Term
MDDMajor Depressive Disorder
MTSVMean Thermal Sensation Vote
MLMachine Learning
MoBIMobile Brain/Body Imaging
MOCIMediterranean Outdoor Comfort Index
mPETModified Physiological Equivalent Temperature
MRMulti-sensory and multi-mediated Reality
OTCOutdoor Thermal Comfort
OTCIOutdoor Thermal Comfort Index
PETPhysiological Equivalent Temperature
PMVPredicted Mean Vote
PTVPreference Thermal Vote
RNNRecurrent Neural Network
SET*Standard Effective Temperature
STISubjective Temperature Index
SWISun and Wind Index
SEMStructural Equation Method
SVFSky View Factor
TEPPerceived Equivalent Temperature
TeqEquivalent Temperature
TmrtMean Radiant Temperature
TSVThermal Sensation Vote
UCLUrban Canopy Layer
UCMUrban Canopy Models
UHIUrban Heat Island
UTCIUniversal Thermal Climate Index
VOCVolatile Organic Compounds
WCTWind Chill Temperature
WMOWorld Meteorological Organization
XRVirtuality axis
YDSSense of Thermal Comfort

References

  1. Elnabawi, M.H. Evaluating the impact of energy efficiency building codes for residential buildings in the GCC. Energies 2021, 14, 8088. [Google Scholar] [CrossRef]
  2. ASHRAE. ASHRAE Guideline 10-2011, Interactions Affecting the Achievement of Acceptable Indoor Environments; American Society of Heating: Norcross, GA, USA, 2011. [Google Scholar]
  3. Hamann, G.A.; Ivtzan, I. 30 minutes in nature a day can increase mood, well-being, meaning in life and mindfulness: Effects of a pilot programme. Soc. Inq. Well-Being 2017, 2, 34–46. [Google Scholar]
  4. Twenge, J.M. Increases in depression, self-harm, and suicide among US adolescents after 2012 and links to technology use: Possible mechanisms. Psychiatr. Res. Clin. Pract. 2020, 2, 19–25. [Google Scholar] [CrossRef] [PubMed]
  5. Béjean, S.; Sultan-Taïeb, H. Modeling the economic burden of diseases imputable to stress at work. Eur. J. Health Econ. 2005, 6, 16–23. [Google Scholar] [CrossRef] [PubMed]
  6. Zhou, P.; Yang, Y.; Huang, G.; Lai, A.C. Numerical and experimental study on airborne disinfection by negative ions in air duct flow. Build. Environ. 2018, 127, 204–210. [Google Scholar] [CrossRef] [PubMed]
  7. About|International WELL Building Institute|International WELL Building Institute. Available online: https://www.wellcertified.com/about-iwbi/ (accessed on 29 December 2019).
  8. Elnabawi, M.H.; Hamza, N. Behavioural perspectives of outdoor thermal comfort in urban areas: A critical review. Atmosphere 2020, 11, 51. [Google Scholar] [CrossRef]
  9. Xie, Y.; Huang, T.; Li, J.; Liu, J.; Niu, J.; Mak, C.M.; Lin, Z. Evaluation of a multi-nodal thermal regulation model for assessment of outdoor thermal comfort: Sensitivity to wind speed and solar radiation. Build. Environ. 2018, 132, 45–56. [Google Scholar] [CrossRef]
  10. Haghshenas, M.; Hadianpour, M.; Matzarakis, A.; Mahdavinejad, M.; Ansari, M. Improving the suitability of selected thermal indices for predicting outdoor thermal sensation in Tehran. Sustain. Cities Soc. 2021, 74, 103205. [Google Scholar] [CrossRef]
  11. Binarti, F.; Koerniawan, M.D.; Triyadi, S.; Utami, S.S.; Matzarakis, A. A review of outdoor thermal comfort indices and neutral ranges for hot-humid regions. Urban Clim. 2020, 31, 100531. [Google Scholar] [CrossRef]
  12. Gholami, M.; Torreggiani, D.; Tassinari, P.; Barbaresi, A. Developing a 3D City Digital Twin: Enhancing Walkability through a Green Pedestrian Network (GPN) in the City of Imola, Italy. Land 2022, 11, 1917. [Google Scholar] [CrossRef]
  13. Woodside, A.G.; Wilson, E.J. Respondent inaccuracy. J. Advert. Res. 2002, 42, 7–18. [Google Scholar] [CrossRef]
  14. Zhao, Q.; Lian, Z.; Lai, D. Thermal comfort models and their developments: A review. Energy Built Environ. 2021, 2, 21–33. [Google Scholar] [CrossRef]
  15. Lin, T.; de Dear, R.; Hwang, R. Effect of thermal adaptation on seasonal outdoor thermal comfort. Int. J. Clim. 2011, 31, 302–312. [Google Scholar] [CrossRef]
  16. Lucchese, J.R.; Mikuri, L.P.; de Freitas, N.V.S.; Andreasi, W.A. Application of selected indices on outdoor thermal comfort assessment in Midwest Brazil. Int. J. Energy Environ. 2016, 7, 291. [Google Scholar]
  17. Liu, K.; Nie, T.; Liu, W.; Liu, Y.; Lai, D. A machine learning approach to predict outdoor thermal comfort using local skin temperatures. Sustain. Cities Soc. 2020, 59, 102216. [Google Scholar] [CrossRef]
  18. Goli, A.; Tirkolaee, E.B.; Sangaiah, A.K. Hybrid neural network and improved cuckoo optimization algorithm for forecasting thermal comfort index at urban open spaces. Adv. Edge Comput. Massive Parallel Process. Appl. 2020, 35, 264–280. [Google Scholar]
  19. Liu, C.; Tang, L.; Yan, J.; Ouyang, J. Direct and indirect effects of multisensory modalities on visitor’s thermal comfort in an urban park in a humid-hot climate. Int. J. Sustain. Dev. World Ecol. 2022, 30, 319–328. [Google Scholar] [CrossRef]
  20. Kariminia, S.; Shamshirband, S.; Motamedi, S.; Hashim, R.; Roy, C. A systematic extreme learning machine approach to analyze visitors’ thermal comfort at a public urban space. Renew. Sustain. Energy Rev. 2016, 58, 751–760. [Google Scholar] [CrossRef]
  21. Jeong, J.; Jeong, J.; Lee, M.; Lee, J.; Chang, S. Data-driven approach to develop prediction model for outdoor thermal comfort using optimized tree-type algorithms. Build. Environ. 2022, 226, 109663. [Google Scholar] [CrossRef]
  22. Culot, G.; Nassimbeni, G.; Orzes, G.; Sartor, M. Behind the definition of Industry 4.0: Analysis and open questions. Int. J. Prod. Econ. 2020, 226, 107617. [Google Scholar] [CrossRef]
  23. Zander, T.O.; Kothe, C. Towards passive brain–computer interfaces: Applying brain–computer interface technology to human–machine systems in general. J. Neural Eng. 2011, 8, 25005. [Google Scholar] [CrossRef] [PubMed]
  24. Gramann, K.; Ferris, D.P.; Gwin, J.; Makeig, S. Imaging natural cognition in action. Int. J. Psychophysiol. 2014, 91, 22–29. [Google Scholar] [CrossRef] [PubMed]
  25. Scanlon, J.E.; Townsend, K.A.; Cormier, D.L.; Kuziek, J.W.; Mathewson, K.E. Taking off the training wheels: Measuring auditory P3 during outdoor cycling using an active wet EEG system. Brain Res. 2019, 1716, 50–61. [Google Scholar] [CrossRef] [PubMed]
  26. Banaei, M.; Hatami, J.; Yazdanfar, A.; Gramann, K. Walking through architectural spaces: The impact of interior forms on human brain dynamics. Front. Hum. Neurosci. 2017, 11, 477. [Google Scholar] [CrossRef] [PubMed]
  27. Mann, S.; Furness, T.; Yuan, Y.; Iorio, J.; Wang, Z. All Reality: Virtual, Augmented, Mixed (X), Mediated (X,Y), and Multimediated Reality. arXiv 2018, arXiv:1804.08386. [Google Scholar]
  28. Chiamulera, C.; Ferrandi, E.; Benvegnù, G.; Ferraro, S.; Tommasi, F.; Maris, B.; Zandonai, T.; Bosi, S. virtual reality for neuroarchitecture: Cue reactivity in built spaces. Front. Psychol. 2017, 8, 185. [Google Scholar] [CrossRef] [PubMed]
  29. Carmigniani, J.; Furht, B. Augmented reality: An overview. In Handbook of Augmented Reality; Springer: New York, NY, USA, 2011; pp. 3–46. [Google Scholar]
  30. Pascual-Leone, A.; Nguyet, D.; Brasil-Neto, J.P.; Cammarota, A.; Seidel, O.; Carius, D.; Kenville, R.; Ragert, P.; Stöckel, T.; Carroll, T.J.; et al. Modulation of muscle responses evoked by transcranial magnetic stimulation during the acquisition of new fine motor skills. J. Neurophysiol. 1995, 74, 1037–1045. [Google Scholar] [CrossRef] [PubMed]
  31. Opoku, D.-G.J.; Perera, S.; Osei-Kyei, R.; Rashidi, M. Digital twin application in the construction industry: A literature review. J. Build. Eng. 2021, 40, 102726. [Google Scholar] [CrossRef]
  32. Jost, T.E.; Stary, C.; Heininger, R. Geo-spatial context provision for digital twin generation. Appl. Sci. 2022, 12, 10988. [Google Scholar] [CrossRef]
  33. Razali, M.A.A.; Kassim, M.; Sulaiman, N.A.; Saaidin, S. A ThingSpeak IoT on real time room condition monitoring system. In Proceedings of the 2020 IEEE International Conference on Automatic Control and Intelligent Systems (I2CACIS), Shah Alam, Malaysia, 20 June 2020; pp. 206–211. [Google Scholar]
  34. Lin, T.-P.; Matzarakis, A. Tourism climate and thermal comfort in Sun Moon Lake, Taiwan. Int. J. Biometeorol. 2008, 52, 281–290. [Google Scholar] [CrossRef]
  35. Lim, C.L.; Byrne, C.; Lee, J.K. Human thermoregulation and measurement of body temperature in exercise and clinical settings. Ann. Acad. Med. Singap. 2008, 37, 347–353. [Google Scholar] [CrossRef] [PubMed]
  36. Chen, L.; Ng, E. Outdoor thermal comfort and outdoor activities: A review of research in the past decade. Cities 2012, 29, 118–125. [Google Scholar] [CrossRef]
  37. Fiala, D.; Lomas, K.J.; Stohrer, M.; Laxminarayan, S.; Rakesh, V.; Oyama, T.; Kazman, J.B.; Yanovich, R.; Ketko, I.; Epstein, Y.; et al. A computer model of human thermoregulation for a wide range of environmental conditions: The passive system. J. Appl. Physiol. 1999, 87, 1957–1972. [Google Scholar] [CrossRef] [PubMed]
  38. Kurz, A. Physiology of thermoregulation. Best Pract. Res. Clin. Anaesthesiol. 2008, 22, 627–644. [Google Scholar] [CrossRef] [PubMed]
  39. Wei, S.; Li, M.; Lin, W.; Sun, Y. Parametric studies and evaluations of indoor thermal environment in wet season using a field survey and PMV–PPD method. Energy Build. 2010, 42, 799–806. [Google Scholar] [CrossRef]
  40. Broday, E.E.; Ruivo, C.R.; da Silva, M.G. The use of Monte Carlo method to assess the uncertainty of thermal comfort indices PMV and PPD: Benefits of using a measuring set with an operative temperature probe. J. Build. Eng. 2021, 35, 101961. [Google Scholar] [CrossRef]
  41. Ye, G.; Yang, C.; Chen, Y.; Li, Y. A new approach for measuring predicted mean vote (PMV) and standard effective temperature (SET∗). Build. Environ. 2003, 38, 33–44. [Google Scholar] [CrossRef]
  42. Pickup, J.; de Dear, R. An outdoor thermal comfort index (OUT_SET*)-part I-the model and its assumptions. In Biometeorology and Urban Climatology at the Turn of the Millenium; Selected Papers from the Conference ICB-ICUC; Macquarie University: Sydney, NSW, Australia, 2000; pp. 279–283. [Google Scholar]
  43. Zhao, L.; Zhou, X.; Li, L.; He, S.; Chen, R. Study on outdoor thermal comfort on a campus in a subtropical urban area in summer. Sustain. Cities Soc. 2016, 22, 164–170. [Google Scholar] [CrossRef]
  44. Lai, D.; Guo, D.; Hou, Y.; Lin, C.; Chen, Q. Studies of outdoor thermal comfort in northern China. Build. Environ. 2014, 77, 110–118. [Google Scholar] [CrossRef]
  45. Elnabawi, M.H.; Hamza, N.; Dudek, S. Thermal perception of outdoor urban spaces in the hot arid region of Cairo, Egypt. Sustain. Cities Soc. 2016, 22, 136–145. [Google Scholar] [CrossRef]
  46. Nikolopoulou, M.; Lykoudis, S. Thermal comfort in outdoor urban spaces: Analysis across different European countries. Build. Environ. 2006, 41, 1455–1470. [Google Scholar] [CrossRef]
  47. Cohen, P.; Potchter, O.; Matzarakis, A. Human thermal perception of Coastal Mediterranean outdoor urban environments. Appl. Geogr. 2013, 37, 1–10. [Google Scholar] [CrossRef]
  48. Li, J.; Niu, J.; Mak, C.M.; Huang, T.; Xie, Y. Exploration of applicability of UTCI and thermally comfortable sun and wind conditions outdoors in a subtropical city of Hong Kong. Sustain. Cities Soc. 2020, 52, 101793. [Google Scholar] [CrossRef]
  49. Lotte, F.; Bougrain, L.; Cichocki, A.; Clerc, M.; Congedo, M.; Rakotomamonjy, A.; Yger, F. A review of classification algorithms for EEG-based brain–computer interfaces: A 10 year update. J. Neural Eng. 2018, 15, 31005. [Google Scholar] [CrossRef]
  50. Wolsko, C.; Lindberg, K. Experiencing connection with nature: The matrix of psychological well-being, mindfulness, and outdoor recreation. Ecopsychology 2013, 5, 80–91. [Google Scholar] [CrossRef]
  51. Frühauf, A.; Niedermeier, M.; Elliott, L.R.; Ledochowski, L.; Marksteiner, J.; Kopp, M. Acute effects of outdoor physical activity on affect and psychological well-being in depressed patients—A preliminary study. Ment. Health Phys. Act. 2016, 10, 4–9. [Google Scholar] [CrossRef]
  52. Kim, J.; Schiavon, S.; Brager, G. Personal comfort models–A new paradigm in thermal comfort for occupant-centric environmental control. Build. Environ. 2018, 132, 114–124. [Google Scholar] [CrossRef]
  53. Kántor, N.; Unger, J. Benefits and opportunities of adopting GIS in thermal comfort studies in resting places: An urban park as an example. Landsc. Urban Plan. 2010, 98, 36–46. [Google Scholar] [CrossRef]
  54. Topay, M. Mapping of thermal comfort for outdoor recreation planning using GIS: The case of Isparta Province (Turkey). Turk. J. Agric. For. 2013, 37, 110–120. [Google Scholar] [CrossRef]
  55. Pantavou, K.; Theoharatos, G.; Santamouris, M.; Asimakopoulos, D. Outdoor thermal sensation of pedestrians in a Mediterranean climate and a comparison with UTCI. Build. Environ. 2013, 66, 82–95. [Google Scholar] [CrossRef]
  56. Pantavou, K.; Santamouris, M.; Asimakopoulos, D.; Theoharatos, G. Empirical calibration of thermal indices in an urban outdoor Mediterranean environment. Build. Environ. 2014, 80, 283–292. [Google Scholar] [CrossRef]
  57. Niu, J.; Liu, J.; Lee, T.-C.; Lin, Z.; Mak, C.; Tse, K.-T.; Tang, B.-S.; Kwok, K.C. A new method to assess spatial variations of outdoor thermal comfort: Onsite monitoring results and implications for precinct planning. Build. Environ. 2015, 91, 263–270. [Google Scholar] [CrossRef]
  58. Sharmin, T.; Steemers, K.; Matzarakis, A. Analysis of microclimatic diversity and outdoor thermal comfort perceptions in the tropical megacity Dhaka, Bangladesh. Build. Environ. 2015, 94, 734–750. [Google Scholar] [CrossRef]
  59. Ruiz, M.A.; Correa, E.N. Adaptive model for outdoor thermal comfort assessment in an Oasis city of arid climate. Build. Environ. 2015, 85, 40–51. [Google Scholar] [CrossRef]
  60. Taleghani, M.; Kleerekoper, L.; Tenpierik, M.; van den Dobbelsteen, A. Outdoor thermal comfort within five different urban forms in the Netherlands. Build. Environ. 2015, 83, 65–78. [Google Scholar] [CrossRef]
  61. Huang, J.; Zhou, C.; Zhuo, Y.; Xu, L.; Jiang, Y. Outdoor thermal environments and activities in open space: An experiment study in humid subtropical climates. Build. Environ. 2016, 103, 238–249. [Google Scholar] [CrossRef]
  62. Salata, F.; Golasi, I.; de Lieto Vollaro, R.; de Lieto Vollaro, A. Outdoor thermal comfort in the Mediterranean area. A transversal study in Rome, Italy. Build. Environ. 2016, 96, 46–61. [Google Scholar] [CrossRef]
  63. Rodríguez Algeciras, J.A.; Gómez Consuegra, L.; Matzarakis, A. Spatial-temporal study on the effects of urban street configurations on human thermal comfort in the world heritage city of Camagüey-Cuba. Build. Environ. 2016, 101, 85–101. [Google Scholar] [CrossRef]
  64. Salata, F.; Golasi, I.; de Lieto Vollaro, R.; de Lieto Vollaro, A. Urban microclimate and outdoor thermal comfort. A proper procedure to fit ENVI-met simulation outputs to experimental data. Sustain. Cities Soc. 2016, 26, 318–343. [Google Scholar] [CrossRef]
  65. Jihad, A.S.; Tahiri, M. Modeling the urban geometry influence on outdoor thermal comfort in the case of Moroccan microclimate. Urban Clim. 2016, 16, 25–42. [Google Scholar] [CrossRef]
  66. Golasi, I.; Salata, F.; Vollaro, E.d.L.; Coppi, M. Complying with the demand of standardization in outdoor thermal comfort: A first approach to the Global Outdoor Comfort Index (GOCI). Build. Environ. 2018, 130, 104–119. [Google Scholar] [CrossRef]
  67. Cheung, P.K.; Jim, C. Comparing the cooling effects of a tree and a concrete shelter using PET and UTCI. Build. Environ. 2018, 130, 49–61. [Google Scholar] [CrossRef]
  68. Kruger, E.L.; Drach, P. Identifying potential effects from anthropometric variables on outdoor thermal comfort. Build. Environ. 2017, 117, 230–237. [Google Scholar] [CrossRef]
  69. Krüger, E.; Drach, P.; Broede, P. Outdoor comfort study in Rio de Janeiro: Site-related context effects on reported thermal sensation. Int. J. Biometeorol. 2017, 61, 463–475. [Google Scholar] [CrossRef]
  70. Amindeldar, S.; Heidari, S.; Khalili, M. The effect of personal and microclimatic variables on outdoor thermal comfort: A field study in Tehran in cold season. Sustain. Cities Soc. 2017, 32, 153–159. [Google Scholar] [CrossRef]
  71. Nasrollahi, N.; Hatami, Z.; Taleghani, M. Development of outdoor thermal comfort model for tourists in urban historical areas; A case study in Isfahan. Build. Environ. 2017, 125, 356–372. [Google Scholar] [CrossRef]
  72. Yang, B.; Olofsson, T.; Nair, G.; Kabanshi, A. Outdoor thermal comfort under subarctic climate of north Sweden–A pilot study in Umeå. Sustain. Cities Soc. 2017, 28, 387–397. [Google Scholar] [CrossRef]
  73. Fang, Z.; Lin, Z.; Mak, C.M.; Niu, J.; Tse, K.-T. Investigation into sensitivities of factors in outdoor thermal comfort indices. Build. Environ. 2018, 128, 129–142. [Google Scholar] [CrossRef]
  74. Xu, M.; Hong, B.; Mi, J.; Yan, S. Outdoor thermal comfort in an urban park during winter in cold regions of China. Sustain. Cities Soc. 2018, 43, 208–220. [Google Scholar] [CrossRef]
  75. Li, J.; Niu, J.; Mak, C.M.; Huang, T.; Xie, Y. Assessment of outdoor thermal comfort in Hong Kong based on the individual desirability and acceptability of sun and wind conditions. Build. Environ. 2018, 145, 50–61. [Google Scholar] [CrossRef]
  76. Nazarian, N.; Sin, T.; Norford, L. Numerical modeling of outdoor thermal comfort in 3D. Urban Clim. 2018, 26, 212–230. [Google Scholar] [CrossRef]
  77. Johansson, E.; Yahia, M.W.; Arroyo, I.; Bengs, C. Outdoor thermal comfort in public space in warm-humid Guayaquil, Ecuador. Int. J. Biometeorol. 2018, 62, 387–399. [Google Scholar] [CrossRef] [PubMed]
  78. Ali, S.B.; Patnaik, S. Thermal comfort in urban open spaces: Objective assessment and subjective perception study in tropical city of Bhopal, India. Urban Clim. 2018, 24, 954–967. [Google Scholar] [CrossRef]
  79. Fang, Z.; Feng, X.; Liu, J.; Lin, Z.; Mak, C.M.; Niu, J.; Tse, K.T.; Xu, X. Investigation into the differences among several outdoor thermal comfort indices against field survey in subtropics. Sustain. Cities Soc. 2019, 44, 676–690. [Google Scholar] [CrossRef]
  80. Xie, Y.; Liu, J.; Huang, T.; Li, J.; Niu, J.; Mak, C.M.; Lee, T.C. Outdoor thermal sensation and logistic regression analysis of comfort range of meteorological parameters in Hong Kong. Build. Environ. 2019, 155, 175–186. [Google Scholar] [CrossRef]
  81. Roshan, G.; Almomenin, H.S.; da Silveira Hirashima, S.Q.; Attia, S. Estimate of outdoor thermal comfort zones for different climatic regions of Iran. Urban Clim. 2019, 27, 8–23. [Google Scholar] [CrossRef]
  82. Mijani, N.; Alavipanah, S.K.; Hamzeh, S.; Firozjaei, M.K.; Arsanjani, J.J. Modeling thermal comfort in different condition of mind using satellite images: An Ordered Weighted Averaging approach and a case study. Ecol. Indic. 2019, 104, 1–12. [Google Scholar] [CrossRef]
  83. Ziaul, S.; Pal, S. Assessing outdoor thermal comfort of English Bazar Municipality and its surrounding, West Bengal, India. Adv. Space Res. 2019, 64, 567–580. [Google Scholar] [CrossRef]
  84. Cheung, P.K.; Jim, C. Improved assessment of outdoor thermal comfort: 1-hour acceptable temperature range. Build. Environ. 2019, 151, 303–317. [Google Scholar] [CrossRef]
  85. Deng, J.-Y.; Wong, N.H. Impact of urban canyon geometries on outdoor thermal comfort in central business districts. Sustain. Cities Soc. 2020, 53, 101966. [Google Scholar] [CrossRef]
  86. Acero, J.A.; Koh, E.J.; Ruefenacht, L.A.; Norford, L.K. Modelling the influence of high-rise urban geometry on outdoor thermal comfort in Singapore. Urban Clim. 2021, 36, 100775. [Google Scholar] [CrossRef]
  87. Lukić, M.; Filipović, D.; Pecelj, M.; Crnogorac, L.; Lukić, B.; Divjak, L.; Lukić, A.; Vučićević, A. Assessment of Outdoor Thermal Comfort in Serbia’s Urban Environments during Different Seasons. Atmosphere 2021, 12, 1084. [Google Scholar] [CrossRef]
  88. Shah, R.; Pandit, R.; Gaur, M. Urban physics and outdoor thermal comfort for sustainable street canyons using ANN models for composite climate. Alex. Eng. J. 2022, 61, 10871–10896. [Google Scholar] [CrossRef]
  89. Shah, R.; Pandit, R.; Gaur, M. Thermal comfort analysis through development of artificial neural network models: An experimental study in Cwa climate. Mater. Today Proc. 2022, 57, 2018–2025. [Google Scholar] [CrossRef]
  90. Rossi, F.; Cardinali, M.; Di Giuseppe, A.; Castellani, B.; Nicolini, A. Outdoor thermal comfort improvement with advanced solar awnings: Subjective and objective survey. Build. Environ. 2022, 215, 108967. [Google Scholar] [CrossRef]
  91. Jones, D.; Snider, C.; Nassehi, A.; Yon, J.; Hicks, B. Characterising the Digital Twin: A systematic literature review. CIRP J. Manuf. Sci. Technol. 2020, 29, 36–52. [Google Scholar] [CrossRef]
  92. Bruse, M. Analysing human outdoor thermal comfort and open space usage with the multi-agent system BOTworld. In Proceedings of the Seventh International Conference on Urban Climate, Yokohama, Japan, 29 June–3 July 2009. [Google Scholar]
Figure 1. Frequency of number of publications.
Buildings 14 00879 g001
Figure 2. Köppen–Geiger climatic classification of studies.
Buildings 14 00879 g002
Figure 3. Indices used by research studies.
Buildings 14 00879 g003
Figure 4. Knowledge Translation to overcome the gaps in traditional approach and improve the predictive accuracy of OTCIs using Industry 4.0.
Buildings 14 00879 g004
Table 1. Brief overview of Industry 4.0 and its application for outdoor thermal comfort studies.
TechnologyDescription
Deep learning techniques  The deep learning technique is a specialized form of machine learning, and the crux behind Artificial Intelligence is making computational systems or machines learn the way humans do, mainly by example; thus, it is data-oriented. Some of the commonly used neural networks include Convolution Neural Network (CNN), Long-Term Short-Term Memory Network (LTST), and Recurrent Neural Network (RNN). In the context of applying deep learning techniques to determine thermal comfort modeling, these data-driven models can be applied as a stand-alone model as indicated by research work carried indoors, or in combination with a conventional OTCI to improve the estimated accuracy by the addition of psychological or behavioral aspects.
Brain–Computer Interface  Applying neuro-technology/BCI for cognitive monitoring of thermal sensation/preference of subjects relates to the real-time measurement of a specific mental activity like attention, emotions, and preferences towards interactive surroundings [23]. In the context of applying neuro-technology for cognitive monitoring of thermal sensation/preference of subjects, BCI relates to the real-time measurement of a specific mental activity like attention, emotions, and preferences towards interactive surroundings [23]. When combined with other sensory modalities like physiological or behavioral monitoring, EEG measurement helps create a complete mobile brain-/body imaging (MoBI) to understand embodied cognition further. Thus, the evaluation of the required cognitive metric can be estimated based on the study’s objective [24]. Scanlon et al. (2019) assessed participants’ attention-related metrics while walking, standing, and running on a treadmill. Typically, target cognitive metrics are attention, interest, and memory as responses to an auditory stimulus, for instance, attention to a speaker [25]. Banaei et al. (2017) estimated participants’ perception and emotional experiences while walking around different architectural spaces in virtual reality [26], which also pinpoints the most crucial application of this neuro-adaptive technology, which is the possibility of testing the perception of participants towards any simulated environment other than a real audio/visual/motor-related stimulus.
Multi-sensory and multi-mediated reality  Artificial realities are computer-generated simulation experiences of a virtual world replacing the real-world environment [27]. Virtual, augmented, mixed, mediated, and multi-mediated reality are the different realities developed to date [28]. Virtual reality completely blocks out the real world and provides an immersive virtual environment, for example, Google Street View with Earth VR [28]. Augmented reality does not block the real world like VR [29]. Instead, it supplements the experience with an embodied mix of real and virtual worlds by superimposing models in the virtual scene, thereby giving the illusion that these artificially generated models exist in the real world [29]. Mixed reality blends both real and virtual experiences and alters them in different proportions through an axis called the virtuality axis (XR) or extended reality (e.g., Sony’s X-Reality). The multi-sensory effect can be applied to AR and MR, known as multi-sensory augmented reality or multi-sensory mixed reality [27].
  Hence, multi-sensory MR can completely portray real-world weather and climatic variations [28]. The effectiveness of the aforementioned simulated realities lies in the fact that human brains do not differentiate between actual and imagined events as the same neural pathways are evoked for both, as confirmed by neuro-experimental studies [30]. Hence, this indifference of the brain is leverage for researchers to simulate any climatic scenario they choose to study. Using neuroscience reality as a leverage, end-users’ neural activity can be recorded (using a BCI headset) to interpret the participant’s emotional or even unconscious and complex feelings and thoughts about a built environment in a simulation chamber rather than outdoors [3].
Geo-spatial digital twins  The digital twin of buildings or cities is the integration of IoT and models extracted from Building Information Modeling (BIM) (3D/4D/5D/6D) to obtain real-time operation of the buildings or even a whole city to monitor and estimate big data for efficient functioning and to optimize all physical entities (e.g., people, objects, vehicles, trees), thereby behaving as a conduit for data transfer between the real and virtual worlds. Apart from providing a better quality of life for city dwellers indoors and outdoors, the digital twin stores geo-spaced information of all services and infrastructure existing in a city, thus allowing one to verify different simulation scenarios before applying any changes to an actual building or open space in a city [31]. Geo-spatial digital twins refer to a digital twin with an additional level of data, i.e., GIS [32].
Internet of Things  The term ‘Internet of Things’ was coined in 1999 by Austin; these devices operate on internet-based technology connecting physical and virtual worlds excluding computers and mobile phones. IoT is the crux behind making devices/gadgets or cities/industries ‘smart’, enabling them to be interoperable using Information and Communication Technologies (ICT). IoT also becomes an essential part of the digital twin of smart buildings and smart cities as it gathers data continuously for big data analytics, which modulates to control these smart buildings’ functioning via cloud services. Primarily, IoT-enabled devices or gadgets collect information from their surroundings based on sensor(s) embodied in them, which is relayed to data analytics using cloud computing. After data pass through the communication model conduit, users and service providers can analyze the big data aggregation for predictive analytics in necessary domains.
  Applying the concept of IoT is relatively new, and research publications are scarce, and to the best of the authors’ knowledge, the published works have mainly focused on indoor thermal comfort [33]. However, utilizing this concept is useful for predicting outdoor thermal comfort index, particularly in collecting weather parameters, as monitoring meteorological parameters is a critical step in using a thermal comfort index, whether the index is empirical or simulation-based [33].
Table 2. Summary of different studies for assessing prediction accuracy of outdoor thermal comfort indices. The analysis spanned from 2015 to 2023, coinciding with the development of bio-climatic OTCIs since 2010, and the introduction of the first publication on machine learning, structural equation models, and subjective assessments around 2015.
RefYear of PublicationPlace of StudyKöppen–Geiger ClassificationResearch Methodology/Modification TechniqueIndices UsedSeason and Time of ExperimentScale UsedTimeframe of StudySummary Findings
[53]2010Szeged, HungaryDfbARC GIS view, field survey (6775)PETSummer, spring, autumn, 12 noon–3 p.m.-14 days
  • The detected usage is a function of subjective thermal conditions more than meteorological parameters;
  • 65% stayed in warm and hot areas during spring (PET > 29 °C), whereas 76% stayed in springtime. Only 43.4% stayed under sun in autumn time.
[55]2013Athens, GreeceCsaField questionnaire survey (287)UTCISummer, 8 a.m.–12 p.m., 2 p.m.–7 p.m.9-point thermal sensation scale3 months
  • Participants preferred warmer temperature and associated with outdoor thermal comfort;
  • TSV showed divergent results on UTCI scale, i.e., lower limit of neutral thermal sensation (17.4 °C) was much higher than that predicted by UTCI (9 °C).
[54]2013Isparta, TurkeyCsaARC GIS----
  • Thermal perception maps are generated with the help of climate data and GIS tool;
  • Using these thermal maps, regions or zones are delineated to make suitable measurements.
[56]2014Athens, GreeceCsaMeteorological measurements, questionnaires (1706),STI, UTCI, ASVSummer, 9 a.m.–12 p.m., 1 p.m.–7:30 p.m.ISO16 days
  • ASV, STI, and UTCI were calibrated by three methods, linear and cubic regression and probit analysis, and revealed better accuracy;
  • ASV’s performance was better than STI and UTCI (lowest) after calibration and closest to TSV.
[57]2015Hong Kong, ChinaCwa PET-ASHRAE2 days
  • Data analysis showed that different thermal comfort zones exist in the precinct within a span of 200 m;
  • Compared to open space and basement, semi-open space below an elevated building is better at inducing thermal comfort conditions.
[58]2015Dhaka, BangladeshAwQuestionnaire survey (700), field measurementUTCISummer, 9 a.m.–6 p.m.ISO1 week
  • Building orientation in the E-W direction caused 1–3.8 °C more heat than traditional building layout;
  • Uniform building heights and patterns caused more thermal discomfort for pedestrians.
[59]2015Mendoza, ArgentinaCfaField survey (622), multiple regressionASVSummer, 9 a.m.–5 p.m.ISO6 days
  • Predictive ability of commonly used thermal comfort indices are below 25%;
  • Thermal comfort index for Arid zones developed from multiple regression showed a predictive ability of 73% with independent variables—air temperature, relative humidity, wind speed.
[60]2015NetherlandsCfbField measurements, ENVI-metPET- 16 daysAmong the tested orientations (both singular and linear) north-south, east-west, and courtyard, the latter proved to be most effective in brining outdoor thermal comfort.
[61]2016Wuhan, ChinaCfaField observations (23,164), questionnaires,
measurement
UTCISummer and winter, 7:00–12 p.m., 3 p.m.−9 p.m.ASHRAE4 years
  • Demographic factors influence behavioral response to outdoor thermal comfort.;
  • A causal relationship was found between outdoor thermal environment and activity type as 80%.
[20]2016Isfahan, Iran (Bsk)BskMicroclimatic field measurement, simulationPET, PMVSummer and winter, 10 a.m.–6 p.m.ASHRAE2 weeks
  • Prediction results underestimated neutral and slightly warm sensation while it gave reasonable accuracy for cool sensations;
  • Extreme machine learning (ELM—93.54%) outperformed ANN (91.96) and GP (91.99) in terms of prediction ability;
PET prediction was poorer than PMV prediction results for 3 ML approaches.
[45]2016Cairo, EgyptBwhQuestionnaire survey (320), field measurementPETSummer and winter, 8–10 a.m., 1–3 p.m., 6–9 p.m.ASHRAE1 week
  • Preferred temperature was 29 °C PET in summer and 24.5 °C PET in winter;
  • Thermal neural stress values were higher than that of a temperate climate;
  • Analysis of behavioral adaptation showed men more than women preferred to move to a shaded place to overcome excess outdoor heat.
[62]2016Rome, ItalyCsaQuestionnaire survey (1000), field measurementPETFall, spring, summer, winter, 8 a.m.–9 p.m.McIntyre and ASHRAE1 year
  • PET neutral values for hot and cold season were 26.9 °C and 24.9 °C, respectively;
  • Probit function preferred values for hot and cold season were 24.8 °C and 22.5 °C, respectively;
  • By comparing TSV with modified PET, neutral thermal range was between 21.1–29.2 °C.
[16]2016Campo Grande, BrazilAwField survey (428)PET, UTCI, PMV, YDS, TEPSpring and winterISO4 days
  • PET, UTCI, PMV, Sense of Thermal Comfort (YDS), and Perceived Equivalent Temperature (TEP) had very low predictive capability (19–54%);
  • After calibration from thermal sensation votes, comfort neutral range from PMV was 21–27 °C;
  • Modified scale improved the predictive ability to 63%.
[43]2016Guangzhou, ChinaCfaField survey (1582), logistic regressionTSV, ASV, PTVSummer, 9 a.m. −6 p.m.ASHRAE, 3-point Mclntyre3 months
  • The acceptable thermal comfort is 28.54 °C, which is higher than theoretical neutral temperature set by SET*;
  • New thermal comfort model was developed from ASV and meteorological variables.
[63]2016Camagüey, CubaAwSimulation (RayMan)PET --
  • Extremely high temperature pockets occur along north-south and east-west street orientations;
  • Optimum street configuration is north-south with aspect ratio between 1 and 1.5 for both summer and winter.
[64]2016Rome, ItalyCsaField survey (previous data), ENVI-metPMVSummer-1 day
  • PMV was compared with field survey that had an average deviation of 0.76 units;
  • Open type of ENVI-met showed reliable results among the different lateral boundary conditions.
[65]2016MoroccoCsaTotal Energy Balance Model (TEB)PMV -For increasing thermal comfort, it is preferred to have medium aspect ratio between 1.2 and 2.5.
[66]2017Rome, ItalyCsaExperimental field survey (used previous research data)GOCI, PMV, PET, UTCI ASHRAE1 yearGOCI (27.8%) outperforms in predictive ability when compared to PMV (27.7%), PET (25.4%), and UTCI (23%) but underperforms compared to (MOCI (32.3%).
[67]2017Hong Kong, ChinaCwaMicroclimatic measurements, PET and UTCI indicesPET, UTCISummerASHRAE3 days
  • The mean daytime and nighttime temperature provided by trees is higher than concrete shelters;
  • For mean daytime and nighttime cooling, cooling effects provided by trees are: 0.6 °C air temperature, 3.9 °C PET, and 2.5 °C UTCI;
  • Thermal stress by PET and UTCI on the warmer side were statistically different with UTCI giving better accuracy.
[68]2017Rio
de Janeiro, Brazil
AwQuestionnaires (1015)UTCI, DTSSpring and summerISO10 days
  • Thermal sensation (TSV) was developed as a function of DTS;
  • Females reported slightly warmer thermal sensation than males, with an average increase of 0.04 TSV;
  • Elderly sub-groups were found to have lower TSV by 0.3 than younger samples;
  • BMI difference were negligence except between normal and obese at 0.05 TS;
  • Darker skin colored people had an increase of 0.35 TSV for DTS = +1;
  • Moreover, negligible differences were noted between mixed skin color and darker skin color.
[69]2017Rio
de Janeiro, Brazil
AwQuestionnaire survey (985), field measurementPET, UTCISummer, 10 a.m.–3 p.m.ISO3 years
  • To a large extent, PET and UTCI can explain thermal sensations of people;
  • Under moderate heat stress, increase in SVF increases warm thermal sensation;
  • Under high heat stress, thermal sensation depends on meteorological conditions more than SVF.
[70]2017Tehran, IranCsaField survey (410), multiple regressionTSVWinter, 9 a.m.–5 p.m.ASHRAE5 days
  • The acceptable neutral temperature for winter was 14.2 °C;
  • Using multiple regression, it was found demographic factors like age and gender are as significant as climatic factors with R2 ranging between 26 to 48%.
[71]2017Isfahan, IranBskField survey (previous research data), ENVI-metPETSummer, 5 p.m.–8 p.m.ASHRAE scale10 daysNeutral thermal comfort ranged between 23.06 to 29.73 °C PET.
[72]2017Umeå, SwedenDfcStructured interviews, questionnaires (525)PMV, PET, UTCISummer, 10 a.m.–4 p.m.ASHRAE1 month
  • High solar radiation is preferred by 49% of local people even with ‘slightly warm’ TSV;
  • Local people can tolerate a wider range of climatic variation than non-local people.
[73]2018Hong Kong, ChinaCwaField survey (1706)PET, UTCISummer, autumn, 8:30 a.m.–6:30 p.m.ASHRAE3 months
  • When operative temperature is less than 32 °C, only air velocity showed a positive and linear relationship with PET. An exponential relationship with PET was found at operative temperature more than 32 °C;
  • Clothing insulation was indirectly proportional to air temperature.
[9]2018Hong Kong, ChinaCwaField experiment (25)UCMSummer, winter, autumnASHRAE25 days
  • Participants were more sensitive to wind conditions than solar radiation when the latter was low, which was not captured by the UCM model;
  • Subjects were more tolerant of high air temperature than predicted by the model, thus, over-predicting TSV;
  • Under very hot temperatures, UCM and onsite measurements both showed higher sensitivity towards wind.
[74]2018Xi’an, ChinaBskQuestionnaire survey (1008), field measurementUTCI, PETWinter, 9:30 a.m.–5: 30 p.m.ASHRAE2 days
  • Solar radiation was the preferred factor for thermal comfort followed by air temperature, wind speed;
  • UTCI (14.9–23.2 °C) predicted better than PET (13.3–23.6 °C) for neutral thermal stress.
[75]2018Hong Kong, ChinaCwaField survey (1107), logistic regression of sun and wind desirabilityUTCISummer, autumn, winter, 8 a.m.–5 p.m.ASHRAE23 days
  • For temperatures below 26 °C, wind plays a bigger role in determining thermal comfort, while above 26°C, solar strength exerts a bigger influence;
  • Evaluated neutral thermal stress UTCI 16.5–35.0 °C (solar desirability) and 18.5–32.5 °C (wind desirability).
[76]2018Arizona, USBwhSimulation, SETSET- 1 day
  • OTC3D uses spatial and temporal variation for modeling and uses SET as OTCI;
  • When urban density is high, λ = 0.44, surface temperature distribution becomes more critical than building with uniform density.
[77]2018Guayaquil, EcuadorAwField survey (544)PET, SET*Rainy season, 11 a.m.–6 p.m.ISO3 months
  • For dry season, neutral and upper thermal comfort values were lower for both PET and SET* compared to rainy season;
  • Preferred neutral value through subjective evaluation reveals that it is above the theoretical value produced by PET and SET* for both seasons.
[78]2018Bhopal, IndiaCsaField survey, inferential statistics, structured interviewASV, PETSummer, 12:30 p.m.–4 p.m.ASHRAE7 days
  • PET in urban parks was higher than theoretical control limit PET (<30 °C);
  • Statistical analysis confirmed tree canopy density and globe temperature influenced subjective perception.
[79]2019Guangzhou, ChinaCfaQuestionnaire survey (644), field measurementMTSV, PET, WBGT, SET*, UTCI, PMVSummer, 8:30 a.m.–6:30 p.m.ASHRAE1 month
  • Different indices like PET, WBGT, SET*, UTCI, Tmrt, and PMV showed a very high correlation (correlation coefficient of 0.9) with operative temperature;
  • Relationship between MTSV and indices is not clear when operative temperature becomes higher than 34 °C.
[80]2019Hong Kong, ChinaCwaQuestionnaire survey (1600), field measurement, probit analysis, and logistic regression-SummerExtended 7-point ASHRAE2 years
  • Summer season had the narrowest neutral thermal stress and transitional offered broader range of neutral thermal stress;
  • Effect of wind tend to offset thermal sensation of air temperature when it was less than 31 °C;
  • Participants tended to vote correctly as temperature shifted away from neutrality.
[81]2019IranCsaData analysisPT, SET*, UTCI- -
  • Low and high threshold temperature value for PET-18.9–22.5 °C for Bwh;
  • PET: 15.1–19.1 °C for Cfa,
SET*: 20.5–25.5 °C for Bwh,
UTCI:18.5–25 °C for Csb.
[82]2019--OWA, GIS-MCDA----
  • As sensation increases towards optimum (subjective thermal assessment), sensitivity towards favorable and unfavorable categories decreases;
  • Increasing brightness leads to improved thermal sensation in urban areas.
[83]2019West Bengal, IndiaCwaField survey (250), GISDiscomfort Index (DI), PETSummer, winter--
  • Built-up areas experience uncomfortable cold and hot sensations during winter and summer seasons;
  • During cold stress period, 58.78% areas had PET (9–11 °C) and periods of heat stress, 82.41% of areas experienced extreme heat.
[84]2019Hong Kong, ChinaCwa-PET, UTCI-9-point modified ASHRAE scale1 year
  • 1-hour acceptable temperature range (acceptability by 80%): PET—17.0–31.9 °C; UTCI—19.0–33.0 °C; air temperature—22.6–25.4 °C;
  • Transient acceptable temperature range: PET—5.8–45.7 °C; UTCI—4.4–42.4 °C; Air temperature—7.4–34.9 °C.
[48]2020Hong Kong, ChinaCwaField measurements and questionnaire (1638)UTCI, SWI (new)Summer, autumn, winter, 1 p.m.–3 p.m.ASHRAE, 3-point scale for solar and wind desirability1 year
  • Newly developed sun and wind index (SWI) was voted by more than 50% of participants;
  • When solar conditions were stronger than wind, preferred ambient temperature was ≤26 °C, and >26 °C where wind condition was stronger than solar.
[18]2020--Simulations—Neural networkPET---The proposed algorithm to predict PET one hour ahead using cross-over operator of genetic algorithm (GA) and cuckoo optimization algorithm (COA) proved to show 93% effectiveness compared to traditional COA and GA.
[17]2020Tianjin, China (Bsk), and West Lafayette
USA (Dfa)
Bsk, DfaSimulation—Support Vector Machine (SVM), experiment and questionnaire---8 months
  • Prediction accuracy of outdoor thermal comfort was 66–72% from exposed body parts and 42–58% from abdomen or thorax;
  • It was noted that skin temperature of one body part and two body parts improved the model’s accuracy by 1–5% and 4–7%, respectively.
[85]2020Nanjing, SingaporeAfSimulation, ENVI-metPET--
  • East-west orientations have the warmest temperature build-up;
  • As aspect ratio increases, Tmrt decreases;
  • Aspect ratio should not be less than 3, 6, and 8.
[10]2021Tehran, IranCsaQuestionnaire survey (289), field measurementWBGT, ET, Humidex, Teq UTCI, PET, SET*, WCT, STISummer, winterASHREA and McIntyre 3-point scale79 days
  • Low percentage (30% on average) of prediction was noted for TSV vs. original scale of indices;
  • Especially in the neutral class, UTCI and PET’s modified scale using probit analysis and PPD’s diagram-fitted curve correlated better with TSV (on an average it improved to around 50%).
[86]2021SingaporeAfSimulation, ENVI-metPET--
  • The best street orientation is north-south with an aspect ratio of 1.5–3.5.;
  • The study recommends region-specific urban geometry to improve outdoor thermal comfort than a universal one.
[87]2021SerbiaCfa-UTCISummer, spring--
  • Temperature anomalies showed an increasing trend during summer and spring;
  • There is also temporal variation in UTCI threshold value.
[21]2022Seoul, South Korea (Dwa)DwaPET (from previous studies), ML (Decision Tree, Random Forest, XG Boost, Ada Boost, Bayesian Ridge), simulations (RayMan Pro)PET-ASHRAE14 years
  • Prediction accuracy reached up to 90% after hyperparameter tuning;
  • Among the five ML approaches tested, random forest gave the highest prediction accuracy 95.11% compared to other ML models.
[12]2022Imola, ItalyCfaSimulations (Rhinoceros,
Energy Plus, Honeybee, Ladybug)
Real-time PET--1 daySimulation of green pedestrian network can reduce temperature up to 3 °C.
[19]2022Xiamen, ChinaCwaQuestionnaire (1032), structural equation model-Summer, 8 a.m.–6 p.m.ASHRAE3 days
  • A unit increase in psychological cognition led to an increase of 0.601 units of outdoor thermal comfort;
  • Multi-sensory modalities have a strong influence on thermal comfort.
[88]2022Gwalior, IndiaCsaANNPET, UTCI- 6 months
  • Two ANN models had R2 more than 90%;
  • UTCI provided better accuracy than PET, about 6–8% more.
[89]2022Gwalior, IndiaCsaSimulation (ENVI-met)PET- 2 monthsANN for predicting PET had R2 value of 99% when all important meteorological variables were considered and 93% when only air temperature was given as meteorological input for ANN
[90]2022Perugia, ItalyCfbQuestionnaires (27)mPETSummer, 12 p.m.–3 p.m. 1 day
  • Two solar awnings were compared, one with aluminized polyester film—low thermal emissivity, and another with textile awning—high thermal emissivity;
  • The optimized solar awning can reduce mPET value by 1.6 °C.
Disclaimer/Publisher’s Note: The statements, opinions and data contained in all publications are solely those of the individual author(s) and contributor(s) and not of MDPI and/or the editor(s). MDPI and/or the editor(s) disclaim responsibility for any injury to people or property resulting from any ideas, methods, instructions or products referred to in the content.

