Article

Achieving Energy Self-Sufficiency in a Dormitory Building: An Experimental Analysis of a PV–AWHP-ERV Integrated System

1
School of Architectural Engineering, Pusan National University, Busan 46241, Republic of Korea
2
Research Institute for Future Wind Energy Technology, Pusan National University, Busan 46241, Republic of Korea
*
Author to whom correspondence should be addressed.
These authors contributed equally to this work.
Buildings 2024, 14(4), 882; https://doi.org/10.3390/buildings14040882
Submission received: 29 February 2024 / Revised: 17 March 2024 / Accepted: 22 March 2024 / Published: 25 March 2024
(This article belongs to the Special Issue Advanced Building Technologies for Energy Savings and Decarbonization)

Abstract

:
In this study, we investigated the performance of air-to-water heat pump (AWHP) and energy recovery ventilator (ERV) systems combined with photovoltaics (PV) to achieve the energy independence of a dormitory building and conducted an analysis of the energy independence rate and economic feasibility by using energy storage devices. Our data were collected for 5 months from July to November, and the building energy load, energy consumption, and system performance were derived by measuring the PV power generation, purchase, sales volume, AWHP inlet and outlet water temperature, and ERV outdoor, supply, and exhaust temperature. When analyzing representative days, the PV–AWHP integrated system achieved an energy efficiency ratio (EER) of 4.49 and a coefficient of performance (COP) of 2.27. Even when the generated electrical energy exceeds 100% of the electricity consumption, the energy self-sufficiency rate remains at 24% due to the imbalance between energy consumption and production. The monthly average energy self-sufficiency rate changed significantly during the measurement period, from 20.27% in November to 57.95% in September, highlighting the importance of energy storage for self-reliance. When using a 4 kWp solar power system and 4 kWh and 8 kWh batteries, the annual energy self-sufficiency rate would increase to 67.43% and 86.98%, respectively, and our economic analysis showed it would take 16.5 years and more than 20 years, respectively, to become profitable compared to the operation of an AWHP system alone.

1. Introduction

The global climate crisis has underscored the urgent need to reduce carbon emissions from energy use, making this a key objective across various industries. In the construction sector, one promising strategy to achieve this goal is the adoption of zero-energy buildings (ZEBs) [1,2,3]. These buildings are designed to produce as much energy as they consume over the course of a year, effectively eliminating their carbon footprint. The push for ZEBs has become more pronounced due to concerns about energy security and the impact of energy price volatility on the global economy [4,5]. To achieve ZEB status, buildings must significantly reduce their energy consumption and meet any remaining energy needs with renewable sources. This involves improving the insulation performance of buildings, enhancing the efficiency of heating, ventilation, and air conditioning (HVAC) systems, and integrating renewable energy sources like photovoltaic (PV) panels. Research is underway to improve the efficiency of PV panels, particularly in terms of thermal performance, and to explore the potential of photovoltaic–thermal (PV/T) systems that can simultaneously generate electricity and heat [6,7,8,9,10]. As the electrification of major energy sources becomes more widespread, the use of solar energy is expected to increase significantly [11]. Additionally, heat pumps, which are powered by electricity, are being increasingly utilized in various applications [12,13,14,15]. However, the performance of heat pumps can vary based on factors such as technology, geographic location, and energy source [16,17]. Therefore, it is crucial to analyze the performance characteristics of HVAC systems, including heat pumps, PV generation facilities, and energy storage facilities, based on specific building conditions. Recent studies have shown promising results. For instance, Long et al. [18] conducted a simulation to evaluate the performance of solar–air source heat pump (SASHP) heating systems in a low-humidity Tibetan region. Their simulation results showed that initially, the solar heat could handle the entire heating load, but the overall proportion over the entire period was only 42.79%. Therefore, their performance should be improved through the optimization of the solar collector area, angle, and water tank capacity. Kong et al. [19] presented the appropriate number of PV/T modules through a performance analysis and an economic comparison of PV/T–cascade heat pumps for cooling and heating periods in tropical climates. Bae et al. [20] found that a PV/T–ASHP system installed in a small building improved heating and cooling performance coefficients by 52% compared to an ASHP system used alone. They also demonstrated that the electricity generated by the PV/T modules during certain periods exceeded the system’s power consumption, making it possible to achieve a fully zero-energy building [21]. Dementzis et al. [22] monitored a 16 kWp solar panel and a 74 m2 solar collector, along with a 58 kW heat pump, for four years. They found that the PV system generated 6% more electrical energy than the heat pump consumed. Additionally, the solar collector produced 20% more heat per unit area than the heat pump powered by the PV system. Shono et al. [23] conducted a time-resolution analysis of BIPV in large-scale commercial buildings, confirming that 33% of their energy demand could be met by PV modules installed on exterior walls and 15% by rooftop modules. Building on this, Perwez et al. [24] assessed the combined impact on the overall decarbonization potential of buildings, including building-integrated photovoltaics (BIPV). Their results indicate that implementing all measures simultaneously could lead to an 84% reduction in annual CO2 emissions. BIPV emerged as a significant contributor, fulfilling 8–16% and 34–63% of the electricity demand when considering threshold constraints and the full utilization of the building surface, respectively. Sigounis et al. [25] investigated the feasibility of achieving zero-energy implementation in library buildings through the integration of BIPV/T, ERV, and AWHP systems. Their analysis revealed that controlling the heat flow with BIPV/T can satisfy the heating demand and reduce energy consumption for ventilation by up to 37%.
Other studies have focused on the integration of PV generation facilities and energy storage systems. Aneli et al. [26] found that when a 4.8 kWp solar PV generator and a 10 kW heat pump were connected, an energy independence of about 34% could be achieved. Perrella et al. [27] showed that when a heat pump, an 18 kWp PV panel, and a 24 kWh battery were used together, 76% of the heat and electricity demand could be met. Nicoletti et al. [28] conducted a study on the optimal capacity design of air-to-water heat pump (AWHP), PV, and ESS systems considering their economic feasibility for a 20-year driving period. They performed building energy simulations based on the climate of five regions in Italy. Their results showed that the appropriate PV capacity depends on the building’s energy usage independently of the solar source for each region, while the battery size is significantly dependent on the climate characteristics and PV size. A sensitivity analysis of initial costs confirmed a strong interdependence between AWHP, PV, and battery sizes. As the capacities of PV generation facilities and energy storage systems increase, the energy independence rate also increases. However, initial installation costs are high, necessitating a sensitivity analysis of various capacities and prices [29]. Additionally, Yang et al. [30] analyzed various scenarios using a real option model to explore the impact on optimal investment decisions for residential PV–ESS installation projects. Their findings suggest that it could be feasible to apply such installations to all local projects if the initial investment cost is reduced by 50% or the CO2 price is increased by about 33 times. Nonetheless, they also indicate limitations to commercialization under the current circumstances.
Previous studies have been conducted to predict the performance and economic feasibility of systems through mathematical models and energy simulations, as shown in Table 1. In order to accurately evaluate the feasibility of the integrated system, the actual building load and environmental conditions should be considered. Therefore, this study aims to analyze the performance of a system integrating PV, AWHP, and energy recovery ventilation (ERV) in a dormitory building. We analyzed the building load usage patterns during the summer and winter periods, assessed the surplus and shortage of power generation due to PV generation, and evaluated the energy independence rate considering the performance of AWHP systems. Additionally, we performed an economic analysis of the AWHP system alone to propose appropriate capacities considering the energy independence rate and economic feasibility. By understanding the performance characteristics of these integrated systems under actual operating conditions, we hope to provide valuable insights for the design and implementation of ZEBs and renewable energy systems in buildings.
The objectives of this study are as follows: (1) to analyze the building load usage patterns during the summer and winter periods; (2) to assess the surplus and shortage of power generation due to PV generation; (3) to evaluate the energy independence rate considering the performance of the AWHP systems; and (4) to perform an economic analysis of the AWHP system alone to propose appropriate capacities considering the energy independence rate and economic feasibility.

2. Methodology

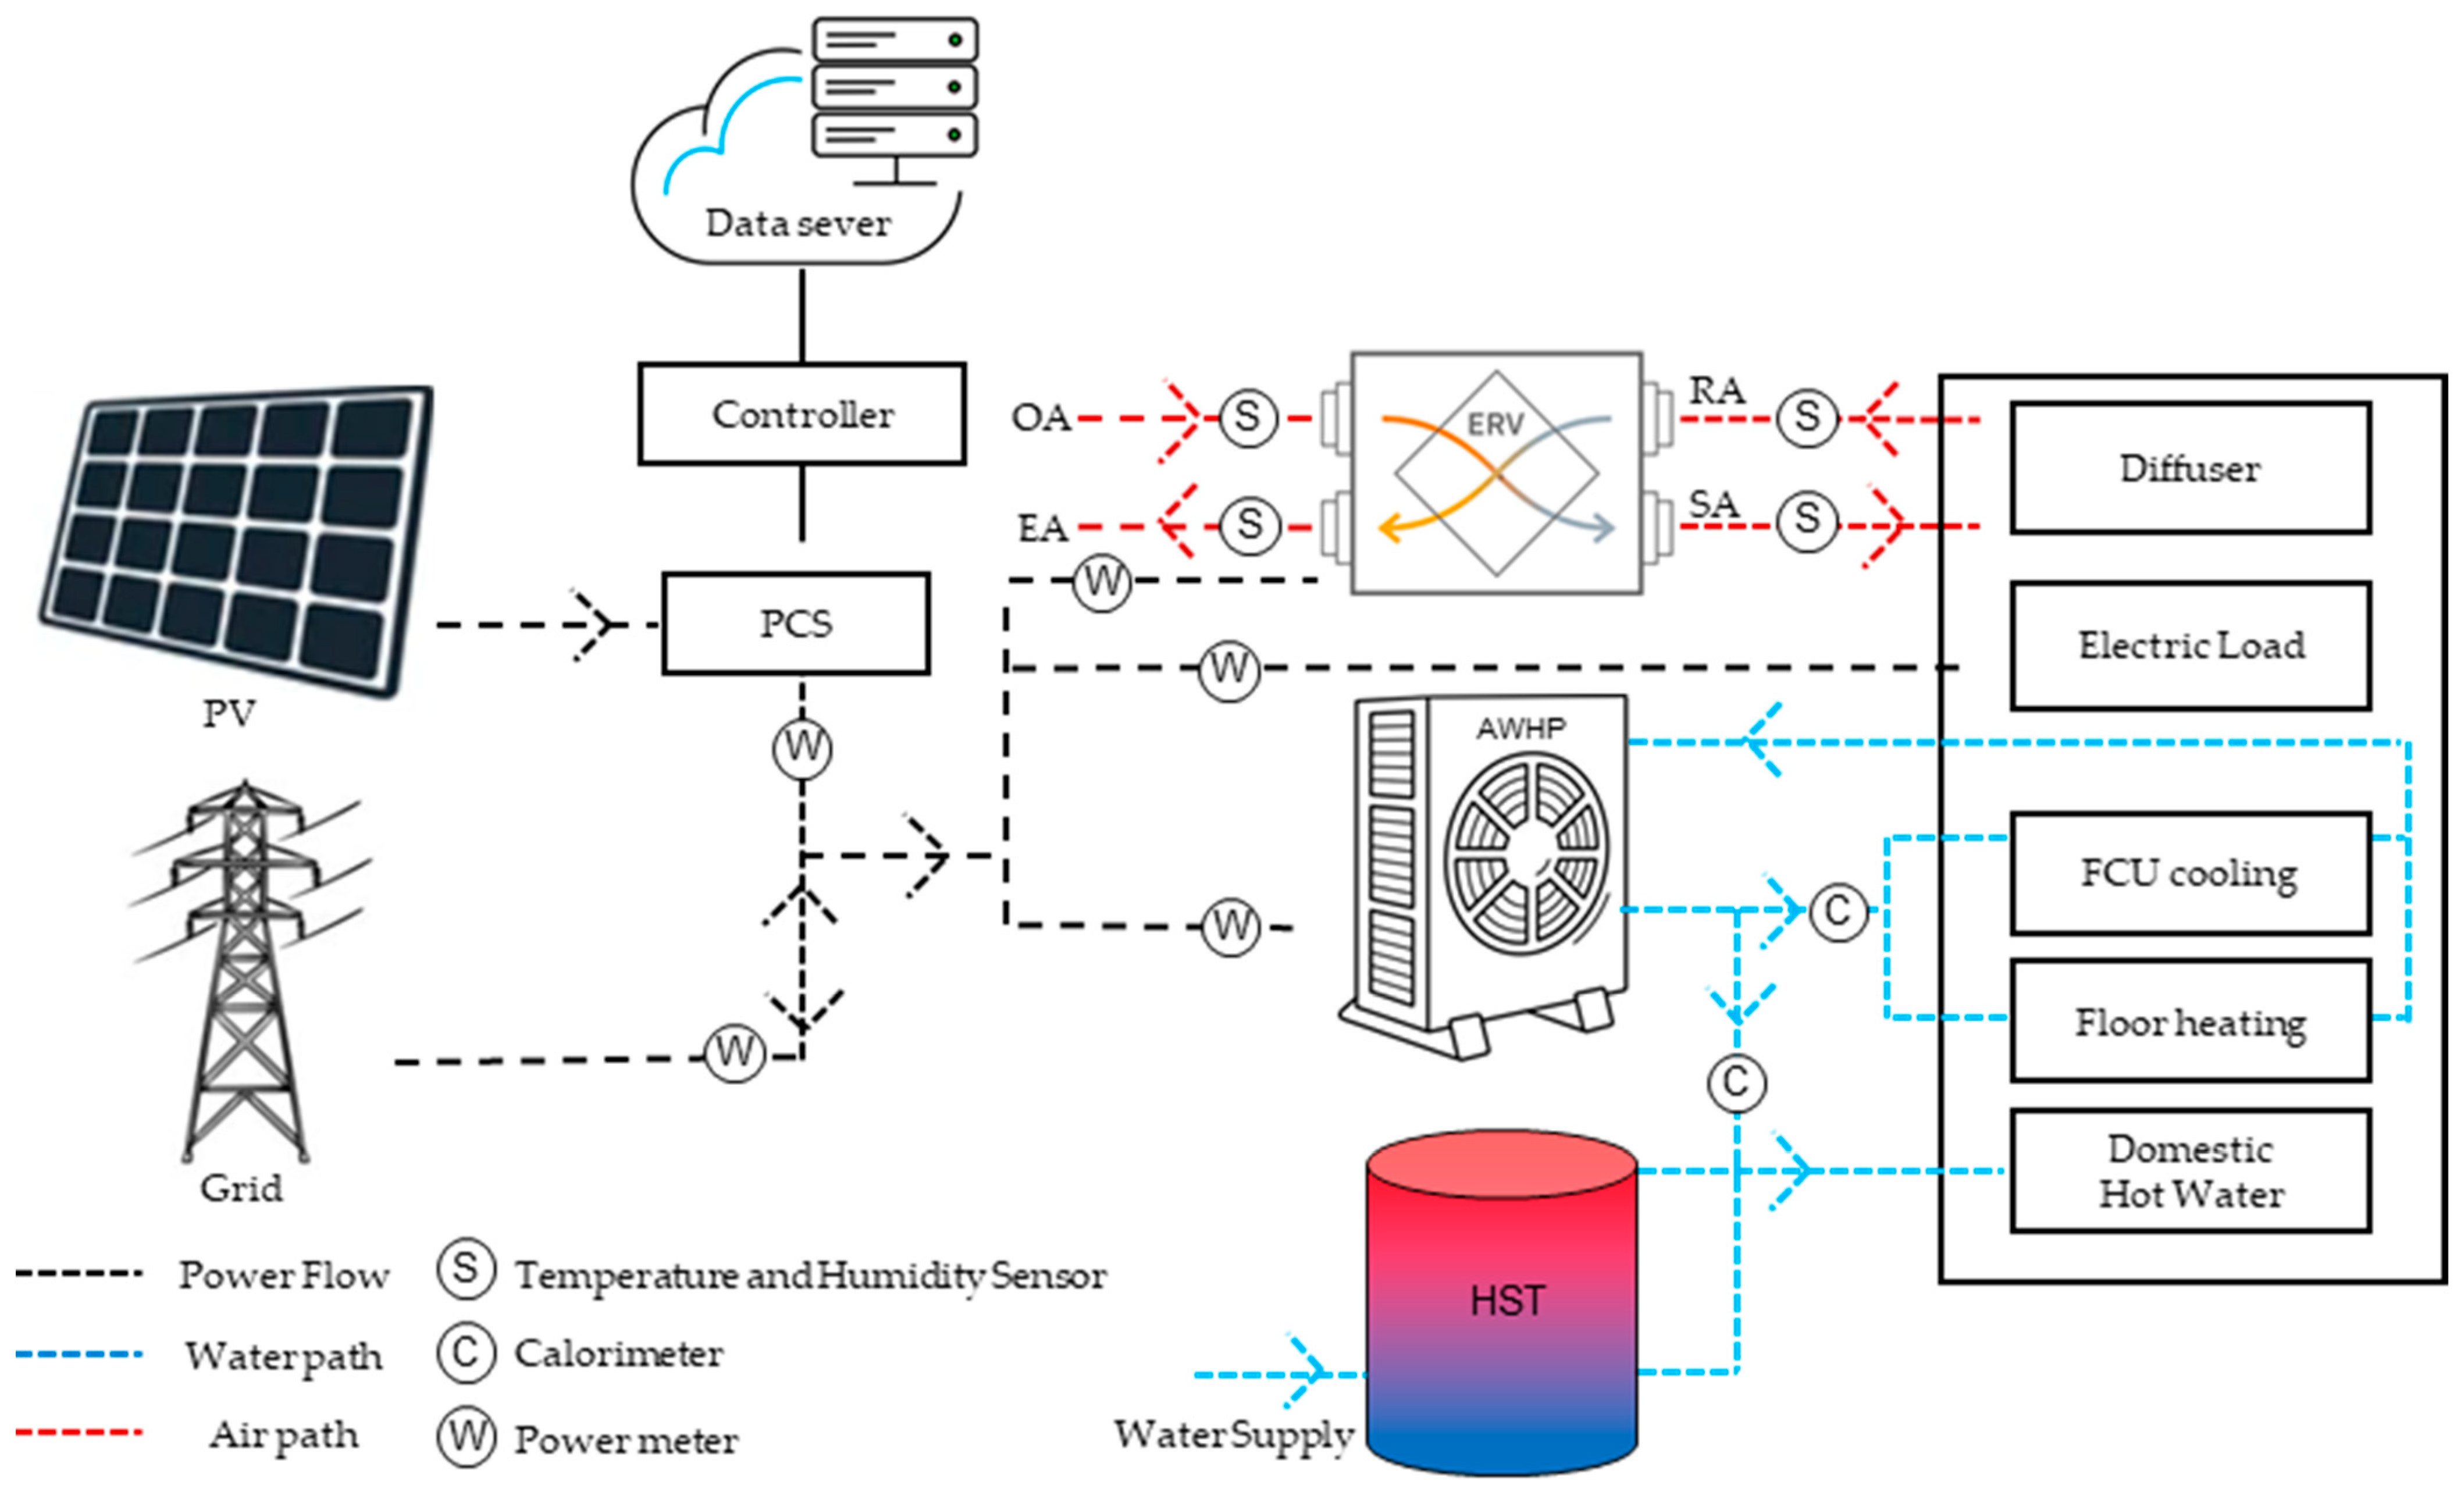
2.1. Building and System Description

The building is located in Cheonan Asan, Republic of Korea (36°46′12.7″ N, 126°59′30.9″ E). The climate zone is classified according to ASHRAE 90.1-2007 as hot and humid in the summer and cold and dry in the winter (4A and 4B). Figure 1 shows the average monthly outdoor temperature and solar radiation. The highest and lowest outdoor temperatures are −2.2 C and 26.2 C, respectively. The monthly average solar radiation is 299.95 W/m2 in May, which is the highest, and 88.69 W/m2 in December, which is the lowest. The building is used as a dormitory, with two people staying in each room, and each person occupies an area of 16.25 m2.
Through the remodeling of the existing building, a renewable energy (PV) and integrated air conditioning system were installed. The integrated energy system (IES) constructed connects two rooms to IES_A and three rooms to IES_B, each responsible for handling the load, as shown in Figure 2. This system can analyze the energy consumption, reflecting the characteristics of the building load as all the loads required for the building are used in the form of electrical energy, and can suggest the appropriate capacity design for renewable energy. The system components include solar panels, power conversion system (PCS), ERV, and AWHP as depicted in Figure 3, and the configuration and specifications of each system are shown in Table 2. The direct current generated by PV is supplied through PCS to operate ERV and AWHP and is connected to the external power grid to sell excess power generated by the system or purchase power when the amount is insufficient. The capacity of AWHP and the storage tank is designed based on ASHRAE Standard 90.1 [31], and floor heating is used for heating, while ceiling-mounted FCUs are used for cooling. For hot water supply, hot water at 65 °C is supplied to the storage tank, and the temperature inside the storage tank is controlled to always be above 50 °C.

2.2. Experimental Conditions

Throughout the five-month period from July to November, meticulous data collection was conducted. Indoor and outdoor temperature and humidity were monitored using sensors, while solar radiation was gauged utilizing an SR-05 solar radiation meter. The cooling and heating loads were quantified through the utilization of an RCN8 ultrasonic heat meter, which measured both inlet and outlet temperatures alongside flow rates. Furthermore, the efficiency of the ERV was assessed using the QAF 3160 apparatus in accordance with ISO 5222-1 standards [32]. This involved meticulous measurement of temperature and humidity at various points including outdoor air inlet (OA), supply air inlet (SA), and exhaust air outlet (RA), facilitating a comprehensive evaluation of ERV performance.
For quantifying the performance of the PV system and related energy dynamics, an EM415 power meter was employed. This meter facilitated the precise measurement of the amount of PV power generation, power purchased from the grid, power sold, and power consumption by auxiliary systems such as the AWHP and ERV. The collected data, spanning minute intervals, were promptly transmitted to a centralized data server for analysis.
The reliability of the measurement equipment utilized in this study is detailed in Table 3, ensuring confidence in the accuracy of the obtained data. Additionally, the precise locations of our measurements are depicted in Figure 3, providing insight into the spatial distribution of data collection points.
Given the significant influence of climate data on system performance, specific days representing peak energy consumption during summer and winter periods were selected for in-depth analysis. Notably, August 7th and November 27th were identified as representative days for comparison and analysis. Through comprehensive examination of trends in PV generation, integrated system energy consumption, and power transactions with the external grid, a nuanced understanding of system behavior was attained, facilitating informed decision-making and optimization strategies.

2.3. Key Performance Indicators

The heating and cooling capacity (Qh and Qc) of an air-to-water heat pump (AWHP) is determined by Equations (1) and (2), and the coefficient of performance (COP) and energy efficiency ratio (EER) are calculated using Equations (3) and (4).
Q h = m ˙ × c p , w × ( T w , i T w , o )
Q c = m ˙ × c p , w × ( T w , o T w , i )
where m ˙ and cp,w are mass flow rate of water (kg/s) and specific heat capacity of water (kJ/kg°C). Tw,i and Tw,o are the water temperatures at the inlet and outlet of the condenser (°C).
C O P = Q h P A W H P
E E R = Q c P A W H P
where PAWHP is the power usage of the AWHP (kW).
The energy saved by operating an energy recovery ventilator (Qsaved) is calculated using Equation (5), and the energy saving efficiency of the ERV is calculated using Equation (6).
Qsaved = ηt × ρ × cp,a × G × (TOATRA)
η t   T O A T S A T O A T R A   × 100
where ηt is the efficiency of the ERV. ρ and cp,a are the density of air (kg/m3) and specific heat capacity of air (kJ/kg°C). G is the indoor and outdoor ventilation amount per sec (m3/s). TOA, TSA, and TRA are the outdoor air temperature, supply air temperature, and indoor air temperature (°C), respectively.

2.4. Building Energy Self-Sufficiency Rate

The building energy self-sufficiency rate is an indicator of the percentage of energy used in the entire building that can be covered by renewable energy. As shown in Equation (7), the building energy self-sufficiency rate was calculated by dividing the total power generated by renewable energy by the total energy consumption.
E n e r g y   s e l f - s u f f i c i e n c y   r a t e = R e n e w a b l e   e n e r g y   g e n e r a t i o n   s y s t e m T o t a l   e n e r g y   c o n s u m p t i o n × 100

2.5. Economic Analysis

The initial investment (I) includes the cost of purchasing and installing the AWHP, PV, and ESS. The annual operating cost (AOC) includes the cost of electricity to run the AWHP and the cost of maintaining the system. Annual savings (AS) come from the energy generated by the PV and ESS. Initial investment, annual operating cost, and annual savings can be calculated according to Equations (8)–(10).
I = CAWHP + CPV + CESS
AOC = EAWHP × Pelectricity + MAWHP
AS = (EPV + EESS) × Pelectricity
where CAWHP, CPV, and CESS are the cost of AWHP, PV, and ESS. EAWHP is the annual energy consumption of the AWHP (kWh). Pelectricity is the annual energy consumption per kWh. MAWHP is the annual maintenance cost of the AWHP.
The net present value (NPV) is the difference between the present value of the benefits and the present value of the costs. Payback period (PP) is the time it takes for the system to pay for itself. Net present value and payback period can be calculated as Equations (11) and (12).
N P V = t = 0 n A S t A O C t ( 1 + r ) t I
P P = I A S A O C
where ASt is the annual savings in year t, and AOCt is the annual operating cost in the year t. r and n are the discount rate and number of years.

3. Result and Discussion

3.1. Representative Day Analysis

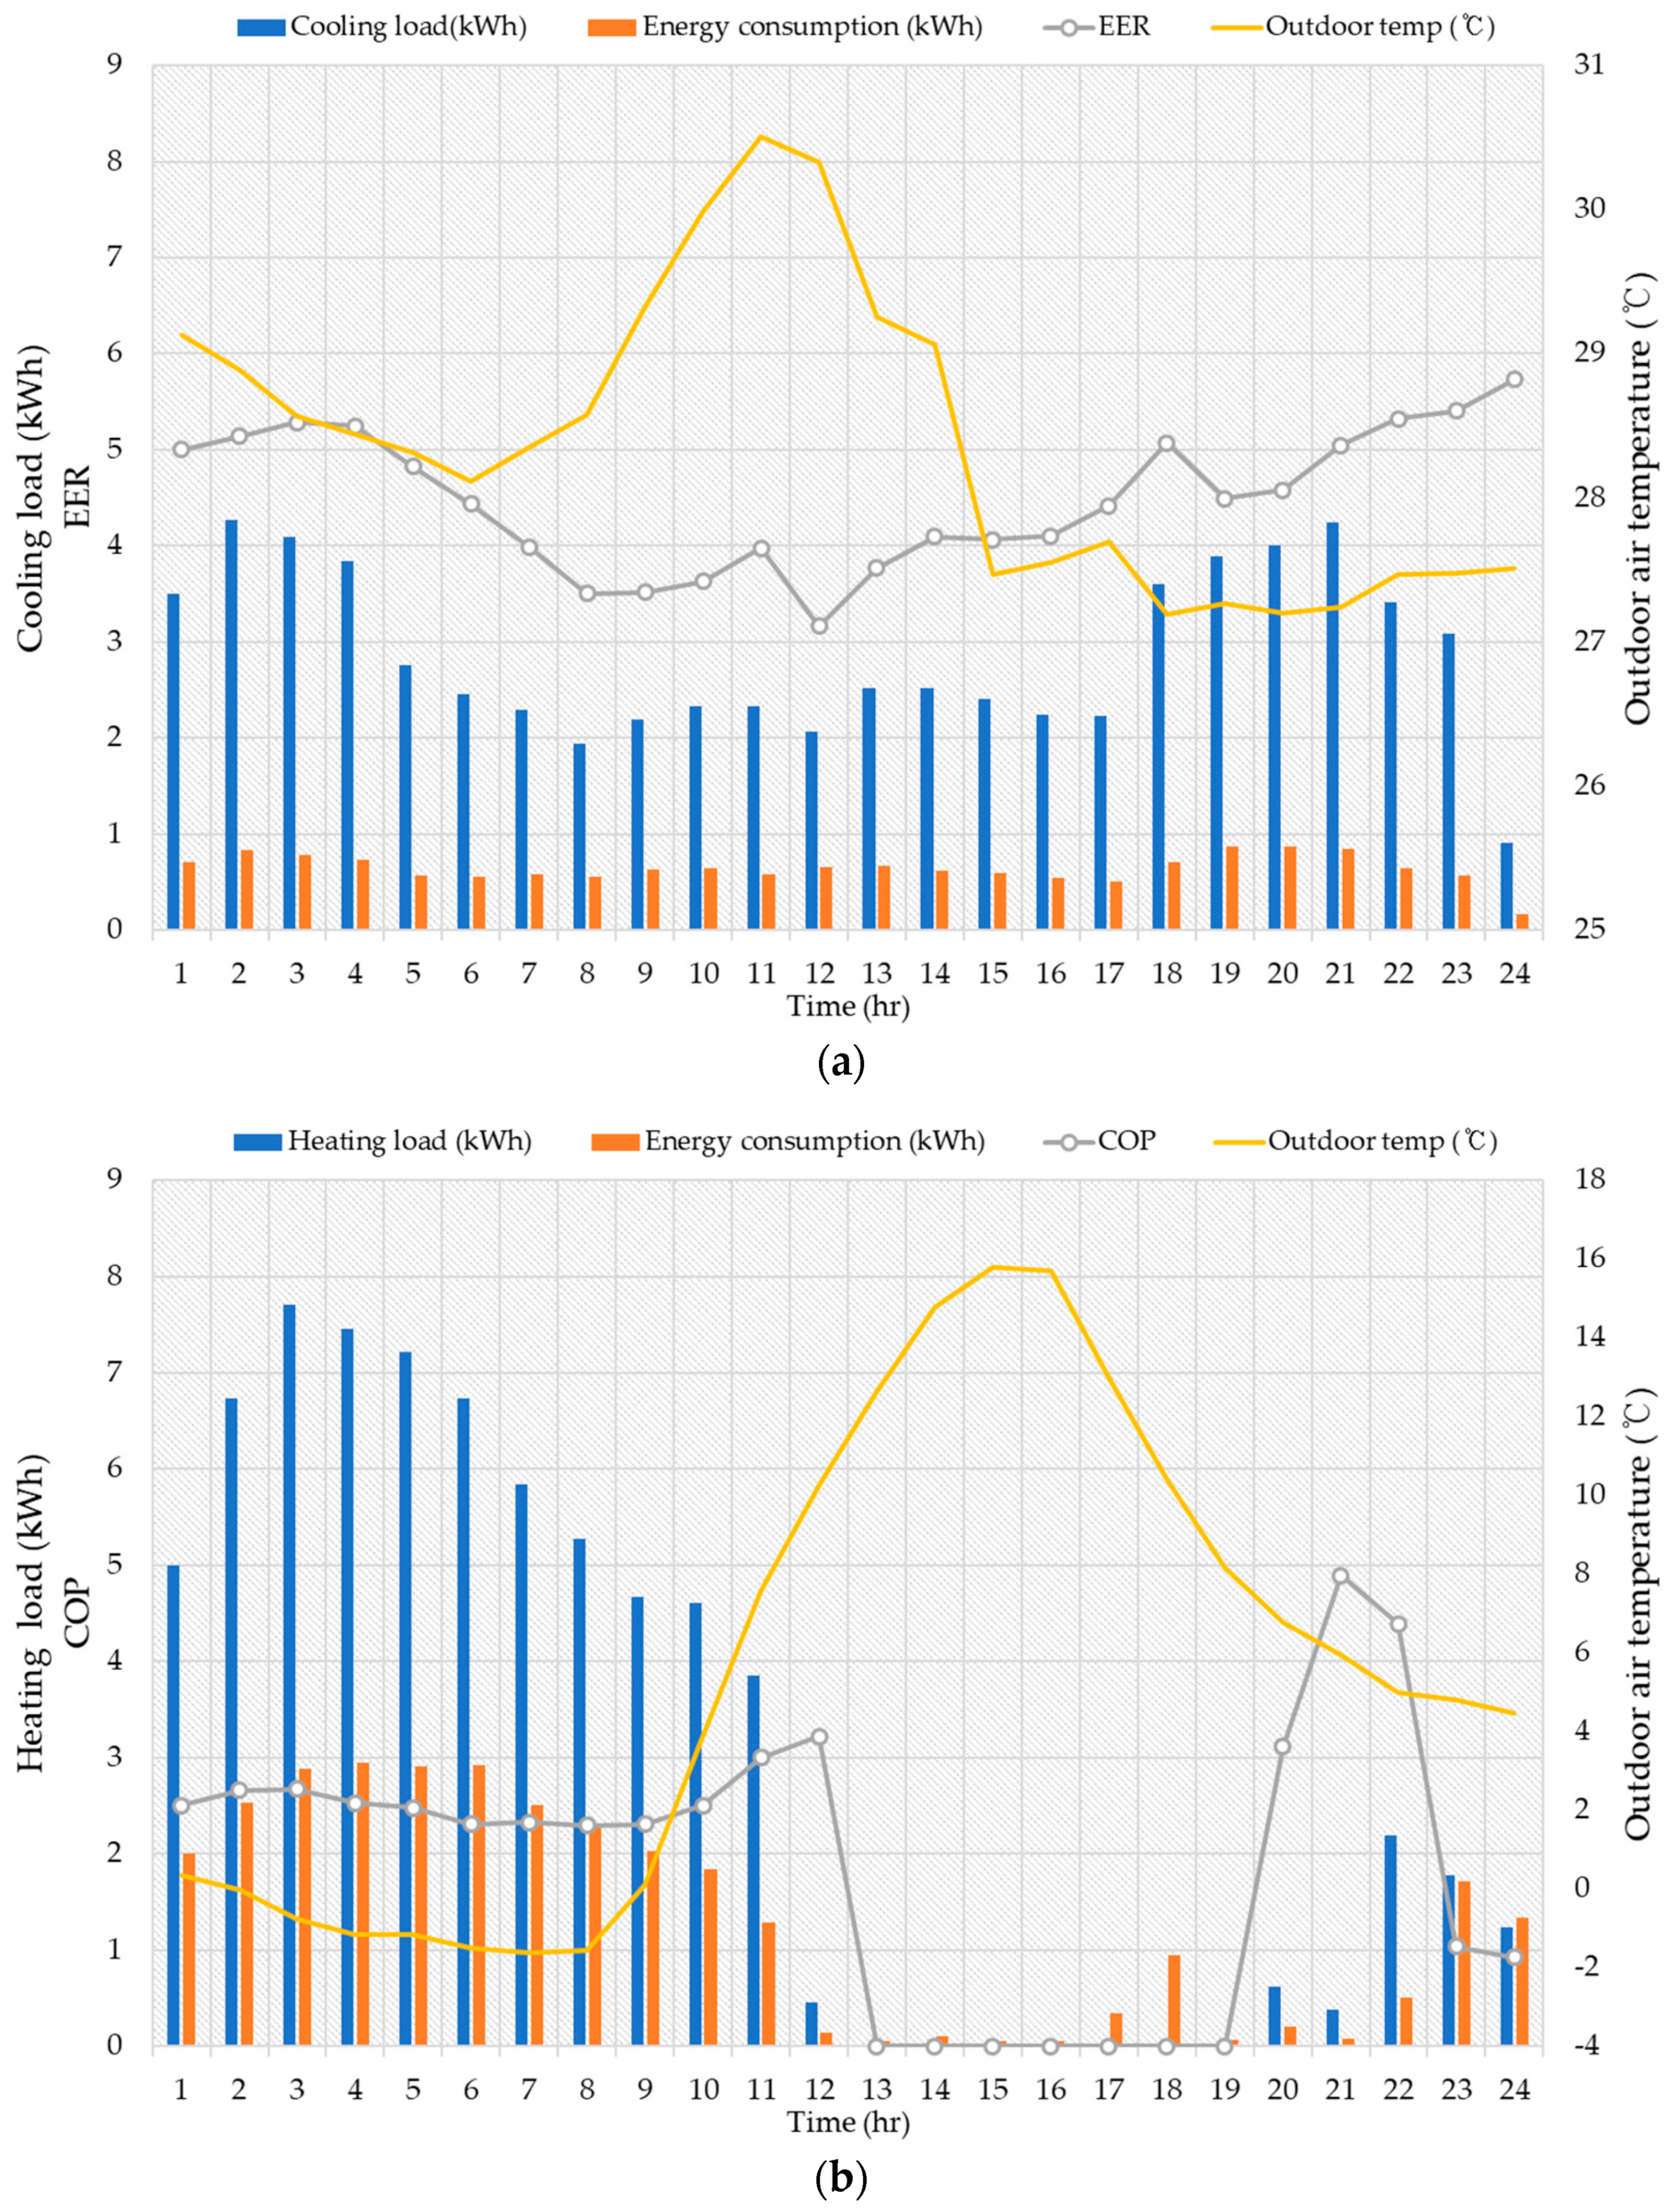
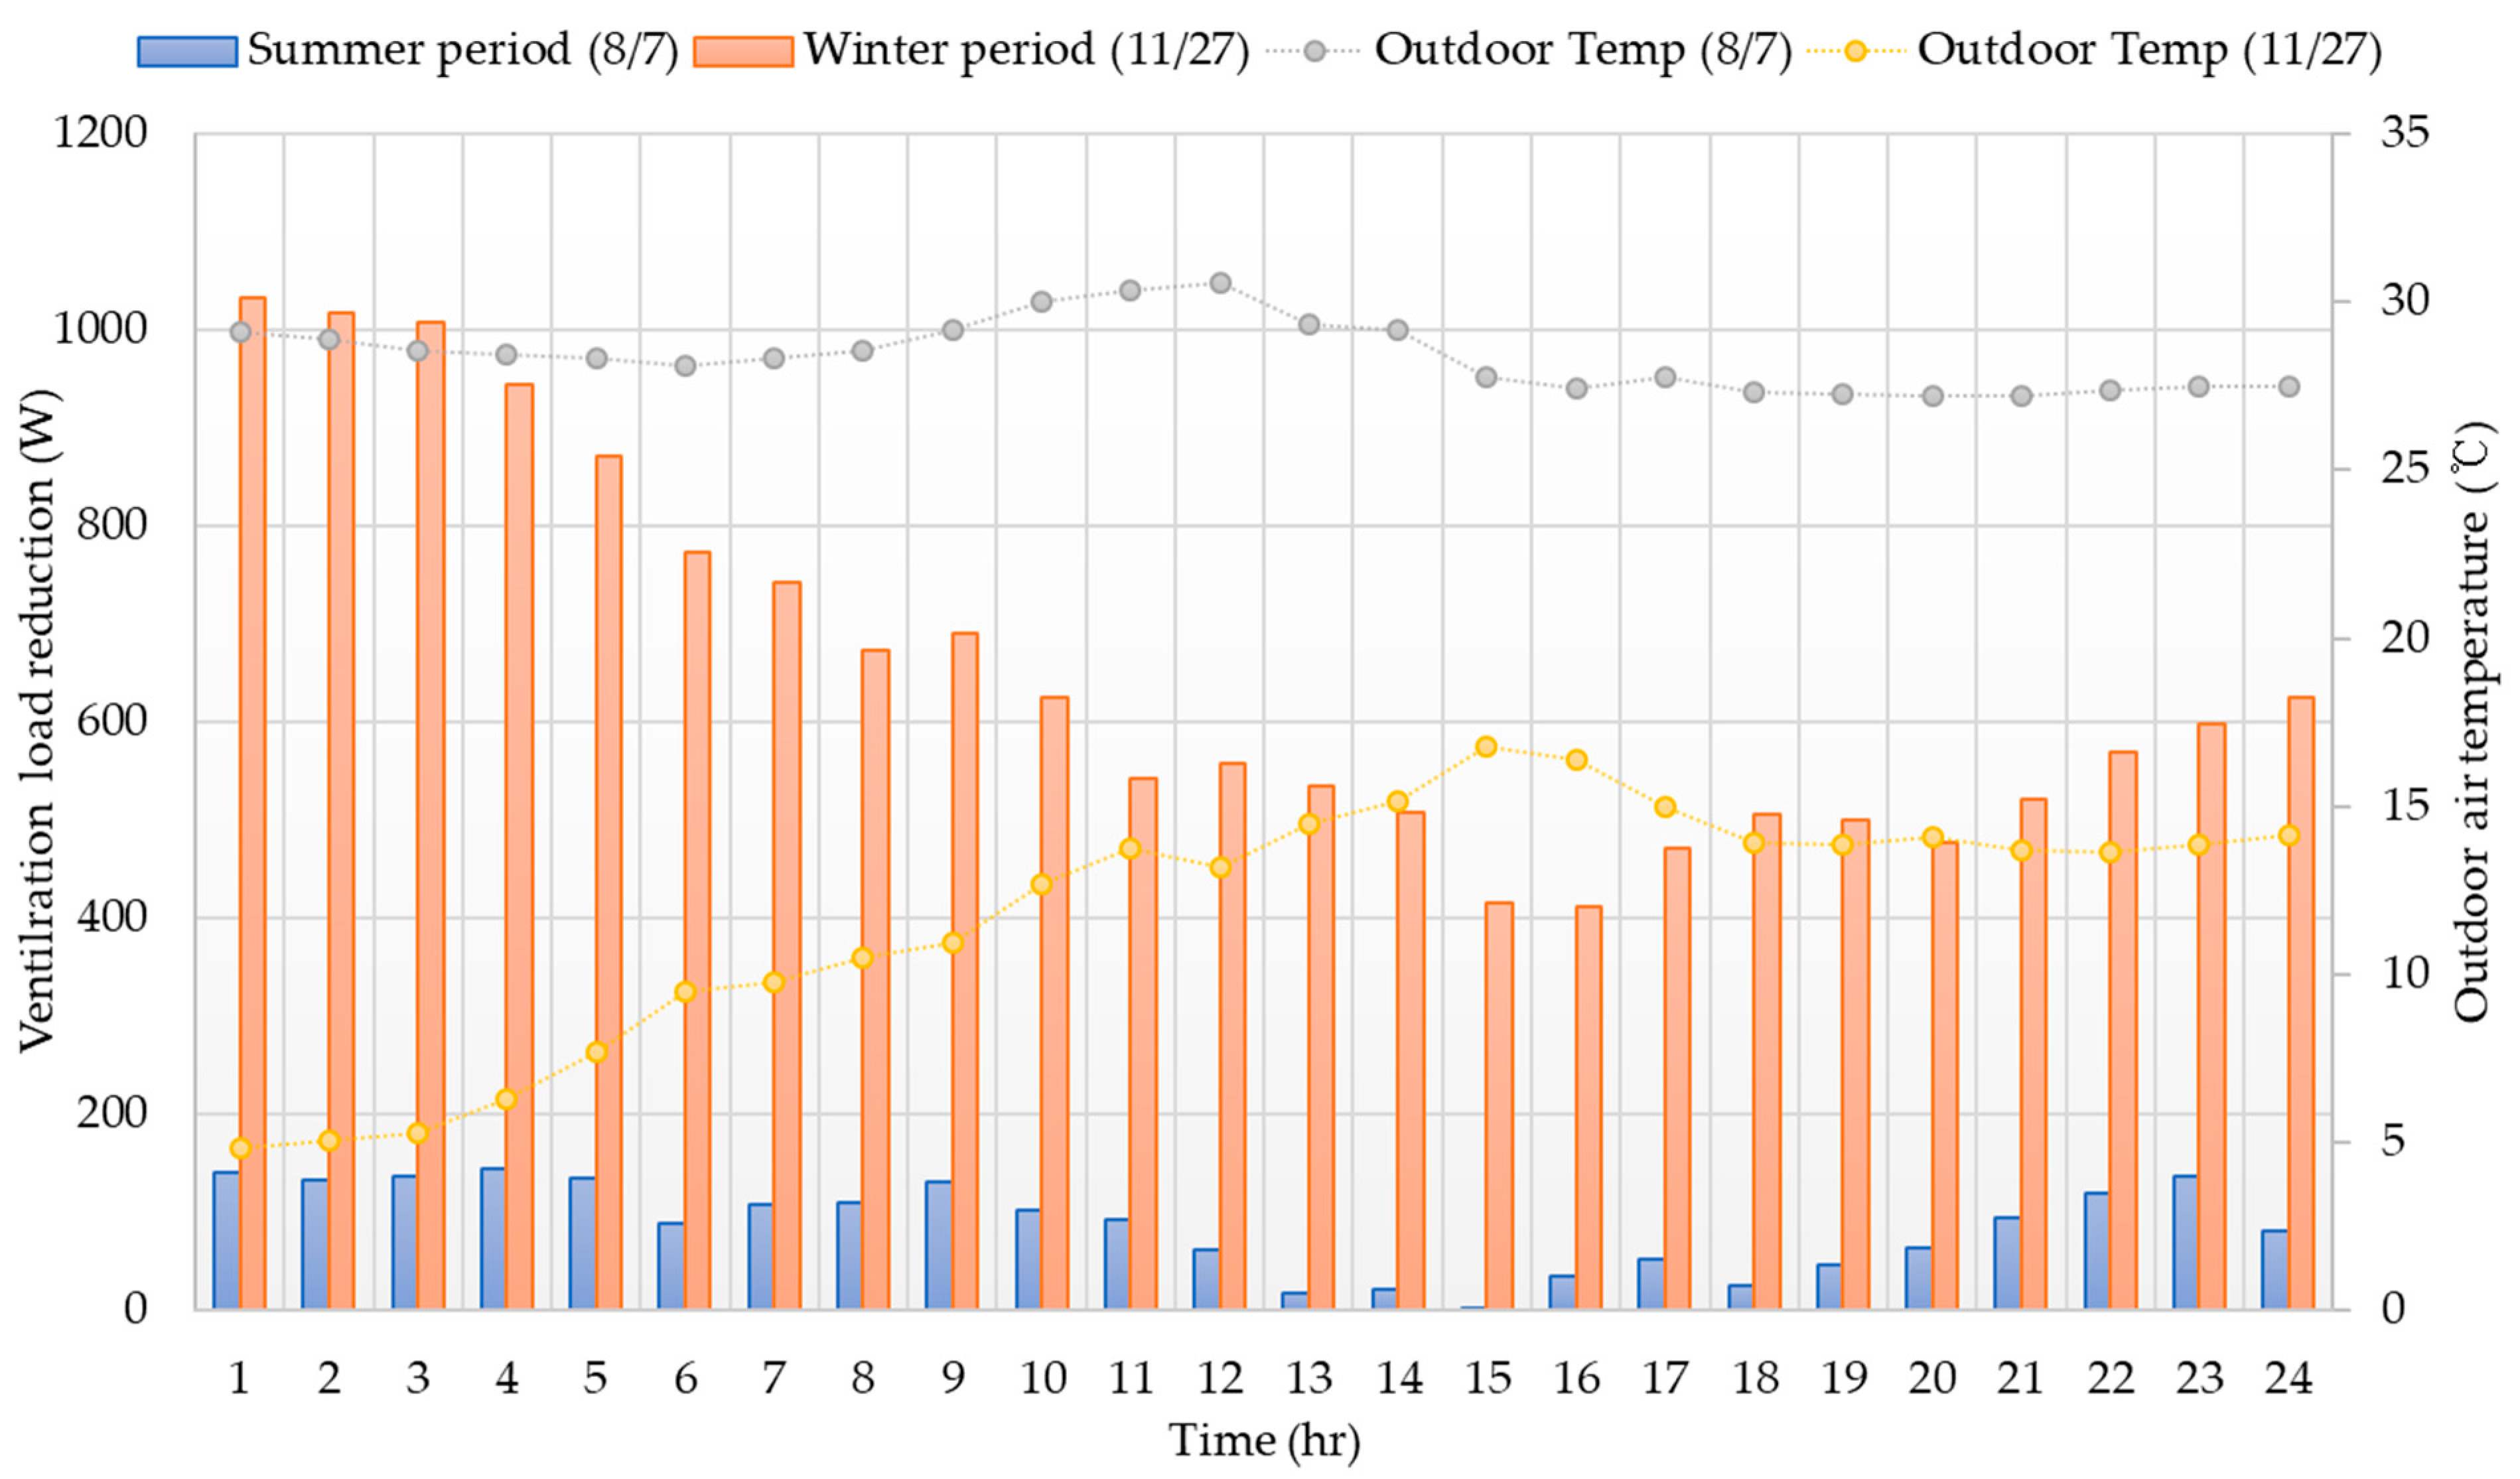
3.1.1. System Performance Analysis

To accurately understand the system’s operational characteristics and assess the suitability of its PV generation capacity, the days with the highest energy consumption during the entire measurement period are selected as representative days. Specifically, 8 July and 27 November are chosen as representative days for the summer and winter seasons, respectively. During the entire cooling operation of the AWHP system, the average energy consumption per hour was 0.64 kWh, and the EER was 4.49. However, there is a tendency for the cooling EER to decrease during the transition period when the system switches to hot water operation at around 7 A.M. and 7 P.M. The hourly load and energy consumption of the AWHP system are shown in Figure 4. During the heating operation of the AWHP system from 12 P.M. to 7 P.M., there is almost no heating load due to the absence of occupants. The average energy consumption per hour during the heating operation is 2.25 kWh, and the COP is 2.27. The heating COP and cooling EER of the systems proposed in previous studies range from 1.2 to 5.3 and 3.31 to 16, respectively, and the performance of the AWHP system used in this study falls within this range. If the ventilation frequency is satisfied once per hour, it is possible to reduce the ventilation load by an average of 87 W in the summer and 650 W in the winter compared to natural ventilation. The ERV efficiency and load reduction are calculated using Equations (5) and (6). The outdoor temperature and hourly load reduction are shown in Figure 5.

3.1.2. PV Generation and Power Flow Analysis

On the representative summer day, the daily PV generation is 15.29 kWh, and the energy consumption is 33.05 kWh. The energy self-sufficiency rate is 46.3%. However, due to the imbalance in energy demand, 12.8% of the renewable energy generation, which is 1.96 kWh, is sold to the external grid, and 80.7% of the energy consumption, which is 26.68 kWh, is purchased from the external grid. On the representative winter day, the daily PV generation is 9.74 kWh, and the energy consumption is 48.74 kWh. The renewable energy production ratio is 19.97% compared to the energy consumption, and due to the imbalance in energy demand, 33.25% of the renewable energy generated, which is 3.24 kWh, is sold to the external grid, and 98.18% of the energy consumed, which is 47.86 kWh, is purchased from the external grid. The hourly power flow on the representative days is shown in Figure 6.

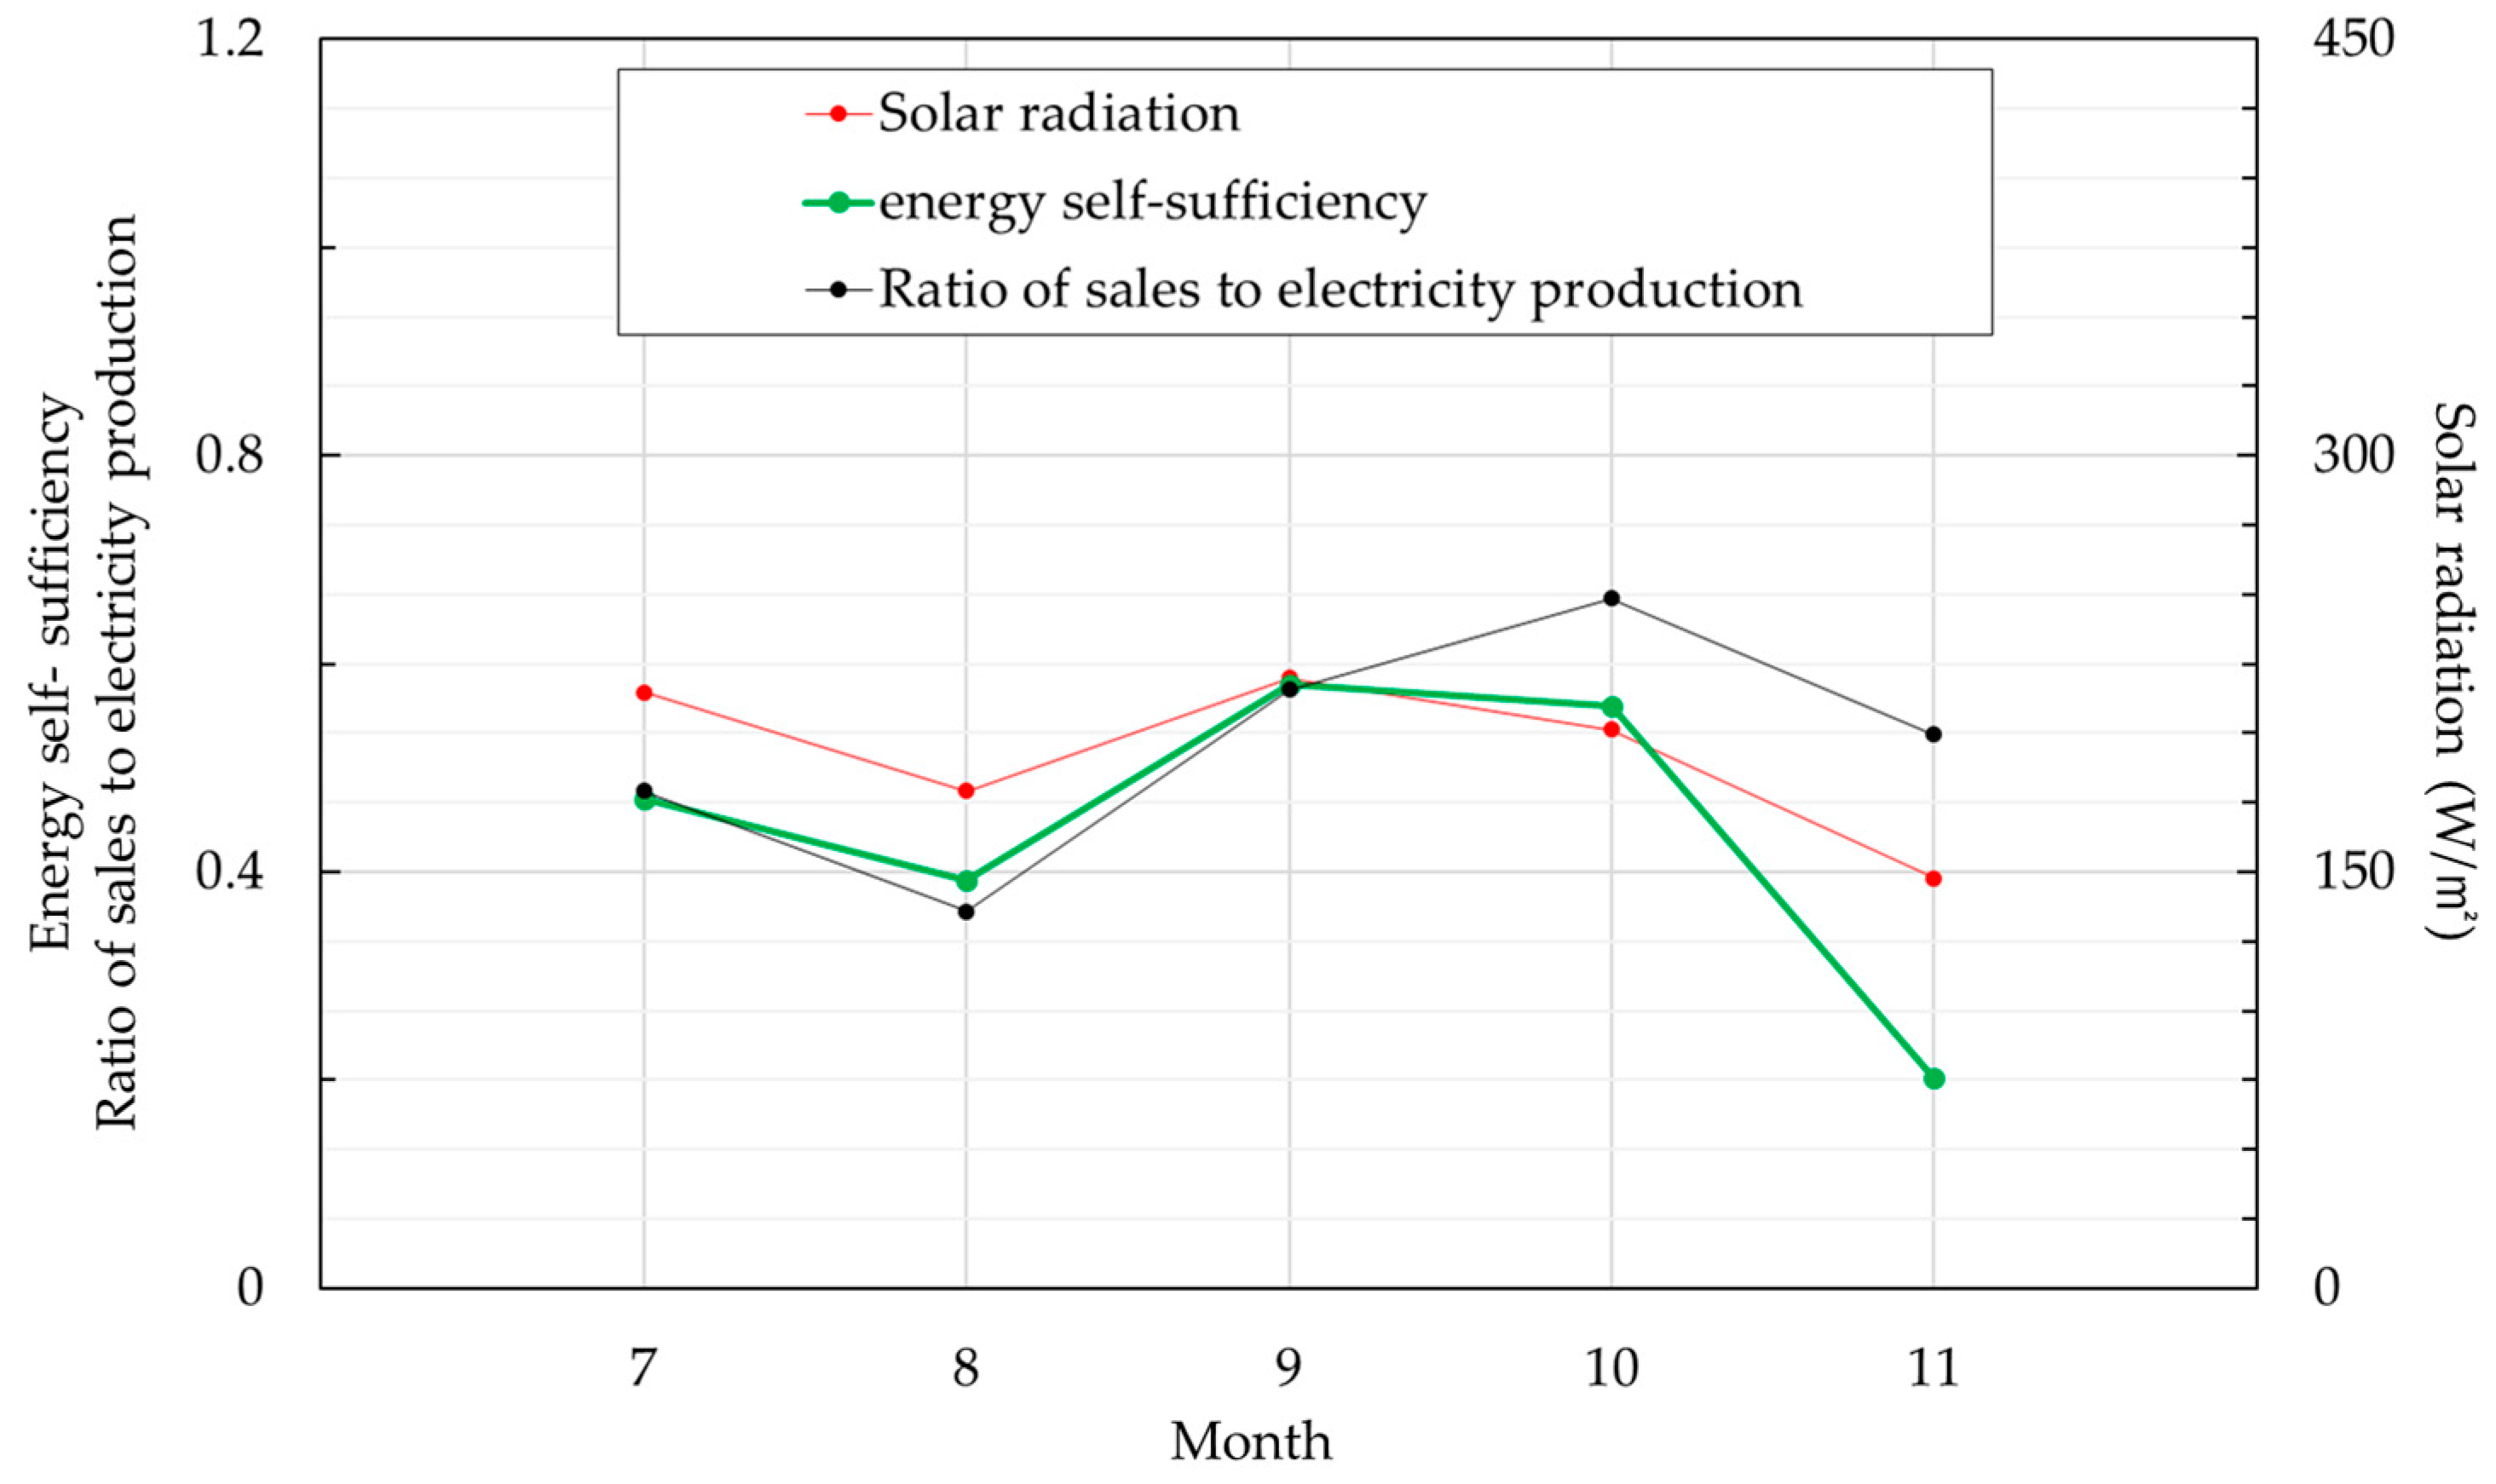
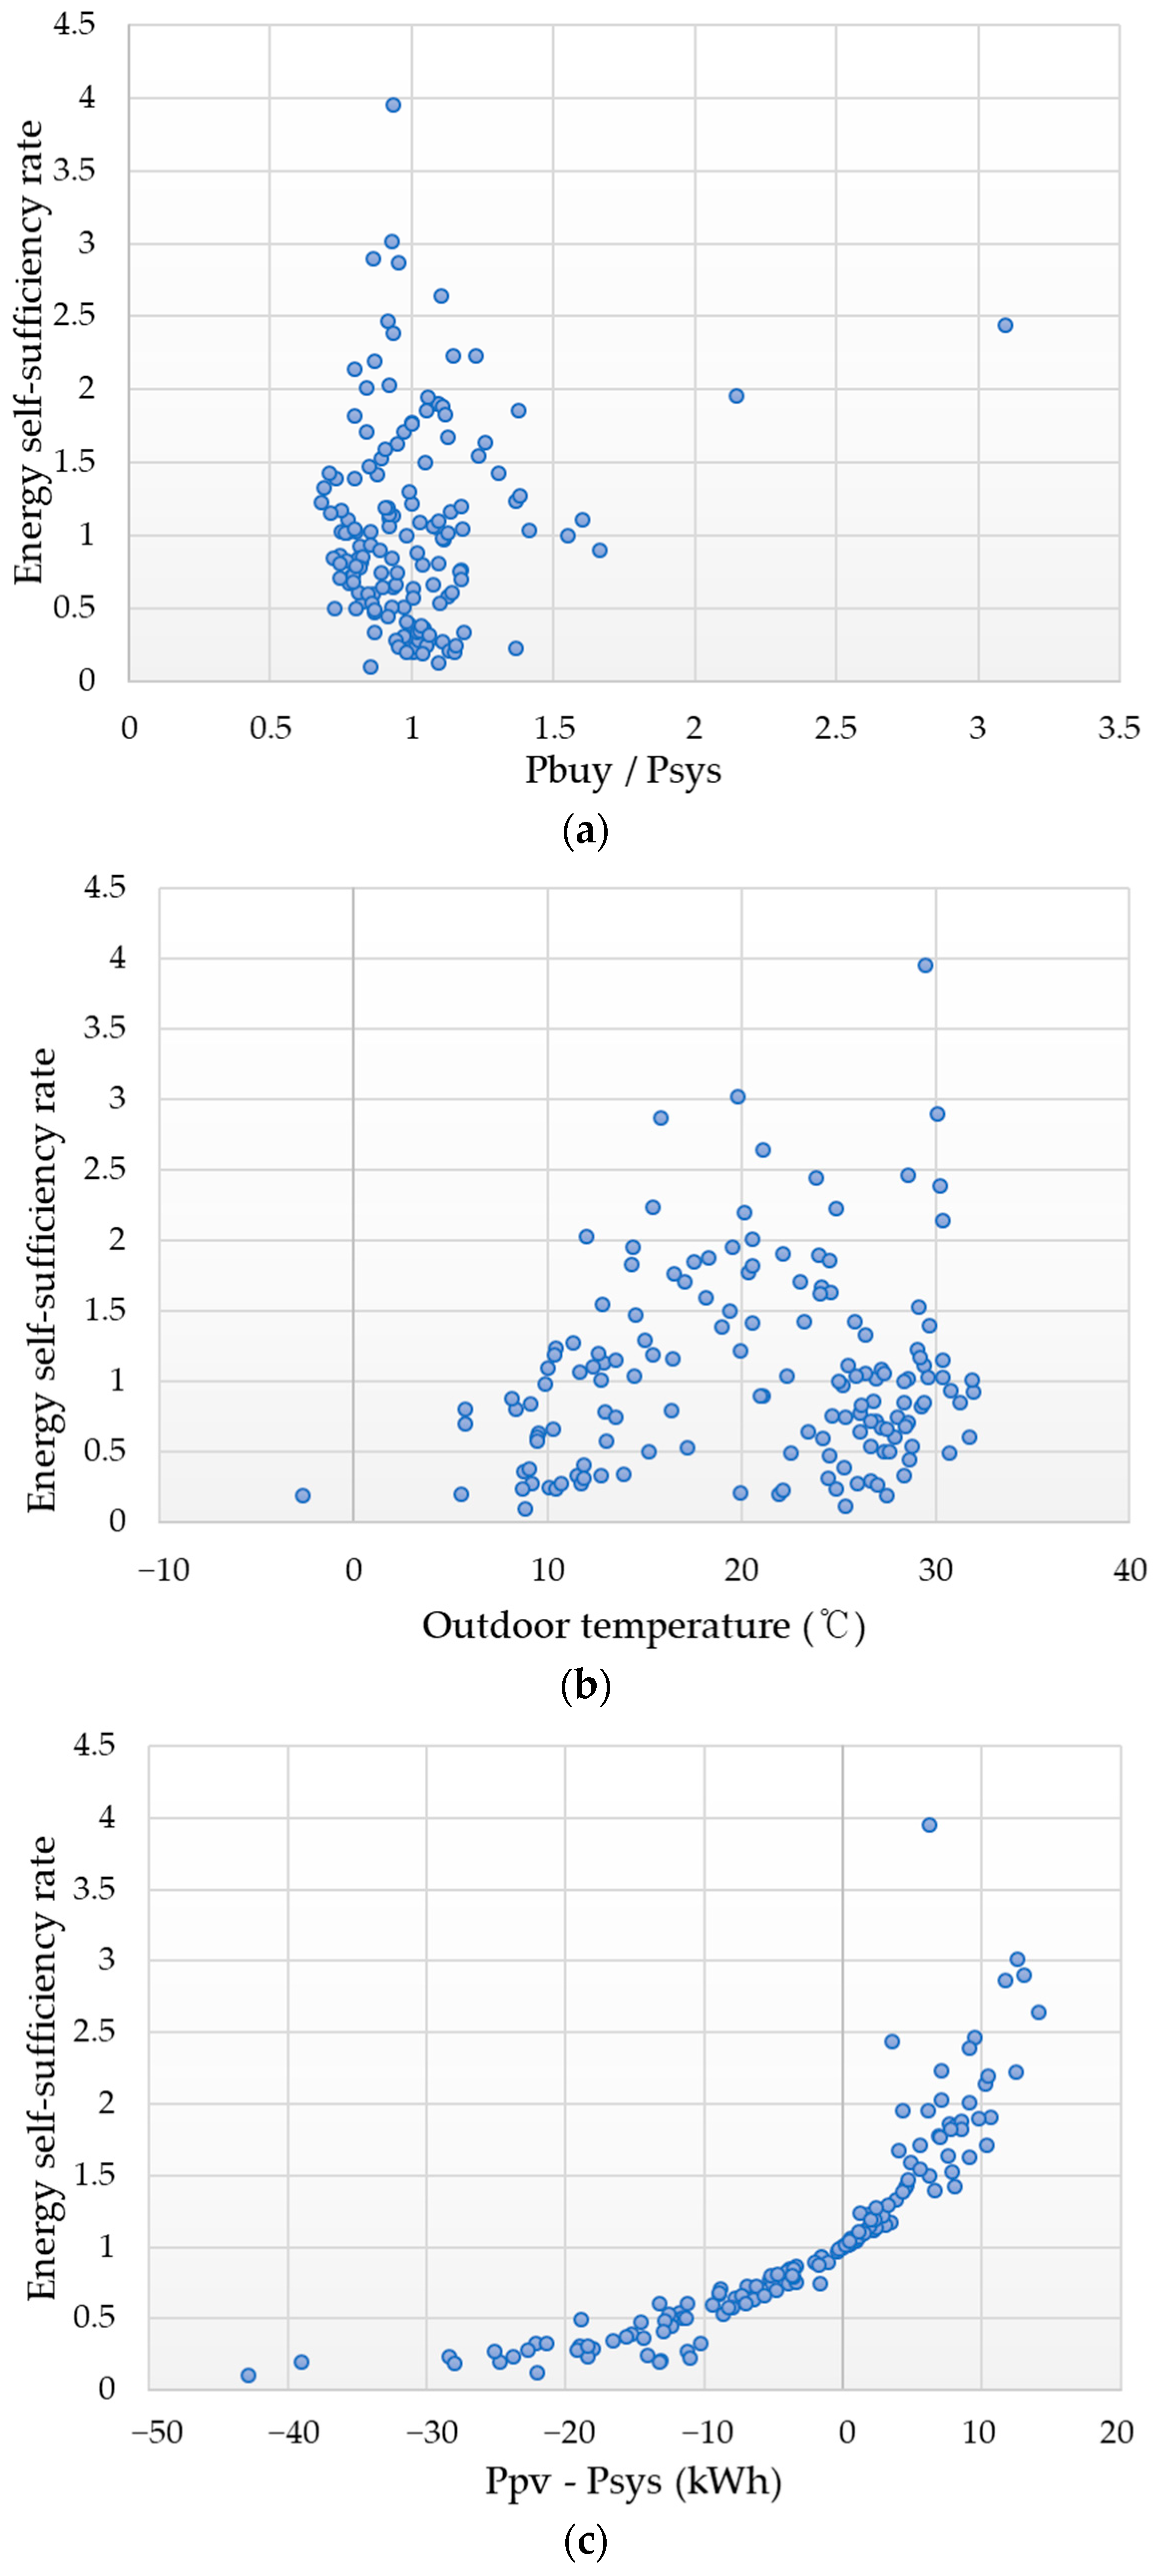
3.2. Building Energy Independence Analysis

The daily average value of the energy self-sufficiency rate, determined by Equation (7), varied throughout the period from July to November: 47% in July, 39.2% in August, 57.95% in September, 55.94% in October, and 20.27% in November. Notably, the presence of solar power generation significantly elevated the energy self-sufficiency rate, particularly during the mid-term, summer, and winter periods. The average solar radiation levels—214.75, 179.27, 219.83, 201.28, and 147.87 W/m2—were identified as a primary contributing factor to this self-sufficiency. Concurrently, our analysis of the average energy sold to the external grid revealed percentages of 47.78, 36.22, 57.47, 55.94, and 53.22%, underscoring the impact of energy demand imbalances on the energy independence rate. These relationships between the average solar radiation, renewable energy sales ratio, and energy independence rate are visually represented in Figure 7 below.
The distribution of the energy self-sufficiency rates by outdoor temperature is shown in Figure 8a. In this study, since there were no batteries, the excess power generated from the PV was not stored and was sold to the grid. Although revenue can be expected from selling electricity, the energy self-sufficiency is reduced because electricity needs to be purchased and used during non-generating hours. As shown in Figure 8b, even when the energy self-sufficiency rate is close to 100%, a significant portion of the load required for the HVAC system needs to be purchased from the grid, highlighting the need for ESS installation to improve the building’s energy self-sufficiency. Figure 8c shows the difference between daily PV generation and energy consumption, and it was observed that in the winter, the PV energy generated was not enough to be stored. The daily power production, purchase and sales volume, and energy consumption during the measurement period are shown in Figure 9.

3.3. Energy Independence Analysis by PV–ESS Capacity

Through a building energy simulation, the annual load demand of a building with the same insulation performance, floor area, and AWHP capacity as the building taken as our subject was calculated. The power consumption required for heating and cooling loads was calculated based on the AWHP performance coefficient, and the energy self-sufficiency rate was analyzed for different PV–ESS capacities, as shown in Table 4. When the PV capacity is 4 kW and the ESS capacity is 2, 4, and 8 kWh, the building’s energy self-sufficiency rates are 55.84%, 67.43%, and 86.98%, respectively. As the PV and ESS capacities increase, the energy self-sufficiency rate naturally increases. However, it was observed that the rate of increase significantly decreases as the capacity increases excessively. Therefore, it is necessary to compare energy self-sufficiency and economic feasibility to select an appropriate capacity.

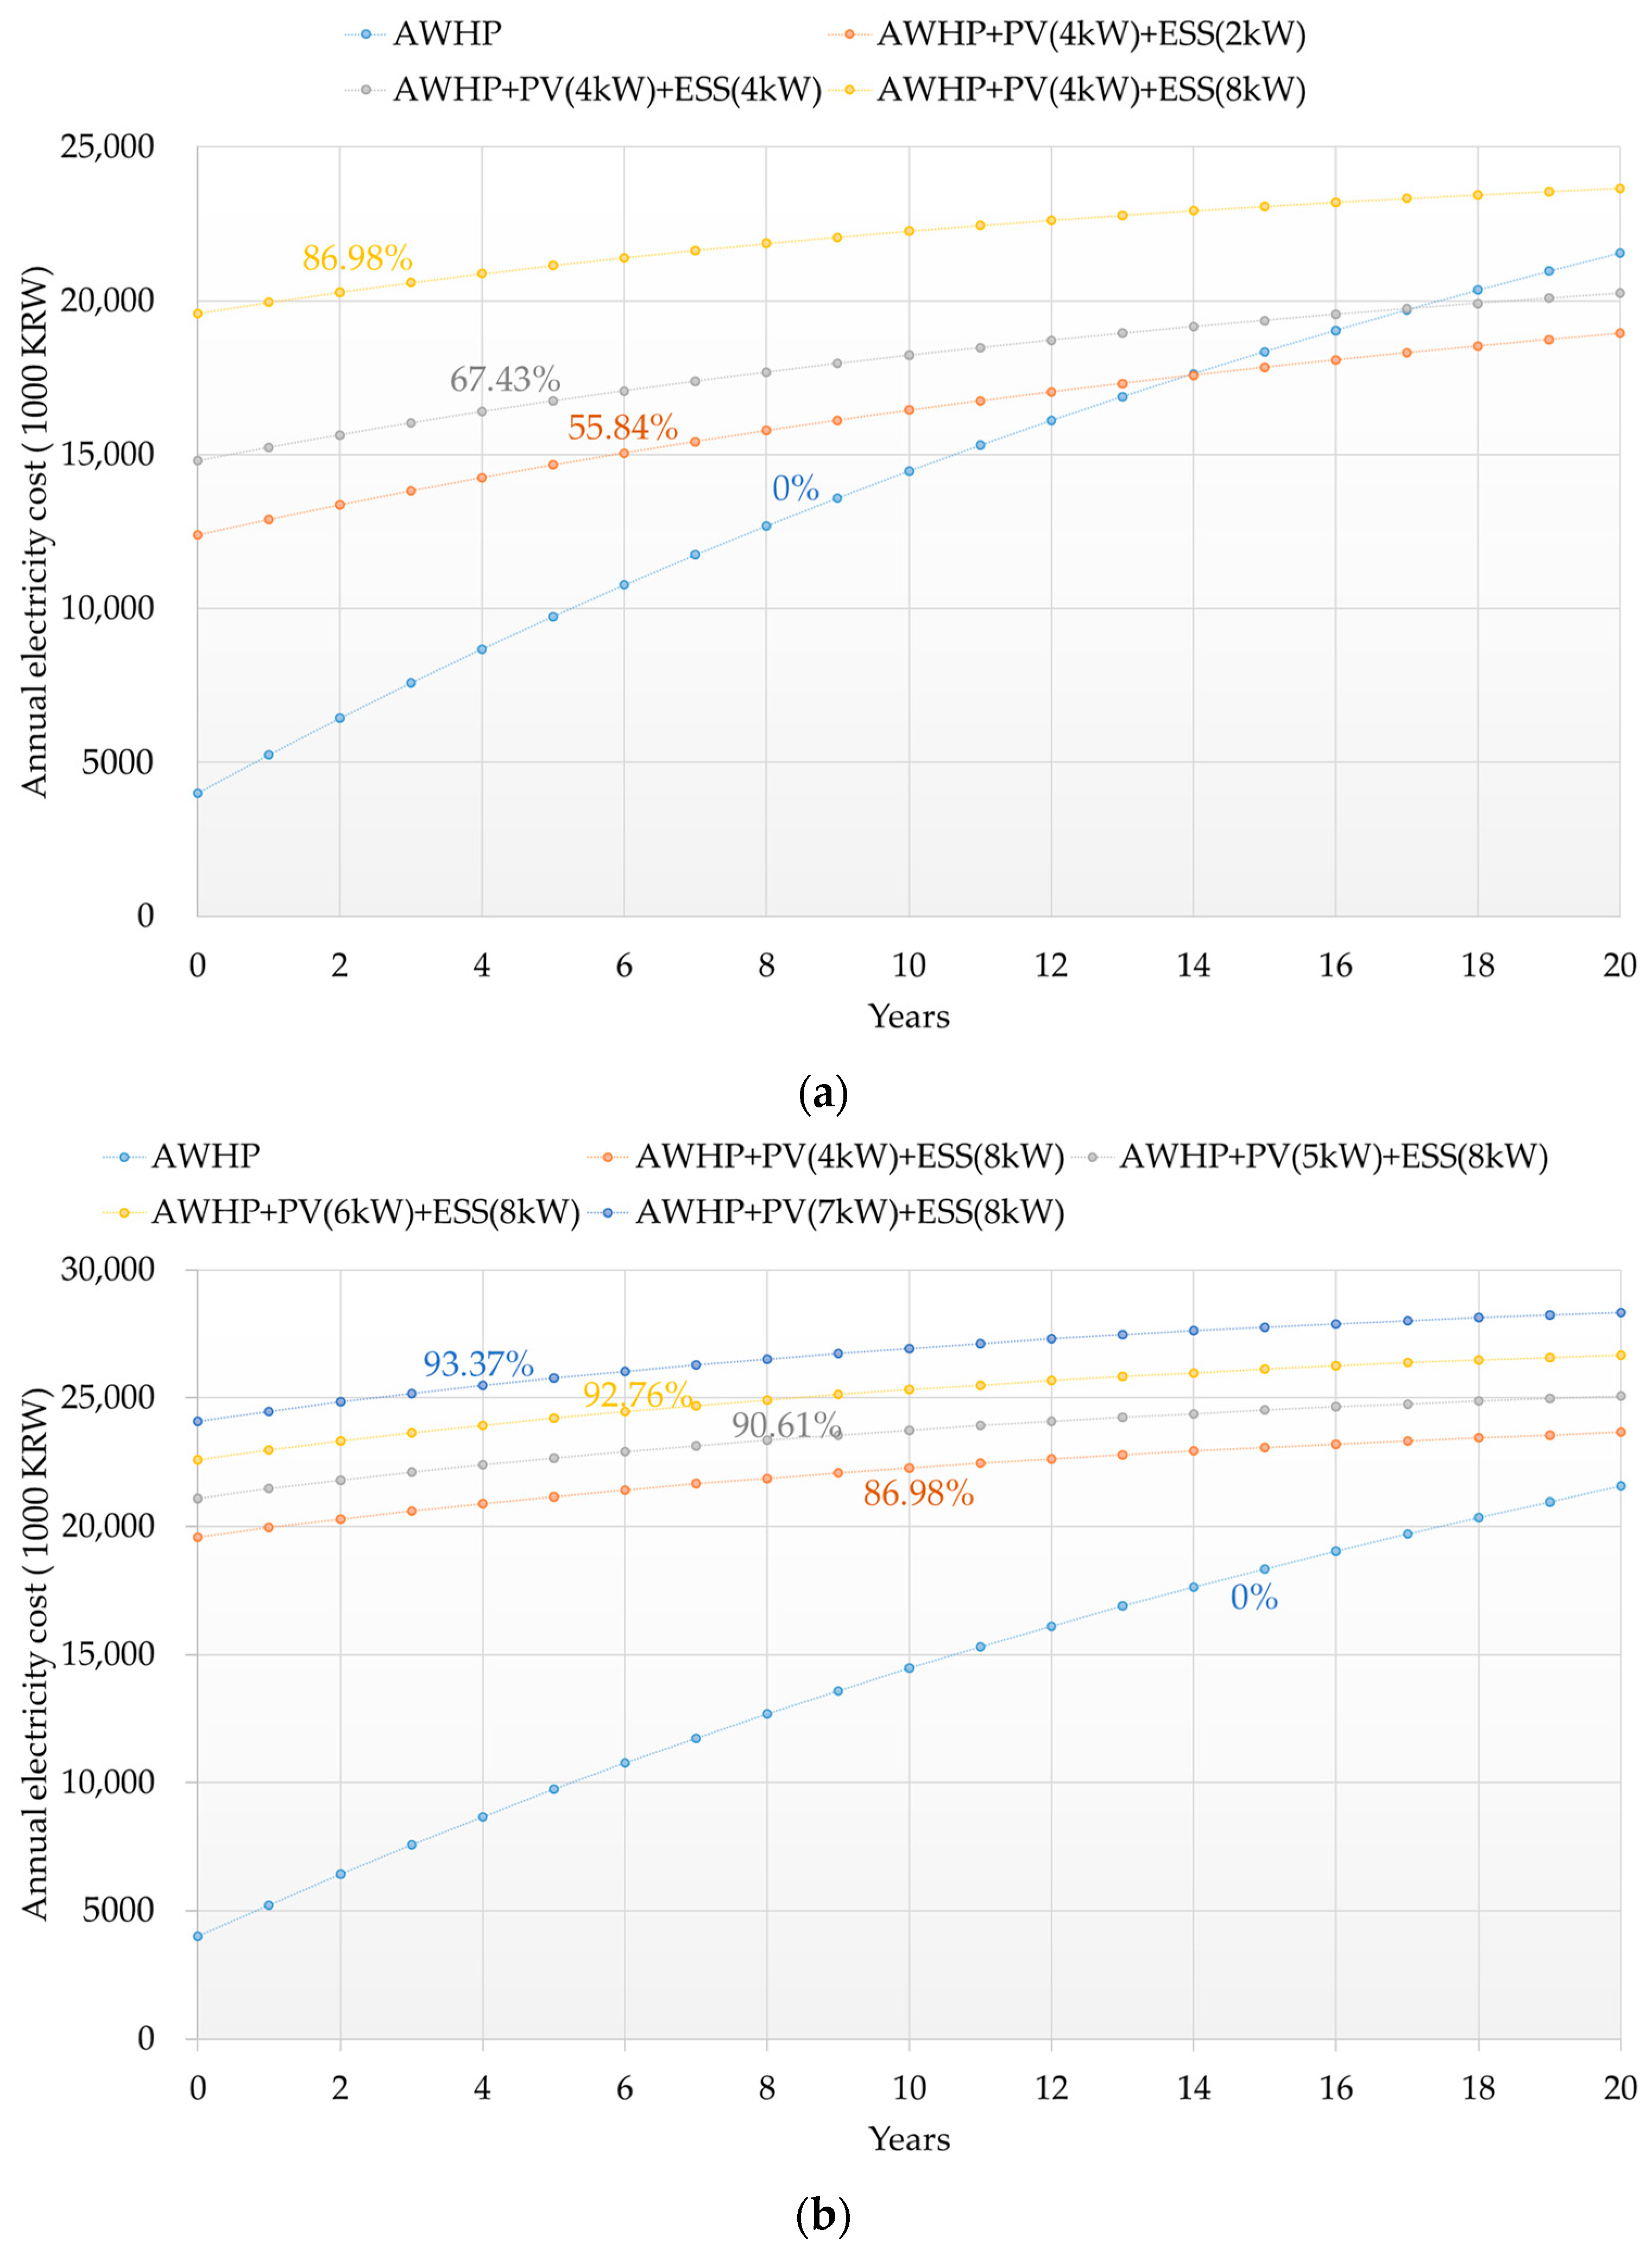
3.4. Economic Analysis of PV–ESS System

Through Equations (8)–(10), the initial investment cost and annual operating cost were compared and analyzed for scenarios in which the energy production limit cost for the AWHP system alone is used and that of the PV–ESS system with different capacities is used. Compared to using the AWHP system alone without a PV–ESS system, the period required to make a profit is 14 years for a 4 kW–2 kWh PV–ESS capacity, 16.5 years for a 4 kW–4 kWh PV–ESS capacity, and 20 years for a 4 kW–8 kWh PV–ESS capacity. However, since an energy self-sufficiency of 87% is possible, it may be a better choice than using the AWHP system alone when considering carbon emissions reductions. Focusing on an energy self-sufficiency of over 90% and an 8 kWh battery capacity, an economic analysis was performed for PV capacities of 4, 5, 6, and 7 kW. The results showed that the difference in energy cost reductions was negligible in each case due to the large initial investment cost. Figure 10a shows the annual operating cost of 4 kW PV–2, 4, and 8 kWh ESS, and Figure 10b shows the annual operating cost of 4, 5, 6, and 7 kW PV–8 kWh ESS.

4. Conclusions

This study investigated the potential of a building-integrated air-to-water heat pump system coupled with photovoltaics to achieve energy independence. We analyzed the energy independence rate and economic feasibility based on different PV–ESS capacities. The integrated PV–AWHP system shared indoor electrical loads with the building’s energy recovery ventilator. The AWHP system achieved an average cooling EER of 4.49 and a heating COP of 2.27. The energy independence rate varied significantly during the measurement period, ranging from 20.27% in November to 57.95% in September. This finding underscores the critical role of energy storage systems in enhancing self-sufficiency by storing surplus PV power for later use. With a 4 kW PV capacity, an energy independence of 67.43% was achieved with a 4 kWh battery and 86.96% with an 8 kWh battery. However, it is crucial to note that while increasing PV and ESS capacities might lead to a higher self-sufficiency, a cost/benefit analysis remains essential to determine the optimal capacity for both energy and economic efficiency. Compared to using AWHP alone, the payback period when combined with PV–ESS takes 14 years for a 4 kW–4 kWh system and over 20 years for a 4 kW–8 kWh system. Implementing an ESS remains an attractive option despite the longer payback period compared to that of a standalone AWHP system, considering its potential for carbon emissions reductions. Future research could explore optimizing the sizing of PV and ESS systems for a balance between energy self-sufficiency and economic feasibility. Additionally, integrating smart energy management systems could further optimize their energy use and improve their cost-effectiveness.

Author Contributions

Conceptualization, S.-K.Y. and Y.-H.K.; Data curation, S.-K.Y. and Y.-H.K.; Validation, S.-K.Y. and Y.-C.A.; Formal analysis, S.-K.Y. and Y.-H.K.; investigation, S.-K.Y. and Y.-H.K. Resources, S.-K.Y. and Y.-C.A.; writing—original draft preparation, S.-K.Y. and Y.-H.K.; writing—review and editing, S.-K.Y. and Y.-C.A. All authors have read and agreed to the published version of the manuscript.

Funding

This research was supported by the Basic Science Research Program through the National Research Foundation of Korea (NRF), funded by the Ministry of Education (2021R1I1A3048346).

Data Availability Statement

Data are available upon request due to privacy or ethical restrictions.

Conflicts of Interest

The authors declare no conflicts of interest.

References

  1. European Parliament. Smarter and More Energy-Efficient Buildings in the EU by 2050. Available online: https://www.europarl.europa.eu (accessed on 26 February 2024).
  2. European Commission. Horizon Europe Work Programme 2023–2024 Climate, Energy and Mobility; European Commission: Brussels, Belgium, 2023.
  3. Korol, E.; Shushunova, N. Analysis and Valuation of the Energy-Efficient Residential Building with Innovative Modular Green Wall Systems. Sustainability 2022, 14, 6891. [Google Scholar] [CrossRef]
  4. IEA. Tracking Buildings 2020; IEA: Paris, France, 2020. [Google Scholar]
  5. IEA. Energy Efficiency. The First Fuel of a Sustainable Global Energy System. 2022. Available online: https://www.iea.org/topics/energy-efficiency (accessed on 26 February 2024).
  6. Zheng, Y.; Miao, J.; Yu, H.; Liu, F.; Cai, Q. Thermal Analysis of Air-Cooled Channels of Different Sizes in Naturally Ventilated Photovoltaic Wall Panels. Buildings 2023, 13, 3002. [Google Scholar] [CrossRef]
  7. Ma, T.; Kazemian, A.; Habibollahzade, A.; Salari, A.; Gu, W.; Peng, J. A comparative study on bifacial photovoltaic/thermal modules with various cooling methods. Energy Convers. Manag. 2022, 263, 115555. [Google Scholar] [CrossRef]
  8. Prakash, K.B.; Almeshaal, M.; Pasupathi, M.K.; Chinnasamy, S.; Saravanakumar, S. Hybrid PV/T Heat Pump System with PCM for Combined Heating, Cooling and Power Provision in Buildings. Buildings 2023, 13, 1133. [Google Scholar] [CrossRef]
  9. Li, H.; Sun, Y. Operational Performance Study on a Photovoltaic Loop Heat Pipe/Solar Assisted Heat Pump Water Heating System. Energy Build. 2018, 158, 861–872. [Google Scholar] [CrossRef]
  10. James, A.; Srinivas, M.; Mohanraj, M.; Raj, A.K.; Jayaraj, S. Experimental Studies on Photovoltaic-Thermal Heat Pump Water Heaters Using Variable Frequency Drive Compressors. Sustain. Energy Technol. Assess. 2021, 45, 101152. [Google Scholar] [CrossRef]
  11. United Nations Climate Change. Net Zero by 2050: A Roadmap for the Global Energy Sector—A Special Report by the International Energy Agency; United Nations Climate Change: New York, NY, USA, 2021. [Google Scholar]
  12. Schreurs, T.; Madani, H.; Zottl, A.; Sommerfeldt, N.; Zucker, G. Techno-economic analysis of combined heat pump and solar PV system for multi-family houses: An Austrian case study. Energy Strategy Rev. 2021, 36, 100666. [Google Scholar] [CrossRef]
  13. Allouhi, A. Techno-economic and environmental accounting analyses of an innovative power-to-heat concept based on solar PV systems and a geothermal heat pump. Renew. Energy 2022, 191, 649–661. [Google Scholar] [CrossRef]
  14. Martorana, F.; Bonomolo, M.; Leone, G.; Monteleone, F.; Zizzo, G.; Beccali, M. Solar-assisted heat pumps systems for domestic hot water production in small energy communities. Sol. Energy 2021, 217, 113–133. [Google Scholar] [CrossRef]
  15. Baggio, P.; Bee, E.; Prada, A. Demand-side management of air-source heat pump and photovoltaic systems for heating applications in the italian context. Environments 2018, 5, 132. [Google Scholar]
  16. Bee, E.; Prada, A.; Baggio, P.; Psimopoulos, E. Air-source heat pump and photovoltaic systems for residential heating and cooling: Potential of self-consumption in different European climates. Build. Simul. 2019, 12, 453–463. [Google Scholar] [CrossRef]
  17. Zhou, C.; Liang, R.; Zhang, J.; Riaz, A. Experimental Study on the Cogeneration Performance of Roll-Bond-PVT Heat Pump System with Single Stage Compression during Summer. Appl. Therm. Eng. 2019, 149, 249–261. [Google Scholar] [CrossRef]
  18. Long, T.; Qiao, Z.; Wang, M.; Li, Y.; Lu, J.; Li, W.; Zeng, L.; Huang, S. Performance Analysis and Optimization of a Solar-Air Source Heat Pump Heating System in Tibet, China. Energy Build. 2020, 220, 110084. [Google Scholar] [CrossRef]
  19. Kong, R.; Deethayat, T.; Asanakham, A.; Kiatsiriroat, T. Performance and Economic Evaluation of a Photovoltaic/Thermal (PV/T)-Cascade Heat Pump for Combined Cooling, Heat and Power in Tropical Climate Area. J. Energy Storage 2020, 30, 101507. [Google Scholar] [CrossRef]
  20. Bae, S.; Chae, S.; Nam, Y. Performance Analysis of Integrated Photovoltaic-Thermal and Air Source Heat Pump System through Energy Simulation. Energies 2022, 15, 528. [Google Scholar] [CrossRef]
  21. Bae, S.; Chae, H.; Nam, Y. Experimental analysis of an integrated system using photovoltaic–thermal and air source heat pump for real applications. Renew. Energy 2023, 217, 119128. [Google Scholar] [CrossRef]
  22. Dermentzis, G.; Ochs, F.; Franzoi, N. Four years monitoring of heat pump, solar thermal and PV system in two net-zero energy multi-family buildings. J. Build. Eng. 2021, 43, 103199. [Google Scholar] [CrossRef]
  23. Shono, K.; Yamaguchi, Y.; Perwez, U.; Ma, T.; Dai, Y.; Shimoda, Y. Large-scale building-integrated photovoltaics installation on building façades: Hourly resolution analysis using commercial building stock in Tokyo, Japan. Sol. Energy 2023, 253, 137–153. [Google Scholar] [CrossRef]
  24. Perwez, U.; Shono, K.; Yamaguchi, Y.; Shimoda, Y. Multi-scale UBEM-BIPV coupled approach for the assessment of carbon neutrality of commercial building stock. Energy Build. 2023, 291, 113086. [Google Scholar] [CrossRef]
  25. Sigounis, A.; Vallianos, C.; Athienitis, A. Model predictive control of air-based building integrated PV/T systems for optimal HVAC integration. Renew. Energy 2023, 212, 655–668. [Google Scholar] [CrossRef]
  26. Aneli, S.; Arena, R.; Tina, G.M.; Gagliano, A. Improvement of energy self-sufficiency in residential buildings by using solar-assisted heat pumps and thermal and electrical storage. Sustain. Energy Technol. Assess. 2023, 60, 103446. [Google Scholar]
  27. Perrella, S.; Bisegna, F.; Bevilacqua, P.; Cirone, D.; Bruno, R. Solar-Assisted Heat Pump with Electric and Thermal Storage: The Role of Appropriate Control Strategies for the Exploitation of the Solar Source. Buildings 2024, 14, 296. [Google Scholar] [CrossRef]
  28. Nicoletti, F.; Cucumo, M.A.; Arcuri, N. Cost optimal sizing of photovoltaic-battery system and air–water heat pump in the Medi-terranean area. Energy Convers. Manag. 2022, 270, 116274. [Google Scholar] [CrossRef]
  29. Liu, X.; Zhang, P.; Pimm, A.; Feng, D.; Zheng, M. Optimal design and operation of PV-battery systems considering the interdependency of heat pumps. J. Energy Storage 2019, 23, 526–536. [Google Scholar] [CrossRef]
  30. Yang, C.; Fu, Y.; He, L.; Jiang, Q.; Cui, Y. Real options analysis for regional investment decisions of household PV-ESS in China. Energy 2024, 293, 130725. [Google Scholar] [CrossRef]
  31. ANSI/ASHRAE Standard 90.2—2007; Energy Efficient Design for Low-Rise Residential Buildings. ASHRAE: Atlanta, GA, USA, 2007.
  32. ISO 5222-1:2023; Heat Recovery Ventilators and Energy Recovery Ventilators: Testing and Calculating Methods for Seasonal Performance Factor. ISO: Geneva, Switzerland, 2023.
Figure 1. Average monthly outdoor temperature and global solar radiation.
Buildings 14 00882 g001
Figure 2. Drawing of the building layout and integrated energy system classification.
Buildings 14 00882 g002
Figure 3. Energy flow diagram of integrated energy system.
Buildings 14 00882 g003
Figure 4. Cooling and heating performance of AWHP: (a) summer period; (b) winter period.
Buildings 14 00882 g004
Figure 5. Energy savings using energy recovery ventilator.
Buildings 14 00882 g005
Figure 6. Electrical energy flow; (a) summer (7 August) (b) winter (27 November).
Buildings 14 00882 g006
Figure 7. Relationship between solar radiation, electricity sales, and energy self-sufficiency.
Buildings 14 00882 g007
Figure 8. Renewable energy rate distribution. (a) Energy self-sufficiency rate for outdoor temperature; (b) Energy self-sufficiency rate based on ratio of power purchase amount to system energy consumption; (c) Energy self-sufficiency rate for difference in power production and energy consumption.
Buildings 14 00882 g008
Figure 9. Electrical energy flow of integrated energy system. (a) July; (b) August; (c) September; (d) October; (e) November.
Buildings 14 00882 g009
Figure 10. Annual electricity cost according to PV–ESS capacity. (a) PV capacity changes; (b) ESS capacity changes.
Buildings 14 00882 g010
Table 1. Literature review for the photovoltaic–heat pump integrated system.
AuthorsSystem DescriptionAnalytical
Approach
Evaluation Method
PerformanceEconomicEnergy Self-
Sufficiency
Long et al. [18]PVT/ASHP/HSTSimulationoxx
Kong et al. [19]PVT/ASHP/HSTSimulationxox
Bae et al. [20]PVT/ASHP/HSTSimulationoxo
Bae et al. [21]PVT/ASHP/HSTExperimentoox
Aneli et al. [21]PV/ASHP/HST/EESSimulationoxo
Perrella et al. [24]PV/AWHP/HST/EESSimulationxxo
Nicoletti et al. [25]PV/AWHPSimulationooo
This workPV/AWHP/ERV/HST
/EES
Experiment
Simulation
ooo
Table 2. HVAC system configuration and specifications of the building.
ComponentSpecification
AWHPModelHM051MR U44
Capacity5 kW × 2EA
RefrigerantR32 (1.4 kg)
HSTCapacity220 L
ERVAir volume250 CMH
PV PanelCapacity4.44 kW (370 W × 12 EA)
PCSAC5 kW
Power conversion efficiency96%
LEDPower consumption50 W × 5 EA13 W × 5 EA
Table 3. Measuring equipment and specifications.
EquipmentMetricsSpecification
RCN8 Ultrasonic Heat MeterHeat and flow rateAccuracy class 2 (European EN1434)
Temperature sensor: Pt1000
EM415Power meterAccuracy Class B
SR-05Solar radiationISO second class pyranometer
Uncertainty < 1.8%
QFA3160Temperature and
humidity
Accuracy: 0.8 K (15~35 °C)
1 K (−35~50 °C)
Table 4. Energy self-sufficiency rate according to PV–ESS capacity.
PV Capacity (kW) (%)
12345678
ESS
Capacity
(kWh)
127.74 43.62 47.68 49.97 51.71 53.03 54.09 55.02
227.76 48.13 53.45 55.84 57.65 58.95 60.02 60.94
327.77 51.57 58.99 61.68 63.52 64.87 65.94 66.87
427.79 53.81 64.00 67.43 69.36 70.76 71.86 72.79
527.80 55.08 68.47 73.06 75.19 76.61 77.75 78.70
627.82 55.50 72.44 78.41 80.93 82.42 83.58 84.50
727.84 55.56 75.78 83.28 86.28 87.66 88.65 89.44
827.85 55.57 78.11 86.98 90.61 91.98 92.76 93.37
Disclaimer/Publisher’s Note: The statements, opinions and data contained in all publications are solely those of the individual author(s) and contributor(s) and not of MDPI and/or the editor(s). MDPI and/or the editor(s) disclaim responsibility for any injury to people or property resulting from any ideas, methods, instructions or products referred to in the content.

