Article

Contemporary Evaporative Cooling System with Indirect Interaction in Construction Implementations: A Theoretical Exploration

1
Department of Architecture, Faculty of Engineering and Architecture, Recep Tayyip Erdogan University, Zihni Derin Campus, 53100 Rize, Turkey
2
Department of Energy Systems Engineering, Faculty of Engineering and Architecture, Recep Tayyip Erdogan University, Zihni Derin Campus, 53100 Rize, Turkey
3
Department of Mechanical Engineering, Faculty of Engineering and Architecture, Recep Tayyip Erdogan University, Zihni Derin Campus, 53100 Rize, Turkey
4
Department of School of Engineering and the Built Environment, Birmingham City University, Birmingham B4 7XG, UK
5
Department of Architecture and Built Environment, University of Nottingham, Nottingham NG7 2RD, UK
*
Author to whom correspondence should be addressed.
Buildings 2024, 14(4), 994; https://doi.org/10.3390/buildings14040994
Submission received: 29 February 2024 / Revised: 23 March 2024 / Accepted: 26 March 2024 / Published: 3 April 2024

Abstract

:
The construction sector, including in developed countries, plays a notable part in the overall energy consumption worldwide, being responsible for 40% of it. In addition to this, heating, ventilating and air-conditioning (HVAC) systems constitute the largest share in this sector, accounting for 40% of energy usage in construction and 16% globally. To address this, stringent rules and performance measures are essential to reduce energy consumption. This study focuses on mathematical optimisation modelling to enhance the performance of indirect-contact evaporative cooling systems (ICESs), a topic with a significant gap in the literature. This modelling is highly comprehensive, covering various aspects: (1) analysing the impact of the water-spraying unit (WSU) size, working air (WA) velocity and hydraulic diameter (Dh) on the evaporated water vapour (EWV) amount; (2) evaluating temperature and humidity distribution for a range of temperatures without considering humidity at the outlet of the WSU, (3) presenting theoretical calculations of outdoor temperature (Tout) and humidity with a constant WSU size and air mass flow rate (MFR), (4) examining the combined effect of the WA MFR and relative humidity (ϕ) on Tout and (5) investigating how Tout influences the indoor environment’s humidity. The study incorporates an extensive optimisation analysis. The findings indicate that the model could contribute to the development of future low-carbon houses, considering factors such as the impact of Tout on indoor ϕ, the importance of low air velocity for achieving a low air temperature, the positive effects of Dh on outdoor air and the necessity of a WSU with a size of at least 8 m for adiabatic saturation.

1. Introduction

The clean and effective use of energy production is becoming increasingly important with the increase in the importance and awareness of environmental problems that have come as a result of global warming [1,2,3,4,5,6]. The phenomenon of global warming induces the creation of greenhouse gases, impacting both nature and humans. This is fuelled by the unregulated surge in energy consumption, reflective of irregular increases in the global human population and economic advancements, coupled with the escalating combustion of fossil fuels. In spite of dedicated endeavours to reduce the interval between traditional energy sources and renewables, only approximately 30% of the overall global energy need is fulfilled by green energy technologies [7]. In this context, there is widespread agreement within the scientific community that conducting investigations into the efficient control and utilisation of energy resources and effectively decreasing the consumption of energy is imperative. This issue affects not just one sector, but the entire spectrum of industries. Hence, if each sector implemented measures to curtail the energy demand, the escalating greenhouse gas emissions globally could potentially be halted. Urgent and intensified actions must be taken to achieve stability as a result. A review of literature studies indicates that a substantial portion of global energy consumption is attributed to buildings. As an illustration, in the European Union (EU), buildings contribute 40% of the overall energy consumption [8]. Tzeiranaki et al. [9] reported that the total energy loss for the EU in 2020 was equivalent to approximately 1086 million tons of oil.
In a study conducted years later, regarding the present annual greenhouse gas emissions within the UK territory, standing at 454 MtCO2, approximately 91 MtCO2 was shown to be related to the functioning of structures. Notably, 90% of these emissions stemmed from domestic buildings. The emissions directly associated with constructing new buildings in the UK during 2018 were estimated to range between 17.0 and 18.5 MtCO2. Specifically, domestic buildings were shown to be responsible for 9.4 and 8.9 MtCO2, consistently [10]. Hence, the issue of energy consumption is not only significantly high, but also has an evident impact on the environment.
Buildings’ energy consumption is allocated not only to heating, but also to cooling, making the impact of cooling significant. According to a study by Rashad et al. [11], the demand for cooling is on the rise in tandem with the increased desire for enhanced comfort in buildings. Evaporative cooling is highlighted as a strong contender to meet this demand due to its cost-effectiveness [12]. Evaporative cooling, as underscored by Chen et al. [13], is presented as a feasible substitute for mechanical vapour compression in air conditioning, demanding roughly one-fourth of the electric power compared to vapour compression refrigeration [14].
Evaporative cooling systems currently available can be categorised into direct-contact (DC) evaporative cooling as well as ICESs. In evaporative cooling through DC, the air in need of cooling is brought into DC with the LWF and the need can be met through a heat transfer (HT) between the WA and the LWF [15]. Evaporative cooling through DC is suitable for usage primarily in arid, hot environmental conditions, or in spaces that necessitate both cooling and humidification [16]. Conversely, in ICESs, the interior air decreases in temperature through auxiliary air, known as the WA, which undergoes cooling by means of evaporation [17]. From a thermodynamic perspective, the moist pathway takes in heat from the dry pathway through the process of water evaporation, effectively cooling the non-moist pathway, whilst the latent heat of vaporising water is released into the WA. The depiction in Figure 1 illustrates the setup of ICESs.
The metal panel situated amid the product and working air generally functions as a device that facilitates the exchange of heat between the two air streams, available in plate form [18,19], tube form [18,20] and heat pipe form [18,21]. ICESs possess the utility of cooling the product air without altering its specific humidity [22]. Moreover, ICESs were chosen for this study due to their avoidance of incorporating contaminated water droplets into the system, a concern that can arise during operation, posing significant health risks [23]. As a result, these systems have been extensively employed in residential structures as HVAC systems for over a century [17].
The theoretical examination of ICESs is relatively intricate, given that the air-cooling process entails simultaneous thermal and mass diffusion at the interface between the water film and air. Numerous efforts have been undertaken to achieve a precise comprehension of the thermal characteristics of these systems. Previous theoretical studies utilised 1D mathematical models [24,25,26,27,28]. Erens and Dreyer [29] assessed three analytical models, revealing that the optimal configuration for the cooling system is achieved with the proportion of airflow velocity between the primary and secondary components of approximately 1.4, presuming an equal MFR. Tsay [30] conducted a numerical investigation of a reverse-flow and moist surface heat exchanger, revealing that a significant portion of the energy transfer over the water film was soaked through the film vaporisation process. Guo and Zhao [31] provided a comprehensive examination of an ICES. The impact of diverse factors, including the speeds of the fundamental and auxiliary air flows, channel width, inlet ϕ and the plate’s wettability, on thermal efficiency was explored. They asserted that a decreased inlet ϕ of secondary air, increased plate wettability and a greater velocity rate pertaining to the secondary air in relation to the primary air resulted in an enhanced efficiency of the refrigeration framework. Halasz [32] introduced a comprehensive mathematical model for evaporative cooling systems. The model was constructed by developing a set of four fractional derivative formulas that described evaporation without maintaining an isentropic condition process with a variable watercourse orientation, chilled fluid and air. Riffat and Zhu [33] introduced a mathematical thermal and mass diffusion model in their innovative ICES design, incorporating permeable ceramic and thermal conduit elements. Their findings suggested the potential for achieving substantial cooling capacity in arid and breezy weathers. They emphasised the importance of setting the indoor air velocity at an appropriate level of 0.6 m/s for optimal efficiency. Adam et al. [34] investigated heat and mass transfer in an ICES, specifically focusing on a crossflow arrangement. A numerical model was developed to predict condensation in the primary air and was validated against both numerical and experimental data. The simulations explored different condensation scenarios in the dry channel under severe operating conditions. The results showed that condensation states depended on these factors, with lower wettability factors delaying and reducing condensation. Additionally, increasing the secondary air velocity enhanced condensation and improved the cooling capacity. Belarbi et al. [35] theoretically explored water spray evaporation as a means for natural temperature diminishment in dwellings. Some researchers have engaged in analogous modelling efforts [36,37]. Maheshwari et al. [38] assessed the potential energy savings of ICESs. They noted a significantly higher energy-saving potential in interior areas compared to coastal areas. The study revealed that an ICES in interior areas was 30% further economically efficient in contrast to a conventional air-conditioning system.
A comprehensive examination of the existing literature clearly indicated numerous endeavours towards the theoretical exploration of ICESs. Nevertheless, it is apparent from previous research that achieving a satisfactory alignment between experimental and theoretical outcomes has proven challenging due to the intricate nature of the process and the inherent limitations in assumptions. In addition, there is a pressing need for further studies dedicated to innovative ICESs explicitly tailored for residential buildings. Consequently, to achieve a more thorough understanding of the techno-economic evaluation within such systems, it becomes imperative to undertake a comprehensive analysis that encompasses both theoretical research and experimental validation. Hence, in response to the existing gap in the literature regarding comprehensive modelling or validation through experimental studies, this research introduces a mathematical framework for the inventive design of ICESs, which has already undergone testing at a trial site in the southeast of the United Kingdom. It is anticipated that this study, which meticulously considers various factors, is likely to significantly contribute to future perspectives by offering a detailed insight into the novel modelling of temperature reduction systems along with its initial findings.

2. An Innovative Evaporative Cooling System

This investigation constituted the initial segment of a study focused on an innovative configuration of an ICES. The primary objective of this phase was to discern the operational system features via a theoretical examination. In this context, the study examined the influences of operational and environmental factors, including the temperatures inside and outside, the MFR, the ϕ levels of the supplied and the WA and the channel configuration of the heat exchanger, on the comprehensive efficiency of the system. The setup was developed and built to provide ventilation and cooling for residential structures.
To this end, a test residence was erected in southeastern UK, illustrated in Figure 2, with the system installed beneath the roof. The outer measurements of the testing structure were 7 m in size, 3 m in broadness, as well as 4.3 m in height. It featured a pair of windows, along with a roof skylight (Velux window), all equipped with double glazing. Nevertheless, it was evident from the test site that the study was conducted in conditions representative of a summer climate. Table 1 provides the size of the elements of the trial dwelling. The walls and roof were insulated with 150 mm of mineral wool, while the floor had a 150 mm insulation layer.
The suggested ICES could be divided into two primary components: the heat exchanger unit and the WSU. The system was designed to cool the stagnant indoor air through humidification in the WSU. Afterwards, the cooled air was directed to the polycarbonate heat exchanger (PHE) unit until the isentropic saturation circumstance was reached. This process enabled a reduction in the Tfa,in at the reverse-fluid heat exchange systems. Four PHE sheets were manufactured by connecting 0.2 mm thick PHE sheets using an adhesive with high thermal conductivity, creating a cross sectional area of 10 mm2. Figure 3 depicts the square cross-section channels of the PHE for both the inflowing and outflowing air. Two of the PHE sheets were positioned at the facade of the dwelling, whilst the remaining two were at the rear, as illustrated in Figure 4.
The measurements and the wall measure of how thick the PHE are provided in Table 2.
The termination of every per PHE sheet inside the structure was accompanied by an exhaust duct linked to the top conduits and an intake duct linked to the inferior conduits. The exhaust and intake ducts had a square shape with inner sizes measuring 60 × 60 mm2. Both the exhaust and intake ducts were subsequently incorporated into rectangular channels with interior measurements of 105 × 50 mm2. Ultimately, the oblong conduits linked to fans with variable air velocities. The outer extremities of the PHE concluded below the roof slates, facilitating the drainage of condensed water into the gutters. Conversely, air purifiers would draw fresh air from under the overhangs. The WSU was regulated with a valve, controlling the MFR for the sprayed water. Spraying was carried out using tap water circulating within a copper pipe, having internal dimensions measuring 8 mm in diameter and 1 m in size, positioned at the central point of the exhaust channel immediately prior to the thermal interchange apparatus. A straightforward representation of the entire system is presented in Figure 5.

3. Theoretical Framework of the System

In this part, a precise mathematical description of the innovative ICES is introduced. The model was divided into two components: a theoretical examination of the WSU and a numerical analysis of the PHE unit. Initially, the rate of water film evaporation into the WA was calculated under various operating conditions, and the thermophysical characteristics of the WA were established at the exit of the WSU. A HT comparison for flow within the channels was utilised to assess the rate of evaporation. The rate of evaporation depended on the mass transfer coefficient (K), which was identified by the Sherwood number (Sh). The Sh, which expresses the relationship between convective and diffusive K, was determined using correlations involving Reynolds (Re) and Schmidt (Sc) numbers. To calculate the previously talked about unitless quantities, the thermophysical air attributes at the film temperature (Tf) were operated. Tf was expressed as stated below:
T f = T l w f + T w a , i n 2
The flow’s characteristic was subsequently established using the Re. The Re is a dimensionless parameter indicating the relationship between the inertial and viscous forces, providing insight into the significance of these forces under specific flow conditions [39]. For noncircular tube flows, the Re was calculated based on D h . As a reminder, below we wrote out the Re formulation:
R e = ρ V D h μ
where
ρ : density (kg/m3);
V: velocity (m/s);
µ: dynamic viscosity ( k g m s ) .
D h = 4 A p
In Equation (3), A represents the duct cross-sectional area, while p indicates the perimeter submerged in the liquid. In the other calculated demand formulation, the Sc can be found, and it was written out as follows:
S c = v D m
where
v : kinematic viscosity ( m 2 s );
Dm: mass diffusivity ( m 2 s ).
As apparent from the formulation, the Sc is a unitless factor expressed as the rate between the momentum and mass diffusivities. It can be employed to delineate fluid flows involving concurrent processes of momentum and mass diffusion convection [40]. Afterwards, the Sh was calculated using the subsequent equation:
S h = K D h D m
Sh is a unitless parameter that signifies the convective ratio to dispersive K. The mean K was determined by employing the mean Sh in accordance with the below formula:
K ¯ = S h ¯ d m D h
The line above the abbreviations in the formula means the average.
To calculate the Sh, the subsequent partially theoretical equation established by Frossling [41] could be applied:
S h = 2 + 0.552 R e S c 3
Regarding the water vapour spread coefficient, the curve obtained through the regression adjustment derived from the dataset of Bolz and Tuve [42] could be employed:
D m = 1.656 × 10 10 T 2 + 4.479 × 10 8 T 2.775 × 10 6
The MFR was determined through the disparity in the humidity concentration between the WSU and the WA. The water vapour’s fractional pressure at the WSU expressed vapour pressure of water at saturation in v a p o u r of water vapour concentration ( c w ) at the WSU was the water vapour density determined using the fractional pressure and temperature. The concentration at the WSU is known as the mass fraction of water vapour ( m f w ).
m f w = c w ρ
At T l f w , the fractional water pressure in the operational atmosphere ( P w , w a ), could be obtained by multiplying the ϕ with the saturation pressure of the water vapour ( P s a t , w ), as indicated in the formulation below:
P w , w a = ϕ P s a t , w
The water vapour concentration in the operational atmosphere ( c w , w a ) was determined using ρ w calculated based on the fractional pressure and temperature. Then, the following equation could be used:
m f w , w a = c w , w a ρ
where m f w , w a : mass fraction of water vapour in the operational atmosphere.
The blowing factor (BF) was determined using the following definition to compute the adjusted mass transfer coefficient ( K ¯ c o r ):
B F = ln 1 + m f w m f w , w a m f w , w a 1 m f w m f w , w a m f w , w a 1
The K ¯ c o r was adjusted using:
K ¯ c o r = K ¯ B F
Lastly, the water MFR resulting from evaporation was computed using the next equation:
m ˙ w = K ¯ c o r A t o t , w s u ( c w c w , w s u )
where A t o t , w s u : the overall HT surface area of the WSU.
Establishing the water MFR through evaporation allowed for the determination of the temperature and ϕwa at the WSU exit. The cooled and humidified WA, upon leaving the spraying duct, was then guided to the counter-flow PHE to lower the temperature of the entering warm fresh air. Subsequently, the second phase of the simulation effort focused on examining the HT within the innovative plate-type PHE.
The PHE could be envisioned as a pair of straight channels accompanying the movement of fluid that are thermally linked. Assuming the ducts are of the same size (L) and transports the streams with heat capacity ( c j ), the MFR of the streams is represented by ( m ˙ j ) that lower index and “sa” refers to the stale air and “fa” to fresh air. Therefore, T s a ( x ) and T f a ( x ) are the temperature profile to the streams and, here, x refers to the interval through the channel. The analyses were conducted under steady-state conditions, ensuring that the temperature profiles remained constant and were not dependent on time. Additionally, it was regarded as the exclusive HT from a limited quantity of fluid to the fluid particle inside the second channel at the equivalent location. The quantity of the HT within the channel due to temperature variations was disregarded. According to Newton’s law of cooling, the rate of energy alteration within a limited section of the flow was directly linked to the temperature disparity between that segment and the corresponding component in the alternate duct:
u s a t = ξ ( T f a T s a )
u s a t = ξ ( T s a T f a )
Here, u j ( x ) is the ratio of the thermal energy to size; also, ξ means the thermal coupling constant divided to size among channels. This alteration in the internal energy led to a modification at Tsa. The temporal rate of variation for the stream element transported by the flow was as follows:
u s a t = ψ s a d T s a d x
u f a t = ψ f a d T f a d x
where ψ f = c j m ˙ j means the thermal MFR. When rearranging the equations between (15) and (17) as well as (16) and (18), they could be rewritten as follows:
c j m ˙ j d T s a d x = ξ ( T f a T s a )
c j m ˙ j d T f a d x = ξ ( T s a T f a )
Looking at the rearranged equations above, it could be easily understood that there was no longer a time dependence because the system was essentially stationary. Moreover, given that the HT was nearly negligible along the extension of the pipe, it was not feasible to compute any secondary derivatives at any point x, as indicated by the heat equations, like in the next equations:
T s a = Ω 1 Ω 2 σ 1 σ e σ x
T f a = Ω 1 + Ω 2 σ 1 σ e σ x
Therefore
σ 1 = ξ ψ s a ,   σ 2 = ξ ψ f a ,   σ = σ 1 + σ 2
Also, Ω 1 , as well as Ω 2 , are in the mean of the integration constants. Now, to determine the mean temperatures, with the origin of the temperature points set at 0 and the channel size established as L, the following formulas arose:
T ¯ s a = 1 L 0 L T s a d x
T ¯ f a = 1 L 0 L T f a d x
T s a , 0 = Ω 1 Ω 2 σ 1 σ
T f a , 0 = Ω 1 + Ω 2 σ 1 σ
T s a , l = Ω 1 Ω 2 σ 1 σ e σ l
T f a , l = Ω 1 + Ω 2 σ 1 σ e σ l
T ¯ s a = Ω 1 Ω 2 σ 1 σ 2 l ( 1 e σ L )
T ¯ f a = Ω 1 + Ω 2 σ 2 σ 2 l ( 1 e σ L )
Equations (27)–(31) did not matter at all. By choosing at least two of the temperatures, the integral constant could be eliminated and, thus, shed light on finding the other four temperatures. Additionally, the overall transfer of heat could be obtained using these next equations:
d γ s a d t = 0 L d u s a d t d x = Ψ s a T s a , L T s a , 0 = ξ l ( T ¯ f a T ¯ s a )
d γ f a d t = 0 L d u f a d t d x = Ψ f a T f a , L T f a , 0 = ξ l ( T ¯ s a T ¯ f a )
γ represents the overall transfer of heat, whilst u means the internal energy. As is known from the law of energy conservation, it could be understood from the above equations that the overall result of energy changes was zero. The above equation, given as the mean temperature differences, is defined in the literature as logarithmically average temperature difference, which is one of the measures of heat exchanger efficiency.

4. Results and Discussion

This section first begins with a theoretical evaluation of the effects of the WSU size, WA velocity and Dh on the amount of EWV. Accordingly, Figure 6a–c below was created for the theoretical evaluation.
In an alternative investigation, the temperature without considering humidity at the exit of the WSU and the proportion of moisture in the WA was individually scrutinised at the WA inlet temperatures of 17 °C, 20 °C, 23 °C, 26 °C and 29 °C. The outcomes are depicted in Figure 7a–e, and the theoretical representation of the WSU size was provided.
As indicated in the figures, it was evident that the temperature and ϕ of the WA, as extensively discussed in the literature, played a crucial role in defining the capacity of the evaporative cooling system. The findings suggested a trend of decreasing the Tout of the WA with the increasing size of the WSU. Moreover, it was observed that the ϕ of the WA attained saturation beyond a certain threshold for each size of the WSU, deviating from the peak cooling condition. Nevertheless, a WSU size of at least 8 m was the pivotal requirement to achieve an adiabatic saturation. Nevertheless, the outcomes indicated that with an increase in the inlet ϕ of the WA, both the temperature and ϕ of the outlet WA witnessed an upward trend.
In a different segment of the results, the theoretical computation was performed for the Tout and ϕ of the WA, considering a constant WSU size and air MFR ( L w s u = 6   m , v w a = 0.1   m / s ). The temperature range was scrutinised from 17 °C to 29 °C, at 3 °C increments, mirroring the approach taken in the previous analysis, as illustrated in Figure 8a–e. As evident from the illustrations below, how crucial the Dh is in influencing the WA outlet temperature became apparent. For instance, the observed T t w a , o u t of less than 10 °C for a Dh of 0.3 m was an anticipated occurrence, clearly depicted in the images. However, it was deduced that the ϕwa,in did not surpass 50% at its best. As highlighted earlier, the Tout,wa was markedly impacted by the ϕwa,in. To illustrate, when the WA entered at a temperature of 17 °C with 70% ϕ, the Tout,wa decreased to 13 °C, whereas, with 20% ϕ, it dropped below 10 °C.
Another aspect explored independently within the research involved considering the joint impacts of the MFR and ϕwa on the Tout, as depicted in Figure 9a–e below. The findings allowed us to observe that achieving a lower WA temperature in the outlet area required a significantly low air velocity, which could be attained by humidifying the environment through the addition of water vapour to the WA, albeit requiring a longer duration.
Figure 10 illustrates a linear increase in the Tfa,in, correlating with both the Tfa,out and the Tfa,wa.
In the final analysis, we depicted the impact of Tfa,out on ϕfa,in in Figure 11a–d. As per the results, if ϕ f a , o u t was above 40% and the Tfa,out exceeded 35 °C, it indicated that the thermal comfort range for ϕ f a , i n would not be met.

5. Conclusions

  • Enhancing the Dh and extending the size of the WSU could give rise to an increment in the quantity of water vapour.
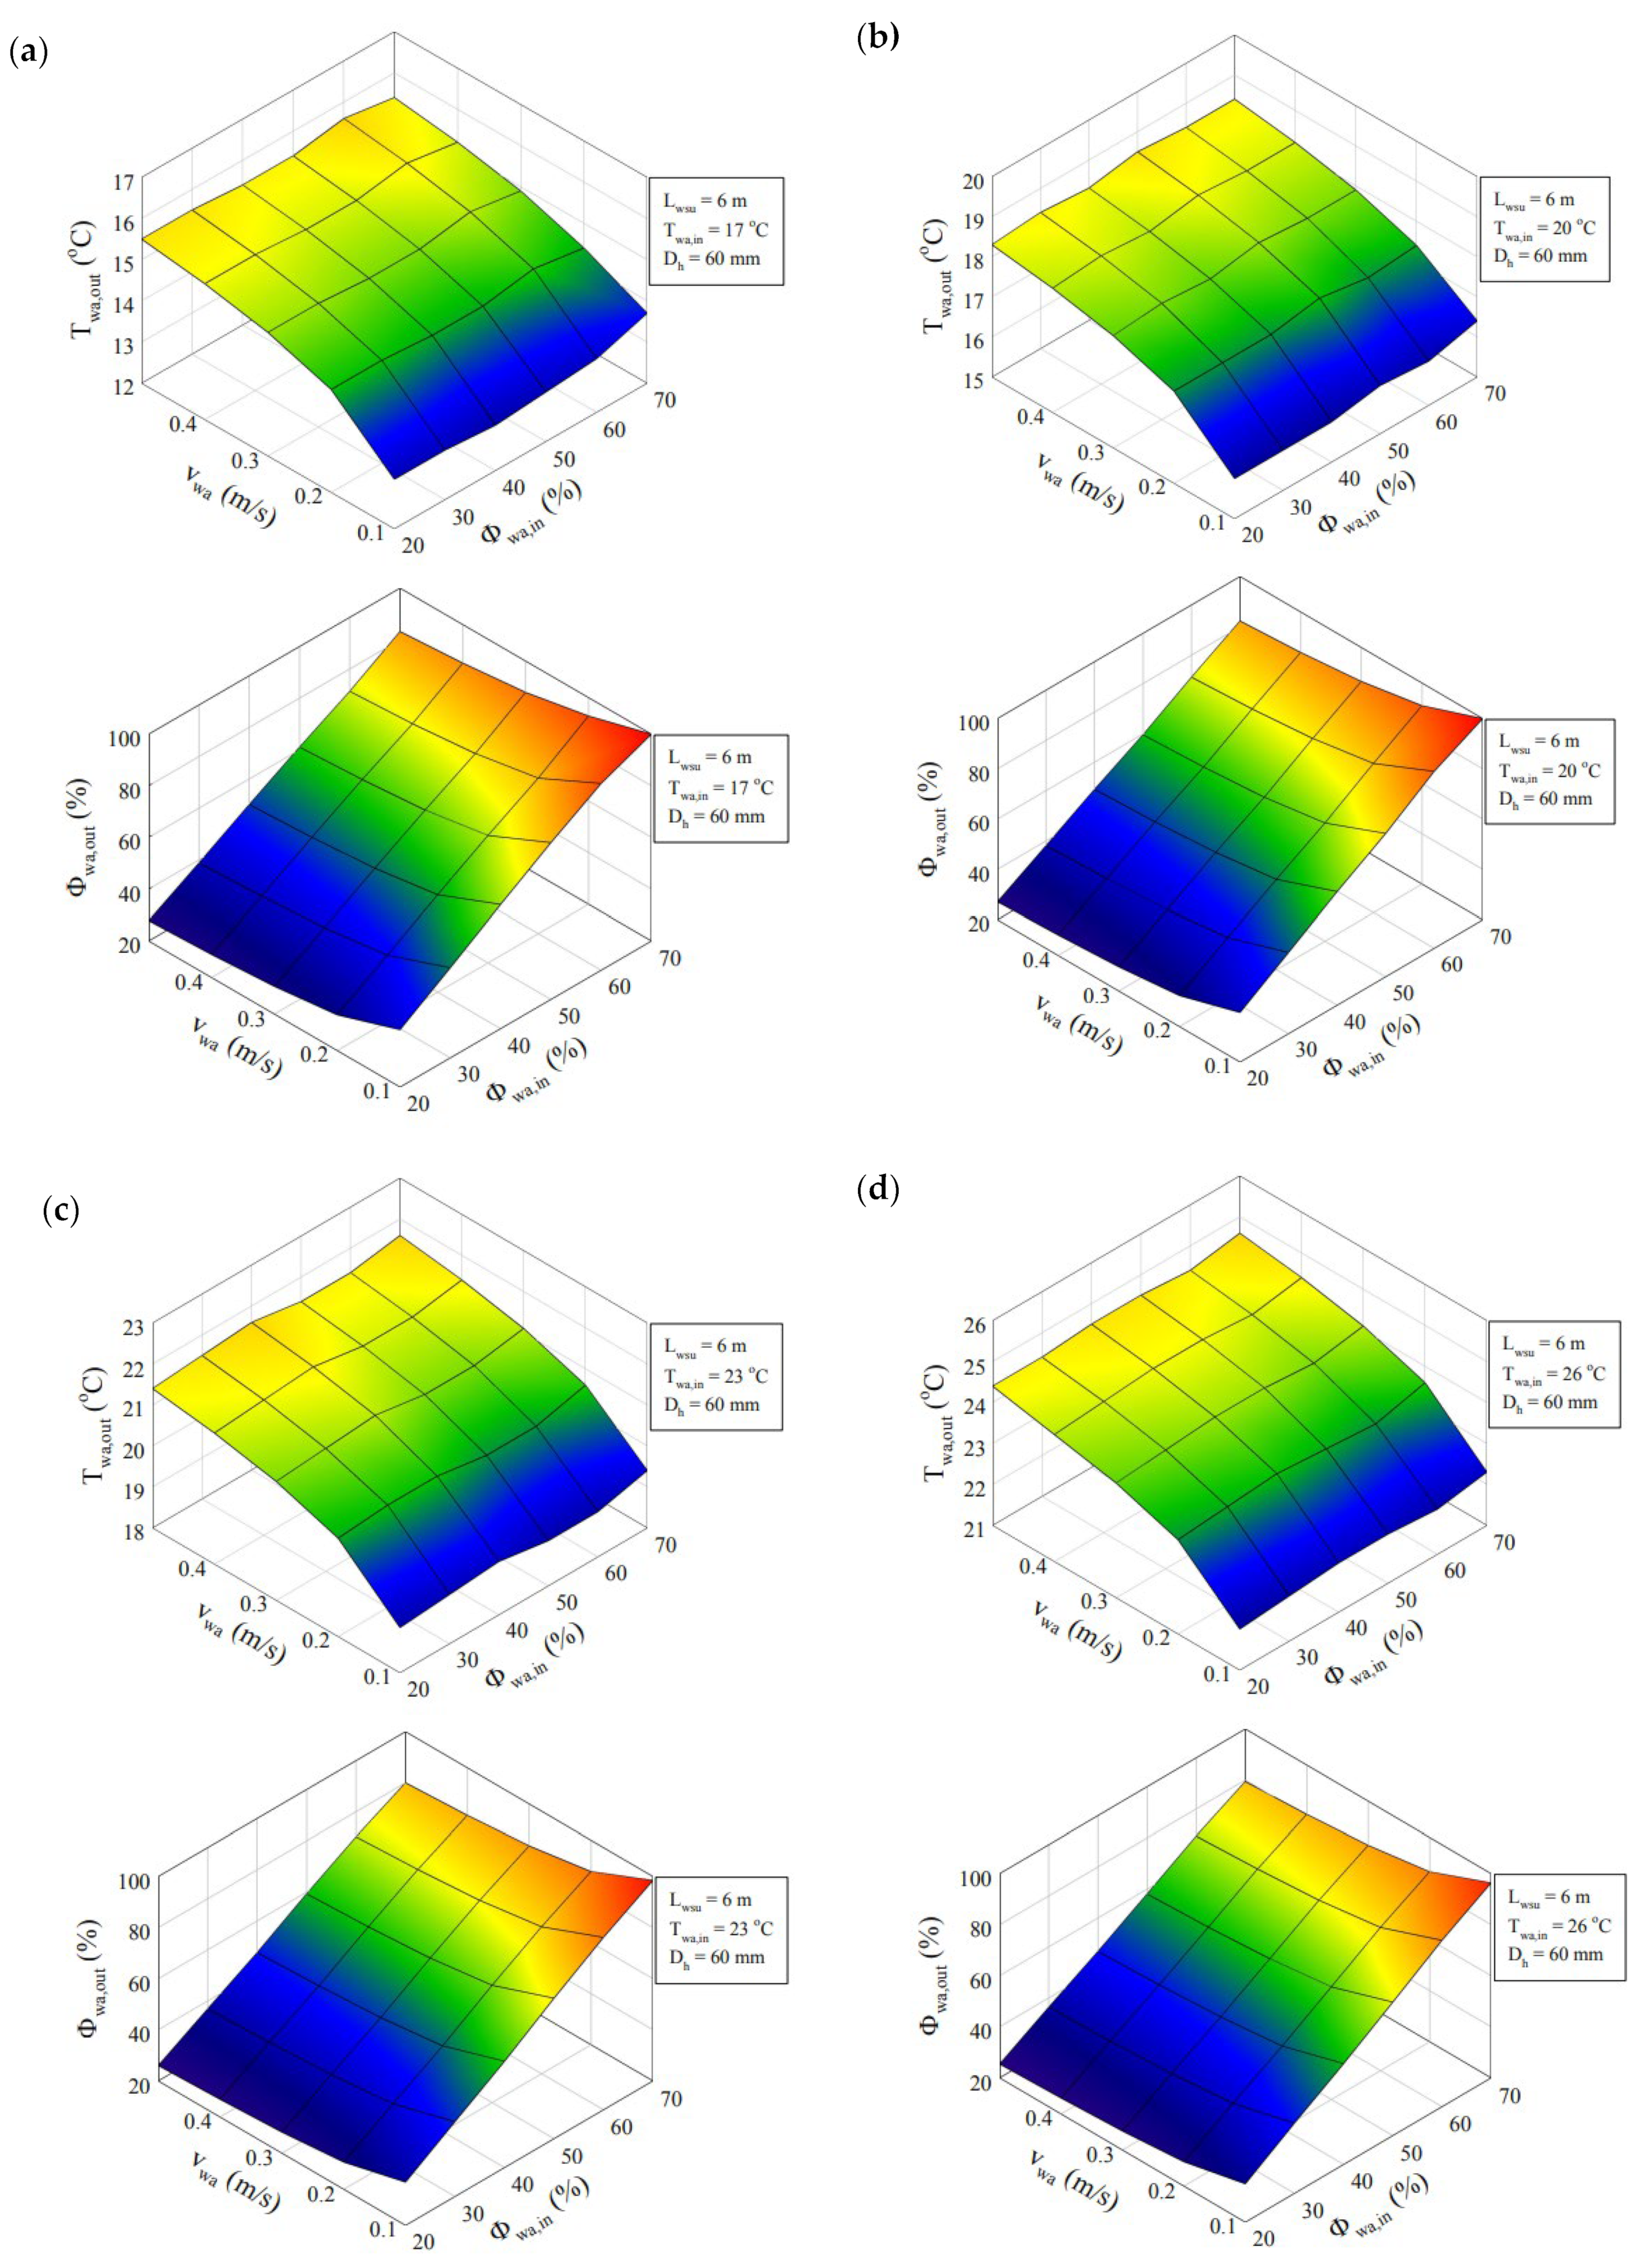
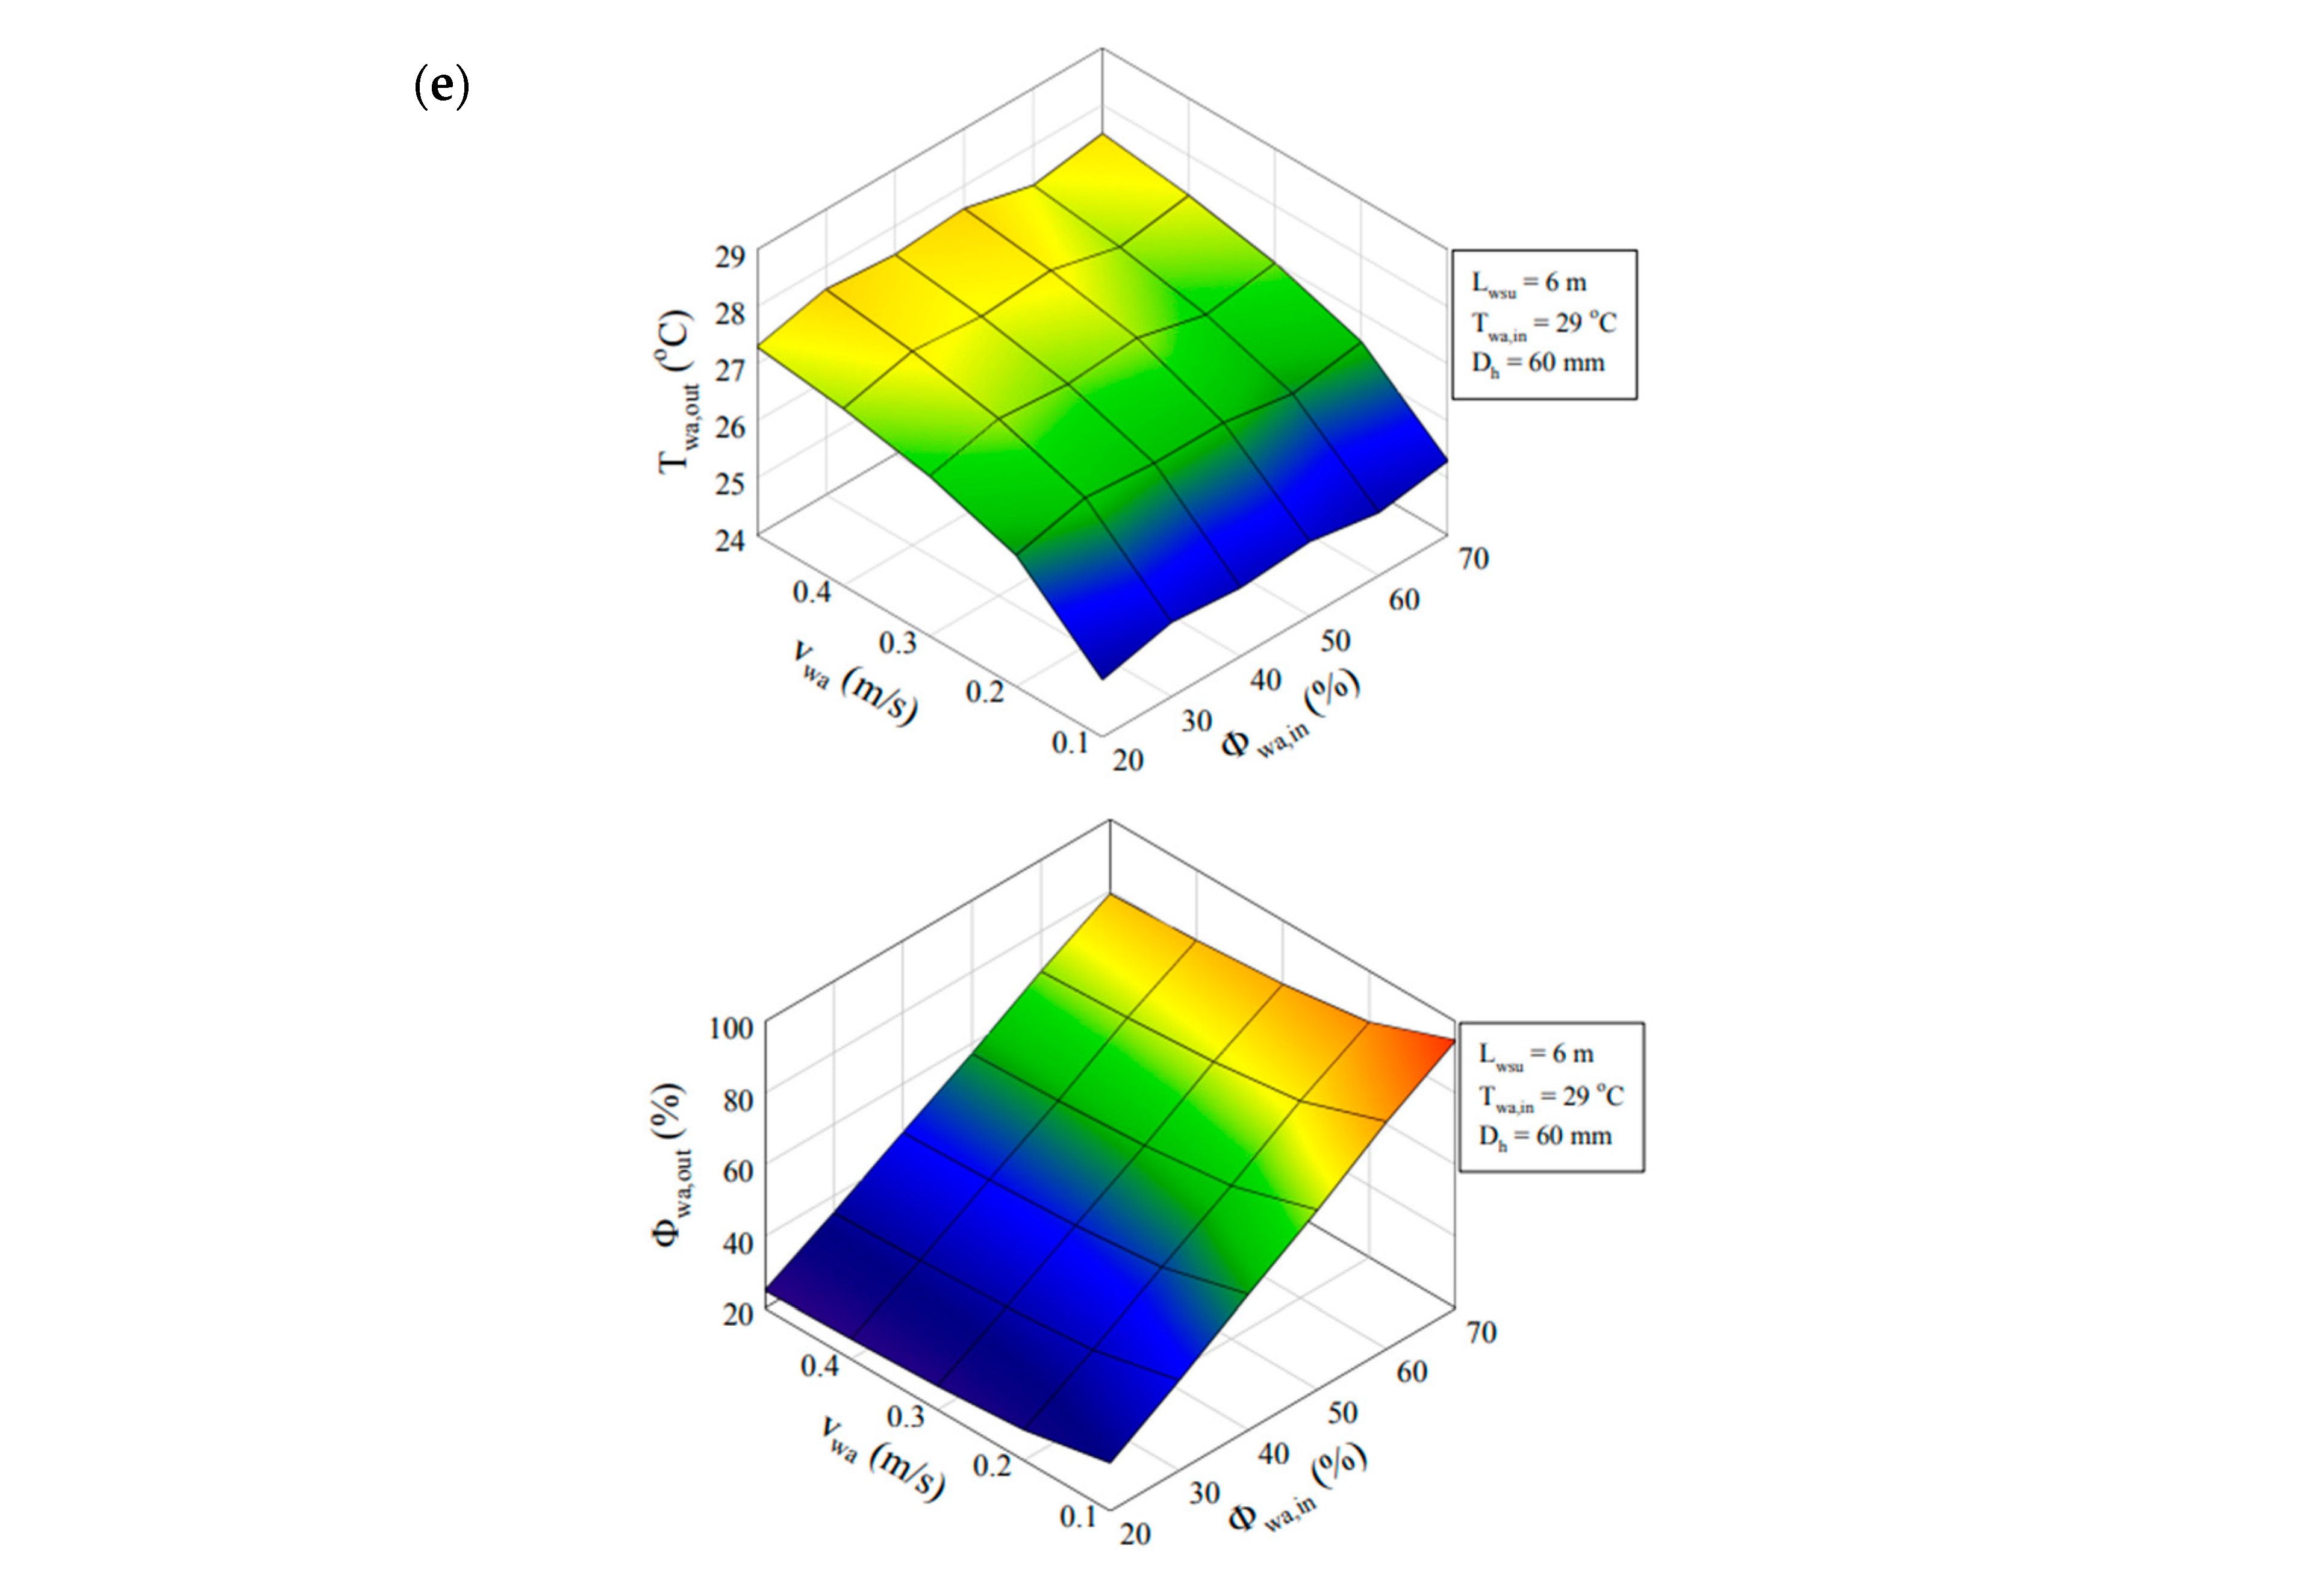
  • Conversely, accelerating the WA speed would contribute to a diminishment in water evaporation.
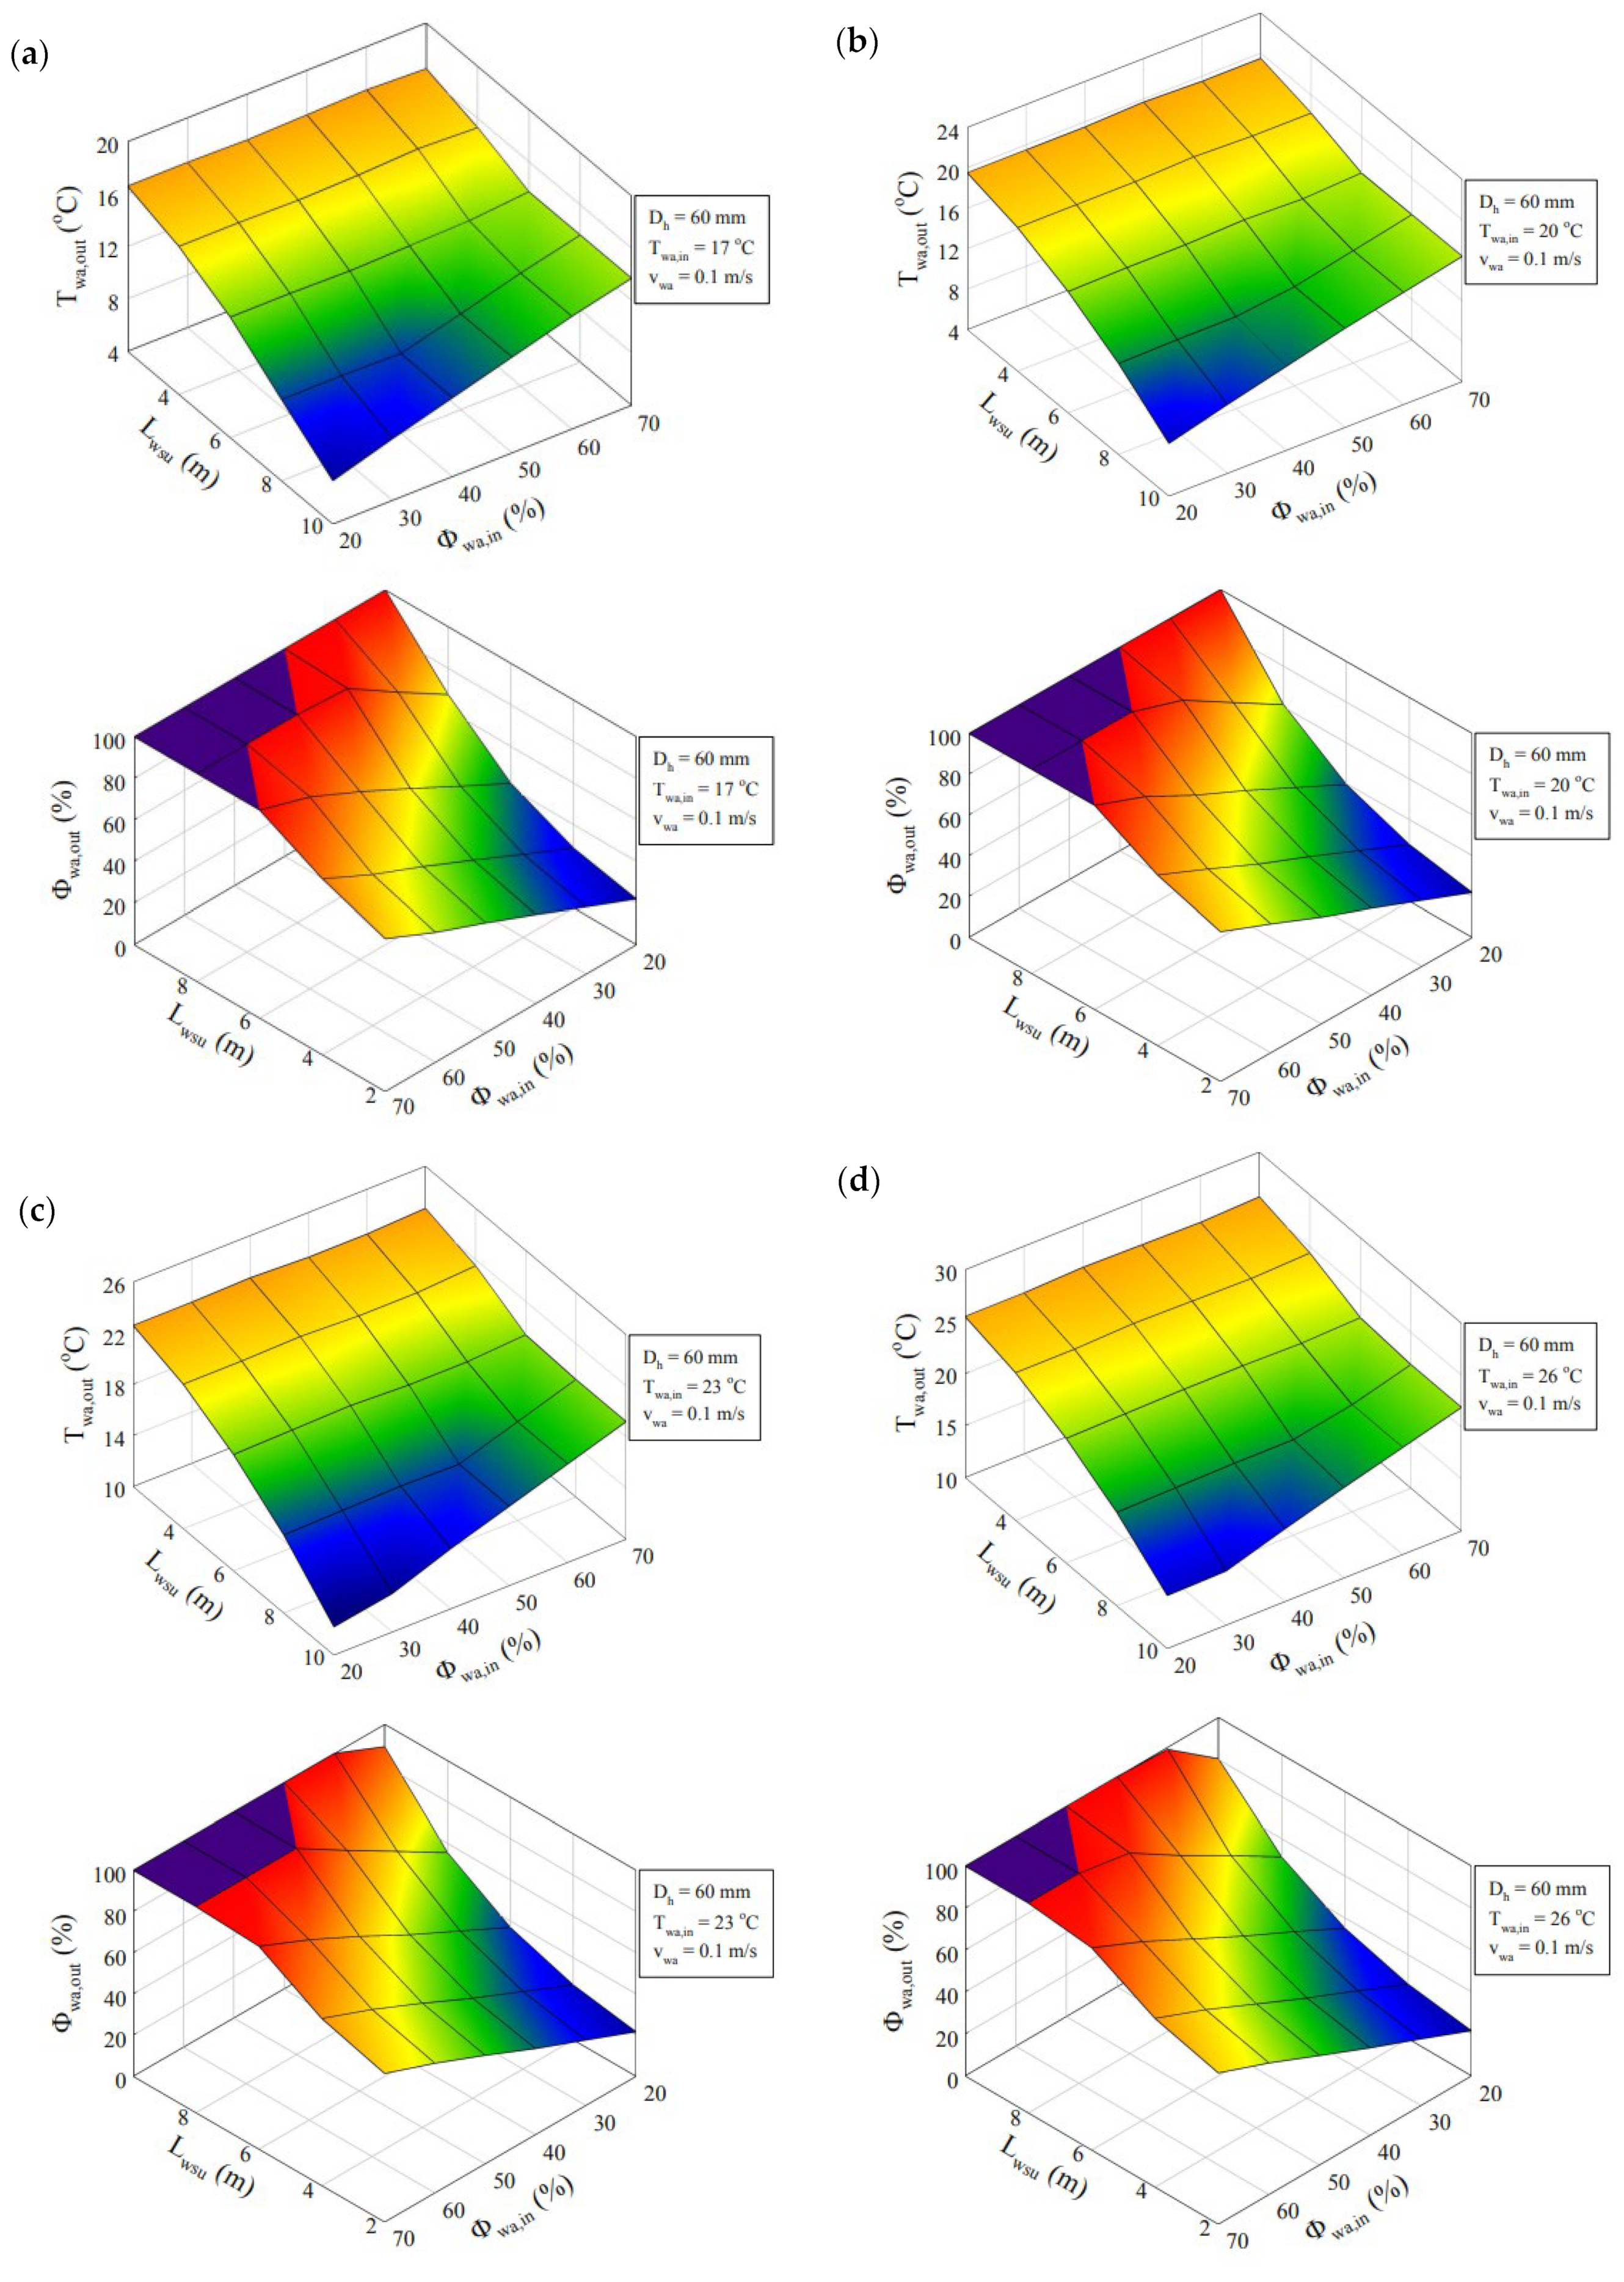
  • When considered in terms of cooling efficiency, it became evident that the temperature of the WA was just as crucial as its ϕ. The findings demonstrated a significant reduction in the Tout of the WA with the rise in WSU size.
  • On the flip side, it was proven that the ϕ in the WA attained adiabatic saturation after a certain value of the WSU size, which was the wanted status.
  • Based on the findings from the optimisation analyses conducted with various inlet air temperatures, achieving the adiabatic saturation status required a WSU size of at least 8 m.
  • In another analysis conducted with a similar approach, the focus shifted to diverse relative humidities of the WA. The results showed that an increase in the inlet ϕ of the WA led to higher temperatures and ϕ of the WA. This underscored the significance of selecting an optimal value whilst considering indoor thermal comfort conditions.
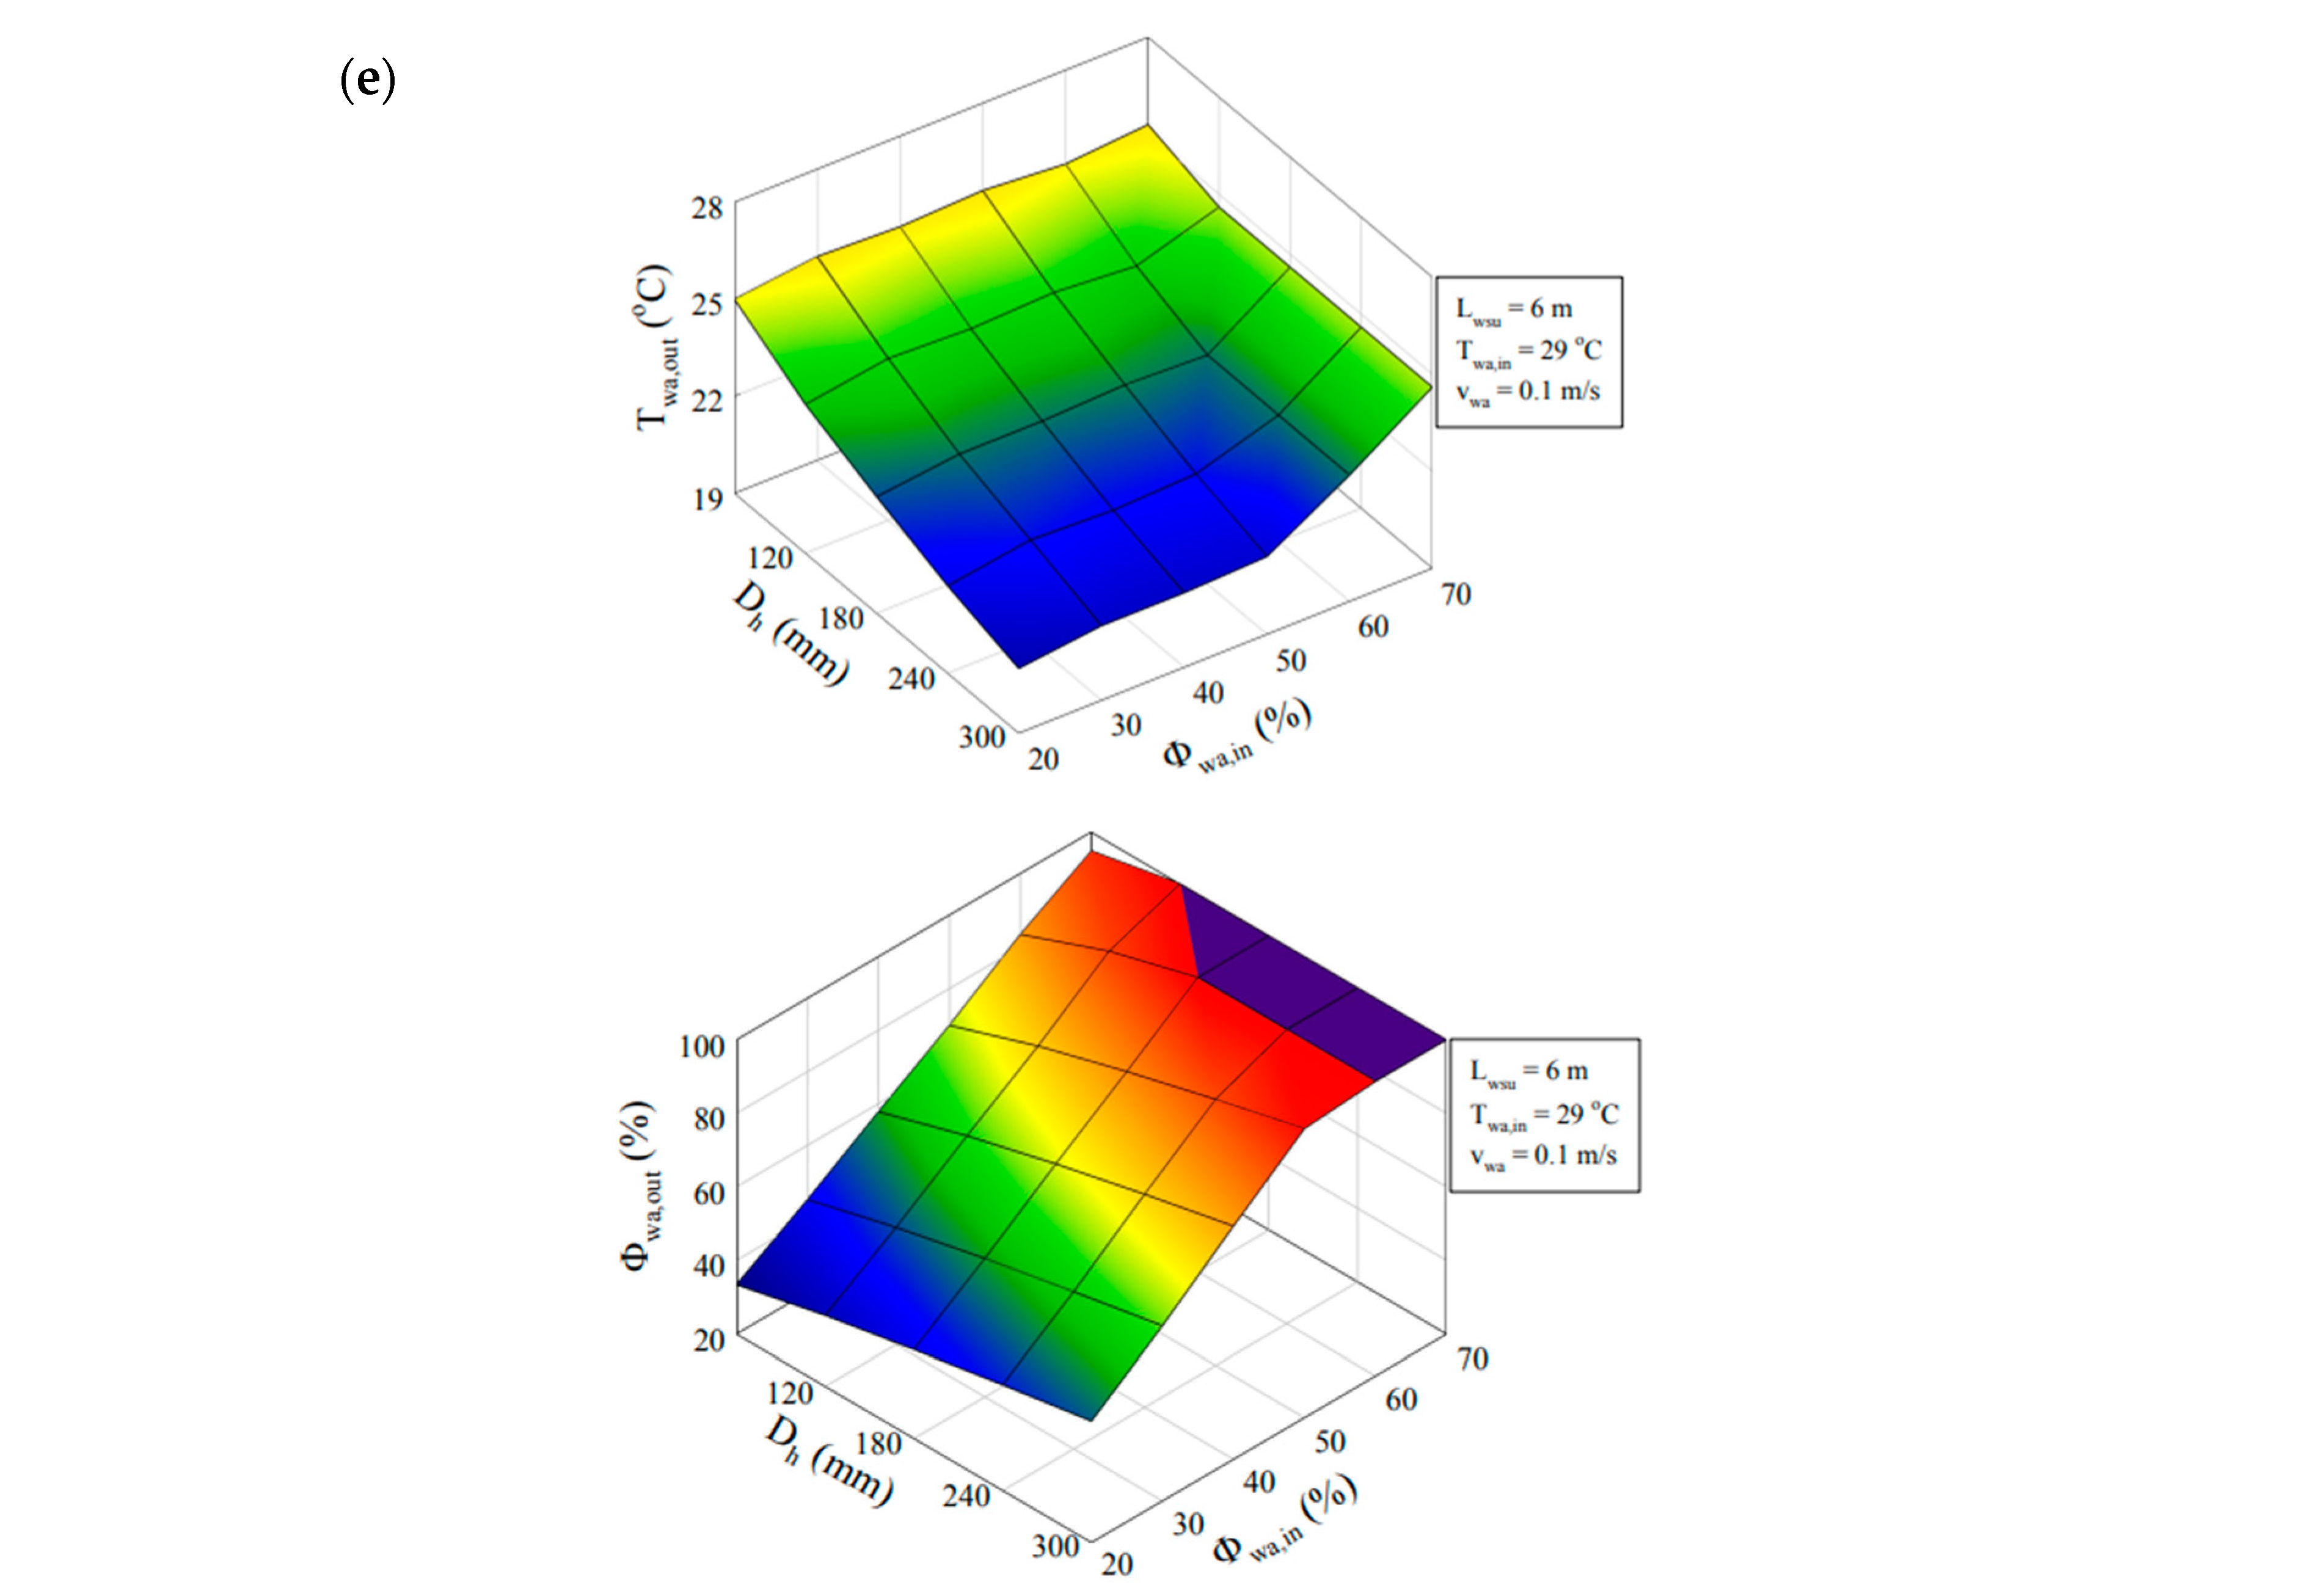
  • Additionally, the outer temperature and ϕ of the WA were established for L w s u = 6   m , v w a = 0.1   m / s , contemplating severe temperatures of the WA at the interior. The cumulative impacts of Dh and ϕ were also assessed. We derived a conclusion that the Dh had a notable impact on the Tout of the WA. For a Dh of 0.3 m, the Twa,out fell below 10 °C, which appeared to be highly favourable.
  • It was stressed that, for the optimal circumstances to be achieved, the ϕ in the inlet WA should be maintained below 50%.
  • This study also investigated the impacts of the MFR and ϕ on the Tout. It concluded that achieving the desired low WA temperature at the outlet required maintaining a low air velocity.
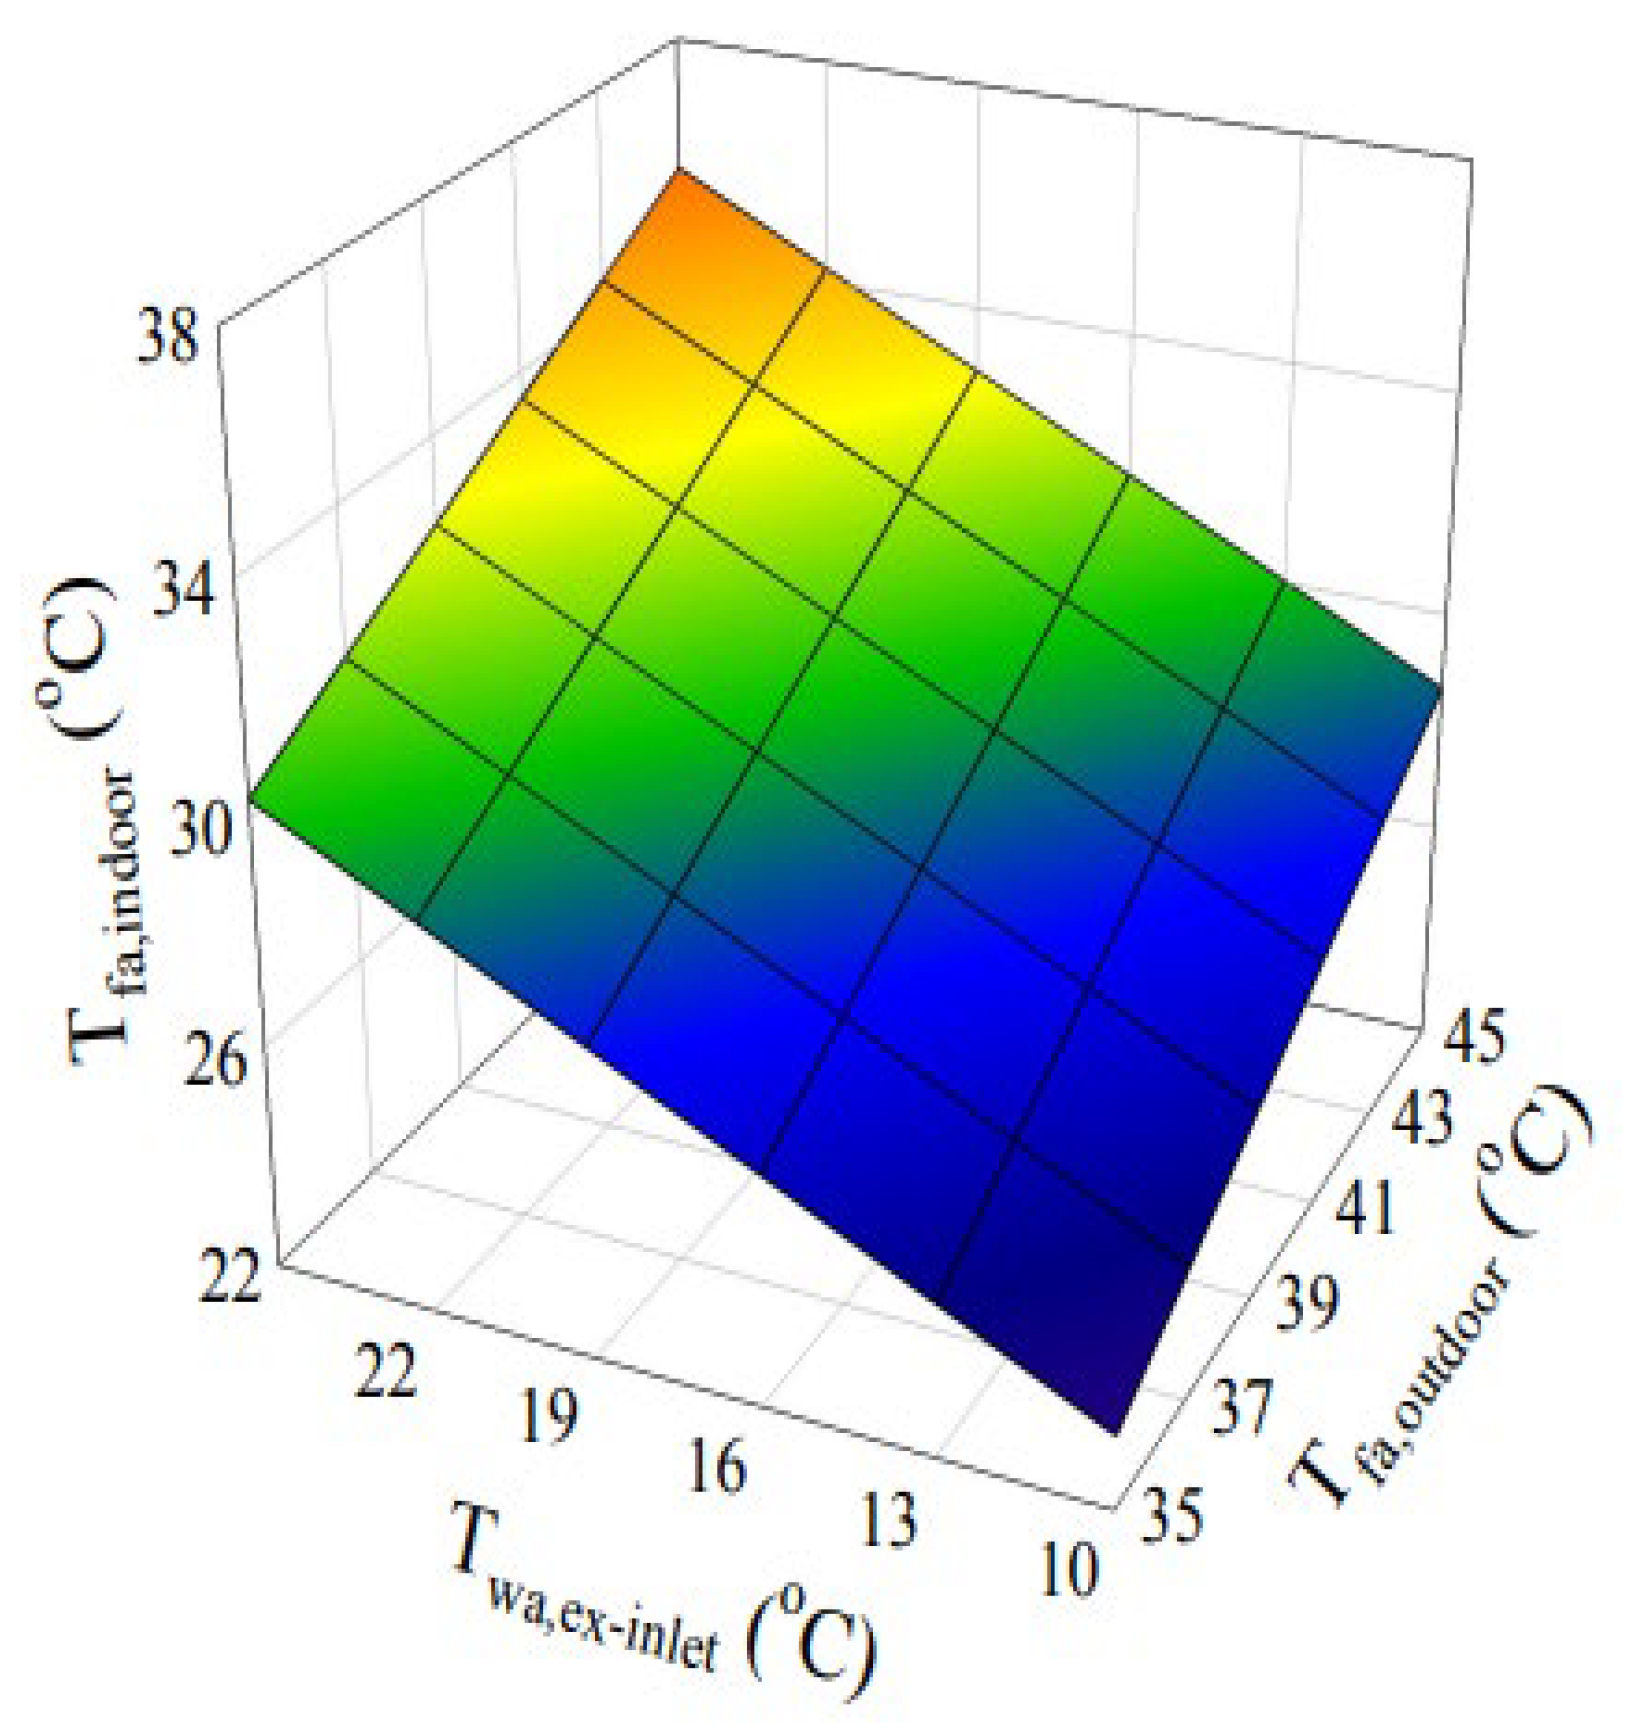
  • Tfa,in increased proportionally with both the temperature of the WA and the Tfa,out.
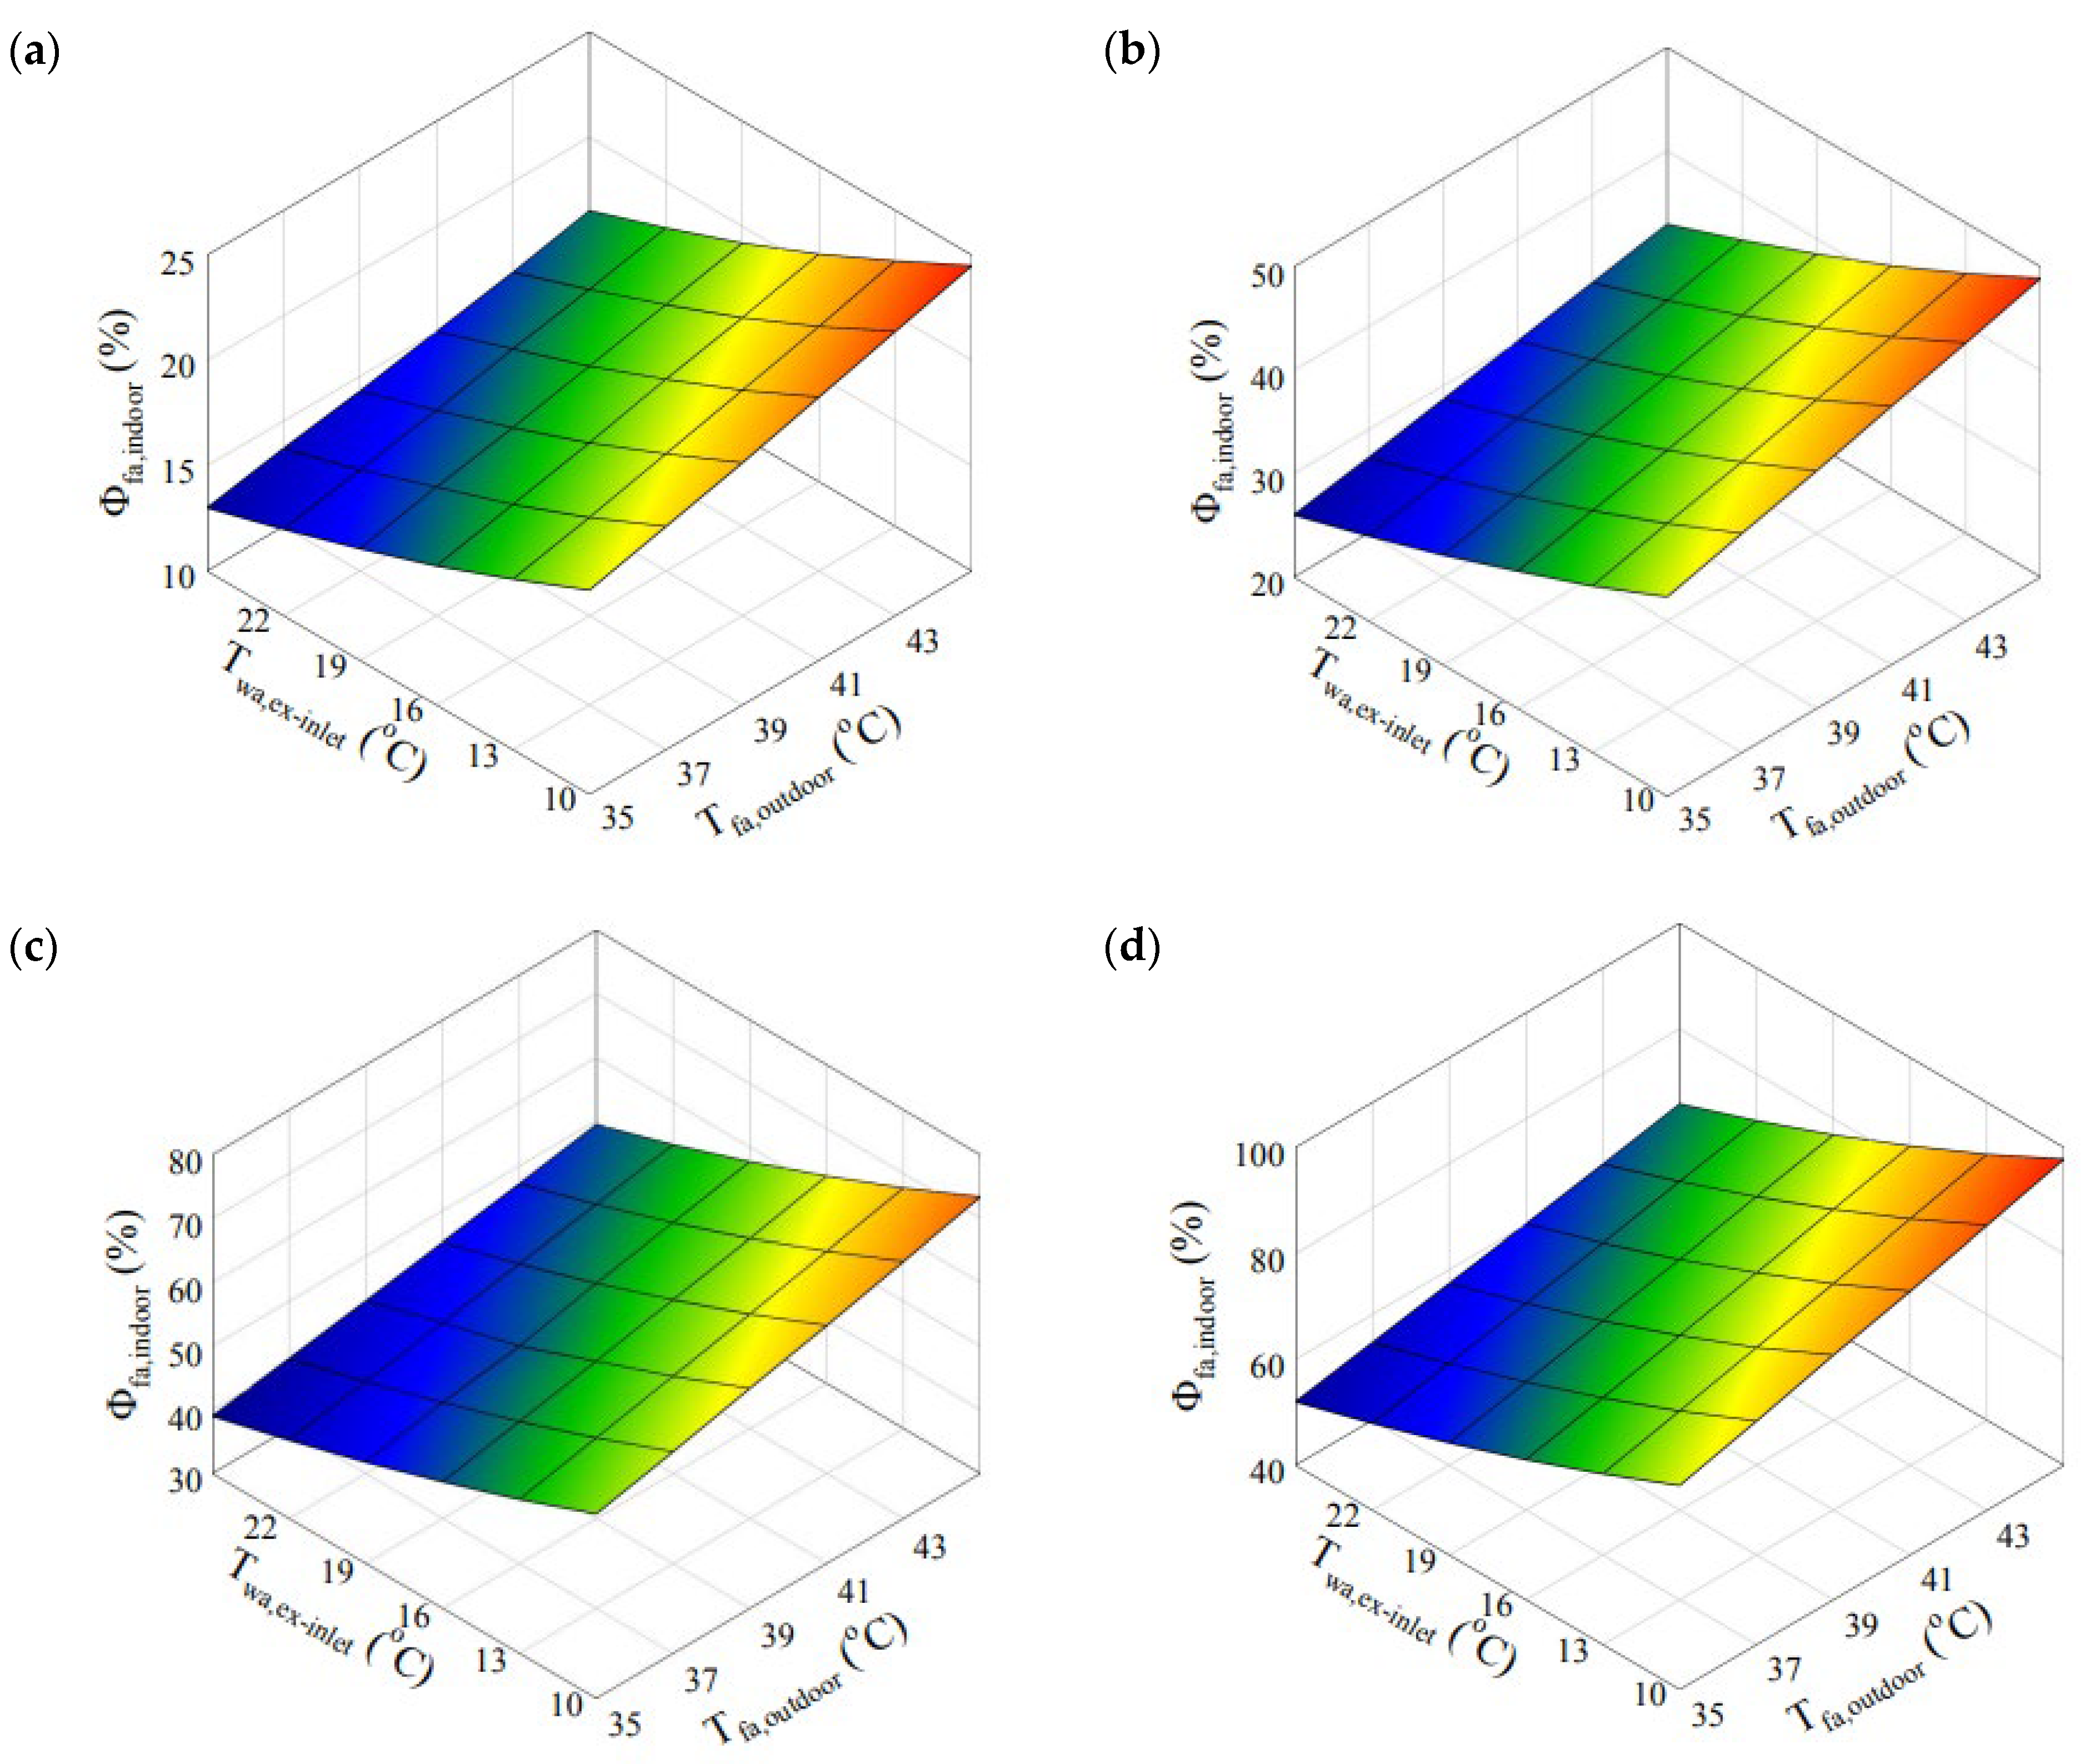
  • The Tout significantly influenced the ϕ within the indoor environment. For instance, assuming ϕ f a , o u t = 40 % , if the Tfa,out exceeded 35 °C, it indicated that ϕ f a , i n may not fall within the thermal comfort range, as demonstrated in this study.

Author Contributions

P.M.C.—Formal Analysis, Methodology, Investigation, Visualization, Validation, Writing—original draft, Writing—review & editing; E.C.—Visualization, Validation, Writing—original draft, Writing—review & editing; S.R.—Project administration, Supervision, Writing—review & editing. All authors have read and agreed to the published version of the manuscript.

Funding

This research received no external funding.

Data Availability Statement

The raw data supporting the conclusions of this article will be made available by the authors on request.

Conflicts of Interest

The authors declare no conflict of interest.

Nomenclature

A: Area [m2]K: Mass transfer coefficient [m/s]
BF: Blowing factorL: Length
c: Specific heat capacity [J/kgK]mf: Mass fraction
D: Diameter [m] m ˙ : Mass flow rate [kg/s]
Dm: Mass diffusivity [m2/s]P: Pressure [Pa]
HVAC: Heating, ventilating and air conditioningRe: Reynolds number
ICES: Indirect-contact evaporative cooling systemu: Thermal energy
PHE: Polycarbonate heat exchangerx: Distance along the duct
Sh: Sherwood numberSc: Schmidt number
T: Temperature [°C]EWV: Evaporated water vapour
MFR: Mass flow rateDC: Direct contact
HT: Heat transfer
SUBSCRIPTS
cor: Correctedlwf: Liquid water film
db: Dry bulbout: Outside
f: Filmsa: Stale air
fa: Fresh airsat: Saturated
h: Hydraulictot: Total
in: Inletw: Water vapour
j: Streamwa: Working air
L: Length [m]wsu: Water-spraying unit
GREEK LETTERS
Φ: relative humidityσ: Constant
ν: Kinematic viscosity [m2/s]ξ: Thermal connection constant
µ: Dynamic viscosity [kg/ms]p: Perimeter [m]
Ω: Constant ρ : Density [kg/m3]
Ψ: Thermal mass flow rate w ¯ : Constant
γ : Overall transfer of heat [W]

References

  1. Zhang, L.; Xu, M.; Chen, H.; Li, Y.; Chen, S. Globalization, green economy and environmental challenges: State of the art review for practical implications. Front. Environ. Sci. 2022, 10, 870271. [Google Scholar] [CrossRef]
  2. Al-Shetwi, A.Q. Sustainable development of renewable energy integrated power sector: Trends, environmental impacts, and recent challenges. Sci. Total Environ. 2022, 822, 153645. [Google Scholar] [CrossRef] [PubMed]
  3. Cuce, P.M.; Cuce, E.; Alvur, E. Internal or external thermal superinsulation towards low/zero carbon buildings? A critical report. Gazi Mühendislik Bilim. Derg. 2024, 9, 435–442. [Google Scholar]
  4. Cuce, E.; Cuce, P.M.; Wood, C.; Gillott, M.; Riffat, S. Experimental Investigation of Internal Aerogel Insulation Towards Low/Zero Carbon Buildings: A Comprehensive Thermal Analysis for a UK Building. Sustain. Clean Build. 2024, 1, 1–22. [Google Scholar]
  5. Akram, M.W.; Hasannuzaman, M.; Cuce, E.; Cuce, P.M. Global technological advancement and challenges of glazed window, facade system and vertical greenery-based energy savings in buildings: A comprehensive review. Energy Built Environ. 2023, 4, 206–226. [Google Scholar] [CrossRef]
  6. Ahmed, A.; Ge, T.; Peng, J.; Yan, W.C.; Tee, B.T.; You, S. Assessment of the renewable energy generation towards net-zero energy buildings: A review. Energy Build. 2022, 256, 111755. [Google Scholar] [CrossRef]
  7. Li, L.; Lin, J.; Wu, N.; Xie, S.; Meng, C.; Zheng, Y.; Wang, X.; Zhao, Y. Review and outlook on the international renewable energy development. Energy Built Environ. 2022, 3, 139–157. [Google Scholar] [CrossRef]
  8. Bertoldi, P.; Economidou, M.; Palermo, V.; Boza-Kiss, B.; Todeschi, V. How to finance energy renovation of residential buildings: Review of current and emerging financing instruments in the EU. Wiley Interdiscip. Rev. Energy Environ. 2021, 10, e384. [Google Scholar] [CrossRef]
  9. Tsemekidi Tzeiranaki, S.; Bertoldi, P.; Diluiso, F.; Castellazzi, L.; Economidou, M.; Labanca, N.; Serrenho, T.R.; Zangheri, P. Analysis of the EU residential energy consumption: Trends and determinants. Energies 2019, 12, 1065. [Google Scholar] [CrossRef]
  10. Drewniok, M.P.; Dunant, C.F.; Allwood, J.M.; Ibell, T.; Hawkins, W. Modelling the embodied carbon cost of UK domestic building construction: Today to 2050. Ecol. Econ. 2023, 205, 107725. [Google Scholar] [CrossRef]
  11. Rashad, M.; Khordehgah, N.; Żabnieńska-Góra, A.; Ahmad, L.; Jouhara, H. The utilisation of useful ambient energy in residential dwellings to improve thermal comfort and reduce energy consumption. Int. J. Thermofluids 2021, 9, 100059. [Google Scholar] [CrossRef]
  12. Cuce, P.M. Thermal performance assessment of a novel liquid desiccant-based evaporative cooling system: An experimental investigation. Energy Build. 2017, 138, 88–95. [Google Scholar] [CrossRef]
  13. Chen, Q.; Ja, M.K.; Burhan, M.; Akhtar, F.H.; Shahzad, M.W.; Ybyraiymkul, D.; Ng, K.C. A hybrid indirect evaporative cooling-mechanical vapor compression process for energy-efficient air conditioning. Energy Convers. Manag. 2021, 248, 114798. [Google Scholar] [CrossRef]
  14. Chang, C.K.; Yih, T.Y.; Othman, Z.B. Performance Assessment of Green Filtration System with Evaporative Cooling to Improve Indoor Air Quality (IAQ). Int. J. Environ. Sci. Dev. 2022, 13, 1–7. [Google Scholar]
  15. Zhou, C.; Hu, Y.; Zhang, L.; Fang, J.; Xi, Y.; Hu, J.; Li, Y.; Liu, L.; Zhao, Y.; Yang, L.; et al. Investigation of heat transfer characteristics of deflected elliptical-tube heat exchanger in closed-circuit cooling towers. Appl. Therm. Eng. 2024, 236, 121860. [Google Scholar] [CrossRef]
  16. Lai, L.; Wang, X.; Kefayati, G.; Hu, E. Evaporative cooling integrated with solid desiccant systems: A review. Energies 2021, 14, 5982. [Google Scholar] [CrossRef]
  17. Blanco-Marigorta, A.M.; Tejero-Gonzalez, A.; Rey-Hernandez, J.M.; Gomez, E.V.; Gaggioli, R. Exergy analysis of two indirect evaporative cooling experimental prototypes. Alex. Eng. J. 2022, 61, 4359–4369. [Google Scholar] [CrossRef]
  18. Mohammed, R.H.; El-Morsi, M.; Abdelaziz, O. Indirect evaporative cooling for buildings: A comprehensive patents review. J. Build. Eng. 2022, 50, 104158. [Google Scholar] [CrossRef]
  19. Shi, W.; Min, Y.; Ma, X.; Chen, Y.; Yang, H. Performance evaluation of a novel plate-type porous indirect evaporative cooling system: An experimental study. J. Build. Eng. 2022, 48, 103898. [Google Scholar] [CrossRef]
  20. Sun, T.; Tang, T.; Yang, C.; Yan, W.; Cui, X.; Chu, J. Cooling performance and optimization of a tubular indirect evaporative cooler based on response surface methodology. Energy Build. 2023, 285, 112880. [Google Scholar] [CrossRef]
  21. Putra, N.; Sofia, E.; Gunawan, B.A. Evaluation of indirect evaporative cooling performance integrated with finned heat pipe and luffa cylindrica fiber as cooling/wet media. J. Adv. Res. Exp. Fluid Mech. Heat Transf. 2021, 3, 16–25. [Google Scholar]
  22. Zhao, X.; Liu, S.; Riffat, S.B. Comparative study of heat and mass exchanging materials for indirect evaporative cooling systems. Build. Environ. 2008, 43, 1902–1911. [Google Scholar] [CrossRef]
  23. Xu, P.; Ma, X.; Zhao, X.; Fancey, K.S. Experimental investigation on performance of fabrics for indirect evaporative cooling applications. Build. Environ. 2016, 110, 104–114. [Google Scholar] [CrossRef]
  24. Maclaine-Cross, I.L.; Banks, P.J. A general theory of wet surface heat exchangers and its application to regenerative evaporative cooling. J. Heat Transf. 1981, 103, 579–585. [Google Scholar] [CrossRef]
  25. Kettleborough, C.F.; Hsieh, C.S. The thermal performance of the wet surface plastic plate heat exchanger used as an indirect evaporative cooler. J. Heat Transf. 1983, 105, 366–373. [Google Scholar] [CrossRef]
  26. Kettleborough, C.F.; Waugaman, D.G.; Johnson, M. The thermal performance of the cross-flow three-dimensional flat plate indirect evaporative cooler. J. Energy Resour. Technol. 1992, 114, 181–186. [Google Scholar] [CrossRef]
  27. Wassel, A.T.; Mills, A.F. Design methodology for a counter-current falling film evaporative condenser. J. Heat Transf. 1987, 109, 784–787. [Google Scholar] [CrossRef]
  28. Hsu, S.T.; Lavan, Z.; Worek, W.M. Optimization of wet surface heat exchanger. Energy 1989, 14, 757–770. [Google Scholar] [CrossRef]
  29. Erens, P.J.; Dreyer, A.A. Modelling of indirect evaporative air coolers. Int. J. Heat Mass Transf. 1993, 36, 17–26. [Google Scholar] [CrossRef]
  30. Tsay, Y.L. Analysis of heat and mass transfer in a countercurrent-flow wet surface heat exchanger. Int. J. Heat Fluid Flow 1994, 15, 149–156. [Google Scholar] [CrossRef]
  31. Guo, X.C.; Zhao, T.S. A parametric study of an indirect evaporative air cooler. Int. Commun. Heat Mass Transf. 1998, 25, 217–226. [Google Scholar] [CrossRef]
  32. Halasz, B. A general mathematical model of evaporative cooling devices. Rev. Générale De Therm. 1998, 37, 245–255. [Google Scholar] [CrossRef]
  33. Riffat, S.B.; Zhu, J. Mathematical model of indirect evaporative cooler using porous ceramic and heat pipe. Appl. Therm. Eng. 2004, 24, 457–470. [Google Scholar] [CrossRef]
  34. Adam, A.; Han, D.; He, W.; Amidpour, M.; Zhong, H. Numerical investigation of the heat and mass transfer process within a cross-flow indirect evaporative cooling system for hot and humid climates. J. Build. Eng. 2022, 45, 103499. [Google Scholar] [CrossRef]
  35. Belarbi, R.; Ghiaus, C.; Allard, F. Modeling of water spray evaporation: Application to passive cooling of buildings. Sol. Energy 2006, 80, 1540–1552. [Google Scholar] [CrossRef]
  36. Crafton, E.F.; Black, W.Z. Heat transfer and evaporation rates of small liquid droplets on heat horizontal surfaces. Int. J. Heat Mass Transf. 2004, 47, 1187–1200. [Google Scholar] [CrossRef]
  37. Kaiser, A.S.; Lucas, M.; Viedma, M.; Zamora, B. Numerical model of evaporative cooling processes in a new type of cooling tower. Int. J. Heat Mass Transf. 2005, 48, 986–999. [Google Scholar] [CrossRef]
  38. Maheshwari, G.P.; Al-Ragom, F.; Suri, R.K. Energy-saving potential of an indirect evaporative cooler. Appl. Energy 2001, 69, 69–76. [Google Scholar] [CrossRef]
  39. Falkovich, G. Fluid Mechanics; Cambridge University Press: Cambridge, UK, 2011. [Google Scholar]
  40. Cengel, Y.A.; Ghajar, A.J. Heat and Mass Transfer: Fundamentals & Applications, 4th ed.; The McGraw-Hill Companies: New York, NY, USA, 2011. [Google Scholar]
  41. Frossling, N. Uber die Verdunstung fallender Tropfen. Gerlands Beitr. Geophysik 1938, 52, 170–216. [Google Scholar]
  42. Bolz, R.E.; Tuve, G.L. Handbook of Tables for Applied Engineering Sciemce, 2nd ed.; CRC Press: New York, NY, USA, 1976. [Google Scholar]
Figure 1. A comprehensive diagram illustrating a counter-flow ICES.
Buildings 14 00994 g001
Figure 2. A residence designated for testing purposes located in the southeastern region of the UK.
Buildings 14 00994 g002
Figure 3. Square-shaped channels of the heat exchange unit for the warm and cold flows.
Buildings 14 00994 g003
Figure 4. Square-shaped channels of the heat exchange model for the warm as well as cold flows.
Buildings 14 00994 g004
Figure 5. Illustration of the suggested ICES setup.
Buildings 14 00994 g005
Figure 6. (a) Merged impacts of Lwsu and Dh onto the quantity of EWV. (b) Collective influence of Lwsu and the vwa on the quantity of EWV. (c) Joint effects of Dh and vwa on the quantity of EWV.
Buildings 14 00994 g006
Figure 7. (a) Depicting the variation in the size of the WSU, the Tdb and the ϕ of the WA at the exit of the WSU concerned a temperature of 17 °C, (b) at 20 °C, (c) at 23 °C, (d) at 26 °C and (e) 29 °C.
Buildings 14 00994 g007aBuildings 14 00994 g007b
Figure 8. (a) As influenced by Dh, the Tdb and the ϕwa at the WSU exit concerned T w a , i n at 17 °C, (b) at 20 °C, (c) at 23 °C, (d) at 26 °C and (e) 29 °C.
Buildings 14 00994 g008aBuildings 14 00994 g008b
Figure 9. (a) In relation to the velocity of the WA, the Tdb and the ϕwa at the exit of the WSU concerned T w a , i n at 17 °C, (b) at 20 °C, (c) at 23 °C, (d) at 26 °C and (e) 29 °C.
Buildings 14 00994 g009aBuildings 14 00994 g009b
Figure 10. The inlet temperature of fresh air was influenced by both the Tfa,out and the Twa,in of the PHE.
Buildings 14 00994 g010
Figure 11. (a) ϕ f a , i n by ϕ f a , o u t , as well as WA temperature at the exchanger inlet at ϕ f a , o u t = 10 % (b) at ϕ f a , o u t = 20 % , (c) at ϕ f a , o u t = 30 % , (d) at ϕ f a , o u t = 40 % .
Buildings 14 00994 g011
Table 1. Measurements of the elements in the experimental residence.
Trial ResidenceComponents
ExteriorInteriorWindowsVelux WindowDoor
Size (m)76.71.20.751.5
Width (m)32.70.10.10.1
Height (m)4.32.45–3.310.92.05
Table 2. Specifications regarding the size of the polycarbonate heat exchanger.
Heat Exchange PlateWall Thickness (mm)
Size (m)Width (m)Depth (m)UpperCentralLower
1.70.4250.010.80.20.8
Disclaimer/Publisher’s Note: The statements, opinions and data contained in all publications are solely those of the individual author(s) and contributor(s) and not of MDPI and/or the editor(s). MDPI and/or the editor(s) disclaim responsibility for any injury to people or property resulting from any ideas, methods, instructions or products referred to in the content.

