Article

Risk Analysis and Simulation of Large Bridge Construction Based on System Dynamics

College of Architectural Engineering, North China Institute of Aerospace Engineering, Langfang 065000, China
*
Author to whom correspondence should be addressed.
Buildings 2024, 14(5), 1488; https://doi.org/10.3390/buildings14051488
Submission received: 16 January 2024 / Revised: 11 May 2024 / Accepted: 11 May 2024 / Published: 20 May 2024
(This article belongs to the Section Construction Management, and Computers & Digitization)

Abstract

:
To reduce risk incidents in large bridge construction, it is necessary to study the interaction mechanisms and dynamic changes among various risk factors during the construction of large bridges. First, the evolution mechanism of construction risks for large bridges is analyzed, and a risk factor structure system is established. Then, based on system dynamics theory, a causal loop diagram and flow–stock diagram are constructed, and system dynamics equations for each variable in the flow diagram are established to build a system dynamics model. Finally, taking a large bridge construction project as an example, the variable equations are assigned actual values, and the construction risk level is simulated and analyzed. The results show that, ➀ continuous investment in safety funds can effectively reduce the overall risk level of the system, ➁ changes in the management risk subsystem have a significant impact on the overall risk level of large bridge construction, and ➂ increasing the safety investment ratio in both the personnel risk subsystem and the management risk subsystem can effectively reduce the total risk level of the system.

1. Introduction

With the rapid growth of the national economy, China’s bridge construction industry has experienced unprecedented development. Due to the large scale and complex technical requirements of bridge projects, along with the continuous increase in spans and the introduction of new structures, materials, and technologies, bridges harbor many uncertainties and associated risk sources during construction, increasing the difficulty of risk management [1,2,3]. In recent years, reports of safety incidents during bridge construction, both domestically and internationally, have attracted significant societal attention. Therefore, to reduce construction risk incidents and effectively control project quality, it is imperative to conduct systematic research on risks during bridge construction [4,5].
Scholars both domestically and internationally have conducted in-depth studies on the safety risks of bridge construction from perspectives such as structure, schedule, and management using various methods. Feng et al. [6] proposed an enhanced Probability Density Evolution Method (PDEM) framework that considers multiple failure modes and limit states for the reliability analysis of structures. Cao et al. [7] assessed the dynamic and probabilistic seismic performances of precast, prestressed, reinforced concrete frames, taking into account the influence of the slab on the overall structural behavior during the process. Yuan Hongchuan et al. [8] evaluated the safety risks of bridge construction using an improved cloud model combined with the uncertain AHP method and set pair analysis. Yuan Jianbo et al. [9] established a safety risk assessment model for highway bridge construction using network analysis and validated its scientific rationality with construction cases. Wang Lei et al. [10] conducted a safety risk assessment of the substructures of bridges in loess mountainous gully terrain using the Analytic Hierarchy Process–Fuzzy Comprehensive Evaluation and proposed safety risk control measures. Tang Tianming et al. [11] assessed the safety risks of the Wuhan Qingshan Yangtze River Highway Bridge during construction using the LEC safety evaluation method and proposed corresponding risk control measures. Zhu Zhibao et al. [12] conducted a risk assessment of each construction unit of the Strait Bridge using the WBS-RBS method combined with fuzzy hierarchy synthesis. Pang Weiying et al. [13] established a risk evaluation index system for large-span bridge construction, then assessed the risks of Tonghai Bridge using the Analytic Hierarchy Process and grey clustering, determining its risk level.
The existing literature, employing a range of methods, has extensively covered different aspects of bridge construction risk, yielding a wealth of experience. Currently, research on the risk of large bridge construction primarily involves estimating risk values and subsequently conducting safety risk assessments based on these values, without examining the changes in system safety risk values throughout the construction process. In other words, most existing risk evaluation models are static, neglecting the impact of interactions and dynamic development among various risk factors within the risk system [14]. Commonly used risk evaluation methods are more suited to assessing static systems and exhibit certain limitations when applied to dynamic and evolving risk systems. Therefore, how to comprehensively consider the coupling relationships among various risk factors and apply a systematic, dynamic approach to the risk evaluation of large bridge construction is an urgent problem that needs to be addressed [15].
System dynamics is a discipline that analyzes and studies information feedback systems. The approach of system dynamics is to explore how to understand and solve problems through a cross-disciplinary and integrative method [16]. In dealing with complex system issues, system dynamics often employs a method that combines qualitative and quantitative analysis. It is a constructive analytical method that emphasizes the system’s structure, the mechanism of behavior generation, the expression of control, and the constraints of causality. Therefore, system dynamics is particularly suited to studying large bridge construction risk systems characterized by their complexity, dynamism, and time variability [17,18].
This paper begins by applying risk management theory to analyze the evolution mechanism of construction risks for large bridges, identify risk factors, and establish a risk factor structure system. Following this, an analysis of the identified risk factors is conducted using system dynamics theory. The paper then utilizes Vensim PLE 7.3.5 software to create causal loop diagrams and stock-and-flow diagrams for the risk system of large bridge construction, establishes system dynamics equations for each variable in the flow diagram, and constructs a system dynamics model. Finally, using a large bridge construction project as a case study, the paper assigns real-world values to the variable equations based on engineering information and data processing to simulate and assess the construction risk level of large bridges.

2. Risk Factor Analysis for Large Bridge Construction

2.1. Construction Risk Evolution Mechanism Analysis

The environment at large bridge construction sites is complex and constantly changing, with numerous uncertainties present throughout the construction process. These uncertainties contribute to a variety of risk factors. Moreover, the construction of large bridges typically involves extended timelines. Throughout these periods, the various risk factors continuously interact and evolve, making the construction process one characterized by dynamic risk changes [19,20].
According to accident causation theory, the occurrence of risk accidents in large bridge construction is primarily the result of the continuous evolution of unsafe human actions and unsafe conditions of objects under the combined effects of adverse environments and management defects. For example, during the foundation construction process of bridges, sudden changes in hydrogeological conditions may lead to alterations in construction plans and machinery, further impacting the schedule and quality [21]. The construction process of the bridge’s superstructure is complex and laborious; errors in monitoring schemes and data processing can affect structural and alignment control [22]. Construction quality defects and casualties caused by the technical level of personnel and their fatigue level will elevate the risk level of construction projects [23].
In the area of bridge seismic design, multiple advanced techniques have been introduced to enhance the structural safety of bridges. For instance, Wang et al. [24] investigated the use of Buckling-Restrained Braces (BRBs) in three-span RC bridges, demonstrating that BRBs have significant potential to improve the earthquake resistance of bridges. Furthermore, research by Kaviani et al. [25] revealed that the inclination angle of a bridge significantly affects its behavior during earthquakes, providing crucial insights for bridge design. Lastly, Vincenzo Gattulli et al. [26] applied a variety of dynamic tests to determine the dynamic properties of multi-span concrete arch bridges, thereby enhancing the model’s precision and reliability. Their findings offer essential theoretical and practical guidance for ensuring safety in bridge construction.
This expanded analysis incorporates a broader range of factors, including advanced technological applications, which can provide a more comprehensive understanding of the risks involved in large bridge construction. This approach ensures that both the dynamic nature of risk factors and the influence of innovative construction techniques are thoroughly addressed in the risk management process.

2.2. Risk Factor Identification

This paper, based on the analysis of the evolution mechanism of significant bridge construction risk and the summary of previous research results, combined with the statistics of bridge construction accidents in recent years and the requirements of industry norms and standards for the identification and categorization of construction risk factors, establishes the structure of risk factors for the construction of large bridges, as shown in Figure 1. The structural system is divided into three layers. The first layer is the total risk of large-scale bridge construction. If analyzed from the perspective of systems engineering, the entire risk of the building can be viewed as a complex risk system, which can be further divided into personnel risk, equipment and material risk, investigation and design risk, construction monitoring risk, environmental risk, and management risk, for a total of six sub-systems that constitute the second layer, and the third layer of the six risk sub-systems includes the specific risk factors, totaling 31. The set of each risk subsystem can be denoted as A = {A1, A2, …, An}, with Ai being the i-th subsystem, and the set of risk factors can be represented as Ai = {Ai1, Ai2, …, Aim}, with Aij being the j-th risk factor in the i-th subsystem.

3. System Dynamics Modelling of Large Bridge Construction Risks

3.1. Boundary Determination and Underlying Assumptions

This paper focuses on the construction risk of large bridges as its research subject. It categorizes these risks into six subsystems, including personnel risk and its system dynamics model boundary. Based on risk factor analysis, the following modeling assumptions are established.
Hypothesis 1. 
Using large-scale bridge construction as the foundation, personnel, equipment and materials, investigation and design, construction monitoring, environment, and management are identified as endogenous variables. The analysis focuses solely on the interactions between internal factors of the system, while other variables are treated as exogenous and are excluded from consideration.
Hypothesis 2. 
Scenarios that omit consideration of system collapse due to force majeure factors, such as political unrest and earthquakes, are excluded from this analysis.
Hypothesis 3. 
While managers have partial control over the system, they are unable to completely mitigate the impact of other risk factors.

3.2. Causal Loop Diagrams and Flow Diagrams Based on System Dynamics

Based on the analysis of prominent risk factors in bridge construction, the causal relationships between each risk factor are established. A causal loop diagram is then illustrated using Vensim PLE 7.3.5 software, as depicted in Figure 2. To enhance the academic nature, readability, and logical consistency of the model, this study adopts a standardized variable-naming convention. Specifically, horizontal variables are named using uppercase letters prefixed with “S,” while rate variables are prefixed with “R.” Auxiliary variables are named using “I” as a prefix.
As seen in Figure 2, the total risk of large-scale bridge construction is the sum of six subsystem risks, including personnel risk. The causal loop diagram for significant bridge construction risk evolution contains 18 feedback loops. In Figure 2, three positive feedback loops are marked with a “+” symbol, indicating that each risk factor escalates the construction risk level through the self-reinforcing effect of these loops. Figure 2 shows 15 negative feedback loops, denoted by a “−” symbol, which suggest that the system’s risk level is mitigated and stabilized through increased safety measures. For instance, increased investment in personnel safety has led to a higher rate of certified special operators, thus reducing personnel risk. The escalation of management safety efforts has helped moderate the risk associated with large-scale bridge construction, as depicted in the causal loop diagram. The dynamic flow diagram model of the large- scale bridge construction risk system, created using Vensim PLE 7.3.5 software, is illustrated in Figure 3.
In the large bridge construction risk system dynamics model developed in this paper, there are 76 variables, comprising 6 level variables, 6 rate variables, 59 auxiliary variables, and 5 constants. The main model variables are outlined in Table 1.

3.3. Establishment of System Dynamics Equations

Let the set of weights W = {W1, W2, …, Wn} correspond to each set of risk subsystems A = {A1, A2, …, An} in Figure 1, with Wi being the weight of the i-th subsystem, and the set of weights Wi = {Wi1, Wi2, … Wim} correspond to the location of risk factors Ai = {Ai1, Ai2, …, Aim}, with Wij being the value of weight of the j-th risk factor in the i-th subsystem. In the set of safety input proportions P = {P1, P2, …, Pn}, Pi is the proportion of inputs accounted for by the i-th subsystem. In the subsystem initial assignment set L0 = {L01, L02, …, Ln}, Li is the initial assignment of the i-th subsystem.
Based on the system dynamics, the SD equations are established as follows:
1. Total risk of large bridge construction
I1 = S1 × W1 + S2 × W2 + S3 × W3 + S4 × W4 + S5 × W5 + S6 × W6.
2. Horizontal variable equation
(1) S1= INTEG (R1, L01).
(2) S2 = INTEG (R2, L02).
(3) S3 = INTEG (R3, L03).
(4) S4 = INTEG (R4, L04).
(5) S5 = INTEG (R5, L05).
(6) S6 = INTEG (R6, L06).
3. Rate variable equation
(1) R1 = I2 × W11 + I3 × W12 + I4 × W13 + I5 × W14.
(2) R2 = I6 × W21 + I7 × W22 + I11 × W23 + I9 × W24 + I10 × W25 + I8 × W26.
(3) R3 = I16 × W31 + I17 × W32 + I13 × W33 + I12 × W34 + I15 × W35 + I14 × W36.
(4) R4 = I21 × W41 + I19 × W42 + I18 × W43 + I23 ×W44 + I22 × W45 + I20 × W46.
(5) R5 = I28 × W51 + I26 × W52 + I24× W53 + I27 × W54 + I25 × W55.
(6) R6 = I29 × W61 + I30 × W62 + I31 × W63 + I33 × W64.
4. Auxiliary variable equations
(1) I2 = Rate of Change in I2 per Time Step − I34 × P1 × Conversion Rate to I2.
(2) I3 = Rate of Change in I3 per Time Step − I34 × P1 × Conversion Rate to I3.
(3) I4 = Rate of Change in I4 per Time Step − I34 × P1 × Conversion Rate to I4.
(4) I5 = Rate of Change in I5 per Time Step − I34 × P1 × Conversion Rate to I5.
(5) I6 = Rate of Change in I6 per Time Step − I34 × P2 × Conversion Rate to I6.
(6) I7 = Rate of Change in I7 per Time Step − I34 × P2 × Conversion Rate to I7.
(7) I8 = Rate of Change in I8 per Time Step − I34 × P2 × Conversion Rate to I8.
(8) I9 = Rate of Change in I9 per Time Step − I34 × P2 × Conversion Rate to I9.
(9) I10 = Rate of Change in I10 per Time Step − I34 × P2 × Conversion Rate to I10.
(10) I11 = Rate of Change in I11 per Time Step − I34 × P2 × Conversion Rate to I11.
(11) I12 = Rate of Change in I12 per Time Step − I34 × P3 × Conversion Rate to I12.
(12) I13 = Rate of Change in I13 per Time Step − I34 × P3 × Conversion Rate to I13.
(13) I14 = Rate of Change in I14 per Time Step − I34 × P3 × Conversion Rate to I14.
(14) I15 = Rate of Change in I15 per Time Step − I34 × P3 × Conversion Rate to I15.
(15) I16 = Rate of Change in I16 per Time Step − I34 × P3 × Conversion Rate to I16.
(16) I17 = Rate of Change in I17 per Time Step − I34 × P3 × Conversion Rate to I17.
(17) I18 = Rate of Change in I18 per Time Step − I34 × P4 × Conversion Rate to I18.
(18) I19 = Rate of Change in I19 per Time Step − I34 × P4 × Conversion Rate to I19.
(19) I20 = Rate of Change in I20 per Time Step − I34 × P4 × Conversion Rate to I20.
(20) I21 = Rate of Change in I21 per Time Step − I34 × P4 × Conversion Rate to I21.
(21) I22 = Rate of Change in I22 per Time Step − I34 × P4 × Conversion Rate to I22.
(22) I23 = Rate of Change in I23 per Time Step − I34 × P4 × Conversion Rate to I23.
(23) I24 = Rate of Change in I24 per Time Step − I34 × P5 × Conversion Rate to I24.
(24) I25 = Rate of Change in I25 per Time Step − I34 × P5 × Conversion Rate to I25.
(25) I26 = Rate of Change in I26 per Time Step − I34 × P5 × Conversion Rate to I26.
(26) I27 = Rate of Change in I27 per Time Step − I34 × P5 × Conversion Rate to I27.
(27) I28 = Rate of Change in I28 per Time Step − I34 × P5 × Conversion Rate to I28.
(28) I29 = Rate of Change in I29 per Time Step − I34 × P6 × Conversion Rate to I29.
(29) I30 = Rate of Change in I30 per Time Step − I34 × P6 × Conversion Rate to I30.
(30) I31 = Rate of Change in I31 per Time Step − I34 × P6 × Conversion Rate to I31.
(31) I33 = Rate of Change in I33 per Time Step − I34 × P6 × Conversion Rate to I33.

4. Construction Risk Simulation for Large Bridges

4.1. Project Case Overview

This paper conducts an empirical study using a river-crossing bridge. The main bridge features a pre-stressed concrete continuous rigid structure with separate widths for up-and-down lanes, a cross slope on the box girder’s top surface, a horizontal bottom, and C55 concrete material. The superstructure employs a suspension-casting continuous rigid frame, the central pier comprises a double thin-walled dock on a pile foundation, and the transition pier utilizes a column pier foundation. Key technical standards include: a Class I highway classification with six lanes in each direction, a Class I design load, a 100-year design base period and service life, a Class I structural design safety level, and a Class II environment for the project area.
The main body of the bridge is modeled as illustrated in Figure 4:

4.2. Parameter Determination and Variable Assignment

Many parameters are involved in the modelling process, some of which are difficult to determine. This paper ascertains the parameter values based on the actual data of bridge construction safety-related indexes, integrating relevant cases, referencing laws and regulations, standards, and norms related to bridge construction safety, and utilizing survey and statistical methods, expert scoring, and so forth. Due to the different units and the variations in the magnitude of the bridge construction evaluation metrics, it is challenging to make direct comparisons. Hence, the dimensionless quantification of the indicator is determined. So, let Mj = maxi(xij) and mj = mini(xij). Thus, x*ij = (xijmj)/(Mjmj) is dimensionless, and x*ij ∈ [0, 1]. When mj = 0 (j = 1,2, …,m), we have x*ij = xij/Mj.
The large bridge construction risk system dynamics model was modelled in Week, with the basic parameters set to FINAL TIME = 60, INITIAL TIME = 0, and TIME STEP = 1.
(1) Determination of variable weights
In this paper, we initially utilize the expert scoring method to obtain the relative importance scale value between each risk factor depicted in Figure 1, and subsequently employ the hierarchical analysis method to ascertain the weight of each risk factor. The results are displayed in Table 2.
(2) Determination of initial values of risk subsystem-level variables
After determining the weights of the indicators, it is also necessary to set the initial values of the variables. Most of the variables in the model are qualitative, and it is impossible to determine the actual data by reviewing historical information. Therefore, based on the documents related to bridge construction safety and the actual construction situation, the risk subsystem-level variables were evaluated by the expert scoring method to determine the initial assigned values of each subsystem, and the results are displayed in Table 3.
(3) Determination of the proportion of inputs
By considering safety inputs as system inputs and categorizing them into personnel safety inputs, equipment and material safety inputs, survey and design safety inputs, construction monitoring safety inputs, environmental safety inputs, and management safety inputs, the proportion of sub-system safety inputs is calculated as sub-system safety inputs/total safety inputs × 100%. Based on the above analyses and the actual safety inputs for large bridge construction, each subsystem’s proportion of safety inputs is presented in Table 4.
(4) Determination of the amount of risk change per unit time step
Based on on-site surveys, relevant data, and the research results of other scholars, and in consideration of the criteria for classifying the risk and accident rate into orders of magnitude, the accident rate, the average number of working days per week, and the number of hours per day of exposure to the risk factors for each risk factor were determined by the experts. Then, the accident probability formula was utilized to calculate the amount of risk change per unit time step for each risk factor. The accident probability formula is displayed in Equation (1), and the calculation results are displayed in Table 5.
c = λt
where c is the change in risk per unit time step, λ is the accident rate, and t is the number of hours of exposure per week.
Since the impact of extreme climate on the risk level of the system varies over time, for example, the rainy season is prone to disasters such as heavy rainfall and flooding, while the winter is susceptible to disasters such as raw snowstorms and cold snaps, the shadow variable <Time> was incorporated into the system and a table function was established to model the values of these factors, and the results are as follows:
Extreme Severe Climate=WITH LOOKUP(Time,
([(0,0)-(36,0.01)],(0,0.009),(6,0.0081353),(12,0.0095619),(18,0.0067812),(20,0.0076941),(24,0. 0055164),(28,0.00472313),(30, 0.00319956),(32,0.00258793),(36,0.00129811)))
(5) Determination of input conversion rates
Construction personnel’s safety awareness, equipment repair and maintenance, and safety education and training, among other factors, will see a reduction in risk values with an increase in safety inputs and unit safety inputs, thereby decreasing the risk values of these factors. The conversion rate of safety inputs changes over time, as the level of each element decreases differently within each time step due to variations in implementation, etc. This paper established the input conversion rate as a table function. After evaluating the risk values of each factor at a unit step, the reduction was then divided by the actual safety inputs in the time step to calculate the safety input conversion rate for a unit time step, and the specific results are as follows:
Conversion rate of inputs to licensed special operators
=WITHLOOKUP(Time,([(0,0)-(36,0.022)],(0,0.003),(6,0.0103521),(12,0.0138147),(18,0.0145662),(20,0.0154558),(24,0.0159881),(28,0.0151247),(30,0.0143387),(32,0.0139223),(36,0.0155568)))
Translation of inputs into the susceptibility of construction personnel to fatigue
=WITHLOOKUP(Time,([(0,0)-(36,0.04)],(0,0.0367574),(6,0.0251156),(12,0.0232783),(18,0.0202517),(20,0.0253795),(24,0.0267431),(28,0.0228375),(30,0.0257712),(32,0.0256675),(36,0.0253747)))
Conversion rate of inputs to safety awareness among construction personnel
=WITHLOOKUP(Time,([(0,0)-(36,0.03)],(0,0.005),(6,0.00317435),(12,0.0023677),(18,0.0203514),(20,0.0225118),(24,0.002769),(28,0.00263352),(30,0.00259612),(32,0.00245647),(36,0.00298337)))
Translation of inputs into professional skill proficiency
=WITHLOOKUP(Time,([(0,0)-(36,0.04)],(0,0.0375329),(6,0.0267412),(12,0.0243368),(18,0.0216857),(20,0.0225118),(24,0.0245773),(28,0.0262265),(30,0.0202541),(32,0.0236113),(36,0.0273625)))
The conversion rate of inputs to safety controls for mounting and dismounting large equipment
=WITHLOOKUP(Time,([(0,0)-(36,0.01)],(0,0.00091225),(6,0.00136334),(12,0.00146783),(18,0.00143754),(20,0.00158776),(24,0.00141125),(28,0.00140171),(30,0.0015897),(32,0.0015452),(36,0.00131156)))
Conversion rate of inputs to the availability of safety guards
=WITHLOOKUP(Time,([(0,0)-(36,0.01)],(0,0.00101423),(6,0.00145783),(12,0.00159271),(18,0.00155412),(20,0.00169574),(24,0.00152886),(28,0.00151091),(30,0.0015675),(32,0.0015519),(36,0.00142258)))
Conversion rate of inputs to repair and maintenance of equipment
=WITHLOOKUP(Time,([(0,0)-(36,0.01)],(0,0),(6,0.00681342),(12,0.00636157),(18,0.00517825),(20,0.00534769),(24,0.0057586),(28,0.00581321),(30,0.00579332),(32,0.00503664),(36,0.00492845)))
The conversion rate of inputs to design detached from the field
=WITHLOOKUP(Time,([(0,0)-(36,0.01)],(0,0.0014233),(6,0.00114753),(12,0.00102754),(18,0.00125761),(20,0.0011779),(24,0.00108356),(28,0.00116554),(30,0.00119814),(32,0.00121127),(36,0.00123563)))
The conversion rate of inputs to under-survey and forecast errors
=WITHLOOKUP(Time,([(0,0)-(36,0.01)],(0,0.0016237),(6,0.00133453),(12,0.00127312),(18,0.00135715),(20,0.00139826),(24,0.0012432),(28,0.00133774),(30,0.00138532),(32,0.00141252),(36,0.00145337)))
Conversion rate of inputs to stress and line control
=WITHLOOKUP(Time,([(0,0)-(36,0.01)],(0,0.0015446),(6,0.00123374),(12,0.00116625),(18,0.00121123),(20,0.00128735),(24,0.00117341),(28,0.0012583),(30,0.00127443),(32,0.00132548),(36,0.00134531)))
The conversion rate of inputs to prestressing tensioning construction
=WITHLOOKUP(Time,([(0,0)-(36,0.01)],(0,0.0015446),(6,0.00123374),(12,0.00116625),(18,0.00121123),(20,0.00128735),(24,0.00117341),(28,0.0012583),(30,0.00127443),(32,0.00132548),(36,0.00134531)))
Conversion rate of inputs to the construction of the cohesive section
=WITHLOOKUP(Time,([(0,0)-(36,0.01)],(0,0.0014324),(6,0.00112877),(12,0.00103376),(18,0.00117428),(20,0.00117641),(24,0.00106276),(28,0.00127843),(30,0.00115387),(32,0.00131125),(36,0.0012115)))
Conversion rate of inputs to monitoring programs
=WITHLOOKUP(Time,([(0,0)-(36,0.01)],(0,0.0015475),(6,0.00125641),(12,0.00115811),(18,0.00126635),(20,0.00123799),(24,0.00117882),(28,0.00137668),(30,0.00124483),(32,0.00145526),(36,0.0013577)))
Conversion rate of inputs to monitoring data feedback and processing
=WITHLOOKUP(Time,([(0,0)-(36,0.04)],(0,0.00351573),(6,0.00214846),(12,0.0019776),(18,0.00231841),(20,0.00236885),(24,0.00248112),(28,0.00227156),(30,0.0024587),(32,0.00261819),(36,0.00273355)))
Conversion rate of inputs to road traffic conditions
=WITHLOOKUP(Time,([(0,0)-(36,0.04)],(0,0),(6,0.0305117),(12,0.0279386),(18,0.0265351),(20,0.0321672),(24,0.0336936),(28,0.03711483),(30,0.0362543),(32,0.0387543),(36,0.0395127)))
Conversion rate of inputs to environment homework assignments
=WITHLOOKUP(Time,([(0,0)-(36,0.04)],(0,0),(6,0.0314257),(12,0.02882145),(18,0.0274252),(20,0.0311936),(24,0.0325873),(28,0.03544129),(30,0.037985),(32,0.0363784),(36,0.0377965)))
Conversion rate of frequency of safety inspections invested in construction sites
=WITHLOOKUP(Time,([(0,0)-(36,0.02)],(0,0.0138533),(6,0.012532),(12,0.0098665),(18,0.0103835),(20,0.0095411),(24,0.011386),(28,0.0103577),(30,0.0103258),(32,0.0112293),(36,0.0123819)))
Conversion rate of inputs to the delivery of security education and training
=WITHLOOKUP(Time,([(0,0)-(36,0.02)],(0,0.0147597),(6,0.013174),(12,0.010296),(18,0.0114759),(20,0.0102455),(24,0.012478),(28,0.0112411),(30,0.0114792),(32,0.0123163),(36,0.0134595)))
Security inputs
=WITHLOOKUP(Total risk level for construction of large bridges,([(0,0)-(1,100)],(0,0),(0.2,20),(0.4,50),(0.6,80),(0.8,90),(1,100)))

4.3. Model Simulation and Result Analysis

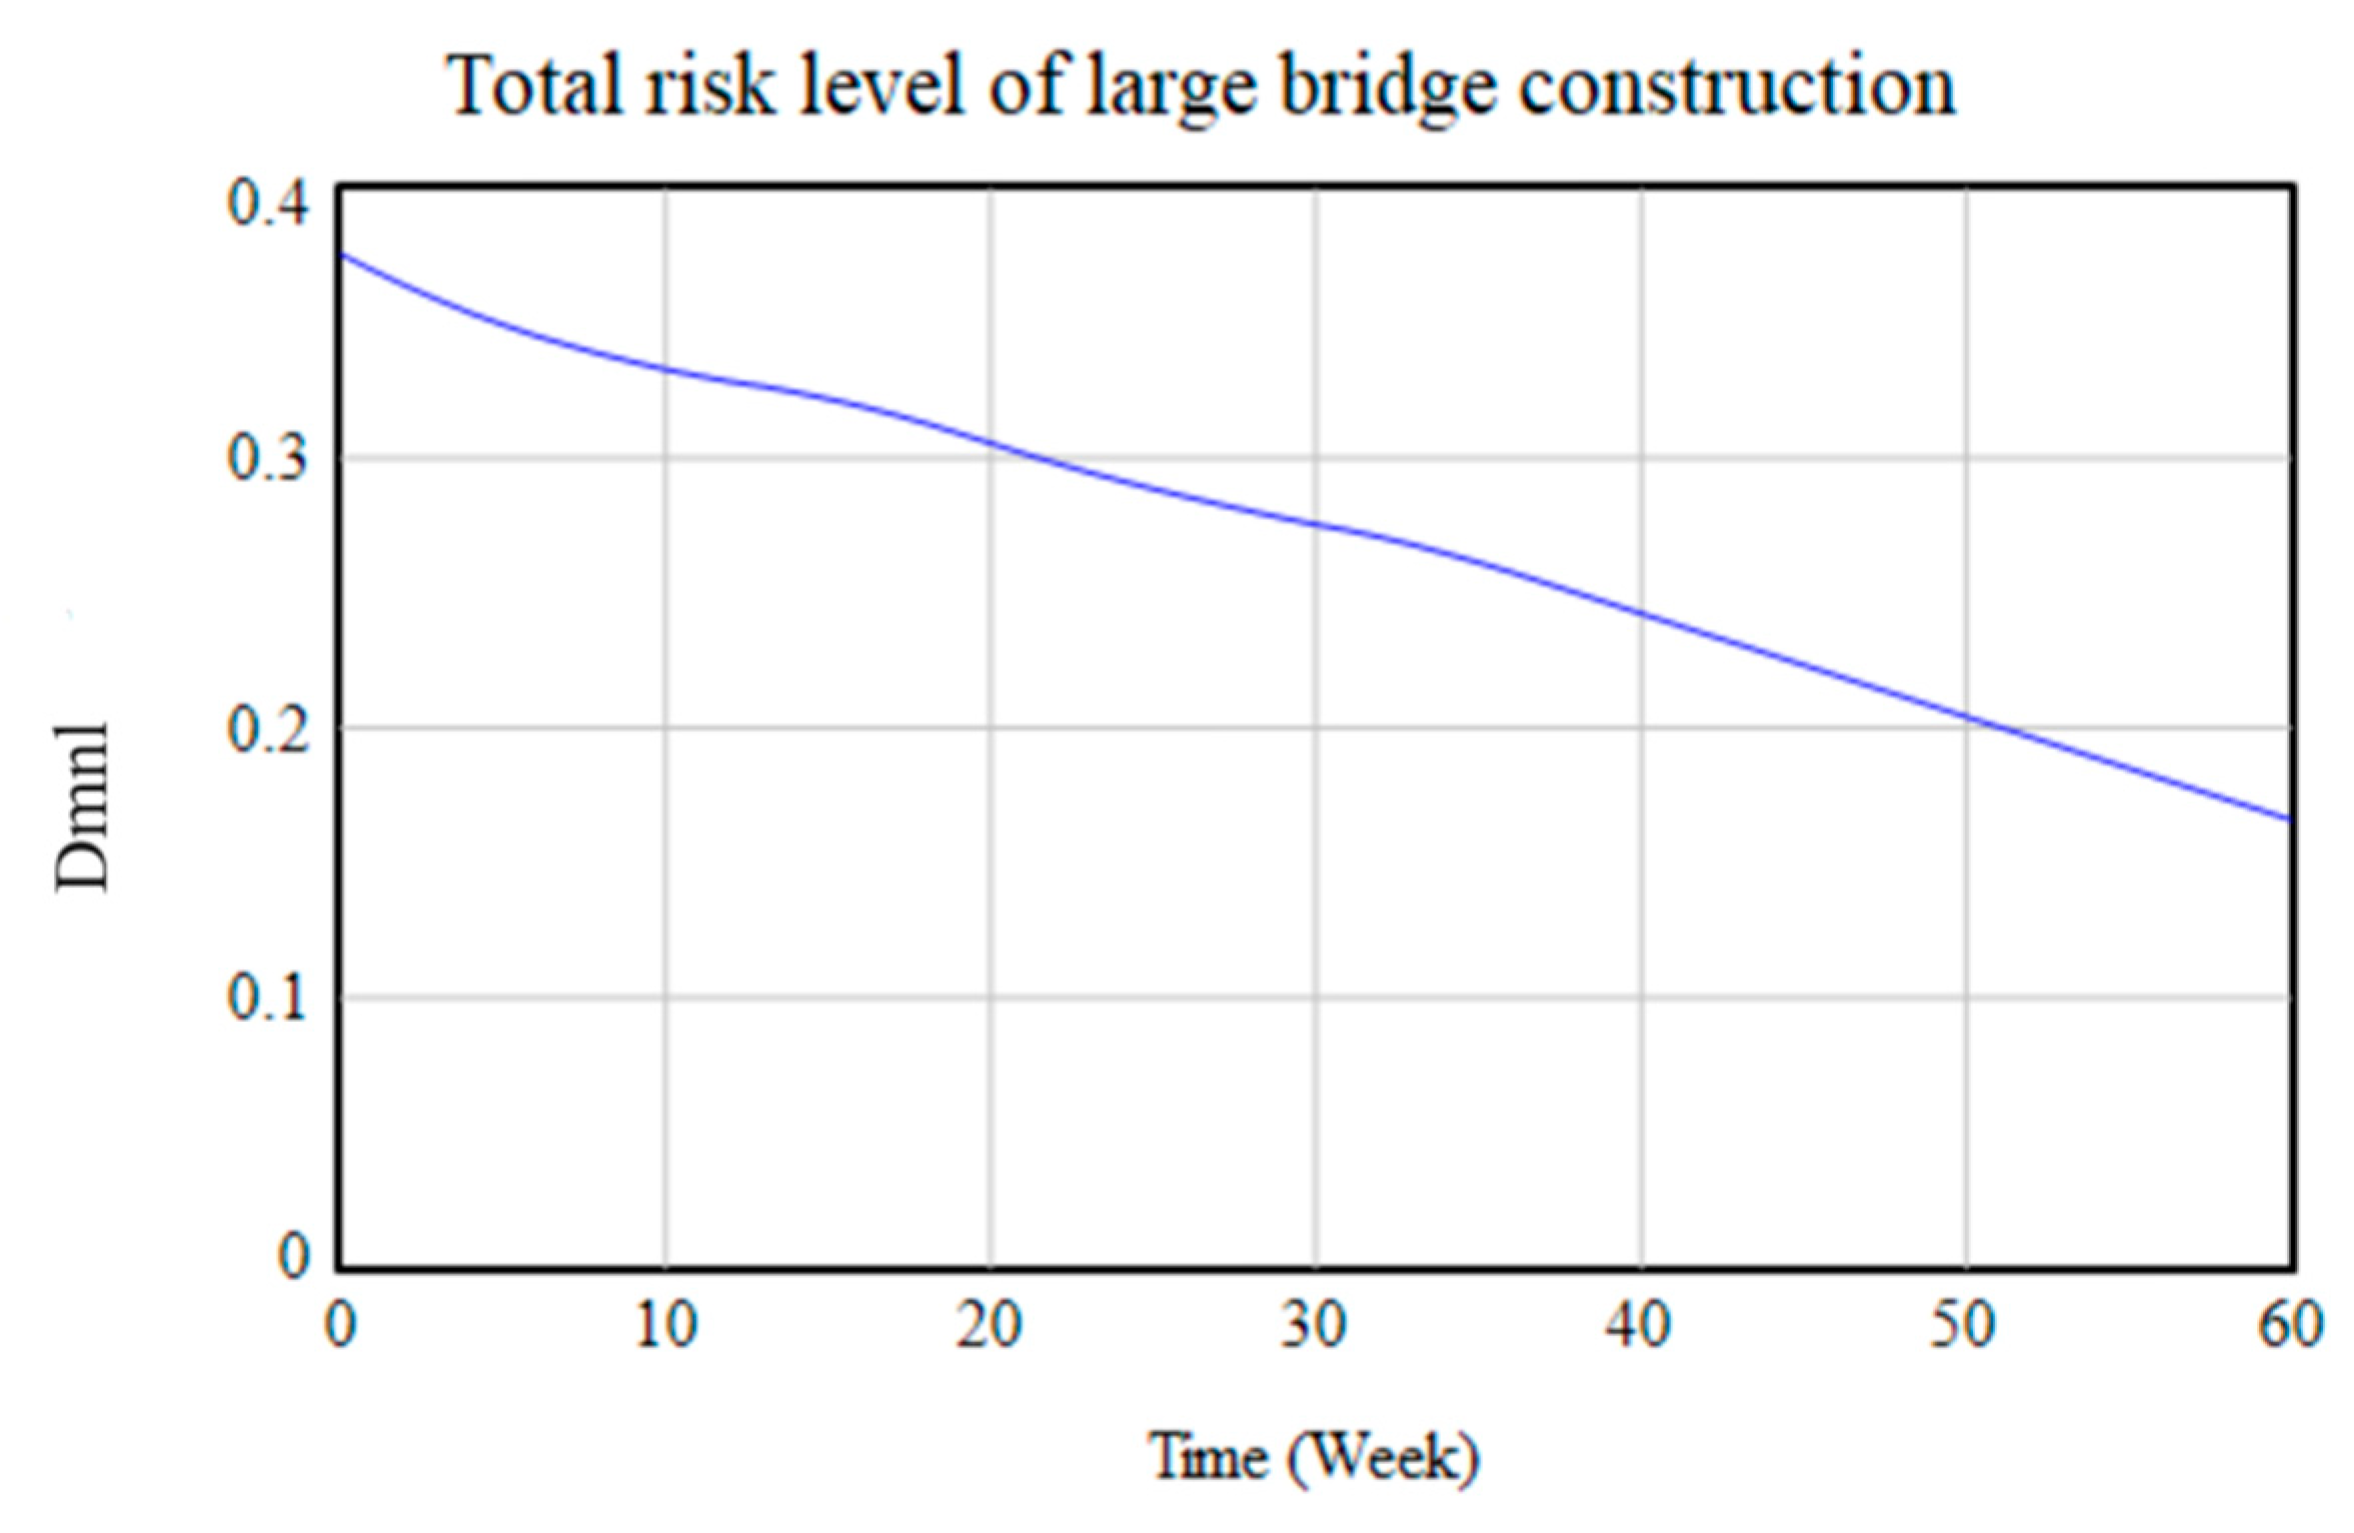
By substituting the parameters of a bridge identified in Section 4.2 into the dynamics equations of the large bridge construction risk system established in Section 3.3, the simulation conducted with Vensim PLE 7.3.5 software revealed the trend of its risk level, as depicted in Figure 5.
As illustrated in Figure 5, the level of risk in the construction of large bridges gradually decreased over the simulation period (60 weeks), demonstrating that the commitment to safety in the construction of large bridges is strengthened by investing in risk management at the construction site. This improvement is attributed to consistently increasing financial support for safety measures, such as acquiring safer equipment, providing more comprehensive safety training, and enhancing the work environment, which collectively contribute to effectively reducing the occurrence of accidents and thus minimizing construction risks.
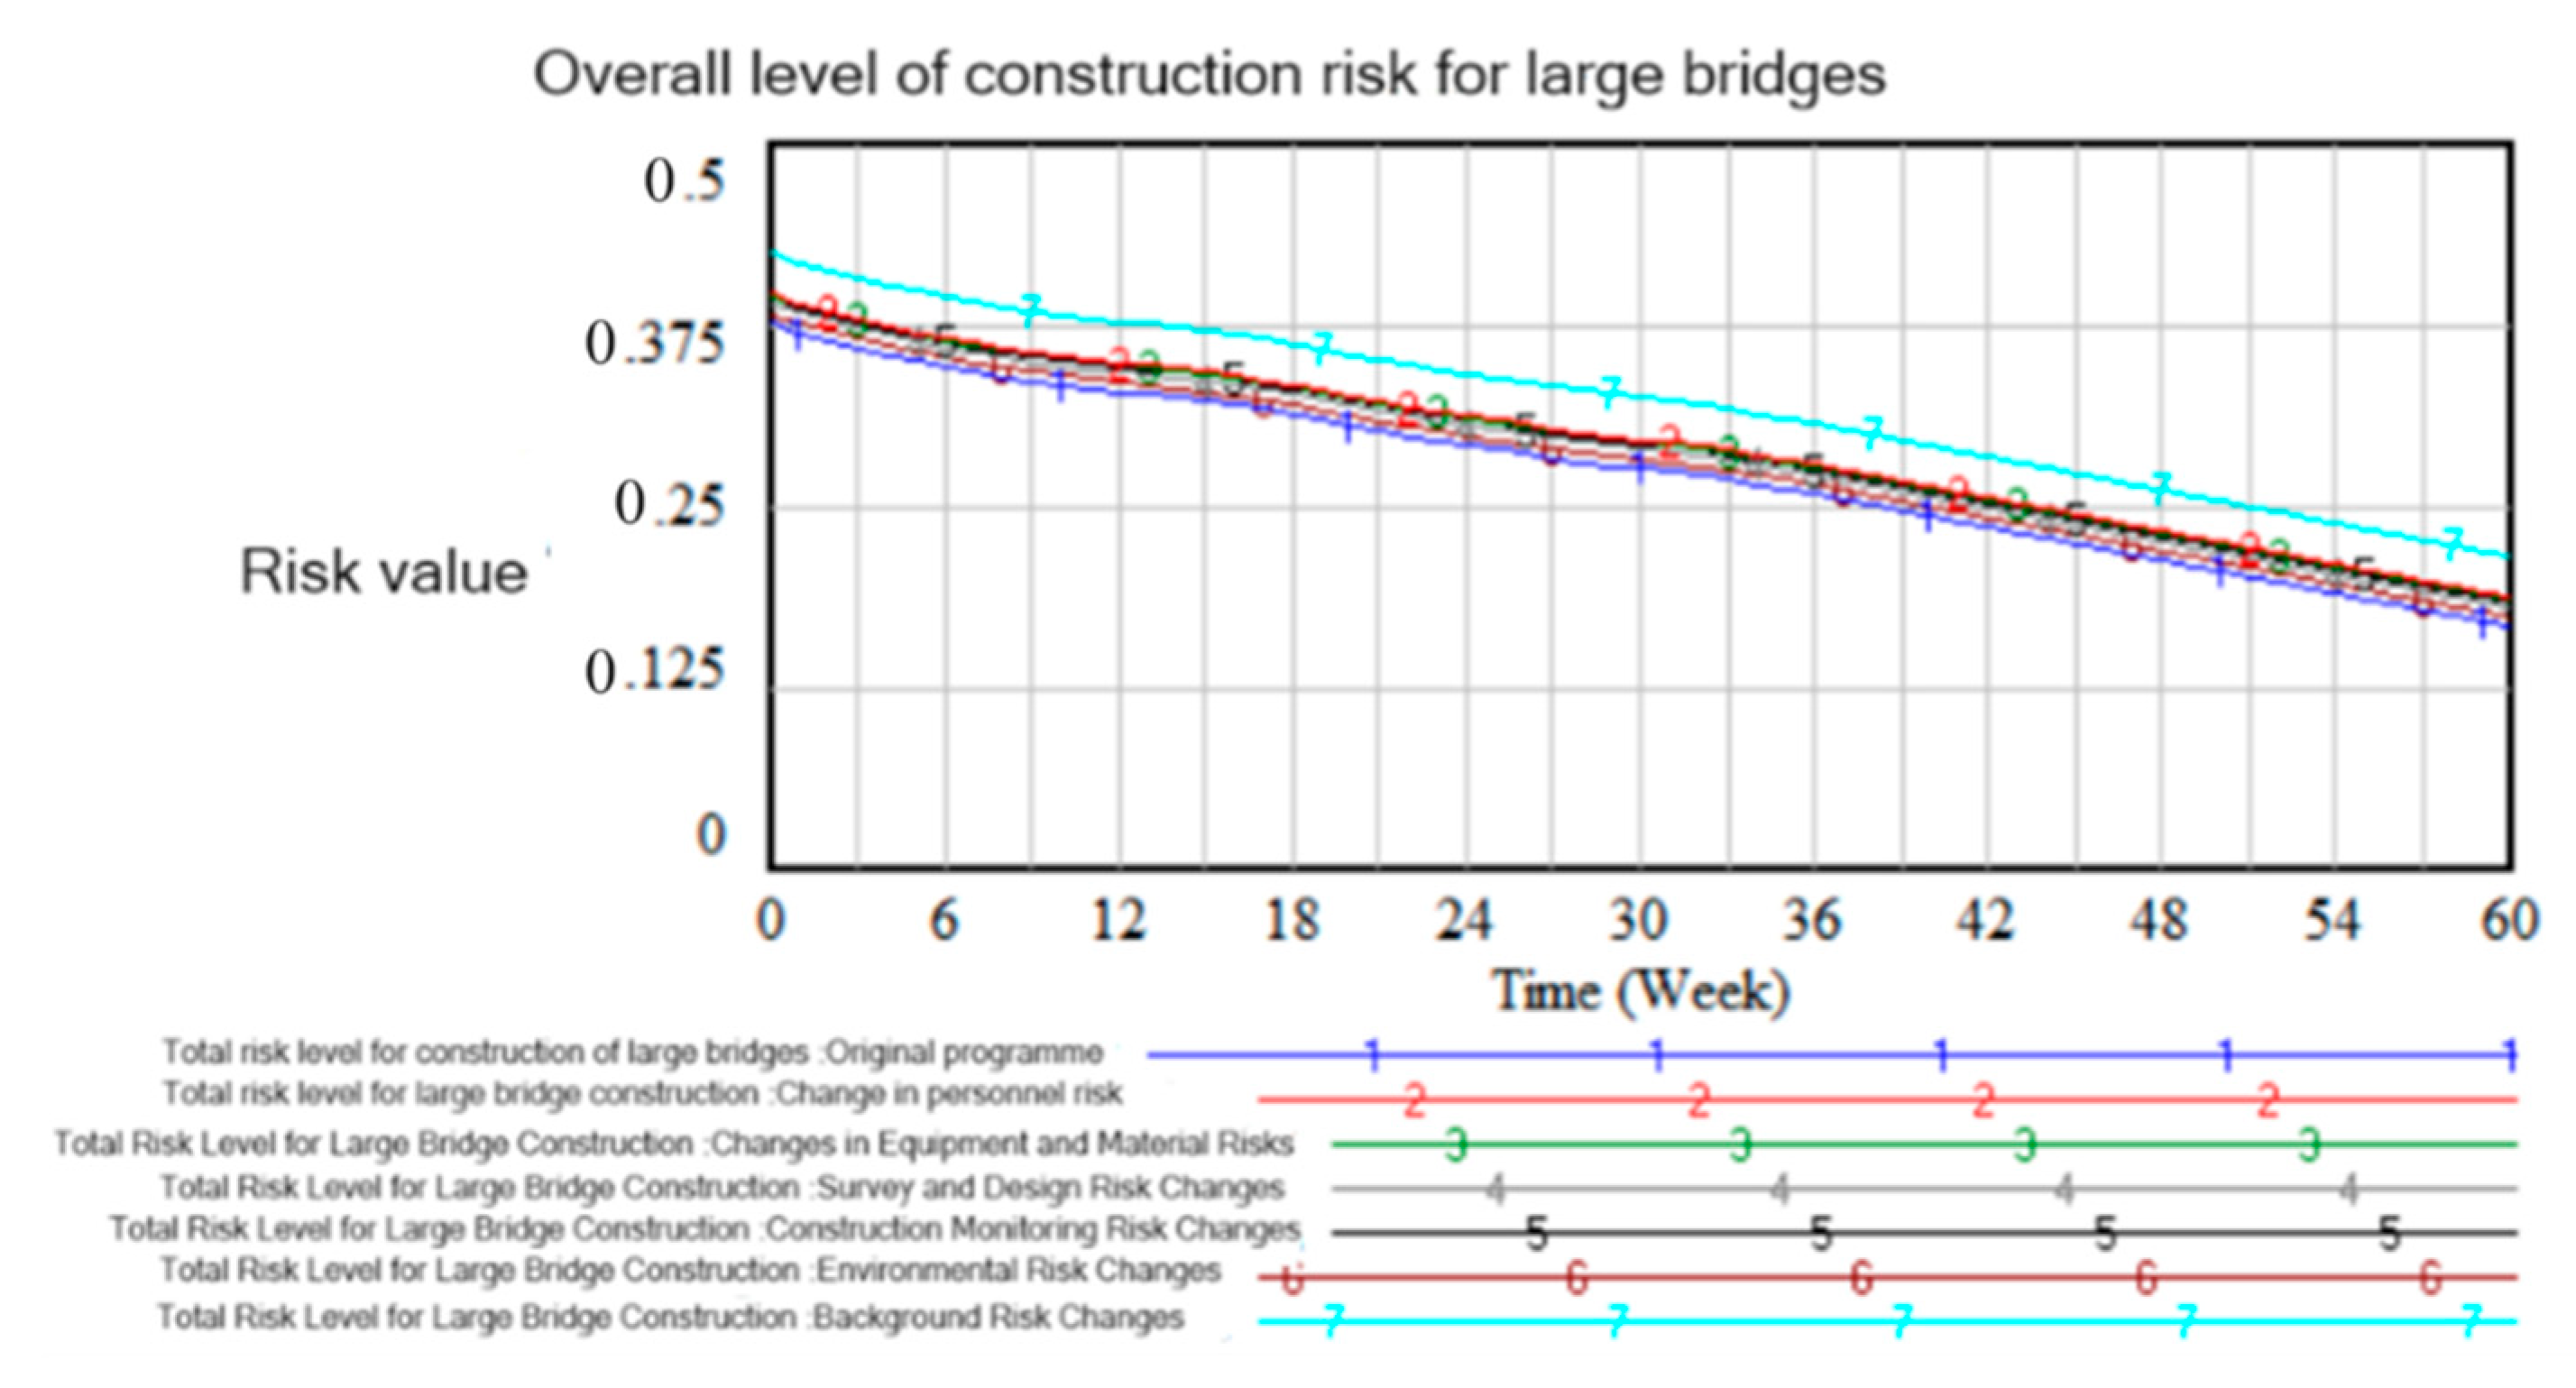
To explore the degree of influence of each risk subsystem on the total risk level of large bridge construction, the initial value of each risk subsystem was increased by one-third of its original value. When the initial value of one risk subsystem was increased, the remaining subsystems were kept unchanged. Six scenarios were designed and compared with the original scenarios, and the simulation results are displayed in Figure 6.
Figure 5 illustrates that the impact of changes in the management risk subsystem on the total risk level of large bridge construction was significant. The influence of changes in other risk subsystems, such as personnel, was subtler and more difficult to distinguish. Therefore, the magnitude of the impact of changes in the initial values of each subsystem were calculated using the Table Time table. The significance of the impact level was assessed by subtracting the average of the total risk-level values for large bridge construction for each scenario group at each time step from the standard of the original designs and dividing by the average of the actual plans. The impacts of risk changes in each subsystem were 11.9%, 11.2%, 8.1%, 10.3%, 3.7%, and 28.6%, respectively. The order of the degree of impact of the six subsystems was as follows: management > personnel > equipment and materials > construction monitoring > survey and design > environment.
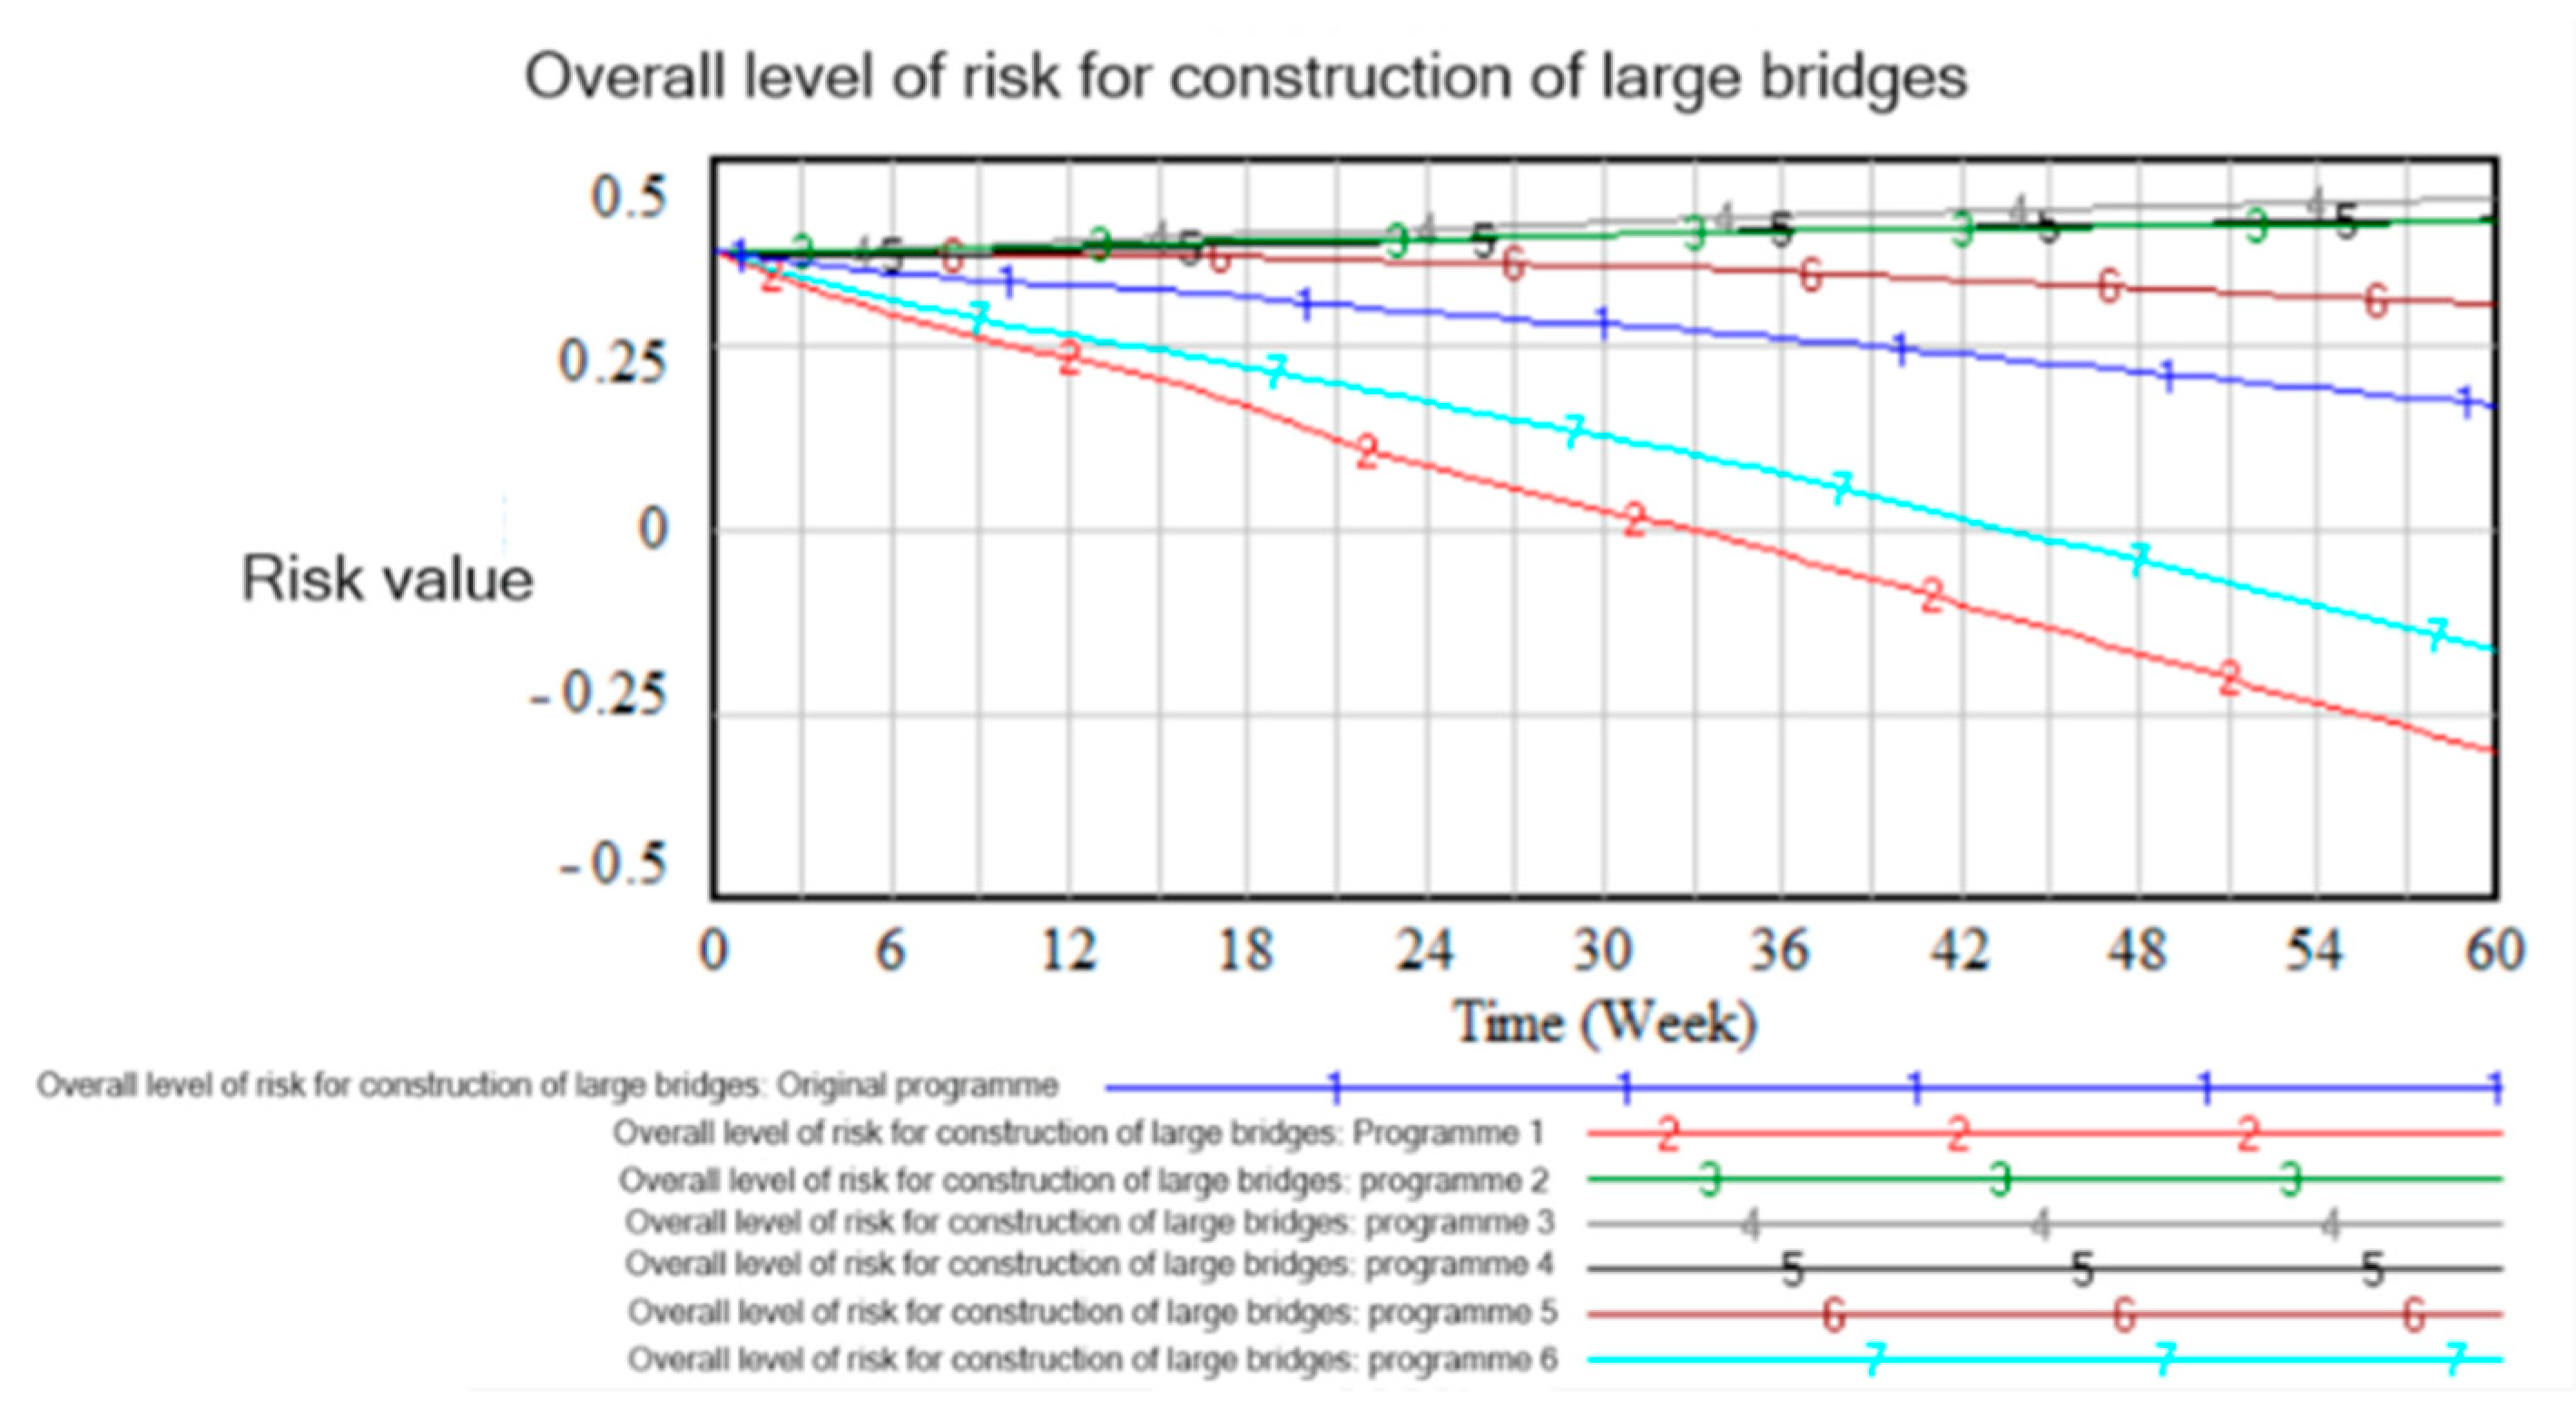
Different proportions of safety inputs in each risk subsystem can lead to various overall risk levels in the total system at risk. Consequently, it is essential to monitor the trend of the overall risk level of large bridge construction under varying input ratios by adjusting the safety input ratios of each subsystem and to examine the impact of these safety input ratios on the total risk of the system. With no changes in the total safety inputs, six groups of safety input ratio adjustment programs were developed, as illustrated in Table 6.
The trend of risk levels for the different input scenarios is depicted in Figure 7, where it is evident that there were variations in the incremental total risk levels of large bridge construction under the scenarios over time, leading to differences in the trends of the curves. Increasing the proportion of safety inputs in the personnel risk subsystem and the management risk subsystem effectively reduced the total risk level of the system. The ranking of the scenarios in terms of the risk level value is scenario 1 > scenario 6 > original scenario > scenario 5 > scenario 2 > scenario 4 > Scenario 3. This is because the safety awareness, skills, and behaviors of personnel directly impact daily operational safety and accident rates. Initially, investing in training and education for personnel can quickly result in safer operational behaviors and fewer accidents, significantly reducing the project’s risk levels. Although risk management has a substantial impact within the system, improvements may take longer to manifest. Effective management enhancements, such as refining processes, policies, and culture, might need time to be absorbed and implemented by the staff, and to demonstrate results in safety performance. Thus, even if the highest investments are made in risk management, their immediate impact on risk reduction may not be as noticeable as direct investments in personnel. In the complex dynamics of systems models, intricate interactions exist between subsystems. At times, a specific subsystem, like personnel risk, may be the key driver for reducing risk, while at other times, the influence of other subsystems, such as management risk, may become more pronounced. Hence, the varying effects between different strategies reflect shifts in the system’s internal dynamic equilibrium. The risk level of the system varies depending on the proportions of inputs for the same amount of time with constant safety inputs. Therefore, a change in the input program can be utilized to achieve the lowest risk-level value more rapidly and efficiently.

4.4. Risk Analysis and Simulation of Large Bridge Construction with Strategies for Optimizing Safety Investments

(1) Safety level of large bridge construction. With a weekly safety investment of CNY 500,000, the parameter values identified in the previous section were input into the system dynamics equations. The development trend of the overall risk level for large bridge construction was then obtained through computer simulation (as depicted in Figure 8). Over a simulation period of 60 weeks, the total risk level for large bridge construction progressively decreased due to the ongoing safety investment, ultimately decreasing to a risk level of 0.166055 by the 60th week.
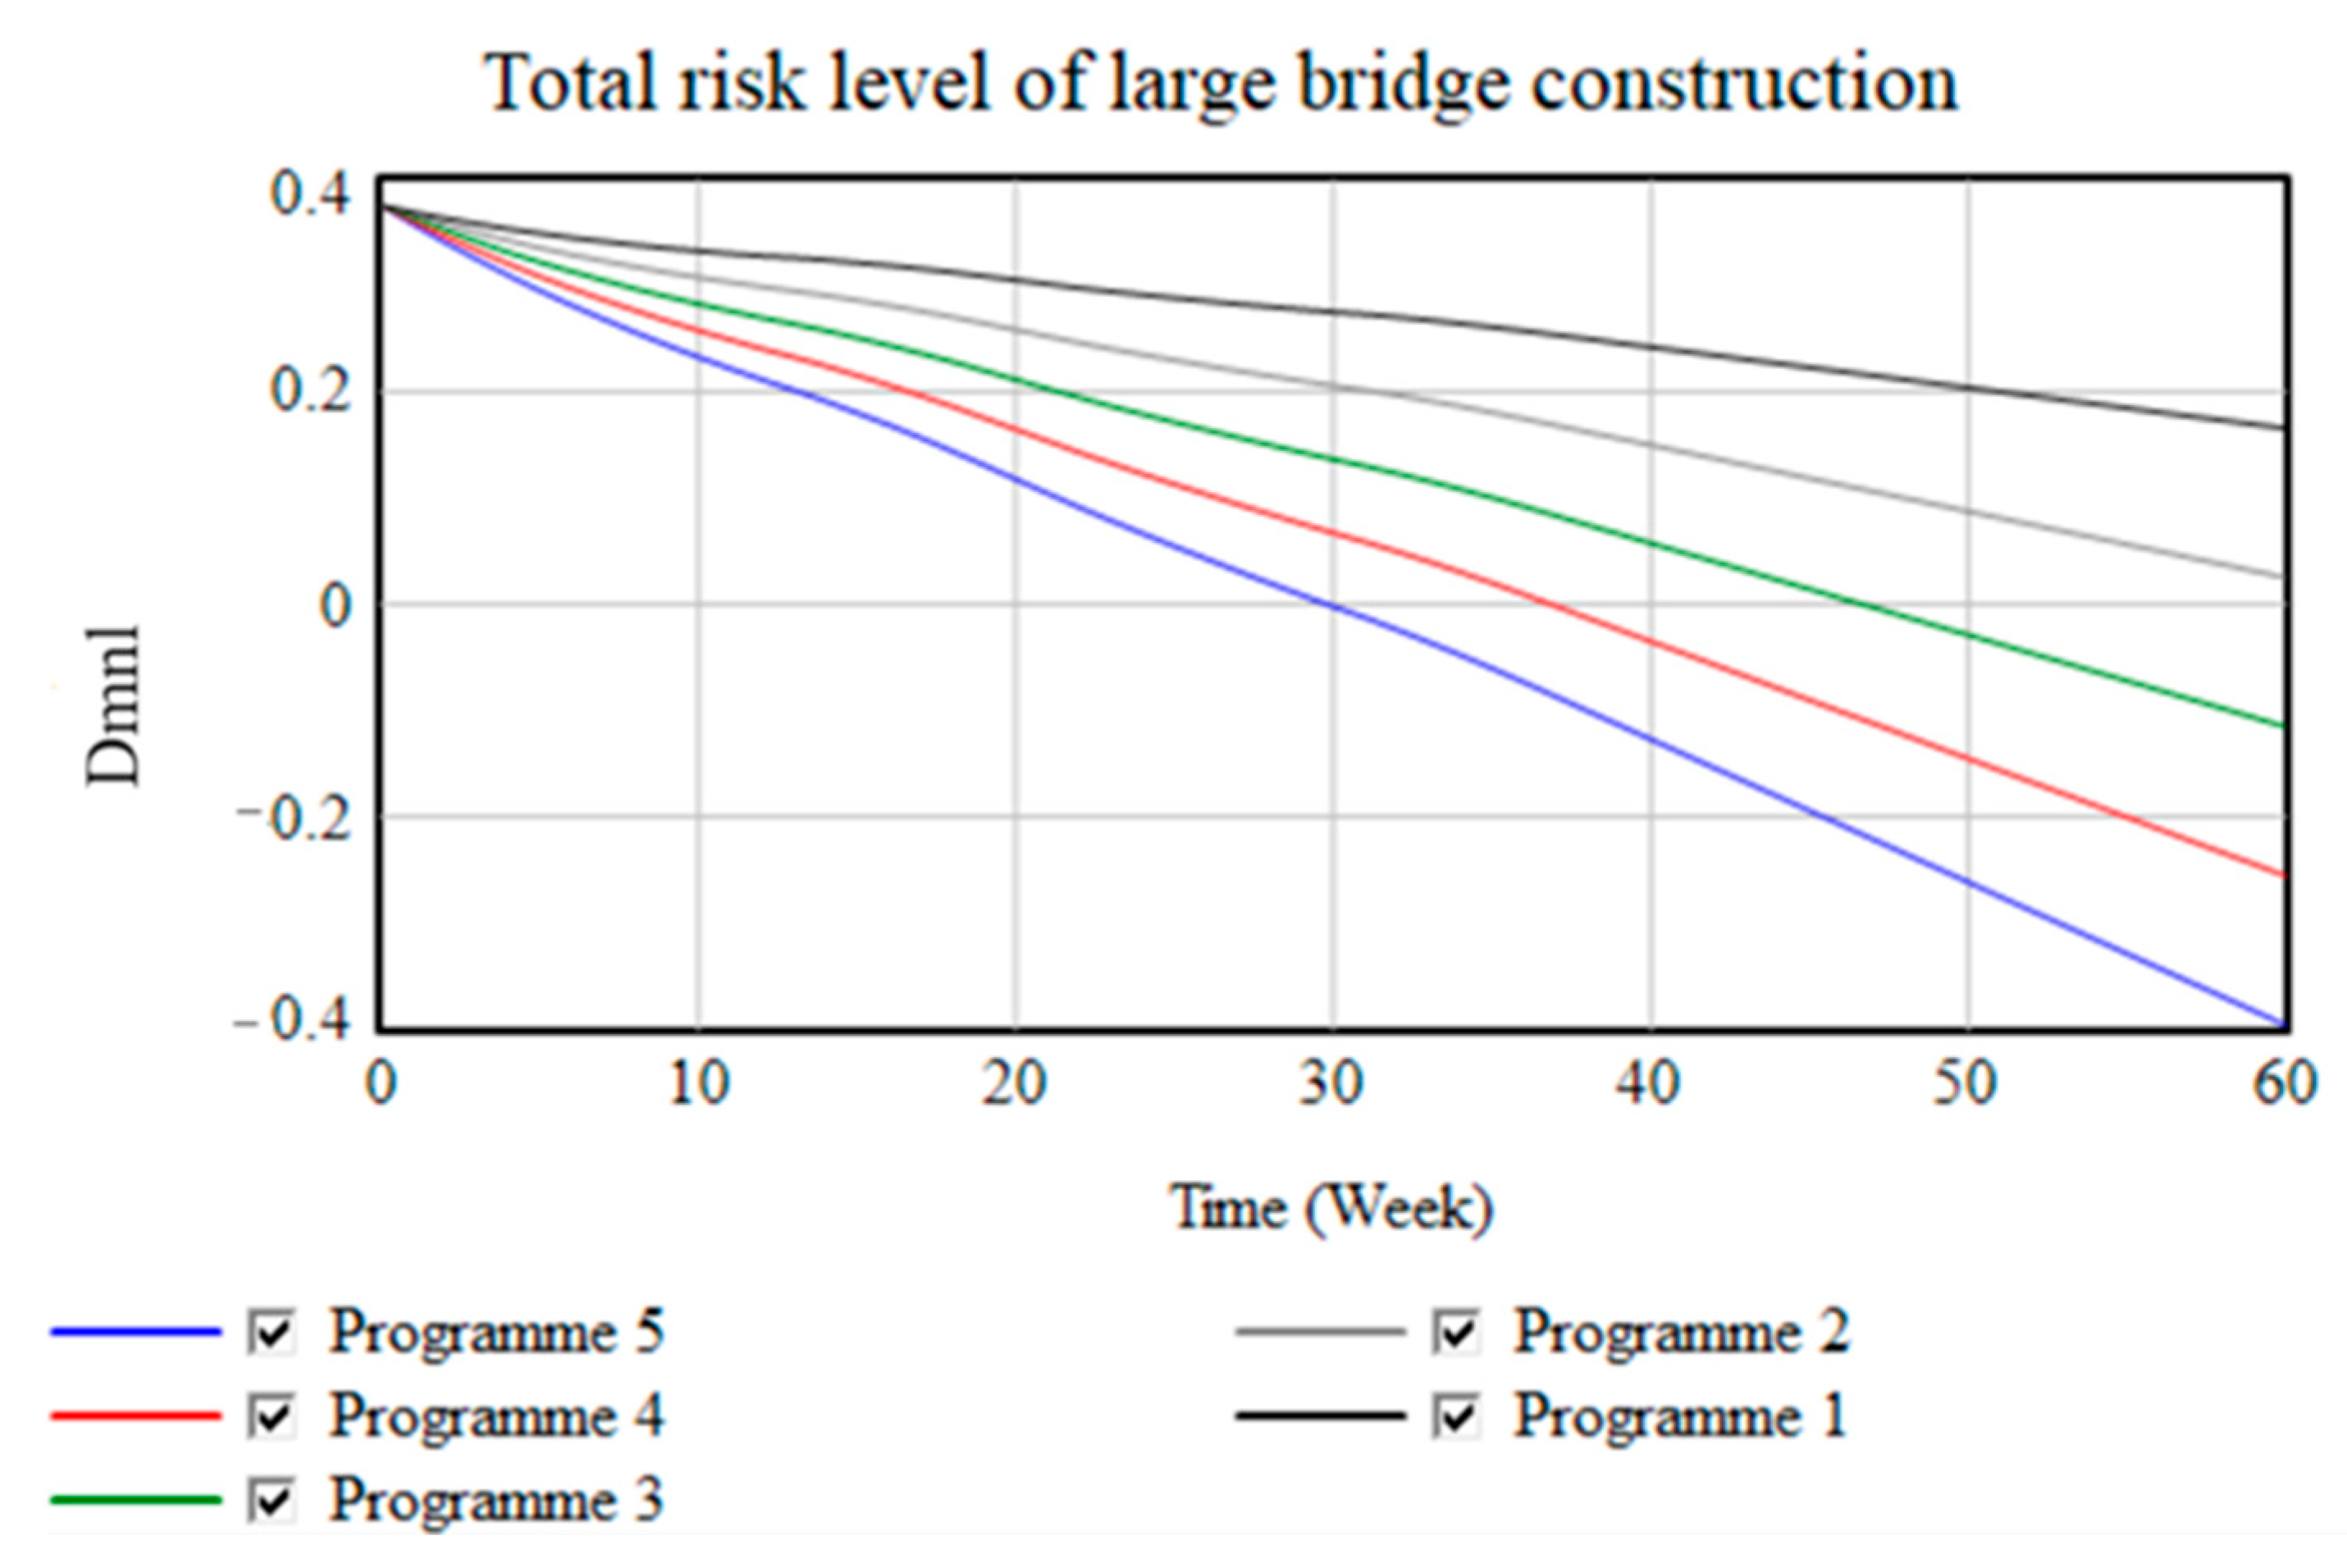
Adjustments were made to the safety investments while keeping other conditions unchanged, and the impacts of various safety investment plans on the system’s risk level were assessed. This analysis examined how these adjustments affect the safety levels in bridge construction, with the specific investment strategies outlined in Table 7.
The trend chart (Figure 9) demonstrates that the overall risk level of large bridge construction decreased with enhanced safety investments and increased when safety investments were diminished.
Enhancing the risk management of bridge construction is a continuous effort. By increasing safety investments, it is possible to progressively enhance the safety awareness and skills of the workforce, thereby leading to a consistent decrease in risk levels. This underscores the effectiveness of augmenting safety investments in reducing construction risks. Detailed risk-level values are presented in Table 8.
The simulation results suggest that appropriately increasing safety investments can substantially reduce the risk levels across various subsystems, thereby improving the overall safety performance of the project.
As the project progresses and environmental conditions fluctuate, the system dynamics model’s flexibility and adaptability prove it to be an effective tool for understanding and managing complex engineering risks. Future efforts should focus on further optimizing risk management strategies, enhancing the allocation of safety investments, and persistently monitoring risk level changes to maintain the highest safety standards during construction. By doing so, we can expect the realization of safer and more efficient large-scale bridge construction projects.

5. Conclusions

As urban areas in our country rapidly expand, there has been a surge in the development of traffic infrastructure, particularly in large bridge construction projects. These projects not only facilitate the growth of urban transportation networks and meet the needs of the population but also expose numerous safety risks. These risks can delay project timelines and lead to significant losses in both personal safety and property. Consequently, conducting comprehensive research on safety risk management for large bridge construction is imperative. This study focuses on the safety risks associated with large bridge construction, integrating both domestic and international research and real-world case studies. Utilizing system dynamics theory and Vensim PLE 7.3.5 software for simulation, the aim was to develop effective risk assessment and management strategies. The following are key conclusions derived from this research process:
(1) Development of a risk factor structure system: This study delves deeply into the evolution mechanisms of risks in large bridge construction, identifying key risk factors impacting construction safety. It establishes a hierarchical system that includes six major risk subsystems, including personnel, equipment and materials, and management risks, among others, and 31 specific risk factors. This structured system provides a comprehensive and systematic framework for further risk assessment and management.
(2) Development and utilization of the system dynamics model: Leveraging system dynamics theory and Vensim software, this study developed causal loop and stock–flow diagrams for the risk system of large bridge construction and formulated system dynamics equations, culminating in a comprehensive system dynamics model for large bridge construction risks. The model comprises 76 variables, including 6 level variables, 6 rate variables, 59 auxiliary variables, and 5 constants. It elucidates the interactions between various risk factors and their cumulative impact on the overall risk level. This model acts as an indispensable tool for understanding and analyzing the dynamics of risk throughout the construction process of large bridges.
(3) Simulation analysis of risk change trends: Employing a specific large bridge construction project as a case study, this research entailed defining and simulating the parameters and equations within the model to analyze the trend of risk changes during the construction phase. The simulation outcomes demonstrated that the personnel and management risk subsystems exert the most substantial influence on the overall risk level. These findings provide invaluable insights and guidance for risk management in large bridge construction projects.
(4) Proposal of risk management strategies: Drawing on the simulation analysis results, this paper further explored effective risk management strategies, including enhancing personnel safety training, refining management systems, and upgrading the quality of equipment and materials. These strategies aim to fundamentally reduce construction risks and ensure the safety and seamless progression of the project.
(5) Critical role of safety investments in risk reduction: The simulation analysis utilizing the system dynamics model verified that appropriate safety investments significantly reduce risk levels in large bridge construction. The research examined various safety investment strategies, illustrating how to optimally allocate funds in response to changes in the construction environment for the best risk management outcomes.
This study delves deeply into safety risk management for large bridge construction, developing a system dynamics model to evaluate and simulate risk factors, and it introduces practical management strategies. These contributions significantly bolster the safety of large bridge projects. Nonetheless, the research identified challenges such as limitations in data collection, the imperative for model validation, the empirical testing of risk control measures, and the potential to broaden interdisciplinary research. Future efforts will focus on collecting more comprehensive data, refining model accuracy, confirming the effectiveness of management strategies, and investigating advanced technologies for intelligent risk detection and control, aiming to provide a more comprehensive contribution to safety management in large bridge construction both theoretically and practically.

Author Contributions

Writing—original draft, X.F.; Writing—review & editing, M.Y., H.L., L.W. and Q.L. All authors have read and agreed to the published version of the manuscript.

Funding

Hebei Province Construction Technology Research Guide Project (project Nos. 20182051); Science and Technology Research Project of Hebei province Higher Education Institutions (project Nos. QN2017003); Ph.D foundation project of North China Institute of Aerospace Engineering under grant (project Nos. BKY-2018-12); Langfang City science and technology research and development plan self-financing project (project Nos. 2020011053; 2021011049).

Data Availability Statement

The data used to support the findings of this study are available from the corresponding author upon request.

Conflicts of Interest

The authors declare that they have no conflicts of interest.

References

  1. Wang, K.Y.; Yang, C.F. Research on the Application of AHP-DEA in Bridge Construction Risk Evaluation. J. Hebei Univ. Technol. 2014, 43, 102–106. [Google Scholar]
  2. Li, Y.C.; Feng, Z.R.; Wang, X.J. Construction Risk Evaluation of Highway Bridges Based on ANP 2D Cloud Modelling. J. Wuhan Univ. Technol. 2019, 41, 73–79. [Google Scholar]
  3. Chen, G.H.; Wu, W.S.; Xu, S.Y. HSE risk evaluation of cross-sea bridge project construction based on WBS-RBS and AHP. China Saf. Sci. J. 2013, 23, 51–57. [Google Scholar]
  4. Wang, C.B.; Song, Y.M. Research on bridge construction risk factors based on factor analysis method. J. Hunan Univ. Arts Sci. Nat. Sci. Ed. 2018, 30, 45–50. [Google Scholar]
  5. Bao, L.S.; Liu, K.T.; Yu, L. Multi-objective risk analysis and evaluation of bridge construction scheme based on grey hierarchical analysis method. J. Shenyang Jianzhu Univ. Soc. Sci. 2009, 25, 663–669. [Google Scholar]
  6. Feng, D.C.; Cao, X.Y.; Michael, B. An enhanced PDEM-based framework for reliability analysis of structures considering multiple failure modes and limit states. Probabilistic Eng. Mech. 2022, 70, 103367. [Google Scholar] [CrossRef]
  7. Cao, X.Y.; Xiong, C.Z.; Feng, D.C. Dynamic and probabilistic seismic performance assessment of precast prestressed reinforced concrete frames incorporating slab infuence through three-dimensional spatial mode. Bull. Earthq. Eng. 2022, 20, 6705–6739. [Google Scholar] [CrossRef]
  8. Yuan, H.C.; Zhang, W.L.; You, J.C. Safety Risk Evaluation of Bridge Construction Based on Improved Cloud Modelling. J. Eng. Stud. 2018, 10, 600–606. [Google Scholar] [CrossRef]
  9. Yuan, J.B.; Cui, G.; Fu, Q.S. Research on safety risk evaluation of road bridge construction based on network analysis method. Technol. Prog. Policy 2014, 31, 96–100. [Google Scholar]
  10. Wang, L.; Guo, Z.S.; Yang, G.J. Safety Risk Evaluation of Bridge Substructure in Loess Mountain Alluvial Terrain. Saf. Environ. Eng. 2022, 29, 26–32. [Google Scholar]
  11. Tang, T.M.; Guan, Y.N.; Wang, G.B. Safety Risk Assessment of Wuhan Qingshan Yangtze River Highway Bridge during Construction Phase. Bridge Constr. 2020, 50, 38–43. [Google Scholar]
  12. Zhu, Z.B.; Ma, C.F.; Wang, B. Safety Risk Assessment for Construction of Pingtan Strait Dual-purpose Bridge. Bridge Constr. 2017, 47, 12–16. [Google Scholar]
  13. Peng, W.Y.; Fan, Y.Y.; Li, H. Risk evaluation of large-span bridge construction phase based on grey clustering method. J. Eng. Manag. 2015, 29, 101–105. [Google Scholar]
  14. Bo, J.S. Research on Safety Risk Management of Long-Span Steel Box Arch Bridge Erection Construction Based on System Dynamics. Master’s Thesis, Chongqing Jiaotong University, Chongqing, China, 2023. [Google Scholar]
  15. Guo, Z.Q. Research on Safety Risk of Deep-Water Foundation Construction for Large-Span Cable-Stayed Bridges Based on System Dynamics. Master’s Thesis, Chongqing Jiaotong University, Chongqing, China, 2022. [Google Scholar]
  16. Liu, W.; Liu, Z.X. Simulation Analysis of Supply Chain Resilience of Prefabricated Building Projects Based on System Dynamics. Buildings 2023, 13, 2629. [Google Scholar] [CrossRef]
  17. Cheng, Y.F. Research on Cost Control of Bridge Engineering Construction Projects Based on System Dynamics. Master’s Thesis, Shenyang Jianzhu University, Shenyang, China, 2023. [Google Scholar]
  18. Zhao, C. Research on Safety Simulation of Elevated Bridge Construction Based on System Dynamics. Master’s Thesis, Zhengzhou University, Zhengzhou, China, 2022. [Google Scholar]
  19. Lin, K.Z.; Wang, Q.; Yang, H.Q. Risk Event Identification and Analysis in the Construction Process of Cross-Sea Bridges. J. Highw. Transp. Res. Dev. Appl. Technol. Ed. 2020, 16, 338–340+360. [Google Scholar]
  20. Wang, Y.M.; Zhang, Y.Y.; Zhu, B.M. Research on Construction Safety Risk Evaluation of Large-span Continuous Steel Truss Girder Bridges for Both Highway and Railway. Constr. Saf. 2023, 38, 76–82. [Google Scholar]
  21. Wu, D. Research on Construction Cost Control of Large Bridge Projects Based on System Dynamics. Master’s Thesis, Chongqing University, Chongqing, China, 2017. [Google Scholar]
  22. Chen, S.Z.; Wu, G.; Feng, D.C. Multi-Cross-Reference Method for Highway-Bridge Damage Identification Based on Long-Gauge Fiber Bragg-Grating Sensors. J. Bridge Eng. 2020, 6, 25. [Google Scholar] [CrossRef]
  23. Xu, X.H. Research on Risk Evaluation and Control of Steel Box Girder Bridge Construction Based on Step-by-Step Launching Technique. Master’s Thesis, Southeast University, Nanjing, China, 2023. [Google Scholar]
  24. Wang, Y.D.; Ibarra, L.; Pantelides, C. Seismic retrofit of a three-span RC bridge with buckling-restrained braces. J. Bridge Eng. 2016, 21, 11. [Google Scholar] [CrossRef]
  25. Kaviani, P.; Zareian, F.; Taciroglu, E. Seismic behavior of reinforced concrete bridges with skew-angled seat-type abutments. Eng. Struct. 2012, 45, 137–150. [Google Scholar] [CrossRef]
  26. Vincenzo, G.; Francesco, P.; Giulio, P. Multiple Tests for Dynamic Identification of a Reinforced Concrete Multi-Span Arch Bridge. Buildings 2022, 12, 833. [Google Scholar] [CrossRef]
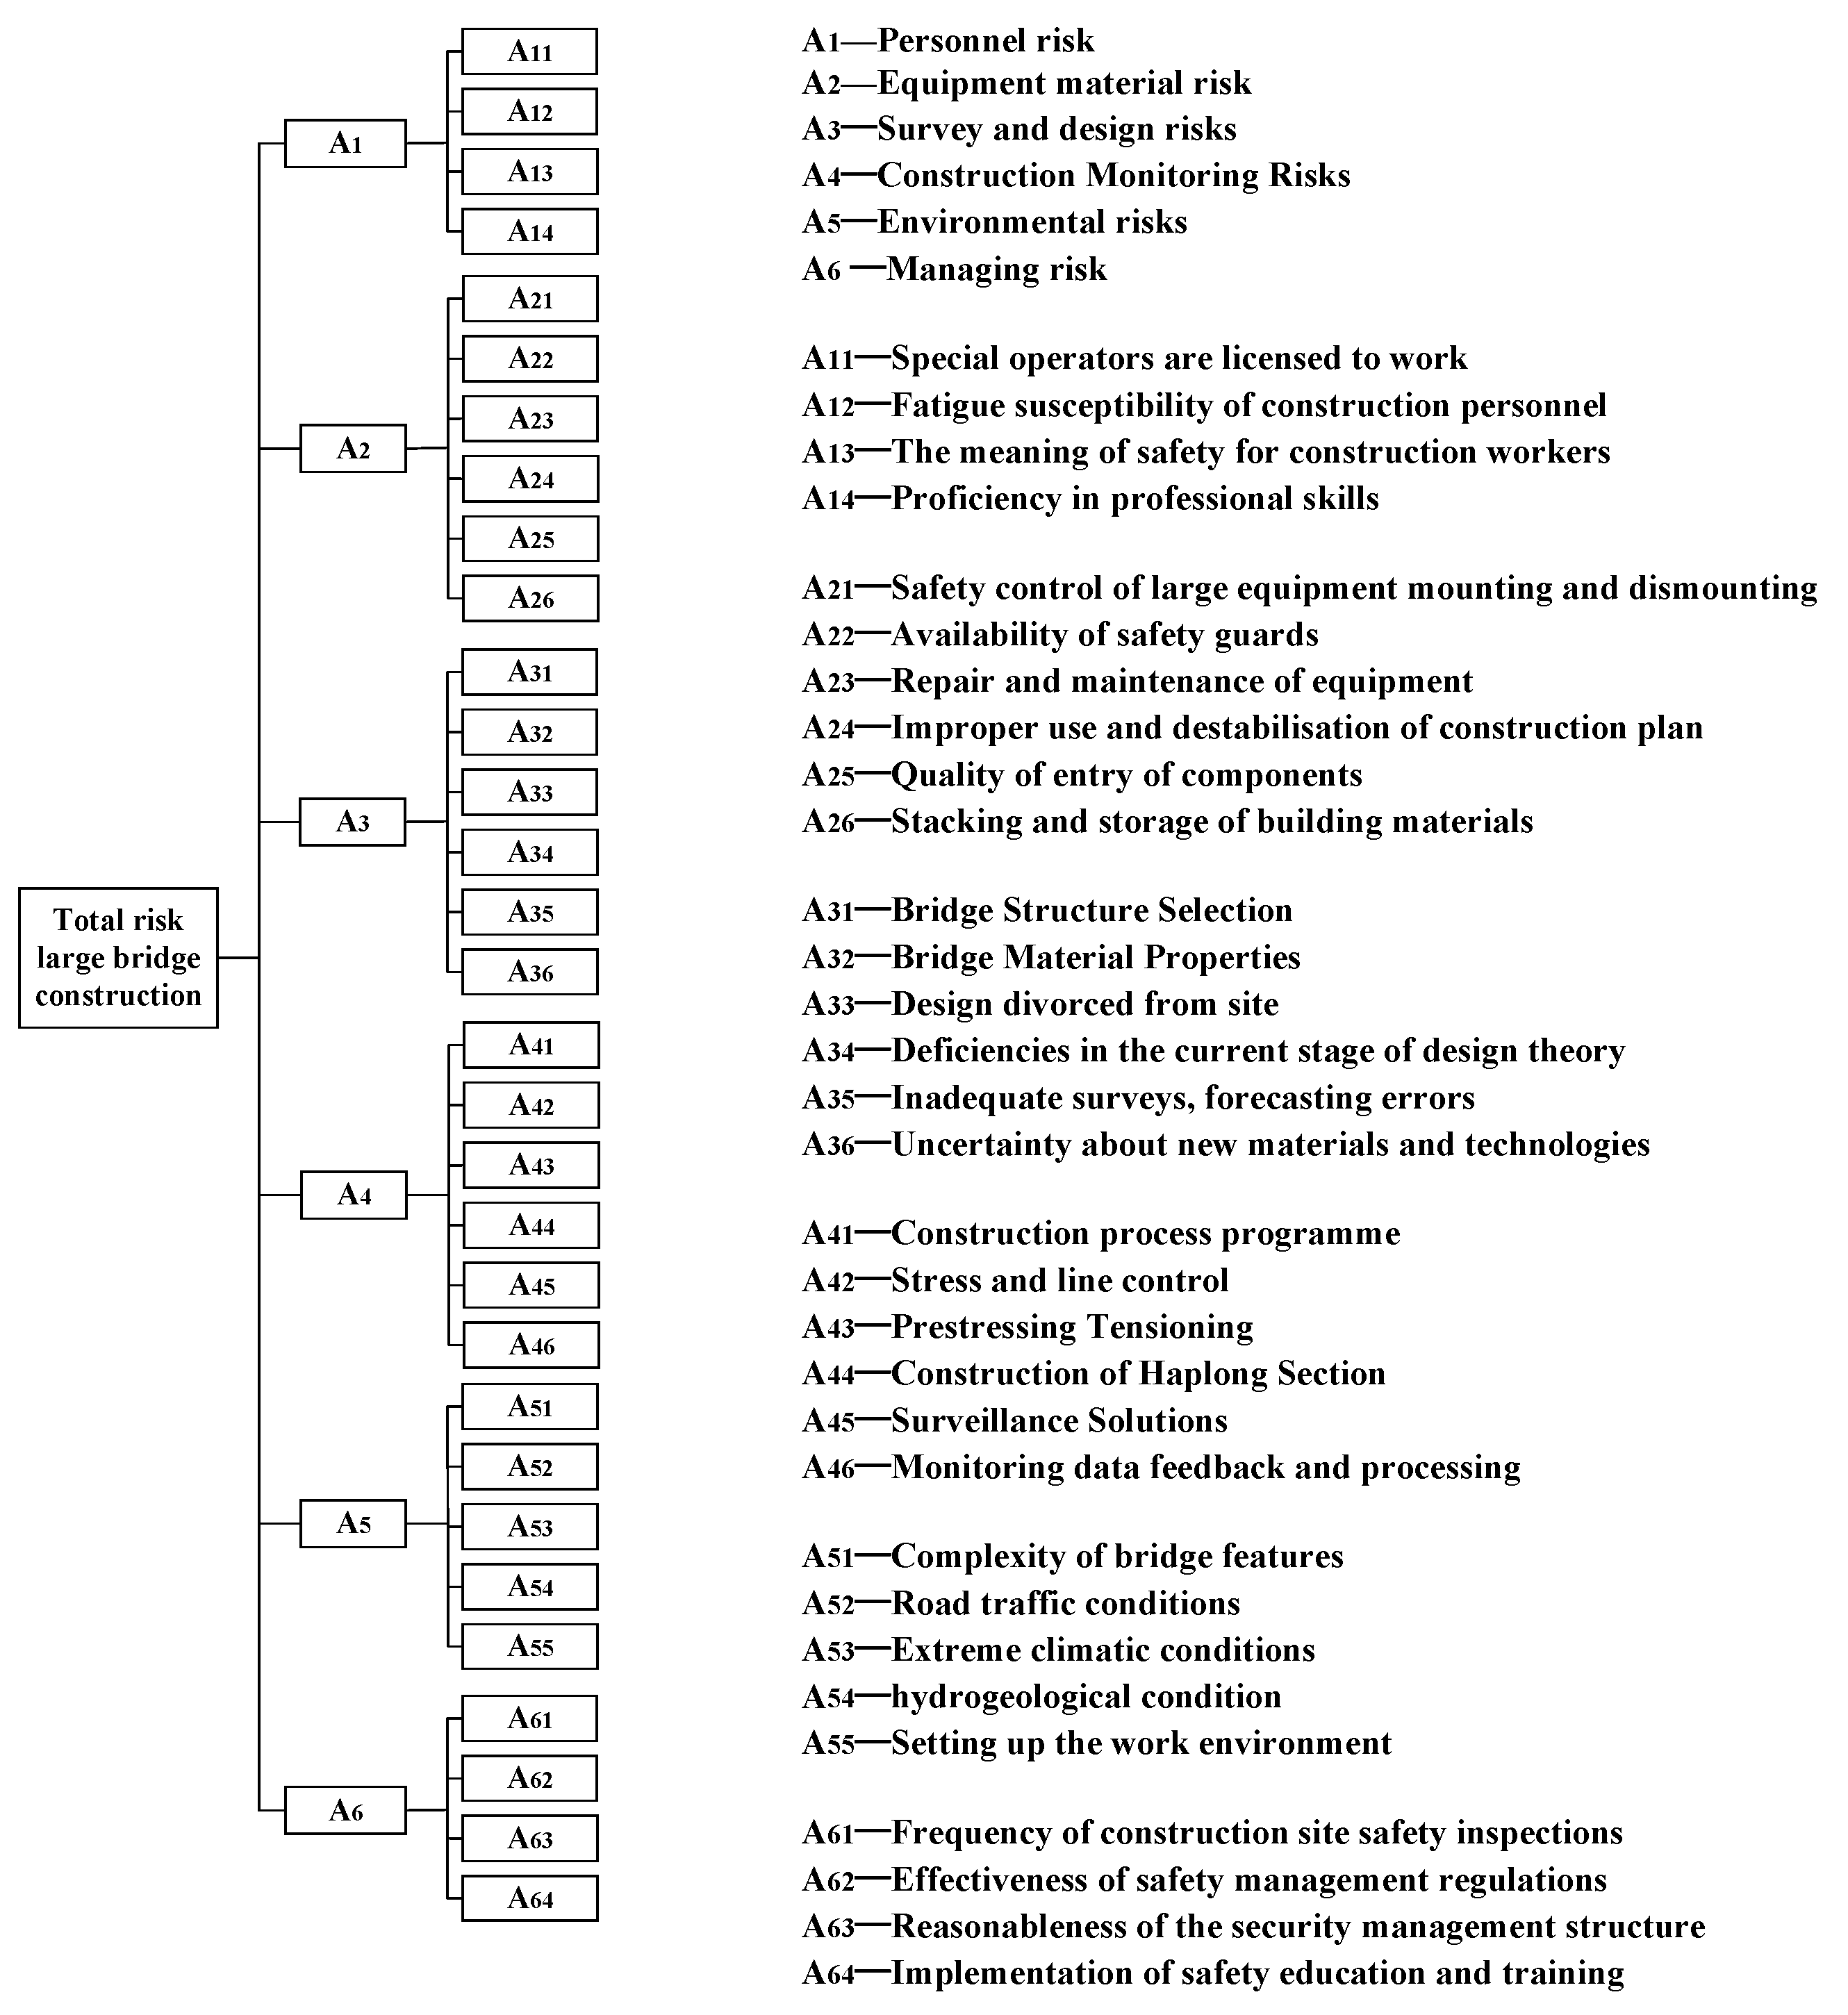
Figure 1. Structure diagram of risk factors for large bridge construction.
Buildings 14 01488 g001
Figure 2. Causal circuit diagram of risk evolution of large bridge construction.
Buildings 14 01488 g002
Figure 3. Dynamic flow diagram model of extensive bridge construction risk system.
Buildings 14 01488 g003
Figure 4. Schematic of a large bridge elevation.
Buildings 14 01488 g004
Figure 5. Development trend of the risk level of large bridge construction.
Buildings 14 01488 g005
Figure 6. The trend chart of the overall risk level after the change to each subsystem.
Buildings 14 01488 g006
Figure 7. Risk-level trend chart for different input schemes.
Buildings 14 01488 g007
Figure 8. Trend chart of the overall risk level for large bridge construction.
Buildings 14 01488 g008
Figure 9. Trend chart for various safety investment levels.
Buildings 14 01488 g009
Table 1. Model variable description table.
S/NTypeIDNameS/NTypeIDName
1Horizontal variableS1Personnel risk level27Auxiliary VariablesI15Deficiencies in the current stage of design theory
2S2Equipment material risk level28I16Inadequate surveys, forecasting errors
3S3Survey and design risk level29I17Uncertainty about new materials and technologies
4S4Construction monitoring risk level30I18Construction process program
5S5Environmental risk level31I19Stress and line control
6S6Managing the level of risk32I20Prestressing tensioning construction
7Rate variablesR1Amount of change in personnel risk level33I21Construction of the closing section
8R2Amount of change in equipment material risk level34I22Surveillance solutions
9R3Amount of change in level of survey and design risk35I23Monitoring data feedback and processing
10R4Amount of change in the level of construction monitoring risk36I24Complexity of bridge features
11R5Amount of change in the level of environmental risk37I25Road traffic conditions
12R6Amount of change in the level of management risk38I26Extreme climatic conditions
13Auxiliary variablesI1Total risk level for construction of large bridges39I27Hydrogeological conditions
14I2Special operators licensed to work40I28Setting up work environment
15I3Fatigue susceptibility of construction personnel41I29Frequency of construction site safety inspections
16I4Safety awareness among construction workers42I30Effectiveness of safety management regulations
17I5Proficiency in professional skills43I31Reasonableness of security management structure
18I6Safety control of large equipment mounting and dismounting44I32Investment in security management funds
19I7Availability of safety guards45I33Implementation of safety education and training
20I8Repair and maintenance of equipment46I34Security inputs
21I9Improper use and destabilization of construction plant47I35Personnel security inputs
22I10Quality of entry of components48I36Security inputs for equipment and materials
23I11Stacking and storage of building materials49I37Survey and design safety inputs
24I12Bridge structure selection50I38Construction monitoring security inputs
25I13Bridge material properties51I39Safety inputs for environmental risks
26I14Design divorced from site52I40Managing security inputs
Table 2. Model variable weight assignment table.
WeightsVolumeWeightsVolumeWeightsVolume
W10.203W240.021W450.021
W20.146W250.016W460.029
W30.137W260.023W510.021
W40.134W310.021W520.019
W50.094W320.023W530.016
W60.286W330.026W540.015
W110.047W340.019W550.023
W120.026W350.031W610.068
W130.067W360.017W620.072
W140.063W410.019W630.065
W210.024W420.027W640.081
W220.027W430.016
W230.035W440.022
Table 3. The horizontal variable initiates the table.
S/NSymbolVariable NamesInitial Assignment
1L01Personnel risk0.3
2L02Equipment material risk0.4
3L03Survey and design risks0.3
4L04Construction monitoring risks0.4
5L05Environmental risks0.2
6L06Managing risk0.5
Table 4. Table of safety investment proportion for each subsystem.
S/NSubsystem NameProportion of InputsSymbol
1Personnel risk0.15P1
2Equipment material risk0.17P2
3Survey and design risks0.16P3
4Construction monitoring risks0.19P4
5Environmental risks0.12P5
6Managing risk0.21P6
Table 5. Risk variation per unit time step of each risk factor.
Risk FactorsUnit Length ChangeRisk FactorsUnit Length Change
Special operators licensed to work0.029Construction process program0.056
Fatigue susceptibility of construction personnel0.037Stress and line control0.065
Safety awareness among construction workers0.046Prestressing Tensioning Construction0.061
Proficiency in professional skills0.033Construction of the closing section0.067
Safety control of large equipment mounting and dismounting0.057Surveillance solutions0.063
Availability of safety guards0.045Monitoring data feedback and processing0.059
Repair and maintenance of equipment0.038Complexity of bridge features0.037
Improper use and destabilisation of construction plant0.051Road traffic conditions0.035
Quality of entry of components0.026Hydrogeological conditions0.034
Stacking and storage of building materials0.031Setting up work environment0.043
Bridge structure selection0.023Frequency of construction site safety inspections0.049
Bridge material properties0.026Effectiveness of safety management regulations0.042
Design divorced from site0.029Reasonableness of security management structure0.036
Deficiencies in current stage of design theory0.021Implementation of safety education and training0.059
Inadequate surveys, forecasting errors0.039
Uncertainty about new materials and technologies0.033
Table 6. Different safety investment ratio schemes for each subsystem.
ProgramProportion of Inputs
Personnel RiskEquipment
Material Risk
Survey and
Design Risks
Construction
Monitoring Risks
Environmental
Risks
Managing
Risk
10.50.10.10.10.10.1
20.10.50.10.10.10.1
30.10.10.50.10.10.1
40.10.10.10.50.10.1
50.10.10.10.10.50.1
60.10.10.10.10.10.5
Table 7. Various safety investment strategies.
NameSafety Investment/CNY 10,000
Program 130
Program 240
Program 350
Program 460
Program 570
Table 8. Data analysis of the overall risk level in large bridge construction.
TimeProgram 1Program 2Program 3Program 4Program 5
00.37580.37580.37580.37580.3758
50.3495280.3360570.3225860.3091140.295643
100.3330480.3080640.2830810.2580970.233114
150.3221330.286750.2513660.2159820.180599
200.3056960.258810.2119240.1650380.118152
250.2887670.2302810.1717960.1133110.0548254
300.2755630.2062260.1368890.0675516−0.00178533
350.261480.1811190.1007580.0203965−0.0599646
400.2425820.1502360.0578892−0.0344572−0.126803
450.223450.1190720.0146935−0.0896848−0.194063
500.2043180.0879081−0.0285022−0.144912−0.261322
550.1851860.0567444−0.0716978−0.20014−0.328582
600.1660550.0255806−0.114893−0.255368−0.395841
Disclaimer/Publisher’s Note: The statements, opinions and data contained in all publications are solely those of the individual author(s) and contributor(s) and not of MDPI and/or the editor(s). MDPI and/or the editor(s) disclaim responsibility for any injury to people or property resulting from any ideas, methods, instructions or products referred to in the content.