Article

Deformation Characteristics and Energy Evolution Rules of Siltstone under Stepwise Cyclic Loading and Unloading

1
Beijing Key Laboratory of Urban Underground Space Engineering, University of Science and Technology Beijing, Beijing 100083, China
2
Civil and Resource Engineering School, University of Science and Technology Beijing, Beijing 100083, China
3
BGRIMM Technology Group, Beijing 100160, China
*
Authors to whom correspondence should be addressed.
Buildings 2024, 14(6), 1500; https://doi.org/10.3390/buildings14061500
Submission received: 12 March 2024 / Revised: 24 April 2024 / Accepted: 28 April 2024 / Published: 22 May 2024

Abstract

:
Uniaxial step cyclic loading and unloading tests on siltstone were conducted to investigate the mechanisms and evolution characteristics of rock deformation, including elastic, viscoelastic, and plastic aspects. This study proposes a method for separating dissipated energy into damage energy, which is used for particle slippage and structural fractures, and plastic energy, which remains in cracks that do not open after unloading. Additionally, elastic energy is divided into particle elastic energy, released by particle rebound, and crack elastic energy, released by the reopening of compacted cracks. The results indicate that as the stress amplitude increases, the damage energy consumption, plastic energy consumption, particle elastic energy, and crack elastic energy increase. At peak stress, significant expansion and penetration of cracks within the rock sample occur, leading to a sharp increase in damage energy consumption and a dramatic decrease in the rock sample’s mechanical properties, with the particle elastic energy dropping quickly. Plastic energy dissipation relates solely to cracks that do not reopen during unloading, with minimal change after reaching peak stress. The calculated damage variables, based on damage energy consumption, align with the deformation and energy characteristics of the rock, providing a reasonable description of the damage development process of the rock under cyclic loading and unloading.

1. Introduction

In engineering activities such as mineral resource extraction and tunnel excavation, the surrounding rock mass often experiences reciprocal or periodic cyclic loading [1,2]. Under cyclic loading, the internal pores and fractures within a rock mass continuously develop and interconnect, leading to progressive damage, which significantly affects its mechanical properties and failure mode [3,4,5]. Therefore, it is crucial to scientifically and accurately describe the deformation evolution mechanism and deterioration damage characteristics of rock during cyclic loading and unloading processes. This understanding is essential for the prevention and control of rock mass engineering disasters and the evaluation of long-term stability.
Currently, scholars have conducted various cyclic loading tests to analyze the mechanical response and deformation characteristics of rock materials. Gordon and Davis [6] studied the strain hysteresis characteristics of water-saturated rock under cyclic loading. Elliott and Brown [7] investigated the evolution of reversible and irreversible deformations in rock under cyclic loading. Yoshinaka et al. [8] analyzed the dilatancy deformation characteristics of four types of soft rocks through cyclic loading and unloading tests and reported an exponential relationship between the deformation modulus and plastic strain. Jia et al. [9] conducted triaxial cyclic loading and unloading tests on fine-grained sandstone and found that, as the number of cycles increased, the volumetric strain gradually decreased from compaction to dilation. Meng et al. [10] observed that, in triaxial cyclic loading and unloading tests, limestone exhibited post-peak strain softening characteristics, signifying brittle failure. Yang et al. [11] developed a fatigue damage creep model that accurately describes the entire deformation process of siltstone under cyclic loading.
The evolution of the mechanical properties of rock under cyclic loading is fundamentally driven by the accumulation and dissipation of energy [12,13,14]. Many scholars have studied the deformation and fracture evolution of rock under cyclic loading from an energy perspective. For instance, Thomas et al. [15] explored the relationship between rock fracture energy consumption and initial structural characteristics using fractal theory. Petrov et al. [16] investigated the effects of load frequency and amplitude on energy evolution during cyclic processes and discussed the energy mechanism of type I crack propagation. Xie et al. [17] researched the energy dissipation mechanism during the deformation and failure process of rock and proposed a rock failure criterion based on dissipated energy. Zhang et al. [18] and Meng et al. [19] observed that the energy during the cyclic process generally exhibits a nonlinear increase. Brantut and Petit [20] and Wang [21,22] conducted triaxial cyclic loading experiments and discovered that the energy required to induce shear cracks is significantly greater than that needed to induce tensile cracks. Zhang et al. [23] performed multilevel cyclic loading tests on coal, examining the energy dissipation characteristics and the influence of loading frequency on the energy dissipation rate.
In recent years, the study of rock damage has gained significant attention [24,25,26]. Scholars have developed various damage variable expressions based on the elastic modulus [27,28], residual strain [29,30], and energy principles [31,32]. However, the decay of the elastic modulus and the accumulation of residual deformation serve only as external indicators of damage and fail to quantitatively reflect the extent of damage. Energy, as the intrinsic driving force of failure, forms the foundation of damage models established on energy principles, enabling a more accurate and objective reflection of the evolution of damage in rock during deformation and failure. Liu et al. [33], Cheng and Li [34], Yang et al. [35], and Wang et al. [36] highlighted that the ratio of dissipated energy to input energy in loaded rock undergoes distinct stages of change. They also defined a damage variable for rocks based on dissipated energy. Liu et al. [37] proposed the concept of a compaction coefficient to describe the extent of rock compaction and proposed a damage constitutive model that accounts for the rock compaction process. Li et al. [38] incorporated initial damage considerations and established a damage variable suitable for fractured rock. Gong et al. [39] concentrated on the pre-peak deformation characteristics of brittle rock and defined the damage variable for brittle rock as the ratio of dissipated strain energy to constitutive strain energy. By conducting triaxial loading and unloading tests at various confining pressures, Miao et al. [40,41] developed a damage variable capable of describing the damage evolution throughout the entire cyclic process.
The abovementioned scholars have extensively researched the mechanical properties, failure modes, energy evolution, and damage during the process of rock deformation and failure. Their work has provided valuable references for this study. However, there is currently limited research that integrates the rock deformation process under cyclic loading and unloading with energy storage and release. This research also fails to differentiate between plastic energy dissipation and damage energy dissipation and lacks quantitative calculation methods for energy release due to rock particle rebound and the reopening of compacted cracks.
Therefore, this paper aims to analyze the mechanisms and evolution characteristics of elastic deformation, viscoelastic deformation, and plastic deformation of silty sandstone under uniaxial step cyclic loading. By decomposing the dissipated energy and elastic energy based on these mechanisms of deformation, new damage variables are defined based on energy dissipation due to damage and crack energy. This provides a theoretical basis for further understanding the mechanisms of rock failure under cyclic loading from an energy perspective.

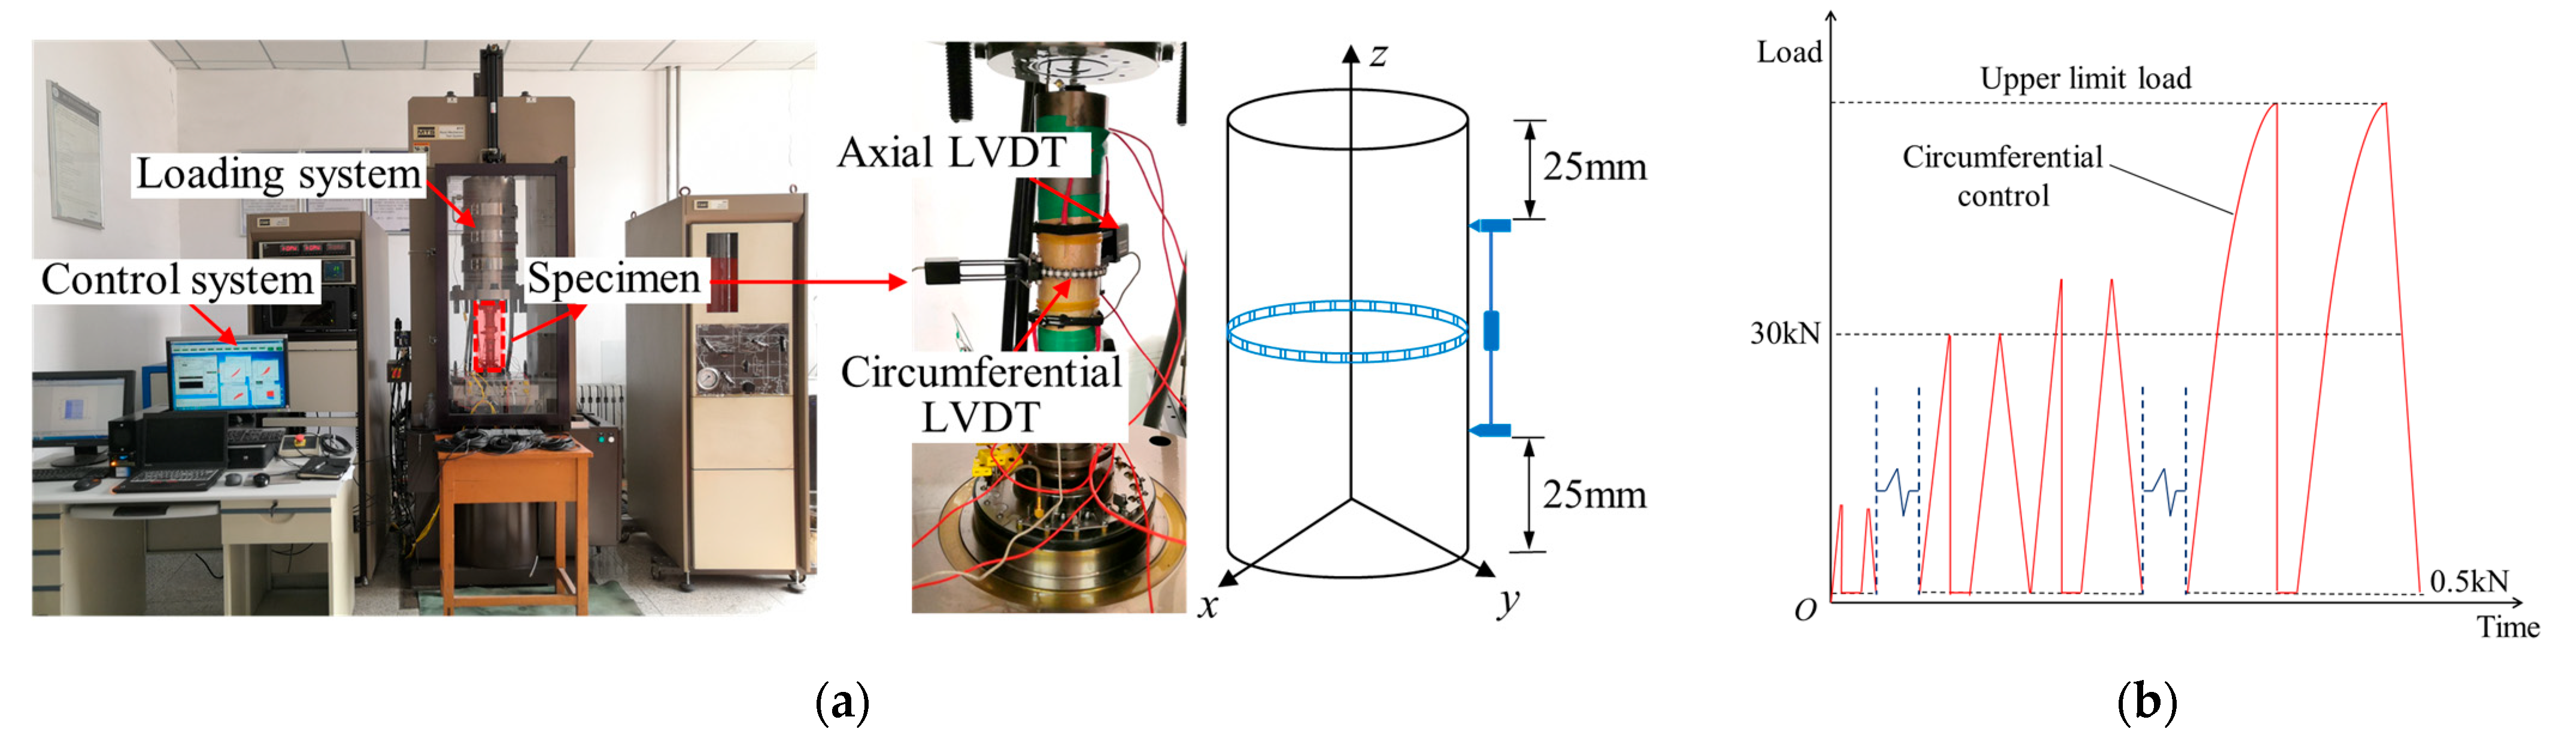
2. Uniaxial Step Loading and Unloading Test

2.1. Experimental Materials

As shown in Figure 1a, according to the International Society for Rock Mechanics (ISRM) standards, the diameter of all cylindrical specimens is 50 mm, the length is 100 mm, the unevenness of the upper and lower end faces is less than ±0.02 mm, the diameter error is less than 0.3 mm, and the axis deviation is less than 0.25°. The main mineral components of siltstone are quartz (78.58%), feldspar (6.66%), mica (5.37%), clay minerals (4.43%), garnet (1.76%), and other minerals (3.20%) (Figure 1b). Process mineralogy analyses show that mineral particle size ranges from 1 µm to 104 µm, and minerals with particle sizes smaller than 38 µm account for 71.67% of the minerals (Figure 1c). The rock pores are relatively well developed, and mercury intrusion porosimetry (MIP) tests indicate a porosity of 19.98% for the siltstone. The average density of the siltstone is 2.12 g/cm3, and the average P-wave velocity is 2165 m/s. The average uniaxial compressive strength (UCS) was measured to be 34.76 MPa, with minimal variation in the test results.

2.2. Experimental Scheme

Traditional uniaxial and triaxial loading tests are incapable of discerning the elastic, viscous, and plastic strains that occur in rock during testing. Consequently, a comprehensive analysis of the strain response mechanisms during experiments has been rendered impractical. To address this limitation, a uniaxial step loading and unloading test was devised for rock based on the deformation characteristics of siltstone under uniaxial compression. As shown in Figure 2, all tests were conducted using an MTS 815 rock mechanics test machine. The rock specimen was fitted with linear variable differential transformers (LVDTs), designed to measure axial and circumferential strains with maximum ranges of 5 mm and 8 mm, respectively. The loading scheme for specimen S6 (S7) was as follows: (1) Apply a constant rate load of 0.2 kN/s until reaching a stress amplitude of 3 kN (6 kN), followed by instantaneous unloading to 0.5 kN, with a 10 min hold; (2) Reload using a constant rate of 0.2 kN/s to attain a stress amplitude of 3 kN (6 kN), then unload at a constant rate of 0.05 kN/s to 0.5 kN; (3) Keep the lower load limit unchanged at 0.5 kN, and repeat steps (1) and (2) with a stress gradient of 6 kN until the stress amplitude reaches 69 kN (66 kN). In order to maintain a consistent strain change rate throughout the loading process and secure a complete post-peak full stress–strain curve, if the load exceeds 30 kN during the loading process, a circumferential deformation rate of 0.03 mm/min is applied to attain the stress amplitude.

3. Mechanism and Evolution Characteristics of Siltstone Deformation at Different Loading and Unloading Stages

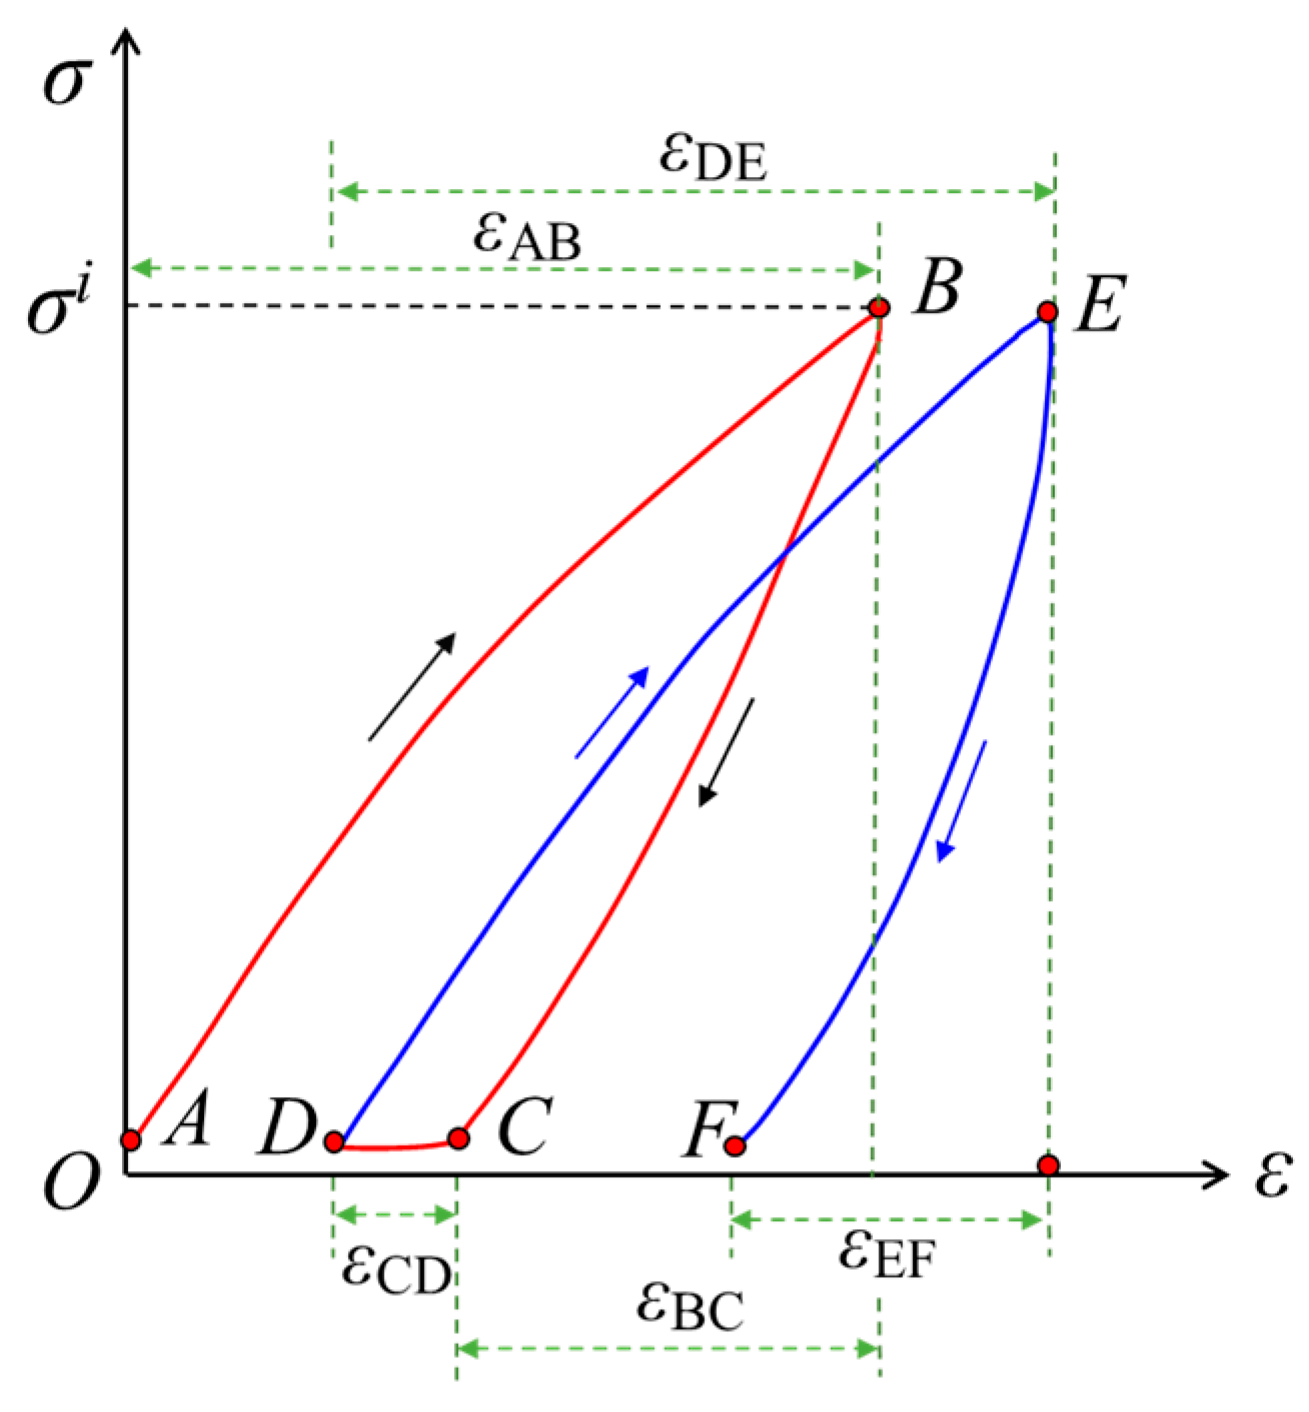
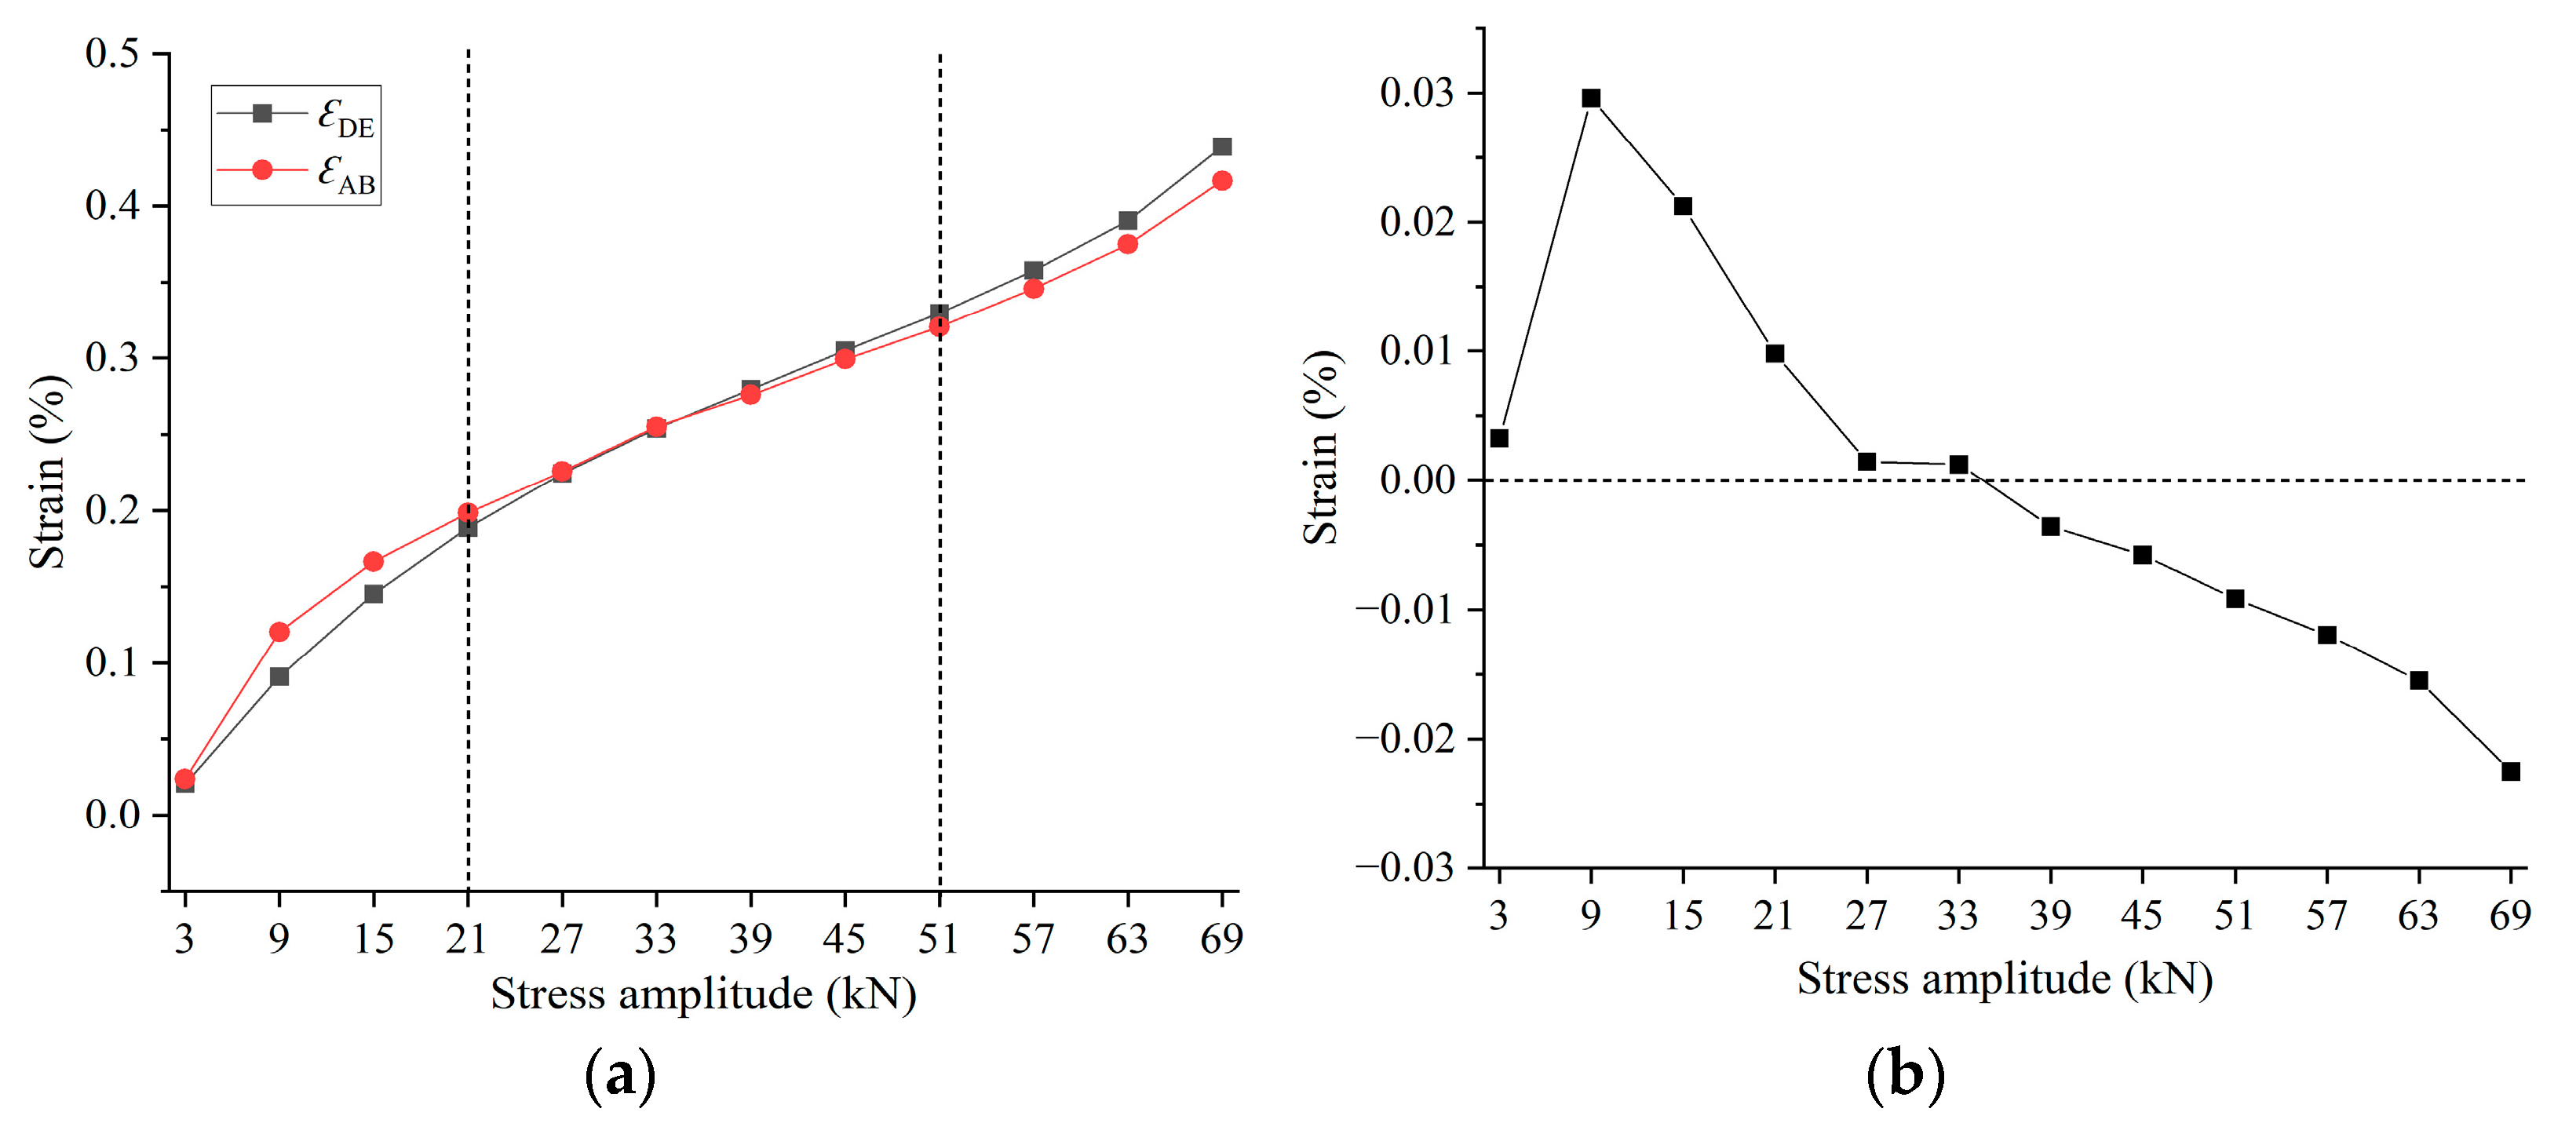
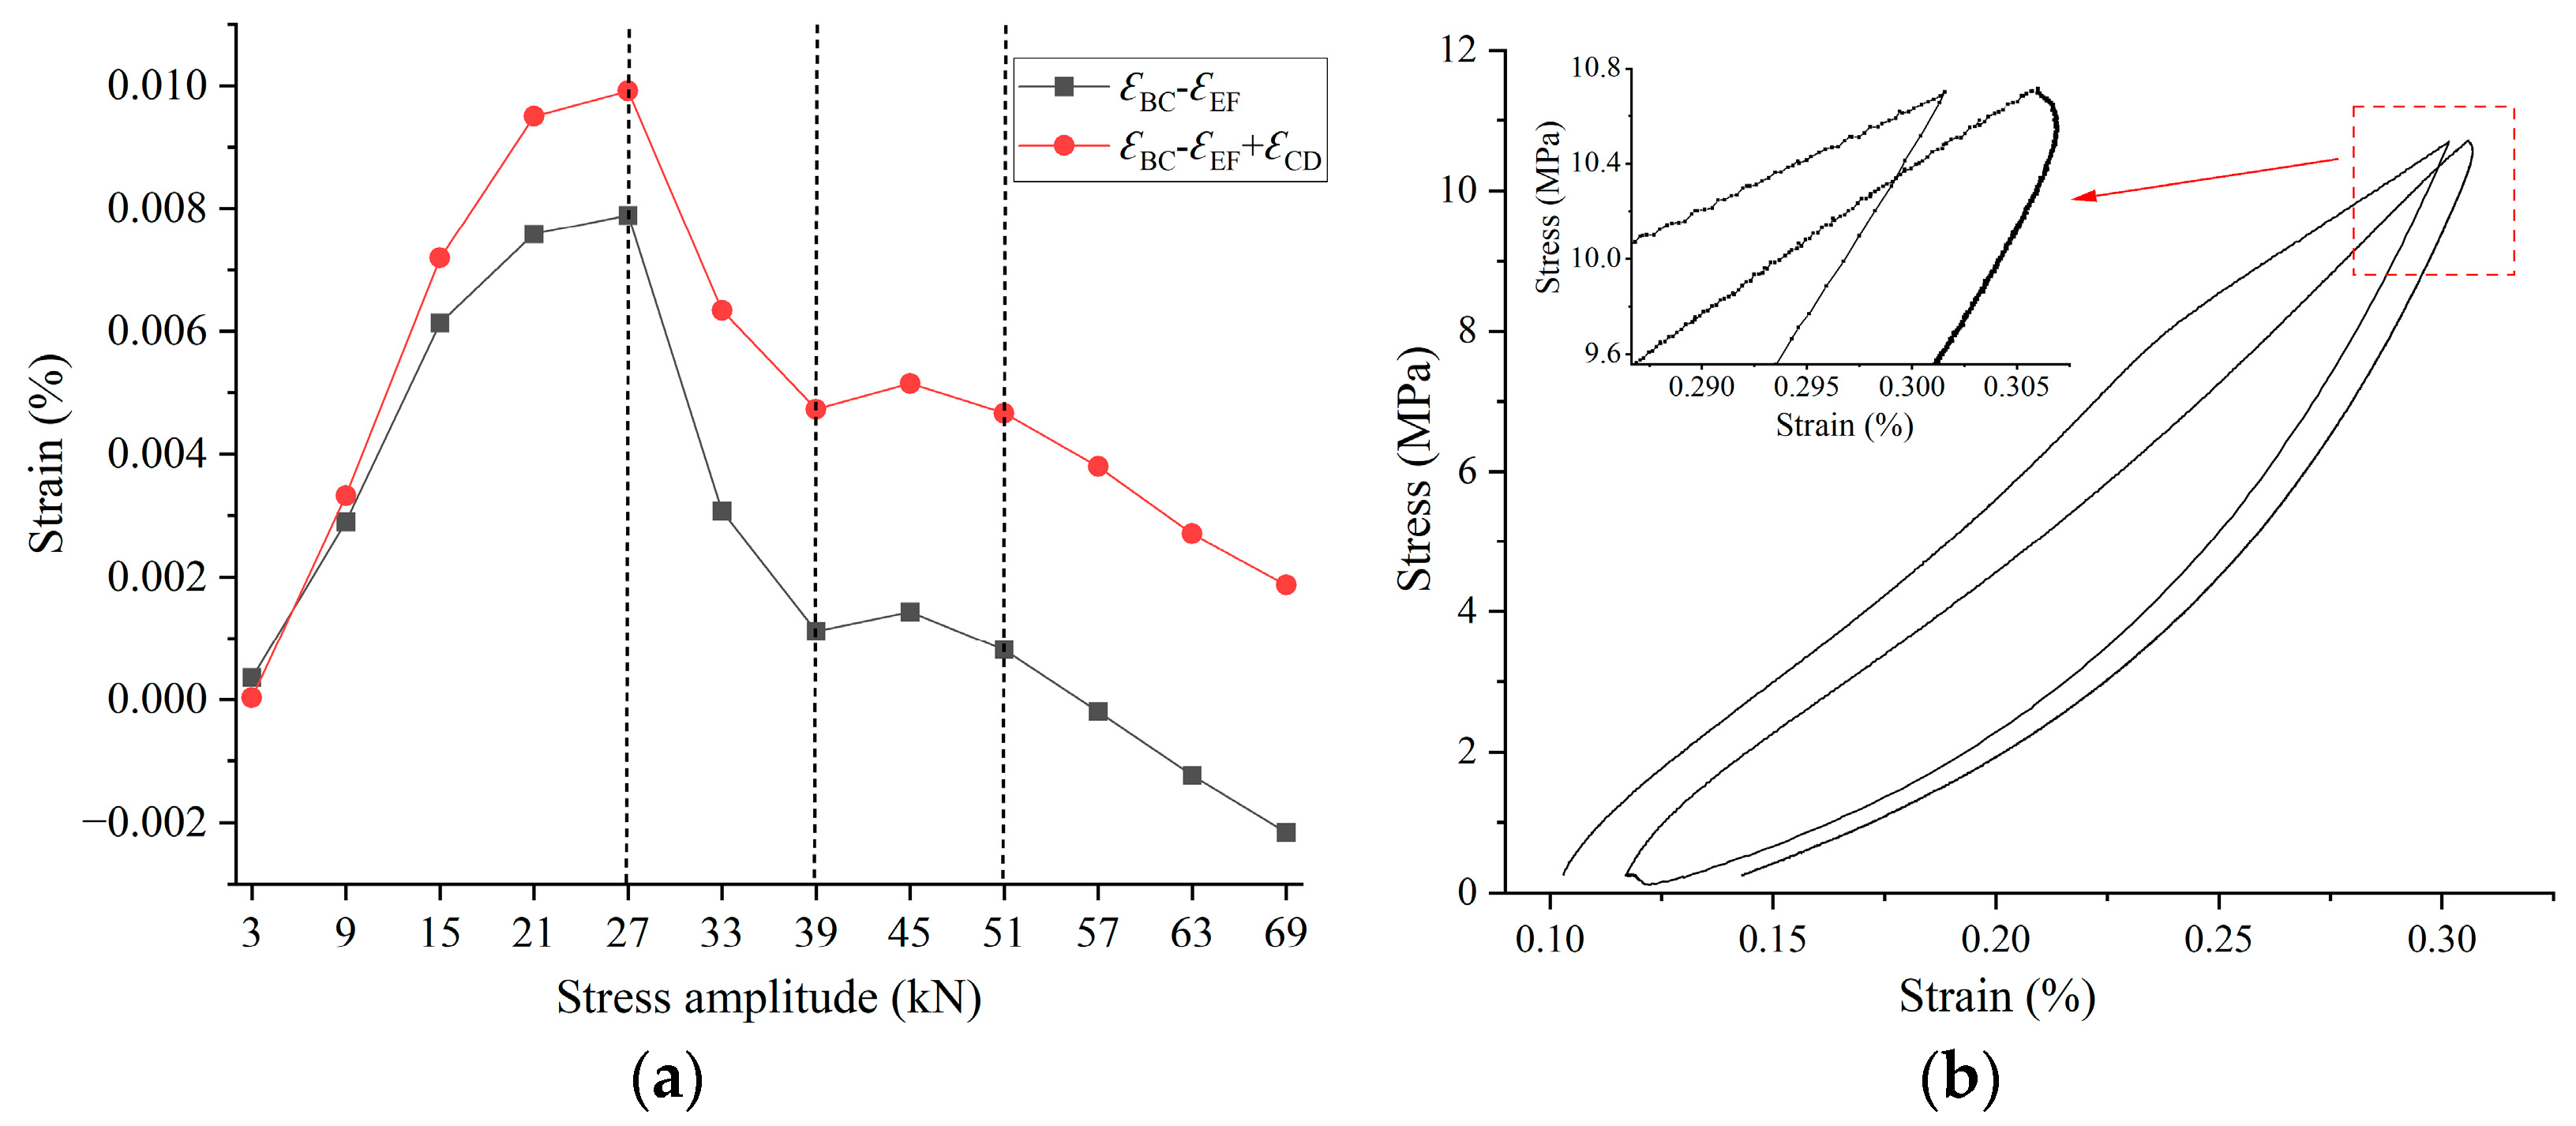
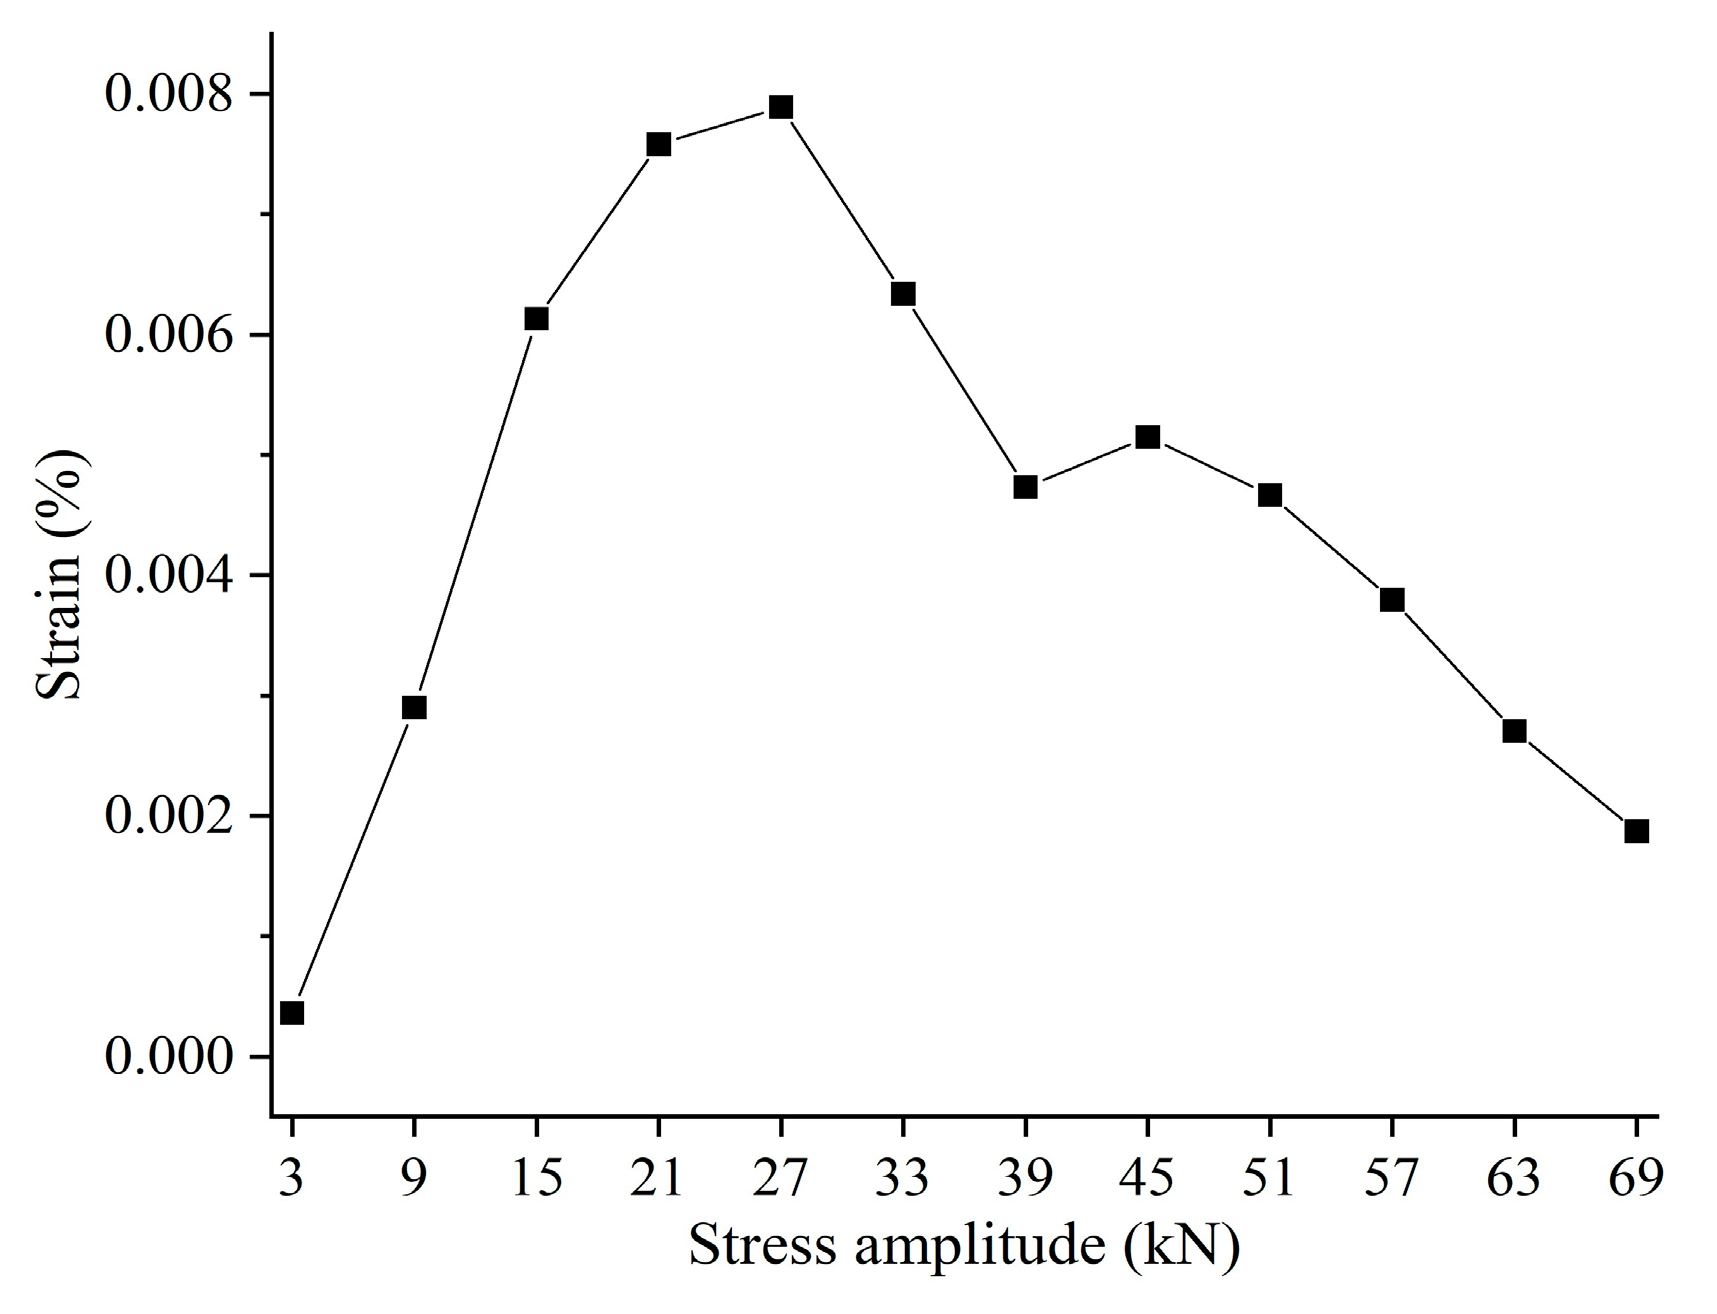
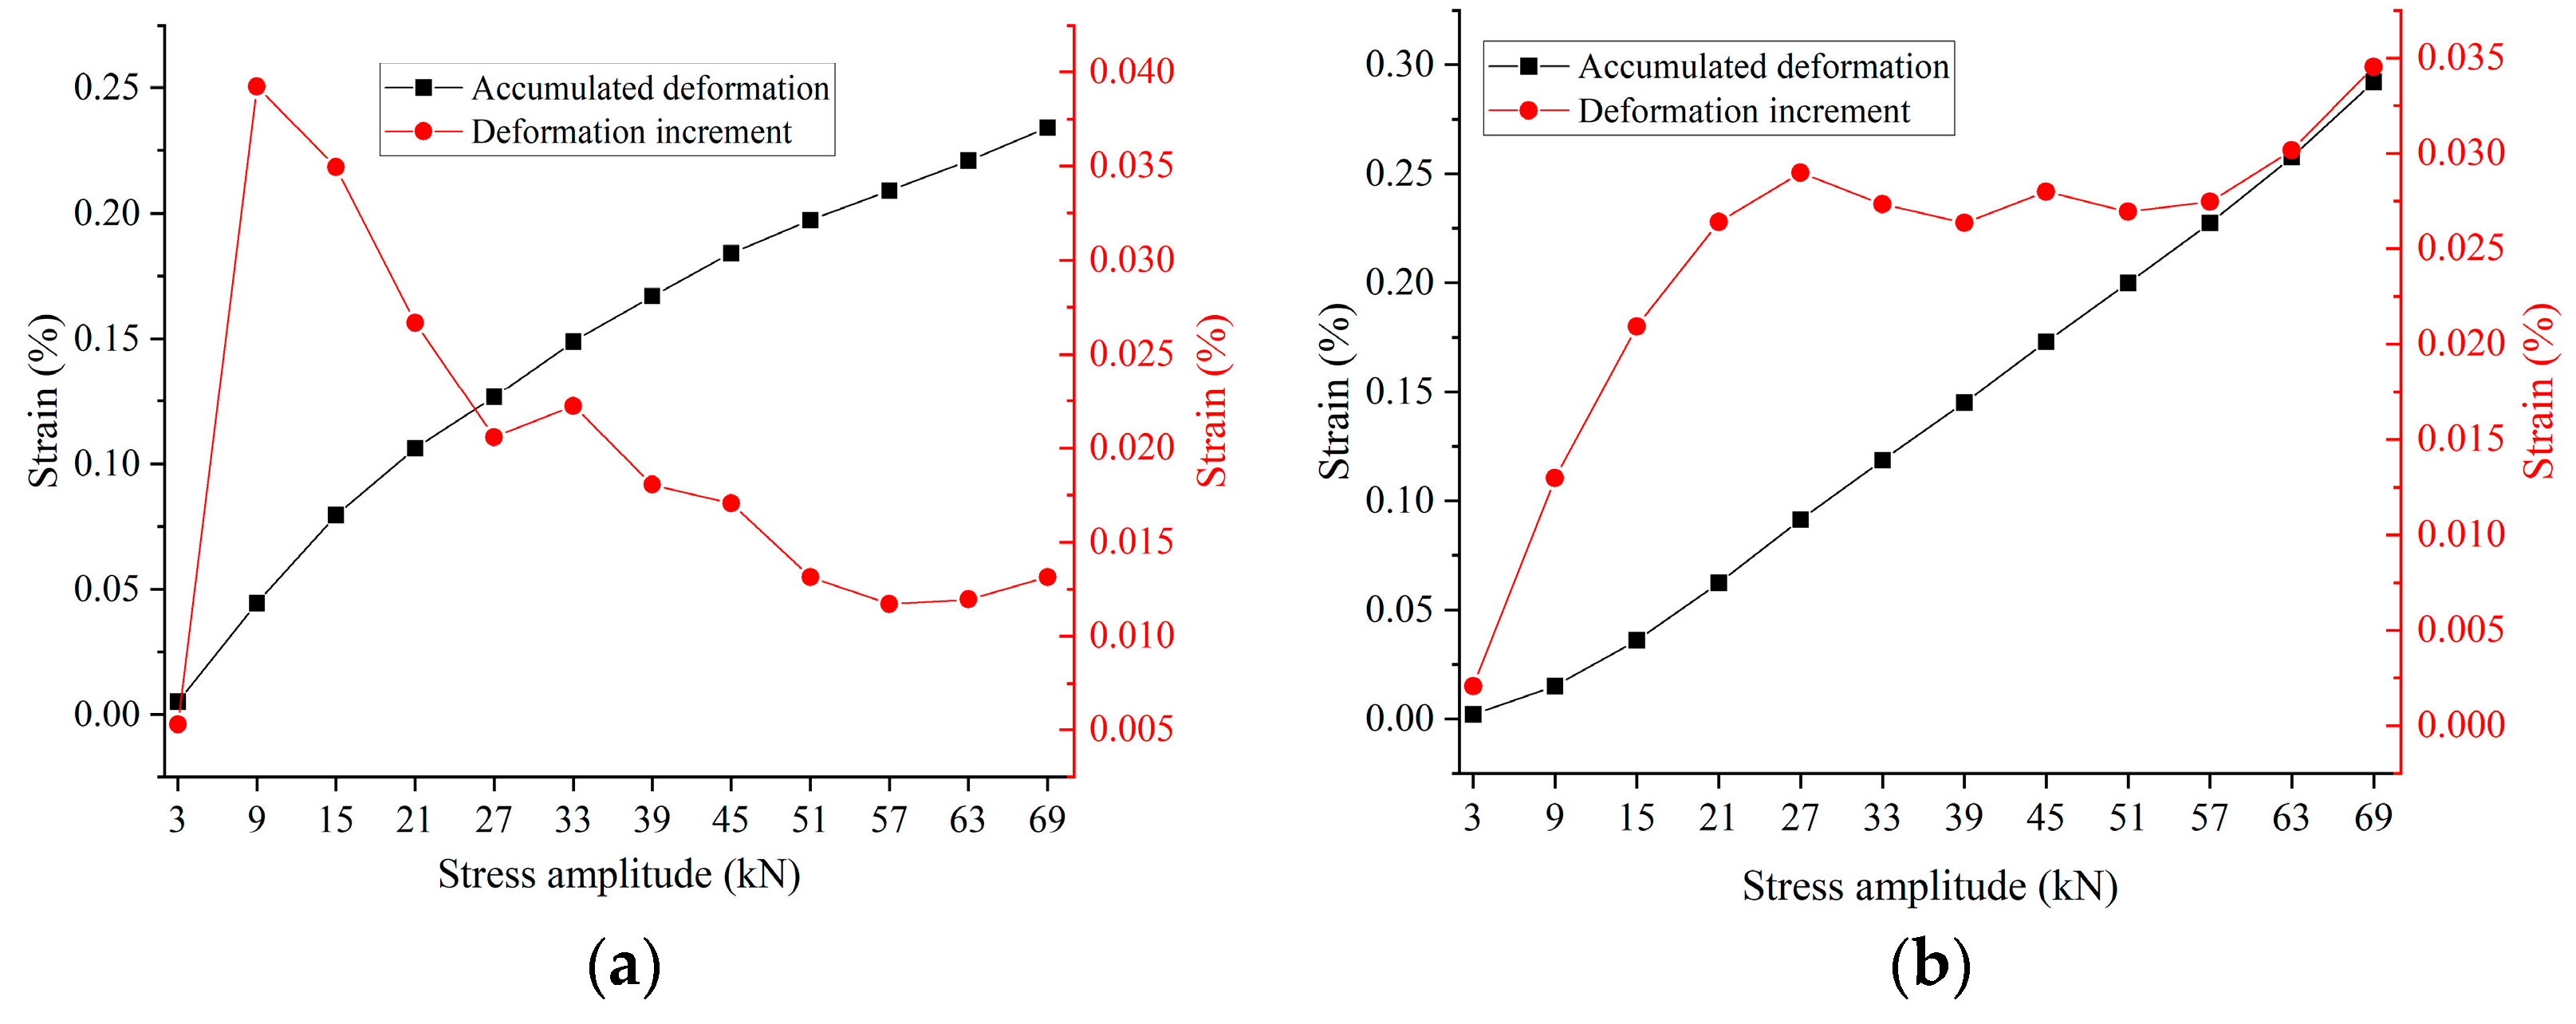
3.1. Deformation Characteristics of Siltstone Subjected to Stepped Cyclic Loading and Unloading

The mechanism and evolution characteristics of siltstone deformation at various loading and unloading stages are illustrated in Figure 3. The study conducted two tests on the S6 and S7 paths, respectively. The results were largely consistent; however, due to article length constraints, they are not included here. Notably, internal crack propagation in the rock displays a memory effect, whereby cracks merely exhibit rapid growth once the applied stress exceeds the previous maximum stress. In situations where the load during loading surpasses the previous maximum load, the rock’s loading curve continues to follow the pattern of the uniaxial compression curve. However, as the stress amplitude gradually increases, the irreversible deformation incurred by the rock during the loading and unloading process surpasses that of the uniaxial compression test. Consequently, the stepwise cyclic loading and unloading curve realigns toward increased strain.
Under axial loading, the axial deformation of the rock sample comprises the deformation of the rock particle body (load-bearing structural framework), the deformation of the cementing material between particles, the slip and dislocation of mineral particles, and the deformation caused by the closure of pores and cracks. Upon removal of the axial load, the deformation of the particle body immediately recovers. The dislocation slip between particles will gradually recover over time, whereas the damage to the original pores of the rock sample and the compression-induced closure of microcracks are irreversible post-unloading. Therefore, the siltstone exhibits elastic, viscoelastic, and plastic characteristics at the macroscopic level during the loading and unloading process. The plastic deformation remaining after each unloading cycle is collectively referred to as residual deformation, which continues to accumulate with an increase in the number of cycles, known as cumulative deformation.
As shown in Figure 4, to simplify the explanation, the strain during the loading and unloading process under the i-th load is defined as follows:
The first loading deformation is εAB (section A-B); the first unloading deformation is εBC (section B-C); the elastic aftereffect deformation is εCD (section C-D); the second loading deformation is εDE (section D-E); and the second unloading deformation is εEF (section E-F).
The relationship between the deformations εAB and εDE during the two loading phases of specimen S6, along with the stress amplitude, is depicted in Figure 5a. The calculation of εAB-εDE is presented in Figure 5b. When the stress amplitude ranges from 3 to 21 kN, the rock sample undergoes loading compaction. This leads to the initial pores being compacted and closed, resulting in a rapid increase in strain with an upward convex trend as the stress amplitude increases. However, as the initial porosity gradually decreases, the rate of strain change decreases. After one cycle of loading and unloading, the density of the rock increases, strengthening its resistance to deformation. Consequently, when loaded again to the same stress amplitude, the deformation of the rock decreases, with εAB-εDE > 0. When the stress amplitude ranges from 27 to 33 kN, the rock specimen enters the elastic stage, and the mechanical properties of the rock remain essentially unchanged after one cycle of loading and unloading, with εAB-εDE > 0. Upon reaching a stress amplitude of 39–51 kN, the rock specimen enters the stable crack development stage. During loading, cracks gradually initiate, and the strain increases linearly with increasing stress amplitude. After one cycle of loading and unloading, the rock’s resistance to deformation decreases, leading to an increase in the amount of rock deformation, with εAB-εDE < 0. When the stress amplitude exceeds 51 kN, the rock specimen enters the unstable fracture development stage. Cracks initiate and propagate rapidly, causing the strain to increase in a concave manner as the stress amplitude increases. The rate of strain change gradually intensifies, resulting in a rapid decrease in the resistance of the rock to deformation. Consequently, the absolute value of εAB-εDE quickly increases.
The stress–strain curve of the elastic aftereffect (section C-D) is shown in Figure 6. After axial unloading, the rock exhibits viscoelastic characteristics, with the axial strain gradually decreasing over time. As the stress amplitude increases step by step, the amount of elastic deformation exhibiting delayed recovery enlarges correspondingly. However, the elastic aftereffect curves for stress amplitudes ranging from 51 to 69 kN show a high degree of similarity, with no significant differences observed in the recovered deformation values. The ratio of viscoelastic deformation to total loading deformation progressively decreases. This indicates that there exists an upper limit for the value of viscoelastic deformation in rock, and it is not infinitely scalable with stress amplitude.
The difference (εBC-εEF) between the deformations of the two unloading recoveries was calculated and plotted in Figure 7a. It can be observed that during the compaction stage (3–21 kN), εBC-εEF is greater than zero and increases as the stress amplitude rises. This indicates that new plastic deformation occurs in the rock during the second unloading process, resulting in less deformation recovery afterward. Taking the fourth cycle in Figure 7b as an illustration, the axial stress initially decreases during unloading, while the axial strain continues to increase, resulting in εBC < εEF upon completion of unloading. This occurs as the stress diminishes gradually during the unloading process, facilitating the expansion of rock cracks. However, during the rapid unloading process, the rock cracks do not have sufficient time to expand, resulting in predominantly elastic deformation. During the compaction stage (3–21 kN), the higher the stress amplitude and the extended unloading duration, the more significant the plastic deformation produced during the slow unloading process. This plastic deformation corresponds numerically to the difference in deformation recovery between the two unloading periods, εBC-εEF.
After entering the elastic stage (greater than 27 kN), εBC-εEF decreases as the stress amplitude increases. When the stress amplitude is between 39 and 51 kN (the stable crack development stage), εBC-εEF ≈ 0, which indicates that the deformation recovered during the two unloading processes is essentially equal. This suggests that, at higher stress amplitudes, the microstructure of the rock tends to reach a similar state after rapid and slow stress release.
Upon entering the unstable fracture development stage (57–69 kN), εBC-εEF < 0, indicating that the deformation recovery during slow unloading is greater than that during rapid unloading (Figure 7). This suggests that, at high stress amplitudes and extended unloading times, not only does elastic deformation recovery and plastic deformation occur during slow unloading, but viscoelastic deformation recovery also occurs. Therefore, when calculating the difference in strain recovery between two unloading processes, the contribution of the elastic aftereffect segment εCD cannot be ignored. The calculations consistently show that εBC-εEF + εCD is always greater than 0. By disregarding the small portion of unrecovered viscoelastic deformation during slow unloading, it can be considered that the value of εBC-εEF + εCD is the plastic deformation generated during the second unloading process. By analyzing the deformation characteristics across various stages to calculate the plastic deformation generated during unloading, as depicted in Figure 8, it becomes apparent that plastic deformation first increases and then decreases with increasing stress amplitude. This demonstrates that the magnitude of plastic strain generated during unloading is not solely determined by the stress amplitude.
The deformation characteristics of the cumulative strain and strain increment at points D and F under various amplitudes are shown in Figure 9. It is evident that the loading and unloading curves exhibit distinct properties. The first loading and unloading curve displays an upward convex shape, while the second loading and unloading curve exhibits a concave shape. During the first unloading, instantaneous unloading occurs, and minimal plastic deformation is observed. The plastic deformation during loading and unloading is equivalent to the plastic deformation generated during the loading phase. Consequently, the residual deformation at point D conforms to the pattern of εAB and follows the stages of compaction, elasticity, stable crack development, and unstable fracture development. On the other hand, the second unloading involves slow unloading, which leads to plastic deformation during both loading and unloading. The plastic deformation during loading and unloading = the plastic deformation generated by loading + plastic deformation generated by unloading. As a result, at point F, the plastic deformation increases with increasing stress amplitude during the compaction stage. During the stages of elastic deformation and stable crack expansion, the plastic deformation experiences a slight decrease before stabilizing. As the crack undergoes unstable expansion, the rate of plastic deformation increases rapidly.

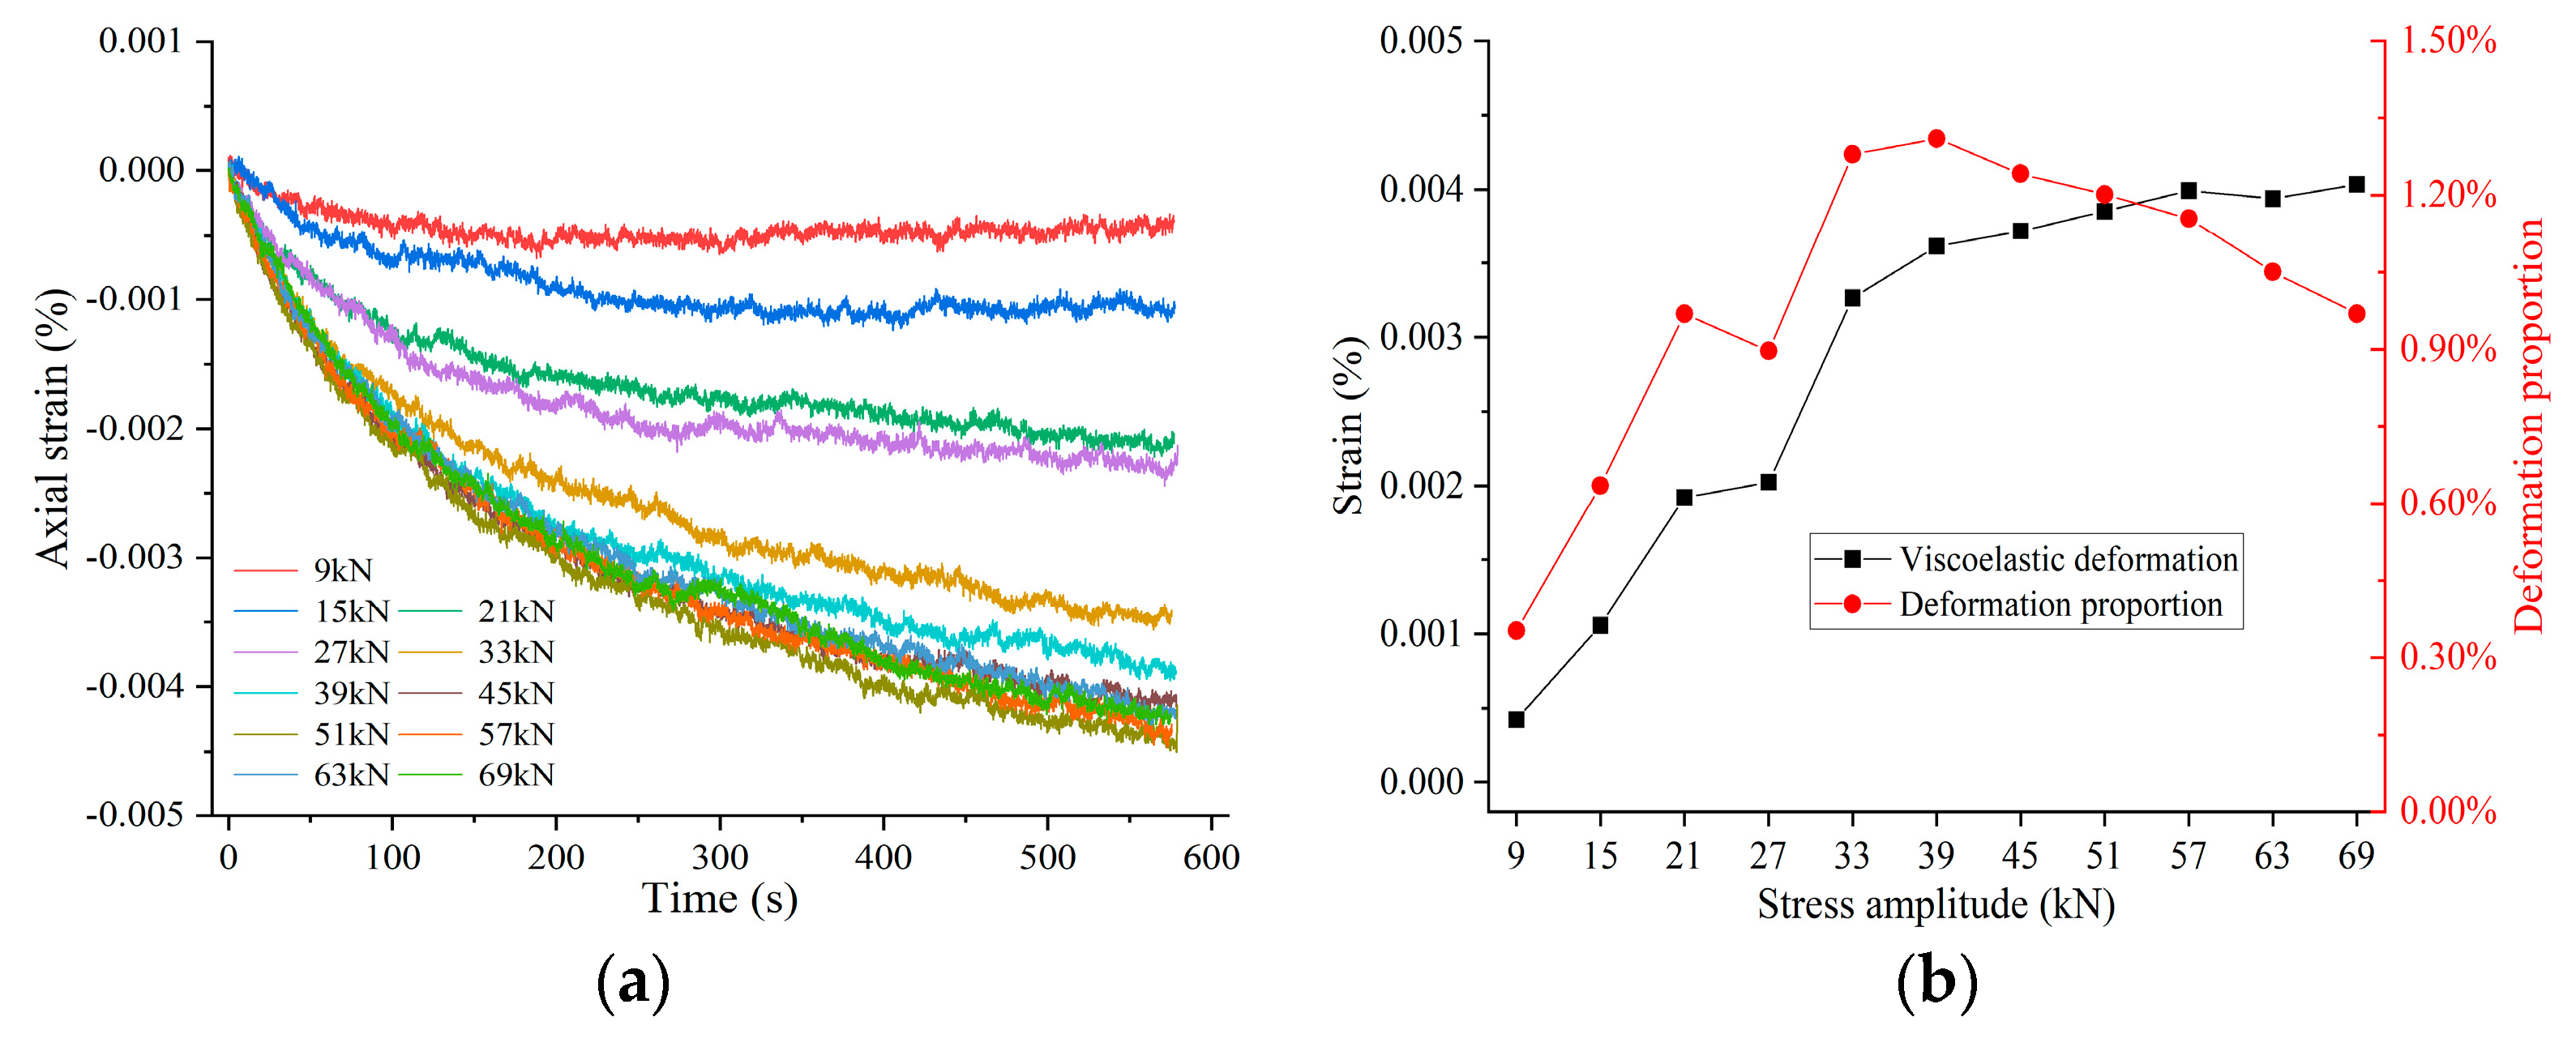
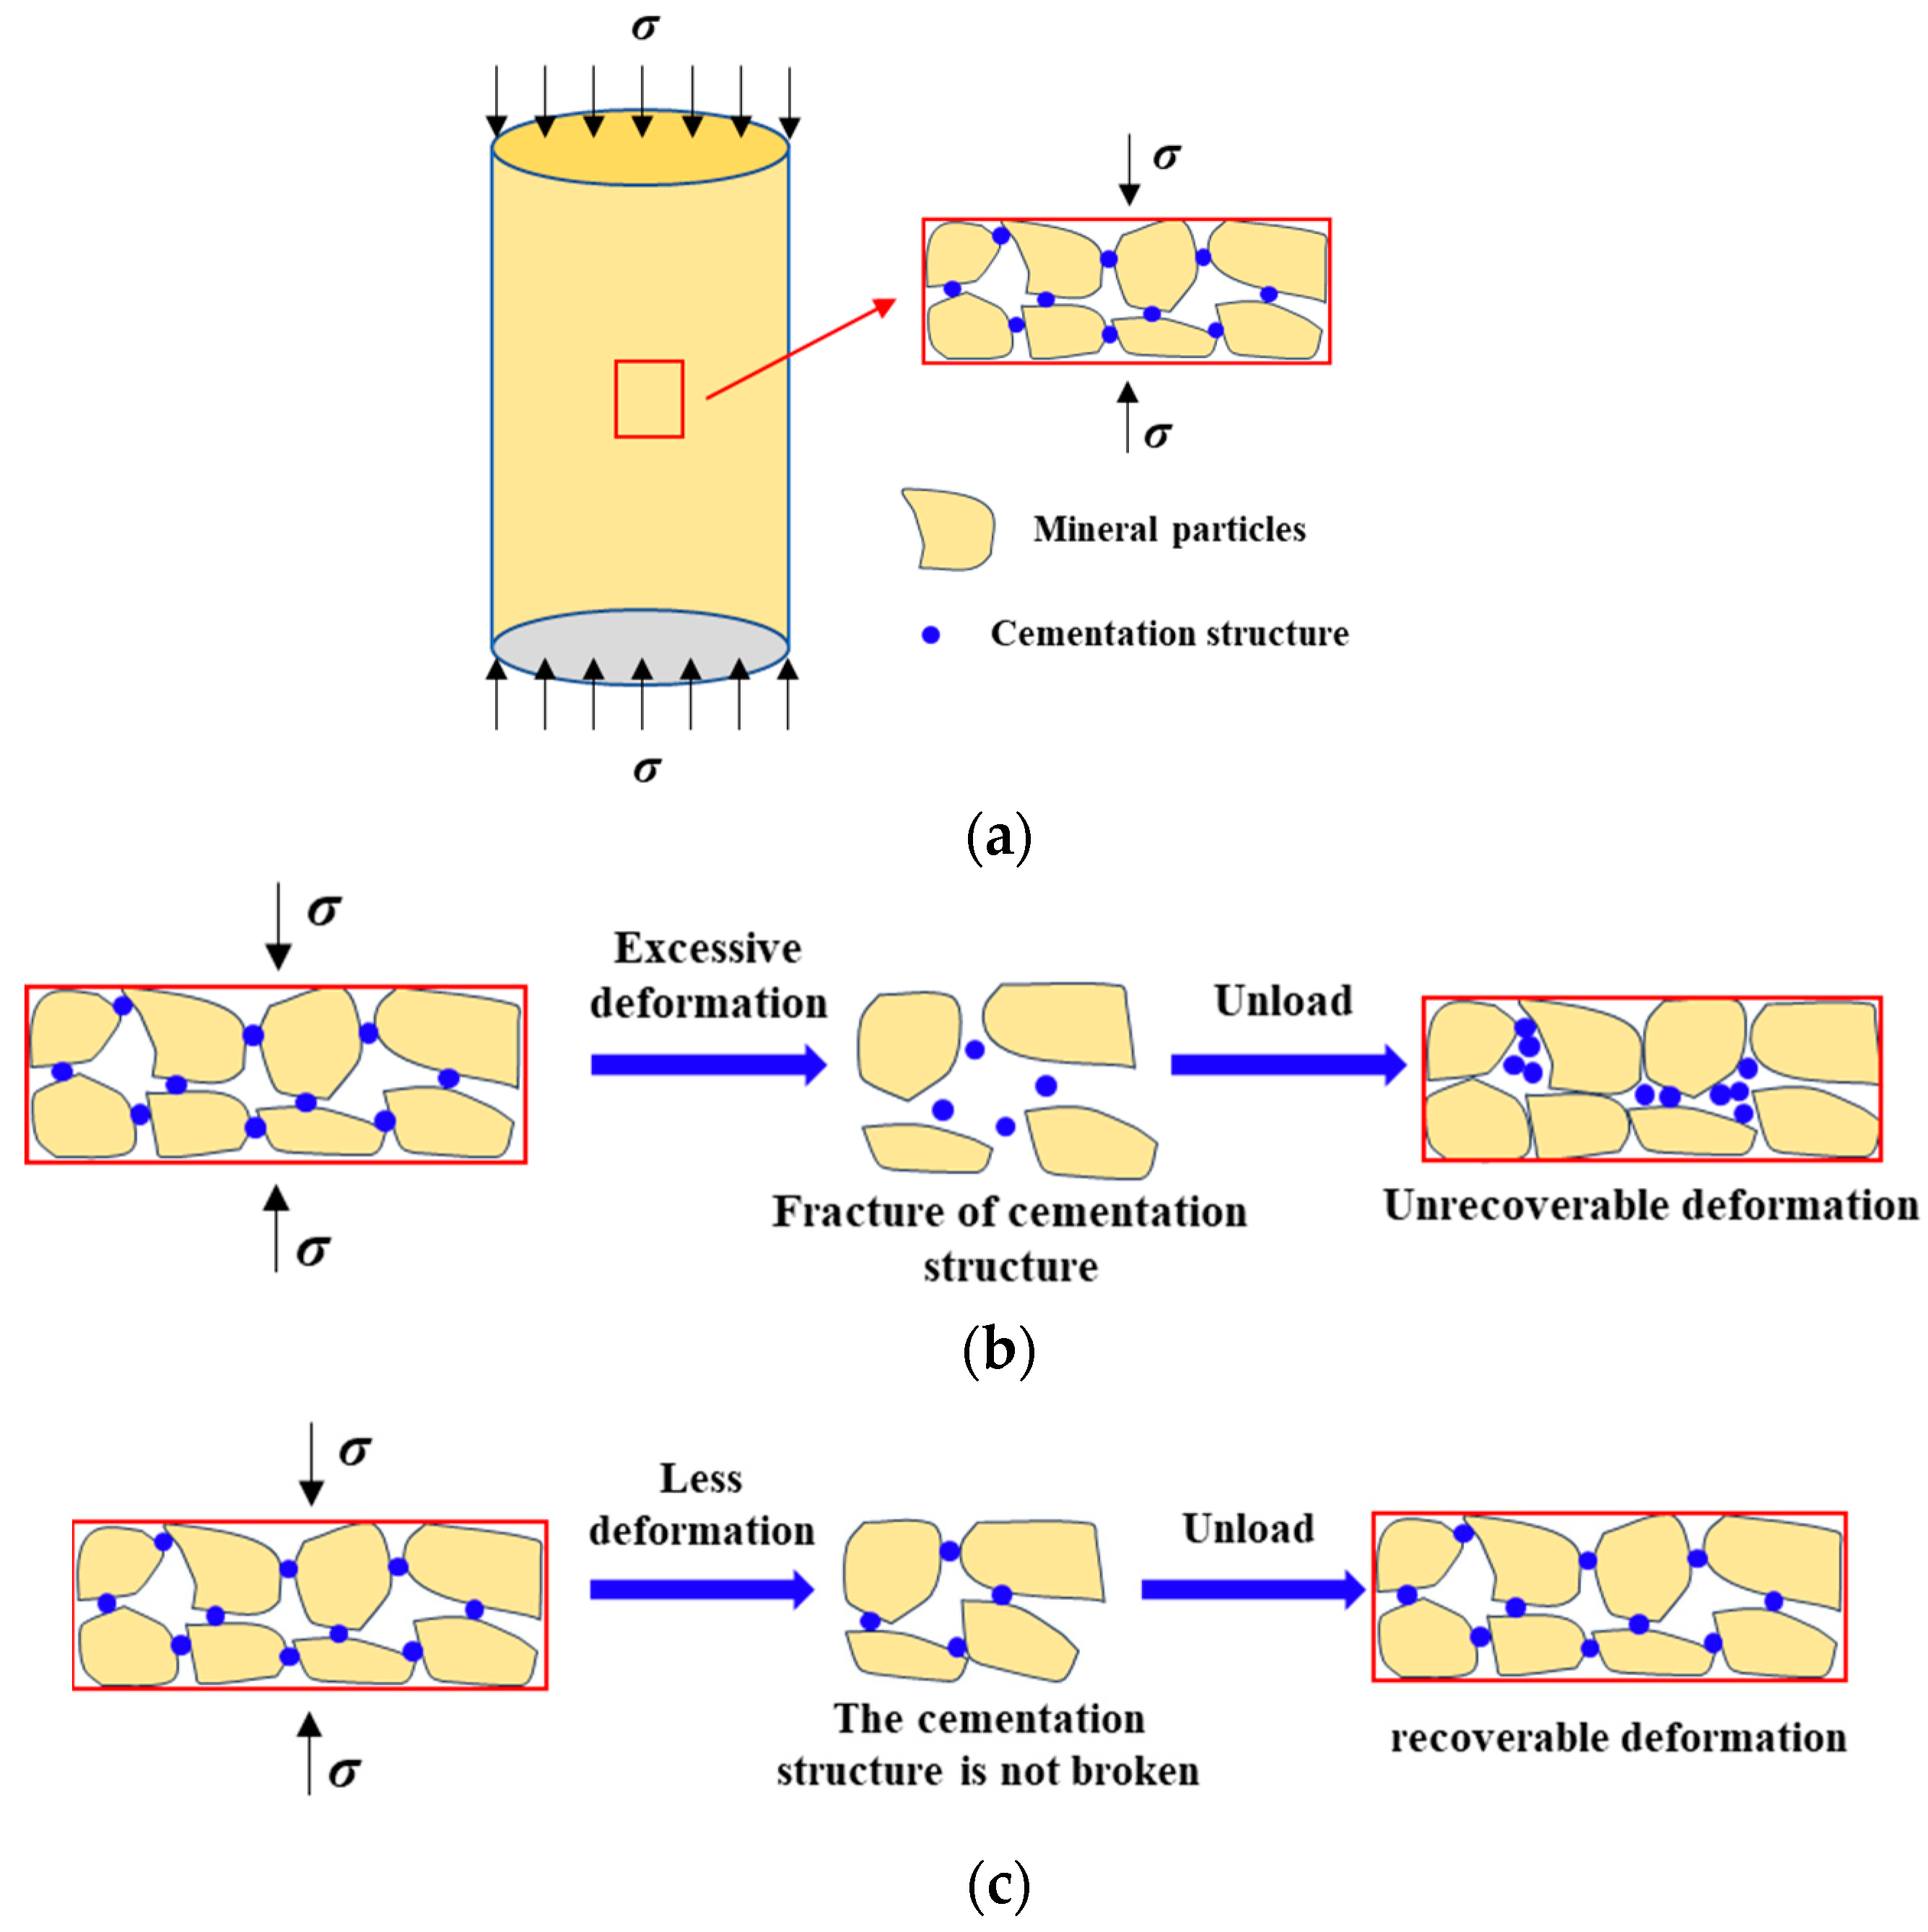
3.2. Deformation Mechanism of Siltstone under Uniaxial Loading and Unloading

Based on the deformation development process, the stress–strain curve of rock can be divided into five stages:
(1) Crack closure stage I: During the initial phase of loading, the majority of the initial pores and cracks within the rock progressively close under the load’s influence. The deformation at this stage exhibits nonlinear characteristics, with changes in the rock’s structure and properties being largely irreversible, allowing only certain cracks to reopen post unloading.
(2) Elastic stage II: Once the stress surpasses the closure stress σcc, the initial cracks within the rock are essentially sealed, transitioning into the elastic deformation phase. At this stage, crack initiation and propagation are virtually absent, and the deformation can be characterized as linear.
(3) Stable crack expansion stage III: Once the stress surpasses the crack initiation stress σci, the rock displays nonlinear behavior, attributed to the progressive emergence of new cracks and the expansion of existing cracks. While this stage is predominantly characterized by elastic deformation, the onset of plastic deformation is evident.
(4) Unstable crack expansion stage IV: Once the stress surpasses the damage threshold σcd, crack expansion undergoes a fundamental change. During this stage, cracks progressively widen and ultimately coalesce, with marked nonlinear and plastic deformations and significant alterations in the rock’s internal structure.
(5) Post-peak stage V: Upon reaching the peak stress σc, numerous cracks expand and coalesce, resulting in the formation of a macroscopic fracture surface. Consequently, the rock’s strength declines abruptly, and there is a substantial increase in plastic deformation.
The preceding five stages elaborate on the processes of rock elastic and plastic deformations, yet the mechanisms behind viscoelastic and viscoplastic deformations remain unknown. As illustrated in Figure 10a, a microscopic cross-section of the rock specimen was analyzed to examine the deformation mechanism of siltstone under step cyclic loading. As illustrated in Figure 10b, siltstone utilizes quartz and feldspar as its fundamental skeleton. The microstructure is characterized by a loose, broken, and honeycomb-shaped configuration. Irregularly shaped quartz particles adhere to each other, forming the fundamental skeleton. Clay minerals act as binders, and the cementation quality is low. The cementation surrounding the skeletal particles constitutes less than 30% of the total mineral content. The pore structure in the siltstone is relatively well developed, and the mercury intrusion porosity (MIP) test indicated a porosity of 19.98%. During the loading process, as stress levels increase, the mineral particles within the rock begin to shift and separate. When deformation surpasses the tolerable limits of the cemented structures that connect the mineral particles, this results in the breakdown of these structures and the transformation of mineral particles into discontinuous nodes. Currently, the strain resulting from particle dislocation slip is irreversible; thus, upon the application of axial stress, siltstone undergoes viscoplastic deformation, a phenomenon typically observed only during the creep of conventional rock. Furthermore, during the ongoing loading and unloading process, fractured clay minerals fill the pores between mineral particles, thereby reducing rock porosity and inducing plastic deformation.
As illustrated in Figure 10c, when the cementation between certain rock mineral particles is robust, or if the deformation of these particles is minimal and does not exceed the deformation threshold of the cementation structure, the cementation structure among the rock mineral particles remains intact. Upon unloading the axial stress, the cementing material directs the mineral particles toward a state of reduced deformation, thereby restoring viscoelastic deformation and diminishing axial deformation.
It is important to note that viscoelastic deformation during loading is significantly less than elastic deformation. The magnitude of viscoelastic deformation is governed by the axial stress σ and the loading rate. During instantaneous loading, viscoelastic deformation is virtually absent.

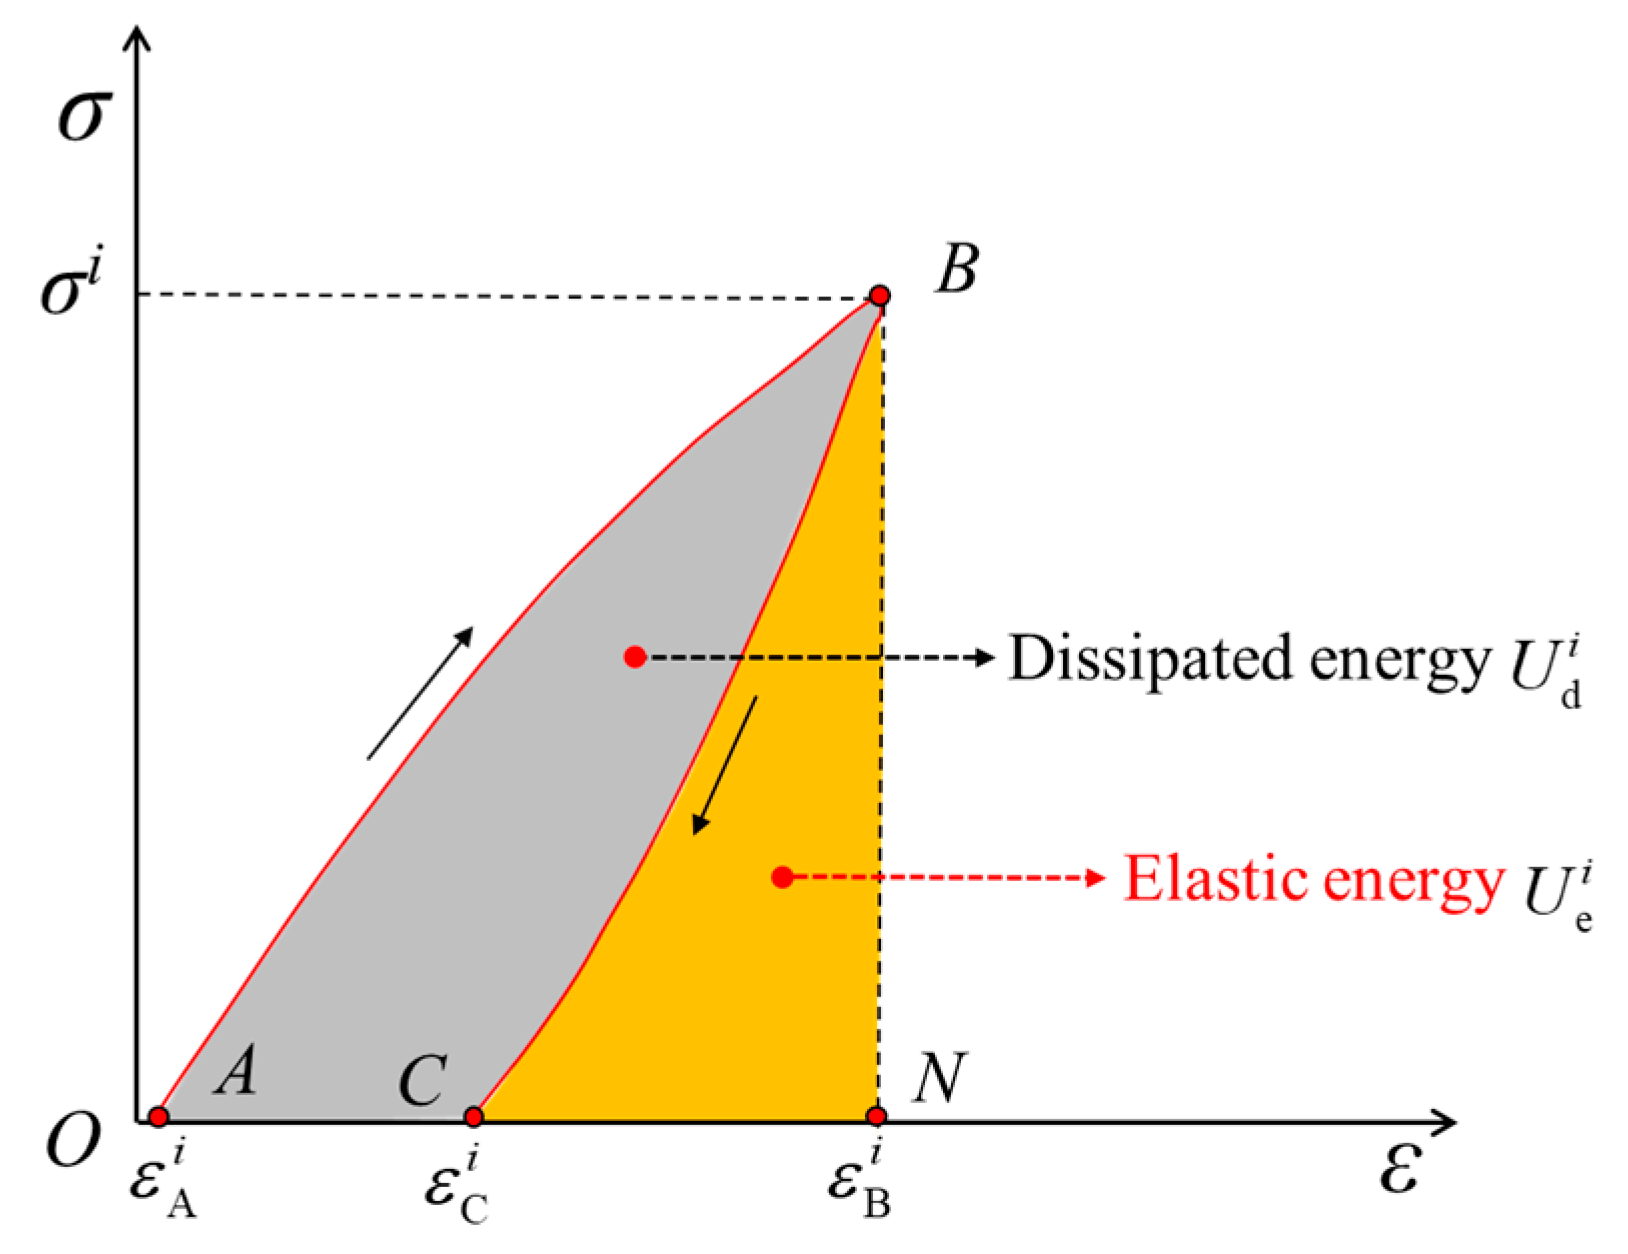
4. Calculation Method of Dissipative Energy and Elastic Energy Based on Deformation Evolution Characteristics

The phased deformation characteristics of rocks under stepped cyclic loading are essentially the mechanical manifestations of the compaction of original micropores and the nucleation, expansion, and coalescence of new cracks. The interaction between the external load and the rock can be considered a closed system of energy transfer, transformation, and release. Due to rock heterogeneity and scale differences, it can sometimes be challenging to effectively explain certain problems solely through deformation analysis. By combining energy and deformation, a more universally applicable description that closely aligns with the nature of rock deformation and damage can be obtained.
As shown in Figure 11, according to the law of energy conservation, assuming there is no heat exchange during the loading and unloading process of the rock, the total energy density U i of the i-th cycle during the loading and unloading process can be divided into elastic energy density U e i and dissipation energy density U d i , as follows:
U i = ε A i ε B i σ i d ε i
U e i = ε B i ε C i σ i d ε i
U d i = U i U e i
where ε A i is the minimum value of the loading strain in the i-th cycle (%), ε B i is the maximum value of the loading strain in the i-th cycle (%), and ε C i is the minimum value of the unloading strain in the i-th cycle (%).
Figure 12 presents the calculations of the total energy density, elastic energy density, and dissipated energy density for rock samples at various amplitude levels, using specimen S6 as an example. Equations (1)–(3) are used for the calculations. Based on the unloading rate, the first loading and unloading at each amplitude level are recorded as instant unloading, while the second loading and unloading are recorded as slow unloading. The energy during the two loading and unloading processes increases with increasing stress amplitude, with the proportion of elastic energy being greater than the dissipated energy.
The occurrence of plastic deformation is attributed to the dissipated energy during the loading and unloading process. As displayed in Figure 13, a comparison between the plastic deformation at different amplitudes in Figure 8 and the increase in dissipated energy in Figure 12 reveals consistent patterns.
As depicted in Figure 14a, the stress and strain conditions at the intersection of the initial unloading and subsequent loading processes are identical. However, this unloading–reloading cycle requires a significant amount of energy consumption, which is quantitatively equivalent to the area enclosed by the hysteresis loop formed by the unloading and loading curves. During a large number of cycles, the energy density of the hysteresis loop accounts for more than 80% and 60% of the dissipated energy density during the loading and unloading processes, respectively (Figure 14b). The stress amplitude at the intersection point of loading and unloading is lower, and loading to this intersection point does not result in extensive plastic deformation. Consequently, the process of unloading and reloading to the intersection point does not entail substantial energy consumption, and the energy within the hysteresis loop cannot be considered as dissipated energy lost during the unloading and reloading processes.
As shown in Figure 15, based on the above analysis, combined with the plastic deformation generation mechanism during rock loading and unloading, the dissipated energy is refined and decomposed into damage energy dissipation U dd i (SABMD) and plastic energy dissipation U de i (SMCD). The energy dissipated due to damage corresponds to the energy consumed as a result of factors such as fracture of the rock particle structure, dislocations of particle slip, and friction between cracks. This energy corresponds to the plastic deformation caused by fractures in the rock during the loading process and the slip of particles during the unloading process. The energy dissipated due to plastic deformation corresponds to the energy contained within the cracks that are not fully opened during the unloading process of the rock sample. This energy pertains to the plastic deformation of closed cracks that remain tightly shut during loading and cannot be restored after unloading. Plastic energy dissipation is irreversible and is only present within the specimen because the cracks fail to open during unloading. Its magnitude varies with changes in the unloading rate and stress amplitude. If the unloading rate is sufficiently slow, the cracks can be completely opened once again, and the plastic energy dissipation during this scenario corresponds to the energy within the completely compacted cracks.
As shown in Figure 16, the energy density of rock samples at different amplitudes is calculated using the division method illustrated in Figure 15. The deformation recovery mechanism during two unloading cycles in Figure 6 demonstrated that rapid unloading results in significant stress changes within a short period of time, making it difficult for microcracks to return to their initial state and causing numerous microcracks to remain closed. By contrast, slow unloading allows microcracks more time to gradually recover and increases their likelihood of returning to their initial state. As a result, the plastic energy consumption during slow unloading is lower than that during instantaneous unloading. However, slow unloading also involves more energy dissipation due to relative friction between rock particle slippage and cracks. Therefore, after the compaction stage (when the stress amplitude exceeds 21 kN), the damage energy consumption during slow unloading becomes greater than that during instantaneous unloading.
During the compaction stage (<21 kN), weak structures within the rock rupture, and pores and cracks compress and close, resulting in a significant dissipation of energy, primarily in the form of damage energy. Consequently, in Figure 14b and Figure 16b, the plastic energy consumption/dissipation energy during the first loading and unloading cycle was less than 50%. The primary occurrence of structural cracks transpires during the initial loading process, causing the damage energy consumption during the first loading and unloading stage to exceed that during the second loading and unloading stage, which corresponds to εAB-εDE > 0 in Figure 5. During the elastic stage and stable crack development stage (27–51 kN), the internal structure of the rock sample undergoes increasing compression and becomes more densely compacted, with structural defects such as microcracks reaching a stable development state. The dissipated energy at this stage is predominantly plastic energy consumption, with the growth rate of damage energy consumption slowing. It is not until the unstable fracture development stage (57–63 kN) that rock damage and fracture increase, resulting in a rapid increase in damage energy consumption.
It can be observed from the recovery mechanism of elastic strain during the unloading process that elastic strain primarily consists of the deformation recovery of rock particles and the reopening of compaction cracks. The recovery process of elastic deformation during rock unloading essentially involves the release of elastic energy. Therefore, as shown in Figure 17, the elastic energy U e i released during the unloading process can be divided into the particle elastic energy U eg i released by the rebound of rock particles and the crack elastic energy U eh i released by the reopening of compacted cracks. In the early stage of unloading, the internal cracks in the rock cannot immediately transition from the compression state to the expansion state, and the elastic deformation during this time period is dominated by particle rebound deformation. As the stress decreases, the cracks in the previously compacted section reopen, causing the tangent slope of the unloading curve to gradually decrease. During this time, the recoverable crack deformation dominates the elastic deformation. Therefore, the tangential modulus at the initial stage of unloading is closest to the true properties of the rock particles. As shown in Figure 18, the tangent line BL of the stress-strain curve is drawn at the initial stage of unloading, and the area of △BLN is the particle elastic energy U eg i stored in the rock particles in the i-th cycle. The difference between the elastic energy U e i and the particle elastic energy U g i is the crack elastic energy U eh i released by crack reopening.
On this basis, the energy in a cycle of loading and unloading can be divided into the following three parts, as shown in Equations (4) and (5): damage energy consumption U dd i caused by rock particle slippage and particle structure fracture; particle elastic energy U eg i stored by the compression deformation of rock particles; and crack energy U ce i stored by microcrack compression and closure. The crack energy is divided into two parts. One part is released as the crack opens during unloading, which is manifested as crack elastic energy U eh i . The other part is not released and is stored inside the rock, which is manifested as plastic energy dissipation U de i .
U i = U dd i + U eg i + U j i
U ce i = U de i + U eh i

5. Damage Evolution Characteristics Based on Plastic Energy Dissipation and Crack Energy

5.1. Definition of Damage Variables Based on Plastic Energy Dissipation and Crack Energy

Damage in rock refers to the deterioration of its internal structure caused by various external factors. To quantify the extent of damage caused by loading, Eberhardt et al. [42] proposed a method for characterizing damage based on irreversible deformation. Lemaitre and Dufailly [43] calculated rock damage based on the degradation of the elastic modulus, as shown in Equation (6):
D = 1 E ( d ) E 0
where D is the rock damage amount, E0 is the elastic modulus in the intact state, and E(d) is the elastic modulus after damage.
The damage characterization method described in Equation (6) is based on the premise that the rock elastic modulus gradually decreases as the degree of damage increases. However, numerous experiments have shown that under higher compressive stress, the elastic modulus of rock actually increases. This phenomenon, known as “negative damage”, results in a decrease in the calculated damage as the stress level increases. To address this issue, researchers have proposed alternative rock damage characterization methods based on energy [34,35,36], such as the method described in Equation (7), which measures dissipated energy.
D = Σ U d i U d T
where U d i is the dissipated energy generated in the i-th cycle, with the value range of i being 1 ~ the maximum number of loops; and the summation limit of Σ U d i is U d T . U d T is the total dissipated energy in the entire cycle.
However, during the actual calculation process, it has been observed that the cumulative dissipated energy during cyclic loading of rock samples far exceeds the dissipated energy observed during uniaxial compression. This means that if a certain threshold of dissipation energy is reached, the rock sample is considered damaged under uniaxial compression, whereas the same sample remains undamaged when subjected to cyclic loading and unloading. Additionally, the plastic energy dissipated in the dissipated energy remains in unopened cracks after unloading and does not contribute to significant damage to the internal load-bearing structure, resulting in a lower calculated damage based on dissipated energy.
During the loading of rock samples, cracks initiate and expand, releasing damage energy. Simultaneously, the cracks are recompacted during the loading process, causing energy to be stored in the compacted cracks and leading to an increase in crack energy. Therefore, it can be inferred that the amount of damage energy consumed reflects the extent of microcrack initiation and expansion during each cycle. The number of cracks is primarily determined by the stress amplitude difference between the i-th cycle and the i-1th cycle, representing a new increase as the cycle progresses. The value of the crack energy can indicate the overall number of cracks after each level of cycles, representing a cumulative amount. Both of these values are related to the damage state of the rock sample.
Based on the dissipation and accumulation of damage energy and crack energy, the damage of rock samples can be evaluated using Equations (8) and (9), respectively. D 1 i is the ratio of the cumulative damage energy density of the previous i cycle to the total damage energy density during the entire cycle. D 2 i is the ratio of the crack energy density of the i-th cycle to the stress amplitude of the cycle, which represents the number of cracks generated inside the rock sample under the action of unit stress.
D 1 i = Σ U dd i U dd T
where U dd i is the damage energy density generated in the i-th cycle, with the value range of i being 1 ~ the maximum number of loops, and the summation limit of Σ U dd i is U dd T . U dd T is the total damage energy density in the entire cycle.
D 2 i = U ce i σ i
where U ce i is the crack energy density of the i-th cycle with units of kJ·m−3, and σ i is the stress amplitude of the i-th cycle of the rock sample, measured in MPa. Therefore, the unit of the numerator in Equation (9) is J/m3, which simplifies to N/m2, and the unit of the denominator, which is Pa, also equals N/m2. Thus, the numerator and denominator have the same dimensions, making D 2 i dimensionless.

5.2. Verification Test

To validate the proposed damage variable calculation method in this article, a uniaxial step loading and unloading test was conducted, as depicted in Figure 18. Each loading level was initially loaded with an axial stress rate of 0.1 MPa/s. Once the volumetric strain reaches the maximum value, it was then loaded with a circumferential deformation rate of 0.03 mm/min until the axial stress reached the stress amplitude of that particular level. The sample was then unloaded to 0.2 MPa at an axial stress rate of 0.25 MPa/s. The stress amplitude and stress amplitude gradient for the first cycle were both set to 3.7 MPa.
The calculated energy of each cycle for specimen S8 is presented in Figure 19. The energy increases with the number of cycles (stress amplitude) before reaching the peak and decreases as the number of cycles continues to increase after the peak. When the 12th and 15th cycles are loaded close to the stress amplitude, the axial load growth rate decreases, resulting in a longer loading time and increased energy input by the testing machine. As a result, various energies increase slightly. Figure 19b,c show that when the peak stress is reached (the 10th cycle), a significant number of cracks expand and penetrate, resulting in a sudden increase in damage energy consumption. The penetration of cracks leads to a sharp decrease in the mechanical properties of the rock sample, and the elastic energy of the particles decreases rapidly in the 11th cycle. The dissipation of plastic energy is only related to the cracks that fail to open during unloading, while the crack elastic energy reflects the energy released by crack opening during unloading. Therefore, the changes in plastic energy dissipation and crack elastic energy are relatively consistent, with only a slight decrease due to the reduction in stress amplitude in the cycles after reaching the peak. Figure 19d demonstrates that although the magnitudes of change in damage energy consumption and crack energy differ, the patterns of change are completely consistent, both reflecting the degree of damage and cracking within the rock.
The elastic modulus calculated for each cyclic loading in Figure 18 is presented in Figure 20. Before reaching the peak strength, as the stress amplitude increases, the elastic modulus of the siltstone increases. As a result, it is not feasible to calculate the damage of the rock samples during loading based on the elastic modulus degradation method described in Equation (6), as it may result in “negative damage”.
Taking the monotonic loading stress-strain curve depicted in Figure 21 as an illustrative example, the magnitude of the area beneath the curve corresponds to the total strain energy density exerted on the rock by external forces. By designating the stress point on the loading curve as the vertex and the slope of the loading process as the elastic modulus, a right-angled triangle is formed when the line extends downward. The area of this triangle signifies the elastic strain energy density, whereas the remaining space enclosed by the loading curve and the hypotenuse represents the dissipated energy density. The calculation reveals that the dissipated energy density at the peak of the uniaxial compression test in Figure 1 is 78.2 kJ·m−3. Furthermore, when the loading reaches its peak, as shown in Figure 18, the cumulative sum of the damage energy density and dissipated energy density is 74.8 kJ·m−3 and 137.97 kJ·m−3, respectively. Evidently, the total dissipated energy density during rock sample failure vastly exceeds that during uniaxial compression. Consequently, utilizing dissipated energy to characterize rock sample damage is unsuitable for cyclic loading and unloading situations. The use of damage energy consumption to describe damage can circumvent this issue.
Based on the calculation methods outlined in Equations (7)–(9), the damage variables for each cycle of specimen S8 were computed individually, as depicted in Figure 22. Throughout the cyclic loading and unloading test, the variation pattern of damage variable D 1 i , computed using damage energy consumption, aligned with the deformation and energy characteristics of the rock. In the compression and elastic stages, damage increased gradually with increasing stress amplitude, increasing linearly with increasing stress amplitude during stable crack development, spiking upon reaching peak stress, and surged post peak. Moreover, for D 1 i , no instances of “negative damage” abnormalities were observed at any stage, indicating that damage variables derived from damage energy consumption calculations can more accurately reflect the evolutionary traits of rock sample damage during cyclic loading and unloading. Furthermore, the damage variable based on damage energy dissipation excluded plastic energy dissipation that did not induce substantial damage within the rock, thereby providing a closer approximation of the true damage state within the rock.
The damage variable D 2 i , calculated based on the crack energy, can quantitatively depict the number of cracks generated within the rock sample under unit stress. D 2 i exhibited a rapid increase during the compaction stage, slight growth during the elastic and stable crack development stages, significant escalation after the stable crack development stage, and a sudden surge upon reaching the peak stress. At this juncture, internal cracks within the rock were primarily interconnected, resulting in a reduced post-peak stress amplitude and a decrease in the generation of numerous cracks, thereby decelerating the growth rate of damage variables.

6. Conclusions

This paper investigates the generation mechanism and evolution characteristics of rock elastic deformation, viscoelastic deformation, and plastic deformation during the uniaxial step cyclic loading and unloading process. By integrating the deformation process with energy storage and release, a quantitative calculation method for plastic energy dissipation and damage energy consumption is developed. This method proposes the division of elastic energy into particle elastic energy and crack elastic energy. Additionally, the damage characteristics of rock during the cyclic loading and unloading process are calculated based on damage energy consumption and crack energy. The main conclusions are as follows:
(1) There exists an upper limit to the viscoelastic deformation capacity between rock particles, which does not increase infinitely with stress amplitude. The value of the irrecoverable deformation during unloading is determined by the newly generated plastic deformation and the recovered viscoelastic deformation during unloading. The irrecoverable deformation initially increases and then decreases with increasing stress amplitude.
(2) The rules governing plastic deformation and dissipated energy increment remain consistent across all levels of stress amplitude. The energy consumed during loading and unloading results in plastic deformation. Plastic deformation during rock loading and unloading mainly comprises plastic deformation caused by structural fracture and particle slip and plastic deformation caused by closed cracks that cannot reopen during unloading. The corresponding dissipated energy can be refined into damage energy dissipation caused by factors such as rock particle slippage and structural fracture and plastic energy dissipation contained in cracks that fail to fully reopen after unloading.
(3) Based on the recovery process of elastic strain during unloading, the elastic energy released during unloading is divided into the particle elastic energy released by the rebound of rock particles and the crack elastic energy released by the reopening of compacted cracks. Furthermore, the energy in a cycle of loading and unloading can be reclassified into damage energy consumption caused by slippage, dislocation, and structural fracture of rock particles, particle elastic energy stored in the compressive deformation of rock particles, and cracks stored in the compression and closure of microcracks. This energy is divided into three parts, among which the crack energy consists of plastic energy dissipation and crack elastic energy.
(4) Upon reaching the peak stress, when a large number of cracks expand and penetrate the rock sample, the damage energy consumption increases suddenly, the mechanical properties of the rock sample decline, and the elastic energy of the particles decreases rapidly. Plastic energy dissipation is only related to cracks that fail to open during unloading. Crack elastic energy reflects the energy released by crack opening during unloading. Therefore, plastic energy dissipation and crack elastic energy change relatively uniformly.
(5) The damage variable calculated based on the crack energy can quantitatively characterize the number of cracks generated inside the rock sample under the action of unit stress. The damage variables calculated using damage energy consumption align with results reflected by the analysis of deformation characteristics and energy characteristics under cyclic loading and unloading, better reflecting the evolution characteristics of rock sample damage during cyclic loading and unloading. Moreover, the damage variable based on damage energy dissipation removes retained crack energy that does not cause substantial damage inside the rock, thus providing a closer approximation to the true damage state inside the rock.

Author Contributions

Methodology, H.W. and P.Y.; Validation, X.S.; Investigation, P.Y. and C.L.; Resources, M.L.; Data curation, M.L. and C.L.; Writing—original draft, S.M.; Writing—review & editing, X.S.; Supervision, H.W. All authors have read and agreed to the published version of the manuscript.

Funding

This work was partially supported by the National Natural Science Foundation of China (Grant Nos. U2034206 and 52374077) and National Key R&D Program of China (Grant No. 2022YFC3004601).

Data Availability Statement

The original contributions presented in the study are included in the article, further inquiries can be directed to the corresponding authors.

Conflicts of Interest

Author Hui Wang was employed by the company BGRIMM Technology Group. The remaining authors declare that the research was conducted in the absence of any commercial or financial relationships that could be construed as a potential conflict of interest.

References

  1. Cerfontaine, B.; Collin, F. Cyclic and fatigue behaviour of rock materials: Review, interpretation and research perspectives. Rock Mech. Rock Eng. 2018, 51, 391–414. [Google Scholar] [CrossRef]
  2. Geranmayeh Vaneghi, R.; Thoeni, K.; Dyskin, A.V.; Sharifzadeh, M.; Sarmadivaleh, M. Strength and damage response of sandstone and granodiorite under different loading conditions of multistage uniaxial cyclic compression. Int. J. Geomech. 2020, 20, 04020159. [Google Scholar] [CrossRef]
  3. Kim, I.B.; Ri, C.S.; So, Y.I. A damage mechanics model of materials with voids and cracks. Int. J. Damage Mech. 2016, 25, 773–796. [Google Scholar] [CrossRef]
  4. Xiong, L.F.; Wu, S.C.; Zhang, S.H. Mechanical behavior of a granite from wuyi mountain: Insights from strain-based approaches. Rock Mech. Rock Eng. 2019, 52, 719–736. [Google Scholar] [CrossRef]
  5. Ahmed, Z.; Wang, S.; Hashmi, M.Z.; Zishan, Z.; Chengjin, Z. Causes, characterization, damage models, and constitutive modes for rock damage analysis: A review. Arab. J. Geosci. 2020, 13, 806. [Google Scholar] [CrossRef]
  6. Gordon, R.B.; Davis, L.A. Velocity and attenuation of seismic waves in imperfectly elastic rock. J. Geophys. Res. 1968, 73, 3917–3935. [Google Scholar] [CrossRef]
  7. Elliott, G.M.; Brown, E.T. Further development of a plasticity approach to yield in porous rock. Int. J. Rock Mech. Min. Sci. Geomech. Abstr. 1986, 23, 151–156. [Google Scholar] [CrossRef]
  8. Yoshinaka, R.; Tran, T.V.; Osada, M. Non-linear, stress- and strain-dependent behavior of soft rocks under cyclic triaxial conditions. Int. J. Rock Mech. Min. Sci. 1998, 35, 941–955. [Google Scholar] [CrossRef]
  9. Jia, C.; Xu, W.; Wang, R.; Wang, W.; Zhang, J.; Yu, J. Characterization of the deformation behavior of fine-grained sandstone by triaxial cyclic loading. Constr. Build. Mater. 2018, 162, 113–123. [Google Scholar] [CrossRef]
  10. Meng, Q.B.; Liu, J.F.; Ren, L.; Pu, H.; Chen, Y.L. Experimental study on rock strength and deformation characteristics under triaxial cyclic loading and unloading conditions. Rock Mech. Rock Eng. 2021, 54, 777–797. [Google Scholar] [CrossRef]
  11. Yang, P.; Miao, S.; Wang, H.; Li, C.; Shang, X.; Xia, D. Comparison of deformation behavior between creep and fatigue on siltstone and its modified damage model. Fatigue Fract. Eng. Mater. Struct. 2023, 46, 3815–3828. [Google Scholar] [CrossRef]
  12. Wang, Y.; Tan, W.H.; Liu, D.Q.; Hou, Z.Q.; Li, C.H. On anisotropic fracture evolution and energy mechanism during marble failure under uniaxial deformation. Rock Mech. Rock Eng. 2019, 52, 3567–3583. [Google Scholar] [CrossRef]
  13. Meng, Q.; Zhang, M.; Zhang, Z.; Han, L.; Pu, H. Research on non-linear characteristics of rock energy evolution under uniaxial cyclic loading and unloading conditions. Environ. Earth Sci. 2019, 78, 1–20. [Google Scholar] [CrossRef]
  14. Jiang, C.; Li, Z.; Wang, W.; Wen, Z.; Duan, M.; Geng, W. Experimental investigation of the mechanical characteristics and energy dissipation of gas-containing coal under incremental tiered cyclic loading. Geomech. Geophys. Geo-Energy Geo-Resour. 2021, 7, 1–15. [Google Scholar] [CrossRef]
  15. Thomas, A.; Filippov, L.O. Fractures, fractals and breakage energy of mineral particles. Int. J. Miner. Process. 1999, 57, 285–301. [Google Scholar] [CrossRef]
  16. Petrov, Y.V.; Morozov, N.F.; Smirnov, V.I. Structural macromechanics approach in dynamics of fracture. Fatigue Fract. Eng. Mater. Struct. 2003, 26, 363–372. [Google Scholar] [CrossRef]
  17. Xie, H.; Li, L.; Peng, R.; Ju, Y. Energy analysis and criteria for structural failure of rocks. J. Rock Mech. Geotech. Eng. 2009, 1, 11–20. [Google Scholar] [CrossRef]
  18. Zhang, L.; Cong, Y.; Meng, F.; Wang, Z.; Zhang, P.; Gao, S. Energy evolution analysis and failure criteria for rock under different stress paths. Acta Geotech. 2021, 16, 569–580. [Google Scholar] [CrossRef]
  19. Meng, Q.B.; Liu, J.F.; Huang, B.X.; Pu, H.; Wu, J.Y.; Zhang, Z.Z. Effects of confining pressure and temperature on the energy evolution of rocks under triaxial cyclic loading and unloading conditions. Rock Mech. Rock Eng. 2021, 55, 773–798. [Google Scholar] [CrossRef]
  20. Brantut, N.; Petit, L. Micromechanics of rock damage and its recovery in cyclic loading conditions. Geophys. J. Int. 2023, 233, 145–161. [Google Scholar] [CrossRef]
  21. Wang, Y.; Tang, P.; Han, J.; Li, P. Energy-driven fracture and instability of deeply buried rock under triaxial alternative fatigue loads and multistage unloading conditions: Prior fatigue damage effect. Int. J. Fatigue 2023, 168, 107410. [Google Scholar] [CrossRef]
  22. Wang, Y.; Cao, Z.; Mao, T.; Li, P.; Cai, M. Investigation of fatigue failure and energy characteristics of rock exposed to complicated stress disturbance paths: Cyclic stress amplitude effect. Fatigue Fract. Eng. Mater. Struct. 2023, 46, 2697–2713. [Google Scholar] [CrossRef]
  23. Zhang, M.; Dou, L.; Konietzky, H.; Song, Z.; Huang, S. Cyclic fatigue characteristics of strong burst-prone coal: Experimental insights from energy dissipation, hysteresis and micro-seismicity. Int. J. Fatigue 2020, 133, 105429. [Google Scholar] [CrossRef]
  24. Shirani, F.R.; Taheri, A.; Karakus, M. Failure behaviour of a sandstone subjected to the systematic cyclic loading: Insights from the double-criteria damage-controlled test method. Rock Mech. Rock Eng. 2021, 54, 5555–5575. [Google Scholar] [CrossRef]
  25. Hu, H.; Lu, Y.; Xia, B.; Luo, Y.; Peng, J.; Li, Y. Damage characteristics of sandstone with different crack angles subjected to true triaxial cyclic loading and unloading. Theor. Appl. Fract. Mech. 2022, 121, 103444. [Google Scholar] [CrossRef]
  26. Jiang, C.; Duan, M.; Yin, G.; Wang, J.G.; Lu, T.; Xu, J.; Zhang, D.; Huang, G. Experimental study on seepage properties, AE characteristics and energy dissipation of coal under tiered cyclic loading. Eng. Geol. 2017, 221, 114–123. [Google Scholar] [CrossRef]
  27. Shen, R.; Chen, T.; Li, T.; Li, H.; Fan, W.; Hou, Z.; Zhang, X. Study on the effect of the lower limit of cyclic stress on the mechanical properties and acoustic emission of sandstone under cyclic loading and unloading. Theor. Appl. Fract. Mech. 2020, 108, 102661. [Google Scholar] [CrossRef]
  28. Sun, Y.D.; Yang, Y. Energy and fatigue damage evolution of sandstone under different cyclic loading frequencies. Shock Vib. 2021, 2021, 5585983. [Google Scholar] [CrossRef]
  29. Wang, Y.; Liu, D.; Han, J.; Li, C.; Liu, H. Effect of fatigue loading-confining stress unloading rate on marble mechanical behaviors: An insight into fracture evolution analyses. J. Rock Mech. Geotech. Eng. 2020, 12, 1249–1262. [Google Scholar] [CrossRef]
  30. Zhu, A.; Liu, J.; Wu, Z.; Wang, L.; Liu, H.; Xiao, F.; Deng, C. Energy dissipation and damage evolution characteristics of salt rock under uniaxial cyclic loading and unloading tension. Adv. Civ. Eng. 2021, 14, 1–9. [Google Scholar] [CrossRef]
  31. Yang, X.B.; Cheng, H.M.; Lv, J.Q.; Hou, X.; Nie, C.G. Energy consumption ratio evolution law of sandstones under triaxial cyclic loading. Rock Soil Mech. 2019, 40, 3751–3766. [Google Scholar]
  32. Lin, H.; Liu, J.; Yang, J.; Ran, L.; Ding, G.; Wu, Z.; Lyu, C.; Bian, Y. Analysis of damage characteristics and energy evolution of salt rock under triaxial cyclic loading and unloading. J. Energy Storage 2022, 56, 106145. [Google Scholar] [CrossRef]
  33. Liu, Y.; Dai, F.; Dong, L.; Xu, N.; Feng, P. Experimental investigation on the fatigue mechanical properties of intermittently jointed rock models under cyclic uniaxial compression with different loading parameters. Rock Mech. Rock Eng. 2018, 51, 47–68. [Google Scholar] [CrossRef]
  34. Cheng, C.; Li, X. Cyclic experimental studies on damage evolution behaviors of shale dependent on structural orientations and confining pressures. Energies 2018, 11, 160. [Google Scholar] [CrossRef]
  35. Yang, X.; Cheng, H.; Hou, X.; Nie, C.; Lv, J. Research on characteristic stress and constitutive equation of confined sandstone during damage evolution based on energy evolution analysis. Adv. Mater. Sci. Eng. 2019, 1, 1–13. [Google Scholar] [CrossRef]
  36. Wang, Y.; Yi, Y.F.; Li, C.H.; Han, J.Q. Anisotropic fracture and energy characteristics of a Tibet marble exposed to multi-level constant-amplitude (MLCA) cyclic loads: A labscale testing. Eng. Fract. Mech. 2021, 244, 107550. [Google Scholar] [CrossRef]
  37. Liu, X.S.; Ning, J.G.; Tan, Y.L.; Gu, Q.H. Damage constitutive model based on energy dissipation for intact rock subjected to cyclic loading. Int. J. Rock Mech. Min. Sci. 2016, 85, 27–32. [Google Scholar] [CrossRef]
  38. Li, T.; Pei, X.; Wang, D.; Huang, R.; Tang, H. Nonlinear behavior and damage model for fractured rock under cyclic loading based on energy dissipation principle. Eng. Fract. Mech. 2019, 206, 330–341. [Google Scholar] [CrossRef]
  39. Gong, F.Q.; Zhang, P.L.; Du, K. A novel staged cyclic damage constitutive model for brittle rock based on linear energy dissipation law: Modelling and validation. Rock Mech. Rock Eng. 2022, 55, 6249–6262. [Google Scholar] [CrossRef]
  40. Miao, S.; Xia, D.; Yang, P.; Liang, M. Acoustic emission and damage characteristics of granite under graded cyclic loading. Arab. J. Geosci. 2022, 15, 1–11. [Google Scholar] [CrossRef]
  41. Miao, S.; Liu, Z.; Zhao, X.; Ma, L.; Zheng, Y.; Xia, D. Plastic and damage energy dissipation characteristics and damage evolution of Beishan granite under triaxial cyclic loading. Int. J. Rock Mech. Min. Sci. 2024, 174, 105644. [Google Scholar] [CrossRef]
  42. Eberhardt, E.; Stead, D.; Stimpson, B. Quantifying progressive pre-peak brittle fracture damage in rock during uniaxial compression. Int. J. Rock Mech. Min. Sci. 1999, 36, 361–380. [Google Scholar] [CrossRef]
  43. Lemaitre, J.; Dufailly, J. Damage measurements. Eng. Fract. Mech. 1987, 28, 643–661. [Google Scholar] [CrossRef]
Figure 1. Basic physical and mechanical characteristics of the siltstone. (a) Siltstone sample specimens; (b) Mineral composition; (c) Particle size distribution; (d) Results of representative stress–strain curve; (e) Uniaxial compression strength test.
Buildings 14 01500 g001
Figure 2. Stepwise cyclic loading and unloading test system and test path. (a) The MTS 815 rock mechanics test machine; (b) Test path.
Buildings 14 01500 g002
Figure 3. Stress-strain curves after stepwise cyclic loading and unloading. (a) S6; (b) S7.
Buildings 14 01500 g003
Figure 4. Schematic diagram of strain division during the i-th cycle of loading and unloading.
Buildings 14 01500 g004
Figure 5. Relationship between the loading deformation and stress amplitude. (a) εAB and εDE; (b) εAB-εDE.
Buildings 14 01500 g005
Figure 6. Relationship between viscoelastic deformation and stress amplitude. (a) Elastic aftereffect curve; (b) Viscoelastic deformation value.
Buildings 14 01500 g006
Figure 7. Plastic deformation values during unloading. (a) Difference between two unloads; (b) Stress–strain curve of the fourth cycle.
Buildings 14 01500 g007
Figure 8. Unrecoverable deformation produced during the second unloading cycle.
Buildings 14 01500 g008
Figure 9. Plastic strain after unloading. (a) Point D; (b) Point F.
Buildings 14 01500 g009
Figure 10. Deformation mechanism of siltstone under uniaxial loading and unloading. (a) Schematic representation of the micro-section of a rock specimen; (b) Viscoplastic deformation; (c) Viscoelastic deformation.
Buildings 14 01500 g010
Figure 11. Schematic diagram of the energy division of the i-th cycle.
Buildings 14 01500 g011
Figure 12. Energy calculation results at various amplitude levels. (a) First loading and unloading cycle; (b) Second loading and unloading cycle.
Buildings 14 01500 g012
Figure 13. The increment of dissipated energy and the increment of plastic deformation in the i-th cycle. (a) First loading and unloading cycle; (b) Second loading and unloading cycle.
Buildings 14 01500 g013
Figure 14. Unloading-loading hysteresis loop and its energy proportion. (a) Loading and unloading intersection point; (b) Hysteretic loop area energy/dissipated energy.
Buildings 14 01500 g014
Figure 15. Schematic diagram of the division of plastic energy consumption and damage energy consumption.
Buildings 14 01500 g015
Figure 16. Calculation results of plastic energy consumption and damage energy consumption. (a) Damage energy consumption; (b) Plastic energy consumption.
Buildings 14 01500 g016
Figure 17. Schematic diagram of the energy calculation.
Buildings 14 01500 g017
Figure 18. Stepwise cycle loading and unloading test (S8). (a) Stress path; (b) Stress-strain curve.
Buildings 14 01500 g018
Figure 19. Energy calculation of stepwise cycle loading and unloading test. (a) Total energy; (b) Dissipated energy; (c) Elastic energy; (d) Damage energy dissipation and crack energy.
Buildings 14 01500 g019
Figure 20. Elastic modulus calculation.
Buildings 14 01500 g020
Figure 21. Uniaxial compression test energy calculation.
Buildings 14 01500 g021
Figure 22. Damage variable calculation results.
Buildings 14 01500 g022
Disclaimer/Publisher’s Note: The statements, opinions and data contained in all publications are solely those of the individual author(s) and contributor(s) and not of MDPI and/or the editor(s). MDPI and/or the editor(s) disclaim responsibility for any injury to people or property resulting from any ideas, methods, instructions or products referred to in the content.

