Article

Mechanical Characteristics of Cracked Lining Reinforced with Steel Plate–UHPC Subjected to Vertical Load

1
Faculty of Architecture and Engineering, Kunming University of Science and Technology, Kunming 650500, China
2
Shandong Hi-Speed Engineering Construction Group Co., Ltd., Jinan 250014, China
*
Author to whom correspondence should be addressed.
Buildings 2024, 14(6), 1515; https://doi.org/10.3390/buildings14061515
Submission received: 21 April 2024 / Revised: 20 May 2024 / Accepted: 21 May 2024 / Published: 23 May 2024
(This article belongs to the Section Building Energy, Physics, Environment, and Systems)

Abstract

:
The steel plate reinforcement method is widely used for strengthening damaged linings. Nevertheless, low durability is one of the disadvantages of the steel plate reinforcement method, which uses epoxy resin as the interface binder. To enhance the load-bearing performance and strengthening effect of steel-plate-reinforced structures, this study introduced ultra-high performance concrete (UHPC) as the reinforcing bonding layer and proposed a novel method for steel plate–UHPC reinforcement of cracked linings. A mechanical performance model test was conducted on a 1/5 scale lining model using a loading test device to evaluate the load-bearing performance and stress deformation of both conventional steel plate and steel plate–UHPC reinforced cracked linings. The characteristics, mechanisms of failure, and impacts of strengthening of the steel plate reinforcement method and steel plate–UHPC reinforcement method for cracked linings were compared. A numerical simulation model was developed to investigate the reinforcement effect of cracked linings using steel plate–UHPC reinforcement. The analysis included examining the influence of steel plate thickness, UHPC bonding layer thickness, and reinforcement timing. Model test results show that the overall damage mode of the steel plate–UHPC-reinforced structure had good elastic–plastic behaviour, and the deformation and damage process under the vertical concentrated load can be divided into four typical phases. Compared with the traditional steel plate reinforcement, the ultimate load-carrying capacity and ductility of the steel plate–UHPC-reinforced structure were increased by 53% and 366%, respectively, showing significantly better load-carrying capacity and deformation performance. Numerical simulation results show that the reinforced structure’s load-carrying capacity and stiffness enhancement rate increased non-linearly with the increase in UHPC layer thickness and steel plate thickness. However, reasonable reinforcement timing exists for steel plate-UHPC reinforcement, and too late reinforcement timing leads to a decrease in structural load-carrying capacity and stiffness enhancement rate.

1. Introduction

Due to various factors including tunnel construction and management practices, geological conditions, service environment, and duration, a significant number of operational tunnels exhibit quality defects and issues, such as voids behind the lining, insufficient lining thickness, water seepage, and lining cracking. Among these issues, structural cracking is particularly prominent, leading to severe performance degradation of tunnels and the posing of a threat to their operational safety [1,2,3].
Currently, the lining reinforcement and strengthening methods include paste fibre, sleeve arch reinforcement, shotcrete reinforcement, and steel plate reinforcement. Liu et al. [4] used fibre-reinforced plastic grid with polymer–cement–mortar (FRP grid, PCM) to strengthen the tunnel lining, which effectively inhibited the expansion of tensile cracks and improved the stiffness of the lining. Pintado et al. [5] adopted stacked sleeve arch reinforcement for the Montblanc Tunnel in Spain to give the reinforced lining better durability. Li et al. [6] carried out numerical simulations of engineered cementitious composites (ECC), steel plates, and carbon-fibre-reinforced polymer (CFRP) reinforcement of cracked lining and analysed the effect of the strengthening by considering the different damage levels and the timing of reinforcement. Kiriyama et al. [7] proposed using thin steel panels for reinforcing tunnel linings and discussed the reinforcing effect of steel plates on tunnel linings with engineering examples. Zhai et al. [8] found that after reinforcing deformed tunnel linings with steel plates, the stiffness and load-carrying capacity of the tunnel were increased by 190% and 69%, respectively. Chen et al. [9] investigated the law of the influence of parameters such as steel plate spacing, thickness, and width on the reinforcing effect. Among the above-cracked lining reinforcement methods, the steel plate reinforcement method is widely used in tunnel reinforcement due to its convenient application and better adaptation to curved structures. However, the steel-plate-reinforced lining structure uses epoxy resin as the interface bonding material. This material has poor durability and high-temperature resistance and is difficult to be used on wet surfaces [10]. After its bonding fails, it will cause the reinforcement layer to crack and peel off, leaving the steel. The overall stiffness of the reinforced structure will decrease rapidly, and the load-bearing capacity will be lost [11,12,13].
Compared with polymer base materials such as epoxy resins, ultra-high performance concrete (UHPC) has high compressive strength, high tensile strength, and excellent durability [14], and its hydration bonding properties allow for better coordination between UHPC and concrete [15]. Moreover, UHPC has good toughness and ductility due to the crack-blocking and bridging effects of steel fibres, which can delay the development of cracks, resulting in UHPC exhibiting “tensile strain hardening” properties [16,17]. In recent years, UHPC has attracted much attention because of its excellent mechanical properties and durability. It has become an effective strengthening material for various concrete structures and has been applied in construction, bridges, and tunnels. For example, Prabhat and Safdar et al. [18,19] used UHPC to strengthen reinforced concrete beams, Alireza et al. [20] used UHPC to repair bridge members, and Pan et al. [21] used UHPC to strengthen tunnel lining structures.
To improve the load-bearing performance and reinforcement effect of the traditional steel-plate-reinforced cracked lining, this paper proposes a steel plate-UHPC reinforcement method for cracked lining by utilising the excellent mechanical properties and durability of UHPC. When the steel plate and UHPC layer are combined, the performance advantages of each material are synergistically utilised to achieve a good combination effect. However, the application of the steel plate–UHPC reinforcement method in the reinforcement of cracked lining in road tunnels has yet to be seen. This paper took a specific double-lane highway tunnel lining as the research object. It carried out a 1/5 model test on the steel plate and steel plate–UHPC-reinforced cracked lining under vertical load, studying the load-bearing and failure characteristics, stress deformation characteristics, and reinforcement effect of the steel plate–UHPC-reinforced cracked lining. On this basis, numerical analyses were carried out to select the optimal parameters of steel plate–UHPC-reinforced cracked lining, which provides a theoretical basis and valuable reference for constructing steel plate–UHPC-reinforced cracked lining.

2. Model Test

2.1. Experimental Content and Similar Design

Three test conditions were set up for this test: the unreinforced condition, the steel-plate-reinforced condition, and the steel plate–UHPC-reinforced condition. The unreinforced condition was used to determine the ultimate load capacity of the original structure and as a base control. The two reinforcement conditions were used to compare and analyse the reinforcement effect under different reinforcement methods.
The lining damage caused by external loads can be divided into loosening vertical soil pressure, horizontal plastic soil pressure, and unbalanced soil pressure [22]. For simplicity, the present tests used vertical centralised loading to investigate the mechanical properties of the reinforced structure under loosening vertical soil pressure, which is similar to the loading method of existing experimental studies [22,23]. Taking the common two-lane road tunnel C30 reinforced concrete lining as the research object [24], based on the similarity theory, for the centralised loading method, the model lining specimens can be made of prototype materials when the effect of structural deadweight is not considered [25]. Therefore, this paper produced a test model according to the material similarity ratio of 1:1 and the geometric similarity ratio of 1:5. As shown in Figure 1a, the lining model had a width of 2.3 m, a height of 1.56 m, a lining thickness of 80 mm, and a longitudinal length of 300 mm. The design of the steel-plate-reinforced lining specimen model was directly based on the design parameters of the China technical JTG/T 5440-2018 [26], and the steel plate–UHPC-reinforced lining structure had an additional UHPC layer between the lining and the steel plate (Figure 1b). The thickness of the UHPC layer was taken as 15 mm.
Steel wire mesh was used to simulate the lining rebars. The prototype lining had a reinforcement ratio of 0.7%. By the principle of equal reinforcement ratio, the model lining was constructed with 4 mm@40 mm of the longitudinal bar and 2 mm@50 mm of the stirrup (Figure 1a).
The steel plate was made of a 1.8 mm thick Q235 galvanised steel sheet; the anchor bolts were simulated by plastic expansion screws with socket size M6 and bolt size M4, 60 mm long, spaced 10 cm apart. The welded studs were simulated by bolts with a diameter of 3 mm and a length of 6 mm. Carbon CBSR adhesive was used as the bonding agent.
The mix ratio of UHPC is shown in Table 1. UHPC cube specimens of 100 mm × 100 mm × 100 mm were produced, and the uniaxial compressive strength test was conducted after curing for 28 days. A UHPC dumbbell-type test piece was also constructed, and the axial direct tensile test of the UHPC test piece was performed on a 10 kN electronic universal testing machine. The compressive strength and tensile strength measured through tests were 150.2 MPa and 7.20 MPa, respectively.

2.2. Methods of Reinforcement Operations

Based on the results of the current research on the reasonable reinforcement timing of steel plate reinforcement for cracked lining [27], steel plate reinforcement and steel plate–UHPC reinforcement were carried out at 45% of the peak bearing capacity of the lining at all times. When loaded to the specified load, the inner surface of the cracked lining needed to be reinforced with adhesive steel plate and steel plate–UHPC, independently. The detailed operation process of steel plate reinforcement can be found in the previous study [7]. The operation process of steel plate–UHPC reinforcement is as follows: (1) According to the curvature of the inner surface of the lining, make a curved steel plate, reserve anchor holes on the steel plate, and weld the bolts to the steel plate. (2) Chiselling the inner curved surface of the lining until the surface mortar is chiselled away and the coarse aggregate leaks out. (3) Drill holes in the inner curved surface of the modelled lining and then implant the screw by supporting the steel plate on the inner surface of the lining after clearing the surface of the floating slag and dust. (4) Repeatedly water the lining reinforcement interface to make the interface thoroughly wet, then pour UHPC between the steel plate and the lining, with natural maintenance for 28 days. Typical operation steps of steel plate–UHPC reinforcement are shown in Figure 2.

2.3. Test Setup

The model test setup adopted a self-developed horizontal loading device, including a counterforce frame, an electro-hydraulic jack, and a ground restraining device, as shown in Figure 3. The counterforce steel frame was assembled by bolting nine H-beam steel members with dimensions of 3950 mm (width) × 2610 mm (height) × 300 mm (thickness). Along the perimeter of the lining, eight pairs of support jacks and rubber plates were set up to simulate the restraining effect of the strata on the structure through the combination of support jacks and rubber plates. The liner footings were set as fixed restraints. A 300 kN electro-hydraulic jack with a maximum stroke of 30 mm was installed at the top of the liner arch to simulate concentrated vertical loading.

2.4. Sensor Arrangement and Testing Process

The arrangement of test elements is shown in Figure 4. Nine displacement measurement points were arranged on the inner side of the lining; the displacement meter with a range of 300 mm and an accuracy of 0.01 mm was used at the position of the arch top, and the displacement meter with a range of 100 mm and an accuracy of 0.01 mm was used at the remaining positions. Eighteen resistive strain gauges with a length of 100 mm and a strain limit of 20,000 μm/m were symmetrically laid at the nine characteristic points on the inner and outer sides of the lining to measure the strain value of the inner and outer sides. After the reinforcement structure was applied, nine strain gauges were again pasted on the outside of the reinforcement layer to measure the strain of the reinforcement layer. A 300 kN pressure transducer was set at the top of the liner arch to measure the applied vertical load. A graded loading method was used, with a loading rate of 0.3–0.5 mm/min; the crack width was measured; and the crack distribution was recorded once for every 5 mm increase in the displacement of the arch until the lining was damaged and the loading was stopped.

3. Experimental Results and Discussion

3.1. Force Deformation Characteristics of Steel Plate–UHPC-Reinforced Structure

3.1.1. Relationship between Load and Displacement

The relationship curves between vault subsidence and vertical load of the steel plate–UHPC-reinforced structure are shown in Figure 5. As can be observed, the reinforced structure encountered four critical places under the vertical load: the reinforcement point (A), the point of spalling at the interface between the steel plate and UHPC (B), the point of peak load (C), and the failure point (D). The damage load was 85% of the peak load [24].
The process of vault subsidence is divided into four stages: (1) Before reinforcement, under the loading of vertical load at the top, the load increased nearly linearly with the increase in displacement. When the load reached 14.99 kN, the lining began to show microcracks, which continued to enlarge with loading. (2) Under the condition of maintaining the stress state, the steel plate and UHPC layer were applied when the load reached 34.5 kN (B). At this moment, the vault sunk 10.82 mm (6.9‰H). The displacement developed with the load at a noticeably slower rate, the reinforcing layer and the lining members created a superposition structure, and the overall section stiffness increased. As the loading continued, the cracks progressively reached the UHPC layer. When loaded to 115.8 kN (C), the vault sunk 16.31 mm (1.05% H), some anchor bolts of the steel plate and UHPC reinforcement layer were pulled out, and the steel plate and UHPC layer appeared to be peeled off. (3) New microcracks were created in the UHPC layer as a result of the steel plate gradually peeling. The displacement development rate increased with the load once again until the loading reached the peak load of 188.39 kN (D). (4) The vault sunk 44.85 mm (2.8% H) when the load reached its peak; the steel plate in the compression zone of the vault completely peeled off; cracks pierced the inner side of the vault and the UHPC re-inforced layer; and some of the reinforcement bars on the outer side of the arch girdle pulled off. The concrete of the lining member on the outer side of the vault was crushed, and the structure failed. The load at the point of damage (E) was 160.13 kN, and the vault subsided by 50.33 mm (3.2% H).

3.1.2. Destruction Process and Pattern

The load–strain curves of the arch and girdle parts of the steel plate–UHPC-reinforced structure are shown in Figure 6 (tensile strain was positive, and compressive strain was negative). The crack distribution pattern, lining deformation, and damage morphology of the steel plate–UHPC-reinforced cracked lining at the time of damage are provided in Figure 7.
The strain distribution of the reinforced structure’s vault demonstrated compressive strain on the outside side and tensile strain on the interior, as seen in Figure 6a and Figure 7. The strain in the vault increased linearly with the increase in load, and the strain growth rate slowed down compared to before reinforcement. When loaded to 115.58 kN, the steel plate of the vault was gradually peeled off from the UHPC layer, and the inner and outer strains of the vault and the surface strain of the steel plate started to accelerate. When the load reached 182.90 kN, the inner surface strain of the steel plate reached the extreme value of 1967.11 με, and after that, with the peeling off of the steel plate from the UHPC layer, the strain of the steel plate in the vault gradually decreased. At this time, the lining and the UHPC layer were bonded intact and could still deform in concert. With the crack further expanding to the UHPC layer, the inner and outer strains of the vault accelerated again. When the load increased from 115.58 kN to 188.39 kN, the inner strain of the vault increased significantly from 2356.89 με to 4598.32 με, and the outer strain increased from −1280.47 με to −2796.82 με. At this time, the UHPC layer of the vault was penetrated by the cracks, the steel fibres were pulled to failure, and some of the reinforcement bars on the inner side of the vault yielded.
The strain distribution of the reinforced structure’s arch waist showed compression on the inner side and tension on the outside side, as illustrated in Figure 6b and Figure 7. At the time of reinforcement, there was one crack in each of the left and right girdles, and the strains at the inner and outer girdles were −405.51 με and 1056.5 με, respectively. After reinforcement, the girdle strains showed a slight increase in a near-linear manner with the load increase, with a slight change in the strains at the inner girdle and the inner part of the girdle steel band. With the increase in load, the width of the cracks on the outer side of the arch girdle began to accelerate, and several new microcracks were added, which were intertwined with the outer cracks. The strain on the outside of the arch girdle showed a steep increase section, and the strain value increased sharply from 900.64 με to 1432.71 με. The strain development rate on the outside of the arch girdle was more significant than that on the inside of the arch girdle and the inside of the arch girdle steel plate.
As shown in Figure 7, with the increase in displacement, the lining first cracked on the inner side of the arch, and then the left and right arch waist also began to appear with tensile cracks, and the width of the lining cracks gradually increased with the increase in the load. When the cracked lining was reinforced, the interface between the steel plate and the UHPC layer was gradually peeled off as the load continued to increase, after which the cracks in the vault were gradually extended to the UHPC layer. Many small cracks appeared one after another on the left and right arch waist to the outside of the region of the reinforced structure’s arch line (the cracks’ widths were all less than 0.1 mm). When the steel plate and UHPC layer in the pressurised area of the vault were wholly peeled off, the development of cracks in the vault, UHPC cracks in the vault, and cracks on the arch waist accelerated. In contrast, the development of small cracks on the outer side of the arch waist was not noticeable. Eventually, penetration cracks appeared in the UHPC reinforcement layer within the vault, steel fibres were pivoted out and failed, some arch waist reinforcement bars were pulled out, and the concrete on the outer side of the vault was crushed. The reinforced structure was damaged by one main crack in the vault and the left and right girders.

3.2. Comparative Analysis of Reinforcement Effects

A comparison of the load-displacement curves of the original lining and the reinforced structure is shown in Figure 8. The strengthening effect of the cracked lining structure is mainly expressed in terms of the ultimate load-carrying capacity, stiffness, and ductility of the reinforced structure. The peak load of the unreinforced lining was recorded as P0. The load when the lining specimen reached the reinforcement point and its vault displacement were recorded as Pa and Sa, respectively. The peak load and the corresponding displacement of the reinforced structure were recorded as Pu and Su, respectively. The starting peeling load and corresponding displacement of the bonded surface were recorded as P1 and S1, respectively. The slope of the straight-line segment in Figure 8 with reinforcement point A as the starting point was extracted, defined as the stiffness of the reinforced structure (ke), and the stiffness of the lining before reinforcement was recorded as k0. The load-carrying capacity was defined as the ultimate load-carrying capacity. The ductility was defined as the ultimate load-carrying capacity. Drawing on existing research results [28], the bearing capacity enhancement rate ηp = (Pu − P0)/P0, the stiffness enhancement rate ηk = ke/k0, and the structural ductility after reinforcement ∆S = Su − Sa were defined. The comparative results of the reinforcement effect are shown in Table 2.
Based on Figure 8 and Table 2, the subsequent results can be made:
(1)
The peak loads of the original lining, the steel plate reinforced structure, and the steel plate–UHPC-reinforced structure were 77.1 kN, 122.9 kN, and 188.4 kN, respectively. The peak loads of the steel-plate-reinforced and the steel plate–UHPC-reinforced structures were 144.3% and 59.36% higher, respectively, than the original lining. This indicates that the two kinds of reinforcement can significantly increase the structure’s ultimate bearing capacity. The slopes of the steel plate reinforcement and steel plate-UHPC reinforcement curves at the reinforced points increased significantly compared to the unreinforced lining, indicating a significant increase in stiffness in both reinforced structures that effectively improved the stiffness of the cracked lining.
(2)
The load-displacement curves of steel-plate-reinforced and steel plate–UHPC-reinforced structures can be divided into four typical stages, but the curve patterns of each stage differed significantly. From the damage mode, the damage of the steel-plate-reinforced structure is manifested as the interfacial stripping damage between the steel plate and the original lining concrete. After reaching the peak load, the steel plate is completely plated from the lining, the steel plate rapidly quits the work, and the reinforced structure cannot withstand the external load and rapidly enters the plasticity stage, showing an apparent brittle damage mode [28]. In contrast, because of the combined shape of the UHPC layer, screws, and welding studs in the steel plate–UHPC reinforcing method, the interfacial bond layer has superior bond and ductility. The interfacial peeling load of steel plate–UHPC reinforcement was 33.60% higher than that of steel plate reinforcement, corresponding to 16.67% higher displacement. After the interface between the steel plate and UHPC started to peel off, due to the role of interface connectors, the UHPC layer was still well bonded to the lining, and the load was still able to increase with the increase in displacement. The structure showed good ductility, effectively solving the problem of brittle damage that is prone to occur in the steel plate reinforcement method. In addition, the UHPC layer was better able to control the deformation of the lining in the elastic phase of the lining members, making the overall stiffness enhancement effect of the steel plate–UHPC-reinforced lining more obvious.
(3)
The ultimate bearing capacity of the steel-plate-reinforced structure was 122.89 kN, the structural stiffness was 17.55 kN/mm, the structural ductility was 7.31 mm, the bearing capacity increase rate was 59.36%, and the stiffness increase rate was 5.48, while the ultimate bearing capacity of the steel plate–UHPC-reinforced structure was 188.39 kN, the structural stiffness was 47.18 kN/mm, the structural ductility was 34.03 mm, the bearing capacity increase rate was 144.3%, and the stiffness increase rate was 14.74. The latter’s ductility, bearing capacity improvement rate, and stiffness improvement rate were 4.66 times, 2.43 times, and 2.68 times that of the former, respectively. It was evident that the steel plate–UHPC-reinforced structure had better load-bearing capacity, greater ductility, and a more apparent overall stiffness improvement effect.
A comparison of the load–strain curves of the inner side of the vault of the two reinforced structures is shown in Figure 9. When the interface started to peel, the lining strains of the steel plate reinforcement method and the steel plate–UHPC reinforcement method were 2416.75 με and 2356.89 με, respectively. The latter strain was reduced by 2.48%. When the peak load was reached, the strain of the steel plate reinforcement method was 5983.26 με, while the strain of the steel plate–UHPC reinforcement method was 4598.32 με, which was reduced by 23.15% compared to the strain of the steel plate–UHPC reinforcement method. It shows that the steel plate–UHPC reinforcement method can effectively reduce the structure’s strain while enhancing the lining’s bearing capacity. The strain of the steel plate–UHPC reinforcement method did not show a steep increase and showed better crack control ability.

4. Numerical Modelling of Steel Plate–UHPC-Reinforced Cracked Lining

4.1. Material Modelling

C30 concrete is simulated using a concrete plastic damage model. This model expresses the strain softening law of concrete based on the stress–strain relationship under uniaxial tension and uniaxial compression of concrete. The stress–strain curve is based on the Code for Design of Concrete Structures and Specifications for Design of Highway Tunnels calculations. The damage factor in the plastic damage model is determined using Sidoroff’s energy equivalence principle, and its expression is [29].
d k = 1 σ k E 0 ε k k = t ,   c
where k = c denotes compression and k = t denotes tension; dk is the damage variable, and the output is the average value of the damage variable between neighbouring units; E0 is the initial modulus of elasticity of the concrete; and σk and εk are the concrete stresses and strains, respectively. As the tunnel lining was loaded in one direction, no lining cracks opened and then closed during the test. Therefore, the stiffness recovery factor of the plastic damage model was calculated numerically by taking the default values wc = 1 and wt = 0.
UHPC is also modelled using the plastic damage model, and the intrinsic relationships of UHPC in compression and tension are shown in Equations (2) and (3) [30,31,32].
σ c f c = a x + ( 6 5 a ) x 5 + ( 4 a 5 ) x 6 , 0 x 1 x b ( x 1 ) 2 + x , 1 x
σ t = E c ε t , 0 ε t ε t 0 f t , ε t 0 ε t ε t u f t 1 + ( ε t ε t u ) l c w p , ε t u ε t
where σ c is the compressive strength, equal to ε/ε0; ε0 is the peak point strain value; a denotes the ratio of tangent modulus to peak cut line modulus; b is the test fitting parameter, taken as 2.41; f t is the tensile strength; and εt0 is the peak point strain value. The damage factor of the UHPC material is calculated to be the same as that of ordinary concrete material. The values of its physical and mechanical parameters are shown in Table 3.
The steel bar was modelled using Von Mises’s multilinear model [33,34], while the steel plate was modelled using the ideal elastic–plastic model [6,35]. The computational parameters are presented in Table 4. Since the simulation only involves unidirectional loading, the bond-slip between the steel bars and concrete can be neglected. Instead, the Truss form is employed to model the steel bars embedded in the concrete, considering their synergistic deformation without relative slip.

4.2. Contact Relations and Interfacial Parameters

As observed throughout the test, the inner surface of the lining and UHPC did not peel off during the test, and they were coordinated to deform as a whole, so the inner surface of the lining and UHPC were connected by the function of “Tie”. The relationship between adhesion and tensile displacement at the interface between the steel plate and the lining concrete is simulated by a bilinear cohesion model, which can be achieved by adding a cohesive behavioural contact unit with “zero thickness” at the interface between the steel plate and the UHPC, ignoring the modelling of screws and welding studs [36,37]. The interface standard stiffness is 200 MPa/mm, and the tangential stiffness is 50 MPa/mm [38].

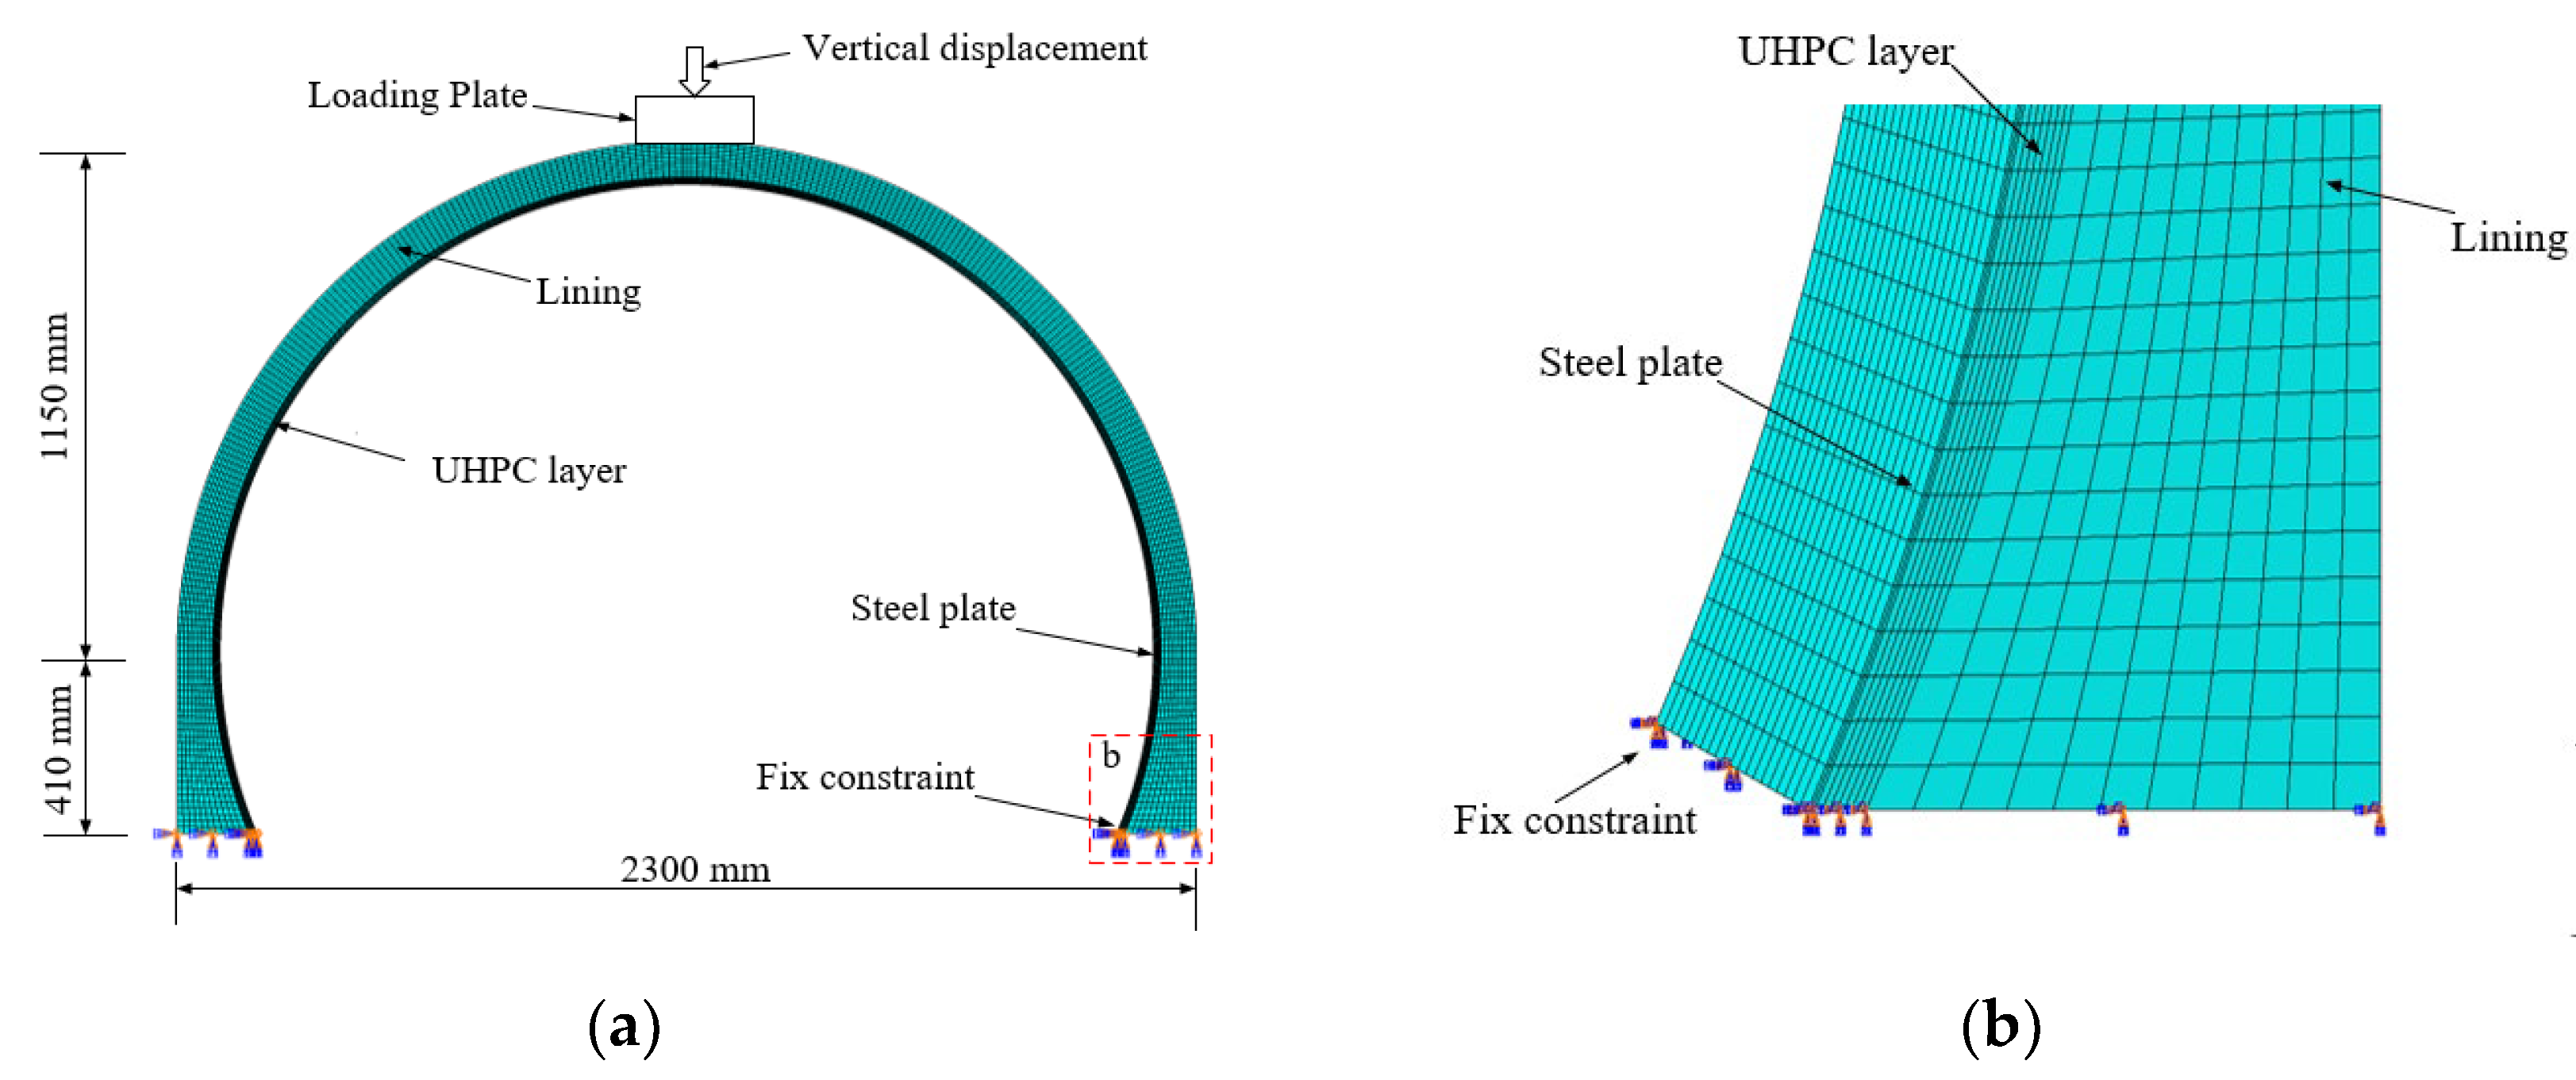
4.3. Numerical Model

Based on the above tests, ABAQUS 2021 was used to establish the numerical calculation model of steel plate–UHPC-reinforced cracked lining. The C3D8R solid unit simulated the lining, UHPC, and steel plate, while the T3D2 truss unit modelled the steel reinforcement. The dimensions of the model were the same as the dimensions of the steel plate–UHPC-reinforced cracked lining in the test. The supporting jacks around the lining were modelled using compression-only non-linear ground springs [6]. Based on the reinforcement tests, fixed constraints were applied at the bottom of both ends of the loaded lining model, and vertical displacement loads were applied to the vault. In order to eliminate the influence of mesh size, the calculation results of the lining under the mesh sizes of 10 mm, 15 mm, and 20 mm were compared. It was found that the peak load and load-displacement curve shapes under the three mesh sizes were very close. The corresponding peak loads under the three grids were 80.44 kN, 79.80 kN, and 78.54 kN, correspondingly. The peak load difference between the 15 mm grid and the 10 mm grid was 0.80%, and the peak load difference between the 15 mm grid and the 20 mm grid was 1.16%. The peak bearing capacity of the complete lining under the three grids was relatively consistent. Considering the computational efficiency and simulation effect, all subsequent calculations were performed with the 15 mm mesh calculation model. The schematic diagram of the model is shown in Figure 10.

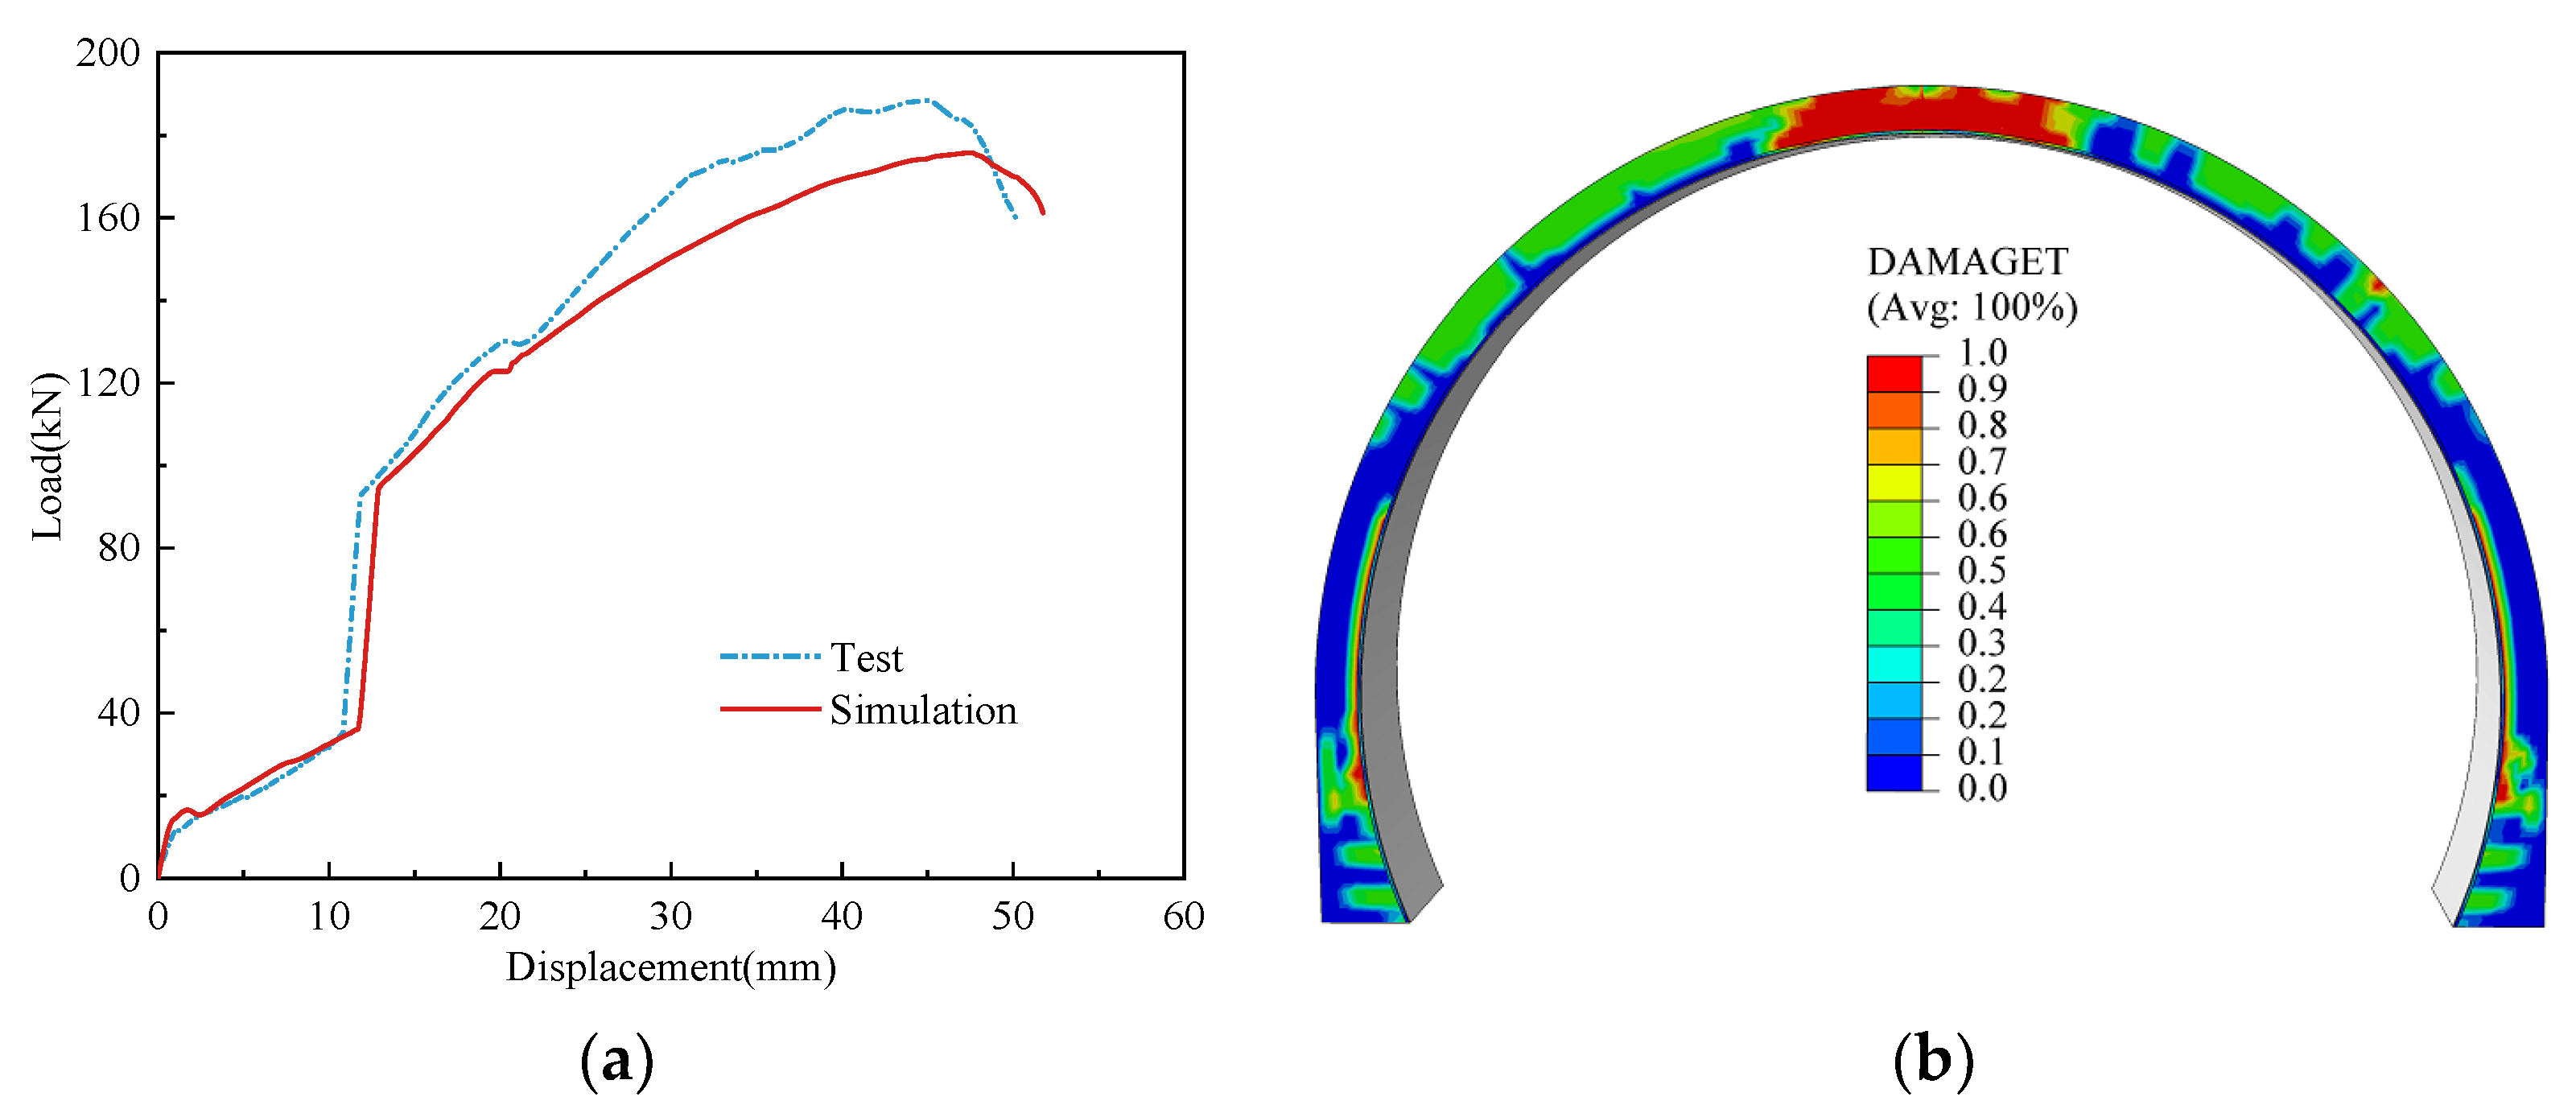
4.4. Verification of Numerical Model

Figure 11 shows the experimental and computational results of the load-displacement curves of the steel plate–UHPC-reinforced cracked lining. It can be seen from Figure 11 that the load-displacement curves of the experimental results and the simulation results were similar. However, the computational results were smaller than the experimental results because the studs were ignored when modelling the steel plate–UHPC-reinforced cracked lining. The peak load of the steel plate–UHPC-reinforced cracked lining test was 188.39 kN, which corresponded to the peak load of 175.26 kN in the simulation results, and the error between the two was within 10%. The damage maps of the simulation results coincided with the actual damage distribution of the test. It indicates that the stress behaviour of the steel plate–UHPC-reinforced cracked lining under concentrated load can be expressed by numerical simulation, and the numerical simulation results are reliable.

5. Numerical Analysis of Steel Plate–UHPC Reinforcement of Cracked Lining

5.1. Simulation Programme

Based on the above finite element calculation model, in the numerical analysis of steel plate–UHPC-reinforced cracked lining, influencing factors such as UHPC layer thickness, steel plate thickness, and reinforcement timing were considered. The specific parameter values were detailed as follows. According to existing research results and specifications, the UHPC layer thickness was designed to be 3–10 cm [12,39], and the steel plate thickness was 5–10 mm as the standard [26]. The similarity ratio in this test was 1/5. After similarity, the UHPC layer thicknesses were 5 mm, 10 mm, 15 mm, and 20 mm. The thickness of the steel plates was designed to be 1.0 mm, 1.2 mm, 1.4 mm, 1.6 mm, 1.8 mm, and 2.0 mm. The ratio of the bearing capacity of the structural reinforcement to the peak bearing capacity was defined as the reinforcement timing, represented by the symbol RDL. This paper selected four different damage states with RDL equal to 20%, 40%, 60%, and 80% to reinforce the tunnel [11,27].
Based on the above three influencing factors, this paper set up 15 kinds of steel plate–UHPC reinforcement cracked lining calculation working conditions, as shown in Table 5.

5.2. Simulation Programme

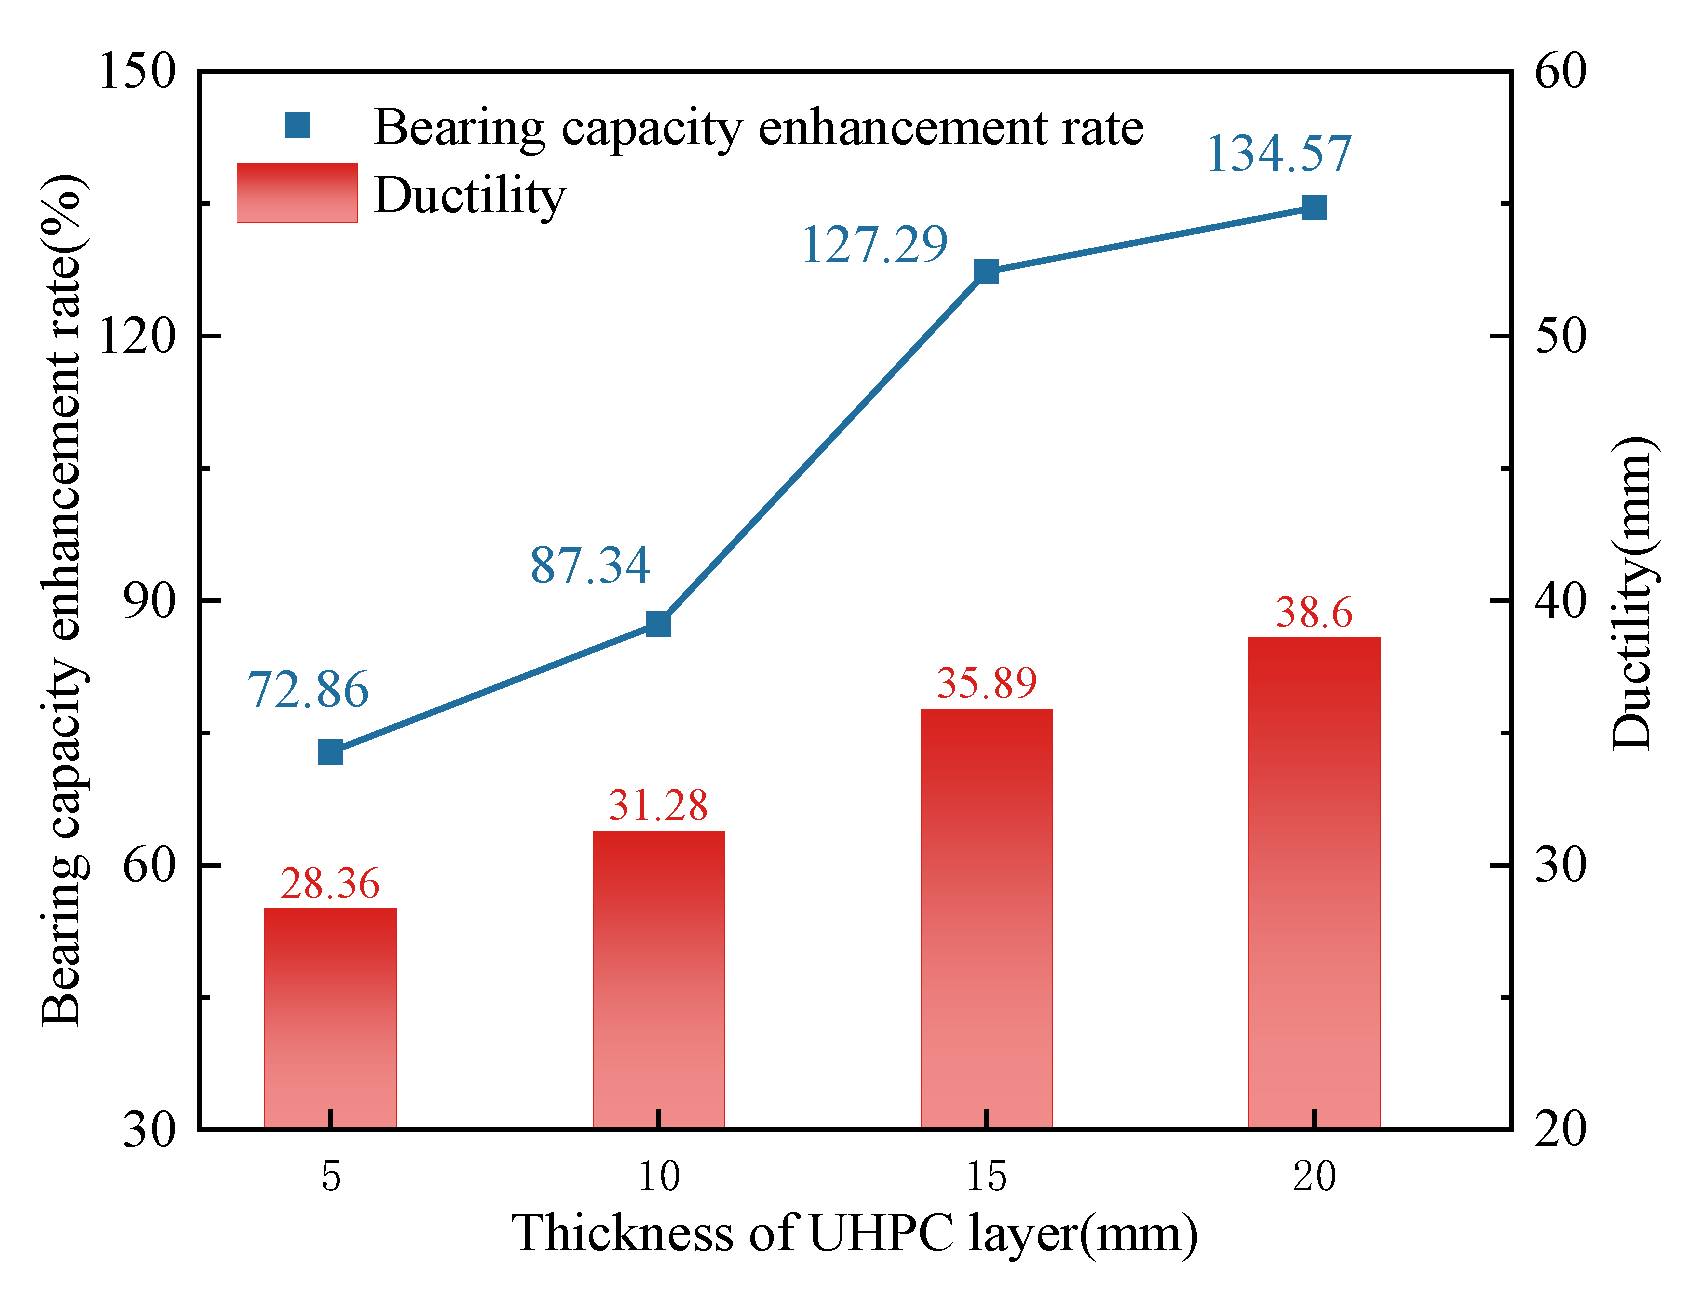
5.2.1. UHPC Layer Thickness

The load-displacement curves of the lining under different UHPC layer thicknesses are shown in Figure 12. The effect on the reinforcement effect is shown in Figure 13. It is noticeable that the change rule of the load-displacement curves of the cracked lining reinforced with different UHPC layer thicknesses was similar, and with the increase in the thickness of the UHPC layer, the bearing capacity was gradually increased. The peak loads of different UHPC layer thicknesses were 133.20 kN, 144.3 kN, 175.26 kN, and 180.53 kN, among which, when 15mm thickness of UHPC layer was used for reinforcement, the bearing capacity was most significantly increased. Compared with the unreinforced lining, it was increased by 127.29%. This was in addition to the displacement corresponding to the peak load gradually increasing as the UHPC layer thickness increased, suggesting that the reinforced structure has better ductility characteristics.

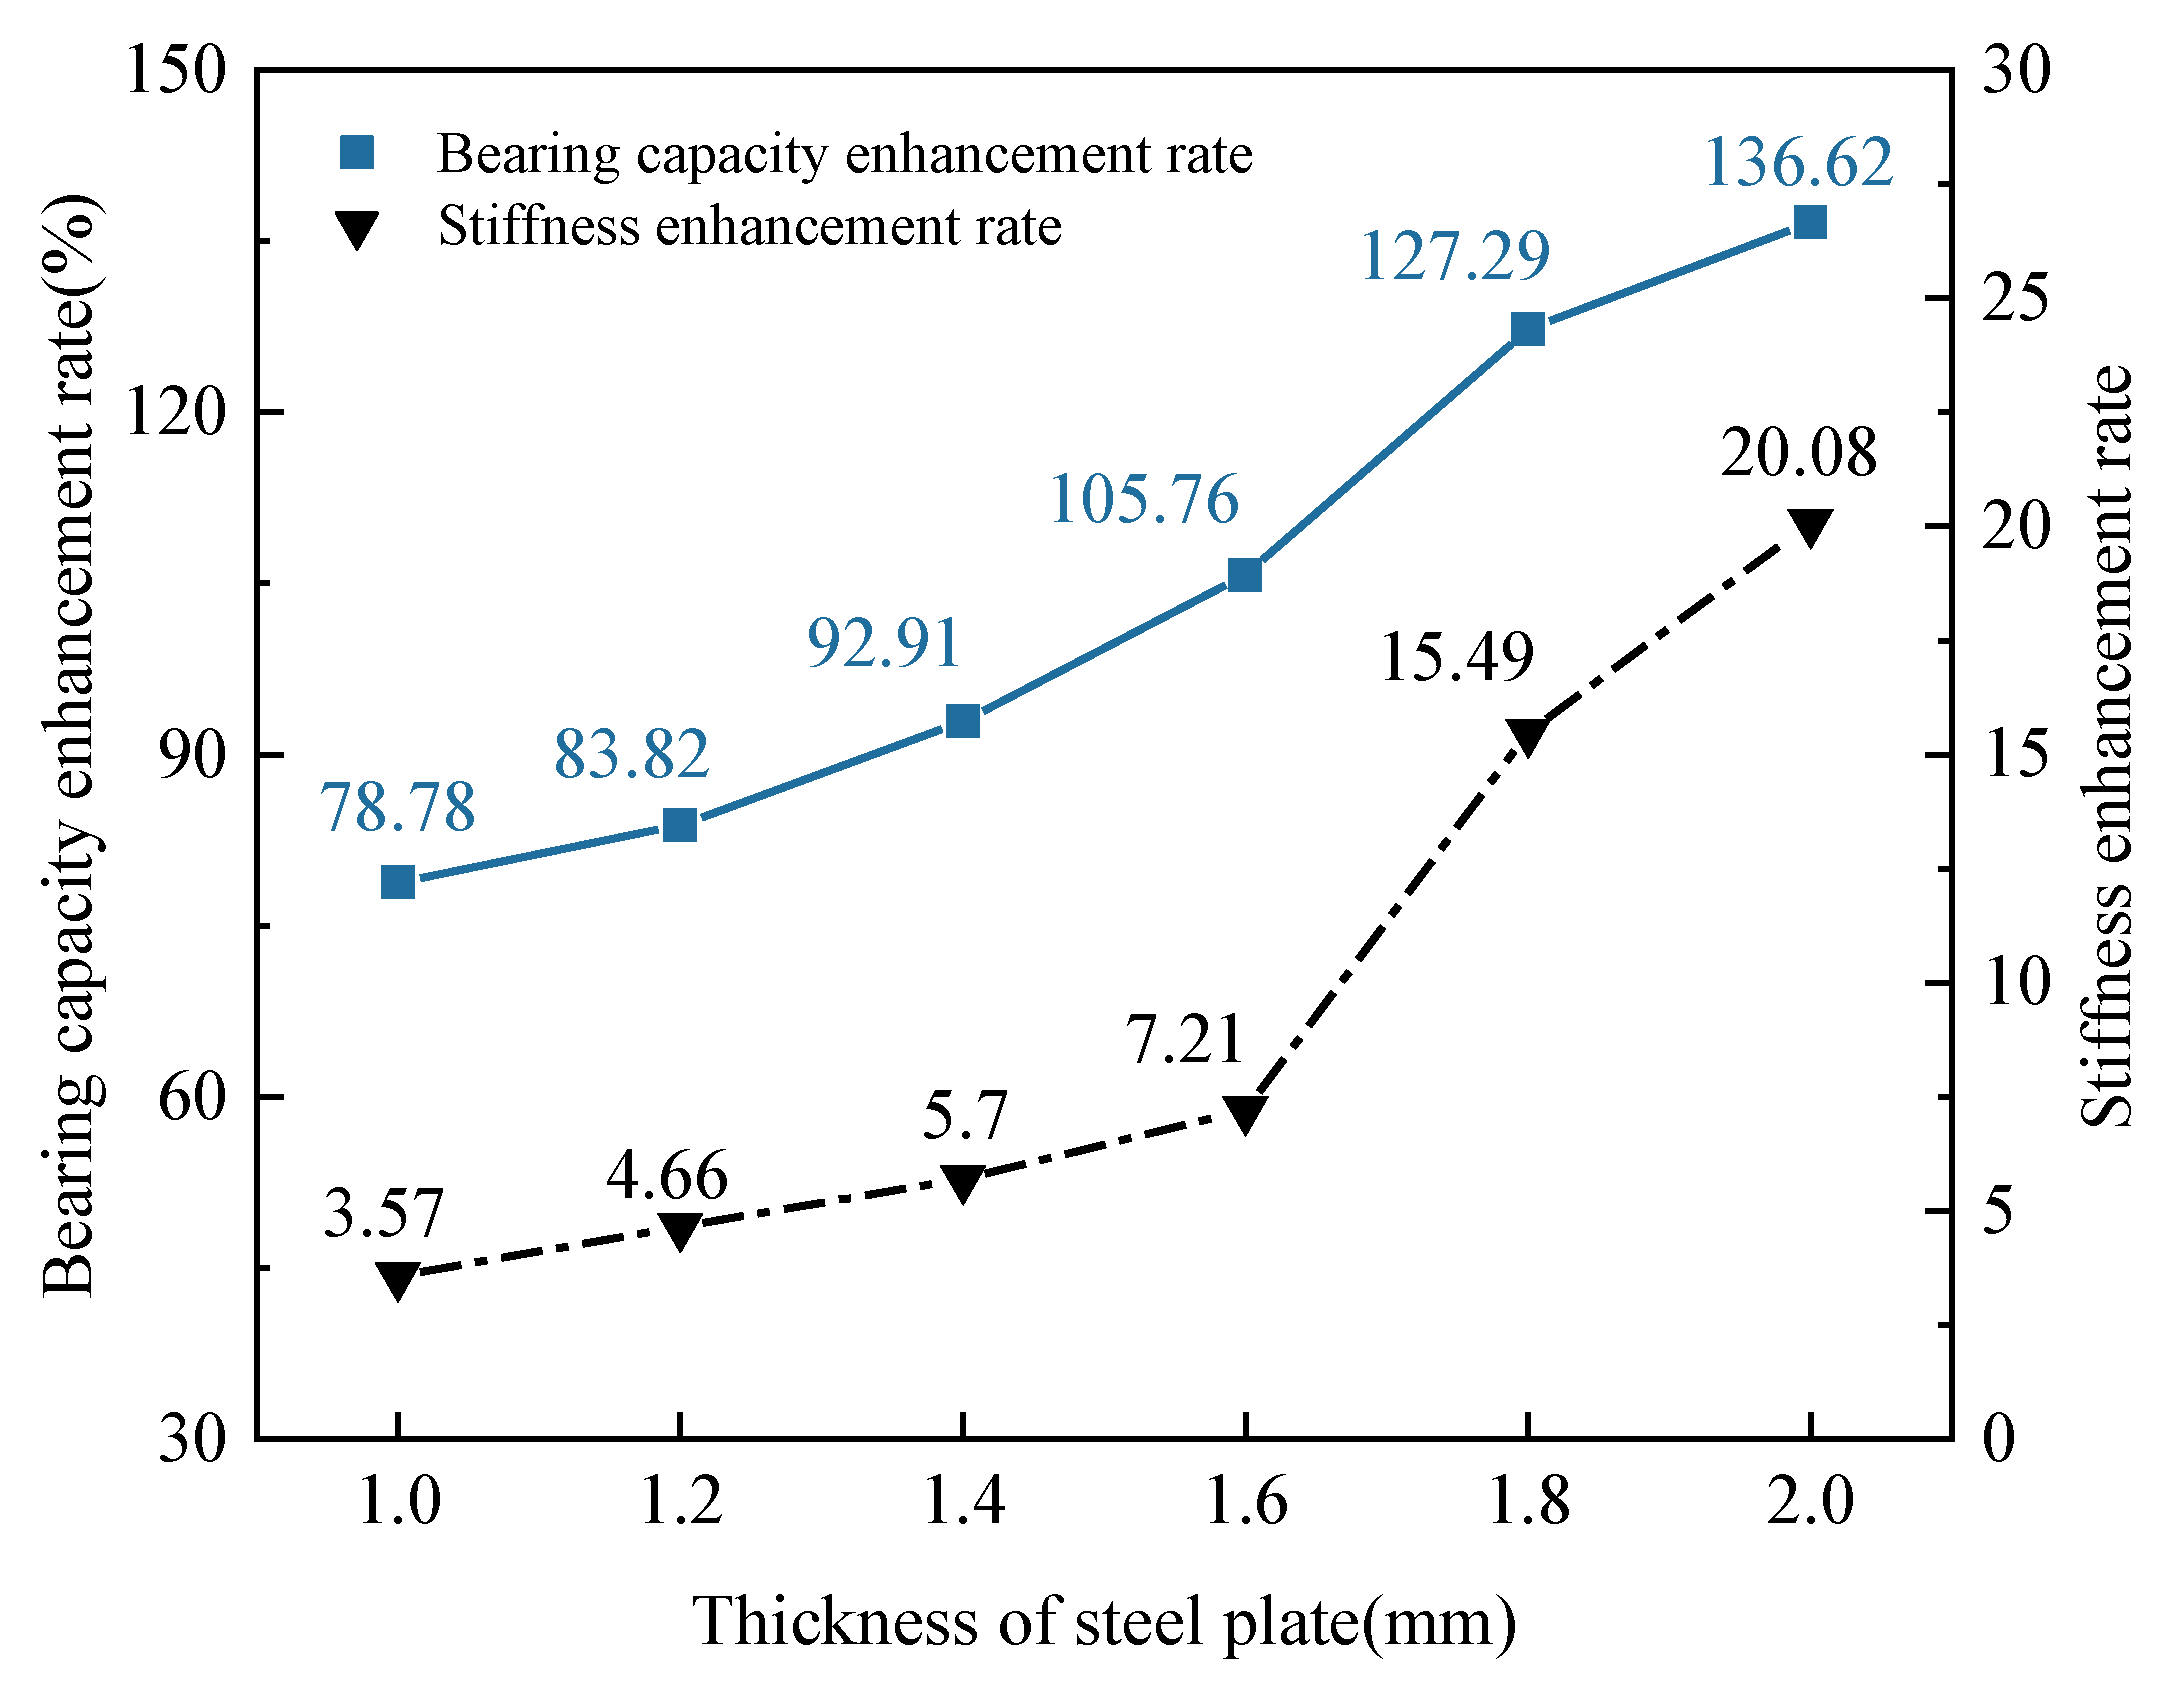
5.2.2. Steel Plate Thickness

Figure 14 is the load-displacement curve of the cracked lining under different steel plate thicknesses. Figure 15 shows the reinforcement effect under different steel plate thicknesses. It can be seen from Figure 14 that the peak load of the load-displacement curve after using steel plates of different thicknesses to reinforce the cracked lining was improved. However, the displacement corresponding to the peak load was close, and the difference in ductility improvement was slight. Figure 15 shows that the bearing capacity enhancement rate increased from 78.78% to 136.62%, and the stiffness enhancement rate increased from 3.57 to 20.08 when the steel plate thickness increased from 1.0 mm to 2.0 mm. It demonstrates that the liner structure’s bearing capacity and stiffness improvement rate exhibited a nonlinear growth trend with increasing steel plate thickness.

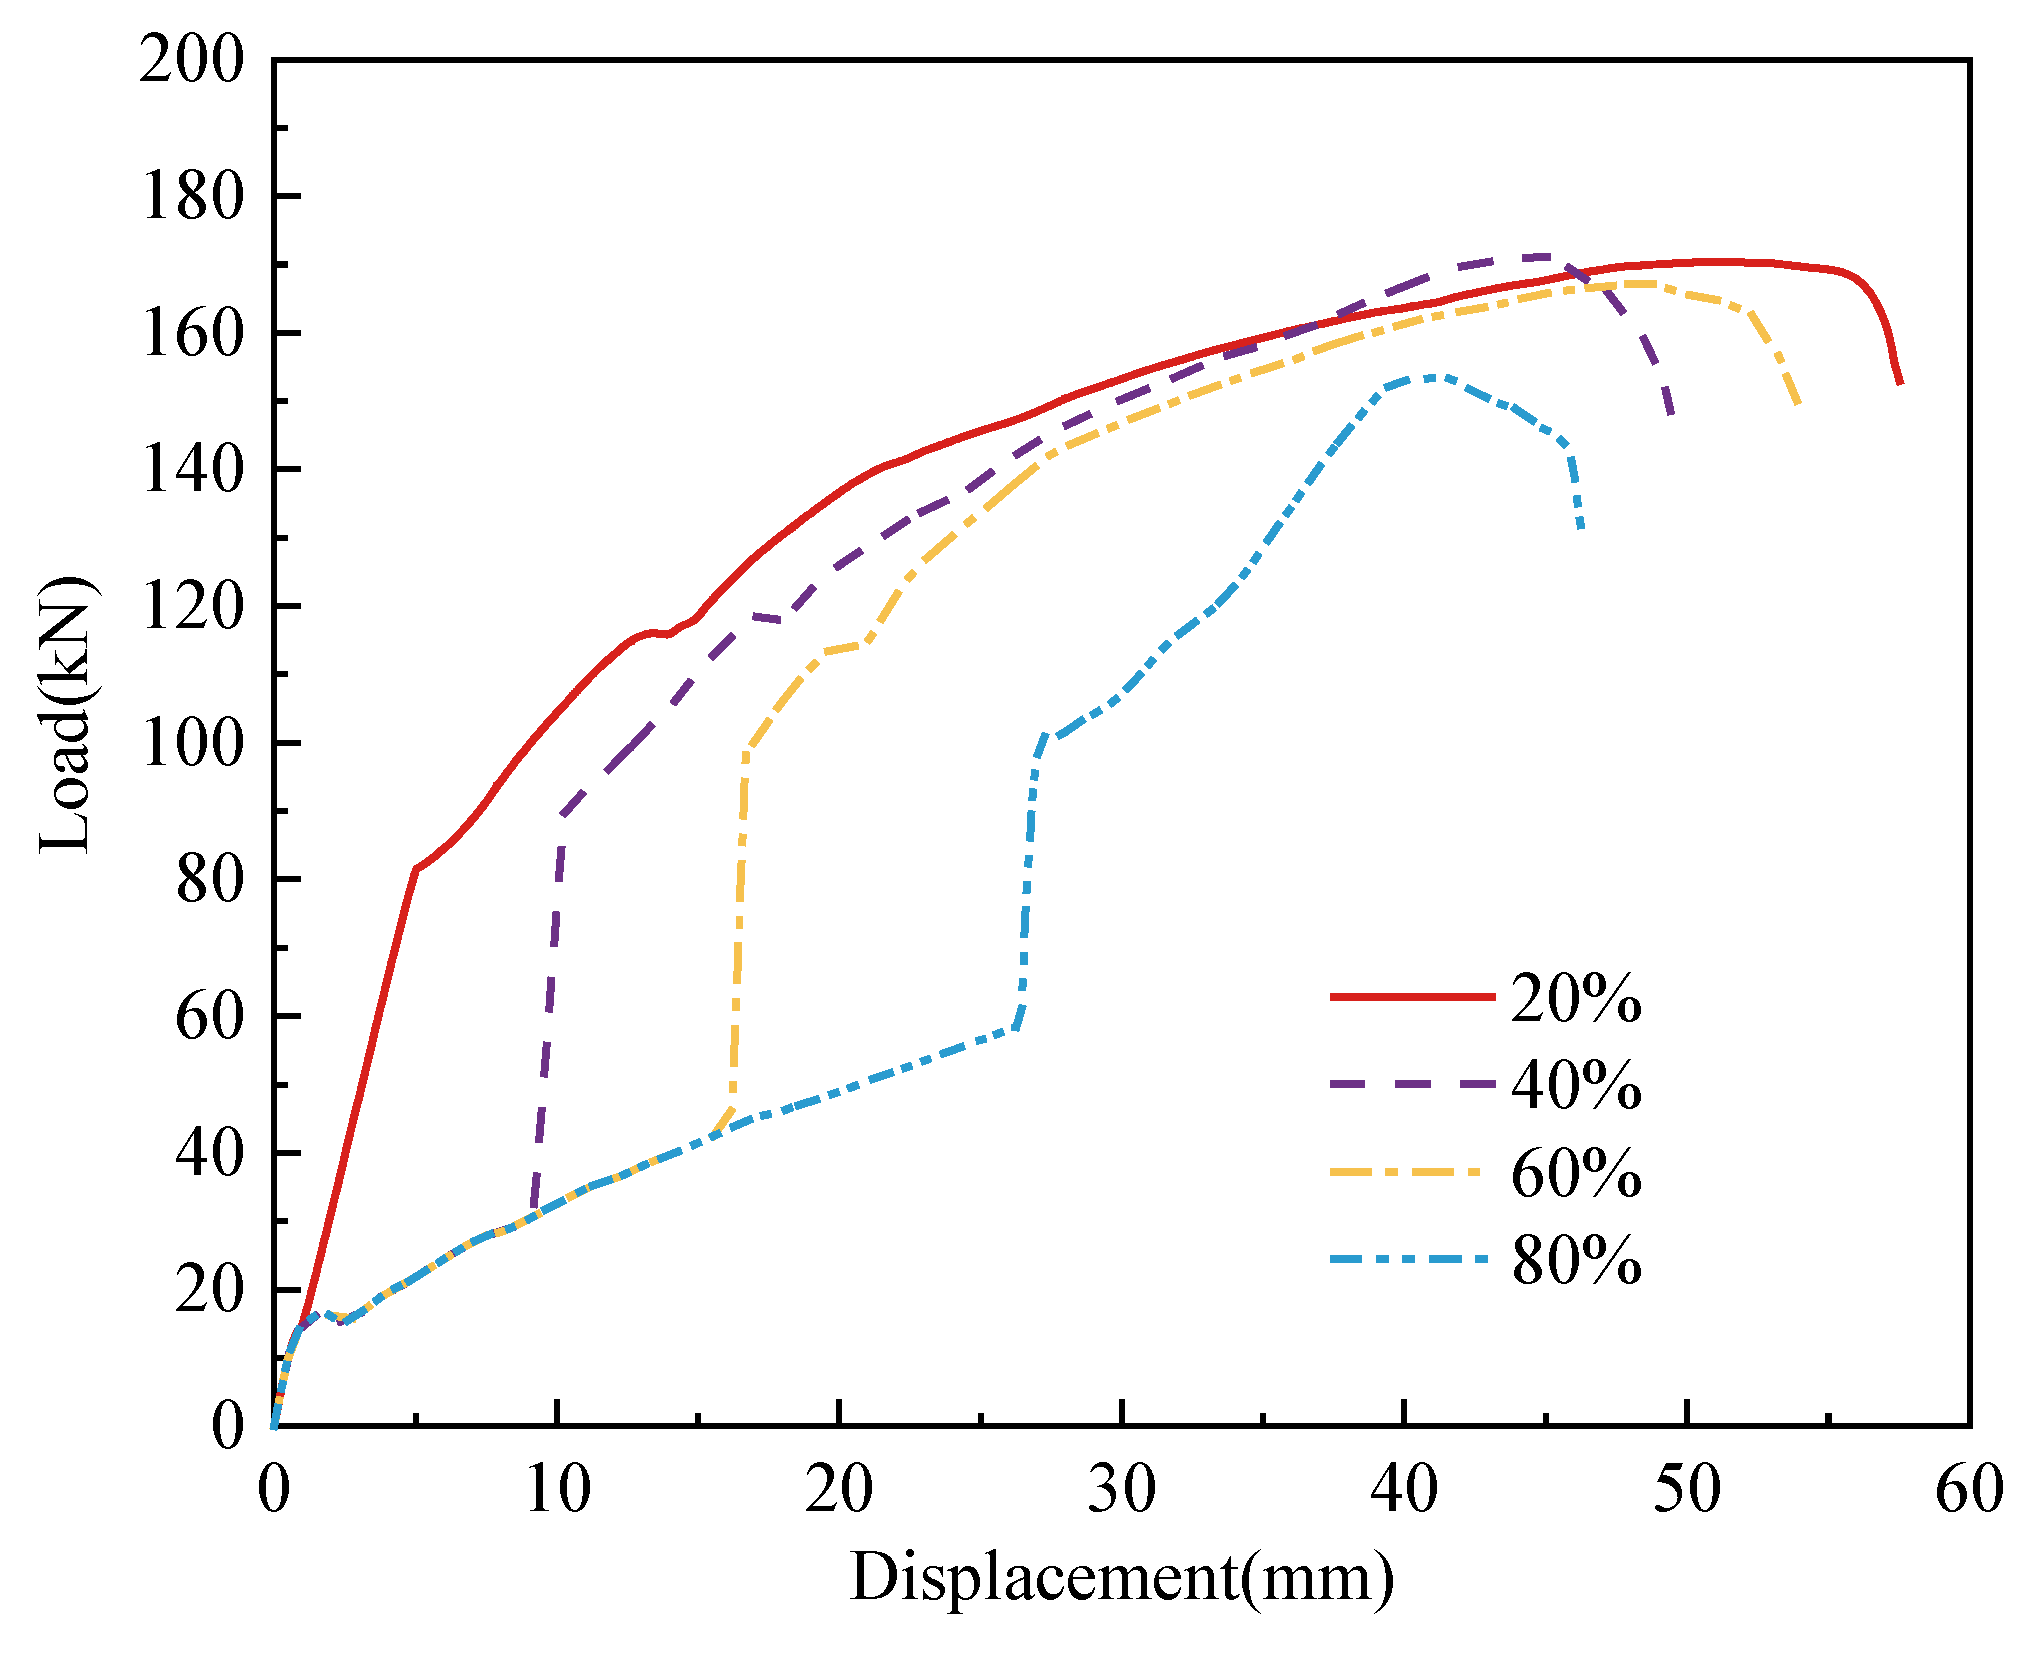
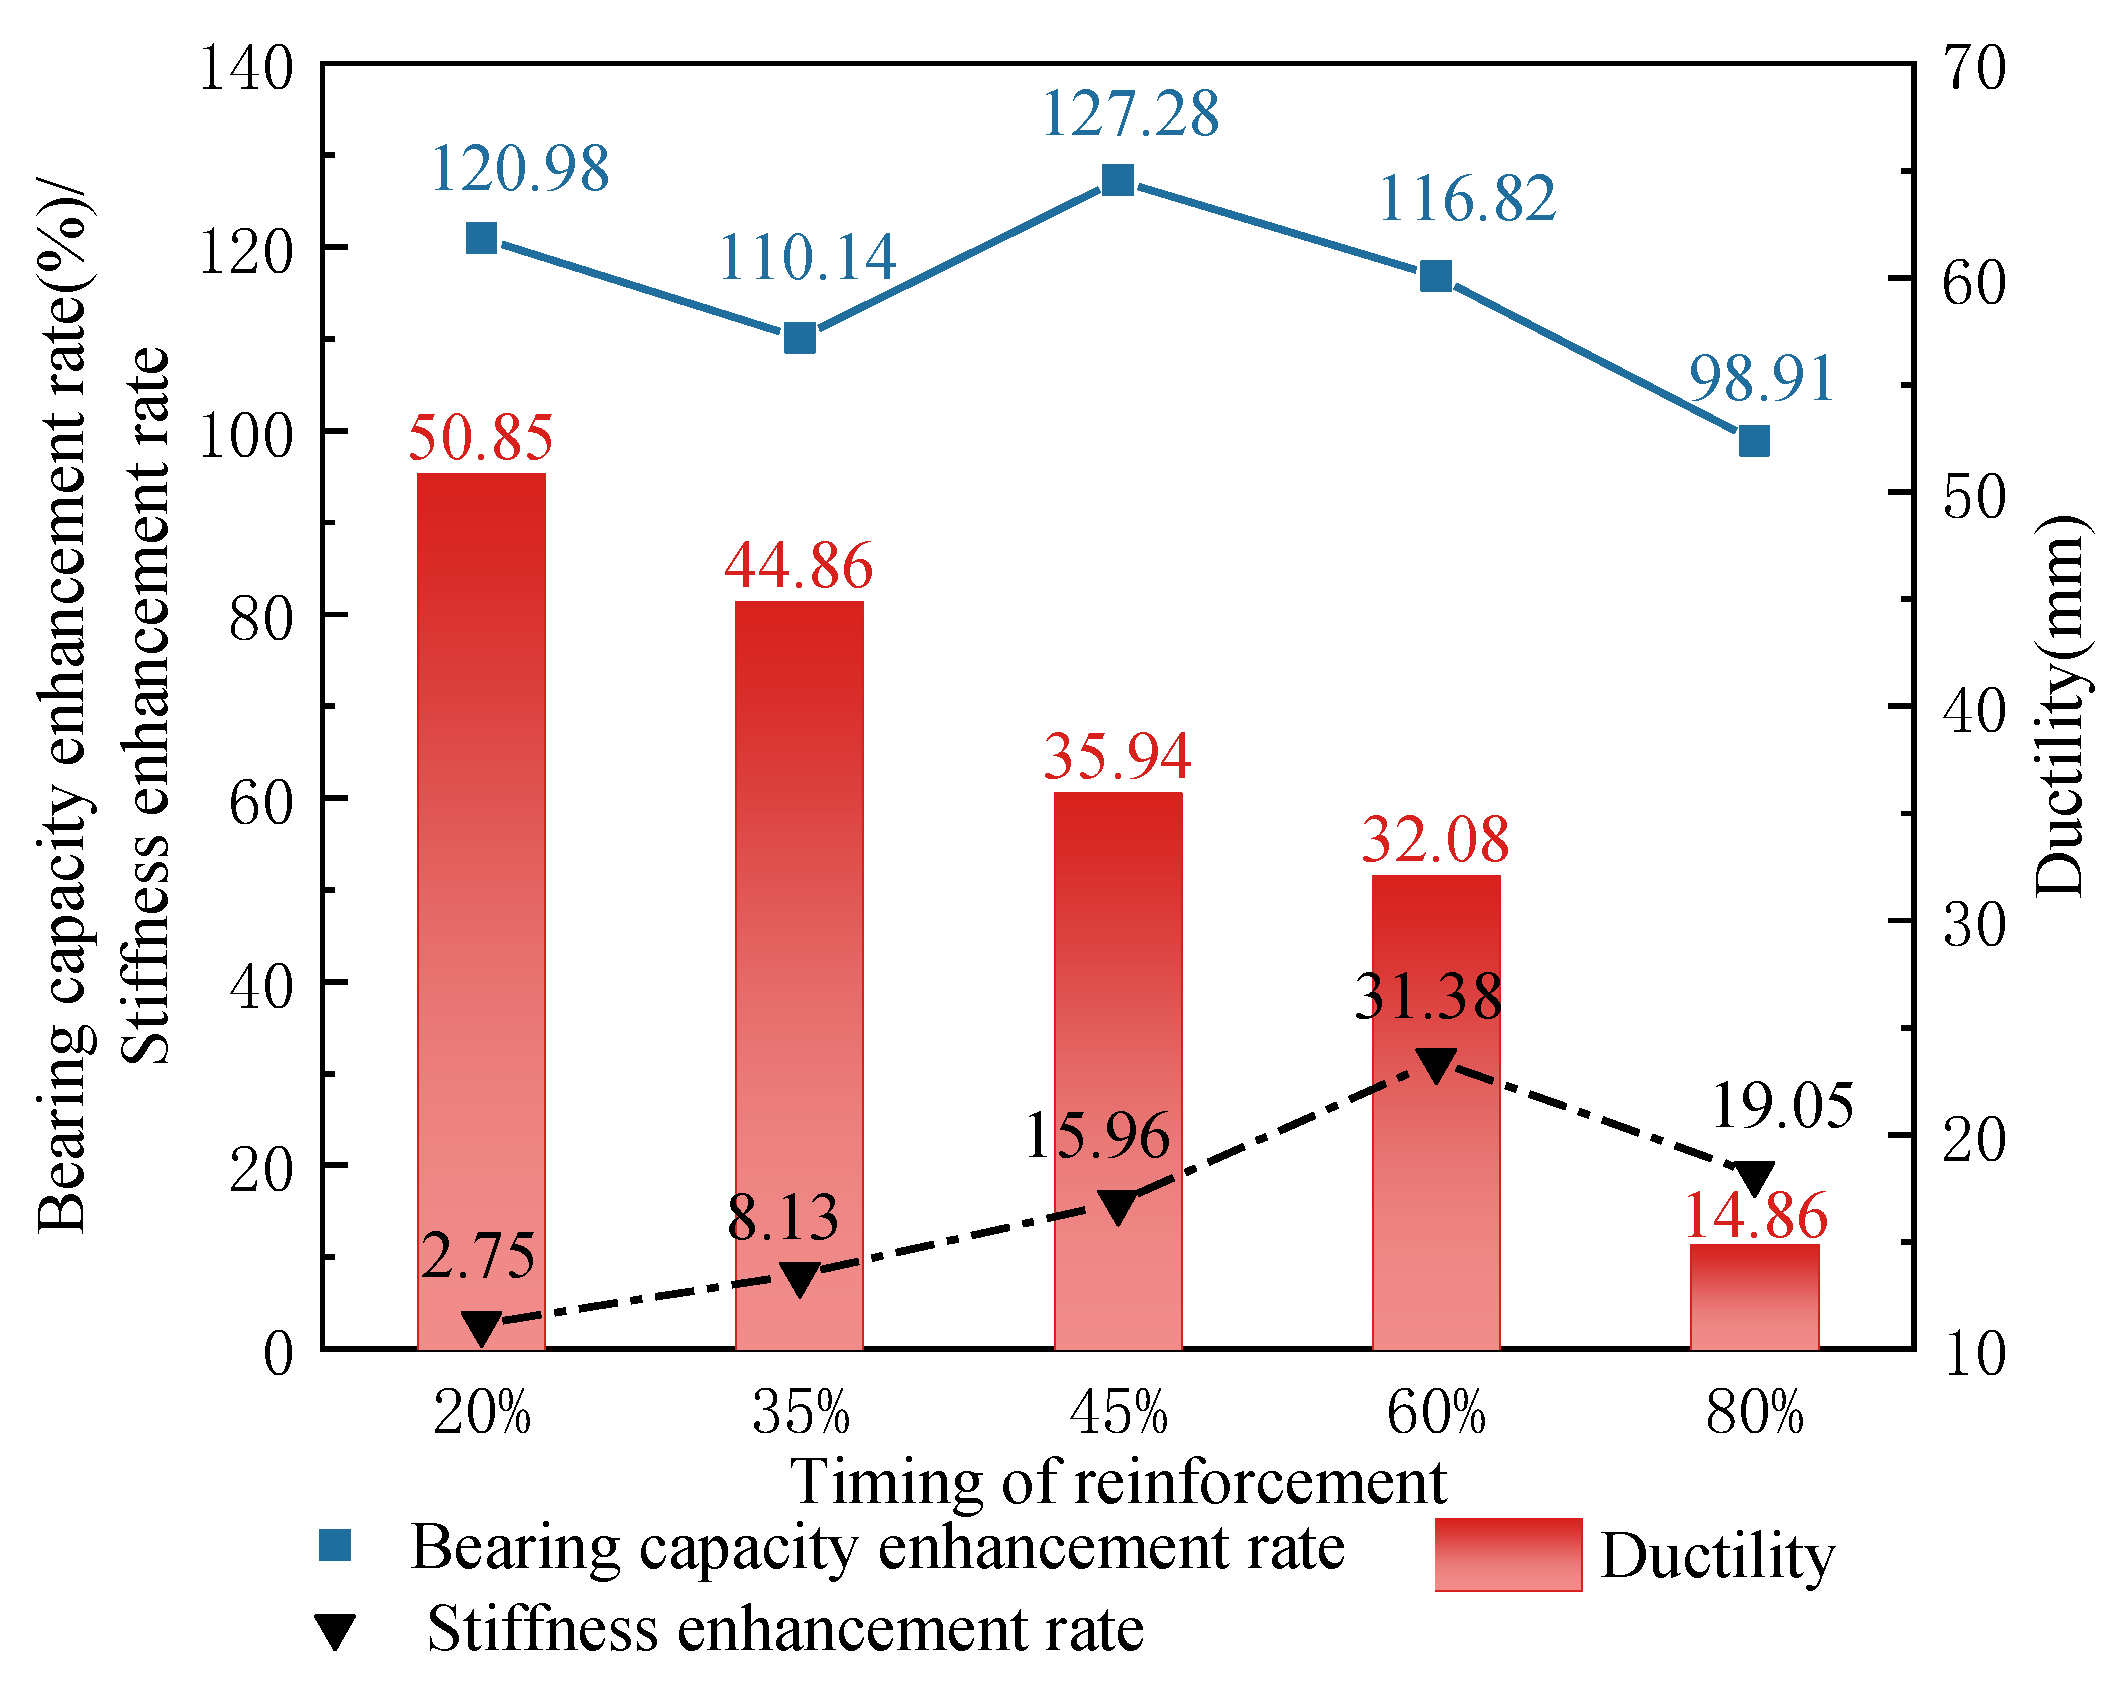
5.2.3. Reinforcement Timing

The load-displacement curves of the composite structure formed after reinforcing the cracked lining under different reinforcement timings are shown in Figure 16. The changes in bearing capacity, stiffness improvement rate, and ductility of the reinforced lining are shown in Figure 17. Figure 16 and Figure 17 show that the peak bearing capacity of the reinforced structure was significantly improved with different strengthening times. As the reinforcement timing was delayed, the stiffness gradually increased, and the ductility gradually decreased. However, when the RDL reached 80%, the load-bearing capacity force increase rate and stiffness increase rate dropped sharply. This shows that if the reinforcement time is too late, the lining will be seriously damaged, making it difficult for the reinforcement layer and the lining to deform cooperatively for a long time, accelerating the damage to the structure and reducing the bearing capacity and stiffness. Therefore, the steel plate–UHPC reinforcement method is suitable for linings that are not seriously damaged, and the strengthening time should be early enough.

6. Conclusions

Based on the experimental and numerical results obtained in this study, the following conclusions can be drawn:
  • Under vertical loading, the process of steel plate–UHPC reinforcement of cracked lining was divided into four stages with reinforcement, spalling at the interface between the steel plate and UHPC, reaching the peak load, and structural damage as the key points. The damage mode was a large eccentric compression at the arch, manifested by the pulling off of the steel reinforcement at the arch waist and the concrete compression at the outer side of the arch, forming one main crack. Throughout the reinforcement process, the strain distribution was shown as tensile on the inner side of the arch, compressive on the outer side, compressive on the inner side of the arch waist, and tensile on the outer side. Compared with the steel plate reinforcement, the peak strain of the reinforcement was reduced by 23.15% when the peak load was reached, which effectively reduced the strain of the structure.
  • The deformation and damage process of steel-plate-reinforced structures and steel plate–UHPC-reinforced structures under vertical concentrated load can be divided into four typical stages, but the curve patterns of each stage differ significantly. Compared with the steel-plate-reinforced structure, the damage mode of steel plate–UHPC-reinforced structure had good ductility, which effectively solved the problem of brittle damage that is prone to occur in the steel plate reinforcement method. In terms of reinforcement effect, both steel plate reinforcement and steel plate–UHPC reinforcement can effectively improve the stiffness of cracked lining and enhance the ultimate bearing capacity of the structure, but the ductility, bearing capacity enhancement rate, and stiffness enhancement rate of the steel plate–UHPC-reinforced structure were 4.66, 2.43, and 2.68 times higher than those of the steel plate reinforcement, respectively.
  • The numerical model of steel plate–UHPC-reinforced cracked lining established based on the plastic damage model showed that the simulated load-displacement curves were basically similar to those of the tests, and the damage morphology and damage site of the reinforced structure were basically in line with those of the tests. After analysing the influencing factors such as UHPC layer thickness, steel belt thickness, and reinforcement timing, it can be seen that the peak load carrying capacity and stiffness enhancement rate of the cracked lining reinforced by steel belt–UHPC increased non-linearly with the increase in UHPC layer thickness and steel belt thickness, but there was a reasonable reinforcing timing for the reinforcement of steel belt–UHPC, and the reinforcement timing will lead to the decrease in the structural load-carrying capacity and stiffness enhancement rate when the reinforcing timing is too late.
The research in this article can provide a basis for subsequent theoretical analysis and engineering practice. However, due to test constraints, this article only used the centralised loading approach for the model test. Furthermore, detailed structures such as pegs and bolts and the impact of changes in UHPC layer thickness on the interface performance of UHPC and steel plates were not considered during the establishment of the numerical model. Future large-scale model tests and other load modes must be conducted to establish a more refined model of steel plate–UHPC-reinforced cracked linings and to more thoroughly investigate the effects and mechanical behaviour of steel plate–UHPC-reinforced cracked linings. Through actual trials, we investigated the mechanism and strengthening of the impact of a fractured lining reinforced with steel plate–UHPC. At the same time, future research also needs to explore and analyse the impact of changes in UHPC thickness on the interface properties with steel plates. In addition, steel plate–UHPC reinforcement has significantly better mechanical properties and durability, which can reduce maintenance costs throughout the life cycle. However, a specific economic comparison has yet to be conducted between steel plate–UHPC reinforcement and other methods. In the future, the benefits of different reinforcement methods can be evaluated from an economic perspective.

Author Contributions

Project administration, Z.D.; methodology, J.W.; resources, W.S.; software, X.L.; writing—original draft preparation, J.W.; supervision, Z.D. All authors have read and agreed to the published version of the manuscript.

Funding

This research was funded by the Transportation Science and Technology Project of Yunnan province, China (No. 2017A04).

Data Availability Statement

For privacy reasons, the data cannot be made fully public. Readers can contact the corresponding author for details.

Conflicts of Interest

Author Wanhu Shen was employed by the company Shandong Hi-Speed Engineering Construction Group Co., Ltd. The remaining authors declare that the research was conducted in the absence of any commercial or financial relationships that could be construed as a potential conflict of interest.

References

  1. Han, W.; Jiang, Y.; Wang, G.; Liu, C.; Koga, D.; Luan, H. Review of Health Inspection and Reinforcement Design for Typical Tunnel Quality Defects of Voids and Insufficient Lining Thickness. Tunn. Undergr. Space Technol. 2023, 137, 105110. [Google Scholar] [CrossRef]
  2. Chen, L.-L.; Li, J.; Wang, Z.-F.; Wang, Y.-Q.; Li, J.-C.; Li, L. Sustainable Health State Assessment and More Productive Maintenance of Tunnel: A Case Study. J. Clean. Prod. 2023, 396, 136450. [Google Scholar] [CrossRef]
  3. Song, W.; Lai, H.; Liu, Y.; Yang, W.; Zhu, Z. Field and Laboratory Study of Cracking and Safety of Secondary Lining for an Existing Highway Tunnel in Loess Ground. Tunn. Undergr. Space Technol. 2019, 88, 35–46. [Google Scholar] [CrossRef]
  4. Liu, D.; Shang, Q.; Li, M.; Zuo, J.; Gao, Y.; Xu, F. Cracking Behaviour of Tunnel Lining under Bias Pressure Strengthened Using FRP Grid-PCM Method. Tunn. Undergr. Space Technol. 2022, 123, 104436. [Google Scholar] [CrossRef]
  5. Pintado, X.; Barragán, B.E. Homogeneity of Self-Compacting Concretes Used in Tunnel Strengthening—A Case Study. Tunn. Undergr. Space Technol. 2009, 24, 647–653. [Google Scholar] [CrossRef]
  6. Li, X.; Zhang, T.; Ding, Z.; Yang, X.; Wen, J. Numerical Analysis of Normal Concrete Lining Strengthening Methods under Different Damage Levels. Struct. Infrastruct. Eng. 2021, 17, 1597–1611. [Google Scholar] [CrossRef]
  7. Kiriyama, K.; Kakizaki, M.; Takabayashi, T.; Hirosawa, N.; Takeuchi, T.; Hajohta, H.; Yano, Y.; Imafuku, K. Structure and Construction Examples of Tunnel Reinforcement Method Using Thin Steel Panels. Nippon. Steel Tech. Rep. 2005, 92, 45–50. [Google Scholar]
  8. Zhai, W.; Chapman, D.; Zhang, D.; Huang, H. Experimental Study on the Effectiveness of Strengthening Over-Deformed Segmental Tunnel Lining by Steel Plates. Tunn. Undergr. Space Technol. 2020, 104, 103530. [Google Scholar] [CrossRef]
  9. Chen, H.; Lai, H.; Qiu, Y.; Chen, R. Reinforcing Distressed Lining Structure of Highway Tunnel with Bonded Steel Plates: Case Study. J. Perform. Constr. Facil. 2020, 34, 04019082. [Google Scholar] [CrossRef]
  10. Liu, D.J.; Huang, H.W.; Zuo, J.P.; Xue, Y.D.; Li, Y.J. Control method and mechanism of large transverse deformation of shield segment using. Chin. J. Rock Mech. Eng. 2017, 36, 1889–1898. [Google Scholar] [CrossRef]
  11. Liu, X.; Jiang, Z.; Mang, H.A. Experimental Investigation of the Influence of the Timing of Strengthening on the Structural Behavior of Segmental Tunnel Linings. Eng. Struct. 2023, 274, 115070. [Google Scholar] [CrossRef]
  12. Chen, R.-P.; Gao, B.-Y.; Ruan, S.-Q.; Wu, H.-N.; Fan, M.; Feng, D.-L. Experimental Study on the Mechanical Behavior of Segmental Joints of Shield Tunnels Strengthened by a Steel Plate-UHPC Composite. Tunn. Undergr. Space Technol. 2024, 144, 105536. [Google Scholar] [CrossRef]
  13. Liu, X.; Jiang, Z.; Yuan, Y.; Mang, H.A. Experimental Investigation of the Ultimate Bearing Capacity of Deformed Segmental Tunnel Linings Strengthened by Epoxy-Bonded Steel Plates. Struct. Infrastruct. Eng. 2018, 14, 685–700. [Google Scholar] [CrossRef]
  14. Teng, J.-G.; Xiang, Y.; Yu, T.; Fang, Z. Development and Mechanical Behaviour of Ultra-High-Performance Seawater Sea-Sand Concrete. Adv. Struct. Eng. 2019, 22, 3100–3120. [Google Scholar] [CrossRef]
  15. Feng, P.; Cheng, S.; Bai, Y.; Ye, L. Mechanical Behavior of Concrete-Filled Square Steel Tube with FRP-Confined Concrete Core Subjected to Axial Compression. Compos. Struct. 2015, 123, 312–324. [Google Scholar] [CrossRef]
  16. Kasischke, E.S.; Bruhwiler, L.P. Emissions of Carbon Dioxide, Carbon Monoxide, and Methane from Boreal Forest Fires in 1998. J. Geophys. Res. Atmos. 2002, 107, FFR 2-1–FFR 2-14. [Google Scholar] [CrossRef]
  17. Wille, K.; El-Tawil, S.; Naaman, A.E. Properties of Strain Hardening Ultra High Performance Fiber Reinforced Concrete (UHP-FRC) under Direct Tensile Loading. Cem. Concr. Compos. 2014, 48, 53–66. [Google Scholar] [CrossRef]
  18. Prem, P.R.; Ramachandra Murthy, A.; Ramesh, G.; Bharatkumar, B.H.; Iyer, N.R. Flexural Behaviour of Damaged RC Beams Strengthened with Ultra High Performance Concrete. In Advances in Structural Engineering; Matsagar, V., Ed.; Springer: New Delhi, India, 2015; pp. 2057–2069. ISBN 978-81-322-2186-9. [Google Scholar]
  19. Safdar, M.; Matsumoto, T.; Kakuma, K. Flexural Behavior of Reinforced Concrete Beams Repaired with Ultra-High Performance Fiber Reinforced Concrete (UHPFRC). Compos. Struct. 2016, 157, 448–460. [Google Scholar] [CrossRef]
  20. Valikhani, A.; Jahromi, A.J.; Mantawy, I.M.; Azizinamini, A. Experimental Evaluation of Concrete-to-UHPC Bond Strength with Correlation to Surface Roughness for Repair Application. Constr. Build. Mater. 2020, 238, 117753. [Google Scholar] [CrossRef]
  21. Pan, Y.; He, X.; Zou, C.; Yang, C. Feasibility and Performance Requirements of Ultra-High-Performance Concrete in Crack Treatment of Tunnel Lining. Tunn. Constr. 2022, 42, 1647–1655. [Google Scholar]
  22. Yashiro, K.; Hirata, R.; Okano, N.; Kojima, Y. Study on Deformation and Failure Behavior of Mountaintunnel Lining Which Consist of Various Materials. J. Jpn. Soc. Civ. Eng. Ser. F1 Tunn. Eng. 2015, 71, 78–94. [Google Scholar] [CrossRef]
  23. He, W.; Wu, Z.; Kojima, Y.; Asakura, T. Failure Mechanism of Deformed Concrete Tunnels Subject to Diagonally Concentrated Loads. Comput.-Aided Civ. Infrastruct. Eng. 2009, 24, 416–431. [Google Scholar] [CrossRef]
  24. Ding, Z.; Fu, J.; Li, X.; Ji, X. Mechanical Behavior and Its Influencing Factors on Engineered Cementitious Composite Linings. Adv. Mater. Sci. Eng. 2019, 2019, 3979741. [Google Scholar] [CrossRef]
  25. Yuan, W. Similarity Theory and Static Model Test; Southwest Jiaotong University Press: Chengdu, China, 1998; ISBN 978-7-81057-187-6. [Google Scholar]
  26. JTG/T 5440-2018; Technical Specification for Highway Tunnel Reinforcement. China Communication Press: Beijing, China, 2019.
  27. Liu, X.; Lai, H.; Sang, Y. Case Study on the Model Test of Staggered-Jointed Assembling Shield Tunnel Structure Reinforced by Bonded Steel Plates under Large Deformation. IOP Conf. Ser. Earth Environ. Sci. 2019, 330, 022080. [Google Scholar] [CrossRef]
  28. Liu, X.; Jiang, Z.; Liu, S. Experiment of deformed shield tunnels strengthened by steel plate-concrete composite structure. China J. Highw. Transp. 2020, 33, 128–137. [Google Scholar] [CrossRef]
  29. Krajcinovic, D.; Fonseka, G.U. The Continuous Damage Theory of Brittle Materials, Part 1: General Theory. J. Appl. Mech. 1981, 48, 809–815. [Google Scholar] [CrossRef]
  30. Zhang, X.; Ma, C.; Liu, C.; Zhang, K.; Lu, J.; Liu, C. Uniaxial Tensile Properties of Steel Fiber-Reinforced Recycled Coarse Aggregate Shotcrete: Test and Constitutive Relationship. Constr. Build. Mater. 2024, 411, 134202. [Google Scholar] [CrossRef]
  31. Amorim, D.L.N.D.F.; Proença, S.P.B.; Flórez-López, J. Simplified Modeling of Cracking in Concrete: Application in Tunnel Linings. Eng. Struct. 2014, 70, 23–35. [Google Scholar] [CrossRef]
  32. Zhang, Z.; Shao, X.; Li, W.; Zhu, P.; Chen, H. Axial Tensile Behavior Test of Ultra High Performance Concrete. China J. Highw. Transp. 2015, 28, 50–58. [Google Scholar] [CrossRef]
  33. Yuan, F.; Pan, J.; Wu, Y. Numerical Study on Flexural Behaviors of Steel Reinforced Engineered Cementitious Composite (ECC) and ECC/Concrete Composite Beams. Sci. China Technol. Sci. 2014, 57, 637–645. [Google Scholar] [CrossRef]
  34. Ding, Z.; Liao, M.; Xiao, N.; Li, X. Numerical Analysis of the Seismic Response of Tunnel Composite Lining Structures across an Active Fault. Adv. Mater. Sci. Eng. 2021, 2021, 1518763. [Google Scholar] [CrossRef]
  35. Tang, H.; Peng, J.; Xiao, L.; Liu, X.; Zhang, J. Numerical Simulation of Corroded Reinforced Concrete Beam Strengthened by a Steel Plate with Different Strengthening Schemes. Adv. Civ. Eng. 2020, 2020, 4236943. [Google Scholar] [CrossRef]
  36. Figiel, Ł.; Kamiński, M. Numerical Probabilistic Approach to Sensitivity Analysis in a Fatigue Delamination Problem of a Two Layer Composite. Appl. Math. Comput. 2009, 209, 75–90. [Google Scholar] [CrossRef]
  37. Zhao, H.; Liu, X.; Bao, Y.; Yuan, Y.; Bai, Y. Simplified Nonlinear Simulation of Shield Tunnel Lining Reinforced by Epoxy Bonded Steel Plates. Tunn. Undergr. Space Technol. 2016, 51, 362–371. [Google Scholar] [CrossRef]
  38. Jones, R.; Swamy, R.N.; Charif, A. Plate Separation and Anchorage of Reinforced Concrete Beams Strengthend by Epoxy-Bonded Steel Plates. Struct. Eng. 1988, 66, 85–94. [Google Scholar]
  39. Luo, J.; Shao, X.; Fan, W.; Cao, J.; Deng, S. Flexural Cracking Behavior and Crack Width Predictions of Composite (Steel plus UHPC) Lightweight Deck System. Eng. Struct. 2019, 194, 120–137. [Google Scholar] [CrossRef]
Figure 1. Schematic diagram of the steel plate–UHPC reinforcement structure (unit: mm): (a) geometry and reinforcement details of lining; (b) reinforced structural model.
Buildings 14 01515 g001
Figure 2. Production process of reinforced specimen.
Buildings 14 01515 g002
Figure 3. Test setup: (a) schematic illustration (unit: mm); (b) schematic diagram of the test site layout.
Buildings 14 01515 g003
Figure 4. Test arrangements.
Buildings 14 01515 g004
Figure 5. Load displacement curve of steel plate–UHPC.
Buildings 14 01515 g005
Figure 6. Load strain displacement curve of steel plate−UHPC reinforcement characteristic point: (a) vault; (b) arched waist.
Buildings 14 01515 g006
Figure 7. Crack distribution and failure state of steel plate−UHPC-reinforced cracked lining structure. (○: Tensile cracking, ●: Compressive fracturing).
Buildings 14 01515 g007
Figure 8. Load-displacement curve of lining with different reinforcement methods.
Buildings 14 01515 g008
Figure 9. Load–strain displacement curves of different strengthening methods.
Buildings 14 01515 g009
Figure 10. Model of steel plate–UHPC-reinforced cracked lining: (a) mesh and boundaries of the model; (b) mesh details of the model.
Buildings 14 01515 g010
Figure 11. Simulation results of steel plate–UHPC-reinforced cracked lining: (a) comparison of simulation and test results; (b) tensile damage cloud diagram.
Buildings 14 01515 g011
Figure 12. Load-displacement curves of lining under different UHPC layer thicknesses.
Buildings 14 01515 g012
Figure 13. Bearing capacity enhancement rate and ductility under different UHPC layer thicknesses.
Buildings 14 01515 g013
Figure 14. Load-displacement curves of lining under different steel plate thicknesses.
Buildings 14 01515 g014
Figure 15. Bearing capacity enhancement rate and stiffness enhancement rate under different steel plate thicknesses.
Buildings 14 01515 g015
Figure 16. Load-displacement curves of lining under different reinforcement timings.
Buildings 14 01515 g016
Figure 17. Reinforcing effects under different reinforcement timings.
Buildings 14 01515 g017
Table 1. Mix proportion design of UHPC (mass ratio).
MaterialCementFly AshSilica
Fume
Quartz
Sand
Quartz
Powder
WaterWater
Reducer
Fiber
UHPC10.100.201.10.190.250.0260.21
Table 2. Main test results of cracked lining reinforcement.
Working ConditionsP0/kNy0/mmP1/kNS1/mmPu/kNSu/mmηp(%)ηk∆S/mm
Steel plate34.5610.8286.5113.98122.8918.1359.365.497.31
Steel plate–UHPC34.5610.82115.5816.31188.3944.85144.314.7534.03
Table 3. Parameters related to physical mechanics of UHPC.
Young’s Modulus
Ec/GPa
Poisson’s
Ratio
μ
Compressive Strength
fc/MPa
Tensile Strength
ft/MPa
Expansion Angle/°KEccentricity
ε
Coefficient of Viscosity
μ
48.20.2150.27.20150.670.10.0005
Table 4. Physical and mechanical parameters of rebar and steel plate.
MaterialElastic
Modulus
Es/GPa
Poisson
Ratio
μ
Yield Strength
f y/MPa
Yield Strength Tensile Strain
εy
Ultimate Strength
f u/MPa
Ultimate
Tensile Strain
εu
Rebar2000.23000.016754200.025
Steel plate2000.2400---
Table 5. Calculated working conditions for steel plate–UHPC-reinforced cracked lining.
Working ConditionsThickness of UHPC Layer/mmThickness of Steel Plate/mmTiming of Reinforcement (RDL)
1–45, 10, 15, 201.845%
5–10151.0, 1.2, 1.4, 1.6, 1.8, 2.045%
11–14151.820%, 40%, 60%, 80%
Disclaimer/Publisher’s Note: The statements, opinions and data contained in all publications are solely those of the individual author(s) and contributor(s) and not of MDPI and/or the editor(s). MDPI and/or the editor(s) disclaim responsibility for any injury to people or property resulting from any ideas, methods, instructions or products referred to in the content.

