Article

A Simultaneous Usage Ratio Based on Occupant Behavior: A Case Study of Intermittent Heating in an Apartment Building in Japan

1
Faculty of Engineering, Hokkaido University, Sapporo 0608628, Japan
2
Northern Regional Building Research Institute, Hokkaido Research Organization, Asahikawa 0788801, Japan
*
Author to whom correspondence should be addressed.
Buildings 2024, 14(6), 1518; https://doi.org/10.3390/buildings14061518
Submission received: 26 April 2024 / Revised: 16 May 2024 / Accepted: 22 May 2024 / Published: 23 May 2024

Abstract

:
It is important to reduce the building load and downsize the heat source equipment capacity during construction or renovation carried out toward the achievement of carbon neutrality by 2050 in Japan. However, this sometimes results in the oversizing of the heat source equipment capacity, despite the fact that designers are engaged in the implementation of safety designs while attempting to balance between cost and risk. This study investigated the simultaneous usage ratio of heating based on occupant behavior in an apartment building with the aim of optimizing this capacity. This ratio was defined as a peak load-based approach rather than simultaneity based on the number of people using the system. First, the analysis was conducted for the heating load characteristics for each dwelling unit and each household composition. The subject of this case study was an apartment building located in Sapporo, Japan. Based on these data, a method for creating the curve of the simultaneous usage ratio to avoid a combinatorial explosion was suggested. As a result, the ratio created for about 200 dwelling units was 53.6% in an apartment building and generally stabilized when the number of dwelling units exceeded 30. Finally, a case study was attempted to analyze the influence of changes in household composition on the ratio. If the method proposed in this study for creating the curve of simultaneous usage ratios were to be applied in not only this case study but also in case studies of non-residential buildings such as offices, new results about the curves of ratios that differ from those of apartment buildings could be obtained. Therefore, this case study provides a methodology for statistically quantifying the simultaneous usage ratio as one of the factors in determining the appropriate heat source equipment capacity in the design stage.

1. Introduction

To achieve carbon neutrality by 2050 in Japan, the government [1] has set a target of securing zero-energy house (ZEH) and zero-energy building (ZEB) levels of energy efficiency for newly constructed houses and buildings from 2030 onwards. Furthermore, starting in April 2025, all new homes will be required to comply with energy-saving standards. One of the keys to energy conservation is improving the load factor (=building load/heat source equipment capacity). Therefore, it is crucial to reduce the building load and downsize the heat source equipment capacity during construction or renovation [2]. This leads to several benefits, including lower initial costs from downsizing, decreased energy consumption and running costs due to improved efficiency, and reduced equipment installation space. Designers perform safety designs while balancing cost and risk, but sometimes, they overdesign.
In an apartment building with a central heat source system targeted in this study, it is necessary to accurately estimate the building load to select the appropriate heat source equipment capacity. However, when estimating the load pattern in an apartment building, the peak load per dwelling unit is often assumed and added up for each unit. This assumption leads to the design of a load that may exceed the actual load since it assumes that the peak load for all dwelling units occurs simultaneously. In other words, the issue arises from the fact that the simultaneous usage ratio is not taken into consideration during the design stage, which results in the oversizing of the heat source equipment capacity. Consequently, there is concern that energy consumption may be affected by the decrease in efficiency resulting from the partial load operation of heat source equipment [3,4]. Particularly in Japan, as there is no minimum standard that guarantees room temperature in homes; it is common for intermittent heating to be used in part of the space for part of the time. Since the full space is not continuously heated for the full time, as seen in Europe and America, this is likely to lead to increased energy consumption due to decreased efficiency.
Related to this background, numerous papers have been published on load patterns and factors that impact energy consumption in apartment buildings. Regarding research on building design, Nair et al. [5] explored factors influencing the adoption of energy-efficiency measures in Swedish homeowners, revealing that income, education, age, and contextual factors influenced homeowners’ preferences for specific measures. Suh et al. [6] established heuristic rules for energy-efficient building design in Korea based on a sensitivity analysis, offering valuable guidelines for architects and engineers to develop sustainable apartment housing. Ling et al. [7] analyzed the impact of apartment location on space heating consumption in multi-apartment buildings, providing location correction factors for fair heating cost allocation in different regions and building types in China. Through energy modeling, Danielski et al. [8] demonstrated that heated atria in Nordic climates could reduce the total energy demand while enhancing social interaction among residents, emphasizing the importance of specific design parameters for energy efficiency and social sustainability. Belazi et al. [9] implemented a multi-zone building model to optimize energy consumption in a three-floor residential building, determining the optimal interior insulation thickness through progressive adjustments and evaluating the influence of random variations in family absence on energy demand.
Next, regarding research on building retrofits, Fajilla et al. [10] conducted a life-cycle assessment to evaluate the impact of climate change and occupant behavior on the environmental performance of heating and cooling systems in an Italian apartment, emphasizing the need for attention to be paid to occupant behavior for future energy strategies. Qi et al. [11] investigated the energy-saving potential of lowering heating set-points in eight cities, discovering significant energy savings even in warm-winter cities, with the mechanism dominated by temperature-difference saving and behavioral saving hours. Seo et al. [12] analyzed heating energy consumption in Seoul and Busan apartment complexes, finding that green retrofits for older buildings led to a significant reduction of up to 32% in heating energy consumption.
Research on heat cost allocation is also advancing. Andersen et al. [13] compared indoor environmental measurements in buildings with collective and individual heat cost allocation, revealing differences in occupants’ control strategies and highlighting the influence of allocation plans on thermal comfort and air quality. Michnikowski [14] analyzed energy consumption fluctuations in apartments over four years, emphasizing significant heat transfer between adjacent apartments and proposing a method based on average internal temperatures for correcting heating cost allocation errors in multi-apartment buildings. Siggelsten [15] utilized hourly electricity use measurements to show the significant impact of occupant behavior on heating energy demand in low-energy buildings, highlighting the importance of the accurate modeling of internal heat gains for energy-efficient designs.
Regarding occupant behavior that impacts load patterns, which is significant for this study, using the real-estate registration database, Santin et al. [16] found that occupant characteristics and behavior significantly affected energy use in dwellings, contributing to 4.2% of the variation, while building characteristics remained the primary determinants of energy use. Using a hybrid life-cycle assessment, Kyro et al. [17] assessed greenhouse gas emissions in Finnish multi-family apartment buildings, identifying heating energy as a major contributor and suggesting that occupant behavior had a limited impact on overall energy consumption. Kim et al. [18] investigated the effect of residents’ behaviors on energy consumption in 20 households, finding that energy-conservation behaviors played a more significant role than building service life in influencing energy use. Engvall et al. [19] analyzed factors influencing energy use for space heating in Swedish multi-family buildings, emphasizing the importance of real-estate management, maintenance, and a gender perspective for effective energy-efficiency measures. Using response surface methodology, Fransson et al. [20] developed a predictive model for heating and cooling energy consumption in South Korean apartment buildings, emphasizing the model’s ability to provide rapid energy predictions based on simple design variables. Haines et al. [21] mapped the interaction between occupants and hot-water heating systems in the UK, identifying four distinct hot-water heating types through contextual interviews, providing insights for the design of future thermal energy storage systems. By analyzing apartment-specific data, Moeller et al. [22] quantified the influence of various factors, including occupant behavior and internal heat transfers, on heating energy consumption in multi-apartment buildings, highlighting the importance of considering both types of data at the apartment level. Lee et al. [23] used smart meters to collect data on domestic hot-water use in 918 households, demonstrating the feasibility of forecasting seasonal consumption based on outdoor temperatures and emphasizing the importance of understanding demand behavior for efficient use. Tran et al. [24] characterized Japanese household properties and electricity consumption in electric-only apartments, revealing significant associations between household characteristics, energy-related behavior, and electricity end-use, providing insights for future energy-saving strategies.
Additionally, regarding prediction and modeling associated with occupant behavior, Jang et al. [25] developed a model considering occupant behavior to reflect variations in actual energy consumption in Seoul apartments, highlighting the methodology’s potential to reduce uncertainties in building simulations and provide more accurate predictions. Through statistical methods, Kim et al. [26] developed a predictive model for residential-building energy consumption in South Korea, considering design factors and showing that the model accurately predicted heating and cooling energy use with simple design variables. On the other hand, with regard to diversity factors, Weissmann et al. [27] examined the impact of building characteristics on diversity in district heating peak loads in German residential areas, identifying factors that contribute to higher diversity and highlighting the advantages, particularly in districts with high load densities and specific building structures. An et al. [28] analyzed diversity in air-conditioning usage patterns in Chinese residential buildings, developing new metrics to enhance their understanding of air-conditioning operation characteristics and promote energy-saving behaviors among occupants. Wang et al. [29] investigated diversity in window-open states influenced by outdoor factors in UK apartment buildings, highlighting the significance of considering hierarchical behavioral variations for accurate estimations of building energy and indoor air quality impacts.
Expanding to energy-saving behaviors [30,31,32,33], a paper on interior layout [29] indicated that the energy performance of buildings can be improved by 14.9%. A review paper on educating occupants [34] concluded that energy savings of 4–30% are possible. However, as a problem on the part of occupants in general, many studies [35,36,37,38] pointed out that there is a large gap between knowledge and behavior regarding energy saving. If these behaviors could be practiced, energy consumption would be reduced, which is desirable. On the other hand, if the conventional design based on the simple accumulation of the peak load of each dwelling unit remains unchanged, there is a possibility that the design and actual situation will diverge further. From this point of view, to consider the planning and operation of buildings, it is crucial to focus on the simultaneous usage ratio of the load based on occupant behavior according to household composition, as indicated by the results of these studies. Additionally, judging from both indoor environmental quality and energy consumption, the importance of occupant behavior among diversity factors, including building characteristics, is supported by a comprehensive review paper [39] and a recent paper [40]. Therefore, the primary objective of this study is to present a methodology to quantitatively obtain the simultaneous usage ratio that can be useful in the design stage through an actual case study. In examining the simultaneous usage ratio as a case study, this study will focus on heating, as it represents a significant portion of energy consumption considering the Japanese custom of intermittent heating. It aims to optimize the heat source equipment capacity considering the simultaneous usage ratio of heating based on occupant behavior in apartment buildings by investigating three points: (1) the analysis of the heating load characteristics for each dwelling unit and each household composition; (2) the suggestion and evaluation of a method for creating the curve of a simultaneous usage ratio; (3) the analysis of the influence of changes in household composition on a simultaneous usage ratio.

2. Materials and Methods

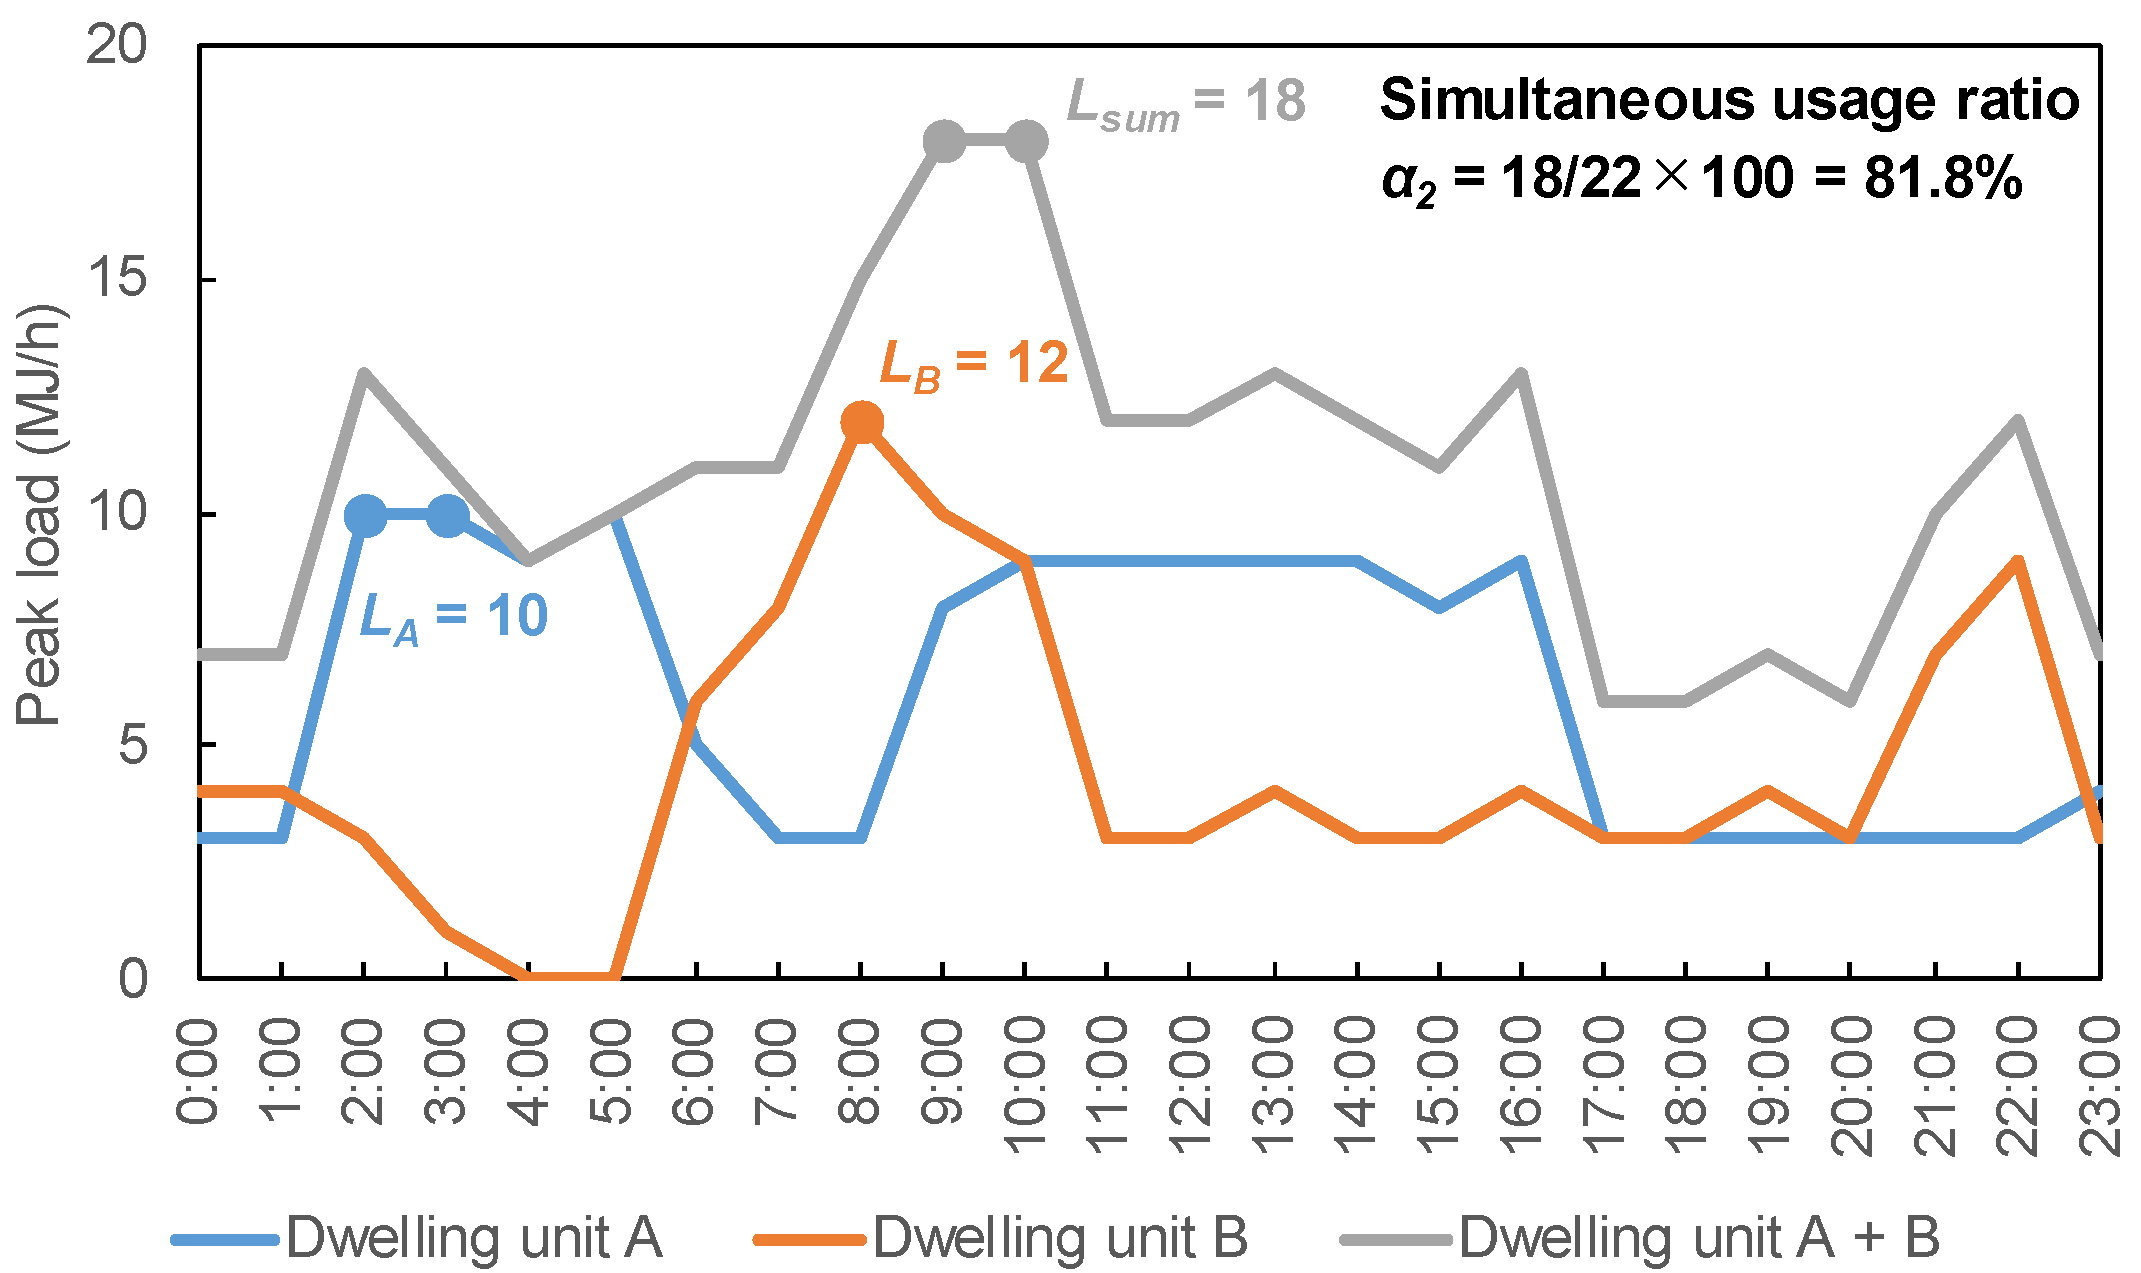
2.1. Definition of Simultaneous Usage Ratio

The definition of a simultaneous usage ratio is shown in Equation (1).
α i = L s u m i = 1 n L i   ×   100 %
where αi is the simultaneous usage ratio, %; Lsum is the peak load for all dwelling units, MJ/h; Li is the peak load for each dwelling unit, MJ/h; and n is the number of dwelling units.
In this study, the simultaneous usage ratio means the ratio of the actual peak load for all dwelling units to the load that would occur if each dwelling unit peaked simultaneously. In general, as the number of dwelling units increases, the peak of each dwelling unit will be less likely to occur simultaneously, and the ratio will decrease. Therefore, it differs from the ratio of the number of zones or spaces, which are occupied or used at the time, to the total number of zones or spaces in the group, as defined in ISO 18523-1:2016 [41].
Figure 1 shows an example of calculating the simultaneous usage ratio using load data for two dwelling units. If the peak load of dwelling unit A is 10 MJ/h, B is 12 MJ/h, and that of two dwelling units that actually occur is 18 MJ/h, the simultaneous usage ratio is 81.8% (=18/(10 + 12) × 100%). When comparing two dwelling units, the ratio may be around 80%, as shown in the example, or it may reach 100% simultaneously. However, as the number of dwelling units increases from 10 to 20 to 30, it becomes less common for all dwelling units to peak simultaneously, resulting in a decline in the ratio.

2.2. Overview of a Case Study Building

The subject of this case study is an apartment building located in Sapporo, Hokkaido, in the north of Japan. The building, completed in June 2001, comprises two residential buildings and an administration building that houses heat source equipment and power-receiving and -transforming equipment. The structure is made of steel-reinforced concrete and has 15 floors above ground and one floor underground. The site area is 11,355 m2, and the total floor area is 28,814 m2. As of December 2019, there are 223 units, and 222 are occupied.
Figure 2 displays the heat and power supply system, which includes a central heat source system for heating, hot-water supply, and snow melting. The system comprises a cogeneration system (CGS) that utilizes one gas engine generator and two vacuum water heaters (heater) to produce hot water at 80 °C for heating. During the planning stage, the annual load for the heating that is the focus of this study was determined to be 4600 GJ/year. The combined heat and power (CHP) system is operated following electric load and is automatically controlled in response to power demand.

2.3. Data Collection

To analyze the load characteristics of each dwelling unit and each household composition, the data from an energy management system for apartment buildings (MEMS) was utilized, and a questionnaire survey of residents was conducted. The MEMS data record the amount of heat used for heating in MJ/h, the amount of electricity used in kWh/h, and so on for each dwelling unit. This research focused on the fiscal year of 2018 from April 2018 to March 2019 and used data from before the COVID-19 outbreak, when telecommuting became widespread.
The questionnaire survey inquired about household composition and lifestyle schedule. A total of 106 valid responses were obtained from 222 households. Table 1 lists the main questionnaire items.

3. Results and Analysis

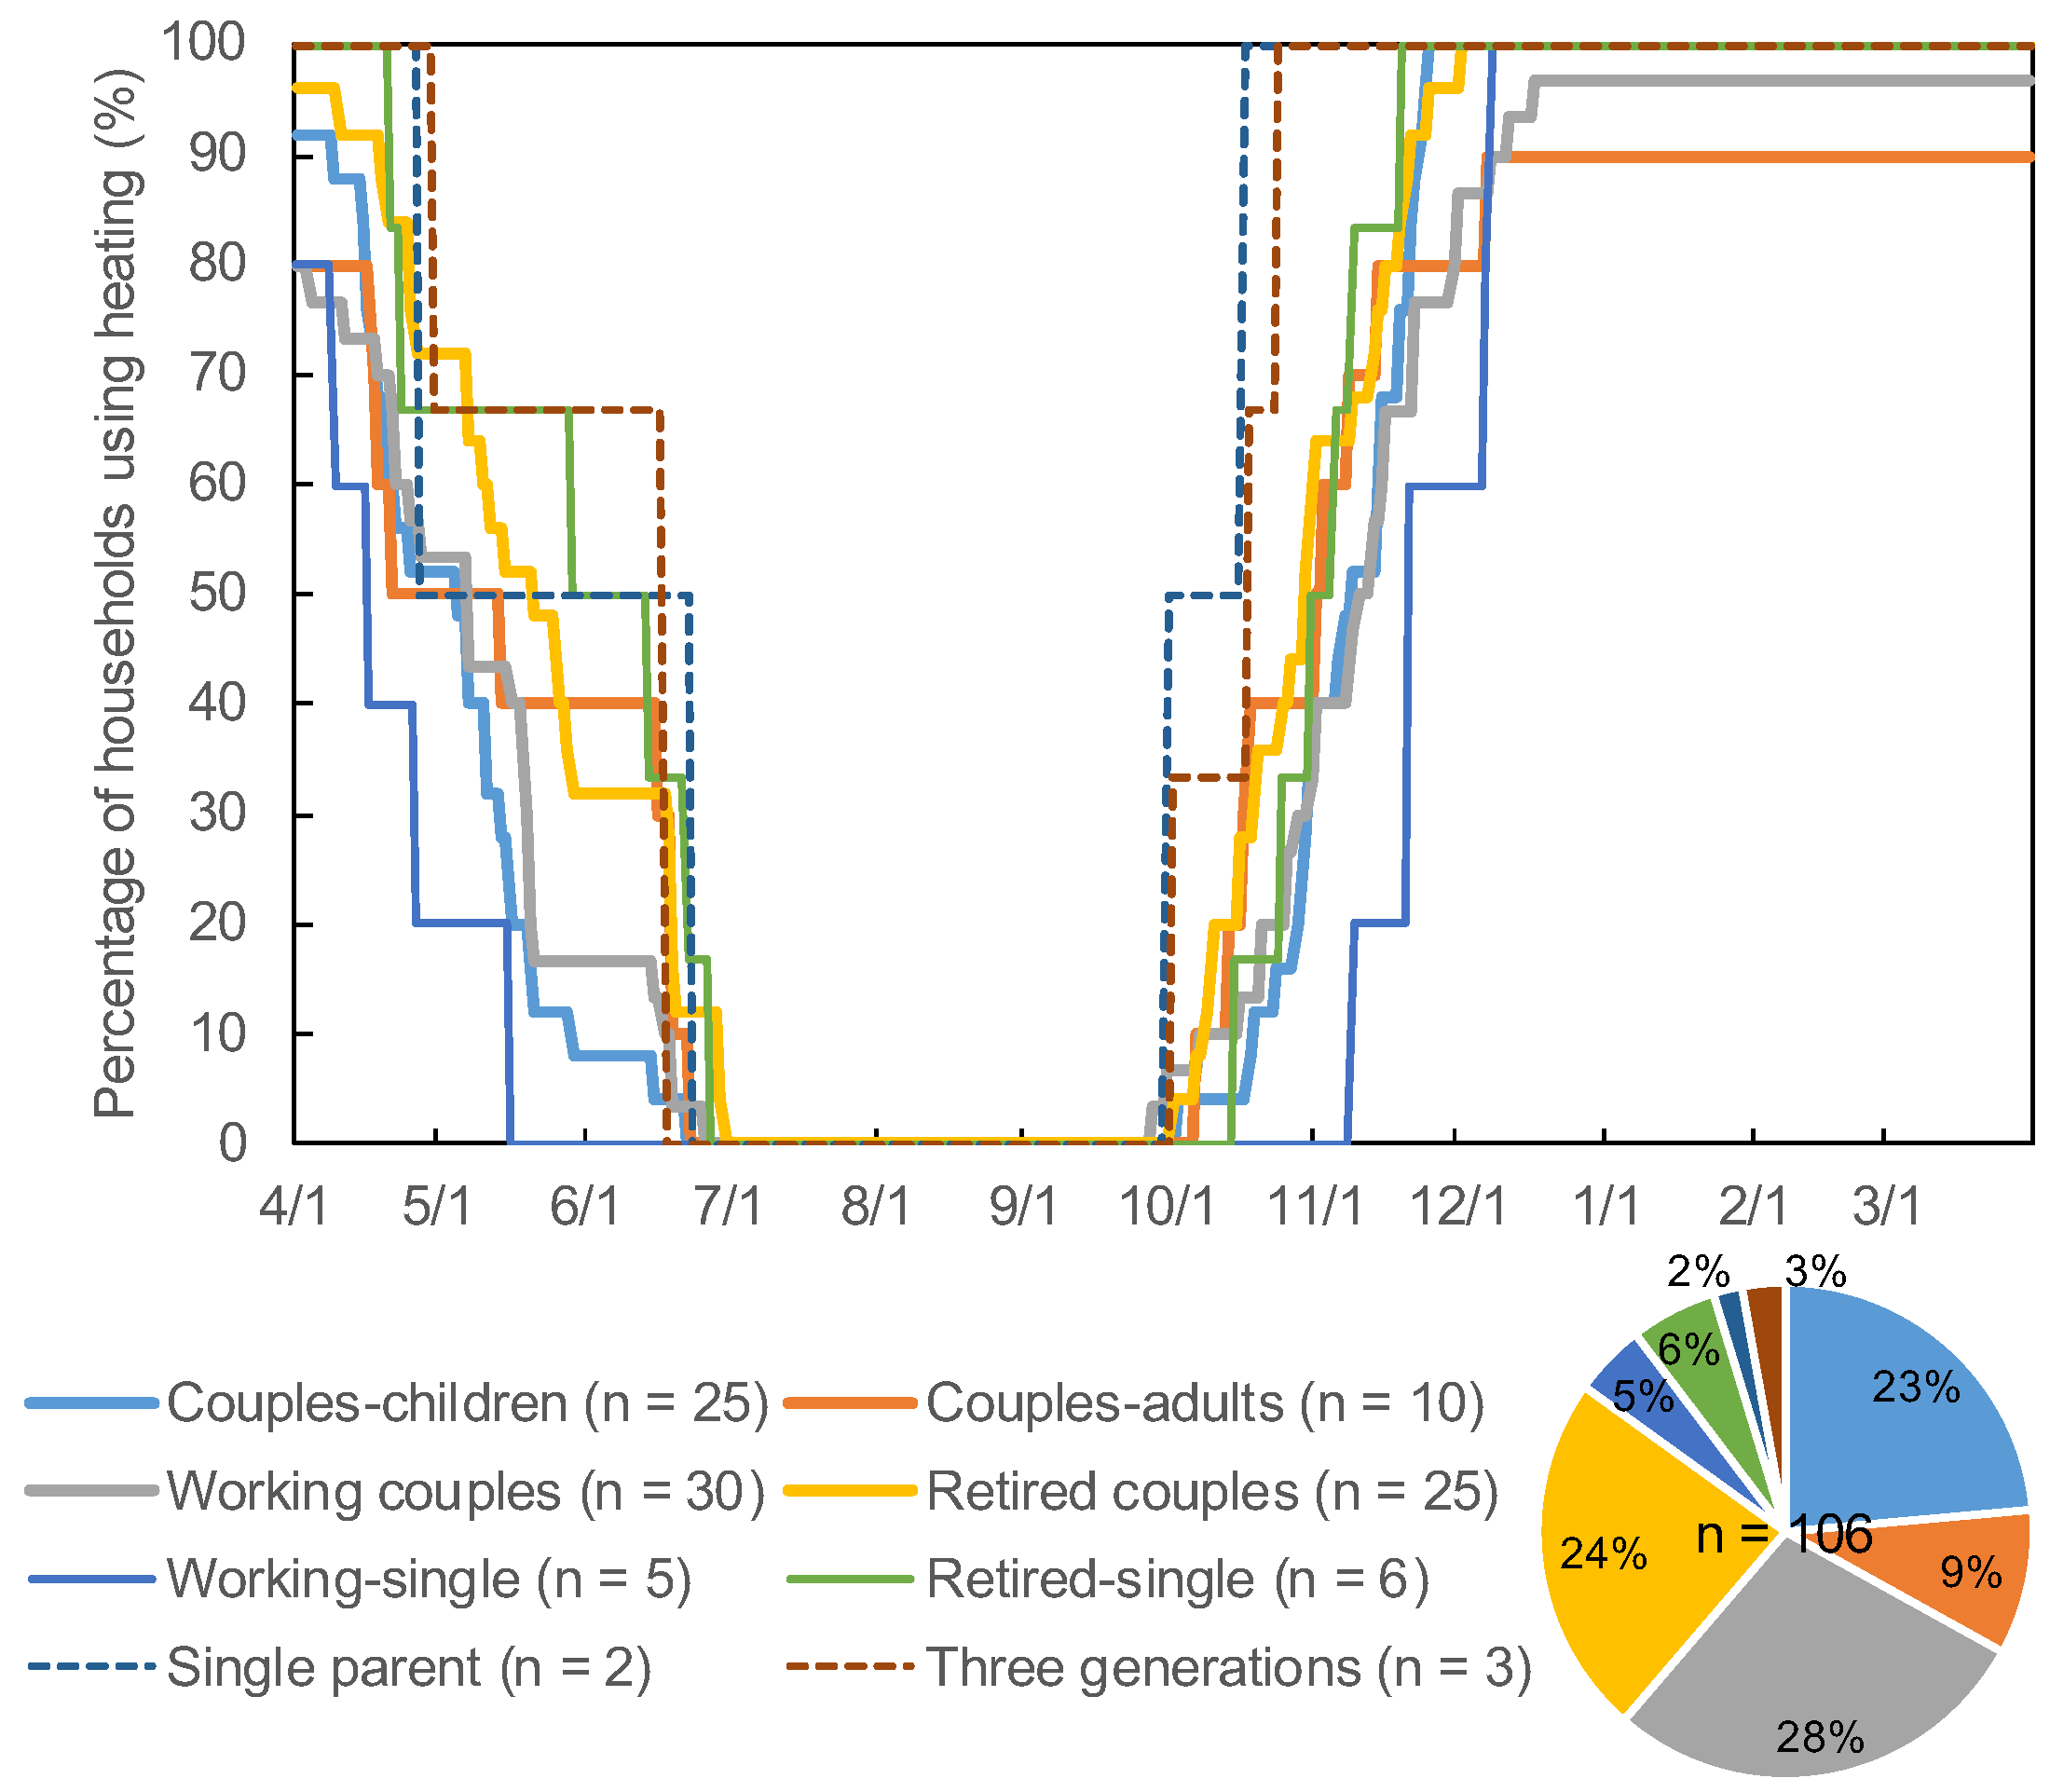
3.1. Classification of Household Composition

Table 2 lists the classification of household composition. Questionnaire responses received from 106 cases were categorized into eight types of household compositions based on the number of people, their gender, age, and occupation. Households comprising a married couple and children who are students or preschoolers were defined as “couple–children”. In contrast, households with a married couple and working children were defined as “couple–adults”. Next, “working couples” were defined as two-person households where at least one person is employed, while “retired couples” were those where both members of the couple are retired. The categorization of household composition was based on the employment status of the residents. Similarly, “working–single” was those households where one person is employed, and “retired–single” was those households where one person is retired. Furthermore, households consisting of a single parent and children were classified as “single parent”, while households with three generations were classified as “three generations”. As a result, the largest share of households were working couples at 28%, followed by retired couples and couples–children, both at 24%. This indicates a wide range of household types.

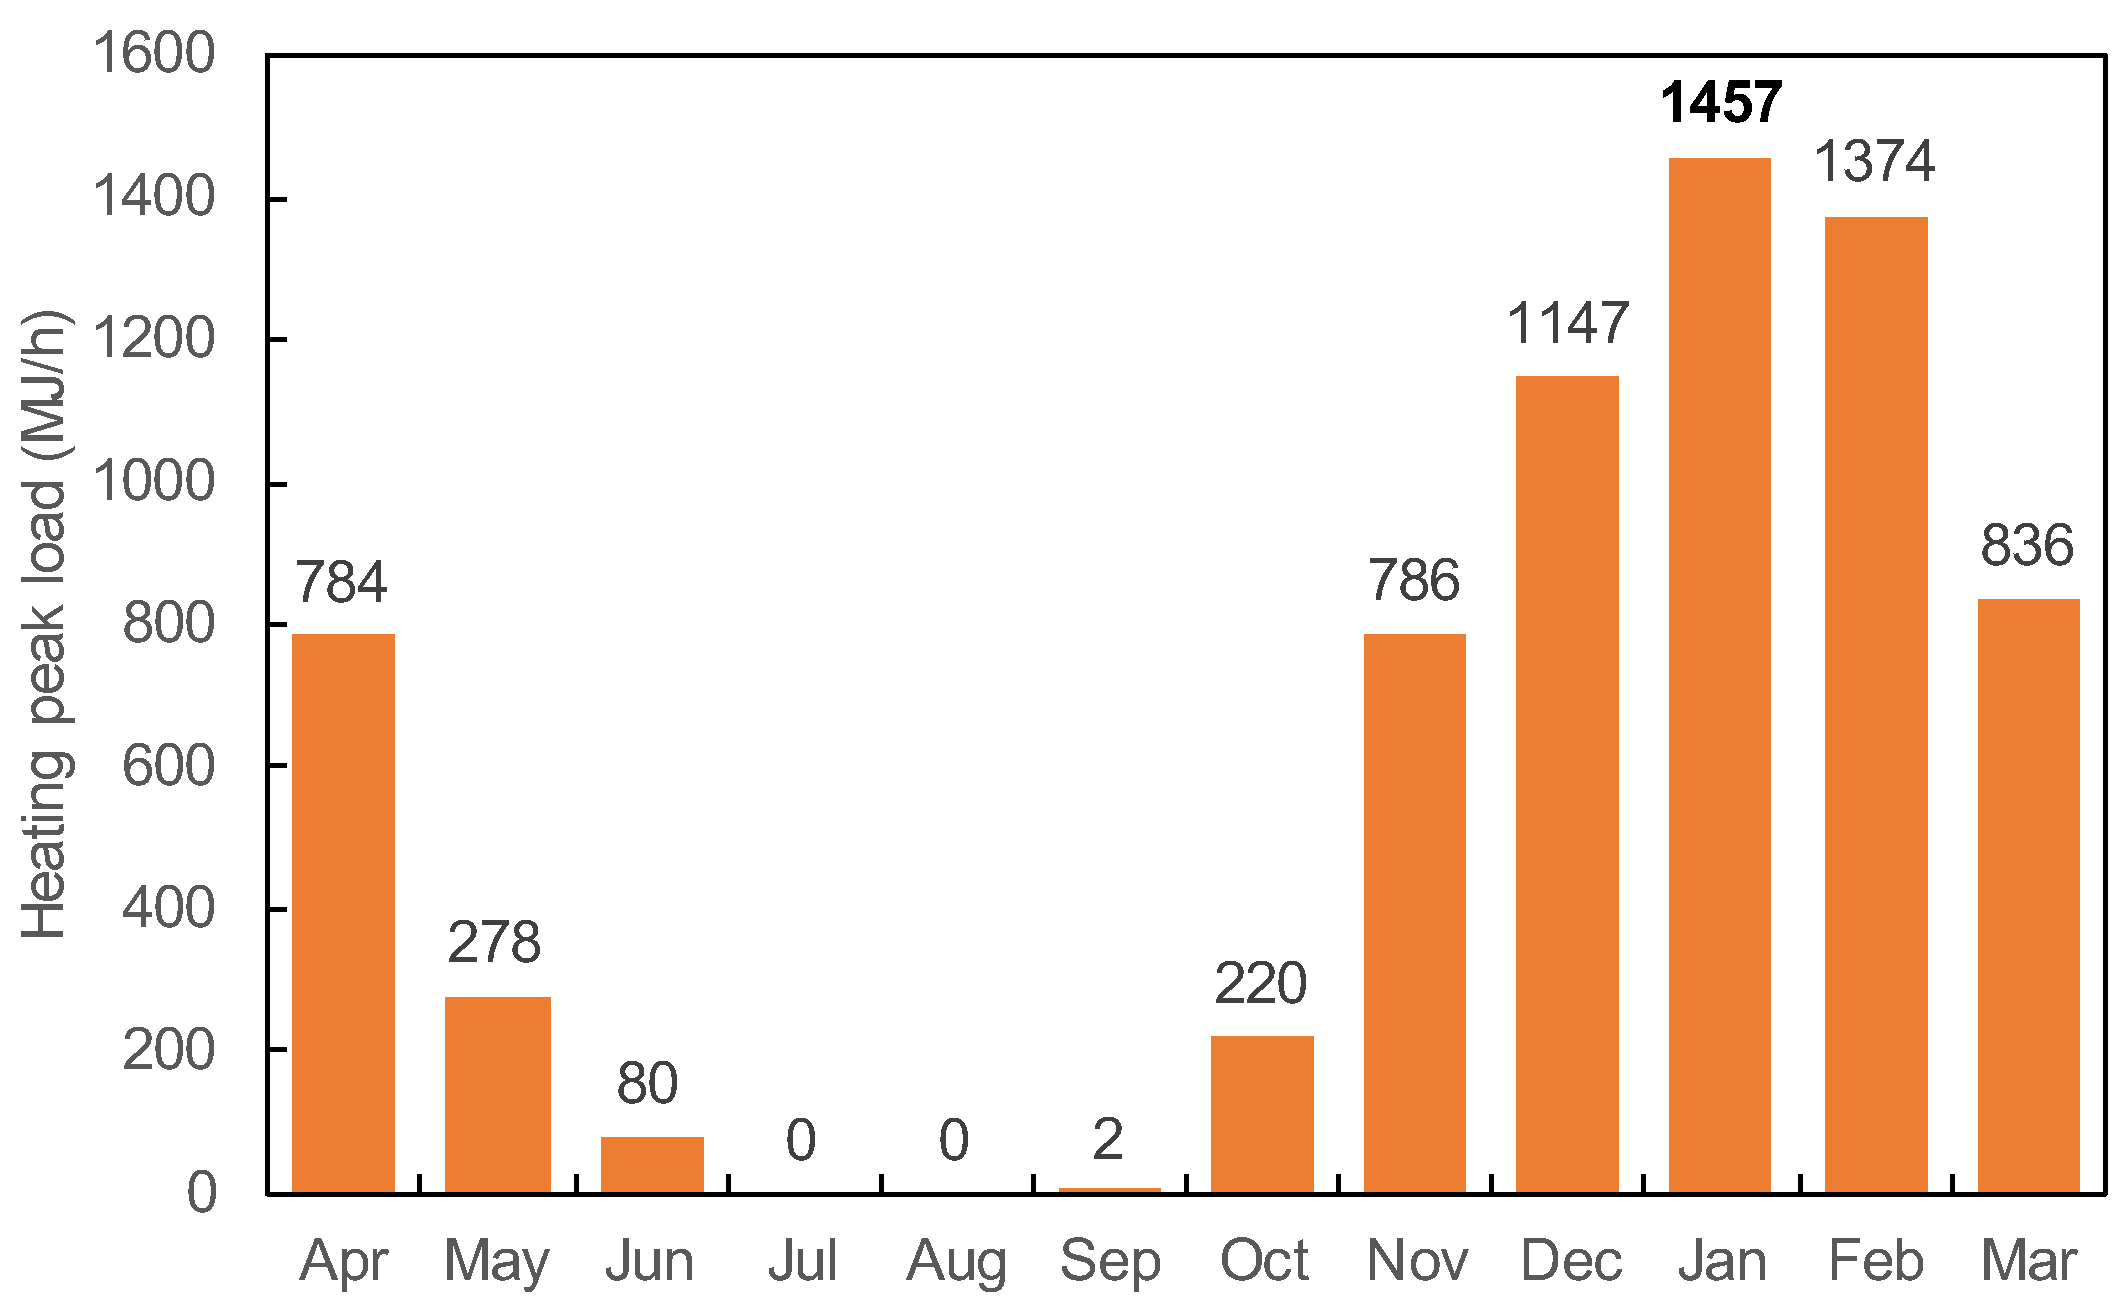
3.2. Heating Load Characteristics

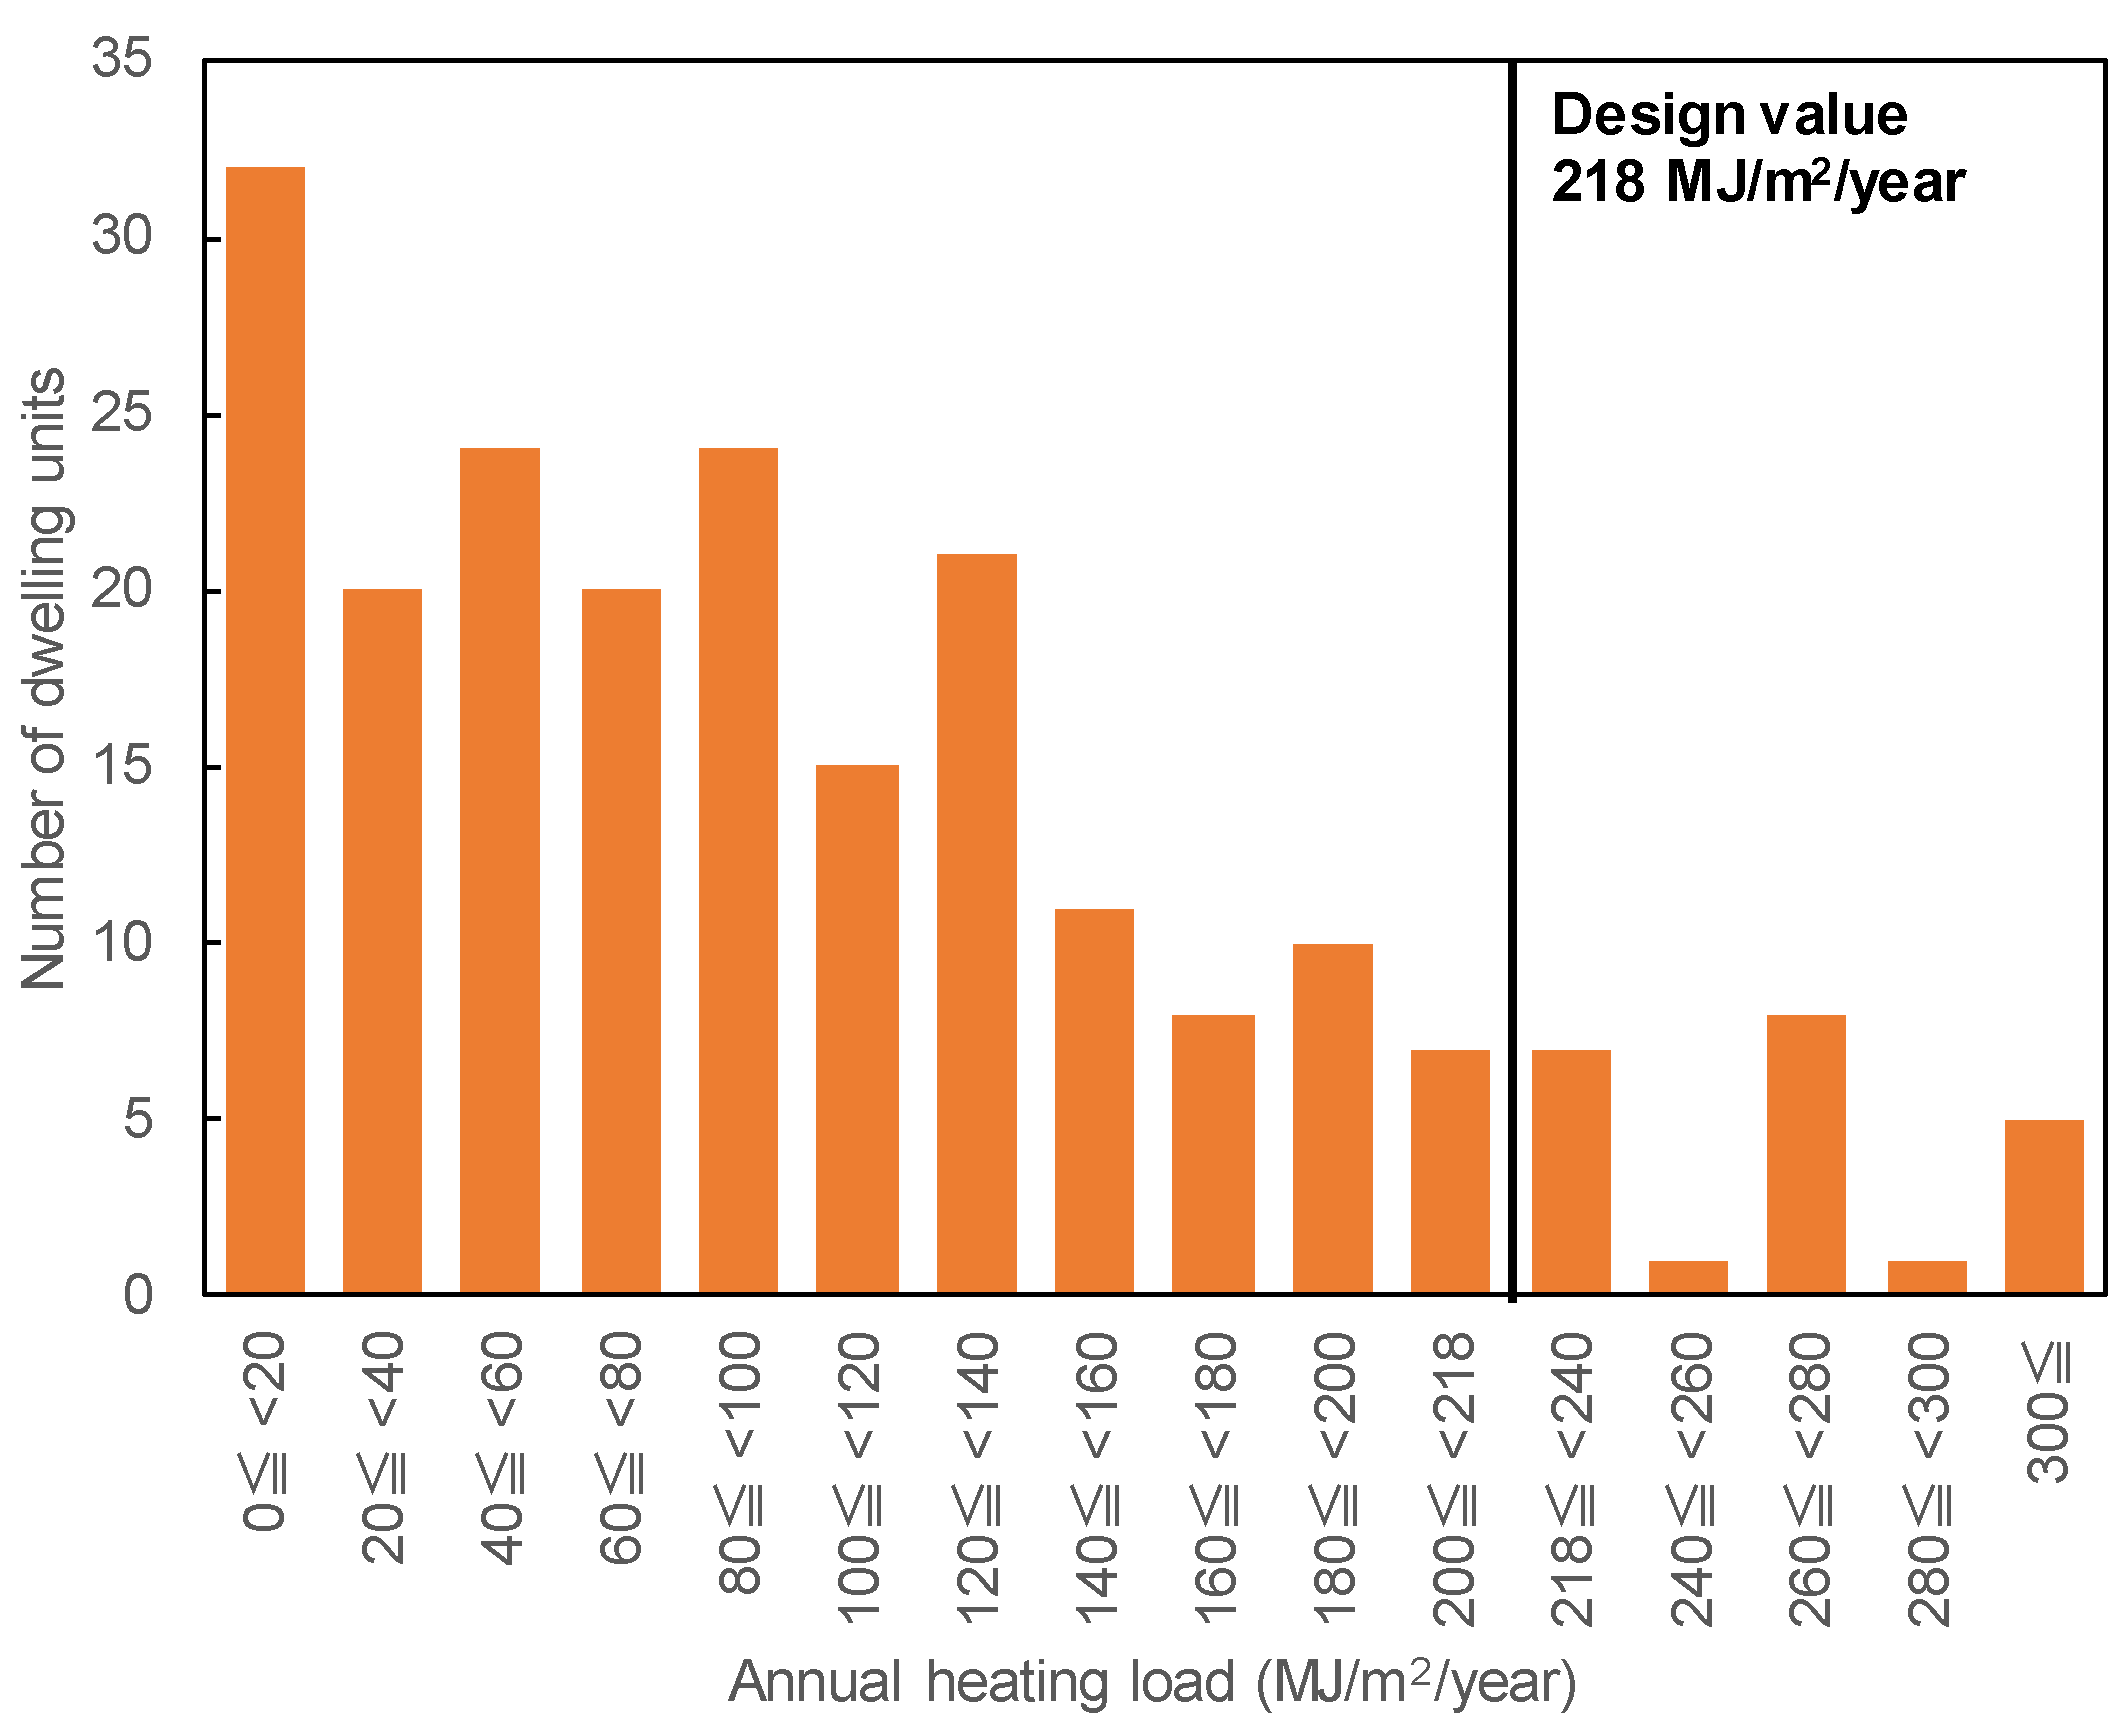
3.2.1. Each Dwelling Unit

Figure 3 shows the frequency distribution of the annual heating load for each dwelling unit. Two hundred and fourteen dwelling units were analyzed based on the water flow rate of MEMS data. Only 22 dwelling units reached the design value of 218 MJ/m2/year or more, calculated by dividing the annual heating load of 4600 GJ/year during the planning stage by the floor area of 21,056.8 m2. The mean measured value for all dwelling units was 105 MJ/m2/year, so this was designed to exceed the actual load. As is the case with energy-performance gaps related to heating in apartment buildings [42,43,44], the issue of overdesign in this case, where actuals differ significantly from predictions and designs, also needs to be addressed.

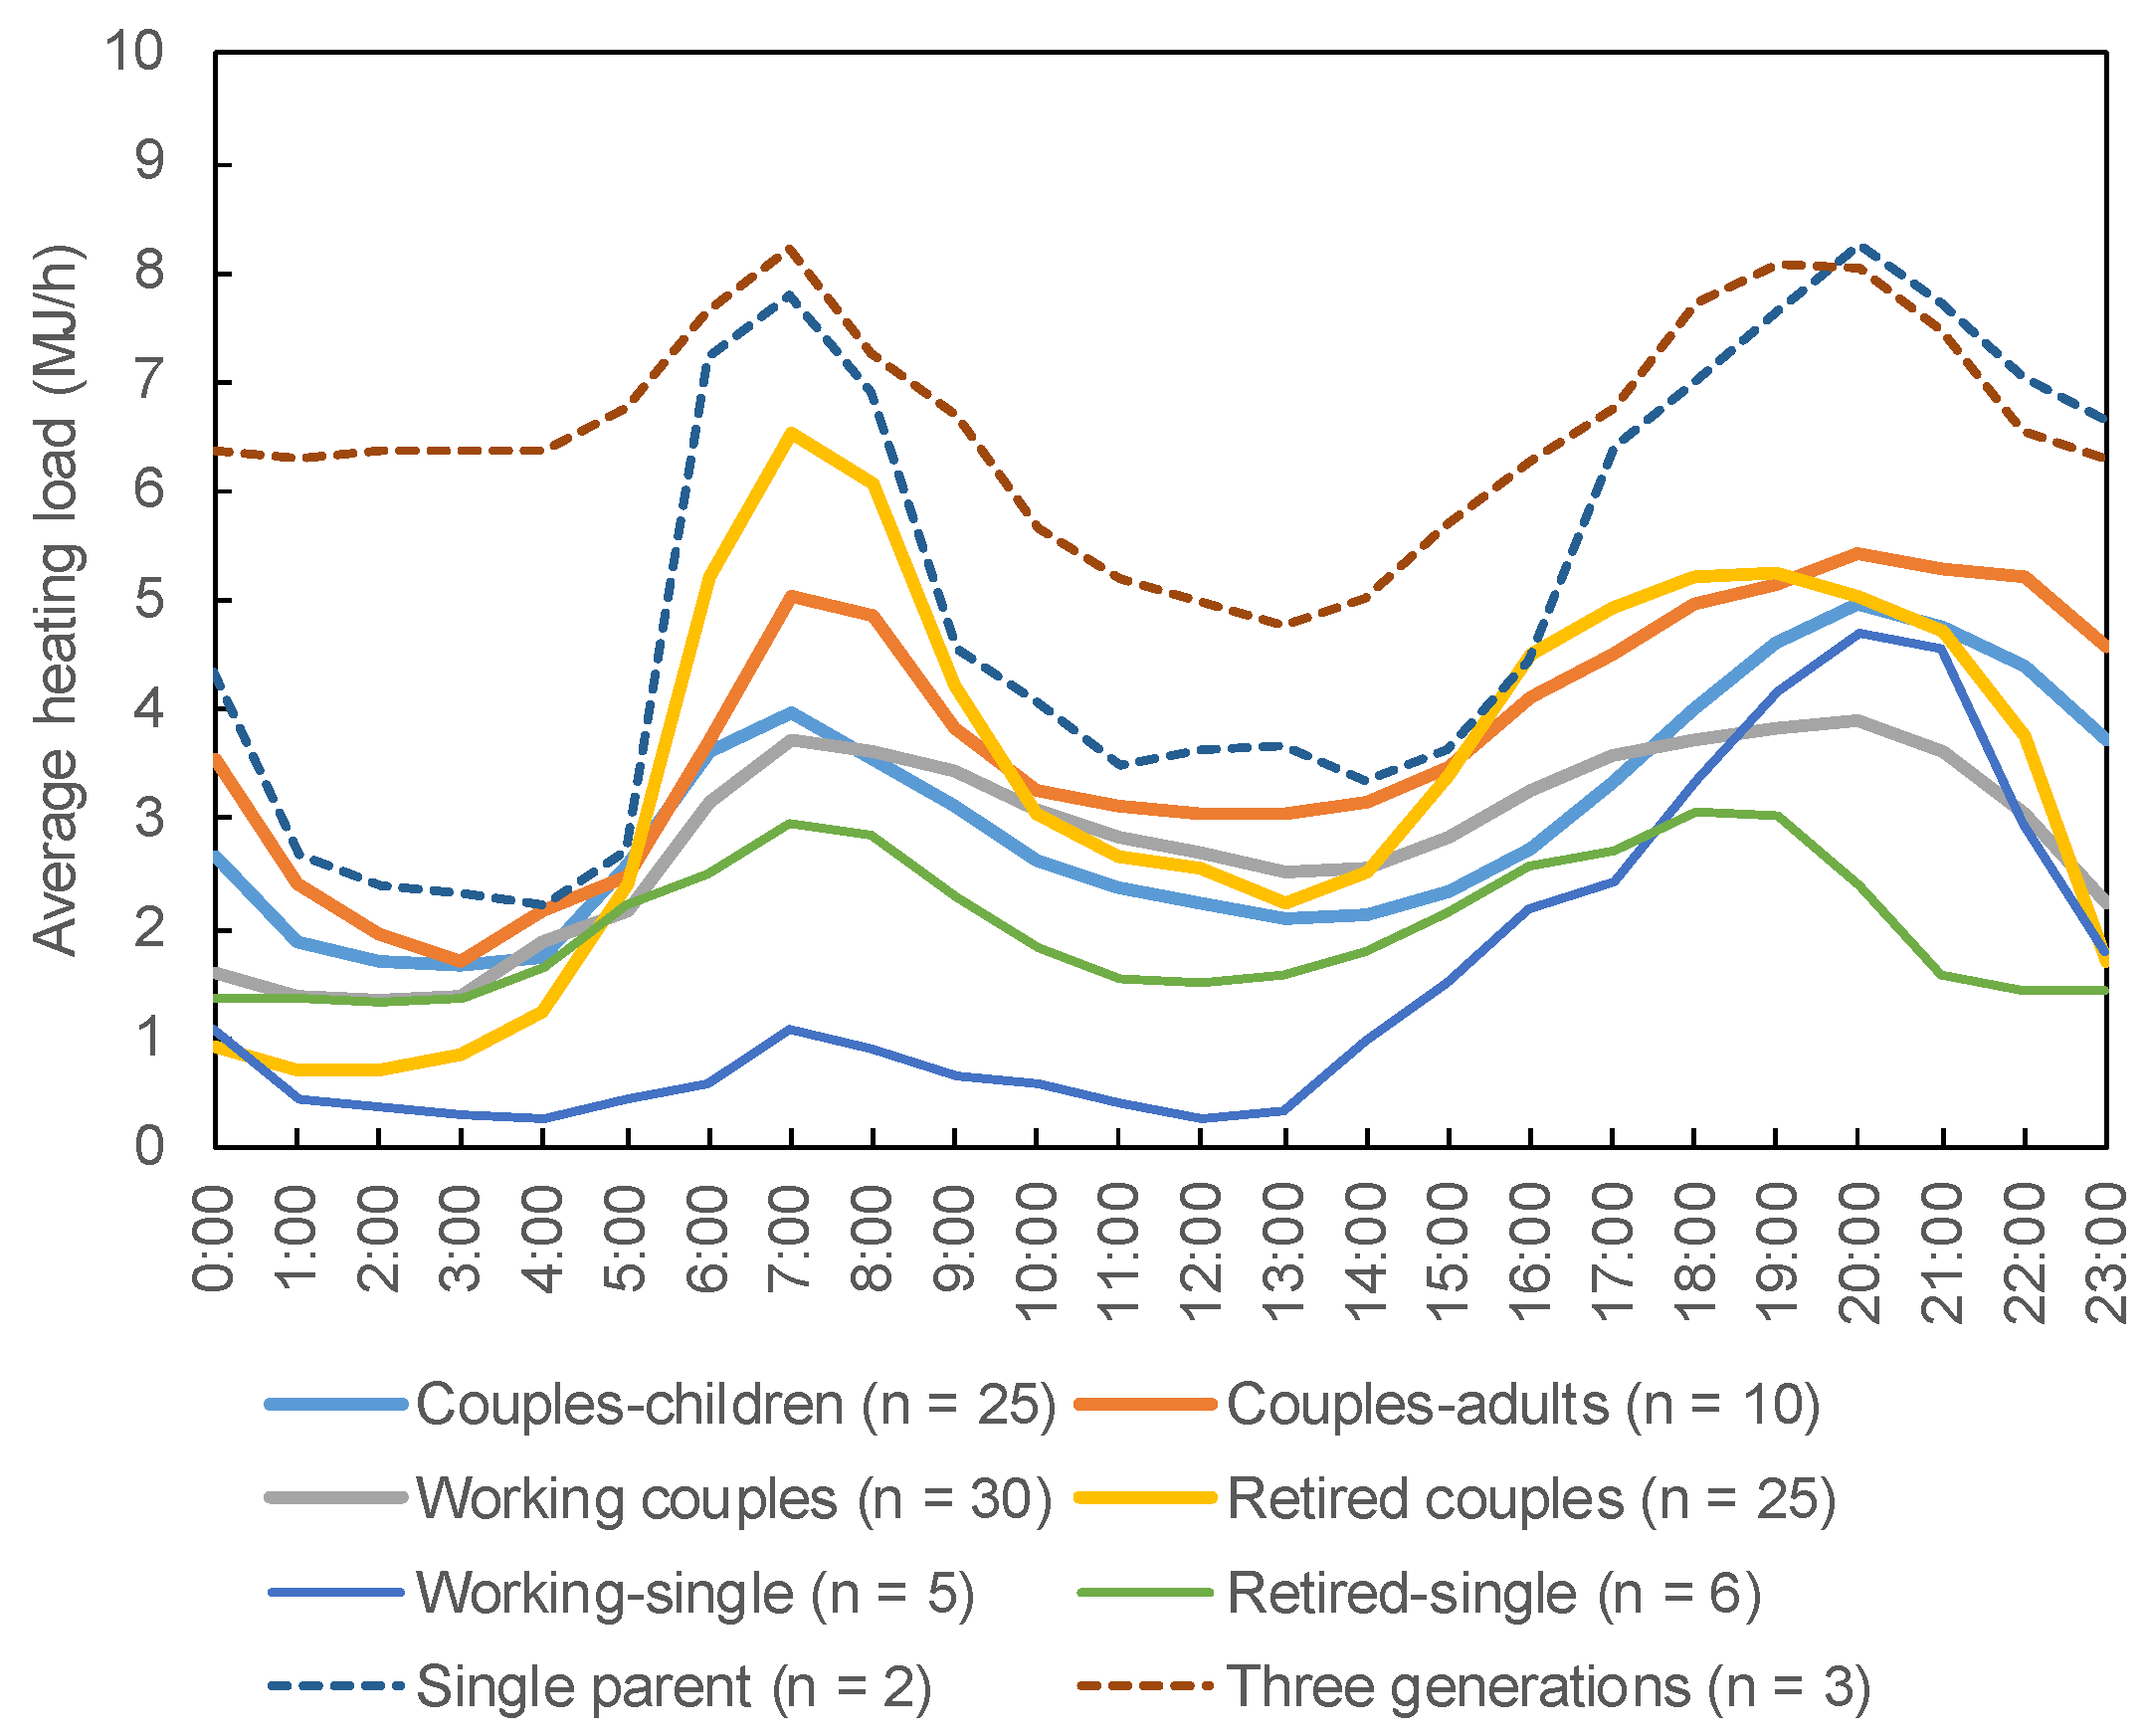
3.2.2. Each Household Composition

Figure 4 shows the heating periods for each household composition. The study determined the start and end dates of heating usage and compared the proportion of dwelling units that used heating for each household composition. Single parent and three generation households began using heating in all their units in mid-October and continued to use it until May. In comparison, working–single households tended to discontinue the heating devices earlier and start using them later than other households.
Figure 5 shows the average heating load for each time in January 2019. Many dwelling units for working–single households did not require heating from the morning until midday. Working households, including working couples and working singletons, had a peak in heating usage about an hour later than retired households, which included retired couples and retired singletons. Third generation households had a heavy load between midnight and 5 a.m., and heating was used continuously throughout the day.

3.2.3. Simultaneous Usage Ratio

Figure 6 shows the heating peak load for all dwelling units in each month. The heating load for each dwelling unit was aggregated by time of day, corresponding to Figure 5, and the maximum value was taken as the peak heating load for all dwelling units. The heating load has a significant seasonal variation, reaching 1457 MJ/h in January. Assuming the load that would occur if each dwelling unit peaked simultaneously, it would be 2878 MJ/h for 214 dwelling units in the subject building. The simultaneous usage ratio of heating based on Figure 6 and Equation (1) was calculated, and it was found to be 50.6% (=1457/2878 × 100%).
Based on the above, the heating load characteristics for each dwelling unit and each household composition were analyzed, and the actual situation of heating peak load was determined. In the future, it is important for the excessive design to be suppressed and the appropriate heat source equipment capacity to be selected [45]. For this purpose, it is necessary to accurately estimate the building load while considering the simultaneous usage ratio to some extent. In other words, it is vital to conduct an analysis that is as close as possible to actual occupant behavior through the use of monitoring [46] and the application of actual data [47] in the face of uncertainty. Therefore, to analyze this expected ratio when the number of dwelling units and household compositions are changing, the method of creating the curve of the ratio will be explained using existing MEMS data and the questionnaire survey results.

3.3. Curve of Simultaneous Usage Ratio

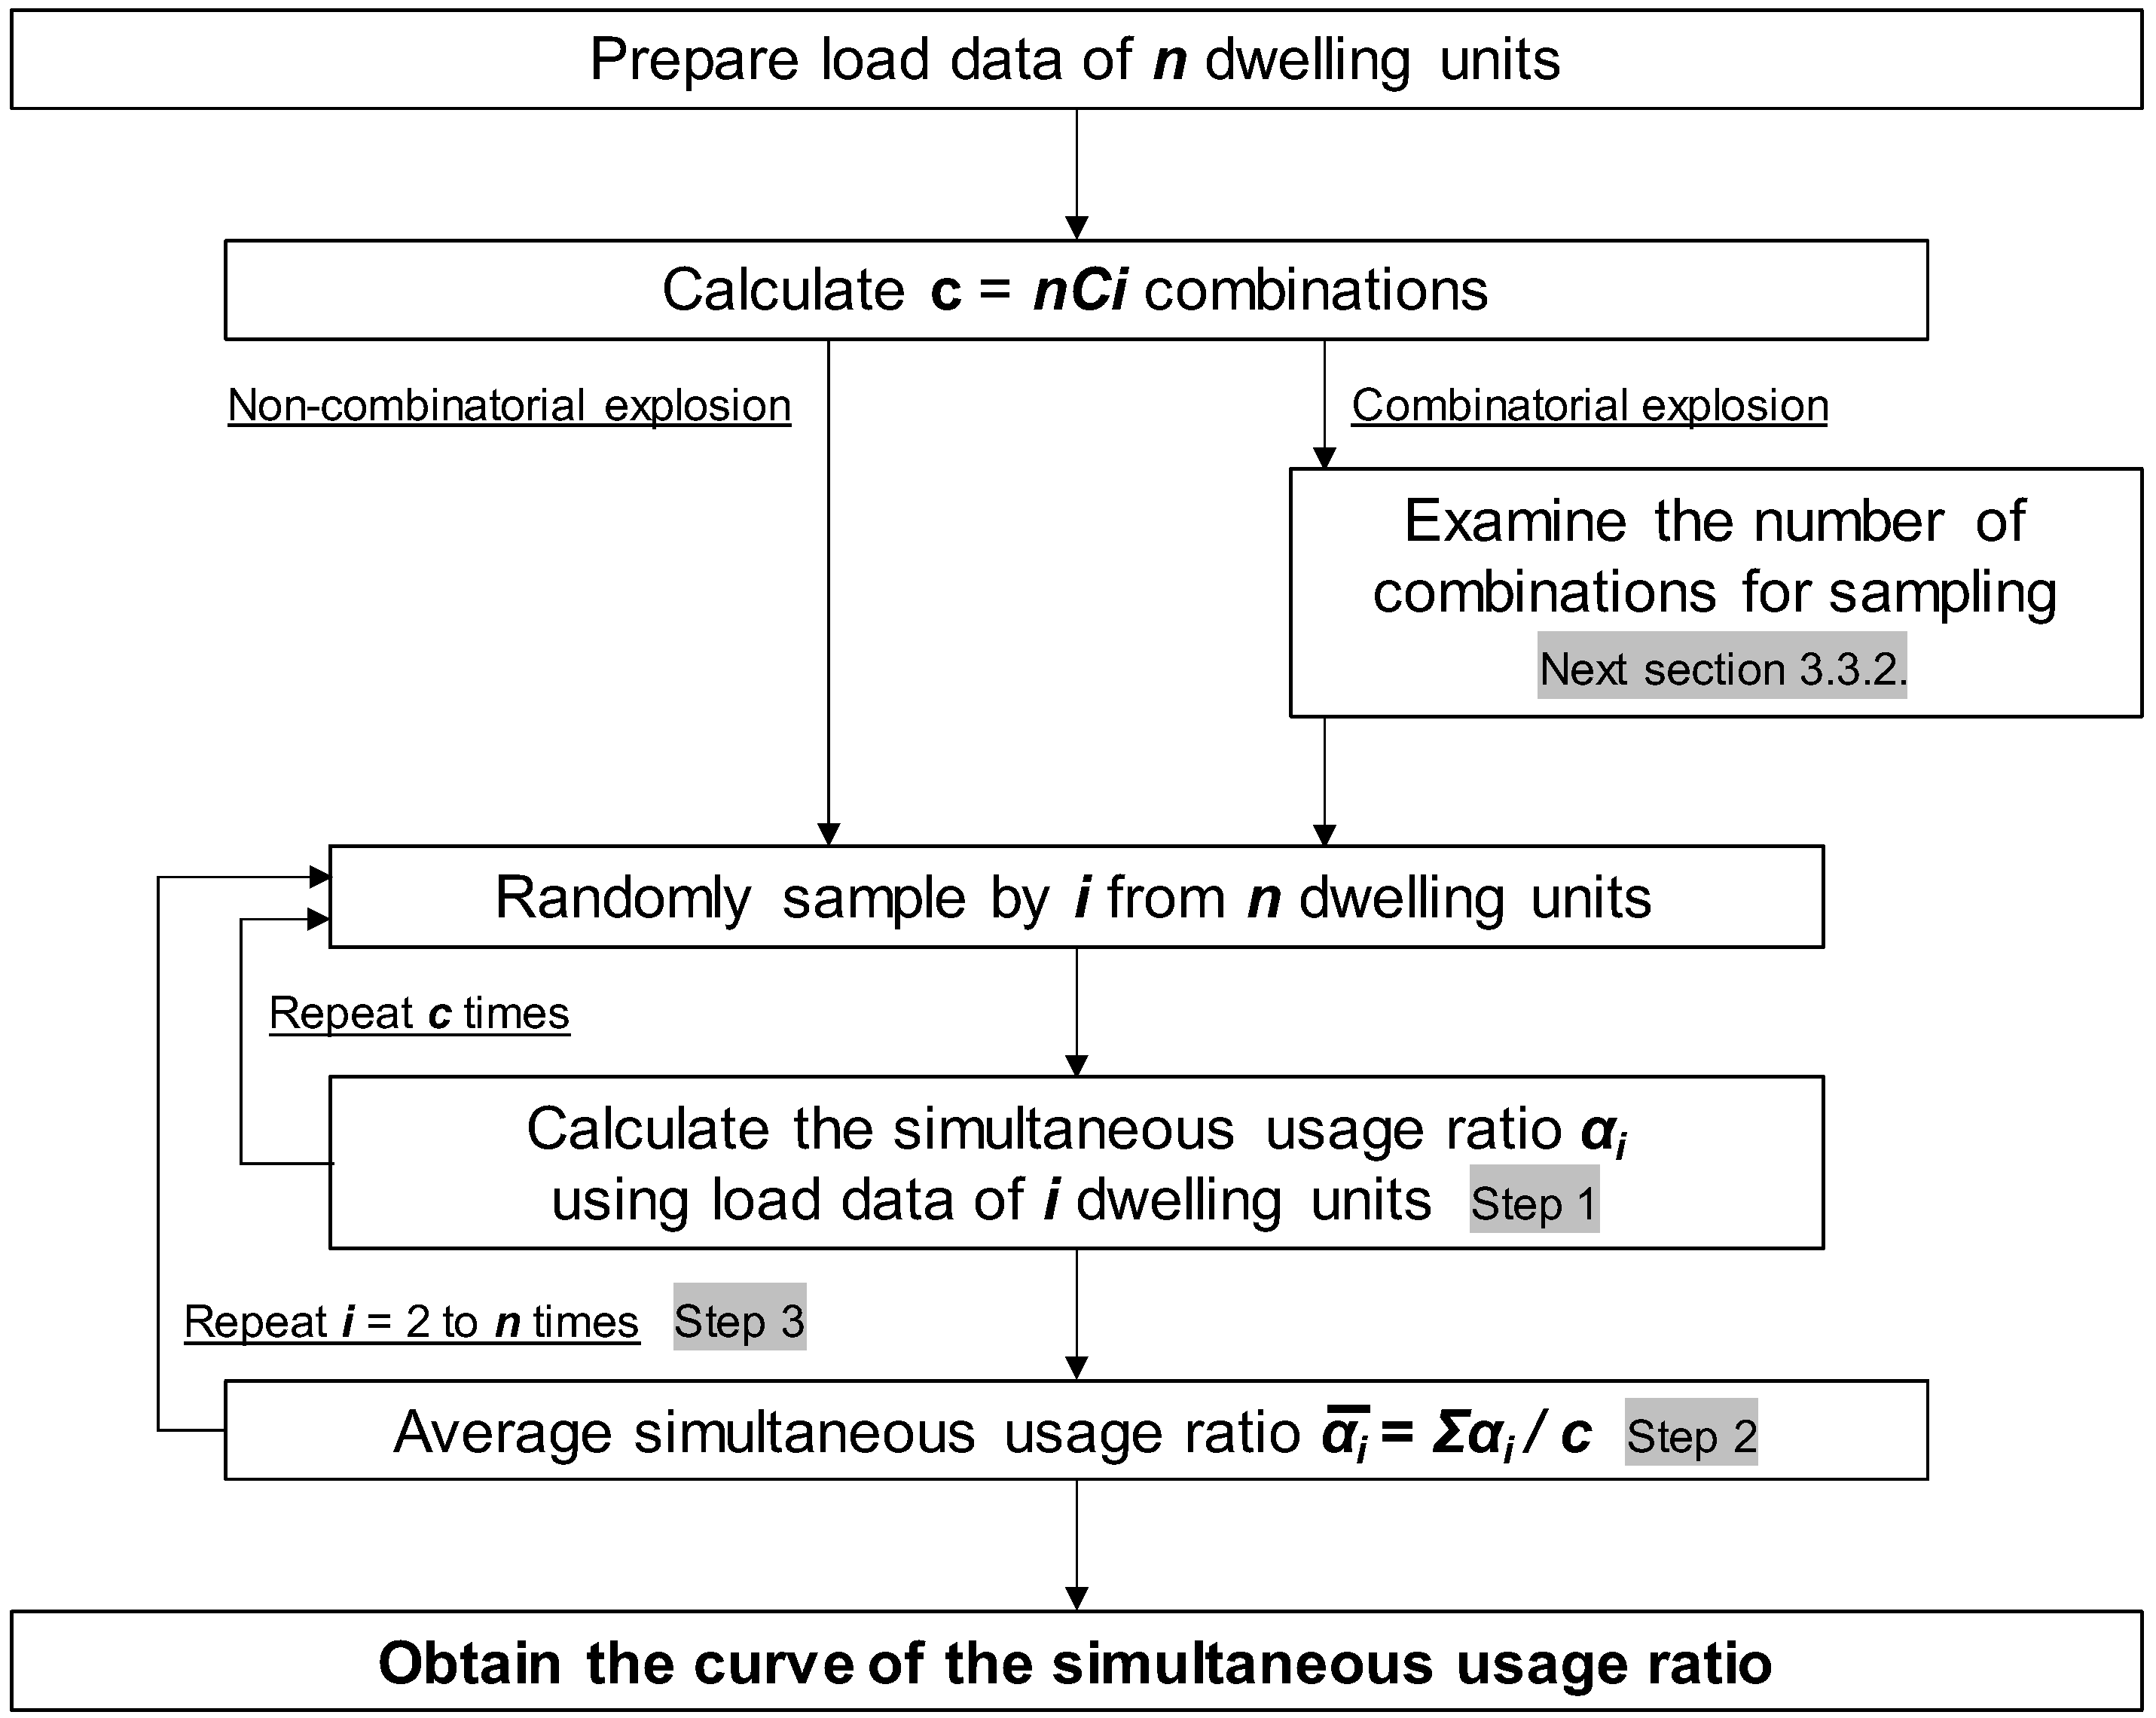
3.3.1. Method of Creating

The curve of the simultaneous usage ratio illustrates how the ratio changes as the number of dwelling units increases. This is calculated by combining the dwelling units from the load data of multiple dwelling units. To calculate the curve of the ratio based on load data of n dwelling units, the following steps are followed:
Step 1.
Use Equation (1) to calculate the simultaneous usage ratio for nCi combinations, which mean the total number of combinations of i dwelling units sampled from n dwelling units.
Step 2.
Plot the average value of this calculated ratio for nCi combinations as the ratio for i dwelling units.
Step 1.
Repeat the above calculations for i = 2 to n dwelling units.
However, when determining the curve of the simultaneous usage ratio, a combinatorial explosion occurs as the load data increases. In this case, calculating the ratio for all combinations becomes nearly impossible. To calculate the ratio in large-scale apartment buildings, a method for creating the curve of the ratio that avoids a combinatorial explosion is necessary. Therefore, to create the curve of the ratio with fewer calculations, a method of random sampling by c (natural number) combinations instead of nCi combinations is suggested.
Based on the above explanation, Figure 7 shows a flowchart for creating the curve of the simultaneous usage ratio.

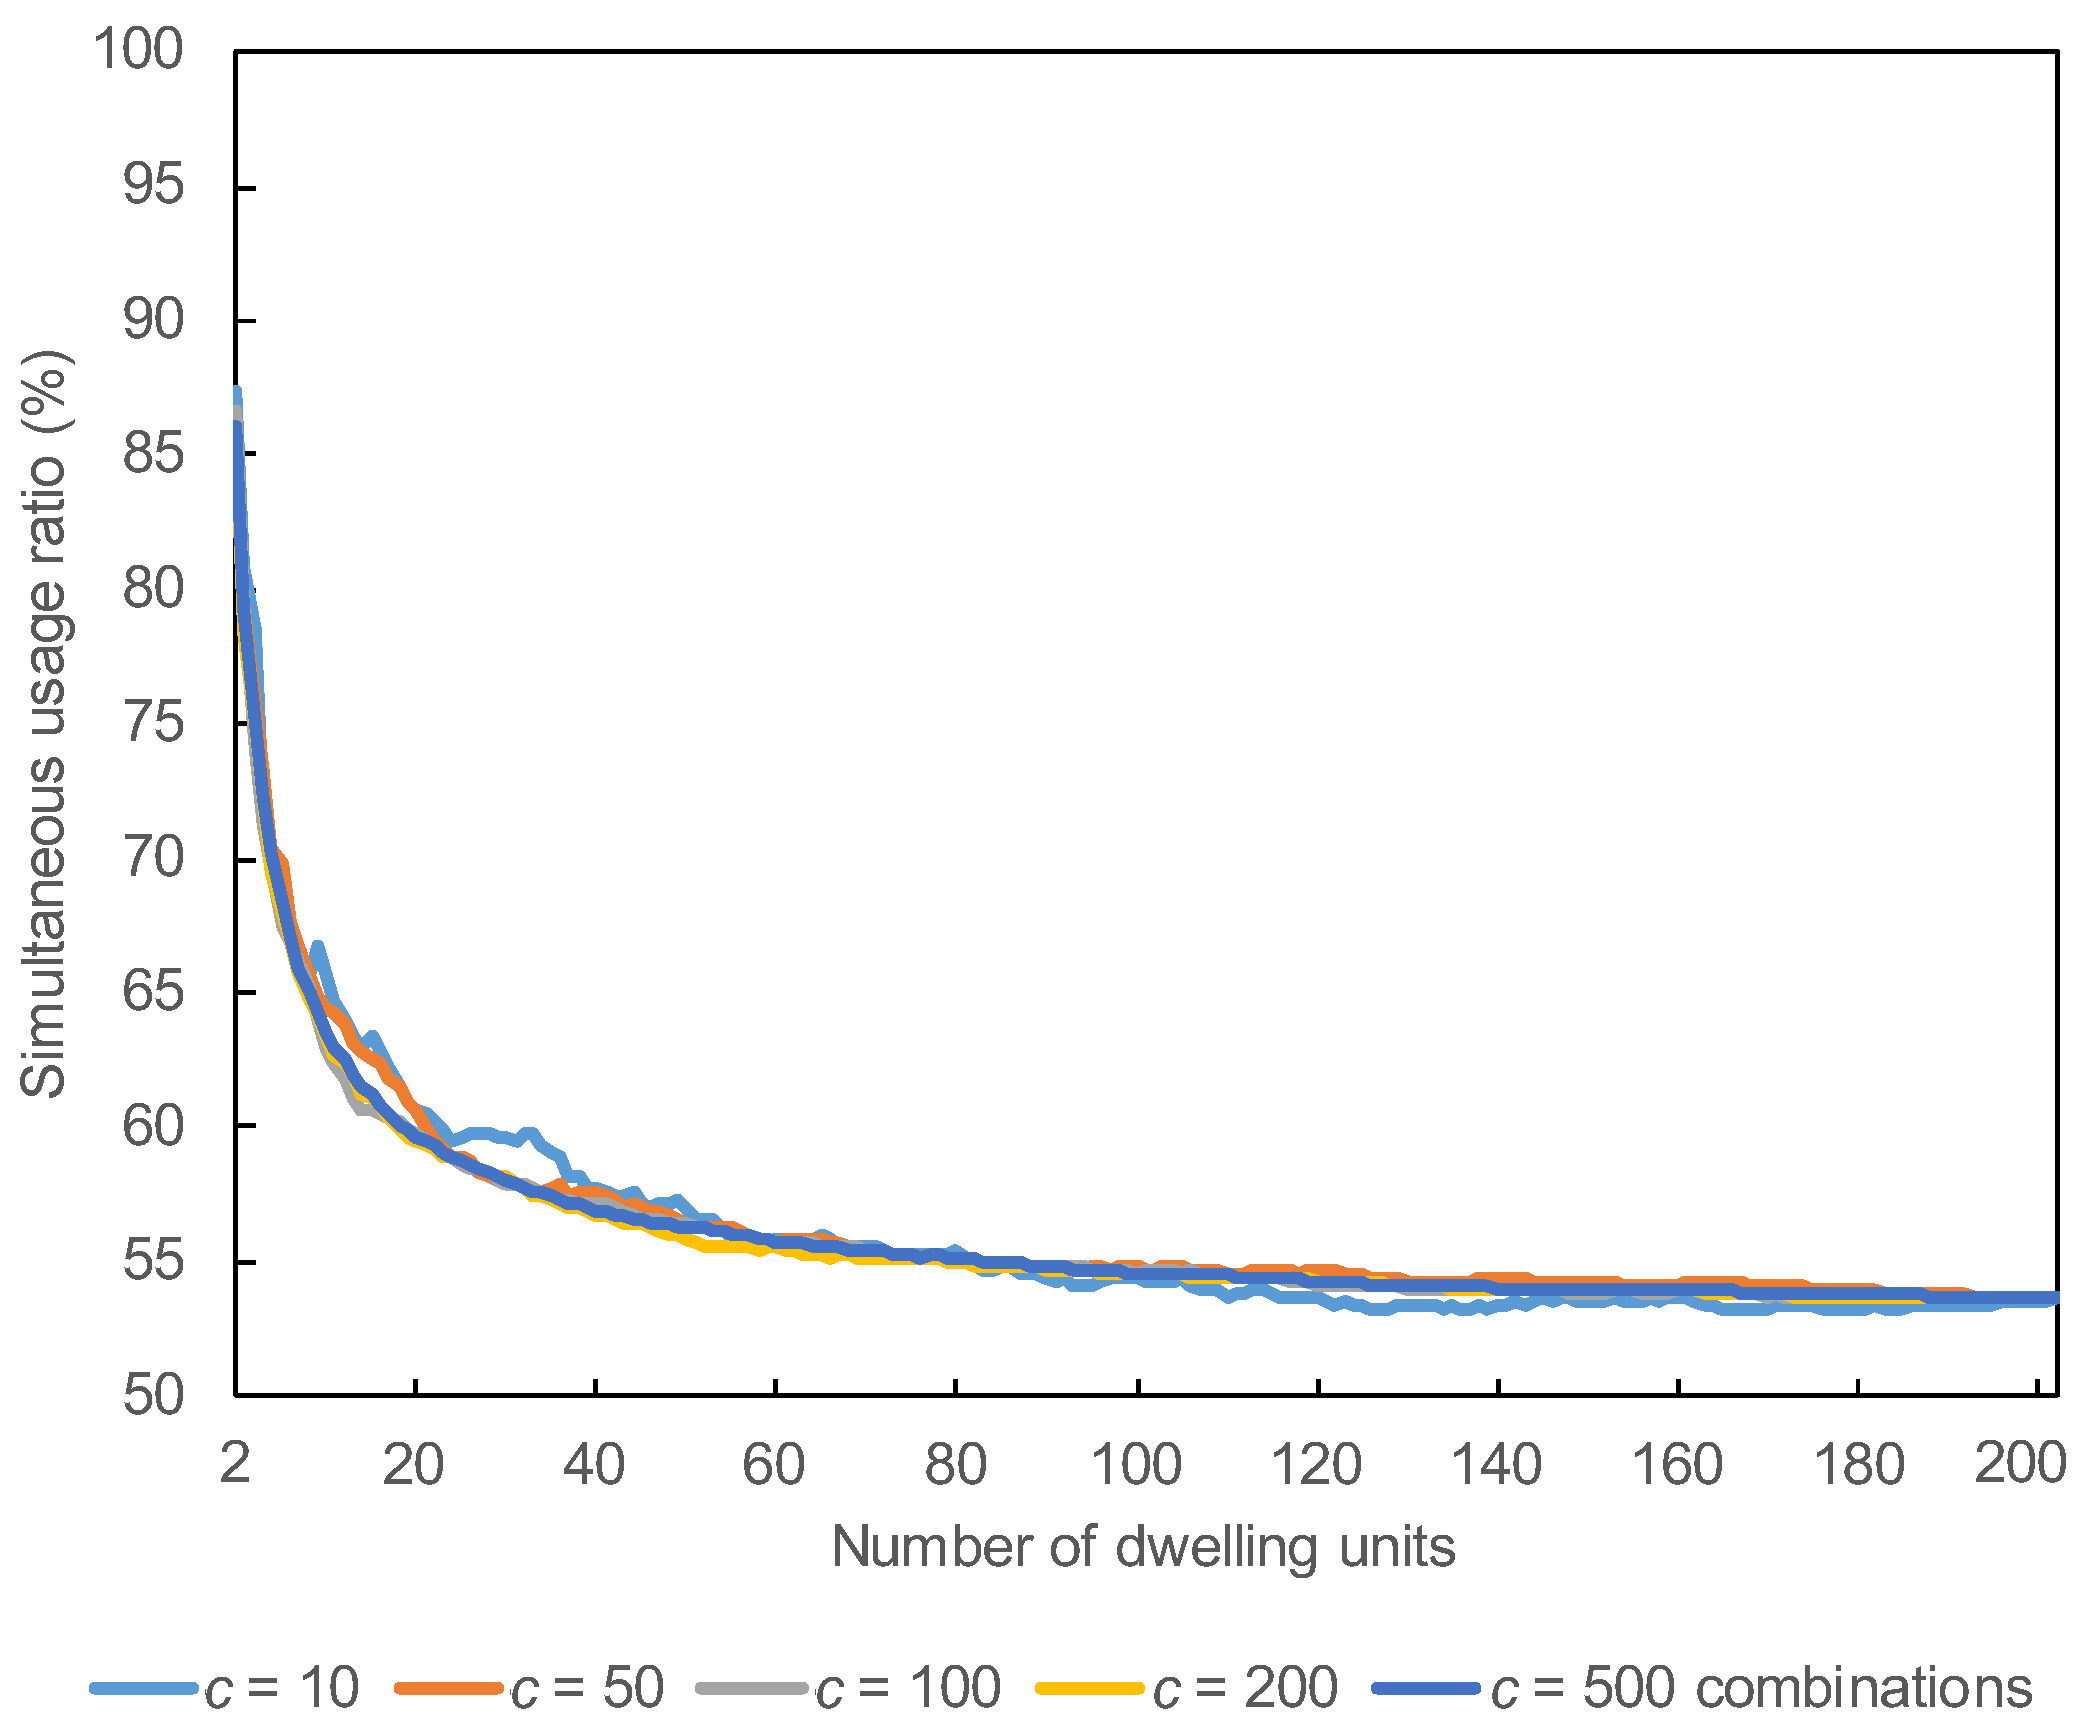
3.3.2. Examination the Number of Combinations for Sampling

To create the curve of the simultaneous usage ratio, the heating load data for 15 days, which included the week before and after the coldest day in 2018, were utilized. During this period, based on the water flow rate of MEMS data, it was determined that dwelling units without any water usage were unoccupied. Load data from 204 dwelling units were used for calculations.
Figure 8 shows the curve of the simultaneous usage ratio for random sampling by c = 10, 50, 100, 200, and 500 combinations. Although the trends of each curve are somewhat similar, there is a concern that errors in the simultaneous usage ratio may occur due to random sampling. Table 3 lists the root mean square error (RMSE) based on the curve of the ratio for c = 500 combinations to evaluate the error. As the number of combinations increased, RMSE approached zero and decreased significantly up to c = 100 combinations. However, no significant change in value was observed even when calculating up to c = 200 combinations. Therefore, it was concluded that c = 100 combinations would be sufficient to create the curve of the ratio with fewer calculations.

3.4. Evaluation of the Simultaneous Usage Ratio

Figure 9 shows the curves of the simultaneous usage ratio and standard deviation for c = 100 combinations. For each point, the upper end of the vertical line represents the mean value of c = 100 combinations’ calculation results plus the standard deviation, while the lower end represents the mean value minus the standard deviation. If only two residential units were used as the load data of 204 dwelling units, the simultaneous usage ratio would be as high as 87.0%. However, as the number of dwelling units increased, the ratio decreased exponentially, and when 204 dwelling units were sampled, the ratio was 53.6%. This ratio was roughly in line with the subject building’s 50.6%.
From the curve of the simultaneous use ratio in Figure 8, it can be also inferred that, for instance, when designing an apartment building with 80 dwelling units, the ratio of 55.1 ± 2.3% is a reasonable guideline, given the Japanese custom of intermittent heating.
Figure 10 shows the rate of change in the simultaneous usage ratio for c = 100 combinations. The rate of change from two to three dwelling units was 7.2%. The rate of change approached 0% when the number of dwelling units exceeded 30 and then leveled off. This suggested that as the number of dwelling units in an apartment building increases, the simultaneous usage ratio decreases and generally stabilizes when the number of dwelling units exceeds 30. However, as shown in Figure 8, since the significant standard deviation was 4.3% for 30 dwelling units, it is necessary to consider the variation in the household composition of those living there. Therefore, to analyze the influence of occupant behavior according to household composition on the simultaneous usage ratio, the suggested method of creating the curve of the ratio will be used.

3.5. Case Study of the Simultaneous Usage Ratio

As a case study, the influence of changes in household composition on the simultaneous usage ratio was analyzed. Table 4 lists the cases of household composition. Case 1 illustrates the transition from couples and children to only couples as their children become independent over time. Case 2 also illustrates the transition from working couples to retired couples as they retire over time. Judging from the standard floor plans and sizes of current apartment buildings, it is not often that there will be a transition from couples and children to three generations. Furthermore, the National Institute of Population and Social Security Research [48] released estimates showing that the average household number will become 1.99 in 2033 compared with 2.21 in 2020. The percentage of single-person households will also rise to 44.3% in 2050 from 38% in 2020. From these, the two case studies reflect changes in the general household composition in Japan.
Figure 11 shows the curves of the simultaneous usage ratio for Cases 1 and 2. As only couples in Case 1 and retired couples in Case 2 increased, the simultaneous usage ratio increased. On the other hand, when comparing the ratio of 30 dwelling units, the difference in the ratio was 6.2% (=61.8% − 55.6%) in Case 1 and 15.0% (=67.4% − 52.4%) in Case 2 over time. By preparing a database of the load characteristics of each household composition, it is possible to incorporate a simultaneous usage ratio into a design in advance. This will lead to the selection of the appropriate heat source equipment capacity during new construction or renovation. Changes in household composition were divided into four steps.

4. Discussion

The initial phase of this study on simultaneous usage ratios presented the methodology and a case study that focused primarily on occupant behavior. This study defines the ratio as a peak load-based approach rather than simultaneity based on the number of people using the system. When calculating the ratio, the data period analyzed is typically shorter for heating, which is highly seasonally dependent, than for hot-water supply. The presented case studies (Figure 9 and Figure 11) confirm this trend by evaluating the ratio with 15 days of data, including one week before and after the coldest day.
However, the ratio to be adopted during the design phase requires each designer to determine the period of data to be analyzed based on the load data characteristics. For instance, if previous actual data are available during facility renovation, each designer can determine the period of data to be analyzed and consider the ratio referring to the methodology. On the other hand, the heating peak load is dependent on diversity factors, including building characteristics such as thermal insulation and air tightness, external factors such as outside air temperature and solar radiation, and internal factors such as household composition and cultural practices related to heating. Therefore, if previous actual data are not available during building renovation or new construction, it is necessary to perform simulations to create load data for the number of dwelling units according to design conditions. Based on the above, it should be understood and referenced that the case study presented in this study is one of the results that strongly reflects the Japanese custom of intermittent heating.
From the aforementioned results and analysis, it is important to utilize actual data in the design stage. The design that anticipates the simultaneous usage ratio will not only enable the heat source equipment capacity to be downsized, but will also likely lead to further energy savings in relation to [2], which claims that it is an opportunity to review piping and pump designs. Furthermore, the ratio is closely related to energy-saving behavior. Consequently, this study aligns with [39,40], which emphasize the importance of internal factors in indoor environmental quality and energy consumption in terms of the necessity for designs based on occupant behavior.

5. Conclusions

In this study, the simultaneous usage ratio based on occupant behavior, mainly for heating in an apartment building, was investigated as a case study. The findings obtained are as follows:
  • An analysis of the heating load characteristics for each dwelling unit showed that the design value was 218 MJ/m2/year. In contrast, the mean measured value for all dwelling units was 105 MJ/m2/year, indicating that the design had exceeded the actual load. Furthermore, upon analyzing the heating load characteristics of each household composition, it was clarified that the heating peak load and appearance percentage of peak varied significantly depending on the household composition.
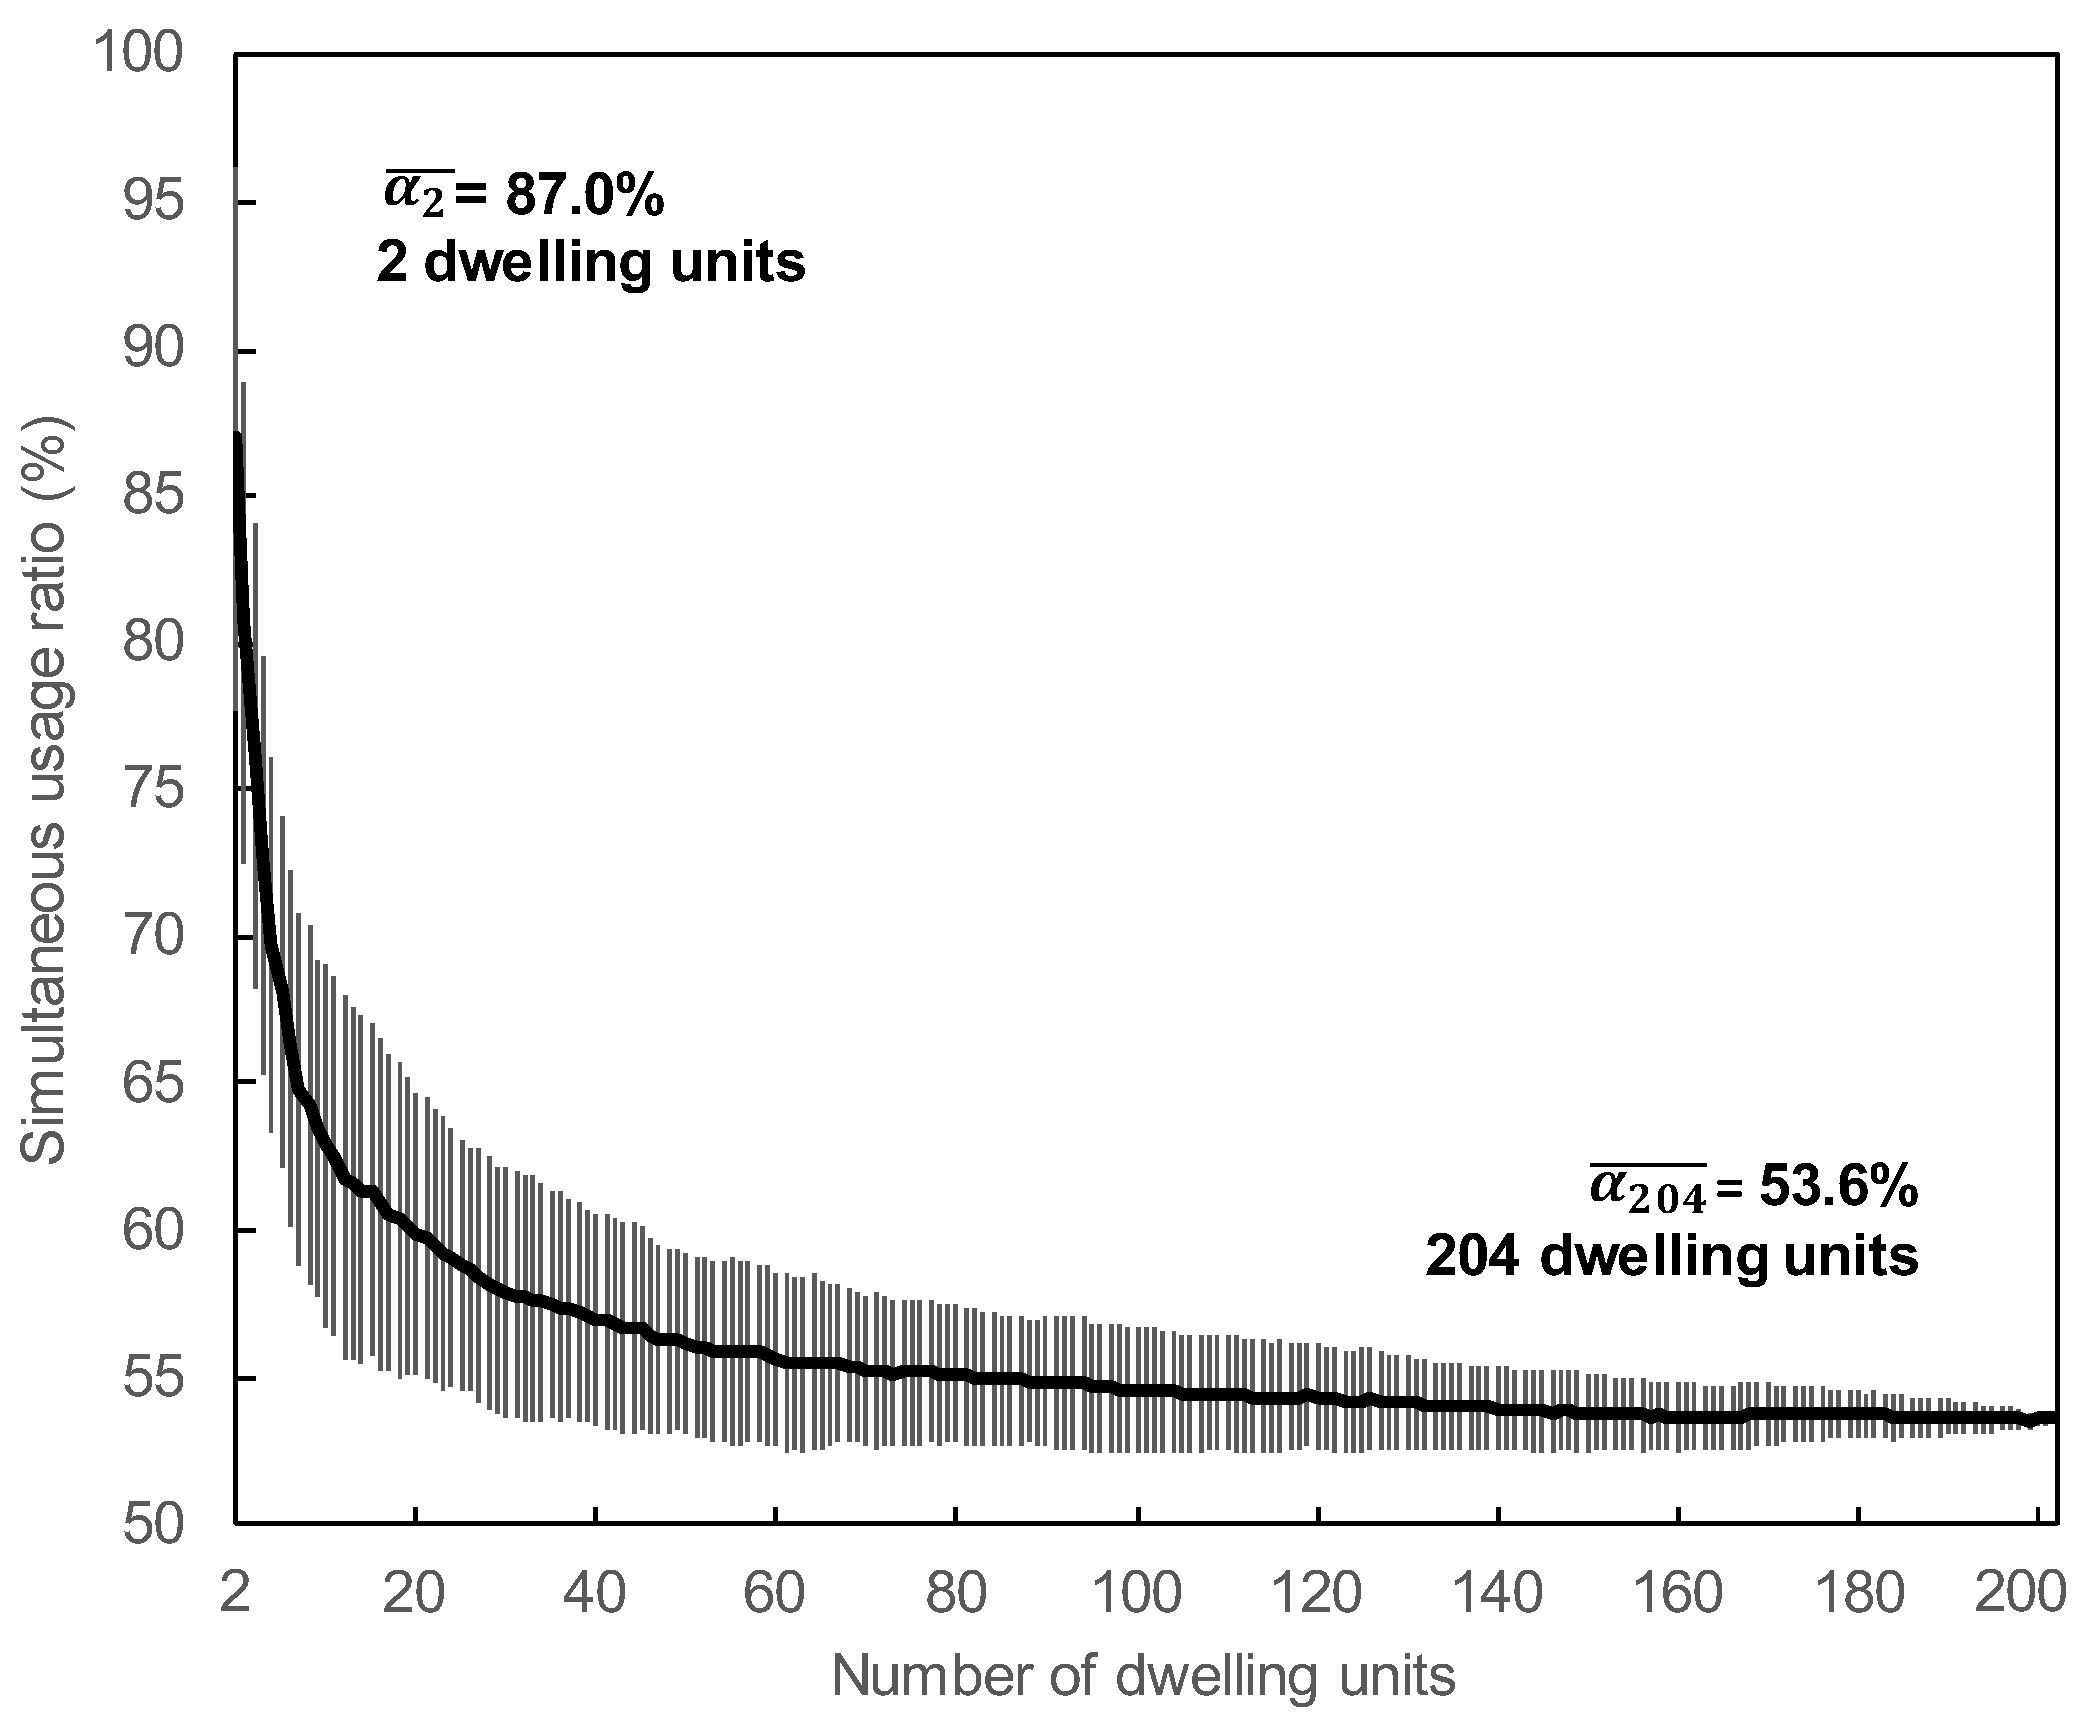
  • A method for creating the curve of the simultaneous usage ratio was suggested, and it was confirmed that random sampling using c = 100 combinations had sufficient precision to avoid a combinatorial explosion. It was also found that the simultaneous usage ratio was 53.6% and generally stabilized when the number of dwelling units exceeded 30 based on the curve of the ratio created for 204 dwelling units.
  • It was revealed that the simultaneous usage ratio tended to increase within the range of approximately 50 to 70% over time and through the analysis of the influence of changes in household composition on the ratio.
Finally, this case study provides a methodology for statistically quantifying the simultaneous usage ratio as one of the factors in determining the appropriate heat source equipment capacity in the design stage. If the method proposed in this study for creating the curve of the simultaneous usage ratio were to be applied to non-residential buildings such as offices, new results about the curves of the ratios that differ from those of apartment buildings could be obtained. In the future, by accumulating load data for each region and building use according to the actual projects, it will be helpful and useful to optimize the heat source equipment capacity by considering the ratio more than ever before in the design stage. It is also important for designers to reconsider the appropriate heat source equipment capacity, including potentially downsizing, when planning ZEH and ZEB to achieve 2050 carbon neutrality in Japan.

Author Contributions

Conceptualization, K.K. and Y.A.; validation, K.K. and Y.A.; formal analysis, K.K. and Y.A.; investigation, K.K. and Y.A.; writing—original draft preparation, K.K.; writing—review and editing, K.K. and Y.A.; funding acquisition, Y.A. All authors have read and agreed to the published version of the manuscript.

Funding

This work was supported by JSPS KAKENHI Grant Number JP19K04745 and JP22K04445.

Data Availability Statement

The data used to support the findings of this study are available from the corresponding authors upon request.

Acknowledgments

The authors would like to thank the apartment residents who cooperated with the survey and Sota Tamamura who cooperated with the analysis.

Conflicts of Interest

The authors declare no conflicts of interest.

References

  1. Ministry of Economy, Trade and Industry. The Sixth Strategic Energy Plan. 21 October 2021. Available online: https://www.enecho.meti.go.jp/category/others/basic_plan/pdf/strategic_energy_plan.pdf (accessed on 15 May 2024). (In Japanese).
  2. Kim, H.; Park, K.S.; Cho, S.; Song, Y.H. A Study on Utility of Retrofit that Minimizes the Replacement of Heat-Source System in Large Offices. Energies 2019, 12, 4309. [Google Scholar] [CrossRef]
  3. Wang, Y.H.; Zou, Z.H.; Lu, K.; Li, Q.; Hu, P.F.; Wang, D. Modeling for on-line monitoring of carbon burnout coefficient in boiler under partial load. Energy 2024, 288, 129859. [Google Scholar] [CrossRef]
  4. Wu, C.L.; Li, X.F.; Wang, Z.C.; Xu, Z.W.; Xu, C.; Yang, Y.X. Optimizing the selection and combined operation of multiple air-source heat pumps for sustainable heating systems. Energy Build. 2024, 310, 114052. [Google Scholar] [CrossRef]
  5. Nair, G.; Gustavsson, L.; Mahapatra, K. Factors influencing energy efficiency investments in existing Swedish residential buildings. Energy Policy 2010, 38, 2956–2963. [Google Scholar] [CrossRef]
  6. Suh, D.; Chang, S. A Heuristic Rule-Based Passive Design Decision Model for Reducing Heating Energy Consumption of Korean Apartment Buildings. Energies 2014, 7, 6897–6929. [Google Scholar] [CrossRef]
  7. Ling, J.H.; Li, Q.; Xing, J.C. The influence of apartment location on household space heating consumption in multi-apartment buildings. Energy Build. 2015, 103, 185–197. [Google Scholar] [CrossRef]
  8. Danielski, I.; Nair, G.; Joelsson, A.; Fröling, M. Heated atrium in multi-storey apartment buildings, a design with potential to enhance energy efficiency and to facilitate social interactions. Build. Environ. 2016, 106, 352–364. [Google Scholar] [CrossRef]
  9. Belazi, W.; Ouldboukhitine, S.E.; Chateauneuf, A.; Bouchair, A. Thermal modeling of the occupied multi-zone buildings taking into account the uncertainties of occupant behavior. C-CORE Publ. 2022, 33, 101978. [Google Scholar] [CrossRef]
  10. Fajilla, G.; Borri, E.; De Simone, M.; Cabeza, L.F.; Braganca, L. Effect of Climate Change and Occupant Behaviour on the Environmental Impact of the Heating and Cooling Systems of a Real Apartment. A Parametric Study through Life Cycle Assessment. Energies 2021, 14, 8356. [Google Scholar] [CrossRef]
  11. Qi, X.Y.; Zhang, Y.; Jin, Z.E. Building Energy Efficiency for Indoor Heating Temperature Set-Point: Mechanism and Case Study of Mid-Rise Apartment. Buildings 2023, 13, 1189. [Google Scholar] [CrossRef]
  12. Seo, R.S.; Jung, G.J.; Rhee, K.N. Impact of green retrofits on heating energy consumption of apartment buildings based on nationwide energy database in South Korea. Energy Build. 2023, 292, 113142. [Google Scholar] [CrossRef]
  13. Andersen, S.; Andersen, R.K.; Olesen, B.W. Influence of heat cost allocation on occupants’ control of indoor environment in 56 apartments: Studied with measurements, interviews and questionnaires. Build. Environ. 2016, 101, 1–8. [Google Scholar] [CrossRef]
  14. Michnikowski, P. Allocation of heating costs with consideration to energy transfer from adjacent apartments. Energy Build. 2017, 139, 224–231. [Google Scholar] [CrossRef]
  15. Siggelsten, S. Heat cost allocation in energy efficient multi-apartment buildings. Cogent Eng. 2018, 5, 1438728. [Google Scholar] [CrossRef]
  16. Santin, O.G.; Itard, L.; Visscher, H. The effect of occupancy and building characteristics on energy use for space and water heating in Dutch residential stock. Energy Build. 2009, 41, 1223–1232. [Google Scholar] [CrossRef]
  17. Kyro, R.; Heinonen, J.; Saynajoki, A.; Junnila, S. Occupants have little influence on the overall energy consumption in district heated apartment buildings. Energy Build. 2011, 43, 3484–3490. [Google Scholar] [CrossRef]
  18. Kim, M.J.; Cho, M.E.; Kim, J.T. Energy use of households in apartment complexes with different service life. Energy Build. 2013, 66, 591–598. [Google Scholar] [CrossRef]
  19. Engvall, K.; Lampa, E.; Levin, P.; Wickman, P.; Ofverholmd, E. Interaction between building design, management, household and individual factors in relation to energy use for space heating in apartment buildings. Energy Build. 2014, 81, 457–465. [Google Scholar] [CrossRef]
  20. Fransson, V.; Bagge, H.; Johansson, D. Impact of variations in residential use of household electricity on the energy and power demand for space heating—Variations from measurements in 1000 apartments. Appl. Energy 2019, 254, 113599. [Google Scholar] [CrossRef]
  21. Haines, V.; Kyriakopoulou, K.; Lawton, C. End user engagement with domestic hot water heating systems: Design implications for future thermal storage technologies. Energy Res. Soc. Sci. 2019, 49, 74–81. [Google Scholar] [CrossRef]
  22. Moeller, S.; Weber, I.; Schröder, F.; Bauer, A.; Harter, H. Apartment related energy performance gap—How to address internal heat transfers in multi-apartment buildings. Energy Build. 2020, 215, 109887. [Google Scholar] [CrossRef]
  23. Lee, J.Y.; Yim, T. Energy and flow demand analysis of domestic hot water in an apartment complex using a smart meter. Energy 2021, 229, 120678. [Google Scholar] [CrossRef]
  24. Tran, L.N.; Gao, W.J.; Novianto, D.; Ushifusa, Y.; Fukuda, H. Relationships between household characteristics and electricity end-use in Japanese residential apartments. Sustain. Cities Soc. 2021, 64, 102534. [Google Scholar] [CrossRef]
  25. Jang, H.J.; Kang, J. A stochastic model of integrating occupant behaviour into energy simulation with respect to actual energy consumption in high-rise apartment buildings. Energy Build. 2016, 121, 205–216. [Google Scholar] [CrossRef]
  26. Kim, D.D.; Suh, H.S. Heating and cooling energy consumption prediction model for high-rise apartment buildings considering design parameters. Energy Sustain. Dev. 2021, 61, 1–14. [Google Scholar] [CrossRef]
  27. Weissmann, C.; Hong, T.; Graubner, C.-A. Analysis of heating load diversity in German residential districts and implications for the application in district heating systems. Energy Build. 2017, 139, 302–313. [Google Scholar] [CrossRef]
  28. An, J.J.; Yan, D.; Hong, T.Z. Clustering and statistical analyses of air-conditioning intensity and use patterns in residential buildings. Energy Build. 2018, 174, 214–227. [Google Scholar] [CrossRef]
  29. Wang, Y.; Cooper, E.; Tahmasebi, F.; Chalabi, Z.; Stamp, S.; Burman, E.; Mumovic, D. A multilevel window state model based on outdoor environmental conditions that captures behavioural variation at room and apartment levels. Energy Build. 2022, 277, 112562. [Google Scholar] [CrossRef]
  30. Vogiatzi, C.; Gemenetzi, G.; Massou, L.; Poulopoulos, S.; Papaefthimiou, S.; Zervas, E. Energy use and saving in residential sector and occupant behavior: A case study in Athens. Energy Build. 2018, 181, 1–9. [Google Scholar] [CrossRef]
  31. He, Y.L.; Chen, Y.X.; Chen, Z.H.; Deng, Z.; Yuan, Y. Impacts of Occupant Behavior on Building Energy Consumption and Energy Savings Analysis of Upgrading ASHRAE 90.1 Energy Efficiency Standards. Buildings 2022, 12, 1108. [Google Scholar] [CrossRef]
  32. Xu, B.P.; Chen, Z.; Wang, X.; Jiang, P.H. Field tests to examine energy saving effects of occupants’ thermostatic radiator valves (TRVs) regulating behavior in district heating systems. Sci. Technol. Built Environ. 2023, 29, 96–105. [Google Scholar] [CrossRef]
  33. Uddin, M.N.; Chi, H.L.; Wei, H.H.; Lee, M.; Ni, M. Influence of interior layouts on occupant energy-saving behaviour in buildings: An integrated approach using Agent-Based Modelling, System Dynamics and Building Information Modelling. Renew. Sustain. Energy Rev. 2022, 161, 112382. [Google Scholar] [CrossRef]
  34. Chen, S.; Zhang, G.M.; Xia, X.B.; Chen, Y.X.; Setunge, S.; Shi, L. The impacts of occupant behavior on building energy consumption: A review. Sustain. Energy Technol. 2021, 45, 101212. [Google Scholar] [CrossRef]
  35. Frederiks, E.R.; Stennerl, K.; Hobman, E.V. Household energy use: Applying behavioural economics to understand consumer decision-making and behaviour. Renew. Sustain. Energy Rev. 2015, 41, 1385–1394. [Google Scholar] [CrossRef]
  36. Delzendeh, E.; Wu, S.; Lee, A.; Zhou, Y. The impact of occupants’ behaviours on building energy analysis: A research review. Renew. Sustain. Energy Rev. 2017, 80, 1061–1071. [Google Scholar] [CrossRef]
  37. Bouktif, S.; Ouni, A.; Lazarova-Molnar, S. Towards a Rigorous Consideration of Occupant Behaviours of Residential Households for Effective Electrical Energy Savings: An Overview. Energies 2022, 15, 1741. [Google Scholar] [CrossRef]
  38. Khanam, T.; Reiner, D.M. Evaluating gaps in knowledge, willingness and heating performance in individual preferences on household energy and climate policy: Evidence from the UK. Renew. Sustain. Energy Rev. 2022, 160, 112229. [Google Scholar] [CrossRef]
  39. Xu, X.X.; Yu, H.; Sun, Q.W.; Tam, V.W.Y. A critical review of occupant energy consumption behavior in buildings: How we got here, where we are, and where we are headed. Renew. Sustain. Energy Rev. 2023, 182, 113396. [Google Scholar] [CrossRef]
  40. Zhang, Z.C.; Yao, J.; Zheng, R.Y. Multi-Objective Optimization of Building Energy Saving Based on the Randomness of Energy-Related Occupant Behavior. Sustainability 2024, 16, 1935. [Google Scholar] [CrossRef]
  41. 41. ISO 18523-1:2016; Energy Performance of Buildings—Schedule and Condition of Building, Zone and Space Usage for Energy Calculation—Part 1: Non-Residential Buildings. ISO: Geneva, Switzerland, 2016.
  42. Bauer, A.; Möller, S.; Gill, B.; Schröder, F. When energy efficiency goes out the window: How highly insulated buildings contribute to energy-intensive ventilation practices in Germany. Energy Res. Soc. Sci. 2021, 72, 101888. [Google Scholar] [CrossRef]
  43. Ascione, F.; De Masi, R.F.; Festa, V.; Gigante, A.; Ruggiero, S.; Vanoli, G.P. Thermal and energy performance of a nearly zero-energy building in Mediterranean climate: The gap between designed and monitored loads of space heating and cooling systems. Energy Source Part A 2022, 44, 732–747. [Google Scholar] [CrossRef]
  44. Zare, N.; Saryazdi, S.M.E.; Bahman, A.M.; Shafaat, A.; Sartipipour, M. Investigation of heating energy performance gap (EPG) in design and operation stages of residential buildings. Energy Build. 2023, 301, 113747. [Google Scholar] [CrossRef]
  45. Staveckis, A.; Zemitis, J. Impact of the Limited Heat Source Capacity on Indoor Temperature and Energy Consumption in Serial nZEB Residential Buildings across the Baltic Region. Energies 2023, 16, 5924. [Google Scholar] [CrossRef]
  46. Guerra-Santin, O.; Herrera, N.R.; Cuerda, E.; Keyson, D. Mixed methods approach to determine occupants’ behaviour—Analysis of two case studies. Energy Build. 2016, 130, 546–566. [Google Scholar] [CrossRef]
  47. Yousefi, F.; Gholipour, Y.; Yan, W. A study of the impact of occupant behaviors on energy performance of building envelopes using occupants’ data. Energy Build. 2017, 148, 182–198. [Google Scholar] [CrossRef]
  48. National Institute of Population and Social Security Research. Estimated Future Number of Households in Japan. 12 April 2024. Available online: https://www.ipss.go.jp/pp-ajsetai/j/HPRJ2024/t-page.asp (accessed on 15 May 2024). (In Japanese).
Figure 1. Example of calculating the simultaneous usage ratio.
Buildings 14 01518 g001
Figure 2. Heat and power supply system.
Buildings 14 01518 g002
Figure 3. Frequency distribution of the annual heating load for each dwelling unit.
Buildings 14 01518 g003
Figure 4. Heating periods for each household composition.
Buildings 14 01518 g004
Figure 5. Average heating load for each time in January 2019.
Buildings 14 01518 g005
Figure 6. Heating peak load for all dwelling units in each month.
Buildings 14 01518 g006
Figure 7. Flowchart for creating the curve of the simultaneous usage ratio.
Buildings 14 01518 g007
Figure 8. Curve of simultaneous usage ratio.
Buildings 14 01518 g008
Figure 9. Curves of the simultaneous usage ratio and standard deviation.
Buildings 14 01518 g009
Figure 10. Rate of change in the simultaneous usage ratio.
Buildings 14 01518 g010
Figure 11. Curves of the simultaneous usage ratios: (a) Case1; (b) Case 2.
Buildings 14 01518 g011
Table 1. Main questionnaire items.
Household CompositionLifestyle Schedule
Number of
people
AgeOccupationA day in the life during winter
Answer is number of people living togetherAnswer in tens of yearsAnswer is chosen from working outside the home, working at home, full-time housewife/househusband, university student, high school student, junior high school student, elementary school student, preschooler, and unemployedAnswer is hourly times for going out, sleeping, eating, bathing, and using heating
Table 2. Classification of household composition.
Major ClassificationMinor ClassificationDefinition
Couples and childrenCouple–children (n = 25)A married couple and children who are students or preschoolers
Couple–adults (n = 10)A married couple and working children
Only couplesWorking couples (n = 30)At least one person is employed
Retired couples (n = 25)Both members of the couple are retired
SingleWorking–single (n = 5)One person is employed
Retired–single (n = 6)One person is retired
OtherSingle parent (n = 2)A single parent and children who are students or preschoolers
Three generations (n = 3)Three generations of grandparents, parents, and children
Table 3. RMSE.
Table 3. RMSE.
Combinationsc = 10c = 50c = 100c = 200c = 500
α 2 ¯ (2 dwelling units) %87.42886.28186.69485.73886.024
α 200 ¯ (200 dwelling units) %53.51753.66853.63953.61553.606
RMSE (2–204 dwelling units)0.8040.4000.2060.192-
Table 4. Cases of household composition.
CaseClassificationStep 1Step 2Step 3Step 4
Case 1Couples and childrenn = 30n = 20n = 10n = 0
Only couplesn = 0n = 10n = 20n = 30
Case 2Working couplesn = 29n = 20n = 10n = 6
Retired couplesn = 1n = 10n = 20n = 24
Disclaimer/Publisher’s Note: The statements, opinions and data contained in all publications are solely those of the individual author(s) and contributor(s) and not of MDPI and/or the editor(s). MDPI and/or the editor(s) disclaim responsibility for any injury to people or property resulting from any ideas, methods, instructions or products referred to in the content.

