Abstract
Research has confirmed the positive impact of social interaction behaviors, including improved mental health, creativity, and stress reduction. Notably, a relationship exists between the spatial characteristics of university campuses and social interaction behaviors. The theories of supportive environment and ecological psychology were used to investigate the quantitative relationship between spatial features of informal spaces and social interactions at a university in a cold region to determine supportive features. Deep learning-based computer vision methods were employed to collect and analyze crowd behavior data, and multiple regression analysis was used to determine the relationship between the features and social interactions. The results indicate that functional features significantly influence social interactions, whereas physical features have a relatively minor impact on social interaction frequency. This finding confirms the efficacy of informal space design at cold-region universities in promoting social interaction behaviors. The deep learning method enables quantitative analysis of the effect of environmental features on social behaviors on cold-region university campuses, providing valuable design suggestions and insights for campuses in other regions and research related to social interaction behaviors.
1. Introduction
1.1. Background and Significance
Social interaction is a behavior, action, or practice in which two or more people interact, i.e., any attempt to influence or consider each other’s subjective experiences or intentions [1]. Social interaction behaviors can have many beneficial effects, such as promoting mental health, creativity, and stress reduction [2,3,4]. Studies on social interaction behaviors and mental health have found that positive and negative social interaction behaviors are closely related to mental health [5]. These results were confirmed by studies in related disciplines, such as social psychology, biology, neuroscience, and cognitive science [6]. Social interaction behaviors, including cognitive abilities, personality traits, task motivation, and other factors, contribute to generating ideas [7]. Connections in social networks typically improve creativity, but the physical location of a social network can facilitate or limit idea generation [8]. Extensive social interactions may reduce a person’s stress [9]. Social interaction also reduces health-damaging behaviors and encourages health-promoting behaviors but may increase stress [10].
Social interaction behaviors occur frequently on campuses. Some studies have shown that these behaviors improve learning efficiency and cognitive abilities. For example, social interaction behavior can significantly increase students’ participation in learning, promote active learning behaviors, and reduce one-way communication between teachers and students [11]. It encourages knowledge acquisition by students, improving their psychological state and learning ability [12]. Social interaction behaviors in university life are highly correlated with academic success, and socializing facilitates learning and improves personal development [13]. Cooperative learning and collaboration based on social interactions positively influence academic achievement, intergroup relations, and self-esteem [14].
1.2. Literature Review
The social, physical, and spatial environment affects social interaction behavior. Some studies have shown that the physical environment can have symbolic meaning, affecting social interaction behavior in non-verbal ways [15]. Spatial composition critically influences positive social interaction behavior [16]. Studies on campus design have also shown that the learning space layout affects the students’ social relationships and behaviors, as well as their social interaction behavior [17]. A favorable physical learning environment can improve the efficiency of teaching, learning, and communication and promote the students’ social interaction behavior and their academic achievements [18].
This paper uses ecological psychology to interpret real-world phenomena, expanding traditional psychological research by emphasizing the interconnections between psychological processes and environmental factors. Ecological psychology challenges the anthropocentric views prevalent in traditional psychology, proposing a more comprehensive understanding of the psyche, including ecological dimensions. This study investigates the profound interrelationship between humans and their natural environment, focusing on the effect of ecological settings on psychological health [19]. Ecological psychology, which is tightly integrated with a human-centered approach, advocates for practices that foster deeper connections with the natural world, offering psychological and ecological support [20]. Research indicates that exploring the cognitive and emotional dimensions of individuals’ interactions with the environment at the educational level can enhance our understanding of behavioral patterns in that environment, facilitating practical research applications [21].
Studies in ecological psychology recognize that environments supporting psychological health can also enhance perceptual interactions between individuals and the world, fostering a symbiotic relationship with the surrounding environment [22]. Many studies have investigated supportive environments, i.e., environments that encourage physical and social activities and improve mental health. Wilson et al. showed that creating environments supporting positive behaviors at home, school, and in the community encouraged healthy behaviors in adolescents and reduced health problems such as obesity [23]. Jayaratne et al. found that it was more likely for individuals to obtain psychological support and reduce stress and tension in a supportive work environment [24]. Holz et al. observed that supportive social environments could increase a person’s ability to cope with stress and counteract the deleterious effects of social adversity [25]. Most research on supportive physical environments has focused on the perception of the physical environment and mental activities. Acton’s study showed how infrastructure, learning, and teaching could be integrated into a socio-material assemblage, emphasizing the importance of understanding the symbiotic relationship between the physical space and human practices in educational environments [26]. Nordtømme’s study of young children’s perspectives found that the spatial environment and materials in kindergartens were crucial to children’s social interaction behaviors, emphasizing the role of the physical environment in children’s play and social interaction behaviors [27]. Heath examined the influence of the physical environment on social activities and observed how the environment affected social interaction behaviors [28].
The design of supportive environments on university campuses has received significant attention in recent years. These studies addressed the design of physical spaces, pedagogical approaches, cultural diversity, and social support. Fan et al. investigated the sensory design of open spaces on university campuses in hot and humid climates, focusing on functional design and multisensory stimuli to enhance the outdoor experience [29]. In contrast, Beyraghi and Balilan examined the importance of social spaces in educational environments from the perspective of behavioral settings. It was found that the physical, semantic, and social components of the campus environment significantly affected students’ behavior [30]. Wang applied environmental and behavioral psychology theories, questionnaires, interviews, observations, and behavioral mapping to evaluate campus environments. Suggestions were provided to improve the campus environment [31].
The characteristics of informal spaces on campuses also influence social interactions. Informal spaces are not designed for specific purposes but are used by people for learning, socializing, and relaxing. They include reading corners in libraries, open lounge areas, and campus green spaces that provide opportunities to interact informally. Sun and Looi emphasized the importance of informal learning spaces in promoting students’ self-directed learning and creativity by proposing boundary activity learning principles to integrate formal and informal learning spaces [32]. Earl showed that the concept of informal spaces originated in socialist societies and was adapted to the new conditions of the post-reform era [33]. Cox found that informal learning spaces included outdoor spaces, corridors, halls, lounges, cafes, and libraries. They provide multisensory experiences and are important destinations for students with balanced socialization with isolation, technology, and easy access to information [34].
The climatic conditions of cold regions can affect social interaction and behavior. Cold environments may pose a risk to human health, resulting in behavioral limitations of varying degrees [35]. Cold temperatures may reduce academic performance, suggesting that cold climates affect students’ learning and cognitive abilities [36]. The stronger perception of stress due to cold climates can lead to more aggressive behavior, adversely affecting social interaction behaviors [37].
Few studies have investigated university campus design in cold climates, necessitating more research to improve our understanding. Research on urban design in cold climates began in the 1970s. Canada, Japan, the Nordic nations, and the former Soviet Union developed urban planning policies specifically for cold climate conditions to address the adverse effects of cold climates on urban spaces, snow resistance, energy conservation, and economic collaboration [38,39,40]. Subsequent studies have primarily focused on using design principles [41] or technological means [42] to minimize the effect of cold climates on urban areas [42].
These studies have shown that supportive environmental design can facilitate social activities, cultural exchange, and creative thinking and optimize the physical environment. Supportive environmental design of educational institutions, workplaces, or urban spaces can encourage behavior that facilitates social interactions or other behaviors. However, cold climates require tailored approaches to address their unique conditions. More research is required to investigate the effects of supportive design on individuals’ behaviors as technology develops and societal needs change, opening up a wide range of design possibilities.
Existing research has focused on the impact of supportive environment design on the perception of the physical environment and psychological activities. Some studies have examined which supportive environments are required for social activities. Research on supportive environments on campuses has concentrated on the effect of supportive environments on teaching methods, cultural diversity, and social support. However, few studies have examined the effect of the supportive environmental design of campus spaces on specific behaviors. Most studies have utilized qualitative research methods, such as surveys and interviews, whereas few quantitative analyses have been conducted. This study addresses the limitations of previous studies and analyzes crowd behavior using a deep learning-based visual approach. Video observations acquired in informal spaces on the campus of a cold-region university are used instead of a questionnaire survey to obtain more objective data. The objective is to fill the research gap related to the influence of functional and physical environmental features on social interaction and behavior.
1.3. Research Issues
The supportive environment and ecopsychology theories are used to analyze the correlation between environmental features and social interaction behaviors to improve design strategies. This study aims to answer the following questions:
Question 1: Which physical environment features affect social interaction behaviors in informal spaces on cold-weather university campuses?
Question 2: How can the supportive design of informal spaces on cold-weather university campuses facilitate social interaction behaviors?
The innovation of this study is to analyze the social interaction behaviors in informal spaces on cold-region university campuses using deep learning-based visualization of crowd behavior. The novel statistical approach adds value to this study because it provides evidence to assess and explain the relationships. This method can be used to investigate social interaction behaviors and improve the reliability of research by revealing the role of environmental characteristics in social interaction. The results provide practitioners with a deeper understanding of the impact of the characteristics of informal spaces on social interaction behaviors on cold-region university campuses and can be used to improve campus design.
2. Methodology
2.1. Workflow
The workflow of this study consisted of (1) the acquisition of videos, (2) the extraction of crowd behavioral data from the videos using deep learning methods, and (3) the visualization of the data and correlation analysis.
The behavioral patterns were analyzed using behavioral quantification, which has been widely used and proved effective [43,44,45]. The video data were acquired by the author on the first campus of the Harbin Institute of Technology (HIT) from November to December 2023. Fifteen locations with high foot traffic were selected, including nine indoor scenes and six outdoor scenes. The video recordings were obtained from 10:00 to 14:00 on sunny days to obtain high-quality data.
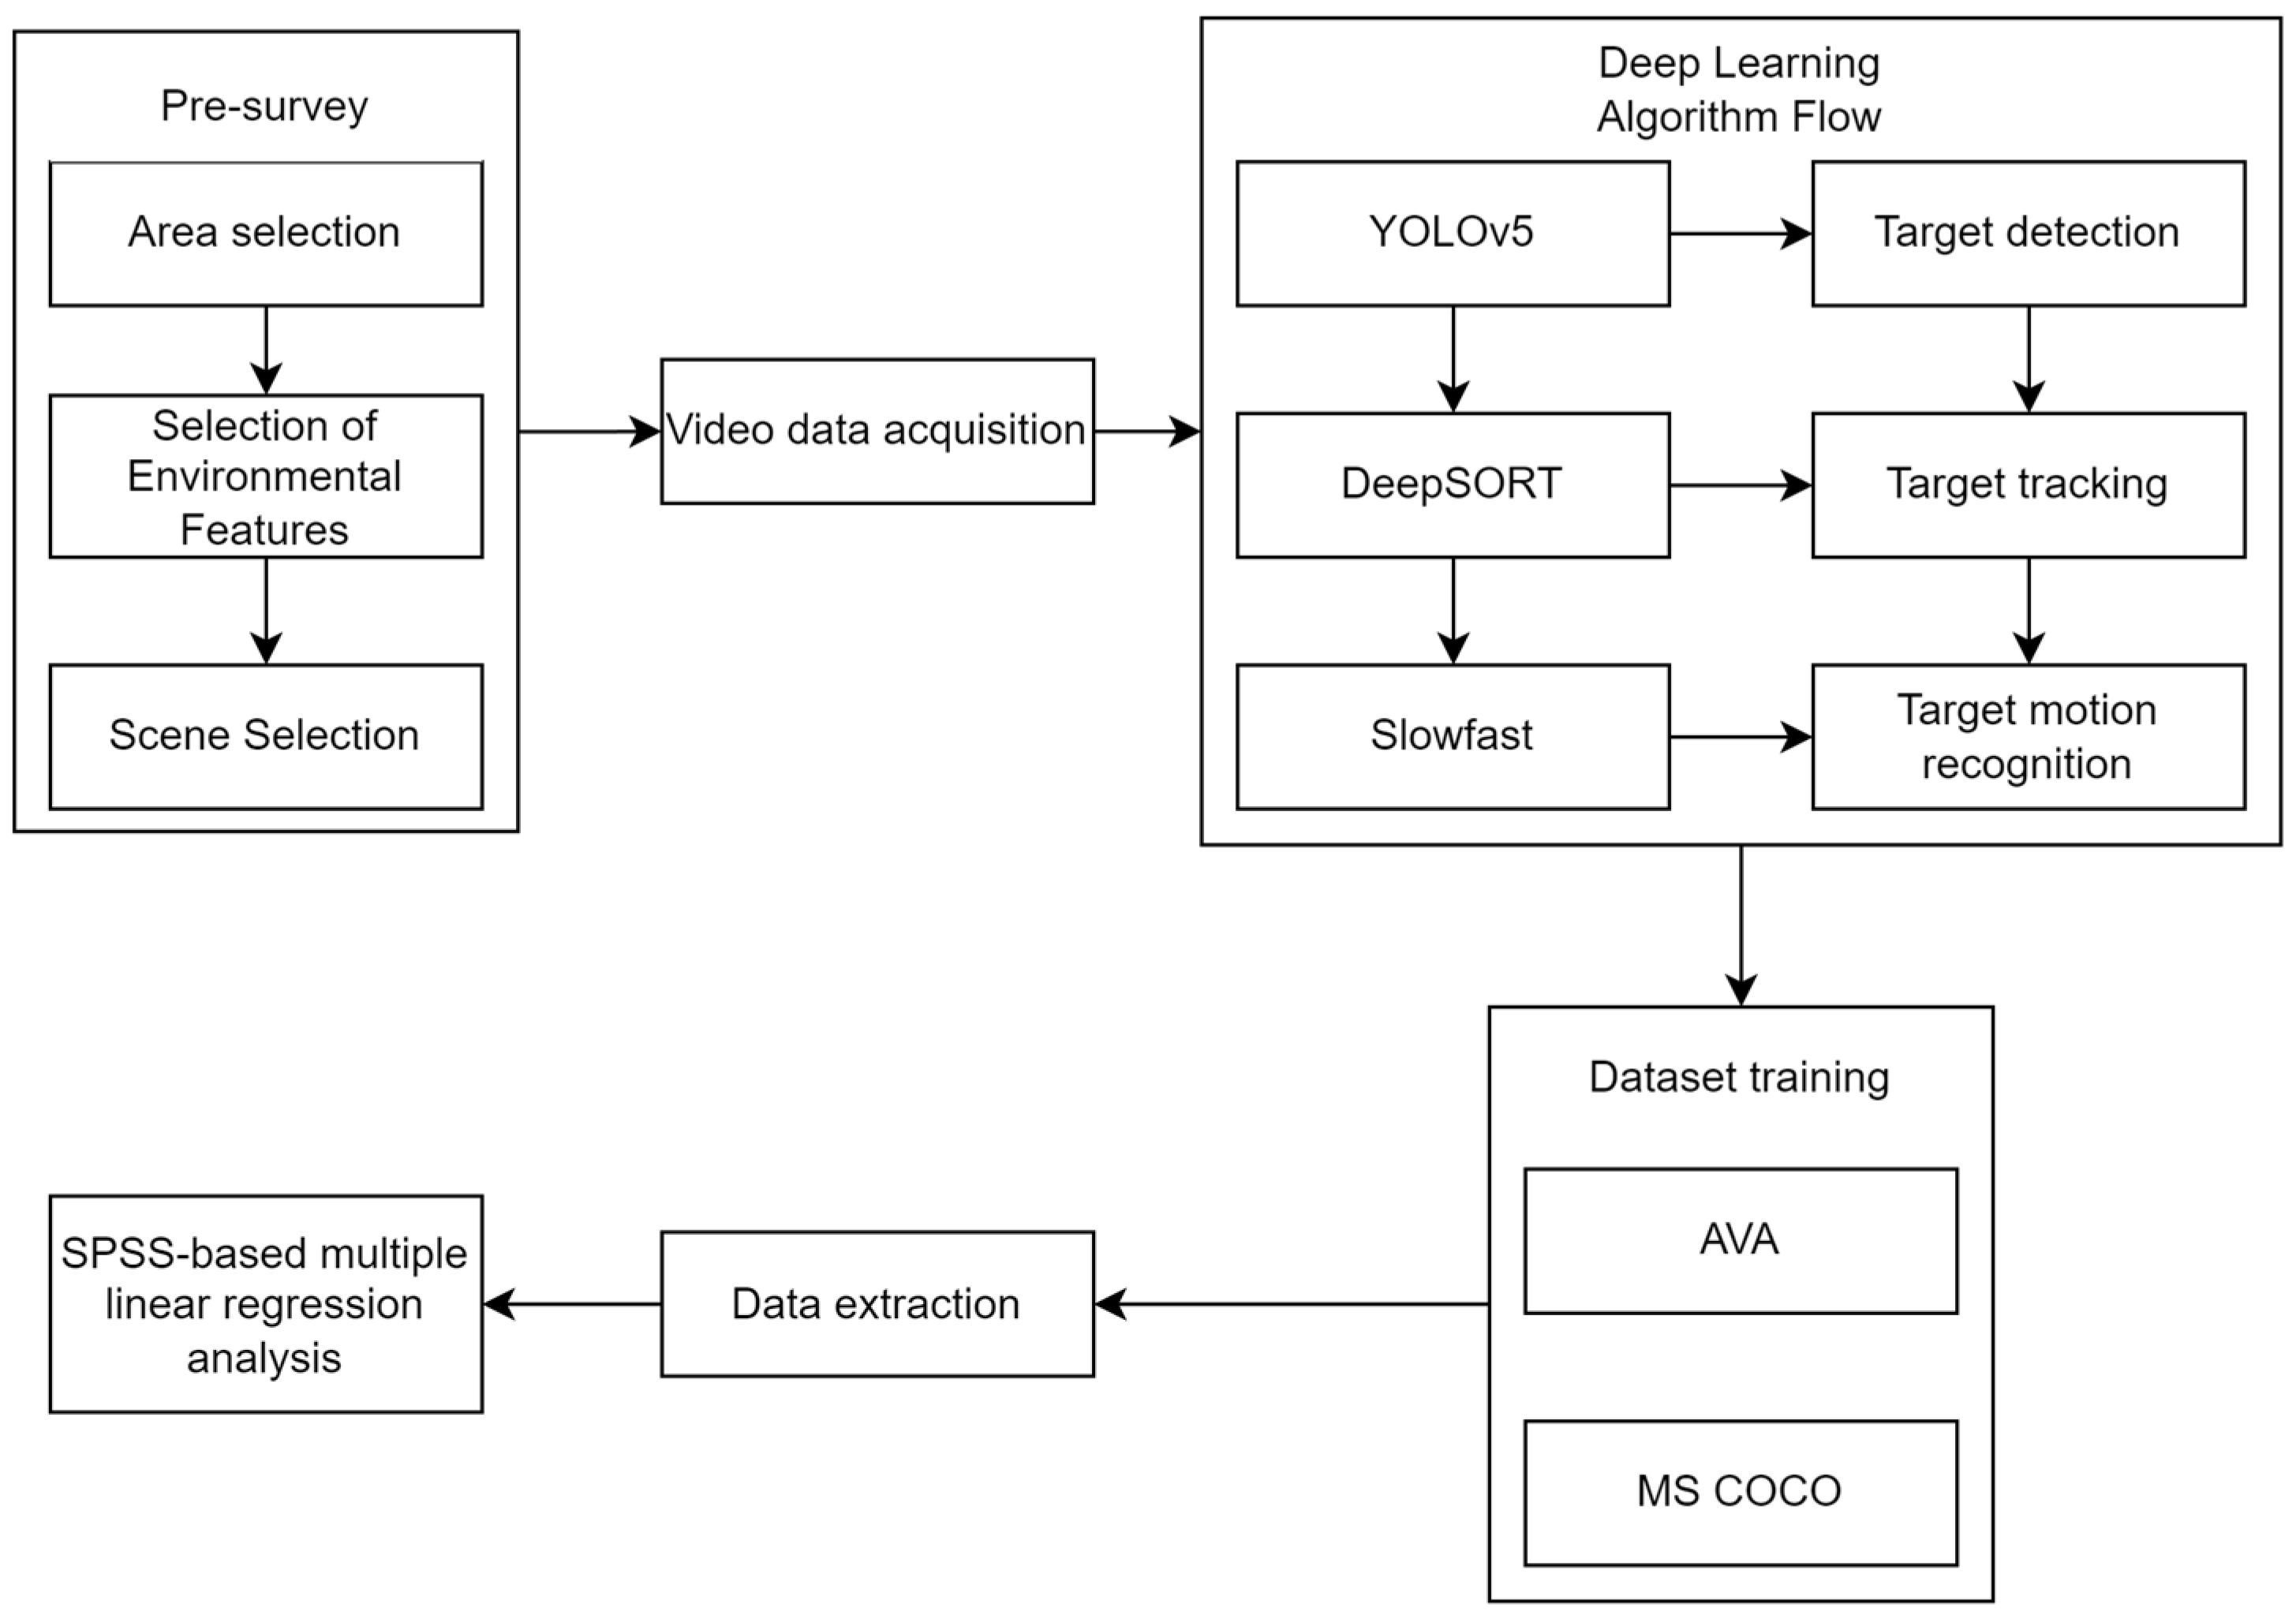
As shown in Figure 1, behavioral detection was performed using the You Only Look Once (Yolo) v5 model and the SlowFast algorithm. Actions, such as walking, standing, sitting, and social interactions, were tracked and counted using the Deep Simple Online and Realtime Tracking (DeepSORT) algorithm. Model training was performed using the audiovisual annotations (AVA) and Microsoft common objects in context (MS COCO) datasets. The number of people exhibiting four types of behaviors (walking, standing, sitting, and social interactions) was identified. A valid behavior lasted 120 consecutive frames. The four types of behaviors were extracted separately. Walking, standing, and sitting were mutually exclusive, and it was assumed that social interactions occurred at the same time as the other behaviors.

Figure 1.
Workflow chart.
Multiple linear regression analyses were performed on the extracted data using SPSS Statistics 26. A correlation analysis between the environmental features and the crowd behaviors was performed to identify the effect of environmental features on the behavior types and propose targeted design recommendations.
2.2. Research Area
The study area was the first campus of the HIT. It was built in 1920 and is also known as the main campus. It is located in the Nangang District and covers an area of 977,400 sq m. We chose this location because it is the largest university campus in Harbin and provides a convenient sample area. Harbin is located in northeastern China, in southwestern Heilongjiang Province. According to the Köppen–Geiger climate classification, the research site falls in the Dwa category, a cold region with cold winters and hot summers [46]. The area has a temperate continental monsoon climate with long, cold winters and short, cool summers and four seasons. The temperatures in the spring and fall transition seasons rise and fall quickly. The average annual temperature is 5.6 °C, the maximum average monthly temperature is 23.6 °C, and the minimum average monthly temperature is −15.8 °C. The average annual precipitation is 423 mm. Most of the precipitation falls from June to September. The number of frost-free days is 168. The average temperature in winter is −20 °C to −5 °C, with the lowest temperature reaching −30 °C or lower. Precipitation is relatively low in winter and falls as snow, with an average annual snowfall of 50–60 cm.
2.3. Feature Selection
The behavioral environments on college campuses in cold regions may increase or decrease the likelihood of social interactions. Thus, it is critical to find features that influence social interactions in informal spaces on college campuses in cold regions.
The literature on campus design suggests many features of the built environment can influence people’s interactions, including aesthetics, land use, function, shape, materials, color, or height. This study selected environmental, functional, and material features as influencing variables. According to the theory of supportive environments, “behavior reflects the interaction between individuals and the environment”. Based on the literature and the results of field research (Figure 2), crowd behavior was classified into four behavior categories (walking, standing, sitting, and social interactions) using the deep learning model. The spatial functions were identified according to three behaviors (walking, standing, and sitting), and the spaces were categorized as walking, standing, and sitting spaces. The material features included indoor/outdoor locations, natural lighting, a staircase, an elevator, and others. This study conducted an analysis and arrangement of environmental and material characteristics within a campus of Harbin Institute of Technology, selecting 15 scenes that meet the experimental conditions and represent relevant features for video collection.
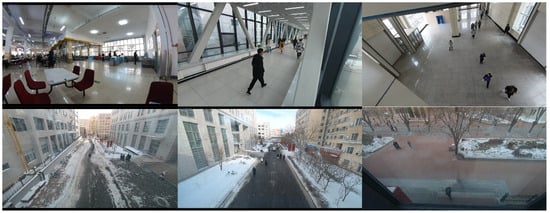
Figure 2.
Example of a site at the Harbin Institute of Technology.
2.4. Research Tools
The behavior detection from the video data was achieved using different algorithms. The target in the frame was detected by Yolo v5 and tracked by DeepSORT, and the target’s action was extracted by SlowFast.
Yolo is a fast object detection algorithm that uses a convolutional neural network for target detection. Although it is not the most accurate object detection algorithm, it is a good choice for real-time detection and provides sufficient accuracy. YOLO v5 was released in 2020 and has a small software size.
DeepSORT is an improved version of the SORT algorithm suitable for tracking objects. A re-identification algorithm detects and tracks the object and extracts its features (low-dimensional vector table). The step is repeated, and the similarity between the extracted features from the two steps is obtained. The detection is conducted sequentially to prevent missed detections and the loss of the ID number. DeepSORT utilizes the object’s speed and movement direction to track the target and its features to determine whether it is the same object.
SlowFast is a deep learning architecture that detects actions in video clips. It was proposed by a team of Facebook artificial intelligence (AI) researchers. It is an efficient and accurate algorithm that considers both the slow and fast dynamics of the video. The input is the video sequence and detection frame, and the output is the behavioral category.
The AVA and MS COCO datasets were used for model training. The AVA dataset is densely annotated with 80 atomic visual actions from 430 15-min video clips. The actions are localized spatially and temporally, resulting in 1,580,000 action labels, with multiple labels per person. It includes (1) definitions of atomic visual actions rather than composite actions; (2) precise spatiotemporal annotations, with multiple possible annotations for each person; (3) extensive annotations of atomic actions in 15-min video clips; (4) people who are temporally linked across consecutive clips; and (5) the use of movies to collect different action representations. This dataset differs from other spatiotemporal action recognition datasets, which typically provide sparse annotations for composite actions in short video clips [47]. The MS COCO dataset contains images of complex everyday scenarios. It is a large-scale dataset suitable for semantic segmentation, image captioning, and image detection. It contains more than 330 k images (of which more than 200 k are labeled), more than 1.5 million targets, 80 target categories (train, boat, cat, etc.), 91 material categories without clear boundaries (street, wall, sky, etc.), and 250,000 objects labeled with key points [48].
2.5. Data Extraction
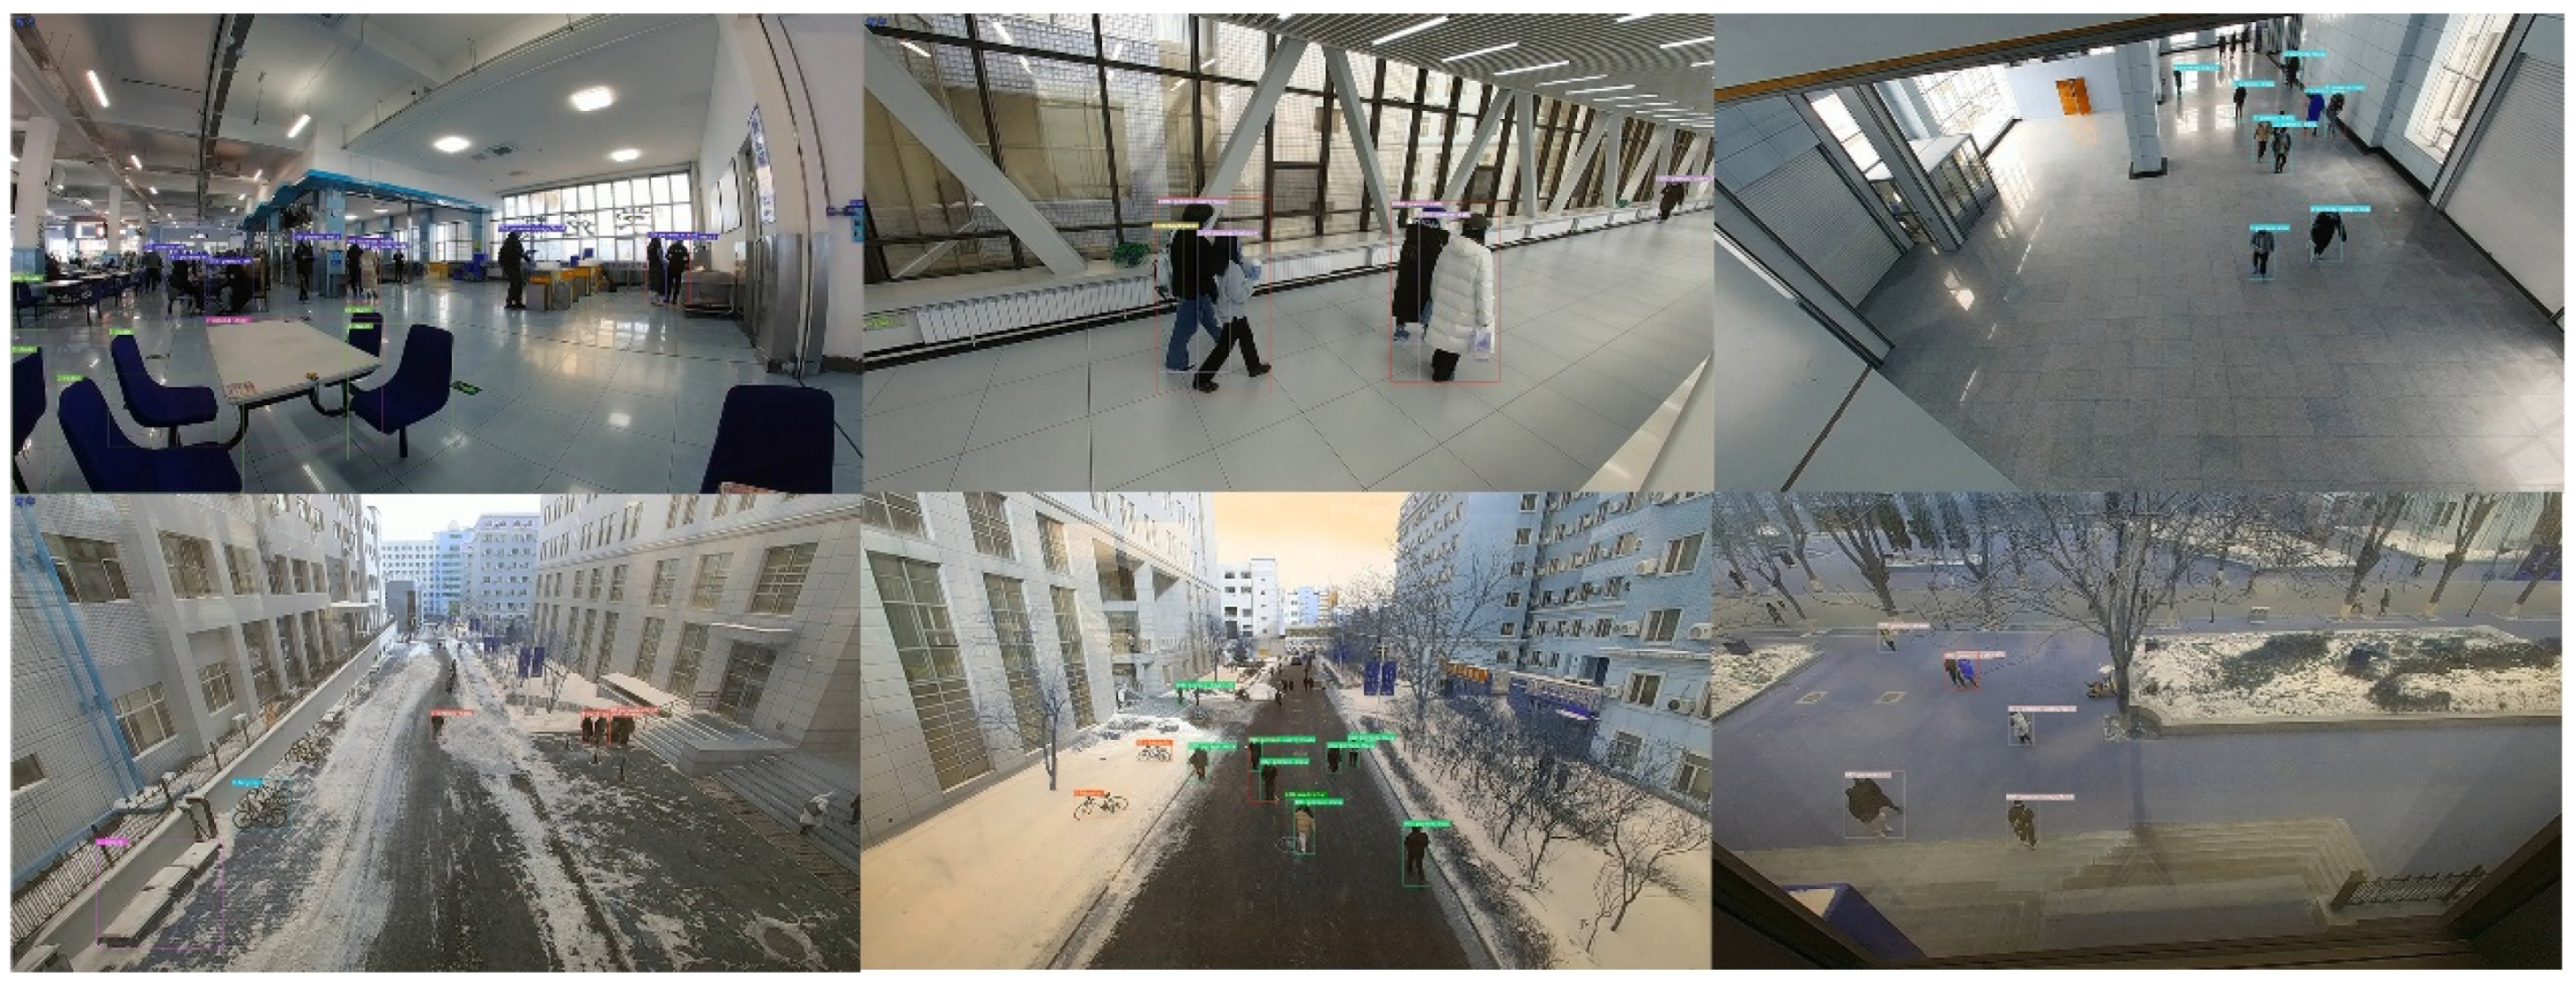
As shown in Figure 3, 15 video clips of different scenes were randomly selected, with an average length of 10 min per video and a frame rate of 24 frames/second. The proportions of walking, standing, sitting, and interacting people in each scene were calculated. Photoshop was used to determine the proportion of areas where people were walking, standing, and sitting. Due to the overlap of locations with different activities and the occlusion of some scenes, the proportion of the three values did not necessarily add up to 1.
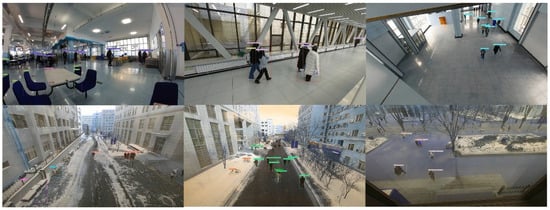
Figure 3.
Examples of scenes with people exhibiting different behaviors.
3. Results
3.1. Descriptive Statistics and Correlation
A total of 8875 data points were extracted, and 4693 people were identified. Multiple linear regression analyses were performed using SPSS. The proportion of interactions was the dependent variable, and the independent variables included the proportions of people walking, standing, and sitting, the proportions of areas where people were walking, standing, and sitting, indoor/outdoor locations, natural or non-natural lighting, stairs, and elevators. We calculated the descriptive statistics and performed Pearson correlation analysis on the variables. The correlation coefficient (r) of the model was 0.923, and the R-squared was 0.852, indicating a good model fit and the ability of the model to explain most of the variability in the dependent variable.
Relatively few people (n = 526) among the 4693 exhibited social interactions. Similar results were observed for the number of standing (n = 361) and sitting (n = 163) people. This resulted in relatively few areas for sitting and standing compared to areas for walking. The SlowFast algorithm assigns a unique number to each identified individual. The number of walking people was substantially higher than those in other behavioral categories, but there was no significant impact on the number of social interactions.
3.2. Effect of Variables on Social Interaction Behavior
Pearson correlation analysis was used to assess the relationship between environmental characteristics and social interaction behavior. The proportion of social interaction behavior was significantly positively correlated with the proportion of walking spaces and significantly negatively correlated with the proportion of standing and sitting spaces. The results of multiple regression analysis showed a highly significant effect of the proportion of walking and standing spaces and a moderately significant effect of the sitting space on the proportion of interacting people.
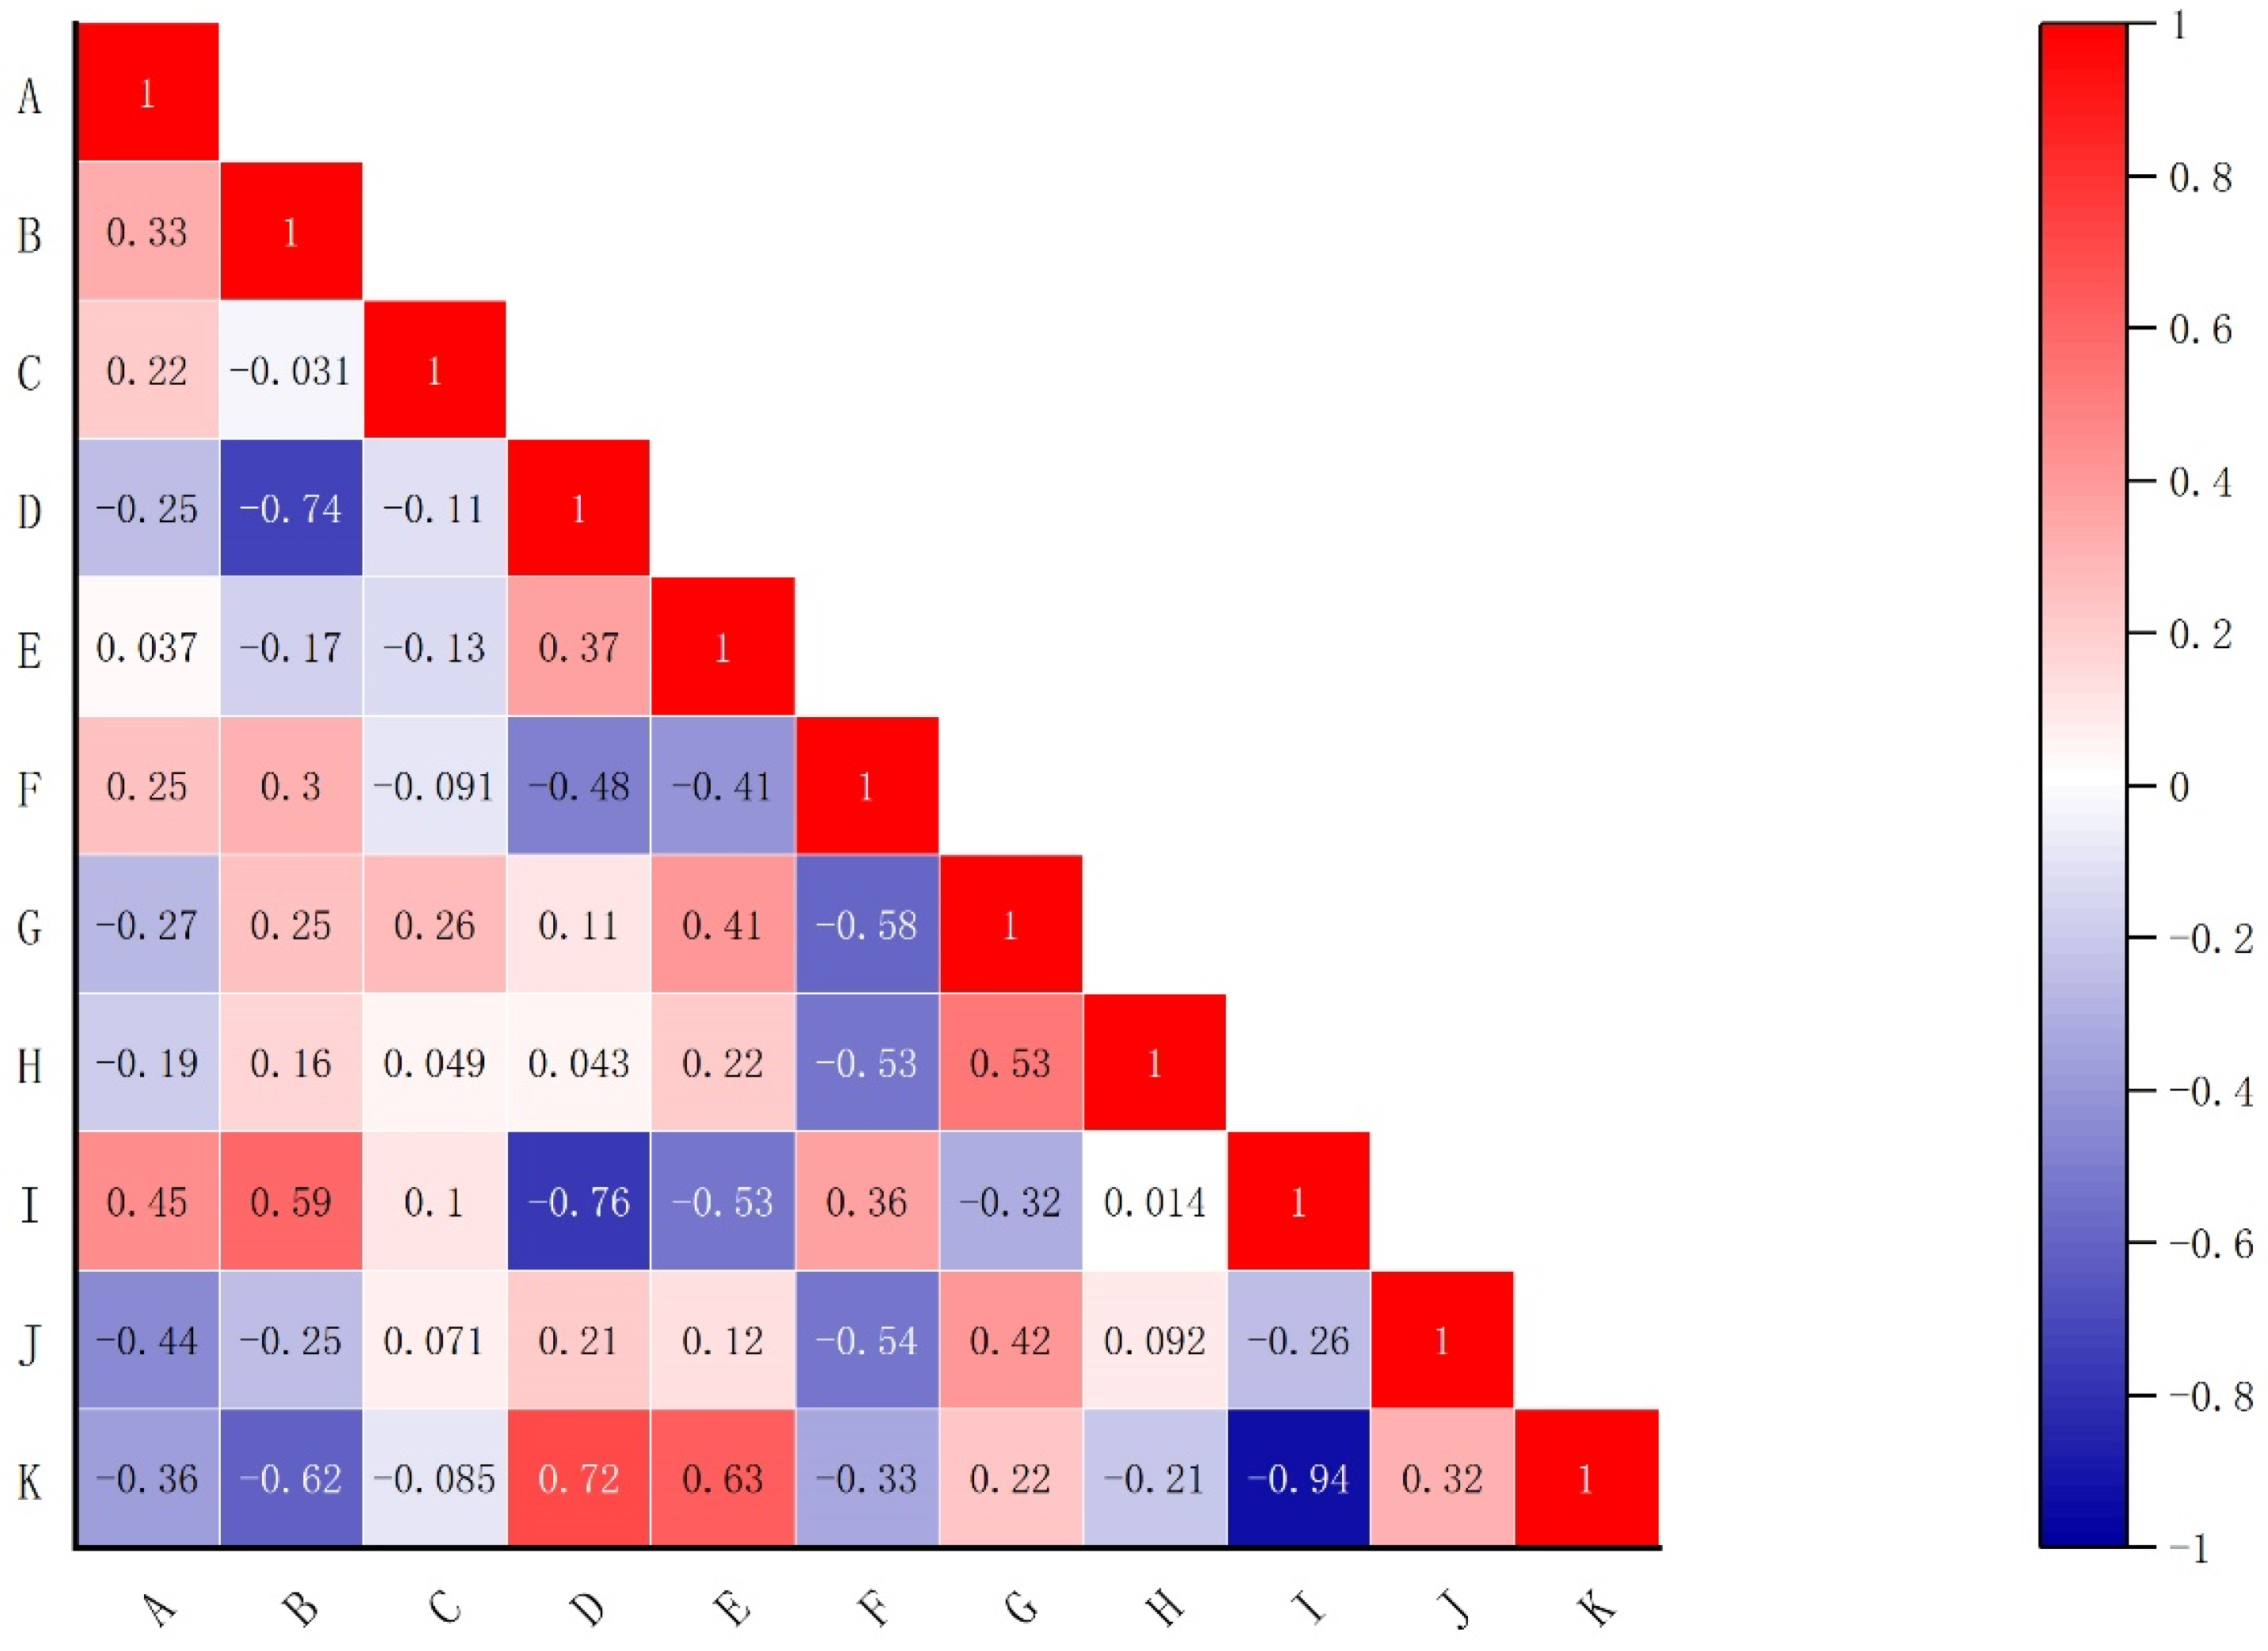
The proportion of people with social interactions was significantly and positively correlated with the proportion of people walking. A positive correlation occurred with the proportion of standing and sitting people, but the significance level was lower for the latter than the former. Figure 4 shows the correlations between the different variables. The results indicate that social interaction behaviors are correlated with the functional and physical characteristics of the environment. Different environmental characteristics had different degrees of impact on the social interaction behaviors of users of informal spaces on the cold-region university campus. The proportion of interacting people had a strong positive correlation with the proportion of walking space and a strong negative correlation with the proportion of standing and sitting spaces. In contrast, the effect of the physical characteristics of the environment was relatively small. The presence/absence of an elevator, stairs, and natural lighting had small effects on social interaction, whereas the indoor/outdoor variable had no effect.
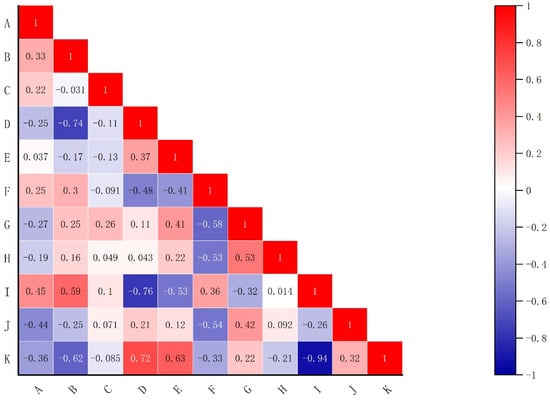
Figure 4.
Correlation matrix plot (Pearson correlation). Notes: All correlations are significantly different from 0. A = proportion of people with social interactions; B = proportion of people walking; C = proportion of people standing; D = proportion of people sitting; E = indoors; F = with natural light; G = with stairs; H = with elevator; I = proportion of walking space; J = proportion of standing space; K = proportion of sitting space.
4. Discussion
4.1. Effects of Environmental Functional Characteristics on Social Interaction Behavior
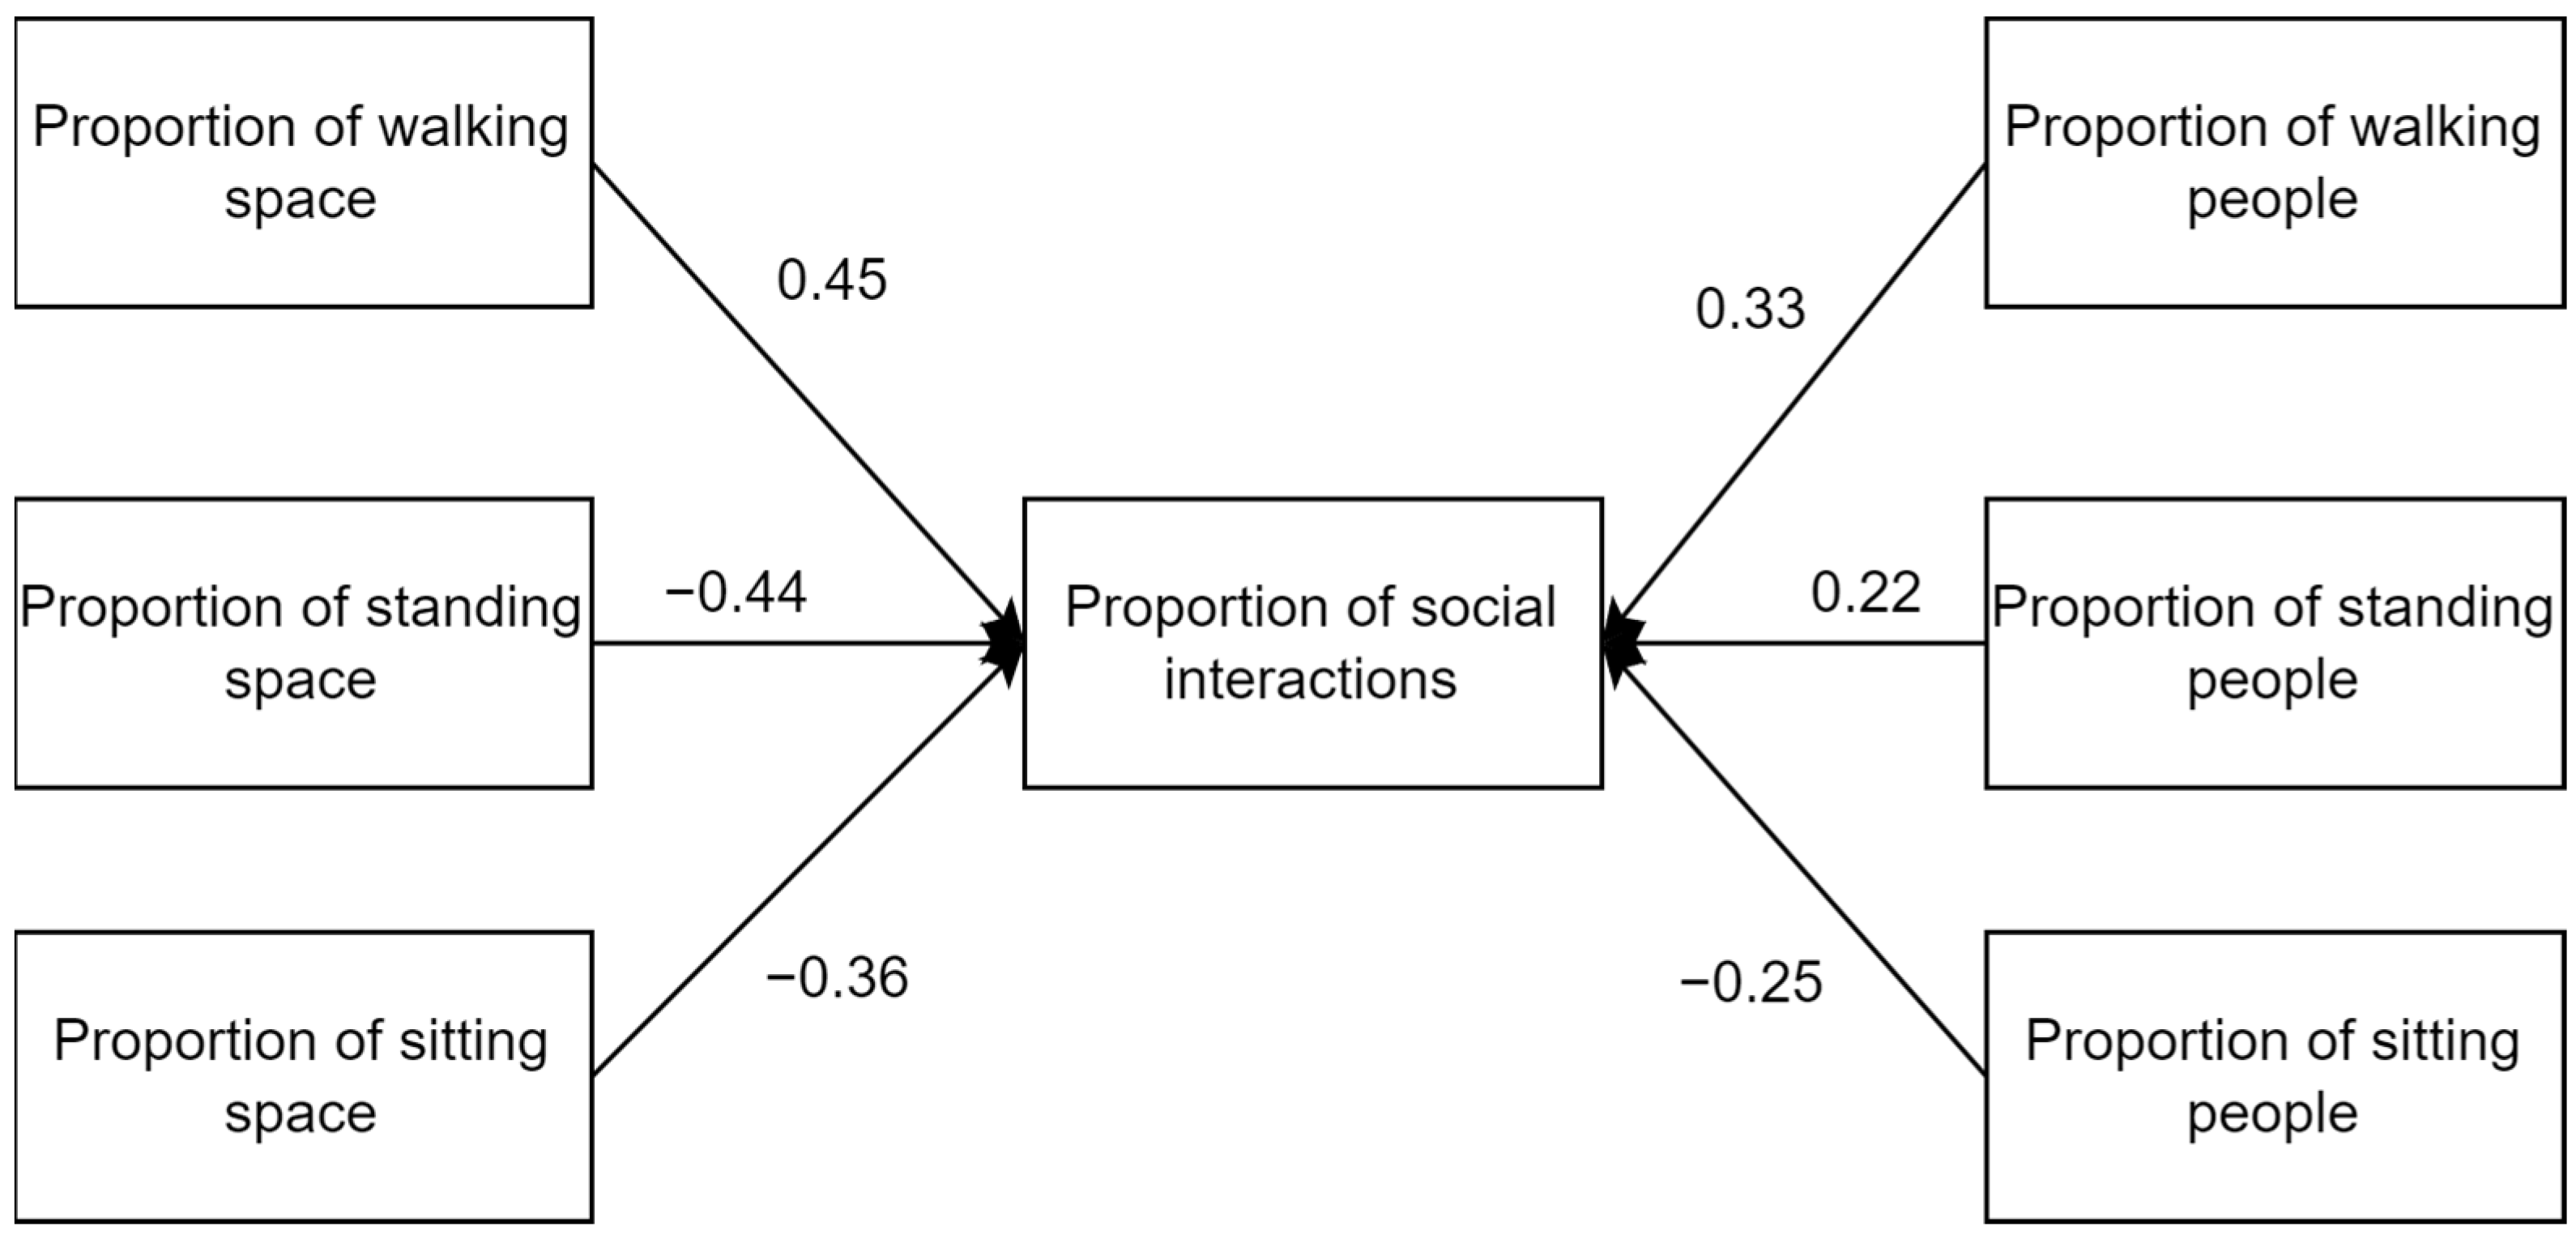
As shown in Figure 5, the findings indicate that environmental functional features significantly affect social interaction behaviors. A strong positive correlation was observed between the proportion of walking space and social interaction behaviors. A strong negative correlation occurred between the proportion of standing and sitting spaces and social interaction behaviors.
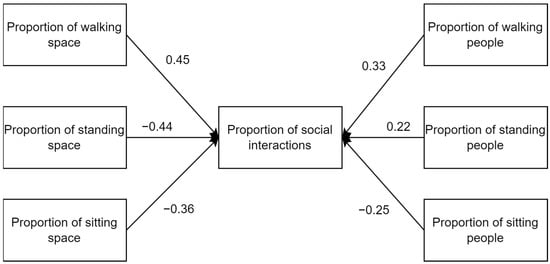
Figure 5.
Correlations between the proportion of social interactions and environmental functional characteristics.
The correlation coefficient between the proportion of walking space and the proportion of social interactions is 0.45 (strong positive correlation). Studies have shown that positive experiences during walking, such as sharing spaces with others, encouraged positive interactions between people, enhanced the sense of belonging, reduced loneliness, and contributed to a sense of well-being. In our study, walking spaces encouraged social activities, which is consistent with the results of other studies [49,50]. Some studies have confirmed that walking can significantly reduce the difficulty of social interactions, making short social interactions enjoyable. It can provide companionship for those suffering from social anxiety disorder and promote social interactions [51].
The correlation coefficients between the proportion of interacting people and the proportions of the standing and sitting spaces were −0.44 and −0.36, respectively, a strong negative correlation. Several studies obtained similar results. For example, one study showed that more intense physical activities, which were required before social interaction, helped participants experience social and spatial convergence, resulting in interactions. The participants changed their body positions and gazes to focus on others before they began to speak [52]. Studies have indicated that people prefer a comfortable distance from their surroundings and people at rest, but not when they are active. These studies align with our conclusion that social interactions are less likely when people are in environments that encourage sitting or standing.
The correlation coefficients between the proportions of walking, standing, and sitting people and the proportion of interacting people were 0.33, 0.22, and −0.25, respectively. The trends were consistent with those of the environmental functions of walking and sitting, suggesting that social interactions were more frequent when people were walking and less frequent when people were sitting. In contrast, the trends were the opposite for the proportion of standing people and the environmental function of standing. This discrepancy can be explained by the theory of a supportive environment. It posits that the physical environment affects people’s experiences and behaviors. Since walking and sitting occur in environments that support these behaviors, the behavioral pattern is consistent with the environmental function. In contrast, standing may occur in environments with different functions.
4.2. Effects of Physical Features of the Environment on Social Interaction Behavior
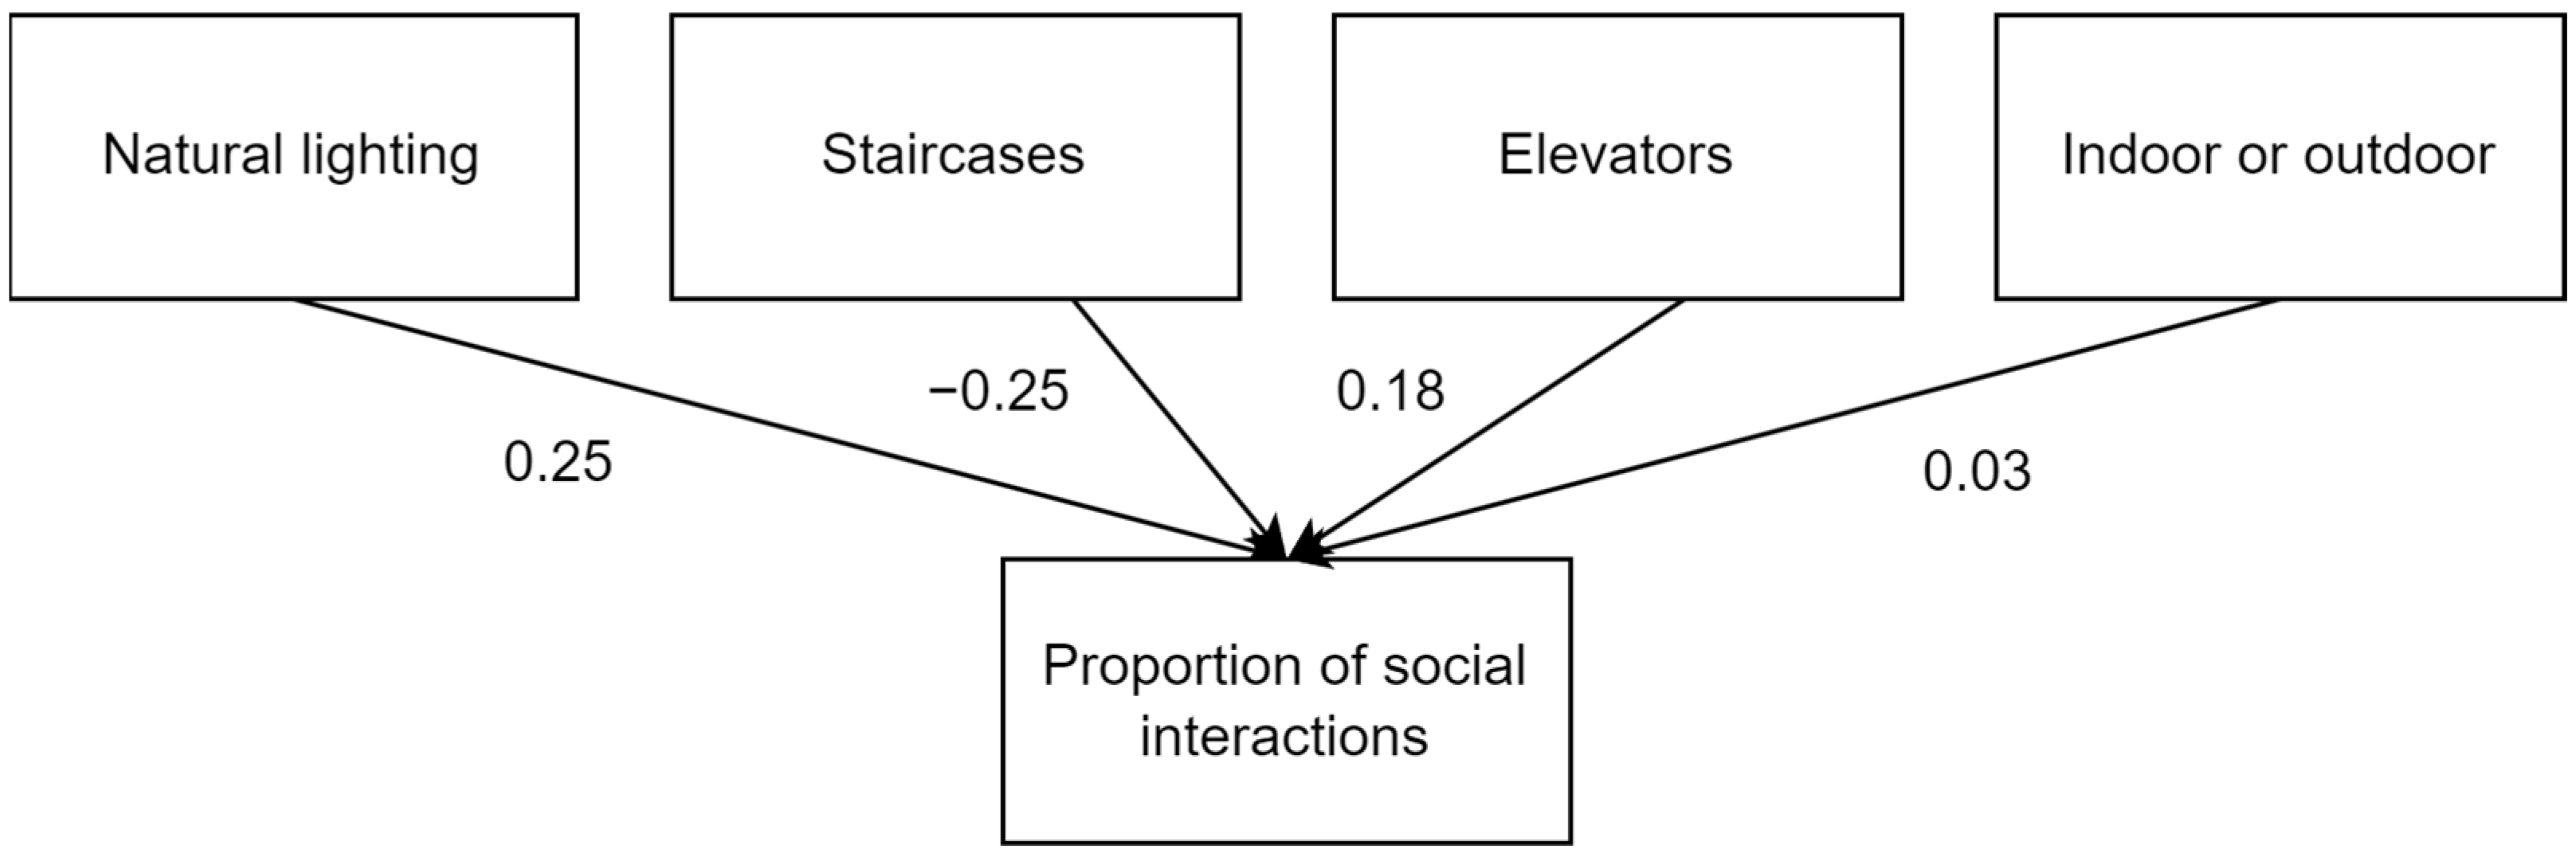
As shown in Figure 6, the study’s results emphasize the low impact of physical characteristics of the environment on social interaction behavior. Notably, the indoor/outdoor variable, which was expected to be important in cold regions, had little or no effect on social interaction.
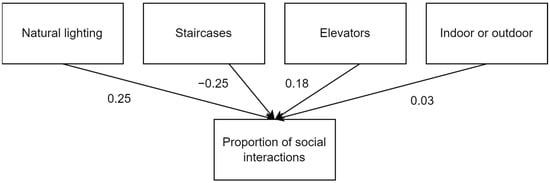
Figure 6.
Correlation between social interactions and environmental physical characteristics.
The correlation between natural lighting and the proportion of people with social interactions was positive (0.25). Cold regions are found at high latitudes. As the seasons change and winter approaches, the number of sunshine hours decreases in the northern hemisphere. In Harbin City, the day length on the winter solstice is 8 h, 40 min, and 4 s, or about one-third of a day. Therefore, natural lighting is important in cold regions. Studies have shown that, although excessive light can hinder social interactions, above-average light levels are associated with lower levels of argumentative behavior, higher levels of comfort, and better moods in the absence of sunlight in winter. A relative lack of light can worsen moods and negatively affect social interactions [53,54]. Our results are in agreement. Therefore, natural lighting should be optimized to improve social interaction in cold regions.
The correlation coefficients between the proportion of people with social interactions and the presence of a staircase and elevator were negative (−0.25 and −0.18, respectively). Most people wear thicker clothing in cold winters, affecting their willingness to climb stairs and engage in conversation. People typically have to wait in line for an elevator, which limits social interactions.
The correlation coefficient between the proportion of people with social interactions and indoor/outdoor conditions was 0.03, indicating a negligible effect. Common sense would dictate that sub-zero temperatures in the winter in cold regions would discourage social interactions. The maximum outdoor temperature was generally below −10 °C, and the indoor/outdoor temperature difference was 30 °C. Thus, it was expected that the thicker garments required outdoors would affect social interactions. However, it was found that the indoor/outdoor variable did not influence the proportion of social interactions. People who move outdoors in the winter tend to keep walking and are less likely to stand or sit down. Therefore, the probability of social interaction is relatively high. Outdoor environments have better lighting, which is also conducive to social interactions. Therefore, both indoor and outdoor environments were favorable for social interactions.
4.3. Limitations and Future Research Directions
This study has the following limitations:
- (1)
- The videos were acquired in the same region. Although they represent the characteristics of crowd activities in the climatic conditions of this cold region, they may not be representative of crowd activities in other cold-region areas. Future research could expand the study areas to other climate zones based on the Köppen–Geiger climate classification and compare the characteristics of different regions to enhance the reliability of the findings.
- (2)
- The deep learning model could only detect certain crowd behaviors and spatial categories. Thus, we classified the behaviors into walking, standing, sitting, and interacting. Future research should investigate different behaviors, utilize additional models, and optimize the datasets.
- (3)
- Winter clothing is thick, and the face is obscured. Therefore, it was impossible to detect social interactions based on facial expressions. We used only the relative positions of people to infer social interactions. Future studies could incorporate facial expressions, characteristic movements, interaction positions, and other features to infer social interactions and improve recognition efficiency.
- (4)
- The videos were recorded during the midday hours in good lighting to obtain a high recognition rate. Thus, we could not incorporate a time variable. Future research could assess the effect of different periods on social interactions.
5. Conclusions
This study investigated the correlation between informal spaces and people’s social interactions on a university campus in a cold region. The frequency of social interactions differed for different environmental functional features. The influence of the physical environmental features on the users’ social interactions was relatively small. The users of informal spaces on the university campus in a cold region were more likely to engage in social interactions while walking than in standing and sitting spaces. The indoor/outdoor variable did not affect the level of social interactions, and users were more likely to engage in social interactions in environments with natural lighting. We plan to analyze data from different seasons for comparison. Another goal is to understand which environmental features influence social interactions and contribute to promoting mental health, creativity, and stress reduction. This study provides informative results and is valuable for designing informal spaces on university campuses in cold regions.
Author Contributions
Conceptualization, J.C. and W.P.; methodology, J.C. and H.S.; software, H.S.; validation, H.S. and D.S.; formal analysis, H.S.; data curation, D.S.; writing—original draft preparation, H.S.; writing—review and editing, J.C.; visualization, H.S.; supervision, J.C. and W.P. All authors have read and agreed to the published version of the manuscript.
Funding
This research was funded by the Postdoctoral General Program Foundation of Heilongjiang Province (grant number LBH-Z22117), Key R&D Program Guidance Category Projects of Heilongjiang Province (grant number GZ20230038).
Data Availability Statement
The original contributions presented in the study are included in the article, further inquiries can be directed to the corresponding author.
Conflicts of Interest
The authors declare no conflicts of interest.
References
- Rummel, R.J. Understanding Conflict and War: The Conflict Helix; Sage: New York, NY, USA, 1976; Volume 2. [Google Scholar]
- Bolger, N.; Eckenrode, J. Social Relationships, Personality, and Anxiety During a Major Stressful Event. J. Personal. Soc. Psychol. 1991, 61, 440. [Google Scholar] [CrossRef] [PubMed]
- Hirshberg, M.J.; Colaianne, B.; Inkelas, K.K.; Oke, G.; Van Doren, N.; Davidson, R.J.; Roeser, R.W. COVID-19 Pandemic Effects on College Student Mental Health: A Cross-Sectional Cohort Comparison Study. J. Am. Coll. Health 2023, 1, 1–10. [Google Scholar] [CrossRef] [PubMed]
- Kabo, F.W.; Cotton-Nessler, N.; Hwang, Y.; Levenstein, M.C.; Owen-Smith, J. Proximity Effects on the Dynamics and Outcomes of Scientific Collaborations. Res. Policy 2014, 43, 1469–1485. [Google Scholar] [CrossRef]
- Lee, H.J.; Szinovacz, M.E. Positive, Negative, and Ambivalent Interactions with Family and Friends: Associations with Well-being. J Marriage Fam. 2016, 78, 660–679. [Google Scholar] [CrossRef]
- Lange, P.A.M.V. Bridging social psychology. In Bridging Social Psychology: Benefits of Transdisciplinary Approaches; Lawrence Erlbaum Associates Publishers: Mahwah, NJ, USA, 2006; pp. 3–20. ISBN 978-0-8058-5094-9. [Google Scholar]
- Amabile, T.M. The Social Psychology of Creativity: A Componential Conceptualization. J. Personal. Soc. Psychol. 1983, 45, 357. [Google Scholar] [CrossRef]
- Perry-Smith, J.E.; Shalley, C.E. The Social Side of Creativity: A Static and Dynamic Social Network Perspective. Acad. Manag. Rev. 2003, 28, 89. [Google Scholar] [CrossRef]
- Ono, E.; Nozawa, T.; Ogata, T.; Motohashi, M.; Higo, N.; Kobayashi, T.; Ishikawa, K.; Ara, K.; Yano, K.; Miyake, Y. Relationship between social interaction and mental health. In Proceedings of the 2011 IEEE/SICE International Symposium on System Integration (SII), Kyoto, Japan, 20–22 December 2011; pp. 246–249. [Google Scholar]
- Lewis, M.A.; Rook, K.S. Social Control in Personal Relationships: Impact on Health Behaviors and Psychological Distress. Health Psychol. 1999, 18, 63–71. [Google Scholar] [CrossRef]
- Hurst, B.; Wallace, R.R.; Nixon, S.B. The Impact of Social Interaction on Student Learning; Missouri State University: Springfield, MO, USA, 2013. [Google Scholar]
- Xu, Y.; Yang, Y. Student Learning in Business Simulation: An Empirical Investigation. J. Educ. Bus. 2010, 85, 223–228. [Google Scholar] [CrossRef]
- Williams, K.B. Academic Support, Social Support, and Professional Development of Higher and Lower Achieving Psychology Majors. N. Am. J. Psychol. 2015, 17, 373–382. [Google Scholar]
- Osterholt, D.A.; Barratt, K. Ideas for Practice: A Collaborative Look to the Classroom. J. Dev. Educ. 2012, 36, 22. [Google Scholar]
- Mazumdar, S. Organisational Physical Environments: Environmental Reading, Communication and Embarrassment. ASBM J. Manag. 2008, 1, 1. [Google Scholar]
- Cerruti, M.S.; Shepley, M.M. The Effects of Spatial Enclosure on Social Interaction Between Older Adults with Dementia and Young Children. HERD Health Environ. Res. Des. J. 2016, 9, 63–81. [Google Scholar] [CrossRef] [PubMed]
- Cantero, J.M.M.; Mira, R.G.; López-Chao, V. Influence of Physical Learning Environment in Student’s Behavior and Social Relations. Anthropologist 2016, 25, 249–253. [Google Scholar] [CrossRef]
- Aliyu, U.D. An Overview of the Physical and Social Learning Environment of Nigerian Schools. Sokoto Educ. Rev. 2014, 15, 6. [Google Scholar] [CrossRef]
- Conn, S.A.; Conn, L.K. Ecopsychology and Psychotherapy Within the Larger Context: Response to Jack Aylward’s Article on Paul Goodman’s Legacy. Gestalt Rev. 1999, 3, 119–125. [Google Scholar] [CrossRef]
- Blair, L. Ecopsychology and the Person-Centred Approach: Exploring the Relationship. Couns. Psychol. Rev. 2011, 26, 43–52. [Google Scholar] [CrossRef]
- Panov, V.I.; Patrakov, E.V. Digitalization of the Information Environment in the Context of the Ecopsychological Model of the Formation of Subjectivity; Moscow State University of Psychology and Education: Moscow, Russia, 2013. [Google Scholar]
- Doherty, T.J. Ecopsychology Enters Its Second Year. Ecopsychology 2010, 2, 1–3. [Google Scholar] [CrossRef]
- Wilson, D.K.; Sweeney, A.M.; Kitzman-Ulrich, H.; Gause, H.; St. George, S.M. Promoting Social Nurturance and Positive Social Environments to Reduce Obesity in High-Risk Youth. Clin. Child Fam. Psychol. Rev. 2017, 20, 64–77. [Google Scholar] [CrossRef]
- Jayaratne, S.; Himle, D.; Chess, W.A. Dealing with Work Stress and Strain: Is the Perception of Support More Important than Its Use? J. Appl. Behav. Sci. 1988, 24, 191–202. [Google Scholar] [CrossRef]
- Holz, N.E.; Tost, H.; Meyer-Lindenberg, A. Resilience and the Brain: A Key Role for Regulatory Circuits Linked to Social Stress and Support. Mol. Psychiatry 2020, 25, 379–396. [Google Scholar] [CrossRef]
- Acton, R. Place-People-Practice-Process: Using Sociomateriality in University Physical Spaces Research. Educ. Philos. Theory 2017, 49, 1441–1451. [Google Scholar] [CrossRef]
- Nordtømme, S. Place, Space and Materiality for Pedagogy in a Kindergarten. Educ. Inq. 2012, 3, 317–333. [Google Scholar] [CrossRef]
- Heath, C. Configuring Action in Objects: From Mutual Space to Media Space. Mind Cult. Act. 2000, 7, 81–104. [Google Scholar] [CrossRef]
- Fan, M.; Jamaludin, A.A.; Hussein, H. The Observation of Sensory Design in Open Spaces of University Campus under Hot-Humid Climate. Environ.-Behav. Proc. J. 2020, 5, 117. [Google Scholar] [CrossRef]
- Beyraghi, S.; Balilan, L. Semiotics of Behavioral Settings in Educational Spaces, Emphasizing the Social Value of Spaces (Case Study of Islamic Art Faculty and Architecture and Art Faculty of Azad University of Tabriz). Int. J. Architect. Eng. Urban Plan 2018, 28, 117–133. [Google Scholar] [CrossRef]
- Wang, F. Research on the university campus space environment design from the perspective of behavioral psychology—Taking Qinhu and its surrounding environment as the example. In Proceedings of the 2017 2nd International Conference on Politics, Economics and Law (ICPEL 2017), Weihai, China, 28–29 July 2017; Atlantis Press: Weihai, China, 2017. [Google Scholar]
- Sun, D.; Looi, C.-K. An Inspiration from border crossing: Principle of boundary activity for integrating learning in the formal and informal spaces. In Seamless Learning; Looi, C.-K., Wong, L.-H., Glahn, C., Cai, S., Eds.; Lecture Notes in Educational Technology; Springer: Singapore, 2019; pp. 73–88. ISBN 9789811330704. [Google Scholar]
- Earl, C. Vietnam’s “Informal Public” Spaces: Belonging and Social Distance in Post-Reform Hồ Chí Minh City. J. Vietnam. Stud. 2010, 5, 86–124. [Google Scholar] [CrossRef]
- Cox, A.M. Space and Embodiment in Informal Learning. High Educ. 2018, 75, 1077–1090. [Google Scholar] [CrossRef]
- Hassi, J.; Rytkönen, M.; Kotaniemi, J.; Rintamäki, H. Impacts of Cold Climate on Human Heat Balance, Performance and Health in Circumpolar Areas. Int. J. Circumpolar Health 2005, 64, 459–467. [Google Scholar] [CrossRef] [PubMed]
- Johnston, D.W.; Knott, R.; Mendolia, S.; Siminski, P. Upside-Down Down-Under: Cold Temperatures Reduce Learning in Australia. Econ. Educ. Rev. 2021, 85, 102172. [Google Scholar] [CrossRef]
- Morris, D.M.; Pilcher, J.J. Psychological Response Not Physiological Response Predicts Aggression behind the Wheel during Cold Stress. Proc. Hum. Factors Ergon. Soc. Annu. Meet. 2015, 59, 1702–1706. [Google Scholar] [CrossRef]
- Eliasson, I.; Knez, I.; Westerberg, U.; Thorsson, S.; Lindberg, F. Climate and Behaviour in a Nordic City. Landsc. Urban Plan. 2007, 82, 72–84. [Google Scholar] [CrossRef]
- Pressman, N. Planning in Cold Climates: A Critical Overview of Canadian Settlement Patterns and Policies; The University of Winnipeg: Winnipeg, MB, Canada, 1986. [Google Scholar]
- Jull, M. Toward a Northern Architecture: The Microrayon as Arctic Urban Prototype. J. Archit. Educ. 2016, 70, 214–222. [Google Scholar] [CrossRef]
- Nazarian, N.; Acero, J.A.; Norford, L. Outdoor Thermal Comfort Autonomy: Performance Metrics for Climate-Conscious Urban Design. Build. Environ. 2019, 155, 145–160. [Google Scholar] [CrossRef]
- Yilmaz, S.; Mutlu, E.; Yilmaz, H. Alternative Scenarios for Ecological Urbanizations Using ENVI-Met Model. Environ. Sci. Pollut. Res. 2018, 25, 26307–26321. [Google Scholar] [CrossRef]
- Liao, E.N.; Chehab, L.Z.; Ossmann, M.; Alpers, B.; Patel, D.; Sammann, A. Using Architectural Mapping to Understand Behavior and Space Utilization in a Surgical Waiting Room of a Safety Net Hospital. Int. J. Environ. Res. Public Health 2022, 19, 13870. [Google Scholar] [CrossRef] [PubMed]
- Wang, X.; Wu, C. An Observational Study of Park Attributes and Physical Activity in Neighborhood Parks of Shanghai, China. Int. J. Environ. Res. Public Health 2020, 17, 2080. [Google Scholar] [CrossRef]
- Yan, W.; Forsyth, D.A. Learning the behavior of users in a public space through video tracking. In Proceedings of the 2005 Seventh IEEE Workshops on Applications of Computer Vision (WACV/MOTION’05), Breckenridge, CO, USA, 5–7 January 2005; Volume 1, pp. 370–377. [Google Scholar]
- Peel, M.C.; Finlayson, B.L.; McMahon, T.A. Updated World Map of the Koppen-Geiger Climate Classification. Hydrol. Earth Syst. Sci. 2007, 11, 1633–1644. [Google Scholar] [CrossRef]
- Gu, C.; Sun, C.; Ross, D.A.; Vondrick, C.; Pantofaru, C.; Li, Y.; Vijayanarasimhan, S.; Toderici, G.; Ricco, S.; Sukthankar, R.; et al. AVA: A video dataset of spatio-temporally localized atomic visual actions. In Proceedings of the 2018 IEEE/CVF Conference on Computer Vision and Pattern Recognition, Salt Lake City, UT, USA, 18–23 June 2018; pp. 6047–6056. [Google Scholar]
- Lin, T.-Y.; Maire, M.; Belongie, S.; Bourdev, L.; Girshick, R.; Hays, J.; Perona, P.; Ramanan, D.; Zitnick, C.L.; Dollár, P. Microsoft COCO: Common Objects in Context 2015. In Proceedings of the Computer Vision–ECCV 2014: 13th European Conference, Zurich, Switzerland, 6–12 September 2014. [Google Scholar]
- Kim, H.; Yang, S. Neighborhood Walking and Social Capital: The Correlation between Walking Experience and Individual Perception of Social Capital. Sustainability 2017, 9, 680. [Google Scholar] [CrossRef]
- Zurawik, M. Moving through Spaces—Leisure Walking and Its Psychosocial Benefits for Well-Being: A Narrative Review. Hum. Mov. 2020, 21, 1–8. [Google Scholar] [CrossRef]
- Doughty, K. Walking Together: The Embodied and Mobile Production of a Therapeutic Landscape. Health Place 2013, 24, 140–146. [Google Scholar] [CrossRef]
- Mondada, L. Emergent Focused Interactions in Public Places: A Systematic Analysis of the Multimodal Achievement of a Common Interactional Space. J. Pragmat. 2009, 41, 1977–1997. [Google Scholar] [CrossRef]
- Wessolowski, N.; Koenig, H.; Schulte-Markwort, M.; Barkmann, C. The Effect of Variable Light on the Fidgetiness and Social Behavior of Pupils in School. J. Environ. Psychol. 2014, 39, 101–108. [Google Scholar] [CrossRef]
- Aan Het Rot, M.; Moskowitz, D.S.; Young, S.N. Exposure to Bright Light Is Associated with Positive Social Interaction and Good Mood over Short Time Periods: A Naturalistic Study in Mildly Seasonal People. J. Psychiatr. Res. 2008, 42, 311–319. [Google Scholar] [CrossRef] [PubMed]

Disclaimer/Publisher’s Note: The statements, opinions and data contained in all publications are solely those of the individual author(s) and contributor(s) and not of MDPI and/or the editor(s). MDPI and/or the editor(s) disclaim responsibility for any injury to people or property resulting from any ideas, methods, instructions or products referred to in the content. |
© 2024 by the authors. Licensee MDPI, Basel, Switzerland. This article is an open access article distributed under the terms and conditions of the Creative Commons Attribution (CC BY) license (https://creativecommons.org/licenses/by/4.0/).