Article

Structural Optimization of Trusses in Building Information Modeling (BIM) Projects Using Visual Programming, Evolutionary Algorithms, and Life Cycle Assessment (LCA) Tools

1
Department of the Chair for Digital Engineering and Construction, Institute for Technology and Management in Civil Engineering, Karlsruhe Institute of Technology, 76131 Karlsruhe, Germany
2
Department of Civil Engineering, Faculty of Engineering, Karadeniz Technical University, 61080 Trabzon, Türkiye
*
Author to whom correspondence should be addressed.
Buildings 2024, 14(6), 1532; https://doi.org/10.3390/buildings14061532
Submission received: 29 March 2024 / Revised: 6 May 2024 / Accepted: 18 May 2024 / Published: 25 May 2024

Abstract

:
The optimal structural design is imperative in order to minimize material consumption and reduce the environmental impacts of construction. Given the complexity in the formulation of structural design problems, the process of optimization is commonly performed using artificial intelligence (AI) global optimization, such as the genetic algorithm (GA). However, the integration of AI-based optimization, together with visual programming (VP), in building information modeling (BIM) projects warrants further investigation. This study proposes a workflow by combining structure analysis, VP, BIM, and GA to optimize trusses. The methodology encompasses several steps, including the following: (i) generation of parametric trusses in Dynamo VP; (ii) performing finite element modeling (FEM) using Robot Structural Analysis (RSA); (iii) retrieving and evaluating the FEM results interchangeably between Dynamo and RSA; (iv) finding the best solution using GA; and (v) importing the optimized model into Revit, enabling the user to perform simulations and engineering analysis, such as life cycle assessment (LCA) and quantity surveying. This methodology provides a new interoperable framework with minimal interference with existing supply-chain processes, and it will be flexible to technology literacy and allow architectural, engineering and construction (AEC) professionals to employ VP, global optimization, and FEM in BIM-based projects by leveraging open-sourced software and tools, together with commonly used design software. The feasibility of the proposed workflow was tested on benchmark problems and compared with the open literature. The outcomes of this study offer insight into the opportunities and limitations of combining VP, GA, FEA, and BIM for structural optimization applications, particularly to enhance structural efficiency and sustainability in construction. Despite the success of this study in developing a workable, user-friendly, and interoperable framework for the utilization of VP, GA, FEM, and BIM for structural optimization, the results obtained could be improved by (i) increasing the callback function speed between Dynamo and RSA through specialized application programming interface (API); and (ii) fine-tuning the GA parameters or utilizing other advanced global optimization and supervised learning techniques for the optimization.

1. Introduction

1.1. Importance of Structural Optimization in the Construction Industry

The reliable optimization of complex engineering problems has gained considerable traction with the advent and enhancement of digital technologies and tools, enabling the efficient utilization of artificial intelligence (AI) optimization algorithms at a fraction of the computation cost. This has also allowed the idea of structural optimization to emerge, as obtaining the optimal performance from a structure with minimum weight is one of the main objectives in the architecture, engineering, construction, and operations (AECO) sector [1], particularly to reduce the environmental impact of construction material [2]. In this study, structural optimization is defined as finding the structure with minimum weight while satisfying all code-specific constraints on displacement and strength. This structural design optimization problem is commonly divided into three sub-categories, namely, shape, size, and topology optimization. In shape optimization theory, the outer boundary of the structure or, in other words, the surface node coordinates of the structure, are the design decision variables [3,4]. An example of shape optimization was given in [5], where the authors improved the mechanical performance of free-form-grid structures just by finding the optimal grid placement for the nodes. On the other hand, sizing optimization, which is also referred to as cross-sectional optimization, is another structural optimization branch that concentrates on finding the best cross-section for the structural elements [3] to fulfill the required design performance objectives [6]. As such, the design decision variables are the cross-section type, area, and shape. In fact, considerable improvements have been observed and reported on benchmark truss problems by considering constraints such as structural modal frequencies [7]. Topology optimization encompasses the decision variables of both shape and sizing optimization [3] within the structural optimization problem. However, the structures obtained by this method usually come with higher manufacturing costs due to flexibility in the layout, size, and shape of the structure, which often generates complex geometries. To this end, additional constraints may be added to limit the complexity of the final structure by utilizing a select set of modules for the layout of the structure [8].
Overall, as the relationship between the objective function and the decision variables contains multiple intermediary steps, such as finite element modeling (FEM), it cannot be represented in a closed form [2,9]. As such, AI-based metaheuristic algorithms are commonly utilized to find a near-optimal solution to the structural optimization problem [10]. Among metaheuristic algorithms, the genetic algorithm (GA), a deep-rooted method that mimics evolutionary theory, is one of those widely used among researchers to optimize structures [11,12,13,14,15]. Other metaheuristic algorithms were also employed, such as ant colony optimization (ACO), which mimics the behavior of ants [16]; particle swarm optimization (PSO), a strong metaheuristic algorithm that mimics swarm behavior [17]; and Bonobo optimization, which mimics the behavior of primates [18]. It is reported that the Bonobo algorithm performs better than or competes well against other techniques according to the tests conducted on some truss examples. Further information about metaheuristic algorithms and their implementation can be found in the review article [19].

1.2. Available Tools for AI-Based Structural Optimization in BIM Projects

Although these studies demonstrate the implementation of metaheuristic algorithms in the structural optimization process, scholars tend to use their own programs for the optimization, structural analysis, and structure generation processes. This is because software platforms such as MATLAB (MathWorks, Natick, MA, USA) and Python (used version 3.9.12, open-source, independent) have many built-in libraries to support the implementation of the optimization algorithms. In the recent studies on structural optimization with metaheuristic algorithms reviewed for this section, the referenced manuscripts [20,21,22,23,24,25,26,27] either employed proprietary programs or did not specify the software used for optimization. On the other hand, using MATLAB for structural optimization purposes is common among researchers [2,7,18,28]; however, MATLAB is not open source and is generally not the preferred choice for FEM in the AECO industry for structural optimization. Python is generally more preferred as it is open source [27,29]; however, due to the considerable numerical computational power offered by existing commercially available FEM software, the integration of optimization software together with commercial structural analysis software provides a more efficient solution.
In [30], SAP2000 (Computers and Structures, Inc., Walnut Creek, CA, USA) [31] was employed, instead of coding FEM from scratch, to conduct structural analysis during the optimization of large steel-frame structures, particularly to reduce the cost and weight of oil and gas modules. The shape and size optimization of large barrel-vault frames was carried out in [32] by employing SAP2000 via an open application programming interface (OAPI). An integration between MATLAB and SAP2000 using OAPI to optimize steel-truss bridges with the aim of minimizing weight was investigated in [33]. An integration between MATLAB and ANSYS (ANSYS, Inc., Canonsburg, PA, USA) was proposed in [34], where the efficiency of different GA operators to perform topology optimization on a benchmark truss structure problem was evaluated. Another pertinent example is the integration of visual programming (VP) software to support the parametric design of the structure. In reference [35], Rhino-Grasshopper (Robert McNeel & Associates, Seattle, WA, USA), a BIM-based VP tool, was utilized together with Karamba (Karamba3D GmbH, Vienna, Austria), a plug-in to Rhino for structural analysis, to perform optimization by employing GA operators. Along the same lines, manuscript [36] utilized Grasshopper to create geometry and developed a tool in C# to transfer the structure to SAP2000 to perform topology optimization. Grasshopper, together with Peregrine (LimitState, Sheffield, UK) plug-in, were employed to perform layout and geometry optimization methods in sequence for optimum designs in [37]. Furthermore, a framework that utilizes Dynamo (Autodesk, San Rafael, CA, USA) for Visual Programming and OpenSees (UC Regents, Pacific Earthquake Engineering Research Center, CA, USA) for measuring structural performance by using the FEM of the created models was proposed in [38]. Another study [39] explores the efficacy of VP technology in structural design, particularly through Dynamo. The study highlights VP’s effectiveness in creating complex geometries and its seamless integration with BIM systems like Revit (Autodesk, San Rafael, CA, USA) and Robot Structural Analysis (RSA) (Autodesk, San Rafael, CA, USA). The opportunities that come with VP, such as generative modeling and optimization, are also mentioned in the study. However, there are no numerical examples or applications in that area, which our current study aims to fulfill.
Although much research in the field has been carried out, a stand-alone and interoperable framework that utilizes VP, FEM software, and AI-based optimization in BIM projects still requires further investigation. As such, this study examined the application of combining interoperable Autodesk platforms, including VP software, Dynamo (used version 2.17.0.3472); BIM tool, Revit 2024 (used version 24.1.11.26); and FEM software, RSA 2024 (used version 37.0.0.10095), with a Python-based GA algorithm that was developed as a function directly within Dynamo. To the best of the authors’ knowledge, no benchmark problem has been optimized using this proposed method and compared with other results found in the open literature. Moreover, due to the enormous amount of CO2 emissions from the AECO industry, along with increasing interest in sustainable development, reducing environmental impacts has recently become another key goal of governments. This interest has become a driving force for countries to adopt BIM, as recent studies show that BIM-based design, construction, and management have the potential to support sustainability in construction [40,41]. The hypothesis was that this approach, due to the inherent interoperability between the Autodesk software platforms, might reduce possible computational overheads and/or loss of information between different information modeling platforms and address the existing gaps. In other words, the design is parameterized once in Dynamo, is optimized using GA and RSA, and is directly transferred into Revit (with no additional tools) for further simulations and engineering analysis, such as life cycle analysis (LCA), quantity surveying, and cost estimation. Furthermore, the Autodesk software platforms are well-established within the AECO industry and the free educational access available for students and educators enables its possible widespread use for teaching, training, and industry transfer. Thus, this study focused on creating a workflow that integrates Revit-Dynamo with RSA to create a robust, efficient, and user-friendly environment to use structural optimization methods. The results were tested in available benchmark problems such as 2D 10-bar, 3D 36-bar, and 3D 120-bar dome trusses and compared with the results reported in the open literature to demonstrate the applicability of the proposed framework. Moreover, the interaction with Revit has also been established for further analysis of the optimized structures, particularly in LCA and cost estimation. Integration with parametric modeling tools, FEM analysis software, and BIM for optimization purposes enables the seamless transfer of knowledge between different platforms and different team members through a common data environment (CDE).

1.3. Scope, and Objective of This Study

This study focuses on creating a workflow for the AECO industry to create sustainable, affordable, and nature-friendly designs. By using optimization, lower weight designs that are more functional can be constructed, which will be of vital importance for countries that have limited sources, resulting in reduced expenses and embodied CO2 [42]. It is necessary to mention that the objective of this study is not to develop the best genetic algorithm and the most efficient code or to improve the existing optimization algorithms. Although better algorithms and codes can be developed and readily implemented into the proposed script, these issues are beyond the scope of the present research. Numerical examples are presented to only show the adaptability of the proposed workflow.
Furthermore, the scope of this research is limited to the problem of size optimization for steel-truss structures, and the aim of the numerical examples is to select appropriate options from a list of real-world section criteria to minimize the weight of the truss while satisfying constraints (e.g., stress, displacement, and buckling). In this aspect, the sizing optimization problem investigated here resembles the combinatorial Knapsack Problem [43]. As GA has been shown to effectively provide a fast and heuristic solution to the Knapsack Problem, it was used here to provide a solution to the sizing optimization problem.

2. Methodology

2.1. Preliminaries

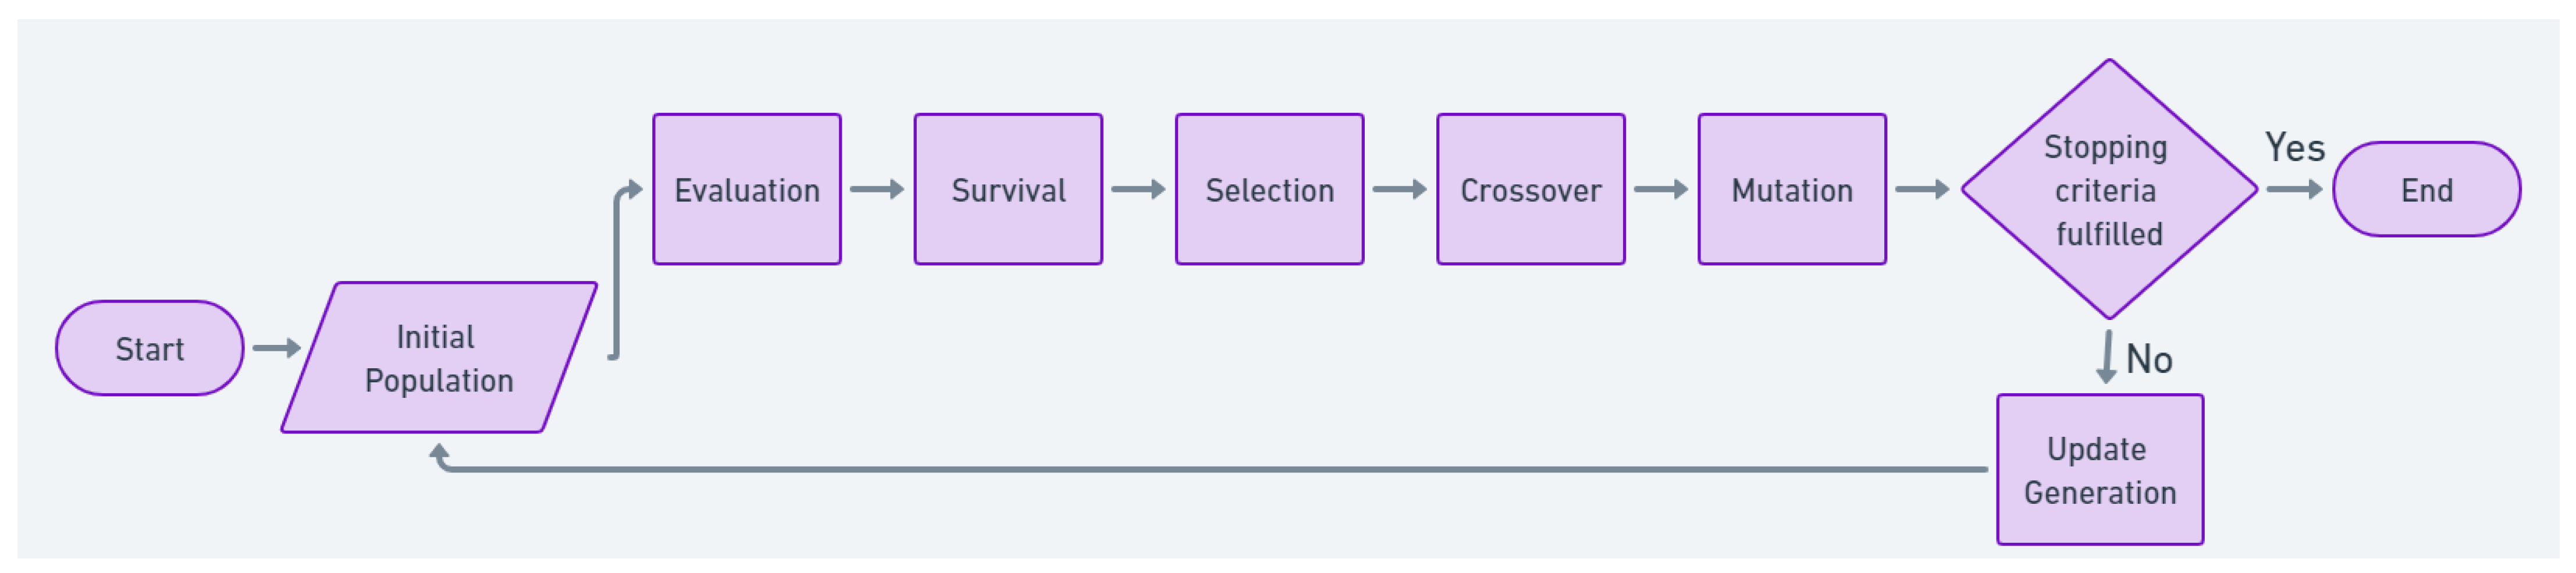
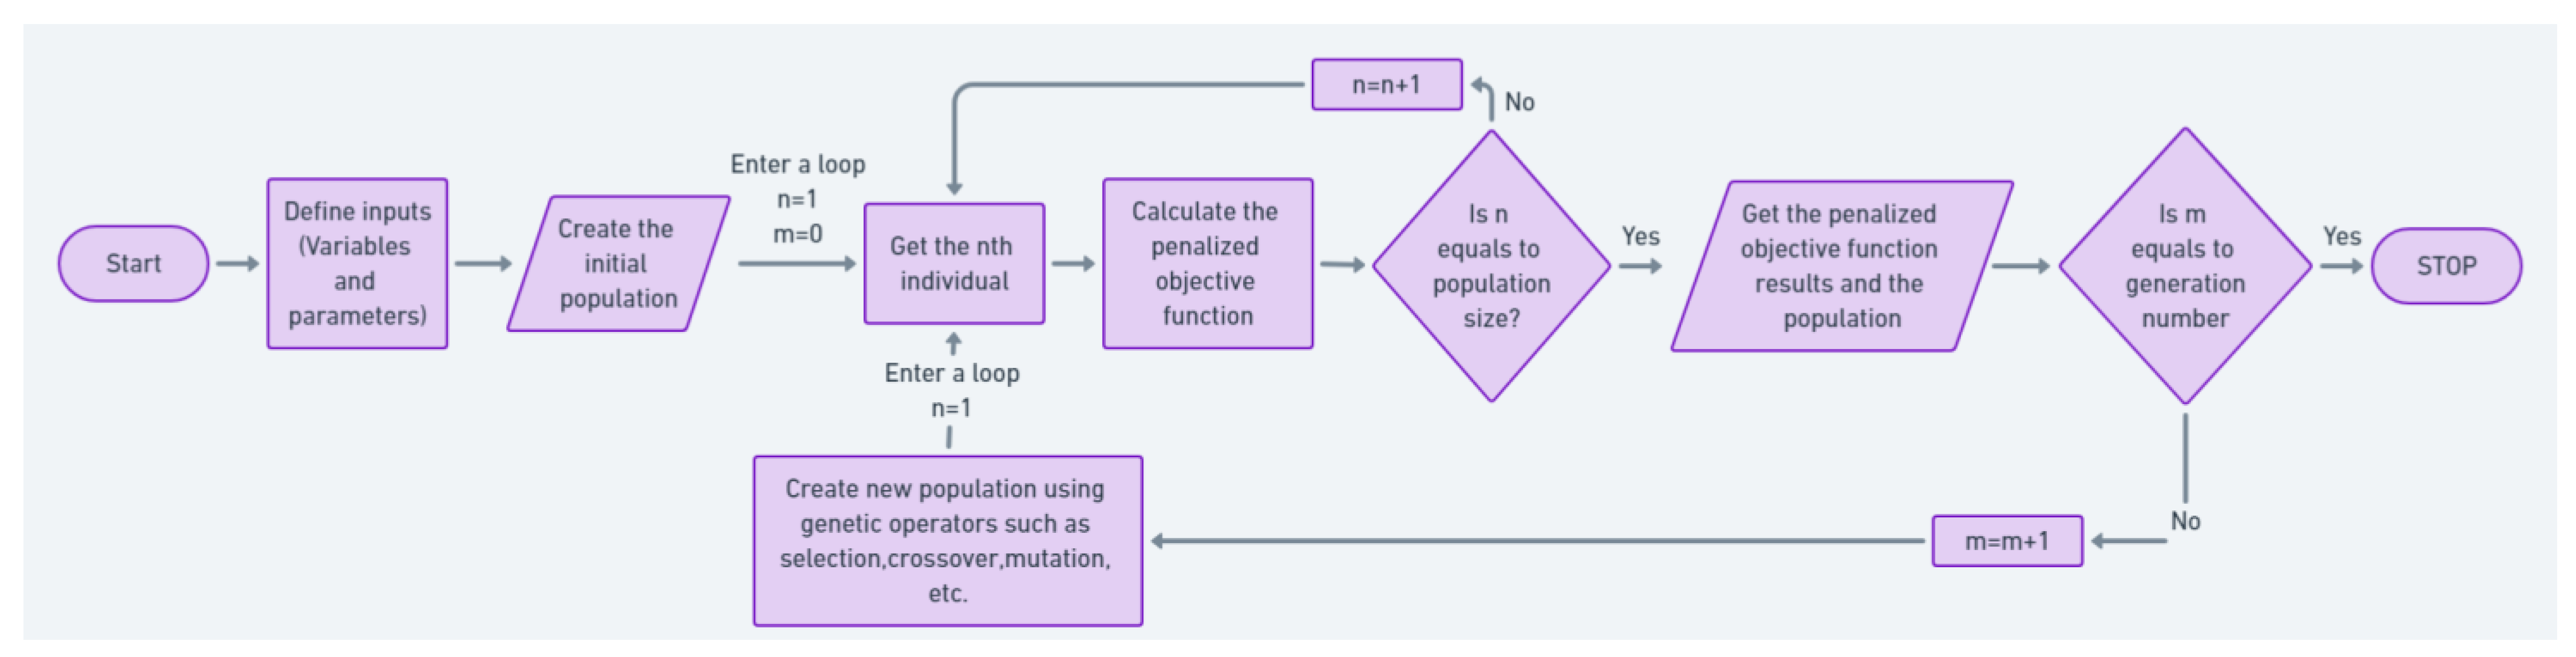
2.1.1. Genetic Algorithm

English naturalist Charles Darwin transformed our understanding of life through his exploration and the concept of natural selection in his famous book, “On the Origin of Species”. He introduced natural selection as a metric for the resilience of species/organisms to adapt to changes in their environment and evolve accordingly [44]. In evolutionary theory, traits are established by chromosomes, which consist of groups of units called genes. The genes can pass on these traits to their offspring through a process referred to as crossover [45]. The algorithms that use these logics and mimic similar evolutionary processes are called Evolutionary Algorithms (EA). GA, which is a type of EA, starts by introducing an initial set of gene populations, identifying their objective fitness values, selecting the best genes and performing cross over and mutation, and generating a new population for the next generation [12]. In trivial terms, the process aims to keep the genes with the best fitness values and create new combinations from these best genes to generate even better solutions in successive generations. Figure 1 demonstrates the basic tenets of a simple GA.
In this study, the evaluation of numerical examples to validate the proposed workflow was performed using GA through the PyMoo (version 0.6.1, open-source, independent) library [46] due to its efficiency, simplicity, robustness, and optimization capabilities for combinatorial optimization problems [47,48]. The selected GA operators were as follows: (i) integer random sampling with duplicate elimination; (ii) tournament selection; (iii) simulated binary crossover (SBX) with a probability value set to 1; (iv) polynomial mutation (PM) with a probability value set to 1; and (v) fitness survival. The termination criterion was controlled by limiting the generation number. Further parameter tuning (outside of the default PyMoo library settings) is provided in Section 3.1. It should be mentioned here that the choice of GA was purely practical, due to its simplicity and effectiveness in solving popular combinatorial optimization problems such as the Knapsack Problem. As such, GA was used only as a tool for validating the workflow. In fact, it is possible to achieve better results either by fine-tuning the existing GA parameter settings, or by employing other algorithms, such as PSO, ACO, or the more recent Jaya optimization. However, these topics are subjects for future research following the establishment of the methodology proposed in this manuscript.

2.1.2. Formulation of the Truss Optimization Problem

As mentioned above, the goal of the proposed design is to optimize (minimize the weight of the structure (W) under multiple constraints) solutions to problems of truss structure with the proposed workflow. Consequently, the weight of truss structures is chosen as an objective function. The problem under consideration in this study can be defined mathematically as follows:
min f x = n = 1 m ρ j A j l j ,
where ρ j is the density of the material, A is the cross-sectional area of the member, and l j is length of the member. As can be seen in the above-mentioned formulation, the weight of the overall structure is taken as the objective. Because GA is ideally used for unconstrained optimization problems, it is necessary to convert the problem into an unconstrained one before starting the optimization process [49]. The transformation is performed by calculating the violations made on the constraints. These violations are penalized by the penalty term, which affects the objective function that directs the search for workable solutions [12]. Rajeev and Krishnamoorthy [12] proposed a formulation based on the violation of normalized constraints in the referenced paper, and it was found to work very well among scholars [20]. Therefore, in this study the same methods have been used to calculate objective functions. In Equation (2), the basic formulation of the proposed methodology is presented as follows:
( x ) = f x ( 1 + KC ) ,
where f x is the objective function and K is a coefficient that is determined by the type of problem. For this study, a value of 10 was chosen for K based on the findings in the referenced manuscript [12] as it has been found to work well for truss optimization problems. In situations where the design fully satisfies the constraints, the coefficient is set to a higher value, and heavier penalty values are assigned to solutions that make only a slight infringement on the constraints. This approach ensures that the constraints are not violated while the search for solutions continues. In engineering designs, minor deviations from the constraints are often acceptable [12]. In such cases, when the main objective is to minimize the weight of the design, a smaller coefficient can be used. This allows for the exploration of solutions with lower weight without including individual solutions that have extreme levels of constraint violation [12]. This approach helps to strike a balance between not violating the constraints and achieving a lighter design. C is the violation coefficient, which is calculated based on the violation of constraints. The constraints are formulated in normalized form, as demonstrated by the following formulas [12]:
g i ( x ) = ρ j   ρ a 1     0 ,             g i ( x ) = u j   u a 1     0 ,
where ρ j is the stress value on the element and ρ a is the allowable stress. Similarly, u j is the displacement on the nodes and u a is the allowable displacement. The violation coefficient C is determined in the following way: if gi(x) > 0, then ci = gi(x); or if gi(x) ≤ 0, then ci = 0 [12].
C = j = 1 m c j
where m = the number of constraints. After the constraint adjustment, the problem reduces into an unconstrained optimization problem with the new objective function, ∅(x) [12].

2.2. Proposed Framework

The overall methodology consists of the following steps:
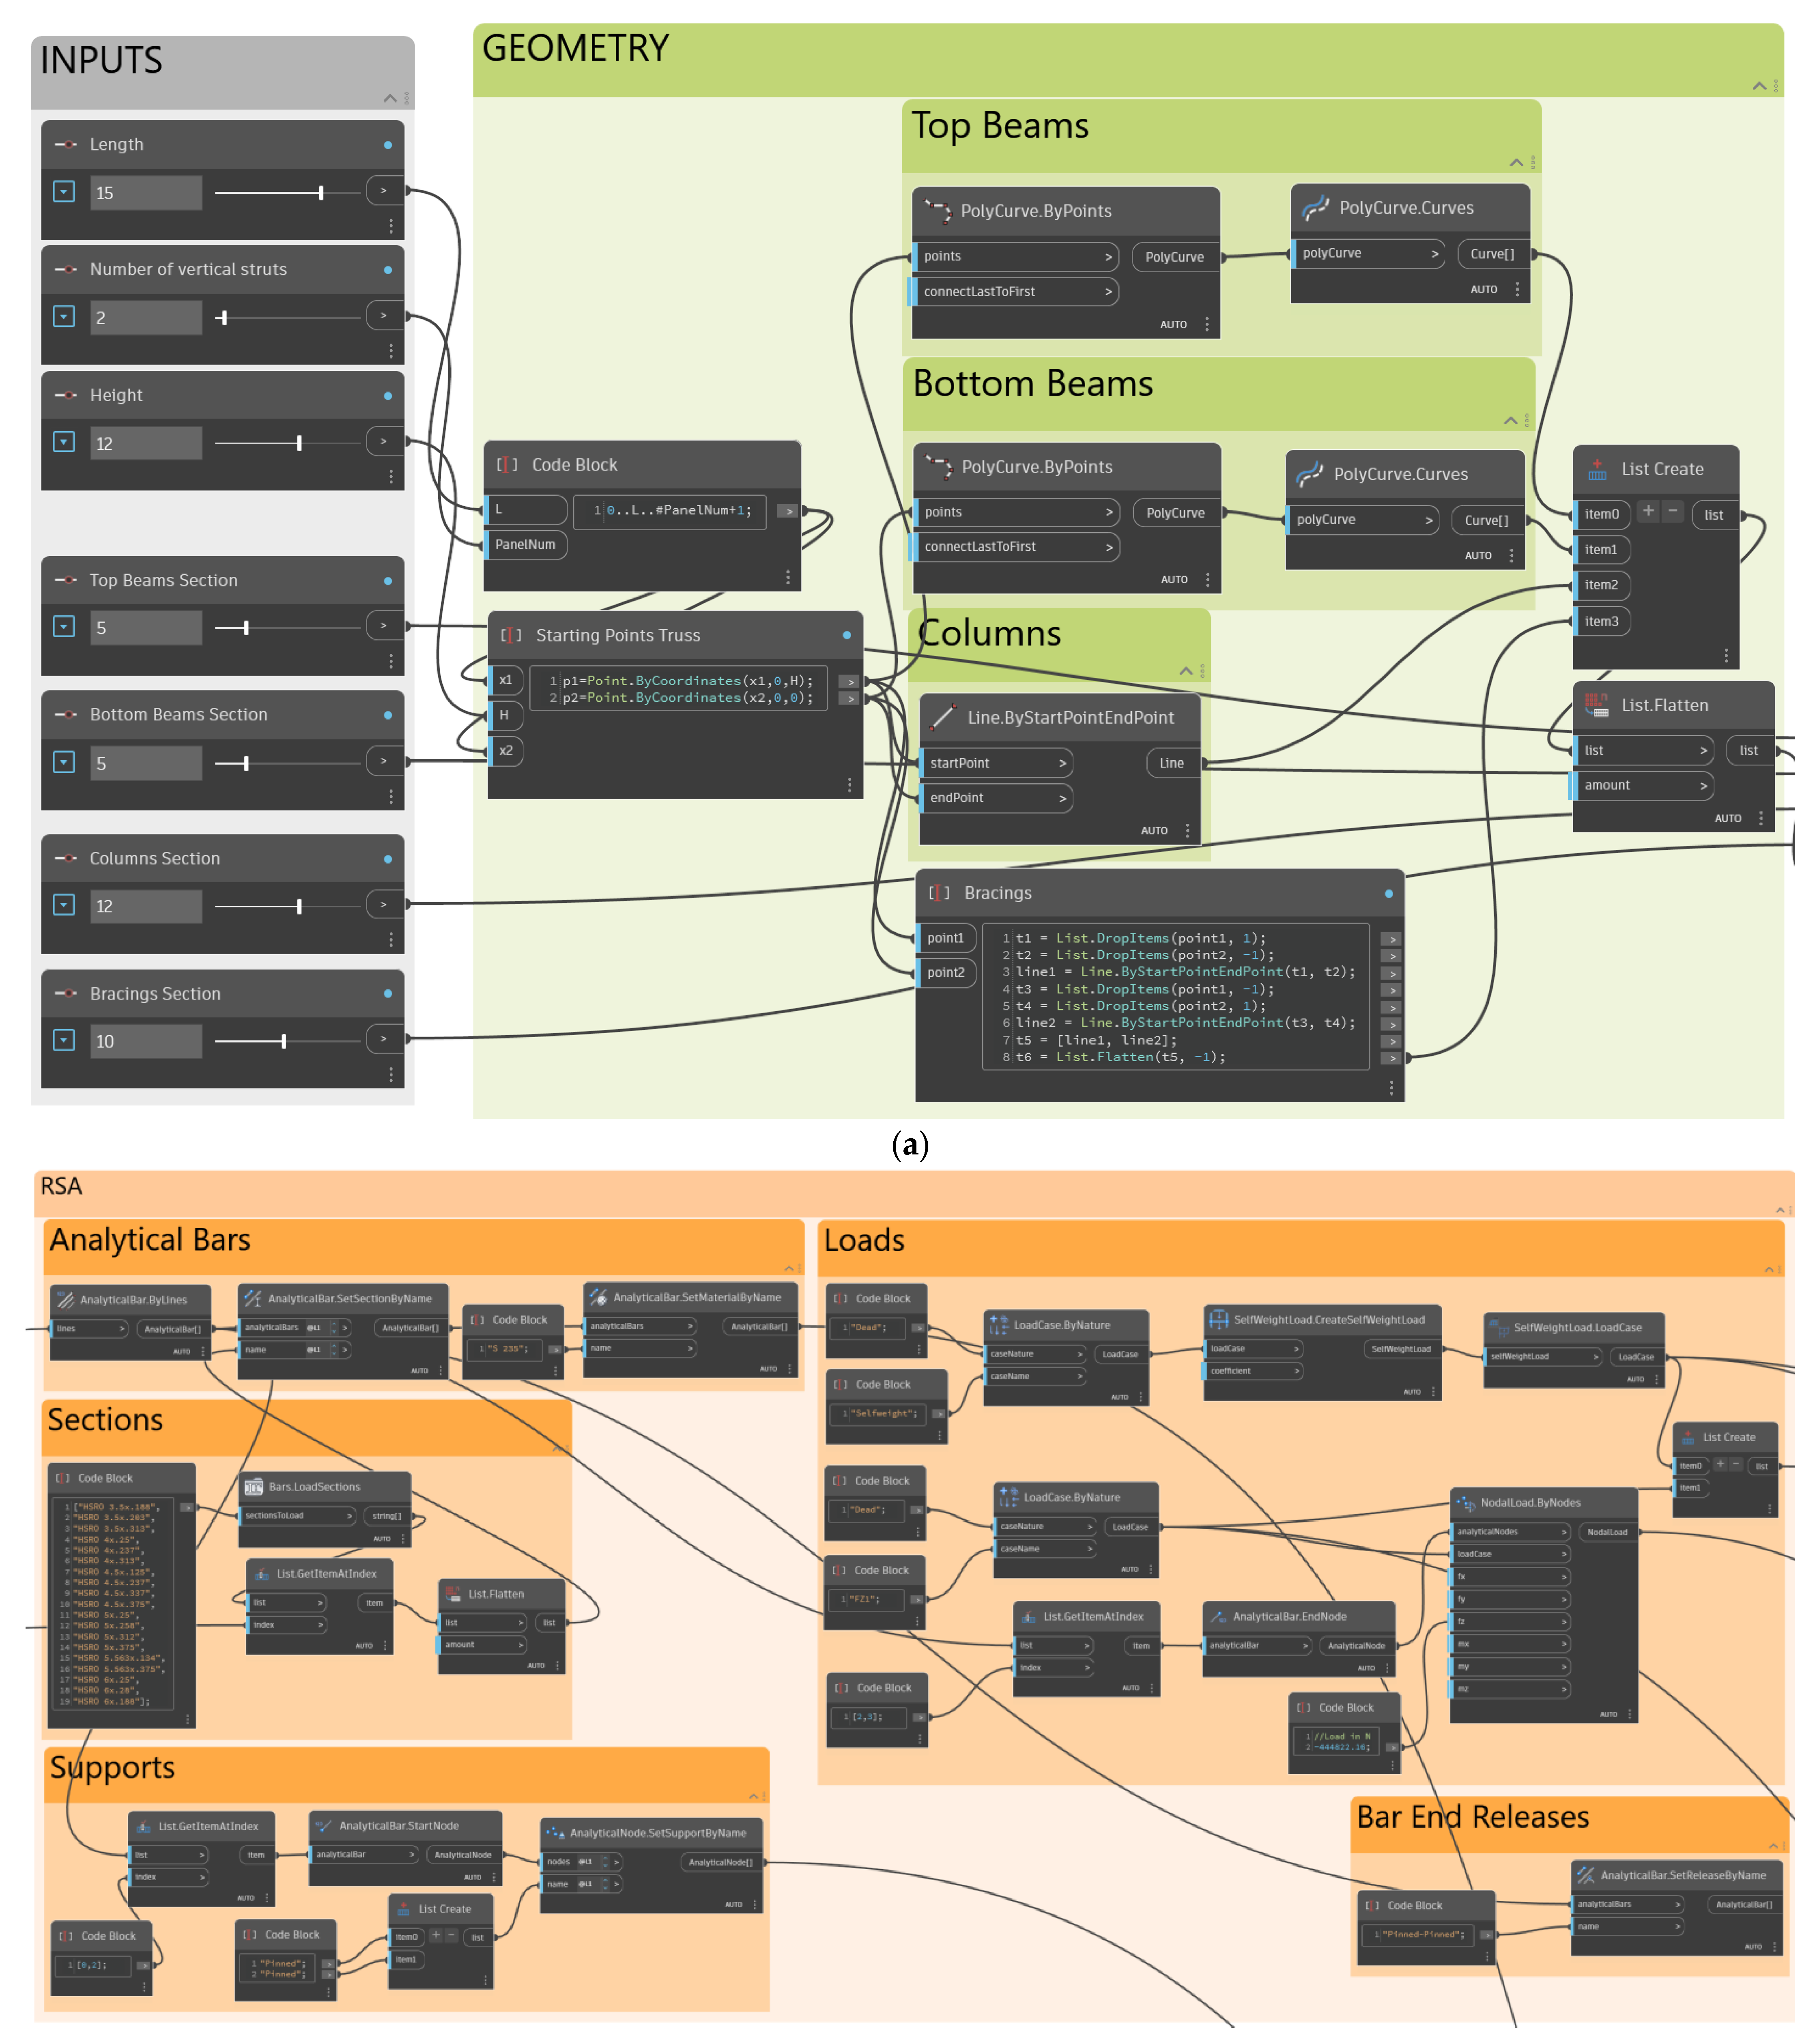
  • Create parametric trusses by using visual programming (Figure 2a);
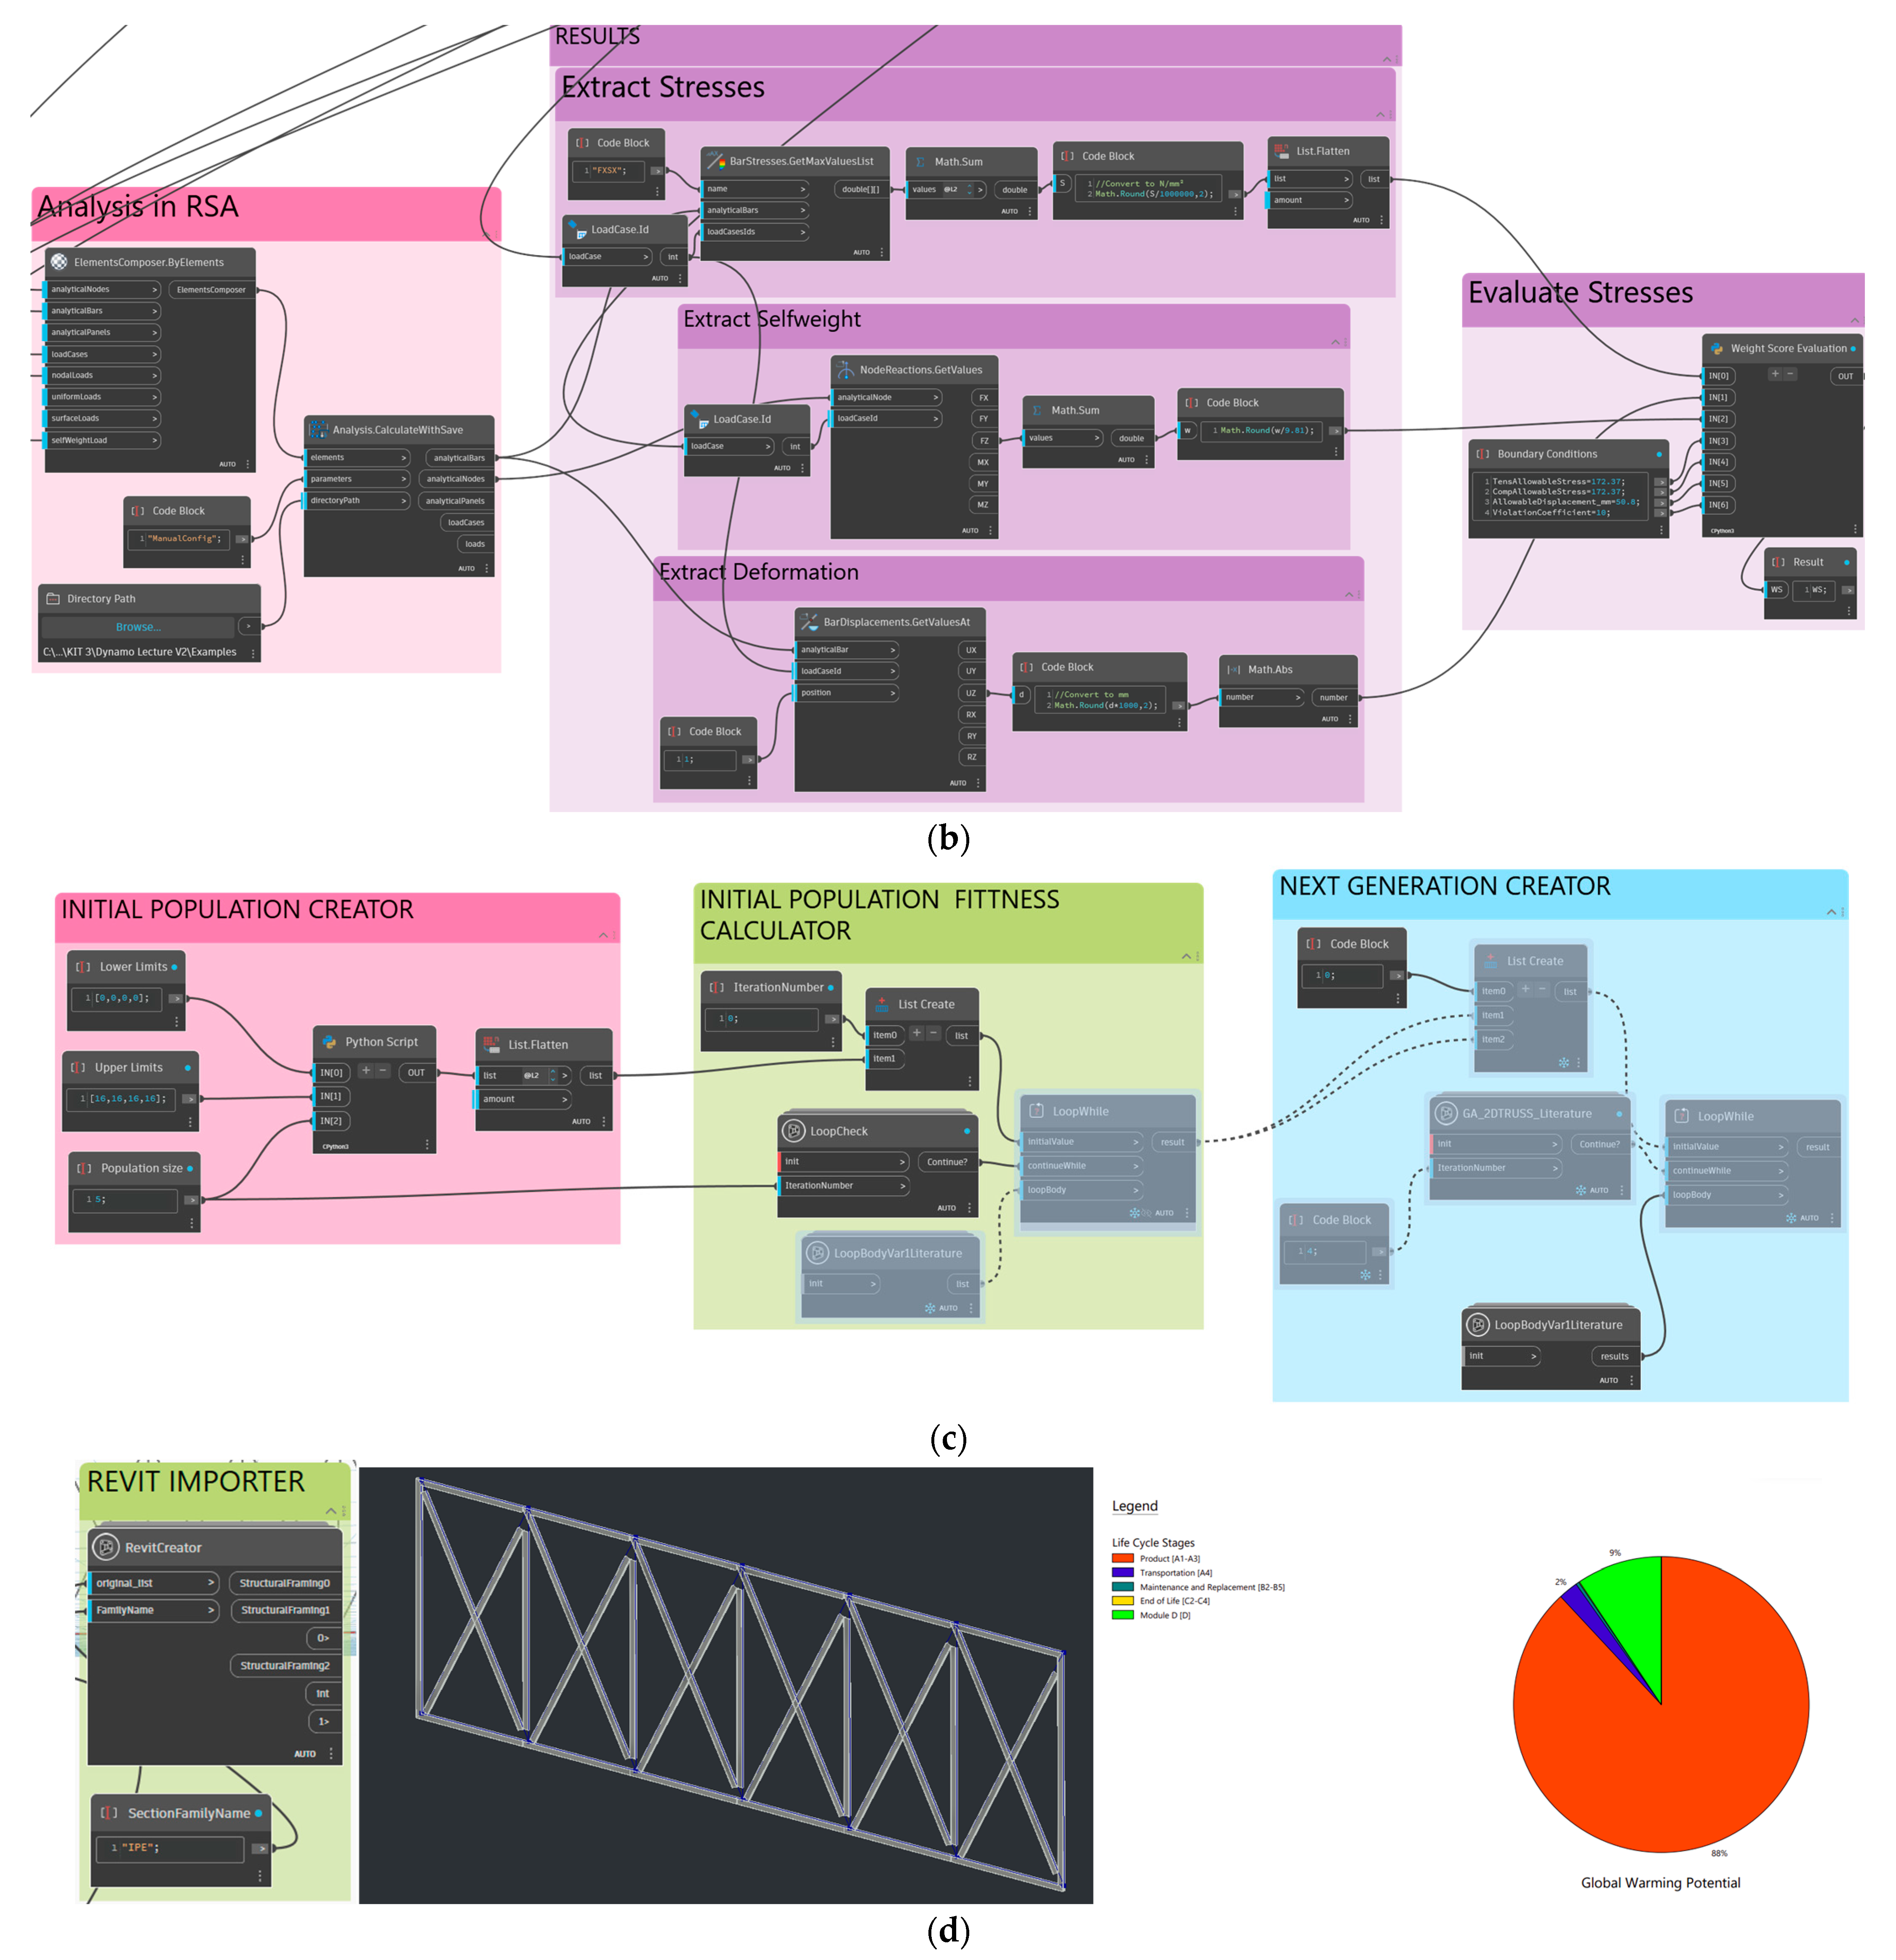
  • Perform structural analysis on RSA and retrieve the results through Dynamo (Figure 2b);
  • Perform the first two steps in a loop along with GA operators to reach an optimum design (Figure 2c);
  • Import the optimized model on Revit to perform further enhancements such as LCA, cost analysis, etc. (Figure 2d).
The overview of the proposed workflow in this study is presented as a flowchart in a simplified form in Figure 3.

2.3. Parametric Model Creation

There are two common techniques used to write computer programs, namely VP and textual programming. The one in which graphical elements and visual syntax such as blocks, nodes, or diagrams are used to create program logic and flow is called visual programming. As it requires no significant syntactic knowledge, it can be quite user-friendly and suitable for beginners. Consequently, VP has been used in this study for modeling through Dynamo. Figure 2a illustrates the use of a number–integer slider, or code block nodes, to specify various parameters such as truss height, truss length, the number of vertical struts, section indexes, truss type, etc. These values are all expressed in millimeters (mm), aligning with the Project Unit setting in RSA, and can be determined as design variables. For this study, only sections are considered as design variables. To create a truss structure, the analytical nodes need to be defined. This can be achieved by either entering the code text “Point.ByCoordinates(0,0,0)” in the code block or utilizing the “Point.ByCoordinates” node. These points were then connected using the “PolyCurve.ByPoints” node, forming the elements of the truss structure. This section must be updated whenever different trusses need to be optimized.

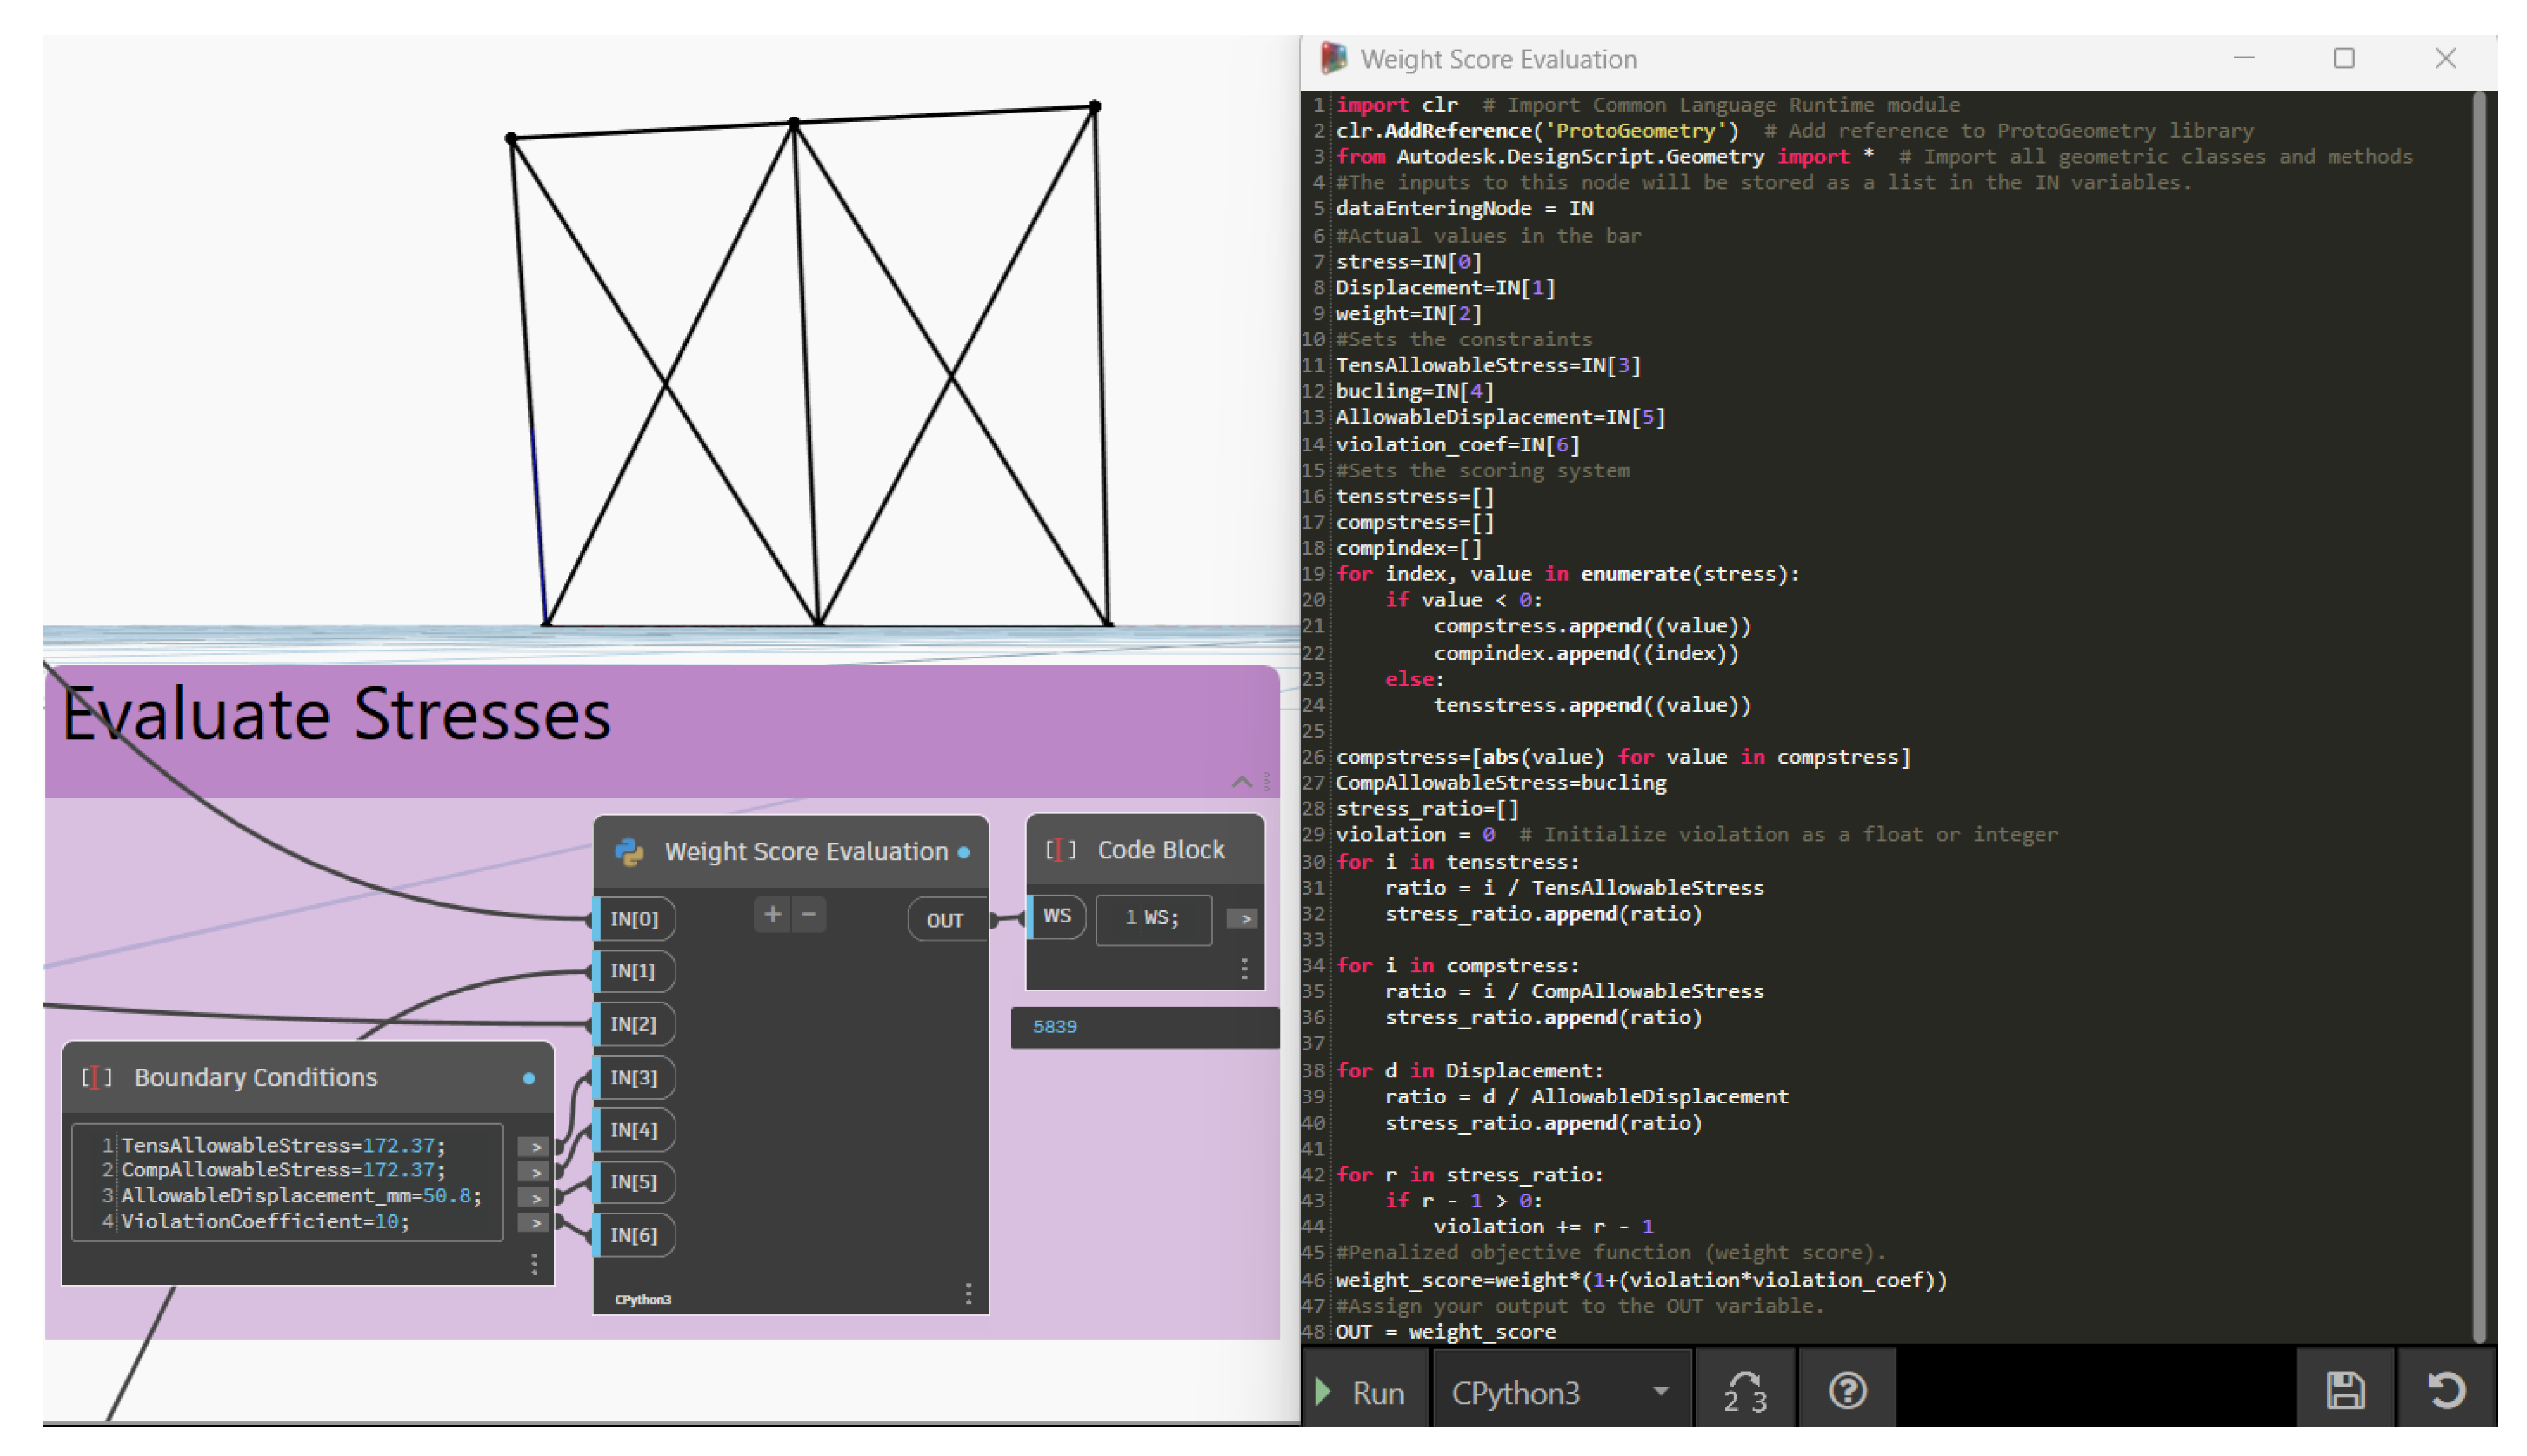
2.4. Calculation and Retrieval of Results

Performing structural analysis is an essential step for structural optimization workflow. Although it is not reliable, many scholars use their own program or third-party libraries for this step, as explained in the introduction section. In this study, an interaction has been established between Dynamo and RSA through the Structural Analysis for Dynamo (version 3.0.10) package, which enables the creation of geometry and the assignment of simulation criteria, such as supports, loads, and sections, based on the geometrical input in Dynamo. To create the analytical members, the lines created in the previous section need to relate to the “AnalyticalBar.ByLines” node from the mentioned Dynamo package. Once the bars have been created, sections and materials must be assigned to the created bars. Thereafter, supports, bar-end releases, and loads must be defined as illustrated in Figure 2b.
Dynamo drives the analysis process in RSA by using the “Analysis.CalculateWithSave” node. The information (analytical model, support and releases, and load cases) that has been created in the previous section needs to be connected to this node. This node performs the analysis and saves the model at a specified location (Figure 2b). Subsequently, stresses, weight of structure, and displacements are needed for the calculation of the penalized objective function. To obtain the maximal stress for each bar, the “BarStress.GetMaxValuesList” node is utilized. For maximal values of displacement on the joints, the “BarDisplacement.GetMaxValuesList” node is utilized. The last parameter that needs to be obtained for the weight score is the “selfweight” value of the structure. This can be achieved by using the “NodeReactions.GetValues” node and extracting the “FZ” results for the load case labeled as “Selfweight”. Evaluating the penalized objective function of each design option is crucial for ranking the fitness of designs in structural optimization. That is why the last part of the script evaluates penalized objective functions by considering constraints as explained in detail in the background section. This process is implemented in the VP environment with the help of Python script as presented in Figure 4.

2.5. Structural Optimization

To perform size optimization, section indexes can be set as design parameters. This is how the algorithm will try to find the best parameters for those inputs. The feature that allows users to do this is parametric modeling, because as soon as an input is updated, a new model is automatically created and FEA can be performed for the new model. Optimization works by running the steps explained in the previous section in a loop. To do this, a custom node and the “LoopWhile” node have been used. By creating a custom node, all of the nodes from Figure 2a,b are consolidated into a single core node. This core node is central to all analyses. It takes the parameter to be optimized through its import port and, in turn, outputs the penalized objective function results. This process occurs repeatedly, ensuring continuous optimization. Henceforth, an initial population is needed for optimization. Thus, a Python script has been prepared to create a random initial population by defining lower–upper limits for solution sets, population size, and chromosome length. After creating initial populations, the outputs are connected to the “LoopWhile” node to process the steps as explained above. Figure 2c illustrates the nodes necessary for this operation. There are two custom nodes in this figure, which are “LoopCheck” and “LoopBodyVar1”. The “LoopCheck” node allows the definition of the stopping criteria by taking the iteration number and comparing it to the input number. As soon as the iteration number exceeds the input number, a stop signal is sent to the “LoopWhile” node and the loop ends. Subsequently, every individual in the initial population list must be sorted based on their penalized objective function results.
The parents that will create the succeeding generation of the population by GA operators are selected by using the obtained penalized objective function that results from the initial population and binary tournament selection. Individuals with smaller objective function values are selected as the parents while the other individuals are not selected, and their genes are eliminated. This process is repeated by the next generation creator node group shown in Figure 2c until a goal is met or a certain number of generations have been produced. The “LoopBodyVar1Literature” custom node contains two Python scripts and the same nodes from the initial population fitness calculator node group as illustrated in Figure 5. First Python code uses GA operators such as selection, crossover, mutation, etc. to create new populations. Second Python code, on the other hand, performs like another selection operator of GA and chooses the best combinations from parents and children.

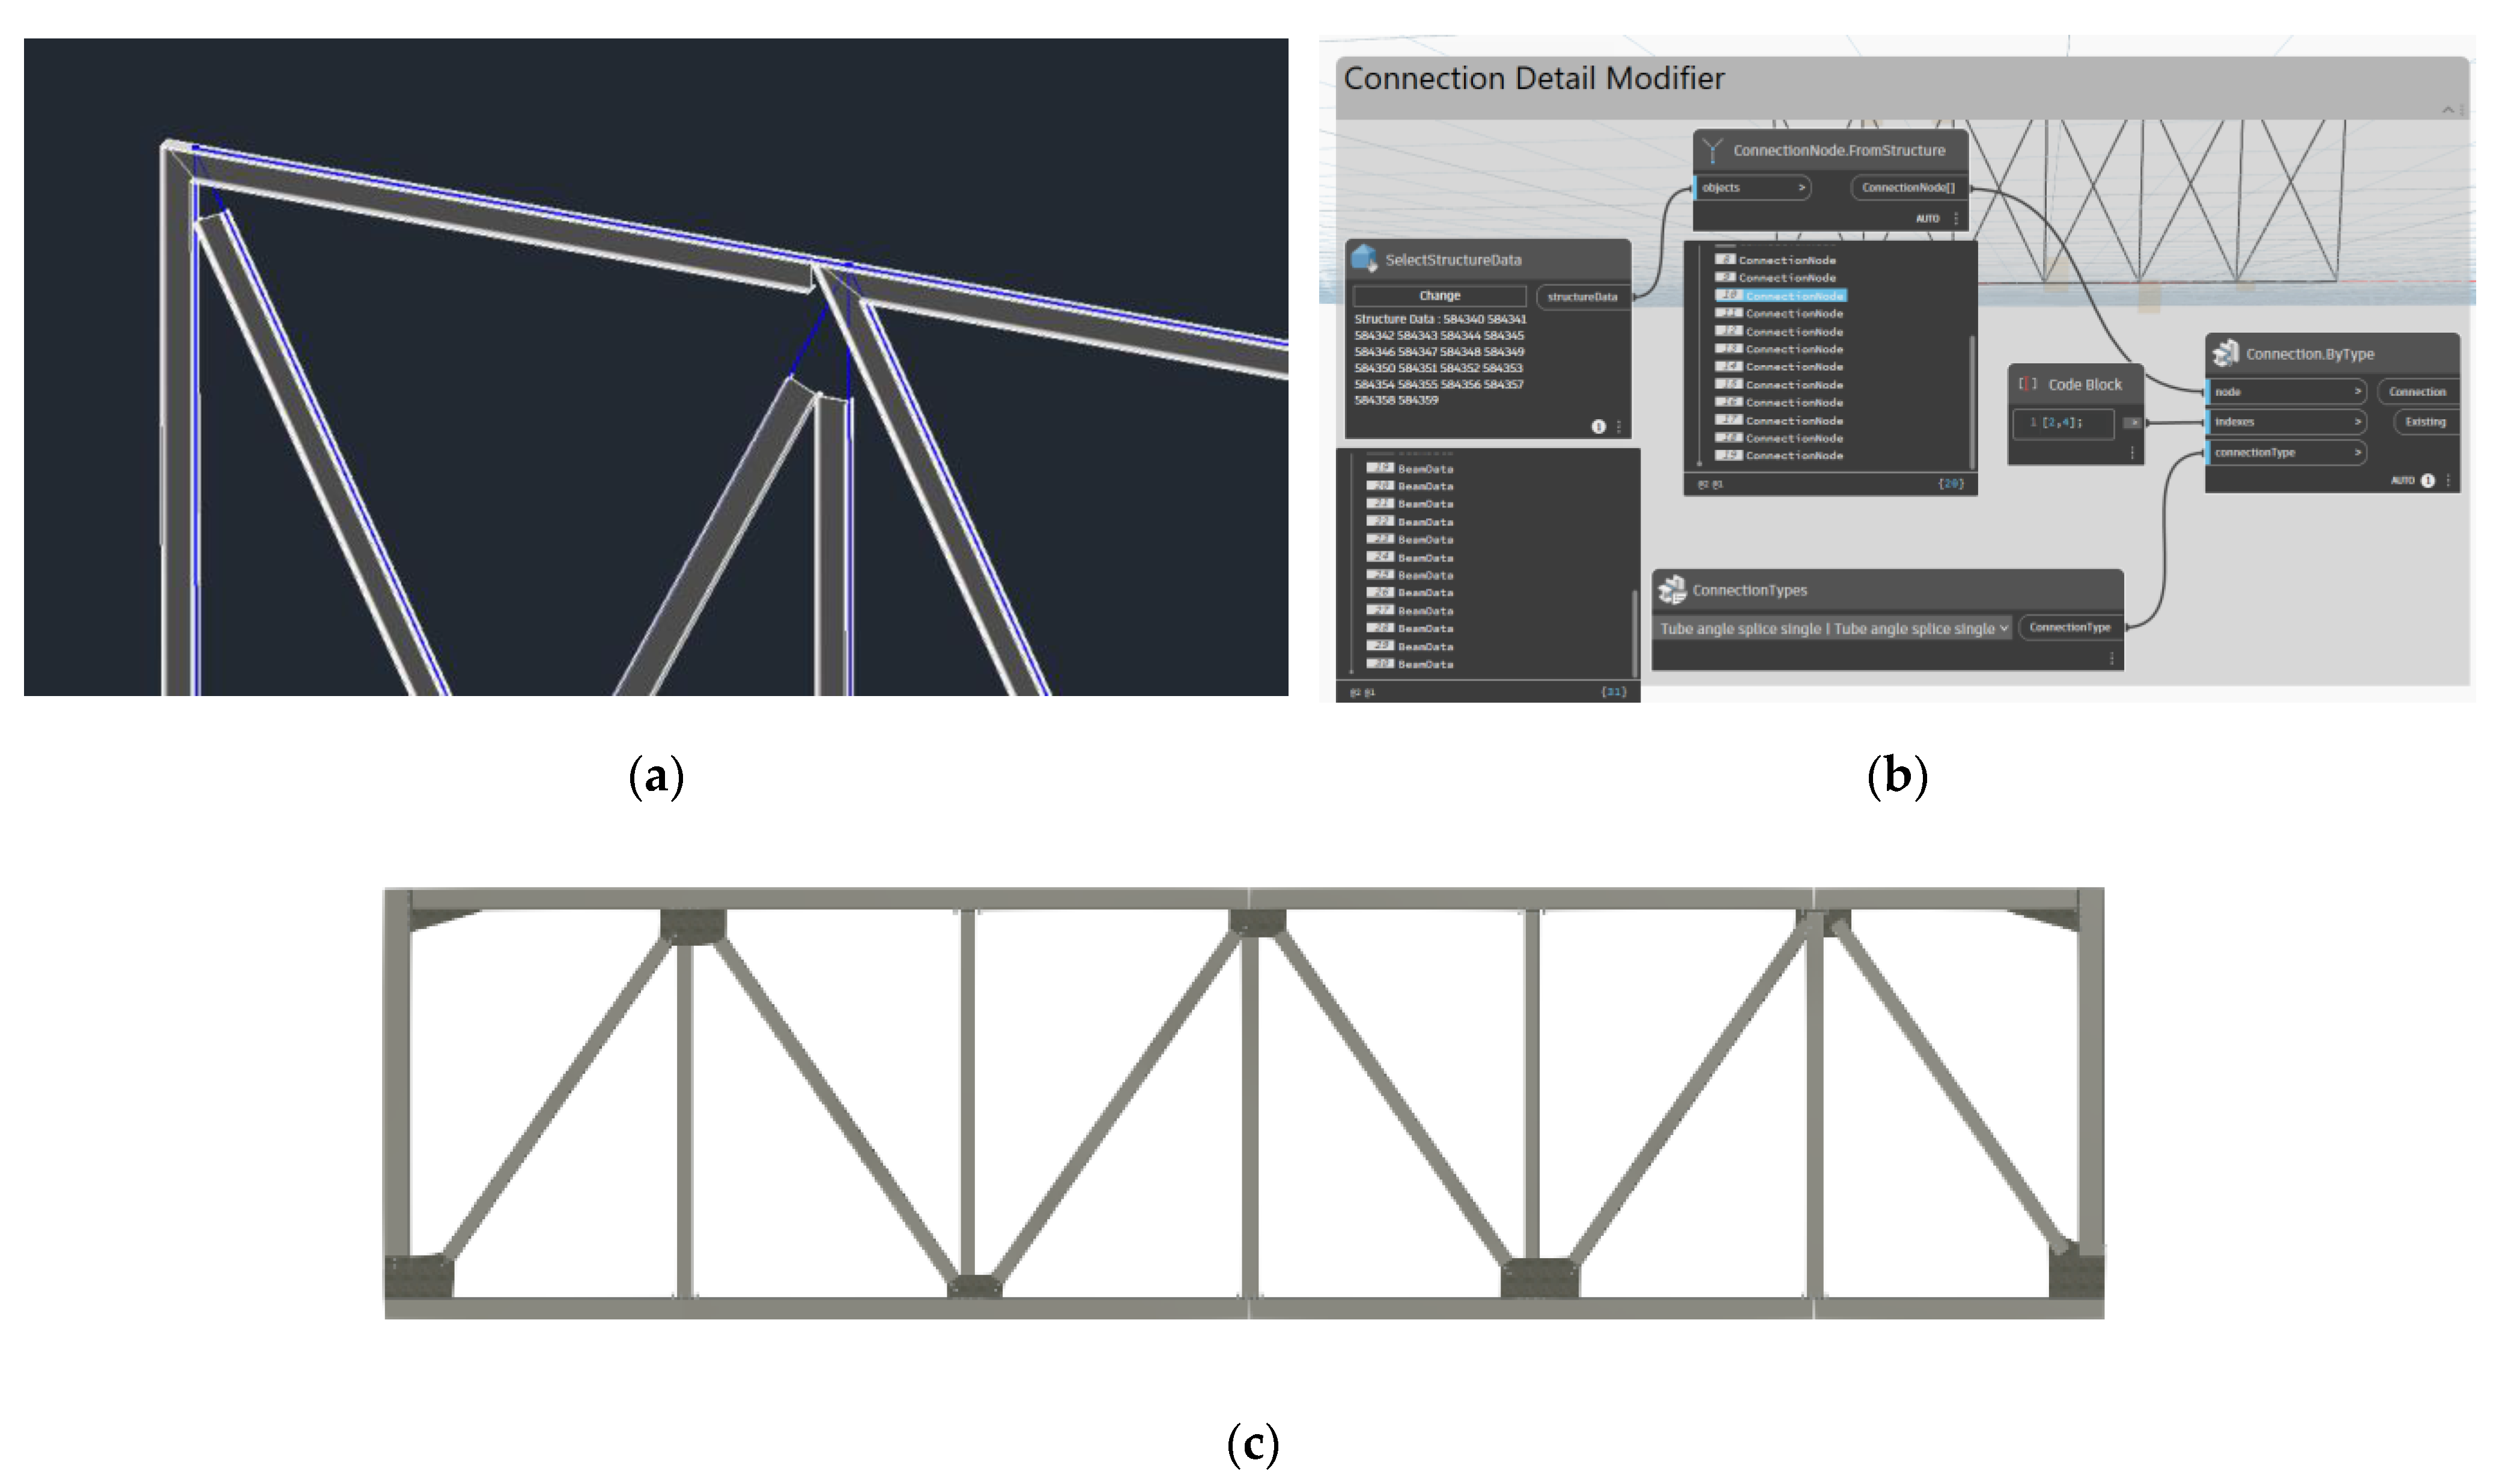
2.6. BIM Integration

In this section, some advantages of using the BIM environment in the optimization process are described and some examples are given. Integration of BIM and AI-based metaheuristic search algorithms for the optimization of designs in the AECO sectors will improve the project-creating process by generating multiple optimized design alternatives and providing detailed reports about the project. Consequently, architects and engineers can give more time to different aspects of a project and encourage innovation in their field by utilizing automation and streamlining repetitive tasks. For this, Revit’s features can be utilized by exporting the optimized model to Revit by employing the Dynamo script and the “RevitCreator” custom node (Figure 2d). The structure following importation of the truss model into Revit is shown in Figure 6a. Prior to creating the model on Revit, cost and LCA analyses can be performed along with arranging connection details. Revit allows users to design connections and prepare more detailed models. This can be performed in two ways. One, choosing the connection points manually on Revit, under the “structure tab”, on the “assembling steel connections” menu. Another way is doing all of these steps parametrically with the help of Dynamo. In this study, to show the capabilities of BIM and Dynamo, this process is performed parametrically on Dynamo by employing the script presented in Figure 6b.
Furthermore, Revit allows the user to utilize add-ins such as “Tally”, which employs contribution assessments to illustrate the environmental impacts of products or components in construction, considering factors such as ozone depletion, acidification, and global warming potential by performing LCA analysis, which gives an opportunity to the AEC specialist who wishes to build an environment-friendly and sustainable design by performing a study on the project and providing a detailed report about the materials. Additionally, it provides focused views of global warming potential and embodied energy through graphics and charts, aiding designers to compare specific assemblies and components. Examples are provided in the upcoming Results section.

3. Results

This section presents the numerical outcomes for several test problems. A comparison is made between the solution obtained from this study and solutions derived from various studies found in the open literature. These problems are solved within the proposed framework using a computer with an Intel(R) Core i7-6700HQ CPU and 16.0 GB Installed RAM. Unlike studies in the literature, sections that exist in real-world applications have been considered as design variables to increase the adaptability of the proposed workflow for real-world examples. The average time spent on 100 analyses is approximately 2 h. It is assumed that this time will be reduced by a computer having better hardware properties. All scripts and corresponding Python code, along with animations, and instructions are conveniently provided in the respective dedicated GitHub repository for this study [50].

3.1. Experimental Setup

Three different benchmark problems have been examined for validation of this study, namely, the 10-bar-2D-truss problem (adopted from [12]); the 36-bar-3D-truss problem (adopted from [51]); and the 120-bar-3D dome truss problem (adopted from [52]). The referenced studies offer the theoretical bases for the constraints, along with the geometric dimensions. According to the referenced manuscripts, the stress member limit, along with the displacements, were as follows: (i) 172.25 MPa, and 50.8 mm, respectively, for the 10-bar truss; (ii) 172.25 MPa, and 50.8 mm (for node 4 in both negative z and y direction), respectively, for the 36-bar truss; and (iii) 240 MPa, and 10 mm (for every node in the structure in the negative z direction), respectively, for the 120-bar truss.
The 10-bar truss example is a standardized test case in the field of structural optimization for those who want to evaluate and validate the effectiveness of proposed optimization techniques, and it is frequently used as a benchmark problem by researchers [12,14,53,54]. The geometry, support requirements, material properties, and boundary conditions for this 2D-hanging truss, which is shown in Figure 7a, have been adopted from the referenced study [12]. A discrete list that contains 41 cross-sectional areas has been sourced from the American Institute of Steel Construction (AISC) and imported to RSA from the AISC database (AISC Edition 15.0 American hot rolled shapes). The HSRO (Hollow Structural Round Sections) family was used during the optimization. Detailed information about importing databases and using different section properties can be found on the referenced website [55]. Population size and generation number have both been determined as 20 through the execution of ten distinct run cycles for this example.
The 36-bar truss problem, which is considerably difficult and includes 21 design variables, has emerged as another benchmark problem used among scholars [14,51,56]. The configuration, dimensions, support requirements, material properties, and loading condition of this three-dimensional truss, shown in Figure 7b, are sourced from the cited article [51]. A discrete list that contains 25 cross-sectional areas, which have been acquired from the AISC and imported to RSA from the AISC database (above), has been prepared for this example. The RB (Round Bars) family was used during the optimization. Population size and generation number have both been determined as 40 through the execution of two distinct run cycles for this example.
The 120-bar dome truss problem was first solved by M.P. Saka in 1991 [52]. Thereafter, other researchers have employed this structure to test their algorithms [52,57,58,59,60,61]. The configuration, dimensions, support requirements, material properties, loading, and boundary conditions of this dome, which is illustrated in Figure 7c, are sourced from the referenced article [52]. The elasticity module is taken as 210000 MPa and material density is taken as 7860 kg/m3. A total of 27 CHS (Circular Hollow Section) sections that comply with the provided limits were chosen from the UKST (British hot rolled section) database available on RSA [55]. Moreover, the buckling effect for elements under compression has also been taken into consideration. To calculate the critical load for buckling, a Python code was created with the formulations taken from AISC [62] regulations. Population size and generation number have both been determined as 20 through the execution of ten distinct run cycles for this example.

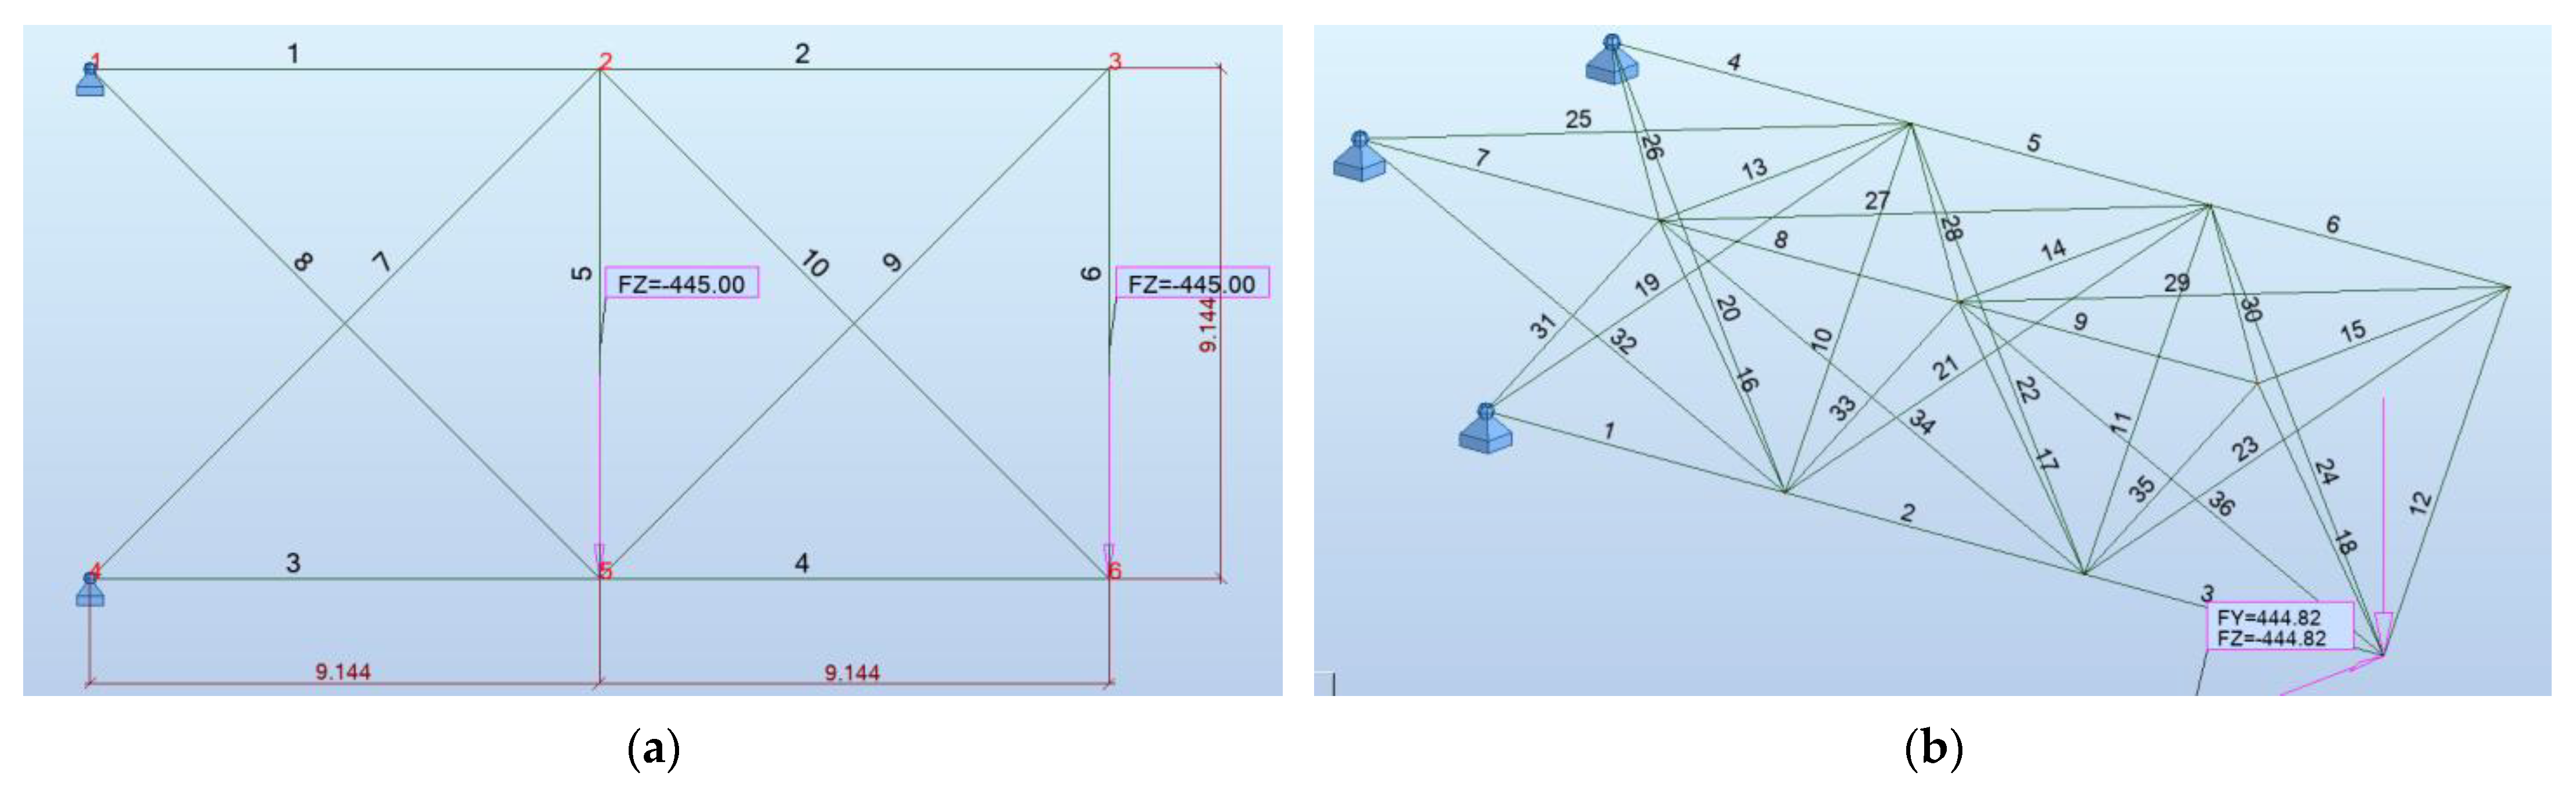
3.2. 10-Bar 2D Truss Problem

The results found for the 10-bar truss are shown and compared with those from studies taken from the literature in Table 1. This table reveals that the weight obtained after optimization is higher than the solutions obtained from previous studies. However, as the aim of this study is to demonstrate the usability of the proposed methodology, the solution obtained is acceptable because this study, conducted by Camp et al., required an average of approximately 10,000 truss analyses with 24 separate run cycles [53] to converge the solution, exhibiting a magnification of 62.5 times compared to the analysis number that has been performed for this study. On the other hand, Jafari et al. [23] needed 113.25 times more analyses to obtain the result presented in Table 1. In addition to the table, the weight score change chart and the final version of optimized structure with sections found have been presented in Figure 8.

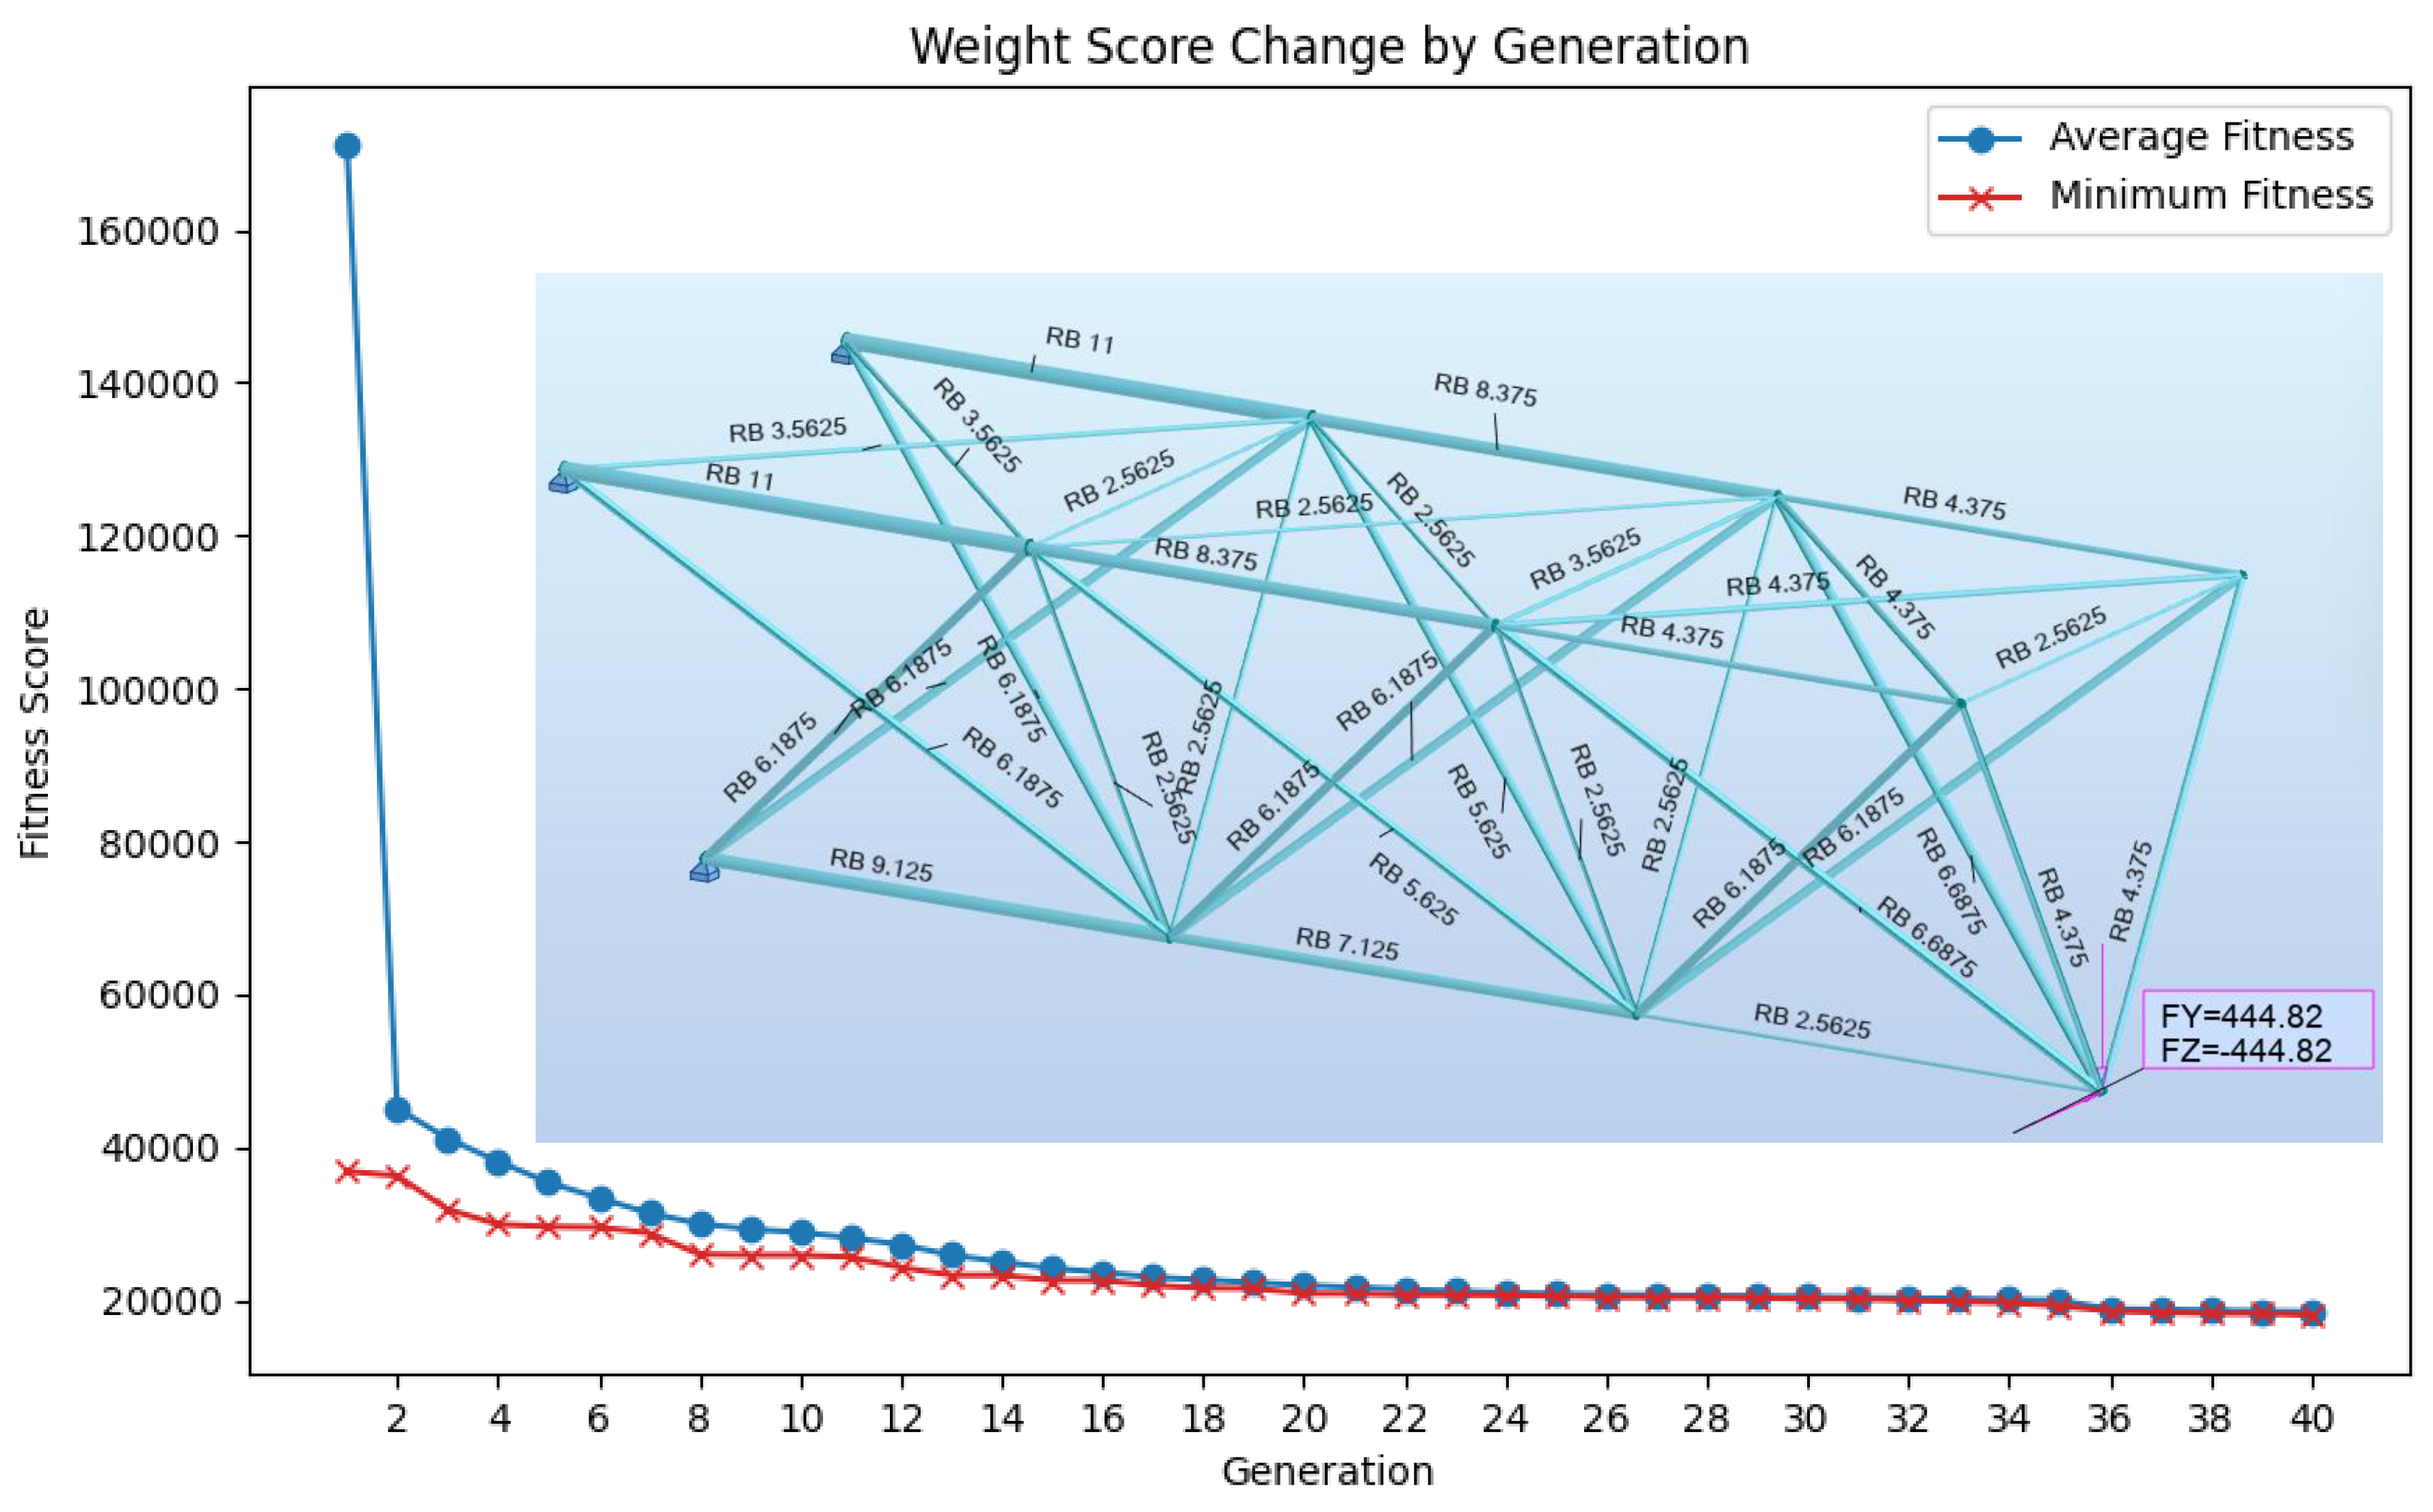
3.3. 36-Bar 3D Truss Problem

The comparison of the results, the number of analyses performed to obtain that truss in a single run cycle, and separate runs performed during this study for the 36-bar truss problem are depicted in Table 2. The main drawback of the proposed framework was the increase in calculation times for structures with more elements. This downside was limited to the number of separate runs performed for this problem. The results, also, showed that the GA configuration used in this study was less efficient compared to that of the 10-bar truss, where the function evaluations were squared to achieve a similar 10% error to that of the best observed result in the literature. Figure 9 presents the weight score and final version of the optimized structure.

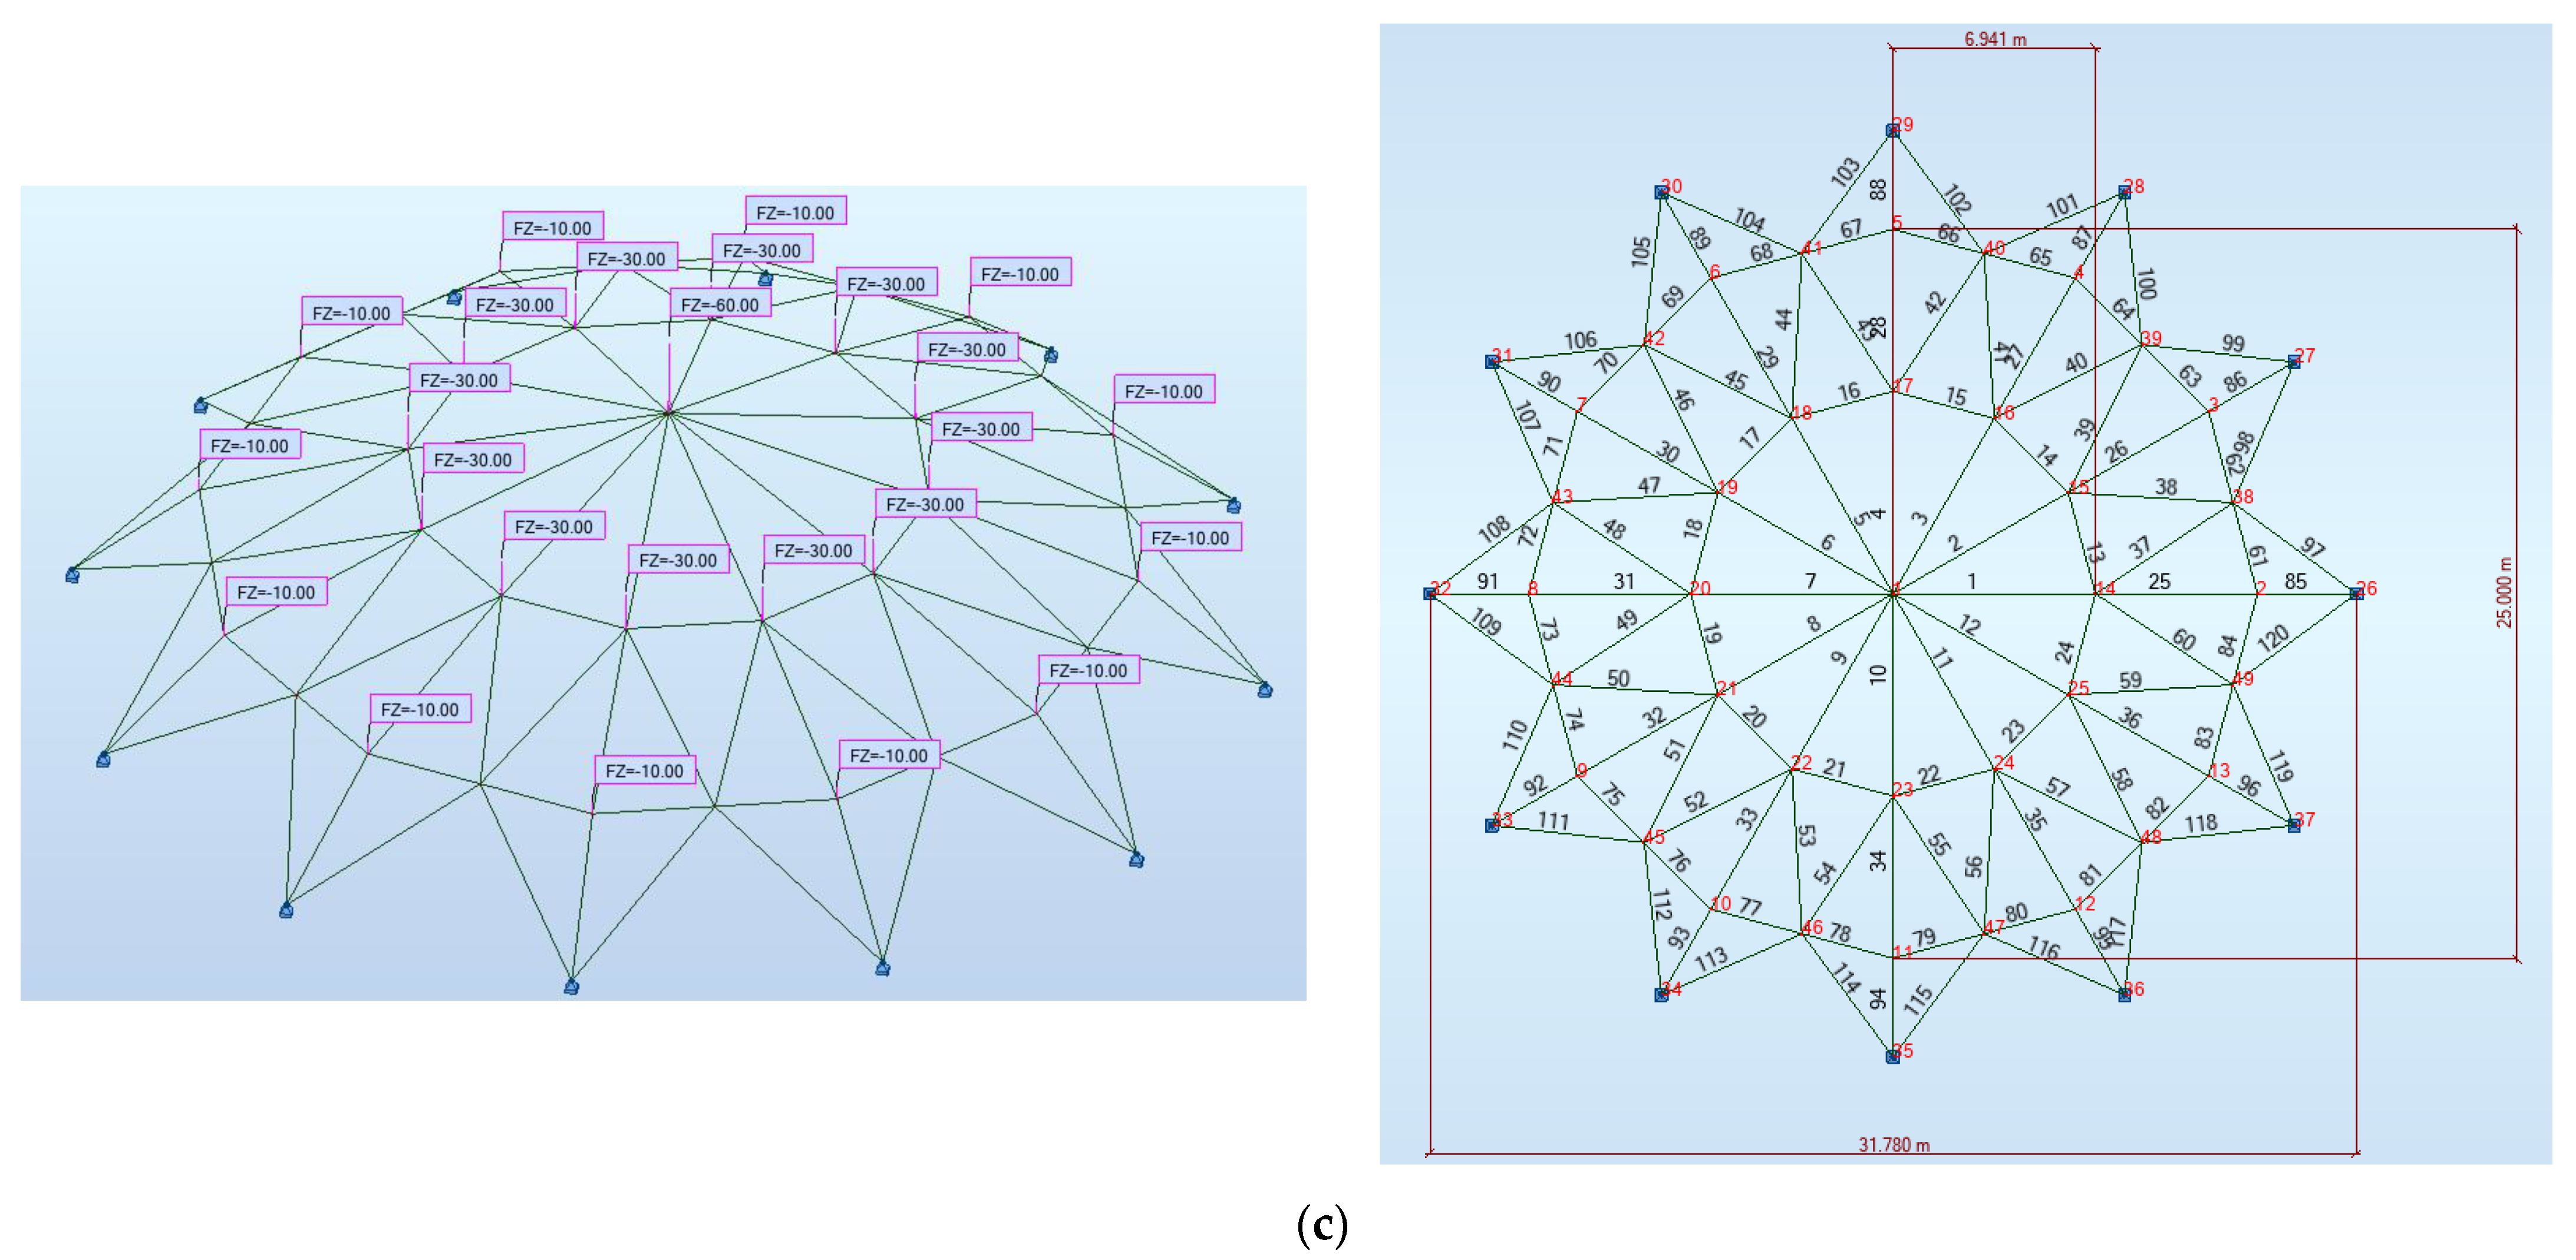
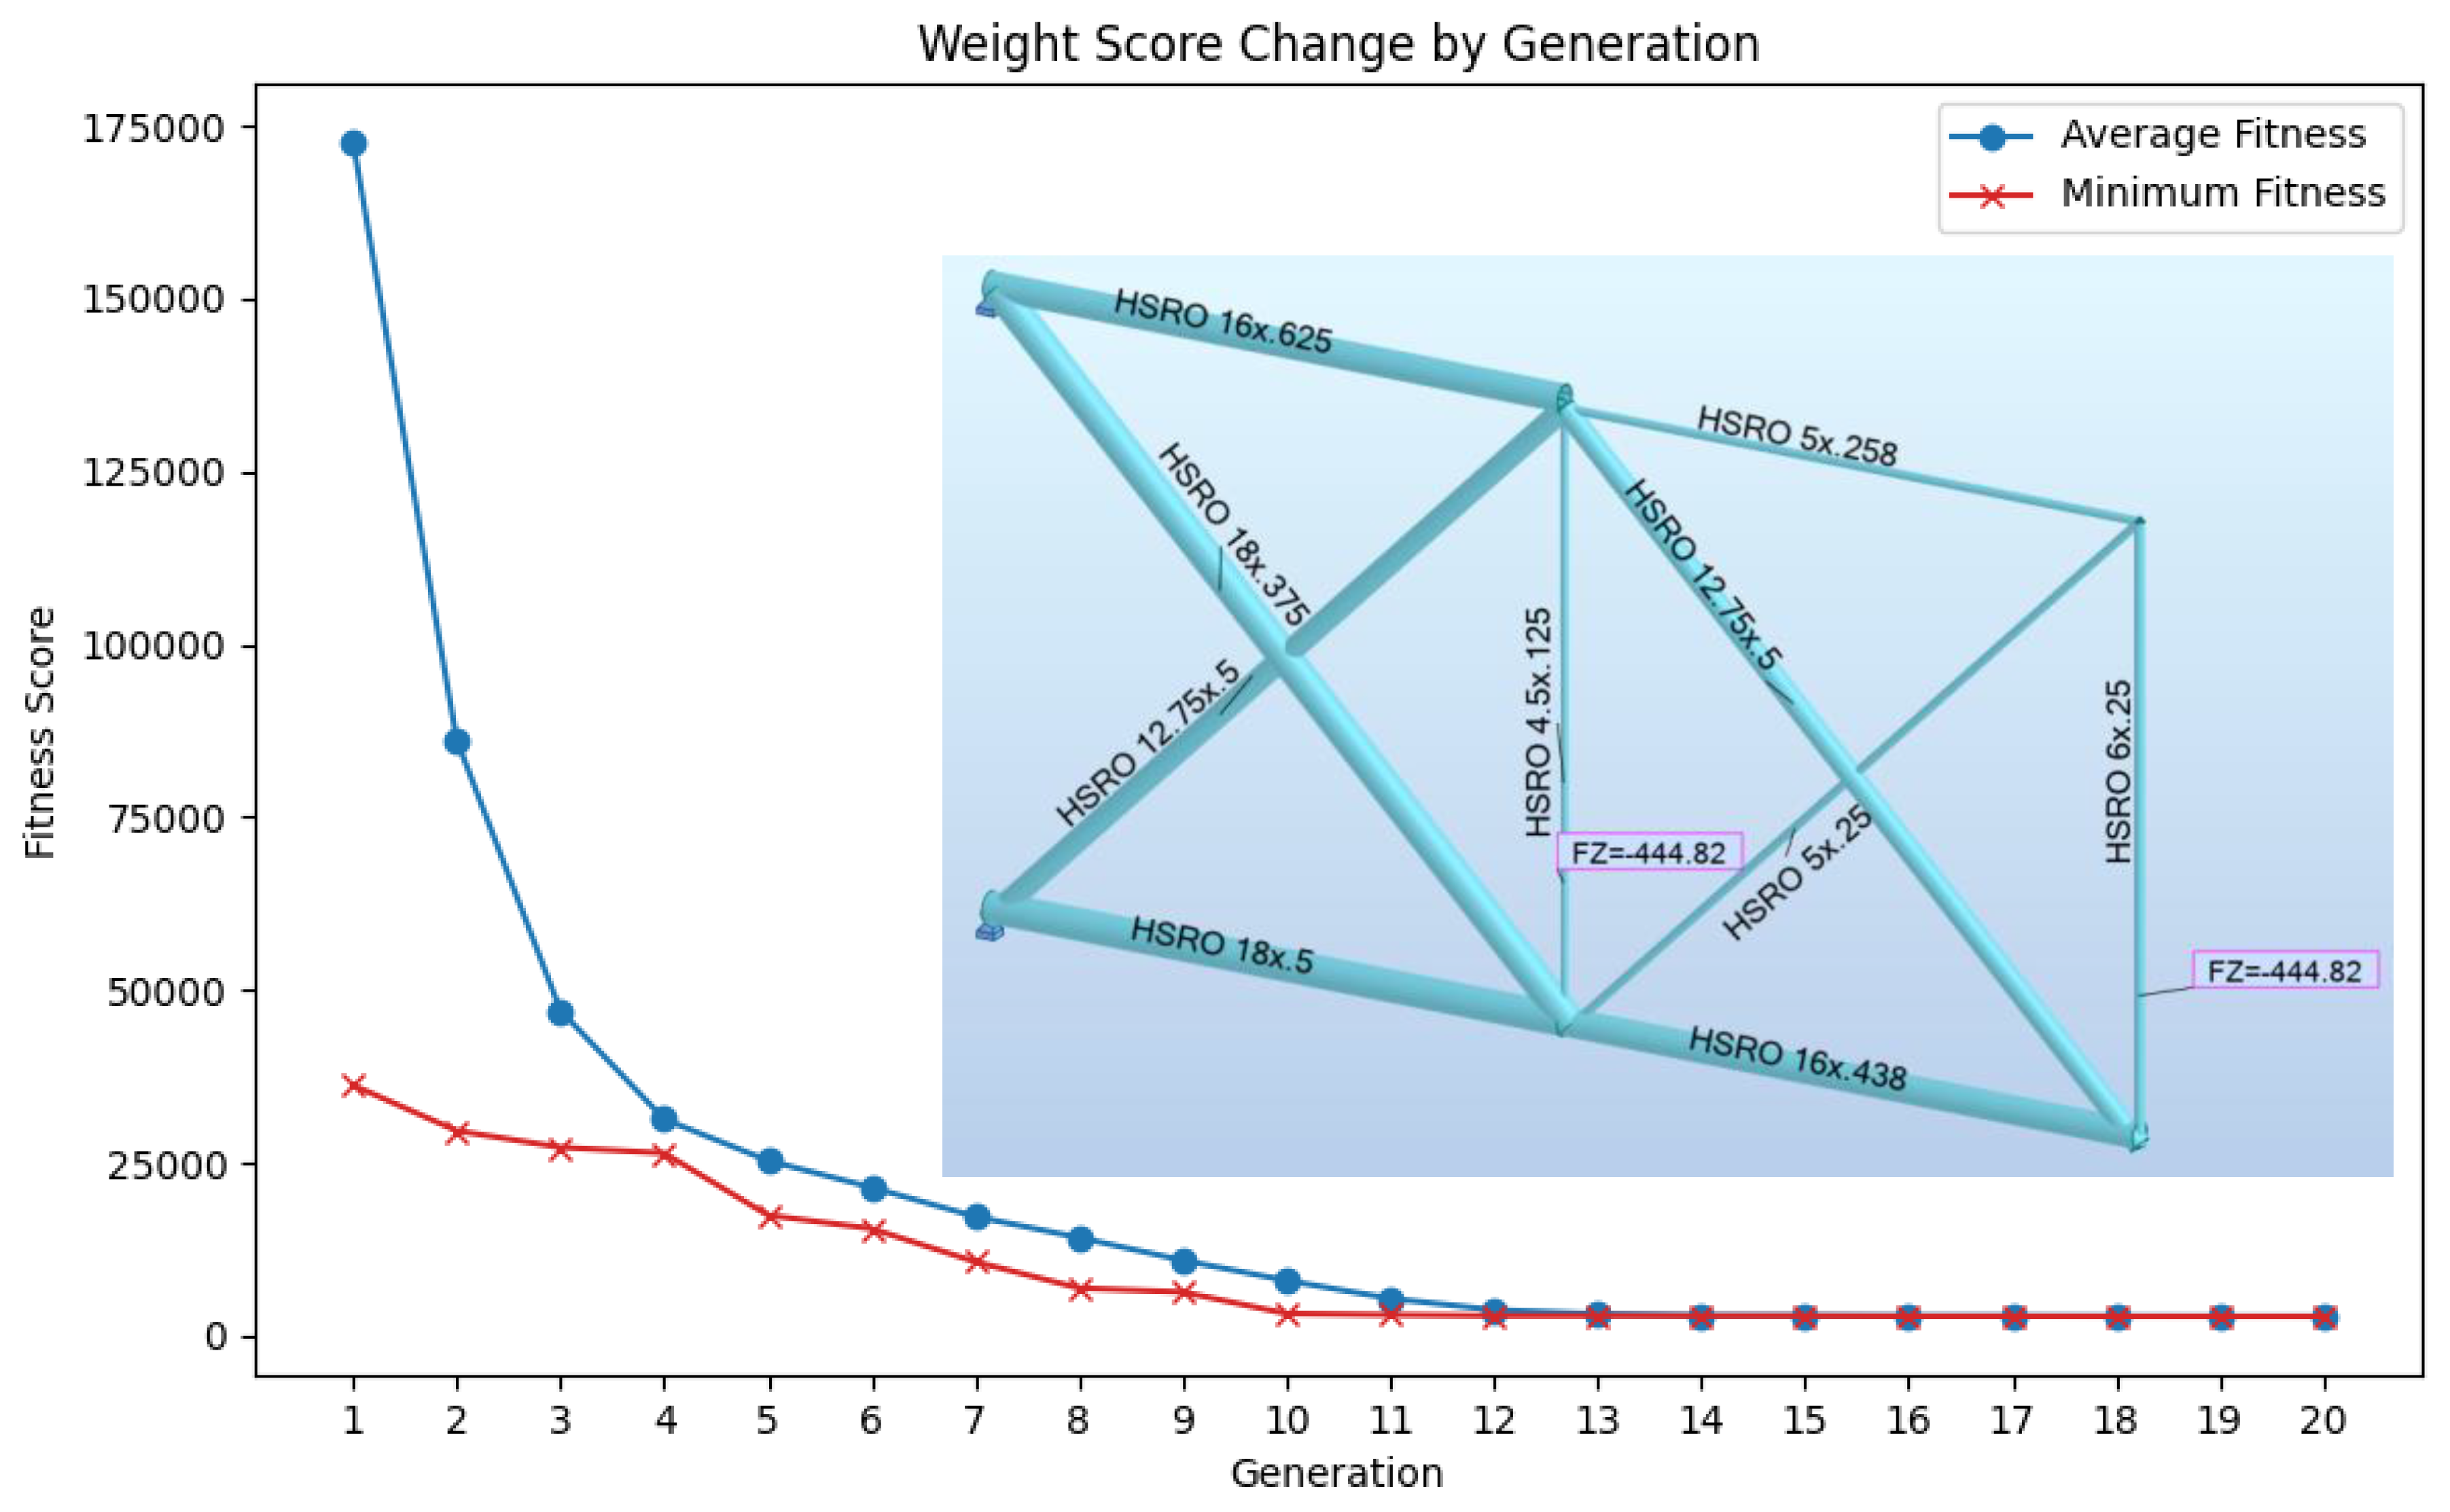
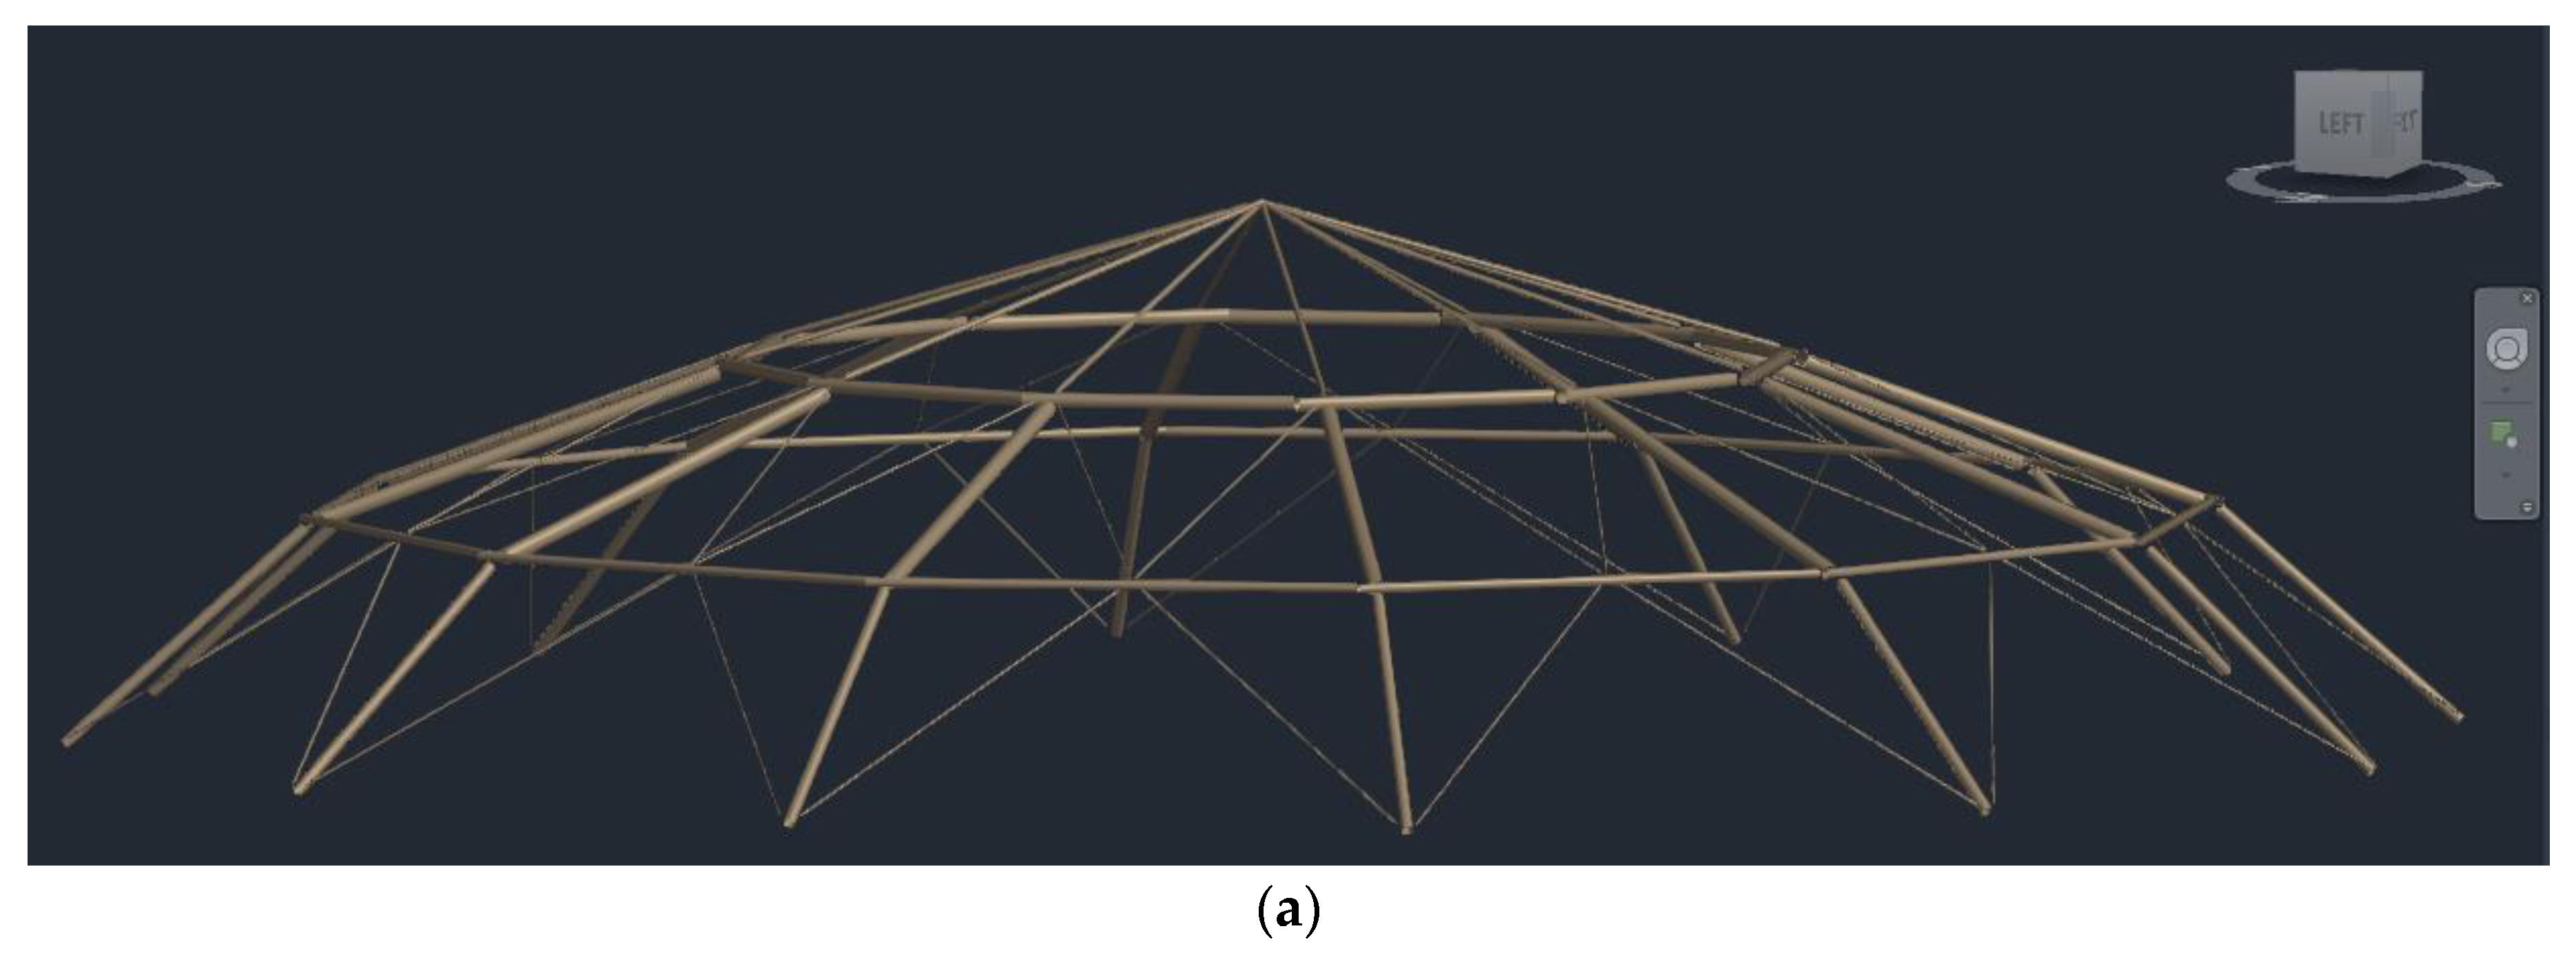
3.4. 120-Bar Dome Truss Problem

This example aims to find suitable sections that give minimum weight while satisfying given constraints for 120 elements that are divided into 7 groups from the list that contains 27 different cross-sectional areas. Results for the 120-bar dome truss are presented in Table 3 along with their comparison to literature results. It is worth noting that conducting additional runs and increasing the number of analyses for the same study is expected to yield better weights, as the study [61] needed 84,000 overall analyses and the study [58], required 100 separate run cycles to find the results depicted in Table 3. It is also important to mention that in this study [61] the displacement constraints are taken as having a ±5 mm difference to the referenced study [52], resulting in a higher structure weight. Also. the referenced studies all used continuous design variables whereas discrete sets were utilized in this manuscript. The reason for choosing this problem for the Results section is to demonstrate that the proposed algorithm is effective and performs well as the number of elements increases. The results indicate that the proposed methodology can be applied to complex structures in future studies. Nevertheless, it should be noted that conducting one analysis for a problem of this scale took about 50 s. Lastly, Figure 10 presents the optimized structure along with a weight score change by generation chart.

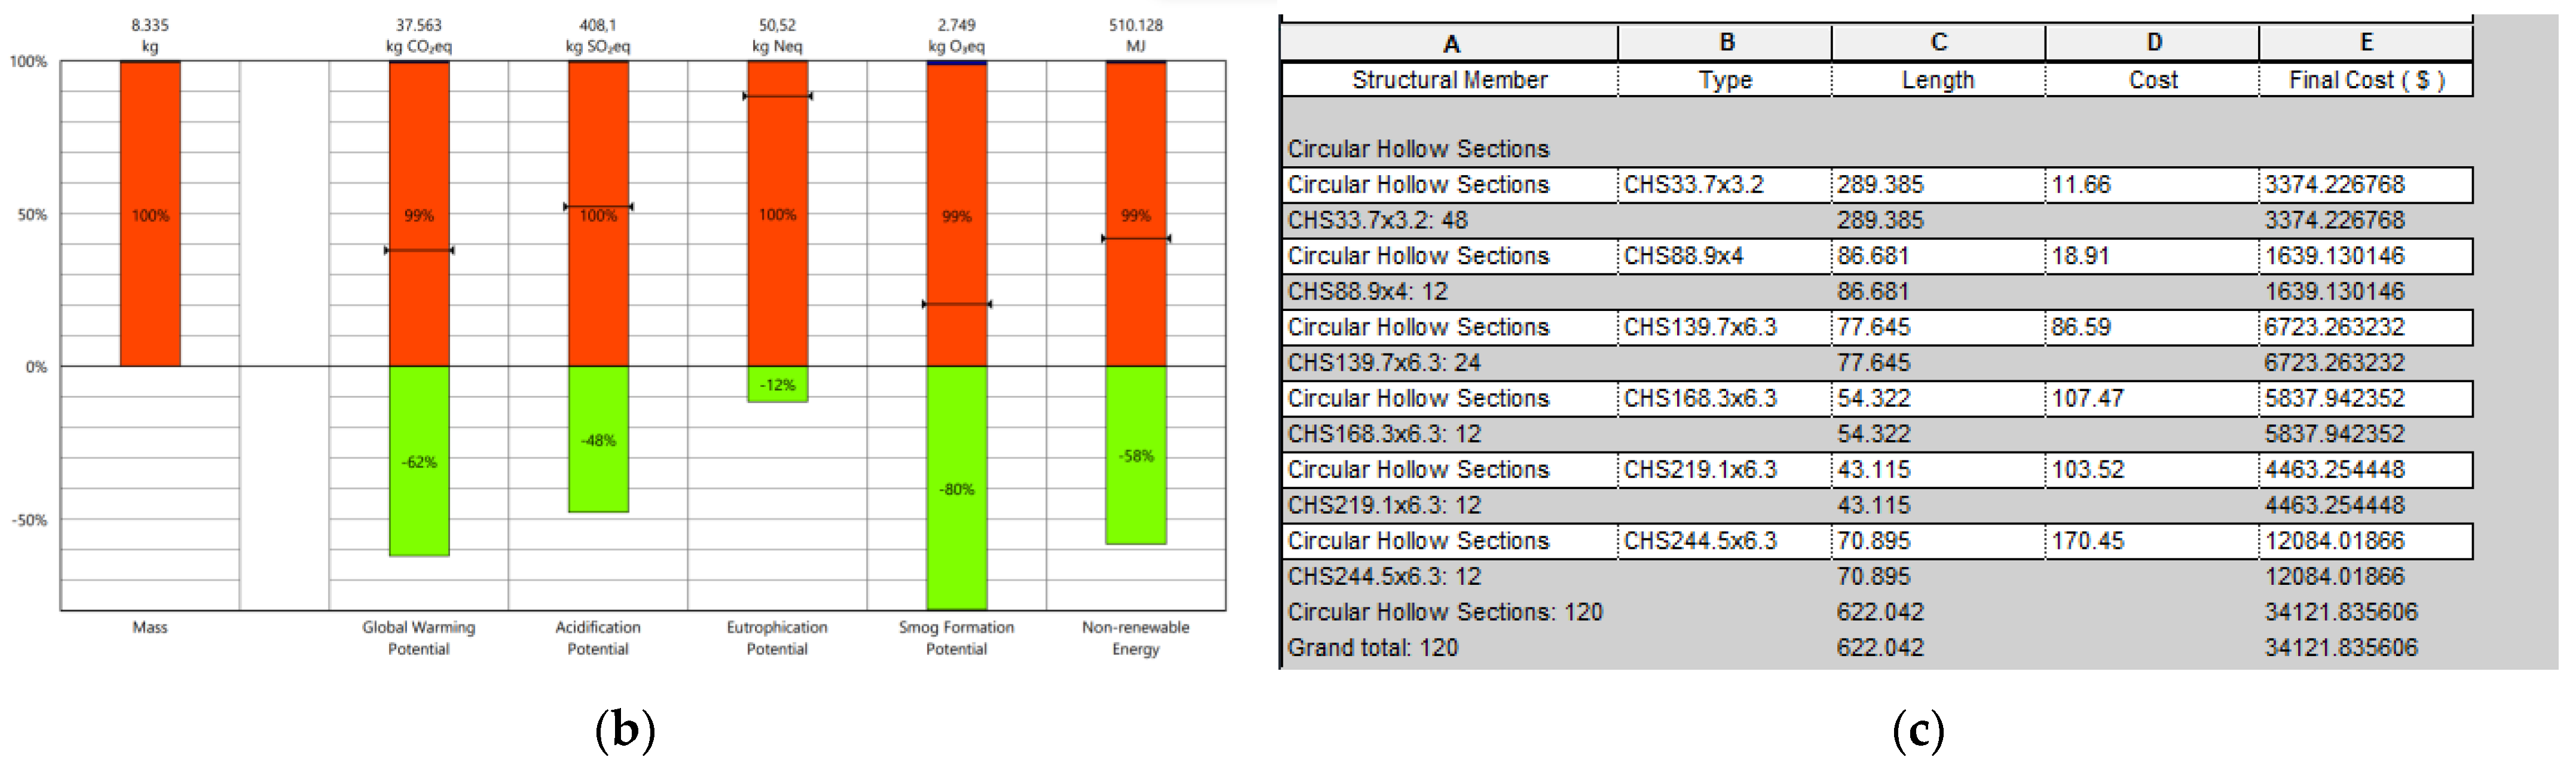
LCA and Cost Analysis for the 120-Bar Truss Structure

This section of this study report provides LCA and cost analysis results of the optimized 120-bar dome truss structure obtained using the explained methodology. As the first step, the best model after optimization has been imported into Revit from Dynamo using the “Revit importer” custom node. Once the model is ready in Revit, as shown in Figure 11a, LCA analysis can be performed by using “Tally”. After the analysis, a detailed report is generated, which includes information on factors such as global warming potential, acidification, and smog formation potential, some part of which is demonstrated in Figure 11b. For cost analysis, a bill-of-quantity table has been created on Revit, as shown in Figure 11c. Fields in this table can be adjusted by specific needs. To give an example, unit prices have been obtained from the referenced website [63] and the total cost of the structure has been calculated automatically within the table.

4. Discussion

In this section, transparent comments have been made about the aspects of this study that could have been improved or that were not fully addressed, along with a brief discussion about the results found in this study and potential future deployment.
Firstly, the proposed workflow can be enhanced by employing RSA-API instead of the Dynamo package to create an interaction between Dynamo and RSA, which would give broader control over the analysis part of the workflow. The Dynamo package restricts the optimization process and the ability to use the full performance of RSA, because no changes are possible inside this package. If there is a problem during the optimization that is caused by this package, then it is challenging to detect and solve that problem. That is why using API to perform FEM analysis on RSA appears to be a better option for future studies. Also, it is assumed that utilizing API would decrease the calculation time, supporting the designer reach optimum solutions in less time, while enabling scholars to perform additional analysis to achieve more competitive results compared to the current literature.
It is important to mention that the main goal for this study was to develop a unified and interoperable framework for the combination of VP, FEM, and GA in BIM-based projects using tools and software that are commonly utilized in the AEC industry. It was hypothesized that this may support the wide implementation of AI-based structural optimization by making it easier and less dependent on programming knowledge (or technology literacy) while having minimal impact on the current supply-chain processes in the industry. In Table 1, Table 2 and Table 3, it can be observed that the lower weights were observed in other studies in the literature; however, Figure 8, Figure 9 and Figure 10 demonstrate that the average population and the best observed results were yielding, suggesting at least a local convergence. From this point, it is possible to update the algorithms, perform additional runs, increase the population size and generation size, and find the optimum setting for GA and verify it by performing a comparison with benchmark functions, or with different global optimization algorithms such as ACO, PSO, etc. Moreover, performing shape or topology optimization for future research under scenarios such as dynamic loadings or different constraints such as frequency constraints has the potential to broaden the application of the proposed methodology.
One way that results and computation time may improve is through machine learning strategies, such as artificial neural networks (ANN) (for more information, readers can refer to referenced manuscripts [64,65,66]). Exploring the integration of machine learning algorithms for predicting structural optimization in BIM projects could be worthwhile to further enhance the proposed framework. Although the current study focuses on creating a workflow that can employ various optimization algorithms and techniques, this future deployment can enhance the efficiency and effectiveness of the optimization process by using the power of machine learning techniques, such as reinforcement learning and deep learning, leading to more sustainable and cost-effective structural designs in BIM-based projects.
Furthermore, following the optimization of truss structures, optimization for special structures such as wide-span roofs and wide-span trusses can result in significant improvements over existing methodology and validation processes. These structures are typically found in industrial buildings, airport terminals, and sports facilities when large open expanses with no intermediary supports are required. For the experimental results, case studies of sustainable railway station designs can be optimized, and the outcomes can be given in future research. These case studies can provide useful insights into how truss structures are employed to achieve sustainable and efficient designs in real-world applications.
Lastly, the definitions of the initial population size, mutation rate, and elite rate all significantly affect the results of the examples. Additionally, the number of design variables and the size of the list containing these variables have substantial influences on finding optimal results. Although having a large list of design parameters allows for the evaluation of various options, it also comes at a significant time cost. The primary challenge of the proposed method is the time required for certain tasks, particularly when importing the model into RSA, assigning boundary conditions, and conducting the analysis. These processes consume a substantial amount of time compared to methods where all operators and programs are coded within a single piece of software using one programming language, and where the generation number does not impose a limitation on this study. However, in this study, as the generation number increases the waiting time also rises due to issues like RAM leaks. Improving the interaction between RSA and Dynamo might reduce the model creation time in RSA, which could help to address this problem. Due to these reasons, the separate run number and analysis number values were kept low, and as soon as a solution close to the literature results was found, the optimization process was terminated. Despite the reasons explained so far, the solutions obtained by using the model proposed in this manuscript are meaningful from the viewpoint of engineering management and computational efforts because, in this study, discrete and real-word cross-sections have been adopted, to the contrary of benchmark problems, as design variables. It should also be emphasized that conducting additional run cycles and increasing the number of analyses for the same study is expected to yield better weights as all the benchmark studies performed a considerably greater amount of analysis than was performed in this study.
Overall, the results obtained in this study are approximately 10% higher than those in the literature. This difference is considered acceptable given that the focus of this study is to establish a workflow for structural optimization using visual programming, parametric modeling, and other BIM tools, rather than coding a metaheuristic algorithm that works best among the ones created in the literature.

5. Final Remarks

Even though structural optimization with metaheuristic algorithms is a well-known subject, its application and utilization in real-world problems are not common because of unfriendly software interfaces and the vast amount of programming expertise required. This gap in the literature is approached utilizing technological advancements like parametric design, VP, BIM, etc. through software like Dynamo, Revit, and RSA during the optimization process. The aim of this manuscript is to create a structural optimization methodology that integrates the tools of VP, parametric modeling, and BIM to obtain a robust optimization framework. This methodology was then validated by comparing the results of several 2D and 3D benchmark problems from the open literature. Concurrently, to show the advantages of using BIM during the optimization process, LCA and cost analysis have been added to the proposed methodology.
The results in this study highlight the promise of new technologies, allowing scholars to include programming into their studies without requiring a large amount of syntax expertise. Furthermore, the findings of this study provided important insights into the adaptation of VP and BIM tools to the optimization process. The computation time of the framework, however, was a controlling factor in the number of function evaluations used during the GA optimization. To this end, the present study, despite its success in developing a workable, user-friendly, and interoperable framework for the utilization of VP, GA, FEM, and BIM for structural optimization, achieved results that were on average 10% higher than those reported in the relevant literature. The authors conclude that this can be improved by the following measures: (i) increasing the callback function speed between Dynamo and RSA (which was the main computation bottleneck) through specialized API; and (ii) fine-tuning the GA parameters or utilizing other advanced global optimization and supervised learning techniques for the optimization.

Author Contributions

Conceptualization, R.M. and F.Y.; methodology, R.M., F.Y. and V.T.; software, F.Y.; validation, F.Y.; formal analysis, F.Y.; investigation, R.M. and F.Y.; resources, R.M.; data curation, F.Y.; writing—original draft preparation, F.Y.; writing—review and editing, R.M. and V.T.; visualization, F.Y.; supervision, R.M. and V.T.; project administration, R.M. and V.T.; funding acquisition, R.M. All authors have read and agreed to the published version of the manuscript.

Funding

This research was supported by the research funds of the Endowed Professorship in Digital Engineering and Construction (DEC) at the Institute of Technology and Management in Construction (TMB) of the Karlsruhe Institute of Technology (KIT). The author wishes to acknowledge the support provided by the KIT Publication Fund of the Karlsruhe Institute of Technology in supplying the APC.

Data Availability Statement

The raw data for the configurations used in this study are available through in the following references: 10-bar truss [12], 36-bar truss [51], and 120-bar dome [52]. The generated computer code along with animations, and instructions are conveniently provided in the respective GitHub repository dedicated for this project [50].

Conflicts of Interest

The authors declare no conflicts of interest.

References

  1. Gordon, J.E. Designing for safety—Or can you really trust strength calculations? In Structures or Why Things Don’t Fall Down; Springer: Boston, MA, USA, 1978. [Google Scholar] [CrossRef]
  2. Maalek, R.; Maalek, S. Repurposing Existing Skeletal Spatial Structure (SkS) System Designs Using the Field Information Modeling (FIM) Framework for Generative Decision-Support in Future Construction Projects. Sci. Rep. 2023, 13, 19591. [Google Scholar] [CrossRef] [PubMed]
  3. Mei, L.; Wang, Q. Structural Optimization in Civil Engineering: A Literature Review. Buildings 2021, 11, 66. [Google Scholar] [CrossRef]
  4. Bakhtiary, N.; Allinger, P.; Friedrich, M.; Mulfinger, F.; Sauter, J.; Puchinger, M. A New Approach for Sizing, Shape and Topology Optimization. J. Mater. Manuf. 1996, 105, 745–761. [Google Scholar]
  5. Wang, Z.; Cao, Z.; Fan, F.; Sun, Y. Shape Optimization of Free-Form Grid Structures Based on the Sensitivity Hybrid Multi-Objective Evolutionary Algorithm. J. Build. Eng. 2021, 44, 102538. [Google Scholar] [CrossRef]
  6. Christensen, P.W.; Klarbring, A. An Introduction to Structural Optimization; Springer Science & Business Media: Berlin/Heidelberg, Germany, 2008; Volume 153, ISBN 1402086660. [Google Scholar]
  7. Baykasoğlu, A.; Baykasoğlu, C. Weighted Superposition Attraction-Repulsion (WSAR) Algorithm for Truss Optimization with Multiple Frequency Constraints. Structures 2021, 30, 253–264. [Google Scholar] [CrossRef]
  8. Liu, Y.; Wang, Z.; Lu, H.; Ye, J.; Zhao, Y.; Min Xie, Y. Layout Optimization of Truss Structures with Modular Constraints. Structures 2023, 55, 1460–1469. [Google Scholar] [CrossRef]
  9. Stolpe, M. Truss Optimization with Discrete Design Variables: A Critical Review. Struct. Multidiscip. Optim. 2015, 53, 349–374. [Google Scholar] [CrossRef]
  10. Liu, J.; Xia, Y. A Hybrid Intelligent Genetic Algorithm for Truss Optimization Based on Deep Neutral Network. Swarm Evol. Comput. 2022, 73, 101120. [Google Scholar] [CrossRef]
  11. Sanchez-Caballero, S.; Selles, M.A.; Pla-Ferrando, R.; Martinez, S.A.V.; Peydro, M.A. Recent Advances in Structural Optimization. Annals of The Oradea University, Fascicle of Management and Technological Engineering, XXI (XI). 2012. Available online: https://riunet.upv.es/handle/10251/35915 (accessed on 17 May 2024).
  12. Rajeev, S.; Krishnamoorthy, C.S. Discrete Optimization of Structures Using Genetic Algorithms. J. Struct. Eng. 1992, 118, 1233–1250. [Google Scholar] [CrossRef]
  13. Rasheed, K.M. GADO: A Genetic Algorithm for Continuous Design Optimization; Rutgers The State University of New Jersey, School of Graduate Studies: New Brunswick, NJ, USA, 1998; ISBN 0591759950. [Google Scholar]
  14. Groenwold, A.A.; Stander, N.; Snyman, J.A. A Regional Genetic Algorithm for the Discrete Optimal Design of Truss Structures. Int. J. Numer. Methods Eng. 1999, 44, 749–766. [Google Scholar] [CrossRef]
  15. Toǧan, V.; Daloǧlu, A.T. An Improved Genetic Algorithm with Initial Population Strategy and Self-Adaptive Member Grouping. Comput. Struct. 2008, 86, 1204–1218. [Google Scholar] [CrossRef]
  16. Dorigo, M.; Birattari, M.; Stutzle, T. Ant Colony Optimization. IEEE Comput. Intell. Mag. 2006, 1, 28–39. [Google Scholar] [CrossRef]
  17. Kennedy, J.; Eberhart, R. Particle Swarm Optimization. In Proceedings of the Proceedings of ICNN’95—International Conference on Neural Networks 4, Perth, WA, Australia, 27 November 1995–1 December 1995; pp. 1942–1948. [CrossRef]
  18. Goodarzimehr, V.; Topal, U.; Das, A.K.; Vo-Duy, T. Bonobo Optimizer Algorithm for Optimum Design of Truss Structures with Static Constraints. Structures 2023, 50, 400–417. [Google Scholar] [CrossRef]
  19. Dede, T.; Kripka, M.; Togan, V.; Yepes, V.; Rao, R.V. Usage of Optimization Techniques in Civil Engineering During the Last Two Decades. Curr. Trends Civ. Struct. Eng. 2019, 2, 1–7. [Google Scholar] [CrossRef]
  20. Aydın, Z. Size, Layout and Tendon Profile Optimization of Prestressed Steel Trusses Using Jaya Algorithm. Structures 2022, 40, 284–294. [Google Scholar] [CrossRef]
  21. Singh, P.; Kottath, R.; Tejani, G.G. Ameliorated Follow The Leader: Algorithm and Application to Truss Design Problem. Structures 2022, 42, 181–204. [Google Scholar] [CrossRef]
  22. Jawad, F.K.J.; Ozturk, C.; Dansheng, W.; Mahmood, M.; Al-Azzawi, O.; Al-Jemely, A. Sizing and Layout Optimization of Truss Structures with Artificial Bee Colony Algorithm. Structures 2021, 30, 546–559. [Google Scholar] [CrossRef]
  23. Jafari, M.; Salajegheh, E.; Salajegheh, J. Optimal Design of Truss Structures Using a Hybrid Method Based on Particle Swarm Optimizer and Cultural Algorithm. Structures 2021, 32, 391–405. [Google Scholar] [CrossRef]
  24. Kaveh, A.; Biabani Hamedani, K.; Milad Hosseini, S.; Bakhshpoori, T. Optimal design of planar steel frame structures utilizing meta-heuristic optimization algorithms. Structures 2020, 25, 335–346. [Google Scholar] [CrossRef]
  25. Vu-Huu, T.; Pham-Van, S.; Pham, Q.H.; Cuong-Le, T. An Improved Bat Algorithms for Optimization Design of Truss Structures. Structures 2023, 47, 2240–2258. [Google Scholar] [CrossRef]
  26. Biabani, F.; Shojaee, S.; Hamzehei-Javaran, S. A New Insight into Metaheuristic Optimization Method Using a Hybrid of PSO, GSA, and GWO. Structures 2022, 44, 1168–1189. [Google Scholar] [CrossRef]
  27. Liu, Z.; Sun, H.; Charkaoui, A.; Hassan, N.M.; Bahroun, Z.; Jiang, J.; Wang, S.; Zhao, L.; Li, W.; Yao, Q.; et al. Truss Optimization Using Genetic Algorithm and FEA. J. Phys. Conf. Ser. 2021, 1965, 012134. [Google Scholar] [CrossRef]
  28. Maalek, S.; Maalek, R.; Maalek, B. Intrinsic Properties of Composite Double Layer Grid Superstructures. Infrastructures 2023, 8, 129. [Google Scholar] [CrossRef]
  29. Mai, H.T.; Lieu, Q.X.; Kang, J.; Lee, J. A Novel Deep Unsupervised Learning-Based Framework for Optimization of Truss Structures. Eng. Comput. 2023, 39, 2585–2608. [Google Scholar] [CrossRef]
  30. Cicconi, P.; Germani, M.; Bondi, S.; Zuliani, A.; Cagnacci, E. A Design Methodology to Support the Optimization of Steel Structures. Procedia CIRP 2016, 50, 58–64. [Google Scholar] [CrossRef]
  31. SAP2000|STRUCTURAL ANALYSIS AND DESIGN. Available online: https://www.csiamerica.com/products/sap2000 (accessed on 17 May 2024).
  32. Kaveh, A.; Mirzaei, B.; Jafarvand, A. Shape-Size Optimization of Single-Layer Barrel Vaults Using Improved Magnetic Charged System Search. Int. J. Civil. Eng. 2014, 12, 447–465. [Google Scholar]
  33. Artar, M.; Carbas, S. Discrete Sizing Design of Steel Truss Bridges through Teaching-Learning-Based and Biogeography-Based Optimization Algorithms Involving Dynamic Constraints. Structures 2021, 34, 3533–3547. [Google Scholar] [CrossRef]
  34. Vasani, A.; Patel, R.; Savsani, V.; Savsani, P. Parametric Analysis of Genetic Algorithm Toolbox for Truss Problem Optimization. In Reliability and Risk Assessment in Engineering; Lecture Notes in Mechanical Engineering; Springer: Singapore, 2020; pp. 389–398. [Google Scholar] [CrossRef]
  35. Mirniazmandan, S.; Alaghmandan, M.; Barazande, F.; Rahimianzarif, E. Mutual Effect of Geometric Modifications and Diagrid Structure on Structural Optimization of Tall Buildings. Archit. Sci. Rev. 2018, 61, 371–383. [Google Scholar] [CrossRef]
  36. Sotiropoulos, S.; Lagaros, N.D. Topology Optimization of Framed Structures Using SAP2000. Procedia Manuf. 2020, 44, 68–75. [Google Scholar] [CrossRef]
  37. He, L.; Li, Q.; Gilbert, M.; Shepherd, P.; Rankine, C.; Pritchard, T.; Reale, V. Optimization-Driven Conceptual Design of Truss Structures in a Parametric Modelling Environment. Structures 2022, 37, 469–482. [Google Scholar] [CrossRef]
  38. Lin, J.-R.; Zhang, Y.; Kong SAR, H.; Xiao, J. A Framework to Automate Reliability-Based Structural Optimization Based on Visual Programming and OpenSees. In Proceedings of the 8th International Conference on Construction Engineering and Project Management, Hong Kong, China, 8–10 December 2019. [Google Scholar]
  39. Kossakowski, P.G. Visual Programming as Modern and Effective Structural Design Technology—Analysis of Opportunities, Challenges, and Future Developments Based on the Use of Dynamo. Appl. Sci. 2023, 13, 9298. [Google Scholar] [CrossRef]
  40. Choi, S.W.; Oh, B.K.; Park, H.S. Design Technology Based on Resizing Method for Reduction of Costs and Carbon Dioxide Emissions of High-Rise Buildings. Energy Build. 2017, 138, 612–620. [Google Scholar] [CrossRef]
  41. Rani, H.A.; Al-Mohammad, M.S.; Rajabi, M.S.; Rahman, R.A. Critical Government Strategies for Enhancing Building Information Modeling Implementation in Indonesia. Infrastructures 2023, 8, 57. [Google Scholar] [CrossRef]
  42. Daloğlu, A.; Armutçu, M. Optimal Design of Plane Steel Frames with Genetic Algorithm. Tek. Dergi 1998, 9, 42. (In Turkish) [Google Scholar]
  43. Marques, F.d.P.; Arenales, M.N. The Constrained Compartmentalised Knapsack Problem. Comput. Oper. Res. 2007, 34, 2109–2129. [Google Scholar] [CrossRef]
  44. Darwin, C. On the Origin of Species: A Facsimile of the First Edition; Harvard University Press: Cambridge, MA, USA, 1964; ISBN 0674637526. [Google Scholar]
  45. Coello Coello, C.A. Theoretical and Numerical Constraint-Handling Techniques Used with Evolutionary Algorithms: A Survey of the State of the Art. Comput. Methods Appl. Mech. Eng. 2002, 191, 1245–1287. [Google Scholar] [CrossRef]
  46. Blank, J.; Deb, K. Pymoo: Multi-Objective Optimization in Python. IEEE Access 2020, 8, 89497–89509. [Google Scholar] [CrossRef]
  47. Kamrani, A.K.; Gonzalez, R. A Genetic Algorithm-Based Solution Methodology for Modular Design. J. Intell. Manuf. 2003, 14, 599–616. [Google Scholar] [CrossRef]
  48. Yang, T.; Kuo, Y.; Cho, C. A Genetic Algorithms Simulation Approach for the Multi-Attribute Combinatorial Dispatching Decision Problem. Eur. J. Oper. Res. 2007, 176, 1859–1873. [Google Scholar] [CrossRef]
  49. Yeniay, Ö. Penalty Function Methods for Constrained Optimization with Genetic Algorithms. Math. Comput. Appl. 2005, 10, 45–56. [Google Scholar] [CrossRef]
  50. Ugurfeyzullah/Structural-Optimization-with-VP. Available online: https://github.com/ugurfeyzullah/Structural-optimization-with-VP (accessed on 10 March 2024).
  51. Ringertz, U.T. On methods for discrete structural optimization. Eng. Optim. 1988, 13, 47–64. [Google Scholar] [CrossRef]
  52. Saka, M.P.; Ulker, M. Optimum Design of Geometrically Nonlinear Space Trusses. Comput. Struct. 1991, 41, 1387–1396. [Google Scholar] [CrossRef]
  53. Camp, C.V.; Bichon, B.J. Design of Space Trusses Using Ant Colony Optimization. J. Struct. Eng. 2004, 130, 741–751. [Google Scholar] [CrossRef]
  54. Cao, H.; Qian, X.; Chen, Z.; Zhu, H. Enhanced Particle Swarm Optimization for Size and Shape Optimization of Truss Structures. Eng. Optim. 2017, 49, 1939–1956. [Google Scholar] [CrossRef]
  55. Robot Structural Analysis 2018 Help|Section Database|Autodesk. Available online: https://help.autodesk.com/view/RSAPRO/2018/ENU/?guid=GUID-727CAC1A-7ABE-4986-B7A5-4E31ADF1A6AA (accessed on 14 April 2024).
  56. Schutte, J.F.; Groenwold, A.A. Sizing Design of Truss Structures Using Particle Swarms. Struct. Multidiscip. Optim. 2003, 25, 261–269. [Google Scholar] [CrossRef]
  57. Capriles, P.V.S.Z.; Fonseca, L.G.; Barbosa, H.J.C.; Lemonge, A.C.C. Rank-Based Ant Colony Algorithms for Truss Weight Minimization with Discrete Variables. Commun. Numer. Methods Eng. 2006, 23, 553–575. [Google Scholar] [CrossRef]
  58. Ebenau, C.; Rottschäfer, J.; Thierauf, G. An Advanced Evolutionary Strategy with an Adaptive Penalty Function for Mixed-Discrete Structural Optimisation. Adv. Eng. Softw. 2005, 36, 29–38. [Google Scholar] [CrossRef]
  59. Tejani, G.G.; Savsani, V.J.; Patel, V.K. Modified Sub-Population Teaching-Learning-Based Optimization for Design of Truss Structures with Natural Frequency Constraints. Mech. Based Des. Struct. Mach. 2016, 44, 495–513. [Google Scholar] [CrossRef]
  60. Azizi, M.; Aickelin, U.; Khorshidi, H.A.; Shishehgarkhaneh, M.B. Shape and Size Optimization of Truss Structures by Chaos Game Optimization Considering Frequency Constraints. J. Adv. Res. 2022, 41, 89–100. [Google Scholar] [CrossRef]
  61. Kooshkbaghi, M.; Kaveh, A. Sizing Optimization of Truss Structures with Continuous Variables by Artificial Coronary Circulation System Algorithm. Iran. J. Sci. Technol.—Trans. Civil. Eng. 2020, 44, 1–20. [Google Scholar] [CrossRef]
  62. American Institute of Steel Construction. Specification for the Design, Fabrication, and Erection of Structural Steel for Buildings; American Institute of Steel Construction, New York, NY, USA, 1969. Available online: https://www.aisc.org/globalassets/aisc/manual/15th-ed-ref-list/specification-for-the-design-fabrication-and-erection-of-structural-steel-for-buildings.pdf (accessed on 17 May 2024).
  63. ParkerSteel—UK Steel Stockholders. Available online: https://www.parkersteel.co.uk/ (accessed on 14 April 2024).
  64. Almasabha, G.; Alshboul, O.; Shehadeh, A.; Almuflih, A.S.; Yang, B.; Almasabha, G.; Alshboul, O.; Shehadeh, A.; Almuflih, A.S. Machine Learning Algorithm for Shear Strength Prediction of Short Links for Steel Buildings. Buildings 2022, 12, 775. [Google Scholar] [CrossRef]
  65. Zain, M.; Prasittisopin, L.; Mehmood, T.; Ngamkhanong, C.; Keawsawasvong, S.; Thongchom, C. A Novel Framework for Effective Structural Vulnerability Assessment of Tubular Structures Using Machine Learning Algorithms (GA and ANN) for Hybrid Simulations. Nonlinear Eng. 2024, 13, 20220365. [Google Scholar] [CrossRef]
  66. Zain, M.; Keawsawasvong, S.; Thongchom, C.; Sereewatthanawut, I.; Usman, M.; Prasittisopin, L. Establishing Efficacy of Machine Learning Techniques for Vulnerability Information of Tubular Buildings. Eng. Sci. 2024, 27, 1008. [Google Scholar] [CrossRef]
Figure 1. Flowchart of GA with basic operators.
Buildings 14 01532 g001
Figure 2. Schematic representation of the proposed methodology: (a) parametric modeling of truss; (b) integration of RSA structural analysis; (c) GA optimization modules; and (d) integration with Revit and Tally.
Buildings 14 01532 g002aBuildings 14 01532 g002b
Figure 3. Flowchart of the proposed workflow.
Buildings 14 01532 g003
Figure 4. Python script used for evaluating and ranking the results.
Buildings 14 01532 g004
Figure 5. Nodes contained by “LoopBodyVar2”.
Buildings 14 01532 g005
Figure 6. (a) Truss model after importation into Revit; (b) nodes for adding the connection details through Dynamo; (c) the structure after adding the connection details.
Buildings 14 01532 g006
Figure 7. Trusses for numerical examination, including (a) 10-bar truss; (b) 36-bar truss; and (c) 120-bar-dome truss configurations.
Buildings 14 01532 g007aBuildings 14 01532 g007b
Figure 8. The result of the 10-bar truss problem; fitness score vs. generation number.
Buildings 14 01532 g008
Figure 9. The result of the 36-bar truss problem; fitness score vs. generation number.
Buildings 14 01532 g009
Figure 10. The result of the 120-bar truss problem; fitness score vs. generation number.
Buildings 14 01532 g010
Figure 11. Results are as follows: (a) dome truss after being imported into Revit; (b) life-cycle stage (generated using Tally); and (c) Revit bills-of-quantity table.
Buildings 14 01532 g011aBuildings 14 01532 g011b
Table 1. Comparison of 10-bar truss results.
Rajeev et al. [12]Camp et al. [53]Jafari et al. [23]This Study
Weight (kg)2549.22490.62302.432763.06
Analysis made40010,00015,100400
Separate Runs-243010
Table 2. Comparison of 36-bar truss results.
Ringertz [51]Groenwold et al. [14]Schutte et al. [56]This Study
Weight (kg)16,517.716,478.116,181.818,081.3
Analysis made-160020001600
Separate Runs-10102
Table 3. Comparison of 120-bar truss results.
Saka et al. [52]Ebenau et al. [58]Kooshkbaghi
et al. [61]
This Study
Weight (kg)75876923.39101.38343.13
Analysis made-20,0008400400
Separate Runs15100102
Disclaimer/Publisher’s Note: The statements, opinions and data contained in all publications are solely those of the individual author(s) and contributor(s) and not of MDPI and/or the editor(s). MDPI and/or the editor(s) disclaim responsibility for any injury to people or property resulting from any ideas, methods, instructions or products referred to in the content.

