Article

Rubberized Concrete: Effect of the Rubber Size and Content on Static and Dynamic Behavior

1
School of Materials Science and Engineering, Shenyang University of Technology, Shenyang 110870, China
2
Multidisciplinary Center for Infrastructure Engineering, Shenyang University of Technology, Shenyang 110870, China
3
School of Civil Engineering, Qingdao University of Technology, Qingdao 266033, China
4
Mechanical Engineering Programme Area, Faculty of Engineering, Universiti Teknologi Brunei, Tungku Highway, Gadong BE1410, Brunei
5
Mechanical and Energy Engineering Techniques, Erbil Technical Engineering College, Erbil Polytechnic University, Erbil 44001, Kurdistan-Region, Iraq
*
Authors to whom correspondence should be addressed.
Buildings 2024, 14(6), 1541; https://doi.org/10.3390/buildings14061541
Submission received: 11 April 2024 / Revised: 13 May 2024 / Accepted: 23 May 2024 / Published: 26 May 2024
(This article belongs to the Section Building Materials, and Repair & Renovation)

Abstract

:
Rubberized concrete (RC) has received widespread attention due to its energy absorption and crack resistance properties. However, due to its low compressive strength, it is not recommended for structural applications. The rubber size and content affect RC’s mechanical properties. This study investigated and formulated the behavior of RC with different particle sizes and contents under dynamic and static loading. Quasi-static compressive and dynamic tests were conducted on RC with varying content of rubber (0–30%) and rubber sizes (0.1–20 mm). It was found that the rubber particle size was 0.5mm and the rubber content was 2%. An equation was derived from the experimental data to forecast the impact of rubber size and content on compressive strength. Additionally, by combining the literature and this research’s data, a model was established based on neural networks to predict the strength of RC. SHPB tests were carried out to study the stress–strain curves under dynamic load. The peak stress, fragment analysis, and energy absorption of RC with varying content of rubber and rubber sizes at three different strain rates (100 s−1, 160 s−1, and 290 s−1) were investigated. Equations describing the relationship between dynamic increase factor (DIF), rubber material content, and strain rate on different particle sizes were obtained by fitting. The DIF increased as the content of the rubber increased. By analyzing energy absorption data, it was found that the optimal ratio for energy absorption was RC-0.5-30, RC-0.1-30, and RC-10-30 at strain rates of 100 s−1, 160 s−1, and 290 s−1. This study could be a good guideline for other researchers to easily select the content and size of the rubber in RC for their applications. It also has a positive significance in promoting the development of green building materials.

1. Introduction

Concrete is most commonly used in civil engineering and finds extensive application in industrial and civil structures, transportation infrastructure, and coastal and harbor developments [1,2,3]. The primary constituents of concrete are derived from abundant and inexpensive geological resources, including sand, gravel, water, and cement, which are obtained by calcinating clay and limestone [4]. Nevertheless, concrete exhibits drawbacks, including brittleness [5] and limited tensile strength [6]. Concrete building structures experience more than just static loads during their utilization. They must also endure impact loads in certain special occurrences, such as earthquakes [7], blasts [8,9], and vehicular collisions with guardrails [10]. The drawbacks of concrete significantly compromise the safety of building structures [11].
To improve the impact resistance of concrete, researchers have conducted many dynamic load tests on concrete. Dashun Cui et al. [12] analyzed the fracture process and crack propagation behavior of concrete specimens mixed with steel fibers and palm fibers using Split-Hopkinson pressure bar (SHPB) and DIC techniques and obtained their dynamic tensile properties and energy dissipation. The experimental results show that adding fibers can enhance the impact toughness of concrete, reduce the failure of the stress end of the specimen due to stress concentration, delay the failure time of the specimen, and effectively suppress crack propagation. Feng Shi et al. [13] analyzed and compared the dynamic uniaxial compression tests of self-compacting concrete (SCC) and normal concrete under different load strain rates and obtained the compression failure modes and stress–strain curves of the two types of concrete. Shiwen Feng et al. [14] used SHPB to analyze foam concrete’s damage behavior and energy absorption characteristics under dynamic load. Tiecheng Yang et al. [15] conducted dynamic pressure tests on geopolymer concrete before and after water saturation using SHPB. The effects of water saturation and strain rate on the impact toughness of geopolymer concrete were studied. Multiple studies have also demonstrated that adding rubber to concrete can enhance the impact resistance of normal concrete [16,17].
How to solve and reasonably utilize solid waste materials has always been a key issue. M Manjunatha et al. [18] used industrial polyvinyl chloride (PVC) waste to replace cement in some M60 grade self-compacting concrete. Research has shown that this method not only helps reduce the cost of SCC but also does not affect its strength and durability. Waste rubber is also a conventional solid waste primarily derived from recycled tires [19]. According to information, the yearly manufacturing of new tires surpasses 1.6 billion, whereas 1 billion new waste tires are generated annually [20]. The primary method of disposing of these discarded tires is depositing them in landfills [21]. Rubber exhibits high resistance to degradation and is highly flammable, posing significant environmental contamination risks [22]. The RC offers a commendable and environmentally friendly resolution to this ecological issue by pulverizing discarded rubber tires into rubber powder or fibers, letting the rubber waste substitute for a portion of the aggregate of the concrete [23,24,25]. This method not only solves the problem of environmental pollution but also enhances the mechanical properties of the concrete.
Rubber is an organic substance known for its high toughness [26] and low density [27]. Specifically, rubber exhibits impact resistance [23,28]. Mixing rubber as aggregate into concrete can significantly enhance its mechanical properties and ameliorate its inadequate toughness and other inherent properties. Shengtian Zhai et al. [29] discovered that RC’s abrasion resistance tended to increase and decrease as the rubber percentage increased. RC exhibited a 14.9% enhancement in abrasion resistance compared to the control concrete. This improvement can be attributed mainly to rubber’s ability to absorb the abrasion-generated energy. Nouran Yasser et al. [30] examined the durability of RC by conducting experiments on water absorption, chloride erosion, and sulfate erosion. They observed that RC exhibits improved workability and reduced density. A.F. Angelin et al. [31] examined the impact of rubber on the acoustic characteristics of RC and demonstrated a significant enhancement in acoustic attenuation, ranging from 30% to 43%. Wanhui Feng et al. [32] investigated the dynamic fracture toughness of RC using the drop weight test, which showed that the fracture toughness of RC increased to 30% at the time of the increase in rubber content. In the rest of the studies, the RC also showed excellent thermal insulation [33] and energy absorption properties [20,34].
The corresponding performance index of dynamic compression is significant in some high-strain rate states, such as explosions, earthquakes, collisions, and many other dynamic impacts [35]. The study of materials under relevant high-strain rate states can be well carried out using the SHPB. Lei Pan et al. [36] conducted a study on the strength of RC in varying rubber content using simulation and the SHPB test. They found that the dynamic strength of RC increases as the strain rate increases. Zhiheng Liu et al. [37] examined the dynamic compression performance of self-compacting RC under multiple impact loads using the SHPB. They considered the effects of rubber content, impact velocity, and heat treatment temperature. The results indicated that including rubber aggregate improves the ductility and toughness of self-compacting RC. Thong M. Pham et al. [38] used SHPB to study the dynamic compression behavior of RC with two rubber particle sizes of 1–3 mm and 3–5 mm at 15% content. The RC containing a smaller rubber aggregate has higher static compressive strength but lower dynamic compressive strength than RC with bigger rubber particles. Although the dynamic impact of RC has been partially studied, there is still a lack of comprehensive and comparative studies on different rubber particle sizes and content.
While using rubber enhances the performance of normal concrete, the strength of RC generally exhibits a decrease in strength when rubber is added [2,38,39,40]. This has been investigated mainly due to the weaker interfacial transition zone (ITZ) created by the weaker bonding process of the rubber to the cement cementitious material [41,42]. A slight decrease in concrete strength is acceptable within the scope of standard requirements because RC brings better impact resistance. However, a significant drop in strength is unacceptable, especially in some load-bearing structures, and unique application scenarios are often fatal [43]. One of the most effective improvement methods is chemical or physical methods to improve the adhesion performance between rubber and cement [17,44,45]. Another more effective scheme is to conduct a more comprehensive and regular investigation of the dynamic impacts and static properties of different rubber contents and particle sizes. At present, there are still a few relevant studies, and further exploration is needed.
This study involves doing a series of combination tests using various rubber contents (0%, 2%, 5%, 15%, and 30%) and particle sizes (0.1 mm, 0.5 mm, 2 mm, 5 mm, 10 mm, and 20 mm). The tests will employ static mechanical combination experiments and the split-Hopkinson pressure bar (SHPB) for dynamic impact. The aim is to examine the influence of varying rubber concentrations and particle dimensions on the dynamic impact behavior and static mechanical characteristics of RC.
In a static loading study, this paper investigates the damage process of 25 groups of RC with different content and sizes. Furthermore, this paper explores the reasons for the loss of strength. The relationship equation between the compressive strength of RC, the content of rubber, and particle size was derived based on data fitting. Meanwhile, a neural network learning method [46,47,48] was used to collect 197 sets of data from 23 studies, and a neural network model of particle size, replacement content, control concrete strength, and rubberized concrete strength was established to predict the static strength of RC. In the study of dynamic impact, the stress–strain curves sets of RC with different rubber admixtures at three different strain rates were analyzed using the SHPB test. They were fitted based on DIF and strain rate, and the DIF equations of RC with different rubber contents and different rubber particle sizes were established by the fitting method. The energy absorption capacity of RC was also analyzed. The work in this paper can demonstrate the static and dynamic mechanical behavior of RC, which is instructive for applying RC as a future building material.

2. Methodology

This article explores the influence of rubber particle size and content on the dynamic and static mechanical properties of RC. In previous literature research, it was found that as the rubber content exceeded 30%, there was a significant loss in the strength of RC. Therefore, the replacement content of rubber in this design is 2%, 5%, 15%, and 30%. At the same time, particle size exceeding 20 mm also causes a significant loss in the strength of RC. In order to explore the pattern, rubber particle sizes of 0.1 mm, 0.5 mm, 2 mm, 5 mm, 10 mm, and 20 mm were selected. An experimental program was created to observe several RC mixtures’ dynamic and static mechanical properties, and the results were analyzed. The experimental program diagram is shown in Figure 1.

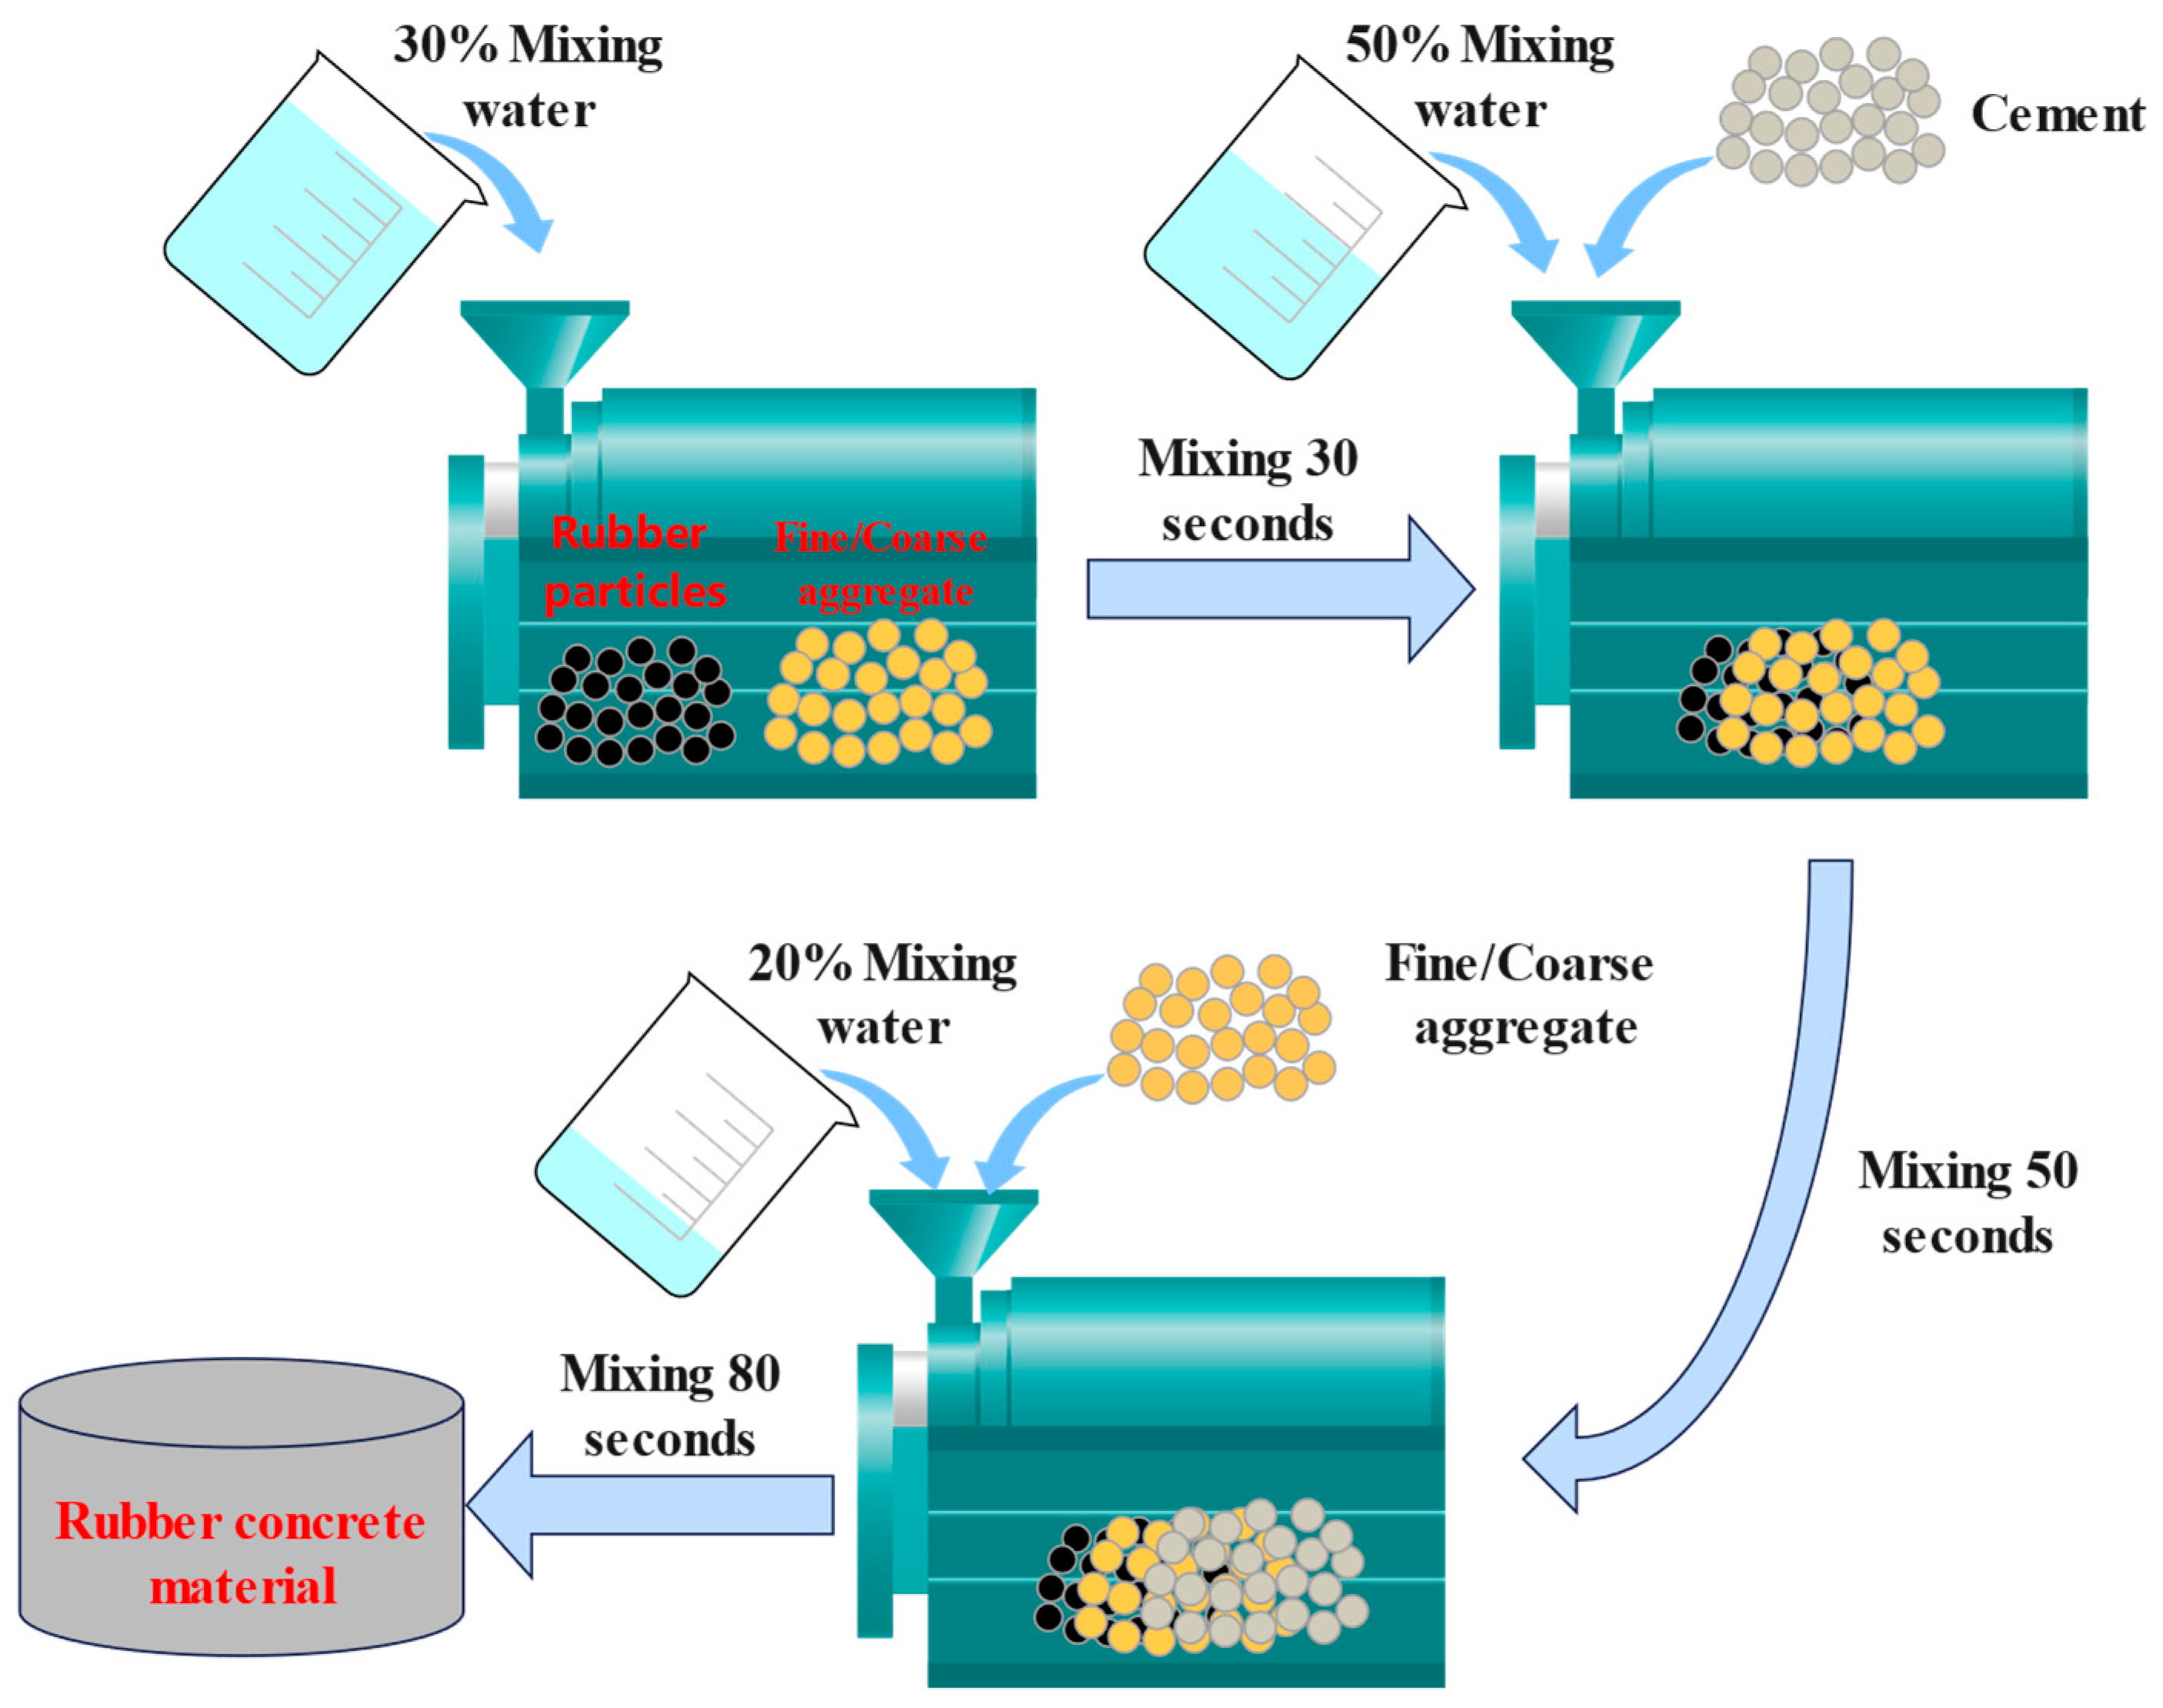
2.1. Material Preparation

The concrete mix ratio is selected based on Chinese Code for the Mix Design of Ordinary Concrete (JGJ55-2011) [49]. The cement used in this research is Shenyang Jindong P.O.42.5 Ordinary Portland cement, with a density of 3100 kg·m−3. The chemical compositions and physical properties of the cement are shown in Table 1. The coarse aggregate natural gravel has a particle size of 5–15 mm. The grain gradation is continuous, with an apparent density of 2680 kg·m−3. The fine aggregate is river sand, medium sand, and fineness module 2.6, with an apparent density of 2600 kg·m−3. Tap water is used in this research. In order to prevent other factors from affecting the mechanical properties of concrete, concrete admixture is not used in the experiment. Rubber is produced by the Sichuan Huayi Rubber Company, and six different sizes of rubber (0.1 mm, 0.5 mm, 2 mm, 5 mm, 10 mm, and 20 mm) and five different replacement rates (0%, 2%, 5%, 15%, and 30%) are used to make the RC. By using the sieving method, the particle size of the rubber is controlled to meet the experimental requirements. We use high-precision electronic scales to weigh rubber particles to ensure the accurate control of rubber content. The rubber particle is shown in Figure 2. The single-factor experiment is used for research. This method has high experimental efficiency, can examine the interaction, is more conducive to controlling interference variables, and is closer to reality. The rubber comes from discarded tires, with an apparent density of 1120 kg·m−3. The equal volume method is used to calculate the rubber content of the replacement aggregate. Due to the aggregate particle grading, the rubber size of 0.1–2 mm is replaced with fine aggregate, and rubber with a particle size of 5–20 mm is replaced with coarse aggregate [50]. The concrete–mix ratio is shown in Table 2.
Rubber is a kind of surface hydrophobic material, and rubber particles easily float in the process of stirring, affecting the mix’s performance. The method of mixing the RC is different from that of normal concrete. In this experiment, rubber particles, according to their particle size, were first mixed with aggregate and water. We made sure the rubber surface was thoroughly wet. Secondly, we mixed the cement to ensure the rubber and cement were evenly mixed. The process flow chart is shown in Figure 3.
After the mix, we place the mixture into the mold. After that, it is placed on a shaking table to expel the air bubbles. Then, we cover it with plastic wrap to prevent water loss. After 24 h, demold the sample and place it in a curing box with a humidity of not less than 95% and a temperature of 20 °C ± 2 for 28 days. After 28 days, the concrete specimens are subjected to water grinding and cutting processing to ensure that the surface’s flatness, smoothness, and verticality meet the test requirements.

2.2. Mechanical Testing

2.2.1. Quasi-Static Compressive Test

The electro-hydraulic servo compressive strength testing machine tests compressive strength. We use high-speed cameras to capture the process of crack formation during loading. The sample sizes are 100 mm × 100 mm× 100 mm. The loading rate of the experiment is 0.5–0.8 MPa per second. It is acceptable to use Formula (1) based on the Chinese standard (GB/T50081-2002) [51] to calculate the compressive strength of the samples.
f c , s = F A
f c , s is the compressive strength of the cube specimen. F is the sample failure load, and A is the specimen-bearing area. As the sample size is 100 mm × 100 mm× 100 mm, the final figure also needs to be multiplied by the conversion factor 0.95.

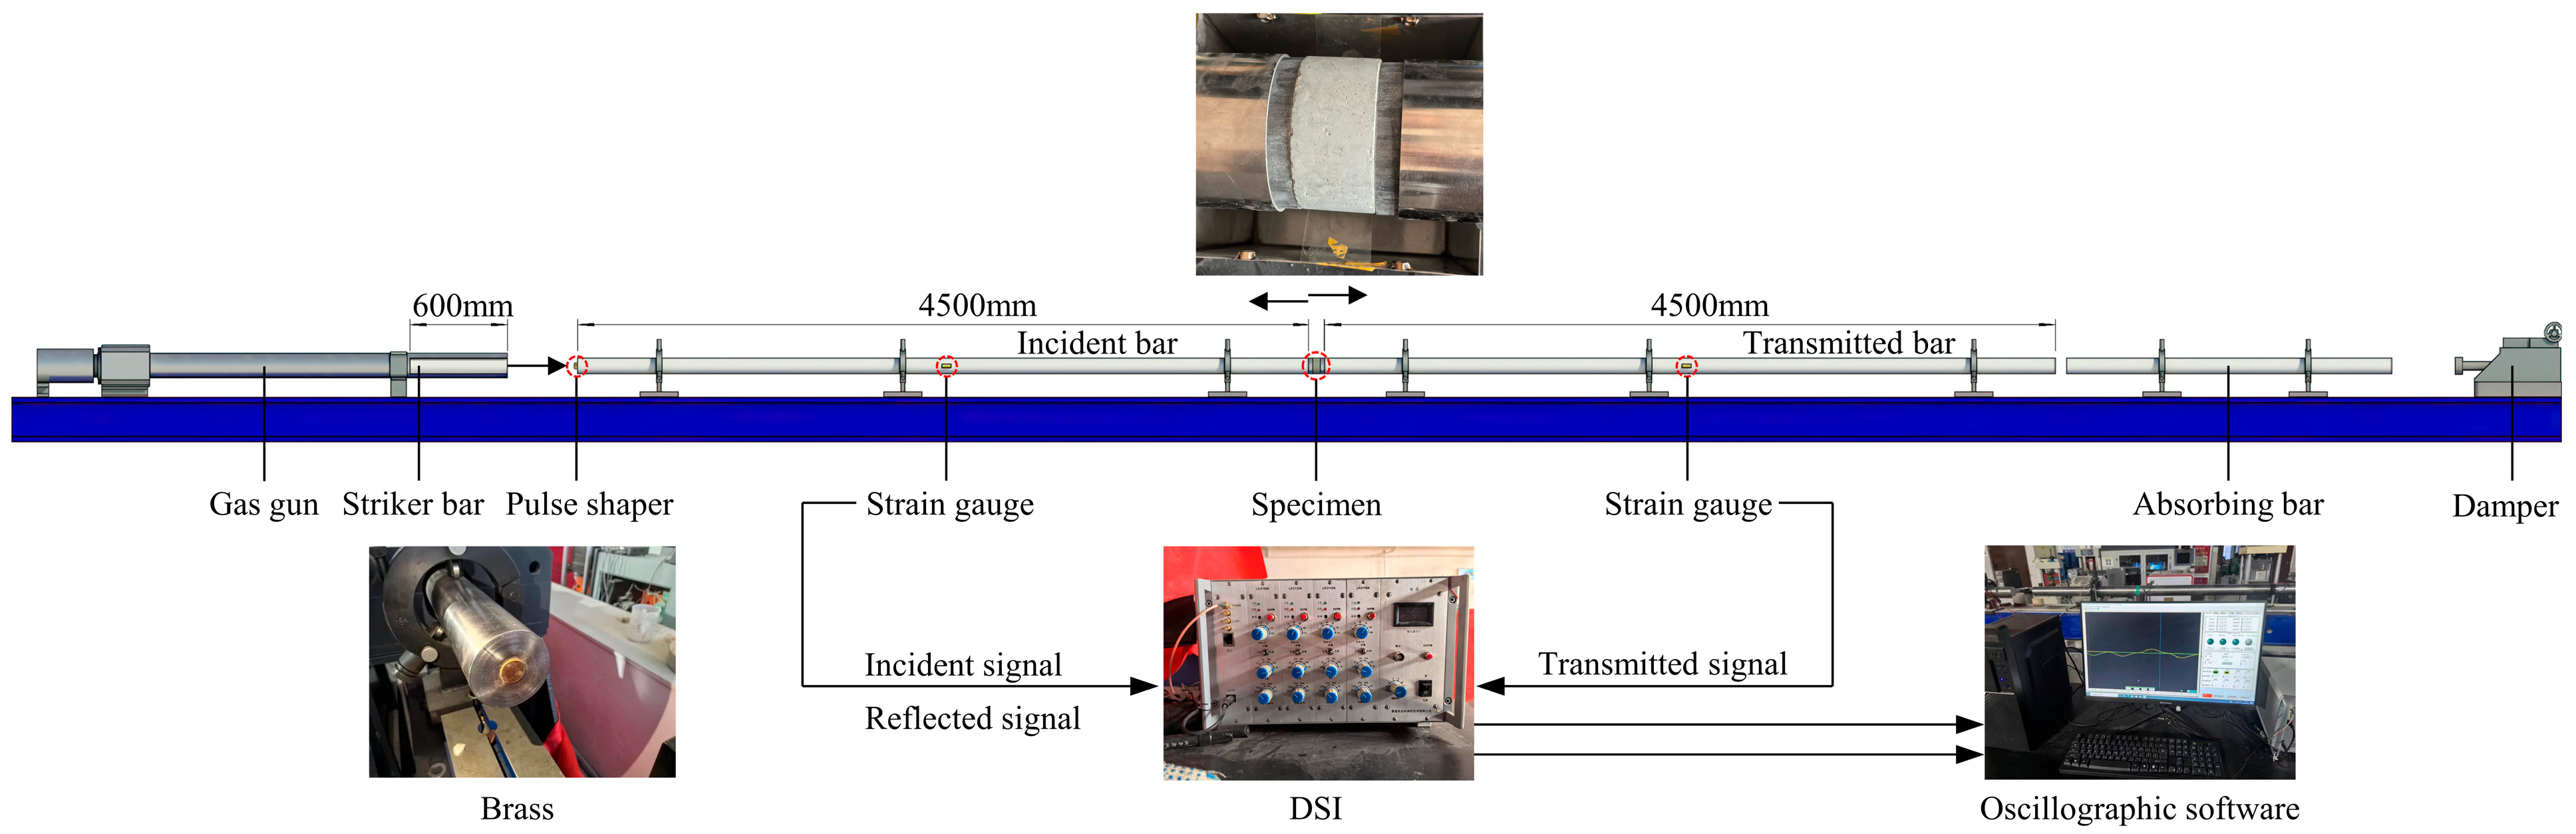
2.2.2. Dynamic Compressive Test

The split-Hopkins pressure bar (SHPB) tested the dynamic mechanical properties. The machine is shown in Figure 4. The sample sizes are φ100 mm × 50 mm. The basic principle of this test is the propagation theory of elastic waves in elastic rods. Based on the assumption of stress uniformity, the stress wave repeats 2–3 times in the sample and is equal everywhere. Using the assumption of stress uniformity ( ε i ( t ) + ε r ( t ) = ε t ( t ) ), we use the two-wave method [52]. The compression strain rate  ε ˙ s t , the compressive strain  ε s t , and the compressive stress  σ s t  can be calculated using the following Formula (2).
  ε ˙ s t = 2 c b l 0 ε r ( t ) ε s t = 2 c b l 0 0 t ε r ( τ ) d τ   σ s t = r b 2 r 0 2 E b ε t ( t )
E b is the elasticity modulus of the elastic rod, τ is the time variable, t is the time, c b is the stress wave velocity in the rod, and r b and r 0 are the radius of the bar and the sample. l 0 is the length of the sample. ε i ,   ε r , and  ε t  are respectively the incident, reflected, and projected strains in the bar.
We use the φ100 mm SHPB system by adjusting the impact speed of the φ100 mm × 600 mm bullet, and we obtain three strain rates for each sample (the three strain rates are 70–300 s−1) to study the dynamic behavior of RC under different strain rates.
In order to ensure the accuracy of SHPB test results and constant strain rate loading during the test process, a brass plate was used as a pulse shaper [53,54,55]. It was pasted at the center of the impact surface of the incident rod as a pulse shaper. Comparative experiments were conducted on pulse shapers of brass and copper of different sizes based on different speeds. After comparisons, brass pieces with a diameter of 30 mm and a thickness of 1 mm and 2.5 mm were chosen as pulse shapers. This technology helps shape the incident wave. The plastic deformation of the pulse shaper can physically filter out the high-frequency components of the incident wave, reducing wave dispersion. Extending the rise time of the incident wave and presenting an approximately half-sine pulse is crucial for achieving stress balance in the specimen, making the SHPB test results in this paper reliable.
Figure 4. SHPB test system.
Buildings 14 01541 g004

3. Results and Discussions

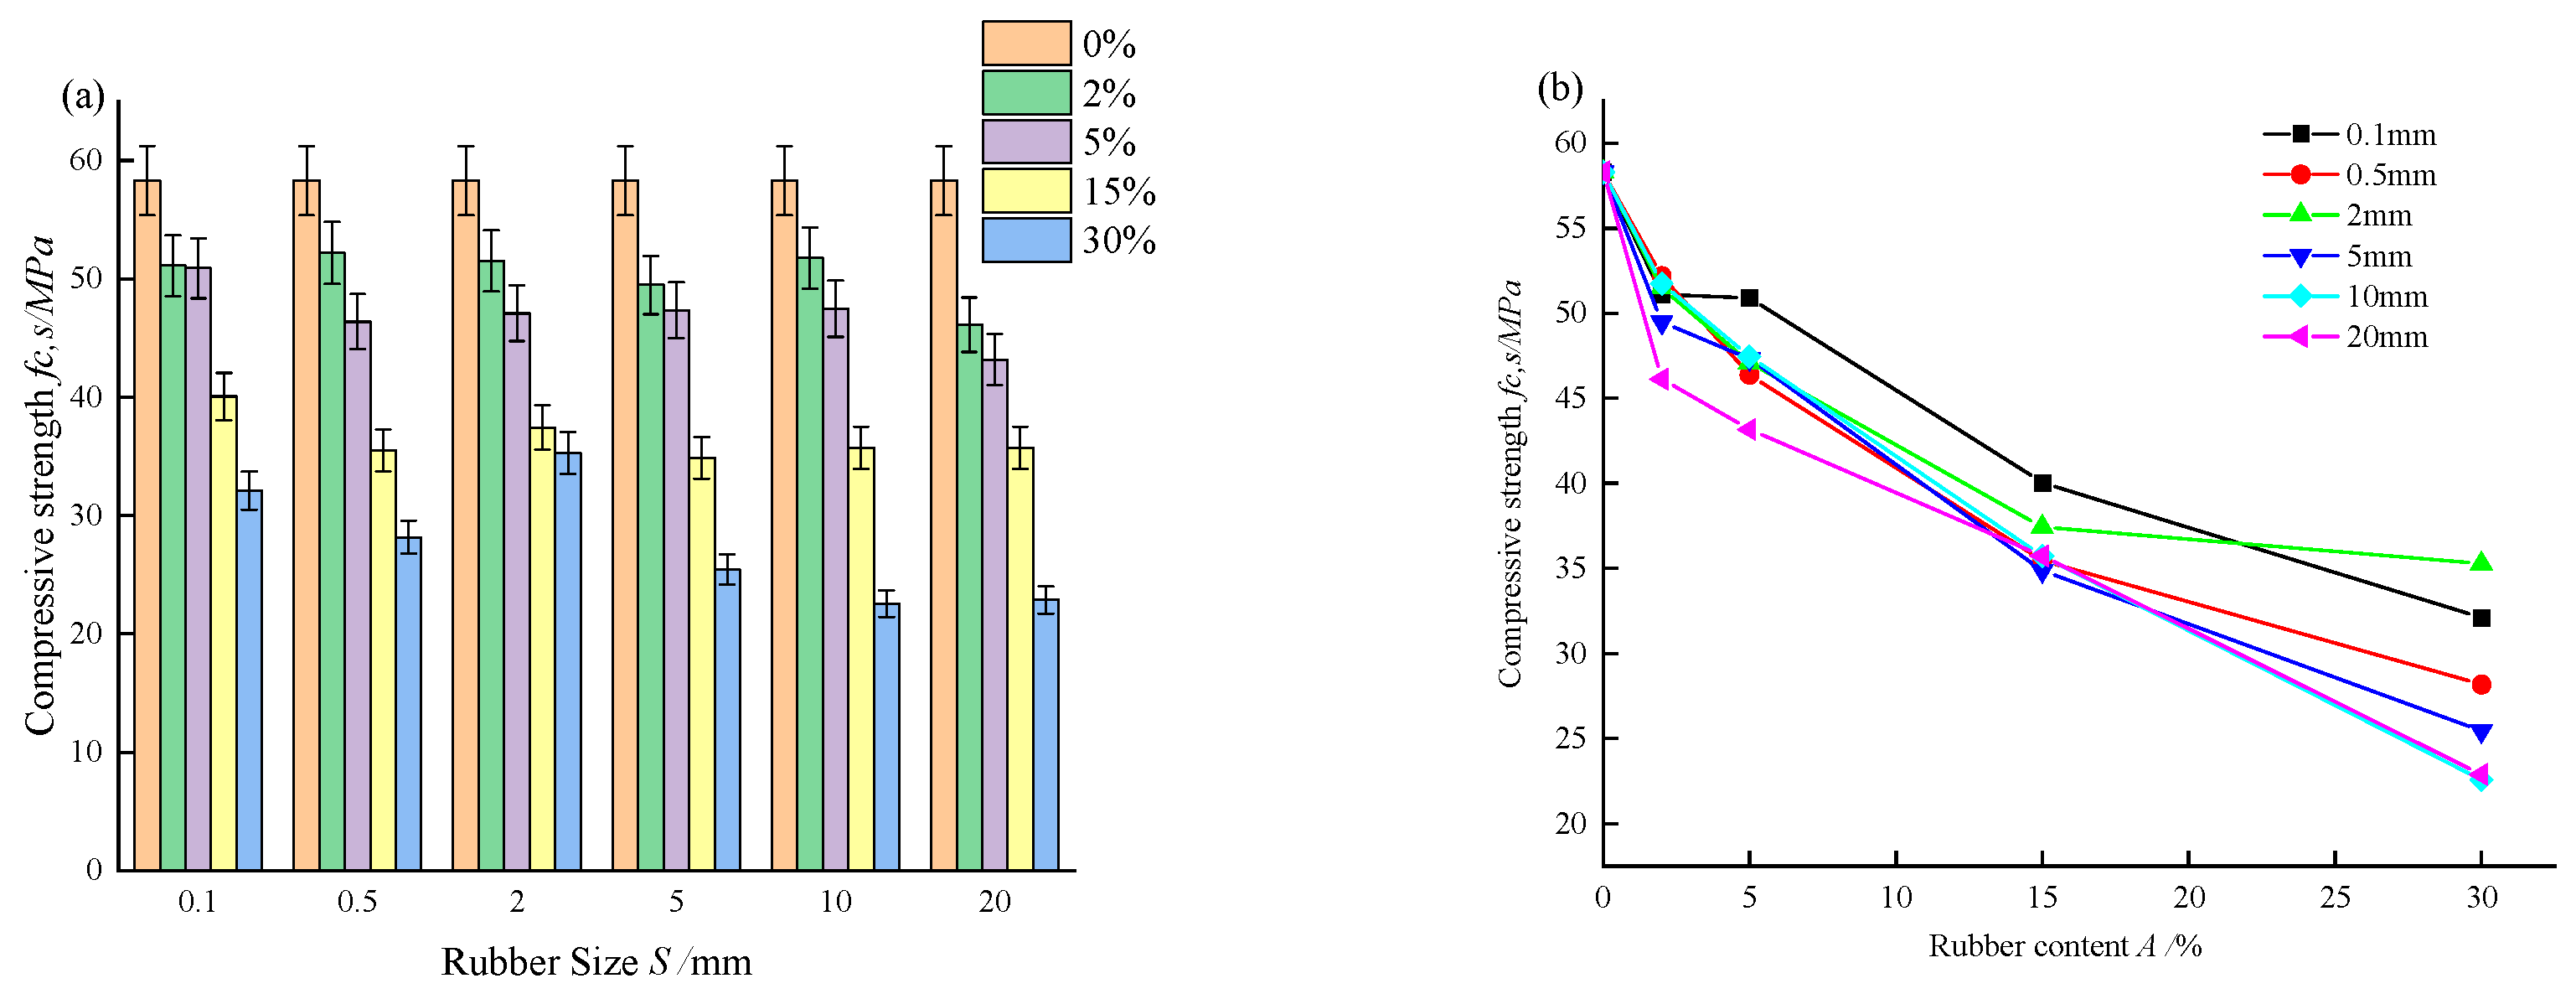
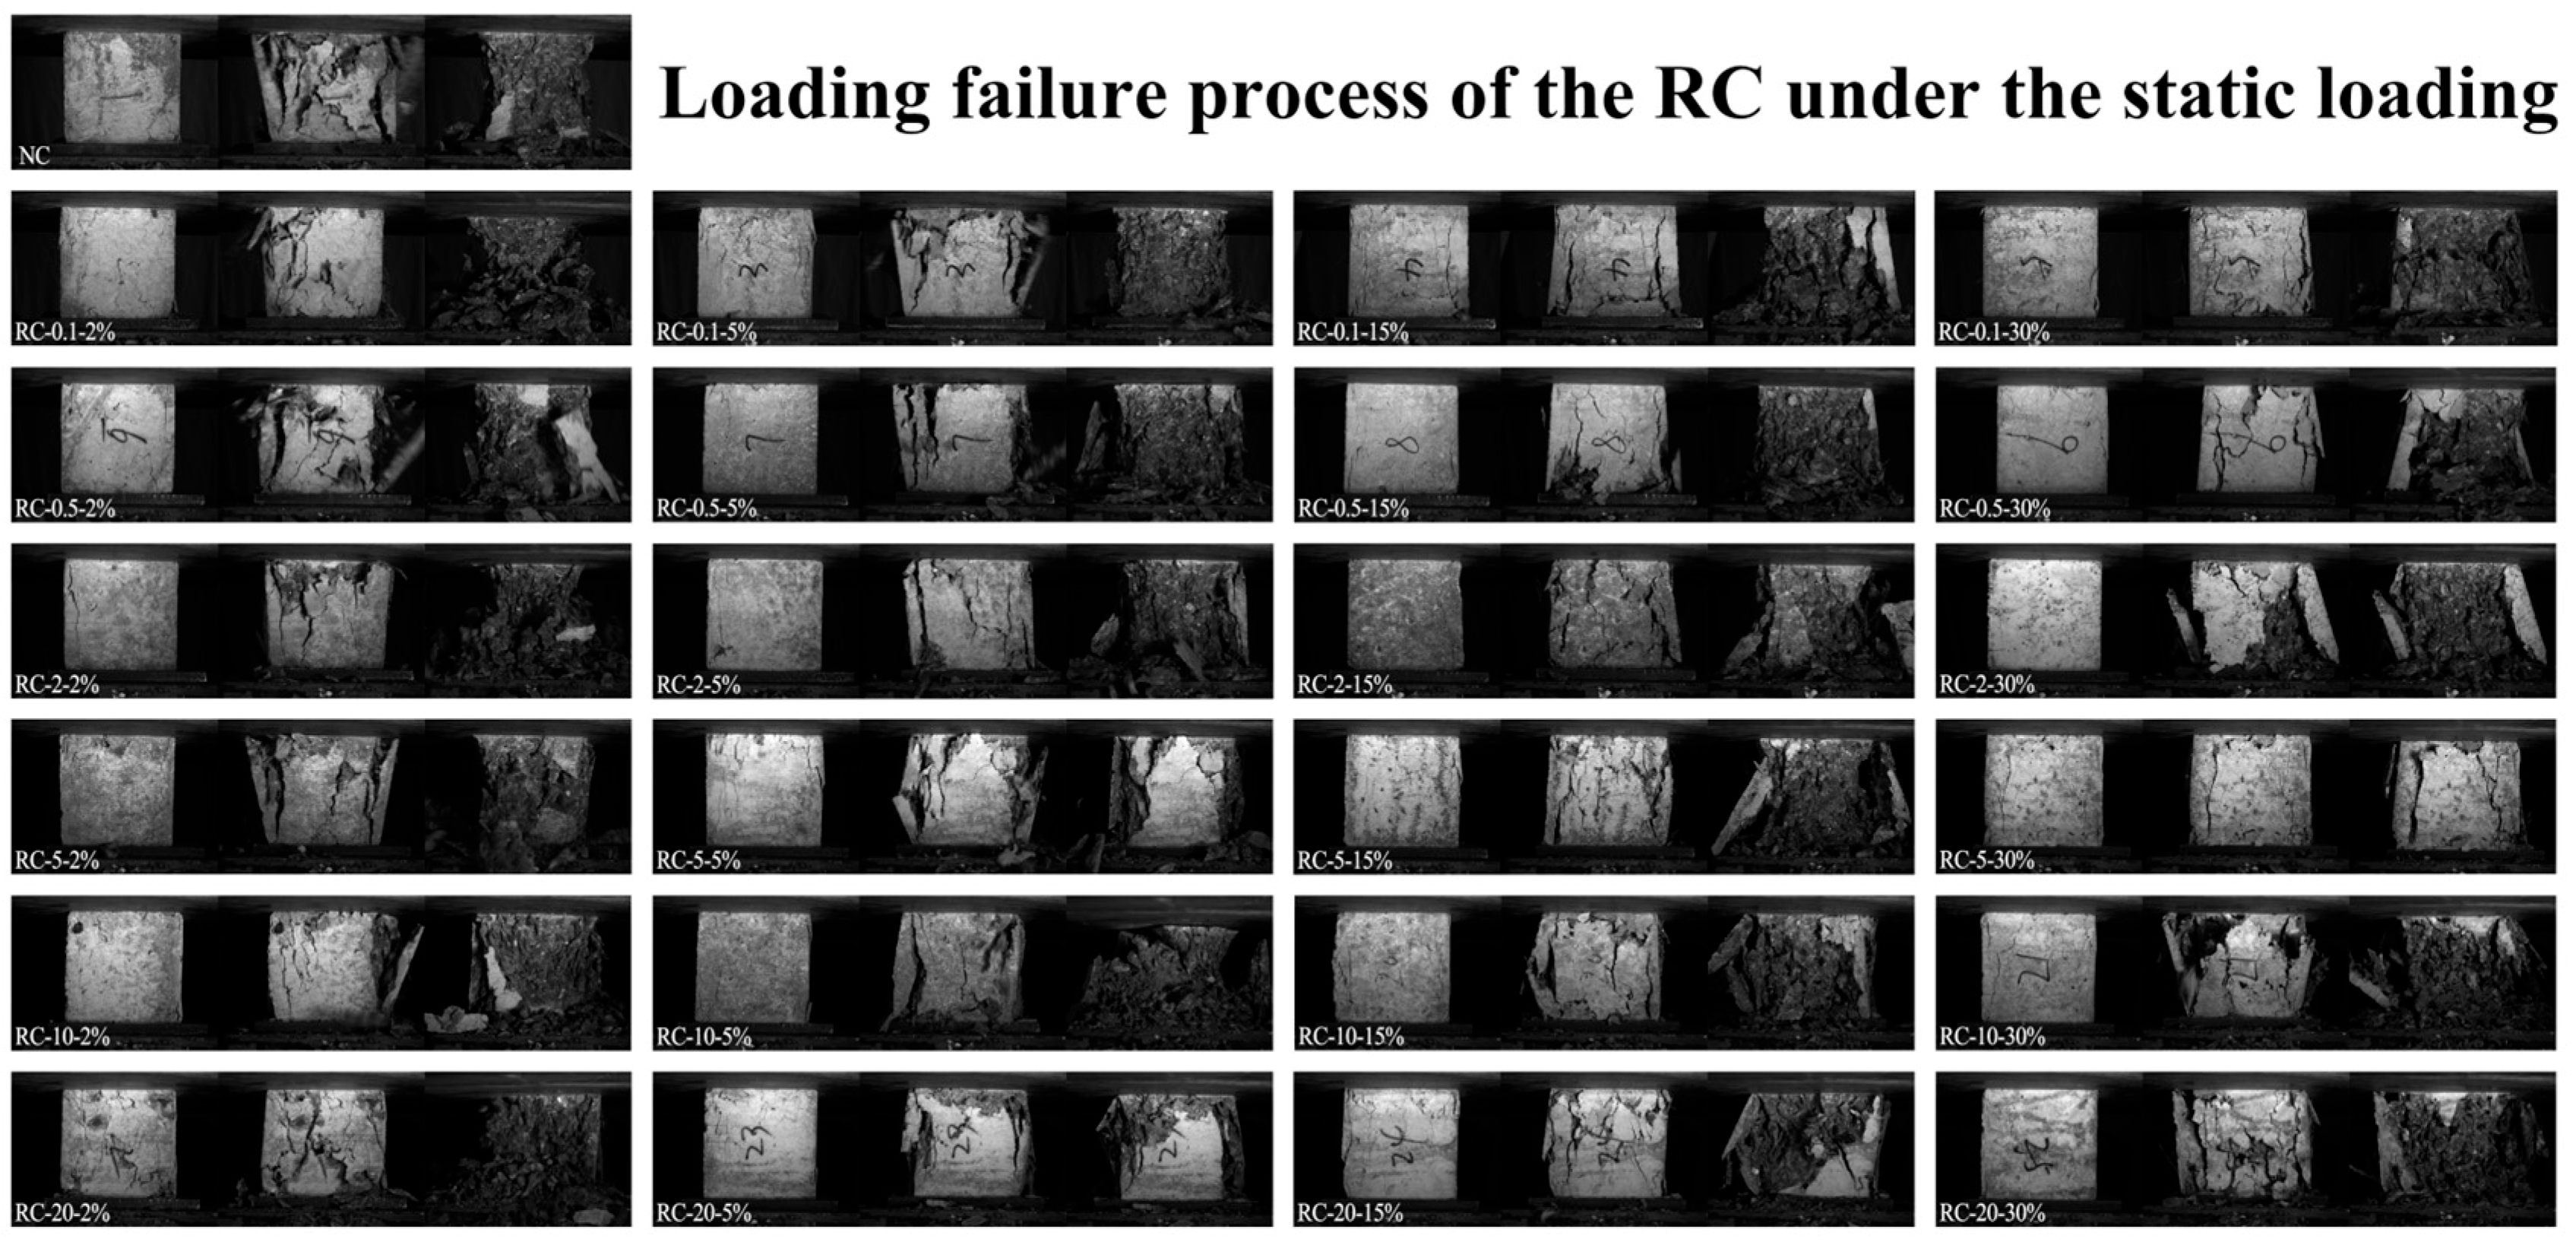
3.1. Static Compressive Strength

In order to better explore the relationship between RC and rubber particle size and content, Figure 5 is drawn. It can be observed that the addition of rubber weakened the original strength of concrete. When the rubber content was increased from 0% to 30%, the compressive strength of different particle sizes decreased by 40–61%. The largest decrease in strength, with a drop ratio of 61%, was observed in the specimen RC-10-30. The specimen RC-0.5-2 exhibited the lowest strength decrease ratio, which was 11%.
Figure 5 demonstrates a non-linear decline in the compressive strength of RC as the rubber sizes range from 0.1 to 20 mm. The alteration in content has a greater effect on RC’s compressive strength than does the variation in particle size.
Through the static loading test process, the results obtained by high-speed cameras show that the increase in rubber reduces the fissure of concrete during the process. The integrity of damaged RC specimens is significantly better than that of normal concrete specimens, and this performance becomes more pronounced as the rubber content continues to increase, as shown in Figure 6. Adding rubber to normal concrete can improve the brittle damage of ordinary concrete and increase the toughness.
The decrease in concrete strength caused by the addition and replacement of rubber can be explained by the following theories:
(1)
Rubber and concrete have different moduli of elasticity [56]. The elastic modulus of concrete is about 5000–24,000 times that of rubber. This difference makes RC prone to cracking around the rubber during the loading process, thereby accelerating the damage to the concrete during the loading process.
(2)
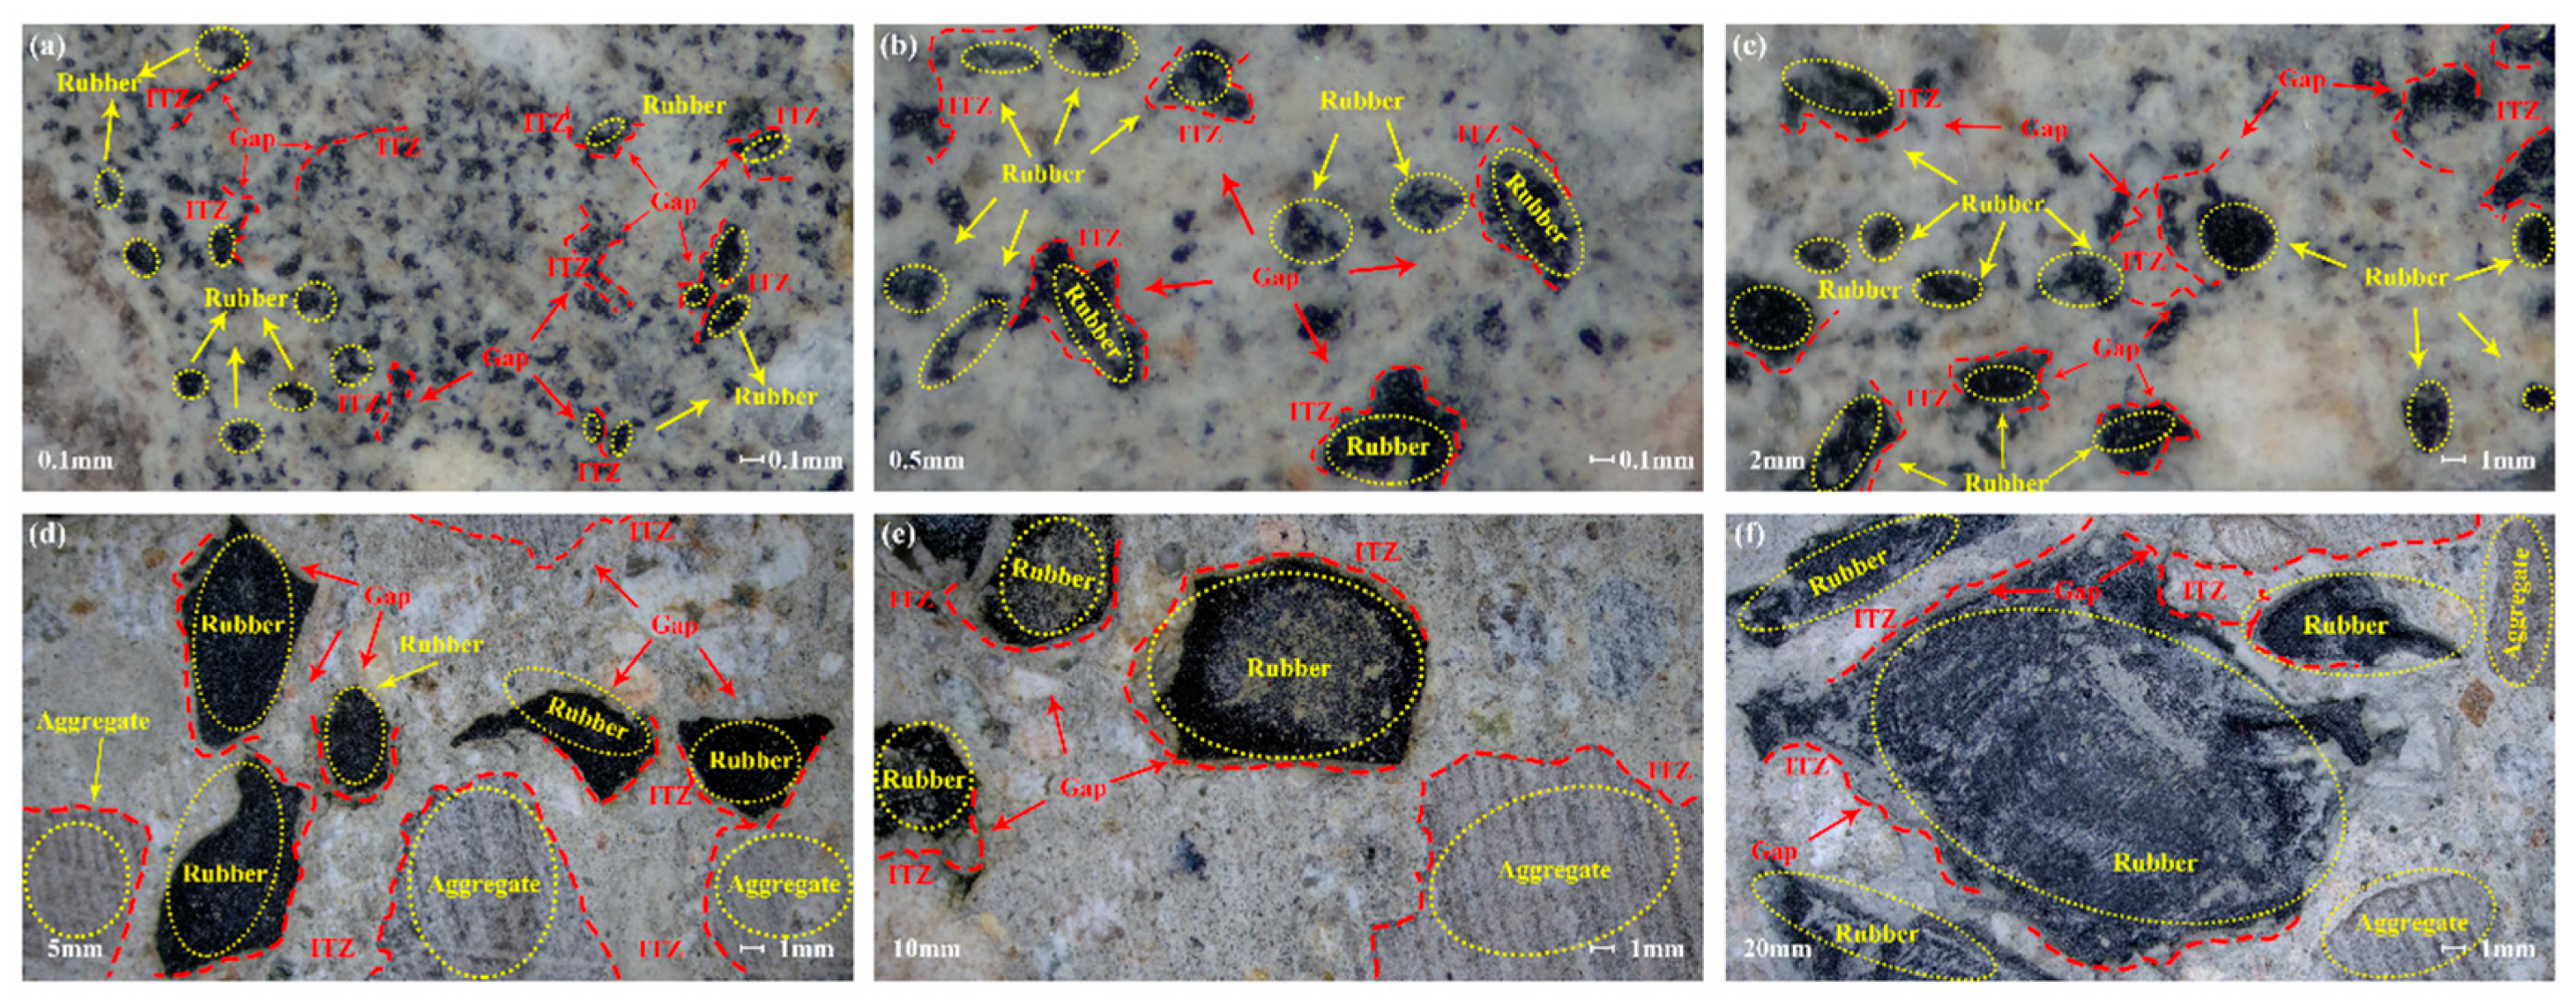
By observing the surface of the RC with a microscope, as shown in Figure 7, it can be found that there is a gap between rubber aggregate and cement paste. Because of the hydrophobic properties of rubber, the interface adhesion between rubber aggregate and cement slurry is low, resulting in a reduction in strength.
(3)
Aggregates mainly play a role similar to human skeleton in concrete, so good grading can help the accumulation of concrete to form the best state. The increase in rubber has disrupted the grading between the original sand and stone [57].
Figure 7. Surface performance of RC specimens with different particle sizes: (a) 0.1 mm, (b) 0.5 mm, (c) 2 mm, (d) 5 mm, (e) 10 mm, (f) 20 mm.
Buildings 14 01541 g007

3.2. Compressive Strength Fitting Analysis

The relationship with the compressive strength of RC and the rubber content and size can be established by analyzing the strength of normal concrete. Since the influence of rubber content on the change in compressive strength is dominant, formula fitting is first performed based on the relationship between rubber content and compressive strength. After many verifications, it was found that the linear fitting effect was better during the fitting process. At the same time, when the rubber content is 0%, the test block is normal concrete, so the intercept of the linear fitting formula is set to 58.3, which is the strength of the control concrete (normal concrete). The parameters of different particle sizes in Table 3 are fitted to the formula. The specific fitting process is shown in Figure 8. After multiple verifications, it was found that the exponential fitting effect is better. They are shown in Formula (3).
f c , s = 0.35 e 0.29 · S 1.3 × C + f c , s , n o r m o l                       0.1   m m S 20   m m , C 30 %
In the formula, C is the rubber’s content, S is the rubber’s size,   f c , s is the quasi-static compressive strength, and f c , s , n o r m o l is the control concrete (normal concrete) compressive strength, and the result of this experiment is 58.3.

3.3. Compressive Strength ANN Analysis

Compared to normal cement concrete, RC properties have varying changes, and the mechanism of action is relatively complex. Making a good theoretical model for strength prediction takes time and effort. Artificial neural network models can be well applied to predict the compressive strength of RC due to their strong nonlinear mapping ability and adaptive learning and memory characteristics [58]. The artificial neural network is a black box structure that can be established and applied to predict the compressive strength of waste RC.

3.3.1. Collection and Classification of Samples

We obtained data from the literature to increase the accuracy of the neural networks. A total of 222 RC data were obtained, among which 25 were static test data in this paper and 197 were obtained from other literature, all of which are shown in Table 4.
The first 70% of the confirmed data is used as the training set, and the last 30% is used as the validation and testing set.

3.3.2. Normalization of Sample Data

Due to the large distribution range of data, in order to avoid saturation of the neural network neuron output due to a certain net input absolute value being too large, and to avoid some data with small values being ignored, resulting in output distortion, it is necessary to perform scale transformation on the original data. It is necessary to normalize the data [75]. This article uses Formula (4) to normalize the data, transform input and output parameters at the [0,1] area.
x n e w = x x m i n x m a x x m i n  
In the formula, x is the original data true value, x m i n is the minimum value of the data in the original data, x m a x is the maximum value of the data in the original data, and x n e w is the value after normalization.

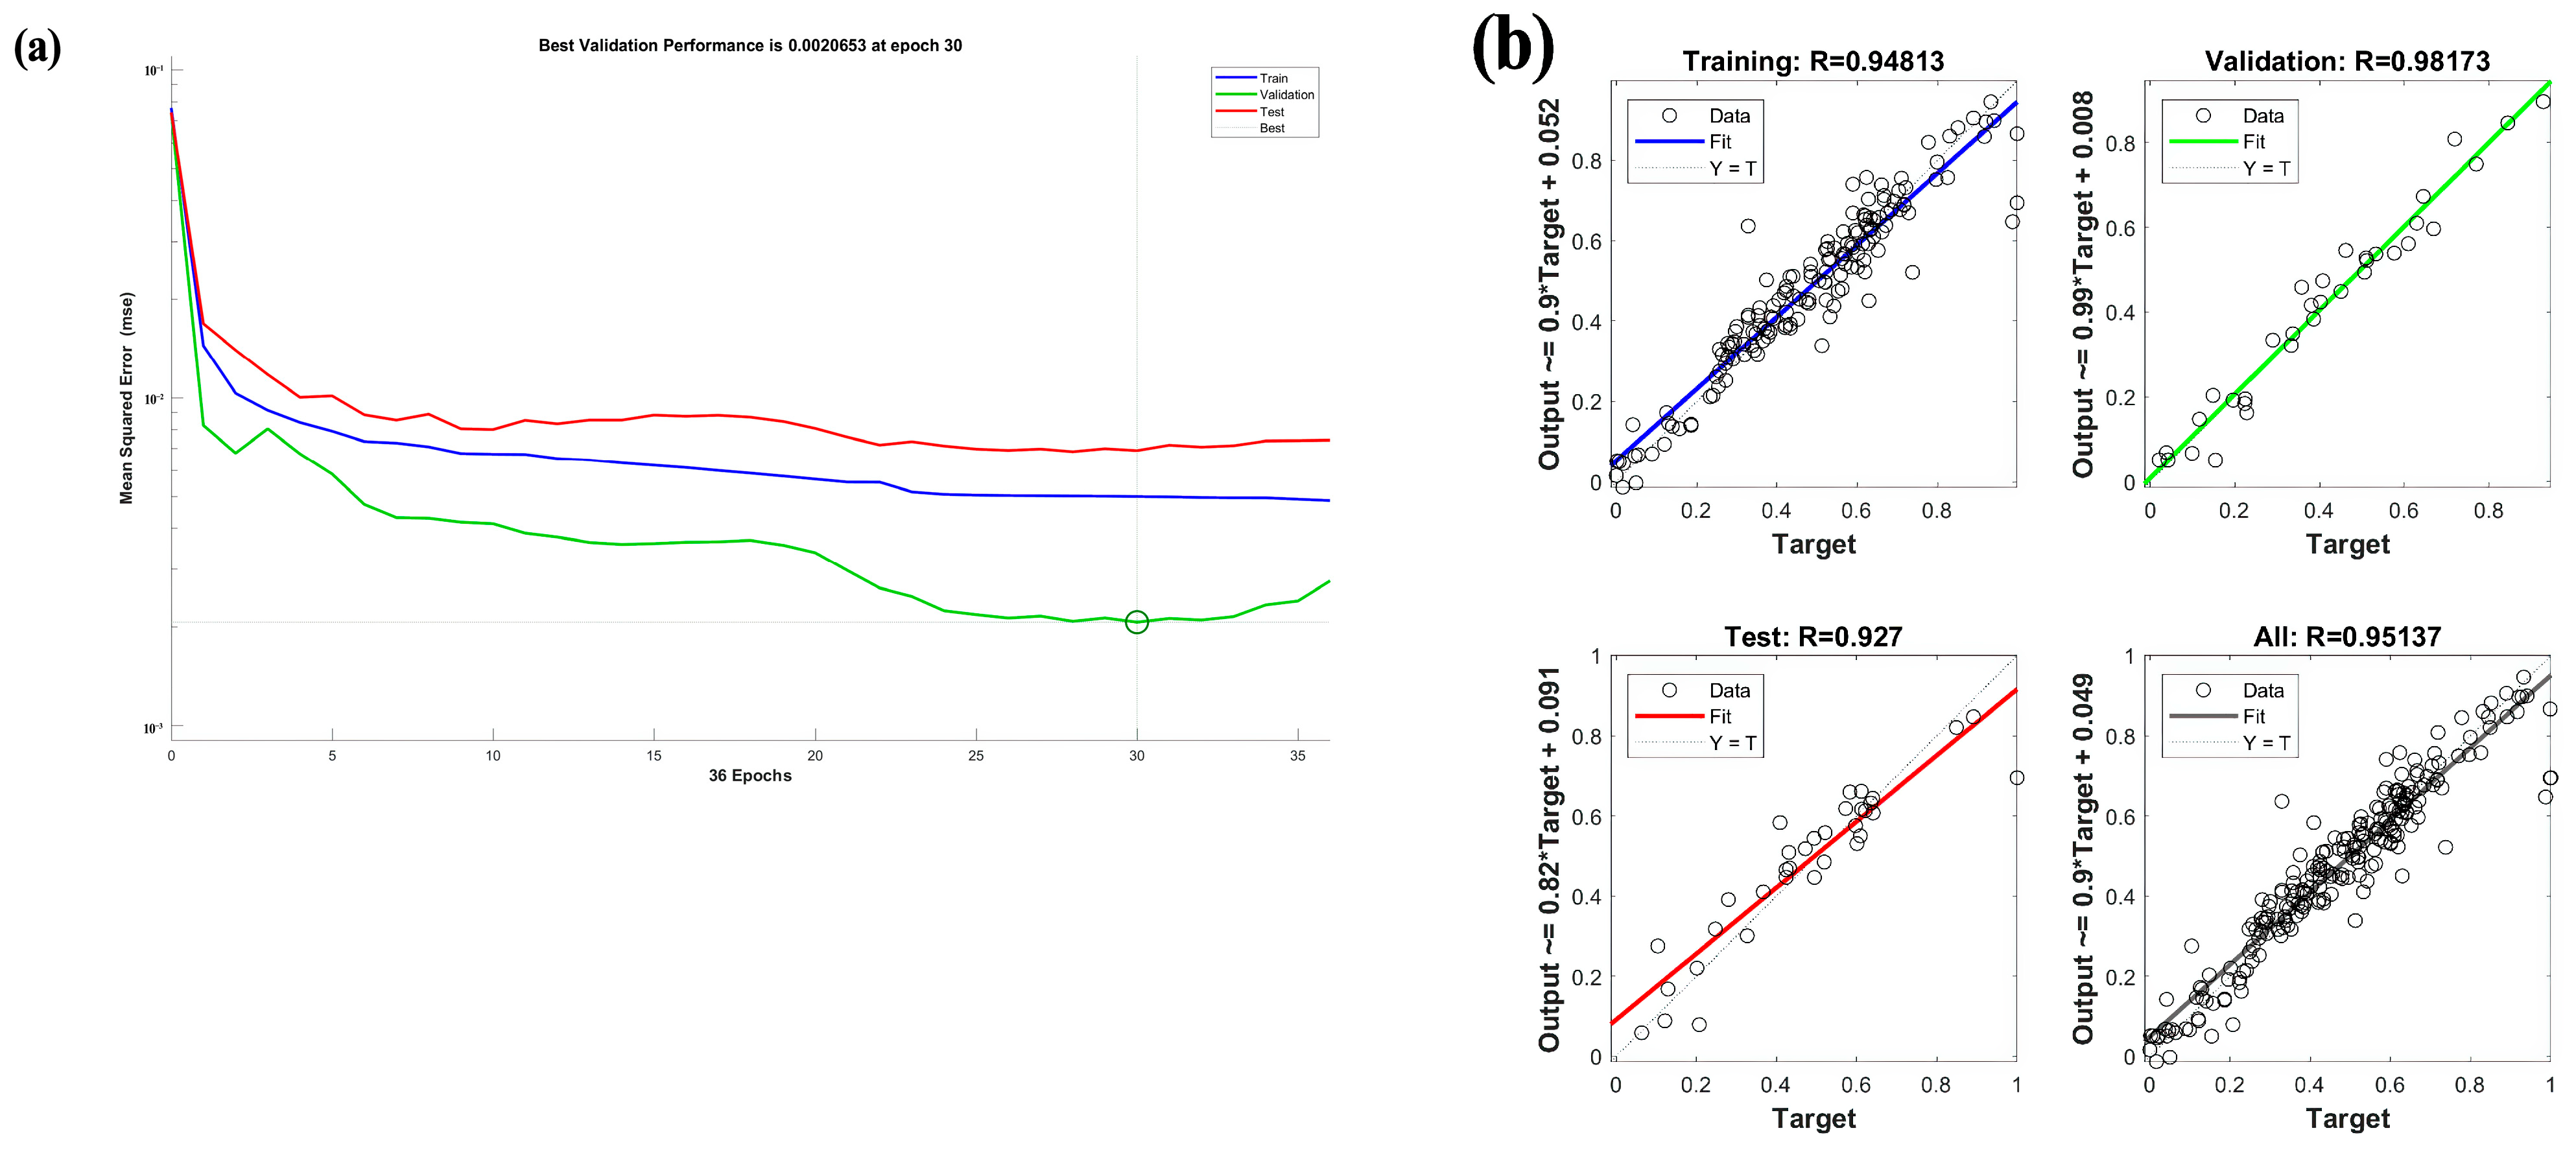
3.3.3. Model Building and Training

The MATLAB R2018b neural network toolbox is used to make the network model. The neural network structure is shown in Figure 9. We set the network model parameters as follows:
(1)
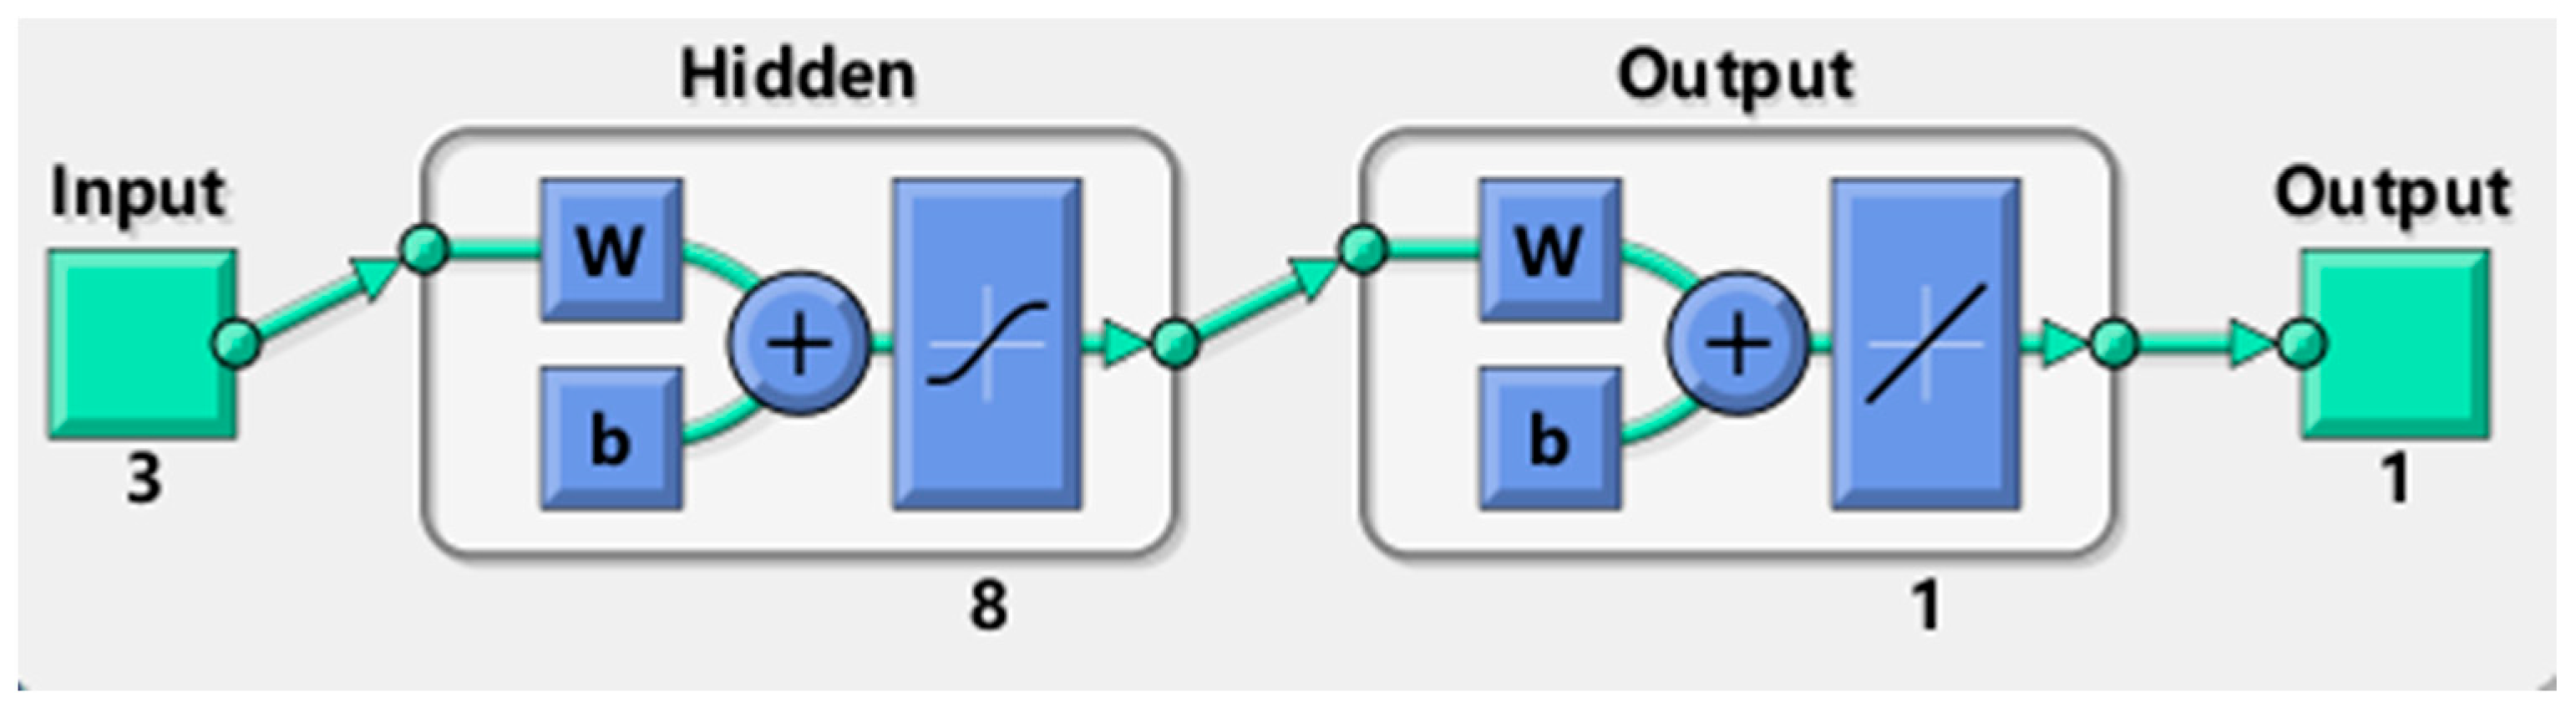
Input layer. The number of input nodes is three, including rubber size, content, and compressive strength of control samples.
(2)
Output layer. The number of output nodes is one, which is the compressive strength of RC.
(3)
Hidden layer. The hidden layer is one layer, and the number of nodes in the hidden layer is eight.
(4)
Training function. We adopt the Levenberg–Marquardt algorithm as a compromise between the Gauss–Newton and gradient descent methods to make the fastest adjustment possible.
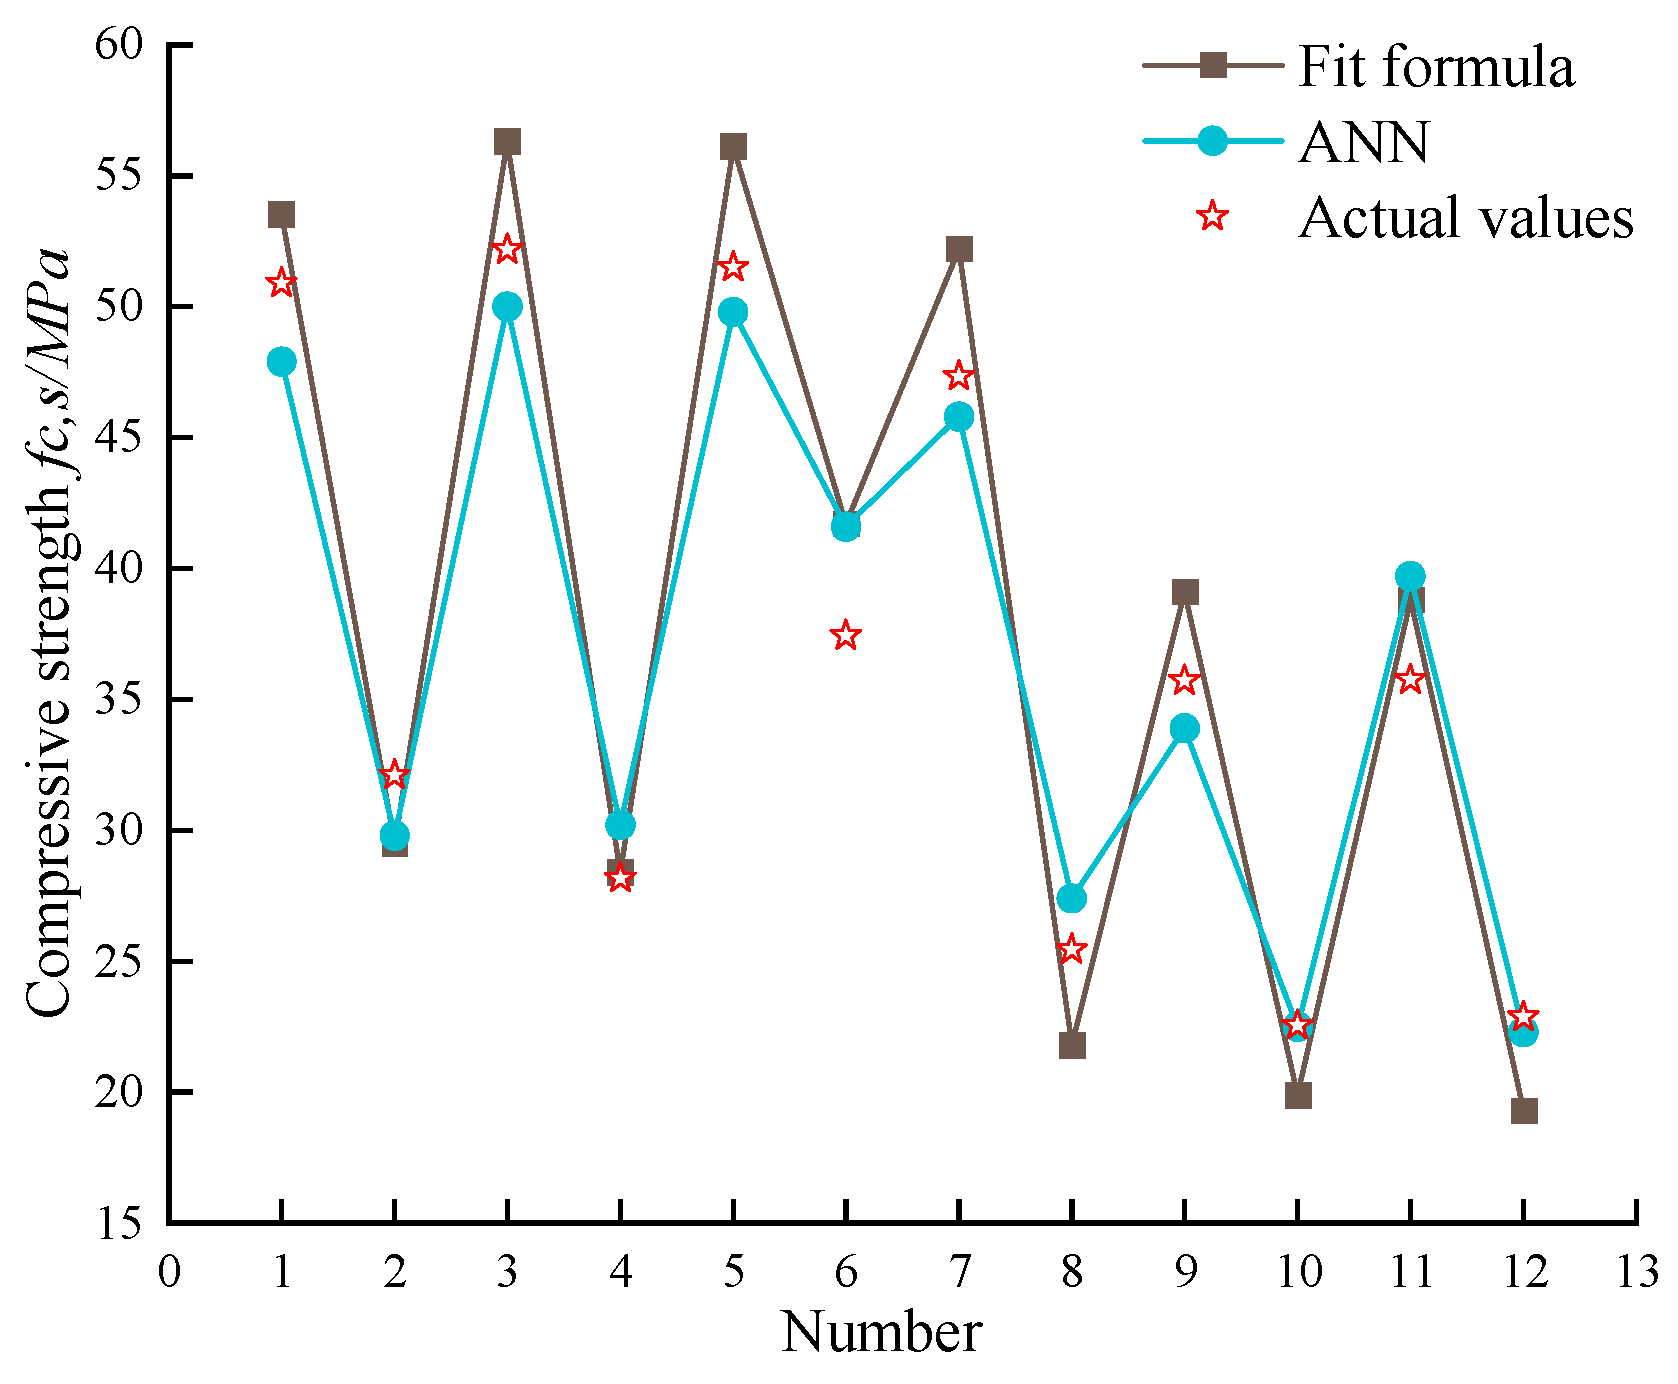
The neural network training performance diagram is shown in Figure 10. At 30 epochs, we achieve good performance. According to the fitting effect drawing in Figure 10, R 2 = 0.95, and so the fitting effect performs well. Therefore, the neural network model can be used to predict the compressive strength of the RC.
Figure 9. BP neural network prediction model for RC.
Buildings 14 01541 g009

3.4. Model Testing

In order to better verify the effect of the fitted model and the neural network model, 12 groups of data were randomly selected from the experimental data for testing. The corresponding prediction results are shown in Figure 11. The data predicted by the neural network need anti-normalization. This article uses Formula (5) to anti-normalize the data:
x = ( x m a x x m i n ) × x n e w + x m i n  
In the formula, x is the original data true value, x m i n is the minimum value of the data in the original data, x m a x is the maximum value of the data in the original data, and x n e w is the value after normalization.
Figure 11. Comparison between predicted and actual results.
Buildings 14 01541 g011
We fit the predicted values through the neural network prediction values of each group of the RC specimens. Comparing the predicted values with the actual measured values, the absolute error and relative error are shown in Table 5 below.
It can be seen from the prediction results of the compressive strength of the randomly sampled neural network and the formula fitting that both the neural network and the formula fitting show good prediction effects. Most of the sample errors are small. The absolute errors are all less than 5 MPa, among which the average absolute error of formula fitting is 3.3 MPa, the average absolute error of the neural network model is 2.1 MPa, the average relative error of formula fitting is 9%, and the average relative error of neural network simulation is 5%. Thus, both approaches can predict the compressive strength of RC.

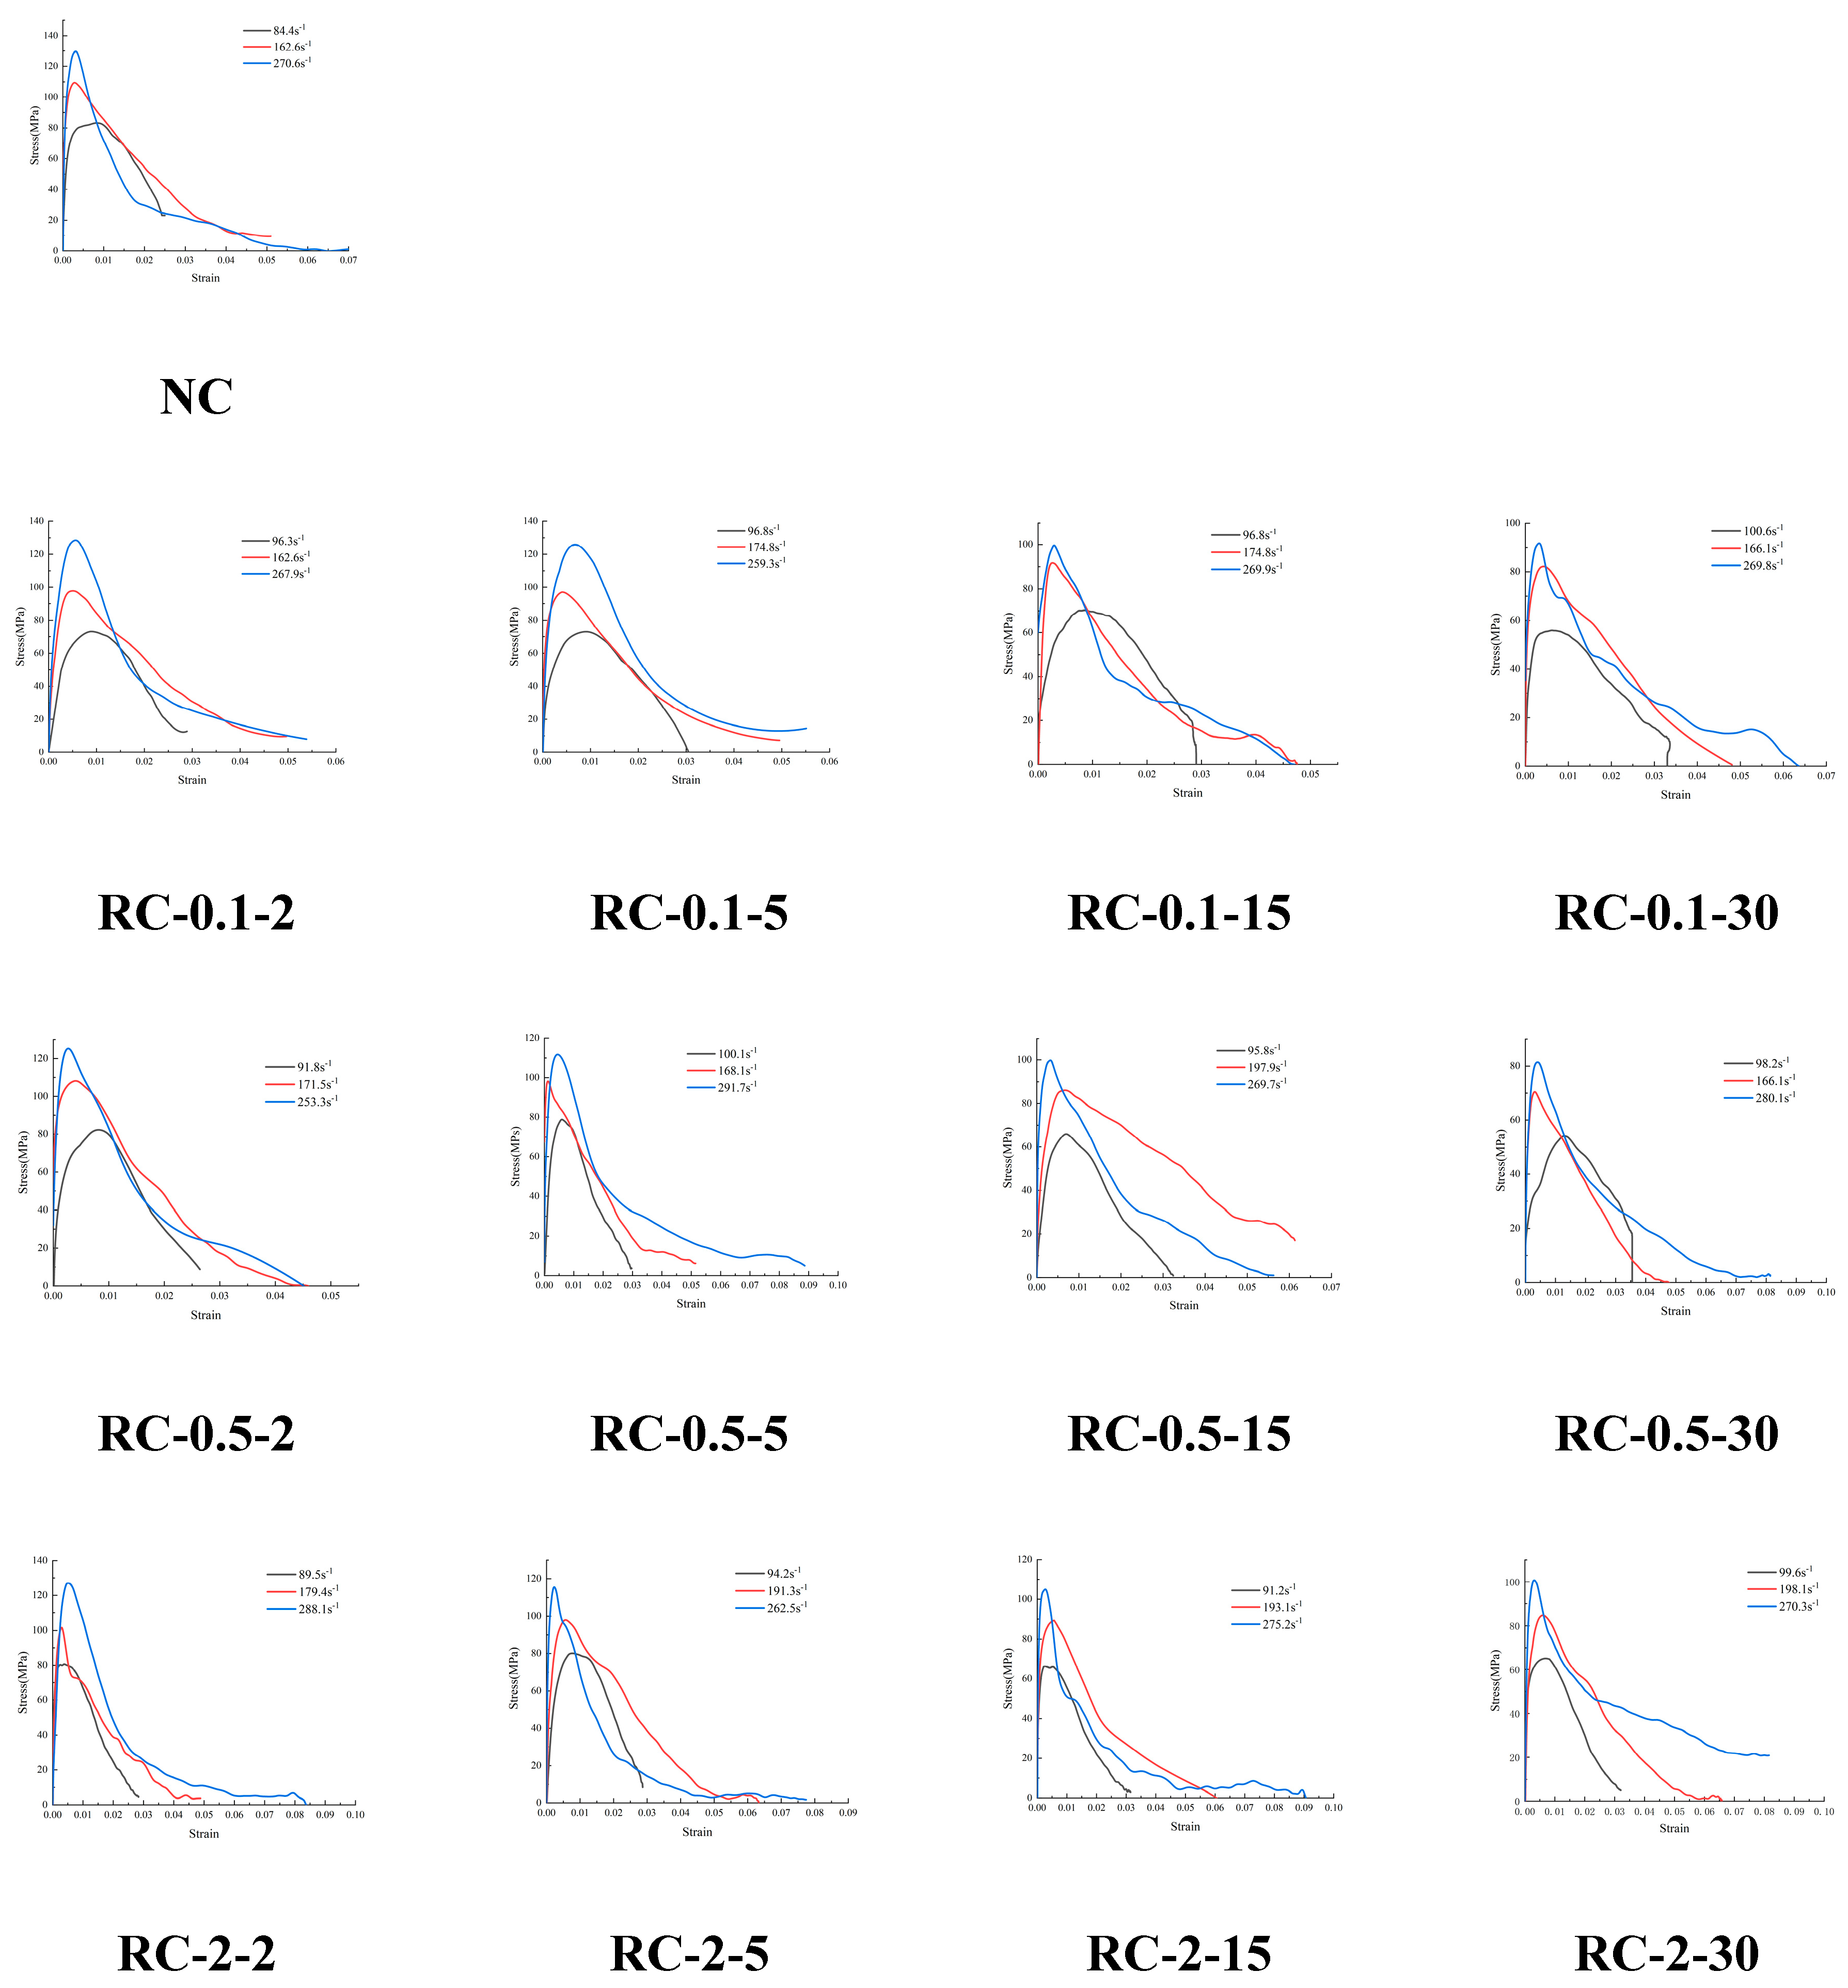
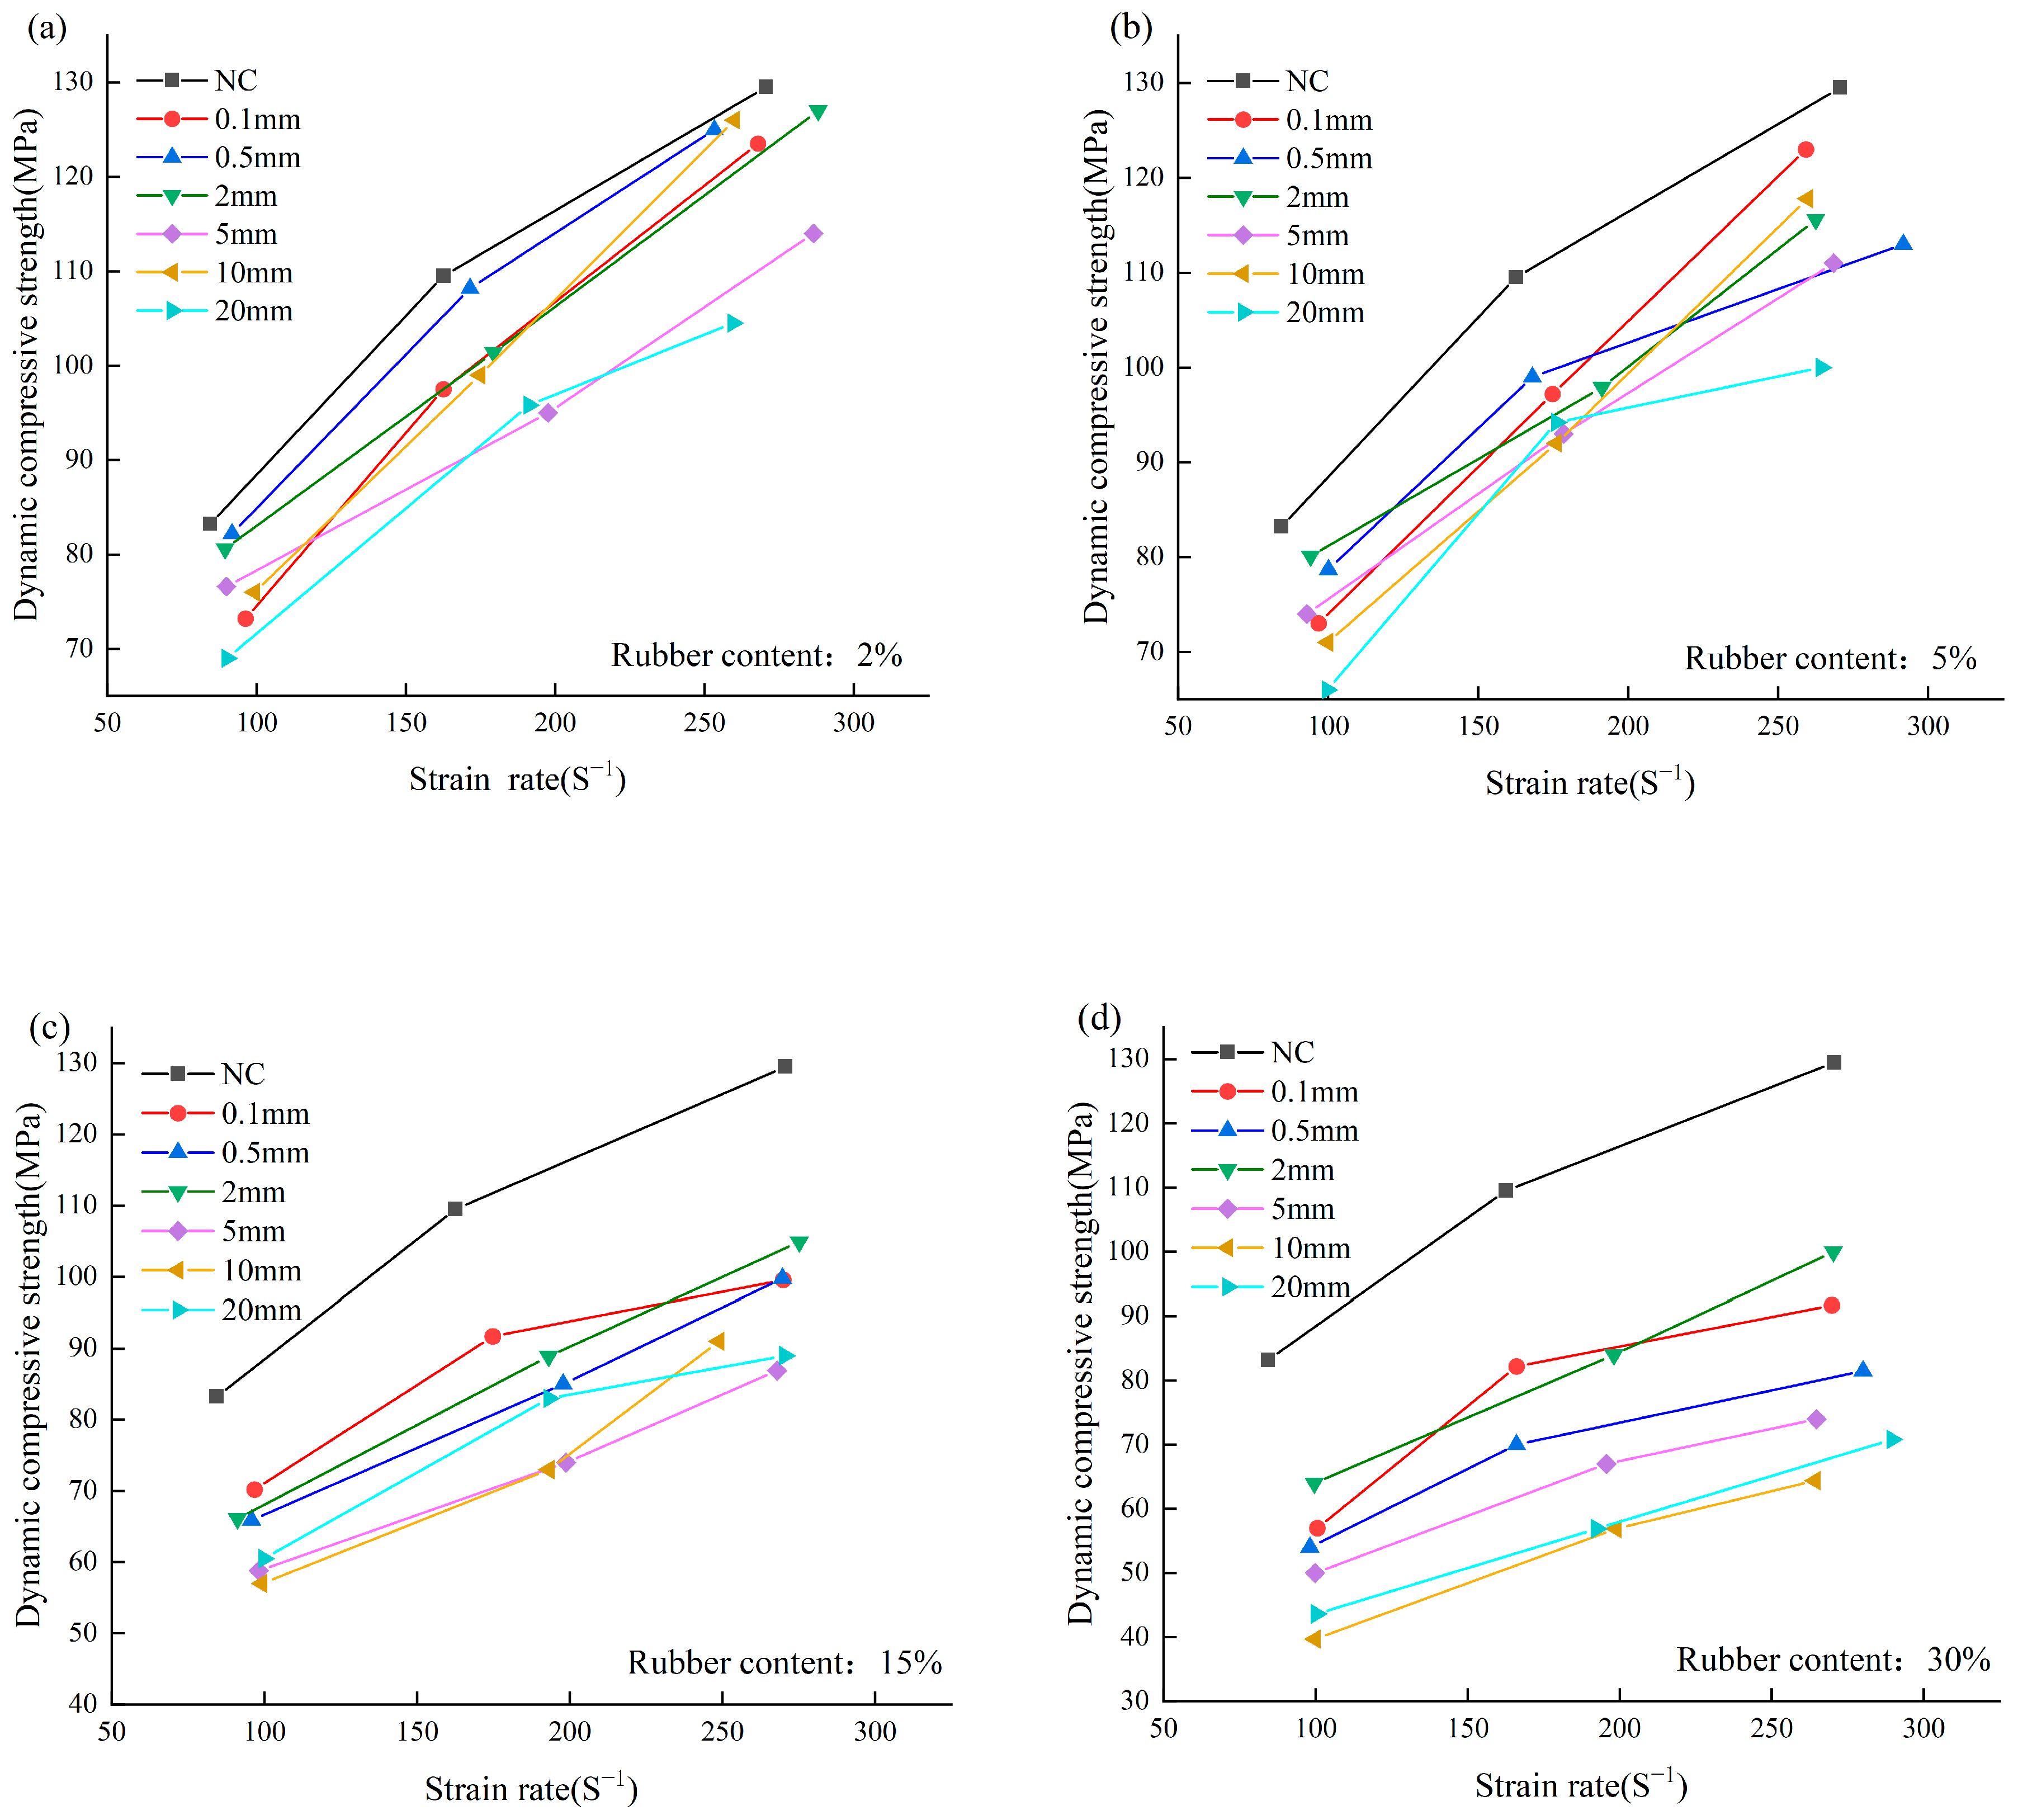
3.5. Dynamic SHPB Test Result
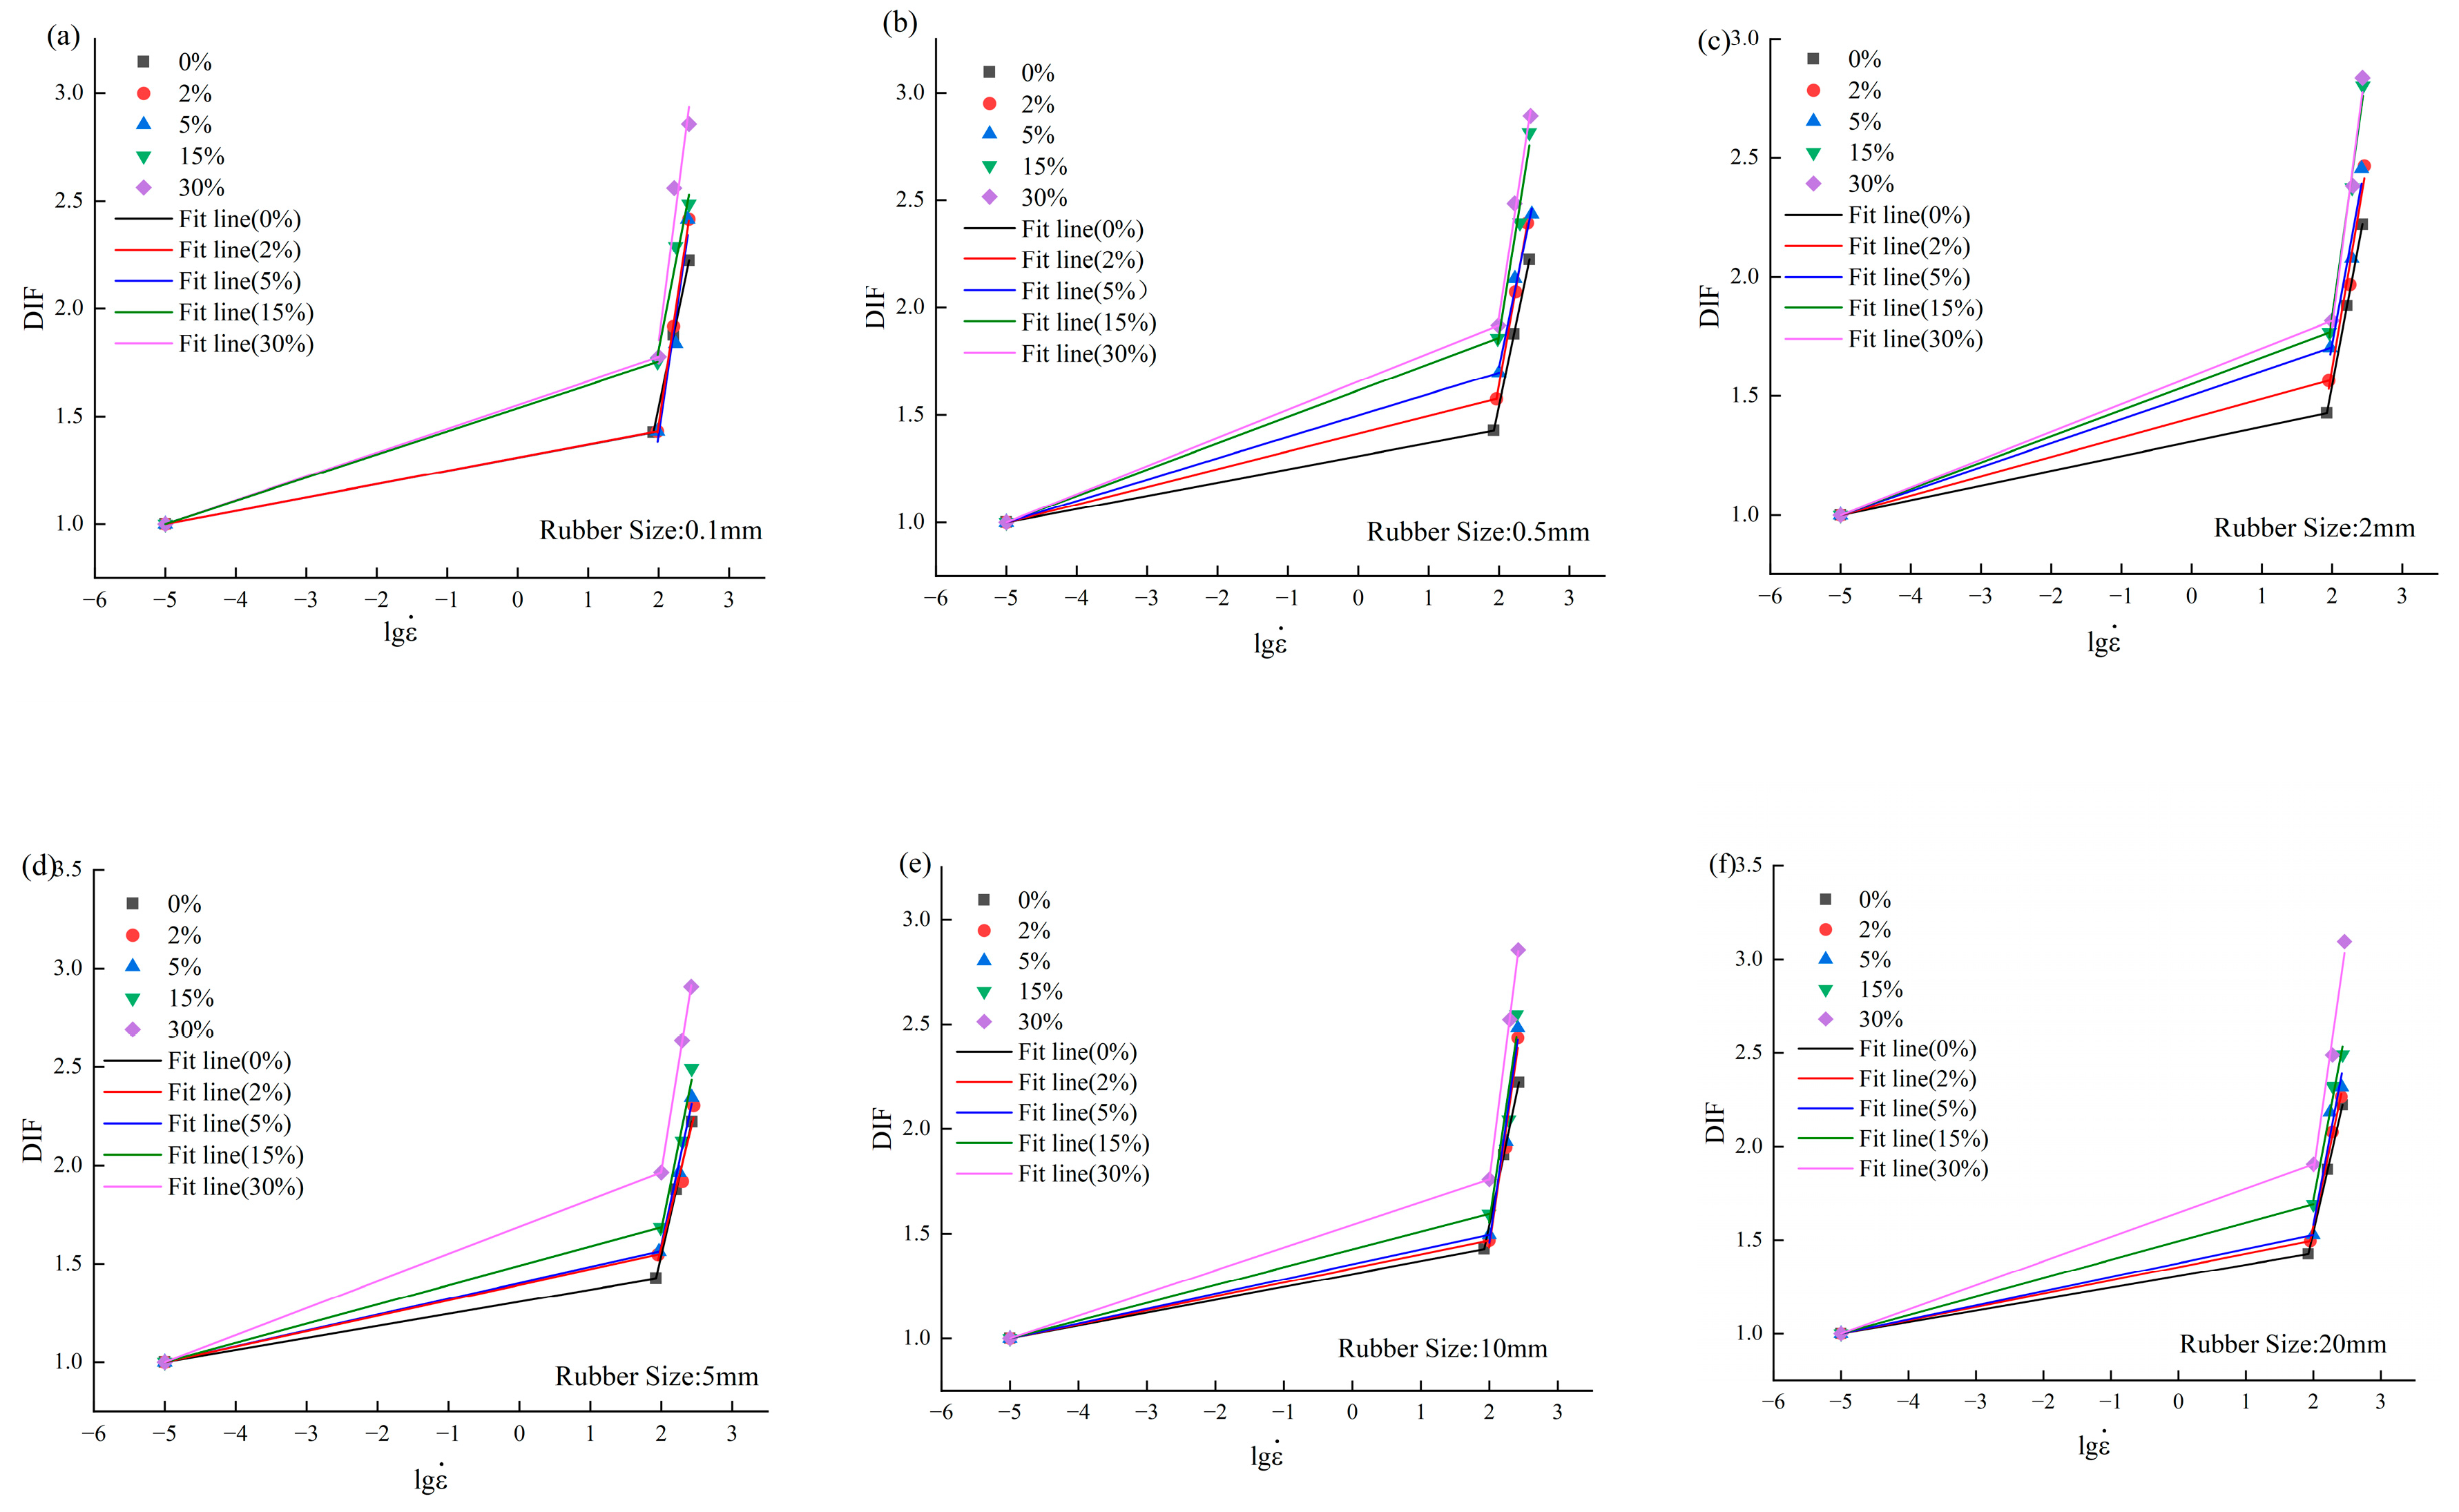
Figure 12 is the complete stress–strain curve of RC with different content and sizes and different strain rates. It can be found that the dynamic strength of RC and normal concrete increases with a continuous increase in the strain rate. With the increasing rubber content, the dynamic compression strength of RC shows a decreasing trend. The size of rubber particles has no obvious effect on the dynamic compressive strength of RC. It is mainly based on the fact that the normal concrete material is relatively uniform, and the added rubber destroys the uniformity of the normal concrete. The elastic modulus of the RC increases with an increase in strain rate. It is observed that RC can achieve excellent performance in the face of a high strain rate.
Figure 13 illustrates the fragmentation of the specimen under different impact rates. It can be observed that as the loading rate increases, the percentage of larger fragments decreases significantly. Higher loading rates lead to a continuous increase in the number of microcracks. At a speed of 17 m/s, the coarse aggregate fractures. However, as the RC content increases, the integrity of the fragments improves. This suggests that increased rubber content enhances the concrete’s toughness and energy absorption capacity [20].
In Figure 13, the structural study of the interface after impact failure of RC is observed, and it is suggested that there may be extensive microcracks on the rubber particles. At the location where the rubber aggregate is broken and extracted, dents in the cement matrix can usually be observed. These dents enhance the bonding strength between rubber and cement. These actual impact test results contradict the weak effect of rubber and cement-based direct ITZ described in the literature. In addition, the widespread micro-cracks observed on the surface of the test block particles support the hypothesis that rubber particles in RC generate tensile strain during the crushing process. This result is consistent with the fact that there is stress transfer between the two-phase composite materials, and the rubber particles undergo tensile strain before failure. In addition, the extraction of rubber particles and micro-cracks on the surface of rubber particles are two toughening mechanisms that consume energy in the rubber concrete matrix, which do not exist in traditional concrete. As mentioned above, these mechanisms have helped RC significantly improve impact energy and fracture toughness. Further research on crack propagation under load may help reveal the mechanism by which rubber particles improve the fracture toughness of concrete.
Figure 14 shows that the dynamic compressive strength of RC increases almost linearly with increasing strain rates for different particle sizes. As the rubber content increases from 0 to 30%, the strength of the RC decreases. This is primarily because the original aggregates in the concrete mix are being replaced by rubber, which disrupts the particle size distribution of concrete. Additionally, the difference in elastic modulus between rubber and cement slurry causes cracks to develop, forming weak areas that reduce the dynamic strength of RC.
Figure 15 shows the relationship between the strain rate and dynamic compressive strength at different rubber contents and sizes. Regardless of the size of rubber particles, the strength reduction rate can gradually increase with an increase in the rubber volume fraction. The test block with the largest reduction is RC-10-30%, and the dynamic compressive strength of RC is reduced by 48–52%. In the dynamic impact process of the RC with different rubber particle sizes, the strength of the RC with a rubber particle size greater than 5mm is significantly reduced. This is compared to the RC that has a smaller particle size. This is because the direct contact area between cement slurry and rubber with a larger particle size is larger, resulting in weaker areas and increasing the formation of vulnerable areas, decreasing the dynamic compressive strength. No suitable fitting relationship was found between the strain rate and rubber content through analysis.

3.6. DIF of the RC

The dynamic increase factor (DIF) is the ratio of dynamic compressive strength ( f c , d ) to static compressive strength ( f c , s ), which reflects the increase in the compressive strength of materials under impact loads. The calculation is Formula (6):
D I F = f c , d f c , s
According to the calculation results of the DIF formula in Table 6, there is a linear relationship between the DIF of empirical concrete and the logarithm of the strain rate [36]. Therefore, for RC with different particle sizes, the logarithm of the strain rate is linearly fitted with DIF, and Figure 16 shows the fitting results. According to the graphic, the DIF of RC grows as the strain rate rises and follows a similar trend to that of normal concrete. In addition, with the increase in rubber content, the DIF of concrete with different rubber particle sizes increases gradually. This is mainly because, with the increase in rubber content, the dynamic strength of RC is significantly improved in the impact test. The logarithmic relationship between the compressive strength of the DIF and the strain rate of the RC can be used to derive the fitting formula.
Formula (7) describes the link between the RC’s DIF and strain rate:
D I F = a × l o g 10 ε ˙ + b                                       ε ˙ 100 c × l o g 10 ε ˙ + d             100 < ε ˙ 291                                        
In the formula, ε ˙ represents the strain rate, while the remaining variables, a , b , c , and d , are the fitting parameters. Refer to Table 7 for specific information.
The changes in Formula (7) parameters of RC with different particle sizes and rubber content are shown in Figure 17.
Through the fitting process, the DIF formula for the RC with different particle sizes can be obtained:
a = k 1 × C + k 2
b = l 1 × C + l 2    
c = m 1 × C + m 2    
d = n 1 × C + n 2  
Parameter C in Formulas (8)–(11) refers to the content of rubber particles. Through parameter fitting, the DIF and strain rate fitting formulas of RC with six rubber sizes, 0.1 mm, 0.5 mm, 2 mm, 5 mm, 10 mm, and 20 mm, with a content of 0–30% can be obtained. The formula can be used to predict the dynamic properties of RC. The specific fitting parameters are detailed in Table 8.

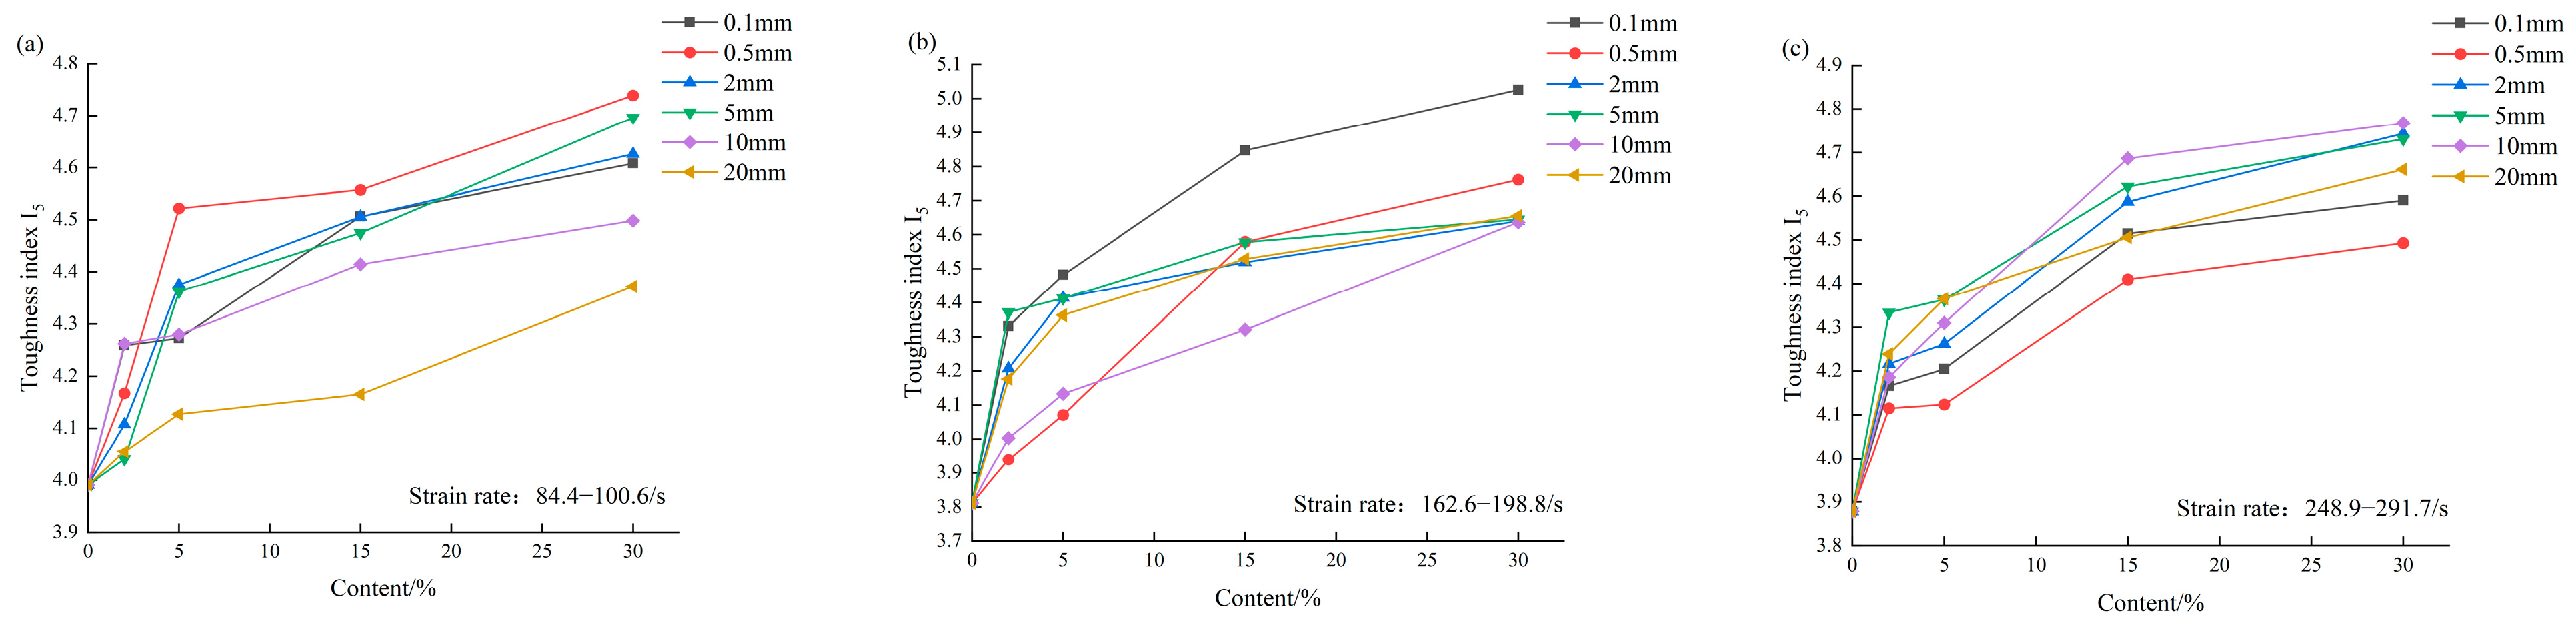
3.7. Analysis of Dynamic Toughness Index of RC

In this paper, ASTM C1018, the toughness evaluation method for ideal elastoplastic materials formulated by the American Society for Materials and Testing, is used to evaluate the bending toughness of the RC studied. The specific evaluation method is shown in Figure 18 below. The σ represents the peak force, 0.85σ represents the first crack force, A represents the first crack point, which corresponds to the first crack deflection δ. The greater the toughness index, the closer the RC is to the ideal plastic material. Formula (12) calculates the values of I 5 .
I 5 = S O A C D S O A B    
It can be seen from Figure 19 that with the increase in rubber content, the toughness index of RC gradually increases. In all cases, it is superior to that of normal concrete. This indicates that with the increase in the content of rubber, the toughness of RC is continuously enhanced, and it can absorb more energy. In all groups, the RC with a 30% rubber content and a diameter of 0.1 mm exhibits the highest increase in toughness, improving by 31.9% compared to the control group of normal concrete.
On the other hand, there is no clear regular relationship between the toughness coefficient of RC and the particle size of rubber. This may imply that the energy absorption capacity of RC mainly depends on the content of rubber added rather than the particle size. However, to draw more accurate conclusions, more research may be needed to validate this hypothesis further.
Based on the experimental results of this study, it can be concluded that RC can be used as an ideal new type of green solid waste concrete material. Although, the addition of rubber weakened the strength of some of the normal concrete, the energy absorption effect of RC was significantly improved. For example, at a particle size of 0.5 mm and a content of 2%, the quasi-static strength of RC had a loss of only 6 MPa compared to normal concrete, with a strength of 52.1 MPa. The design specifications for concrete structures (GB 50010-2010) [76] can meet all design scenarios, and their energy absorption effect is improved by 5.6% under high strain rates.

4. Conclusions

This study experimentally studied the static and dynamic mechanical behavior of RC with different rubber particle sizes and rubber content. Using the compressive strength test and SHPB test methods, we comprehensively analyzed static strength, dynamic strength, the DIF, energy absorption capacity, and fragment characteristics. The results of the current work can be summarized as follows:
(1)
Rubber reduces the static strength of concrete, and the strength of RC decreases with an increase in rubber content. However, the effect of rubber particle size on the compressive strength of RC is irregular.
(2)
This article presents empirical equations for the compressive strength of concrete with varying rubber content and particle sizes. It uses BP neural networks combined with the literature data for neural network learning. The formula and neural network learning model can be used to predict the static compressive strength of concrete with different rubber particle sizes and contents.
(3)
In the dynamic test, the peak strain decreases with the increase in rubber content. When the rubber content is 30% and the rubber size is 10mm, the maximum strength reduction is 52.3%. The dynamic compressive strength of RC with a rubber particle size greater than 5mm is generally small, but the effect is insignificant. As the particle size increases, the interface transition zone becomes larger.
(4)
Compared to normal concrete, RC exhibits better impact resistance and energy absorption ability at high load rates. The main reason is that a large content of rubber particles is added to RC, which can play a role in energy absorption, slowing down the speed of crack propagation and progressive failure.
(5)
The DIF formula for RC with different rubber content and different rubber particle sizes was established through fitting methods. The formula can be used as a reference to predict the dynamic properties of RC under different strain rates in the future.
(6)
The toughness index of RC increases with an increase in rubber content. There is no clear relationship between RC’s toughness index and the rubber particles’ size. This phenomenon may mean that the energy absorption capacity of RC mainly depends on the added rubber content rather than particle size.
The dynamic and static fitting formulas and mathematical models mentioned in this paper can provide guidance for other researchers in choosing the content and size of rubber in the practical application of rubber concrete.
Lastly, future research works in this regard are recommended as follows. The first field is to improve the bonding performance between rubber particles and cement-based materials through physical or chemical modification, thereby enhancing the strength of the ITZ. The second field is to explore the tensile performance of RC using dynamic and static Brazilian discs and three-point bending tests. The third area is to study the durability performance of RC. The fourth area is to analyze the economic benefit of RC.

Author Contributions

Conceptualization, T.D., A.A. and C.Z.; methodology, A.A.; software, H.K.; formal analysis, T.D., H.C. and Y.Y.; investigation, N.S. and H.C.; data curation, T.D. and A.A.; writing—original draft preparation, T.D., A.A. and Y.Y.; writing—review and editing, T.D.; visualization, A.A. and Z.D.I.S.; supervision, A.A. and C.Z.; funding acquisition, C.Z. All authors have read and agreed to the published version of the manuscript.

Funding

This research is financially supported by the National Natural Science Foundation of China (Grant No. 52361135807), the Ministry of Science and Technology of China (Grant No. 2019YFE0112400), and the Department of Science and Technology of Shandong Province (Grant No. 2021CXGC011204).

Data Availability Statement

Data will be made available on request.

Conflicts of Interest

The authors declare no conflict of interest.

References

  1. Li, Y.; Zhang, X.; Wang, R.; Lei, Y. Performance enhancement of rubberised concrete via surface modification of rubber: A review. Constr. Build. Mater. 2019, 227, 116691. [Google Scholar] [CrossRef]
  2. Rambabu, D.; Sharma, S.K.; Akbar, M.A. Evaluation of roller compacted concrete for its application as high traffic resisting pavements with fatigue analysis. Constr. Build. Mater. 2023, 401, 132977. [Google Scholar] [CrossRef]
  3. Topcu, I.B. The properties of rubberized concretes. Cem. Concr. Res. 1995, 25, 304–310. [Google Scholar] [CrossRef]
  4. Amini, K.; Vosoughi, P.; Ceylan, H.; Taylor, P. Effect of mixture proportions on concrete performance. Constr. Build. Mater. 2019, 212, 77–84. [Google Scholar] [CrossRef]
  5. Topçu, İ.B. Assessment of the brittleness index of rubberized concretes. Cem. Concr. Res. 1997, 27, 177–183. [Google Scholar] [CrossRef]
  6. Li, Y.; Li, Y. Experimental study on performance of rubber particle and steel fiber composite toughening concrete. Constr. Build. Mater. 2017, 146, 267–275. [Google Scholar] [CrossRef]
  7. Mu, C.; Zhou, H.; Ma, H. Prediction method for ground shock parameters of explosion in concrete. Constr. Build. Mater. 2021, 291, 123372. [Google Scholar] [CrossRef]
  8. Yang, F.; Feng, W.; Liu, F.; Jing, L.; Yuan, B.; Chen, D. Experimental and numerical study of rubber concrete slabs with steel reinforcement under close-in blast loading. Constr. Build. Mater. 2019, 198, 423–436. [Google Scholar] [CrossRef]
  9. Yang, F.; Ke, Z.; Feng, W.; Li, X.; Chen, S.; Li, H. Effects of crumb rubber particles on the dynamic response of reinforced concrete beams subjected to blast loads. Eng. Struct. 2024, 300, 117181. [Google Scholar] [CrossRef]
  10. Yao, J.; Zhang, J.; Huang, L.; Xu, J. Analysis of anti-collision performance of a new assembled rolling guardrail. In Structures; Elsevier: Amsterdam, The Netherlands, 2023; pp. 246–259. [Google Scholar]
  11. Khan, M.; Cao, M.; Xie, C.; Ali, M. Hybrid fiber concrete with different basalt fiber length and content. Struct. Concr. 2022, 23, 346–364. [Google Scholar] [CrossRef]
  12. Cui, D.; Wang, L.; Zhang, C.; Xue, H.; Gao, D.; Chen, F. Dynamic splitting performance and energy dissipation of fiber-reinforced concrete under impact loading. Materials 2024, 17, 421. [Google Scholar] [CrossRef] [PubMed]
  13. Shi, F.; Cao, P.; Wang, Z.; Gan, Y.; Zhou, C.; Liu, K. An experimental study of dynamic compression performance of self-compacting concrete. Materials 2020, 13, 3731. [Google Scholar] [CrossRef]
  14. Feng, S.; Zhou, Y.; Li, Q. Damage behavior and energy absorption characteristics of foamed concrete under dynamic load. Constr. Build. Mater. 2022, 357, 129340. [Google Scholar] [CrossRef]
  15. Yan, T.; Yin, X.; Zhang, X. Impact toughness and dynamic constitutive model of geopolymer concrete after water saturation. Sci. Rep. 2024, 14, 7117. [Google Scholar] [CrossRef] [PubMed]
  16. Dou, Y.; Feng, G.; Xu, L.; Yang, Y.; Zhang, Z.; You, L.; Zhong, S.; Gao, Y.; Cui, X. Modification of rubber particles and its application in rubberized concrete. J. Build. Eng. 2022, 51, 104346. [Google Scholar] [CrossRef]
  17. He, L.; Cai, H.; Huang, Y.; Ma, Y.; Van Den Bergh, W.; Gaspar, L.; Valentin, J.; Vasiliev, Y.E.; Kowalski, K.J.; Zhang, J. Research on the properties of rubber concrete containing surface-modified rubber powders. J. Build. Eng. 2021, 35, 101991. [Google Scholar] [CrossRef]
  18. Manjunatha, M.; Seth, D.; Balaji, K.; Roy, S.; Tangadagi, R.B. Utilization of industrial-based pvc waste powder in self-compacting concrete: A sustainable building material. J. Clean. Prod. 2023, 428, 139428. [Google Scholar] [CrossRef]
  19. Hayeemasae, N.; Salleh, S.Z.; Ismail, H. Sustainable use of chloroprene rubber waste as blend component with natural rubber, epoxidized natural rubber and styrene butadiene rubber. J. Polym. Environ. 2019, 27, 2119–2130. [Google Scholar] [CrossRef]
  20. Yang, G.; Fan, Y.; Li, X.; Xu, Y. Influence of rubber powder size and volume fraction on dynamic compressive properties of rubberized mortar. Powder Technol. 2023, 420, 118376. [Google Scholar] [CrossRef]
  21. Bušić, R.; Miličević, I.; Šipoš, T.K.; Strukar, K. Recycled rubber as an aggregate replacement in self-compacting concrete—Literature overview. Materials 2018, 11, 1729. [Google Scholar] [CrossRef] [PubMed]
  22. Mavukwana, A.-E.; Stacey, N.; Fox, J.A.; Sempuga, B.C. Thermodynamic comparison of pyrolysis and gasification of waste tyres. J. Environ. Chem. Eng. 2021, 9, 105163. [Google Scholar] [CrossRef]
  23. Chen, J.; Zhuang, J.; Shen, S.; Dong, S. Experimental investigation on the impact resistance of rubber self-compacting concrete. In Structures; Elsevier: Amsterdam, The Netherlands, 2022; pp. 691–704. [Google Scholar]
  24. Liu, F.; Chen, G.; Li, L.; Guo, Y. Study of impact performance of rubber reinforced concrete. Constr. Build. Mater. 2012, 36, 604–616. [Google Scholar] [CrossRef]
  25. Mendis, A.S.; Al-Deen, S.; Ashraf, M. Effect of rubber particles on the flexural behaviour of reinforced crumbed rubber concrete beams. Constr. Build. Mater. 2017, 154, 644–657. [Google Scholar] [CrossRef]
  26. Gao, Y.; Wang, B.; Liu, C.; Hui, D.; Xu, Q.; Zhao, Q.; Qin, Y.; Dong, W. Experimental investigation on static compressive toughness of steel fiber rubber concrete. Rev. Adv. Mater. Sci. 2022, 61, 576–586. [Google Scholar] [CrossRef]
  27. Bu, C.; Zhu, D.; Liu, L.; Lu, X.; Sun, Y.; Yu, L.; OuYang, Y.; Cao, X.; Wang, F. Research progress on rubber concrete properties: A review. J. Rubber Res. 2022, 25, 105–125. [Google Scholar] [CrossRef]
  28. Grincova, A.; Andrejiova, M.; Marasova, D. Failure analysis of the impact resistance of protective rubber panels. Eng. Fail. Anal. 2022, 139, 106481. [Google Scholar] [CrossRef]
  29. Zhai, S.; Liu, G.; Pang, B.; Liu, C.; Zhang, Z.; Zhang, L.; Liu, L.; Yang, Y.; Liu, Z.; Zhang, Y. Investigation on the influence of modified waste rubber powder on the abrasion resistance of concrete. Constr. Build. Mater. 2022, 357, 129409. [Google Scholar] [CrossRef]
  30. Yasser, N.; Abdelrahman, A.; Kohail, M.; Moustafa, A. Experimental investigation of durability properties of rubberized concrete. Ain Shams Eng. J. 2023, 14, 102111. [Google Scholar] [CrossRef]
  31. Angelin, A.; Miranda, E.J.P., Jr.; Santos, J.D.; Lintz, R.; Gachet-Barbosa, L. Rubberized mortar: The influence of aggregate granulometry in mechanical resistances and acoustic behavior. Constr. Build. Mater. 2019, 200, 248–254. [Google Scholar] [CrossRef]
  32. Feng, W.; Liu, F.; Yang, F.; Li, L.; Jing, L. Experimental study on dynamic split tensile properties of rubber concrete. Constr. Build. Mater. 2018, 165, 675–687. [Google Scholar] [CrossRef]
  33. Guo, J.; Huang, M.; Huang, S.; Wang, S. An experimental study on mechanical and thermal insulation properties of rubberized concrete including its microstructure. Appl. Sci. 2019, 9, 2943. [Google Scholar] [CrossRef]
  34. Mei, X.; Cui, Z.; Sheng, Q.; Zhou, J.; Li, C. Application of the improved poa-rf model in predicting the strength and energy absorption property of a novel aseismic rubber-concrete material. Materials 2023, 16, 1286. [Google Scholar] [CrossRef] [PubMed]
  35. Lai, D.; Demartino, C.; Xiao, Y. High-strain rate tension behavior of fiber-reinforced rubberized concrete. Cem. Concr. Compos. 2022, 131, 104554. [Google Scholar] [CrossRef]
  36. Pan, L.; Hao, H.; Cui, J.; Pham, T.M. Numerical study on dynamic properties of rubberised concrete with different rubber contents. Def. Technol. 2023, 24, 228–240. [Google Scholar] [CrossRef]
  37. Liu, Z.; Chen, X.; Wang, X.; Diao, H. Investigation on the dynamic compressive behavior of waste tires rubber-modified self-compacting concrete under multiple impacts loading. J. Clean. Prod. 2022, 336, 130289. [Google Scholar] [CrossRef]
  38. Pham, T.M.; Renaud, N.; Pang, V.L.; Shi, F.; Hao, H.; Chen, W. Effect of rubber aggregate size on static and dynamic compressive properties of rubberized concrete. Struct. Concr. 2022, 23, 2510–2522. [Google Scholar] [CrossRef]
  39. Su, H.; Yang, J.; Ling, T.-C.; Ghataora, G.S.; Dirar, S. Properties of concrete prepared with waste tyre rubber particles of uniform and varying sizes. J. Clean. Prod. 2015, 91, 288–296. [Google Scholar] [CrossRef]
  40. Thomas, B.S.; Gupta, R.C.; Kalla, P.; Cseteneyi, L. Strength, abrasion and permeation characteristics of cement concrete containing discarded rubber fine aggregates. Constr. Build. Mater. 2014, 59, 204–212. [Google Scholar] [CrossRef]
  41. Jin, H.; Wang, Z.; Zhao, C.; Xiao, J. Effect of rubber surface treatment on damping performance of rubber-mortar ITZ in rubberized concrete. J. Build. Eng. 2024, 83, 108441. [Google Scholar] [CrossRef]
  42. Chen, Z.; Li, L.; Xiong, Z. Investigation on the interfacial behaviour between the rubber-cement matrix of the rubberized concrete. J. Clean. Prod. 2019, 209, 1354–1364. [Google Scholar] [CrossRef]
  43. Gholampour, A.; Ozbakkaloglu, T.; Hassanli, R. Behavior of rubberized concrete under active confinement. Constr. Build. Mater. 2017, 138, 372–382. [Google Scholar] [CrossRef]
  44. Dong, Q.; Huang, B.; Shu, X. Rubber modified concrete improved by chemically active coating and silane coupling agent. Constr. Build. Mater. 2013, 48, 116–123. [Google Scholar] [CrossRef]
  45. Huang, B.; Shu, X.; Cao, J. A two-staged surface treatment to improve properties of rubber modified cement composites. Constr. Build. Mater. 2013, 40, 270–274. [Google Scholar] [CrossRef]
  46. Naderpour, H.; Poursaeidi, O.; Ahmadi, M. Shear resistance prediction of concrete beams reinforced by frp bars using artificial neural networks. Measurement 2018, 126, 299–308. [Google Scholar] [CrossRef]
  47. Naderpour, H.; Rafiean, A.H.; Fakharian, P. Compressive strength prediction of environmentally friendly concrete using artificial neural networks. J. Build. Eng. 2018, 16, 213–219. [Google Scholar] [CrossRef]
  48. Congro, M.; de Alencar Monteiro, V.M.; Brandão, A.L.; Santos, B.F.D.; Roehl, D.; de Andrade Silva, F. Prediction of the residual flexural strength of fiber reinforced concrete using artificial neural networks. Constr. Build. Mater. 2021, 303, 124502. [Google Scholar] [CrossRef]
  49. JGJ 55-2011; Standard for Design Specification for Mix Proportion of Ordinary Concrete. China Academy of Building Research: Beijing, China, 2011. (In Chinese)
  50. Ganjian, E.; Khorami, M.; Maghsoudi, A.A. Scrap-tyre-rubber replacement for aggregate and filler in concrete. Constr. Build. Mater. 2009, 23, 1828–1836. [Google Scholar] [CrossRef]
  51. GB/T 50081-2002; Standard for Test Method of Mechanical Properties on Ordinary Concrete. Ministry of Construction of the People’s Republic of China: Beijing, China, 2002. (In Chinese)
  52. GB/T 37783-2019; Metallic Materials-High Strain Rate Tensile Testmethod at Elevated Temperature. Ministry of Construction of the People’s Republic of China: Beijing, China, 2019. (In Chinese)
  53. Jiang, T.; Xue, P.; Butt, H. Pulse shaper design for dynamic testing of viscoelastic materials using polymeric SHPB. Int. J. Impact Eng. 2015, 79, 45–52. [Google Scholar] [CrossRef]
  54. Sun, X.; Zhao, K.; Li, Y.; Huang, R.; Ye, Z.; Zhang, Y.; Ma, J. A study of strain-rate effect and fiber reinforcement effect on dynamic behavior of steel fiber-reinforced concrete. Constr. Build. Mater. 2018, 158, 657–669. [Google Scholar] [CrossRef]
  55. Hassan, M.; Wille, K. Direct tensile behavior of steel fiber reinforced ultra-high performance concrete at high strain rates using modified split hopkinson tension bar. Compos. Part B Eng. 2022, 246, 110259. [Google Scholar] [CrossRef]
  56. Huang, W.; Huang, X.; Xing, Q.; Zhou, Z. Strength reduction factor of crumb rubber as fine aggregate replacement in concrete. J. Build. Eng. 2020, 32, 101346. [Google Scholar] [CrossRef]
  57. Li, L.; Ruan, S.; Zeng, L. Mechanical properties and constitutive equations of concrete containing a low volume of tire rubber particles. Constr. Build. Mater. 2014, 70, 291–308. [Google Scholar] [CrossRef]
  58. Ly, H.-B.; Nguyen, T.-A.; Tran, V.Q. Development of deep neural network model to predict the compressive strength of rubber concrete. Constr. Build. Mater. 2021, 301, 124081. [Google Scholar] [CrossRef]
  59. Chen, A.; Han, X.; Wang, Z.; Zhang, Q.; Xia, X.; Ji, Y.; Li, K. Analytical evaluation of compressive strength for concrete with rubber fine aggregates and the predictive model. Constr. Build. Mater. 2022, 345, 128359. [Google Scholar] [CrossRef]
  60. Karunarathna, S.; Linforth, S.; Kashani, A.; Liu, X.; Ngo, T. Effect of recycled rubber aggregate size on fracture and other mechanical properties of structural concrete. J. Clean. Prod. 2021, 314, 128230. [Google Scholar] [CrossRef]
  61. Ling, T.-C. Prediction of density and compressive strength for rubberized concrete blocks. Constr. Build. Mater. 2011, 25, 4303–4306. [Google Scholar] [CrossRef]
  62. Abbas, S.; Fatima, A.; Kazmi, S.M.S.; Munir, M.J.; Ali, S.; Rizvi, M.A. Effect of particle sizes and dosages of rubber waste on the mechanical properties of rubberized concrete composite. Appl. Sci. 2022, 12, 8460. [Google Scholar] [CrossRef]
  63. Feng, W.; Chen, Z.; Tang, Y.; Liu, F.; Yang, F.; Yang, Y.; Tayeh, B.A.; Namdar, A. Fracture characteristics of sustainable crumb rubber concrete under a wide range of loading rates. Constr. Build. Mater. 2022, 359, 129474. [Google Scholar] [CrossRef]
  64. Gesoglu, M.; Güneyisi, E.; Hansu, O.; İpek, S.; Asaad, D.S. Influence of waste rubber utilization on the fracture and steel–concrete bond strength properties of concrete. Constr. Build. Mater. 2015, 101, 1113–1121. [Google Scholar] [CrossRef]
  65. Al-Tayeb, M.; Bakar, B.A.; Akil, H.; Ismail, H. Performance of rubberized and hybrid rubberized concrete structures under static and impact load conditions. Exp. Mech. 2013, 53, 377–384. [Google Scholar] [CrossRef]
  66. Rezaifar, O.; Hasanzadeh, M.; Gholhaki, M. Concrete made with hybrid blends of crumb rubber and metakaolin: Optimization using response surface method. Constr. Build. Mater. 2016, 123, 59–68. [Google Scholar] [CrossRef]
  67. Issa, C.A.; Salem, G. Utilization of recycled crumb rubber as fine aggregates in concrete mix design. Constr. Build. Mater. 2013, 42, 48–52. [Google Scholar] [CrossRef]
  68. Girskas, G.; Nagrockienė, D. Crushed rubber waste impact of concrete basic properties. Constr. Build. Mater. 2017, 140, 36–42. [Google Scholar] [CrossRef]
  69. Taak, N.; Sharma, L. Influence of compression casting technique and chipped rubber usage on the strength parameters of concrete. Mater. Today Proc. 2021, 45, 3462–3468. [Google Scholar] [CrossRef]
  70. Xu, J.; Niu, X.; Yao, Z. Mechanical properties and acoustic emission data analyses of crumb rubber concrete under biaxial compression stress states. Constr. Build. Mater. 2021, 298, 123778. [Google Scholar] [CrossRef]
  71. Khatib, Z.K.; Bayomy, F.M. Rubberized portland cement concrete. J. Mater. Civ. Eng. 1999, 11, 206–213. [Google Scholar] [CrossRef]
  72. Wu, Y.-F.; Kazmi, S.M.S.; Munir, M.J.; Zhou, Y.; Xing, F. Effect of compression casting method on the compressive strength, elastic modulus and microstructure of rubber concrete. J. Clean. Prod. 2020, 264, 121746. [Google Scholar] [CrossRef]
  73. Feng, W.; Liu, F.; Yang, F.; Jing, L.; Li, L.; Li, H.; Chen, L. Compressive behaviour and fragment size distribution model for failure mode prediction of rubber concrete under impact loads. Constr. Build. Mater. 2021, 273, 121767. [Google Scholar] [CrossRef]
  74. Richardson, A.; Coventry, K.; Edmondson, V.; Dias, E. Crumb rubber used in concrete to provide freeze–thaw protection (optimal particle size). J. Clean. Prod. 2016, 112, 599–606. [Google Scholar] [CrossRef]
  75. Wu, G.-D.; Lo, S.-L. Effects of data normalization and inherent-factor on decision of optimal coagulant dosage in water treatment by artificial neural network. Expert Syst. Appl. 2010, 37, 4974–4983. [Google Scholar] [CrossRef]
  76. GB 50010-2010; Code for Design of Concrete Structures. Ministry of Construction of the People’s Republic of China: Beijing, China, 2010.
Figure 1. The experimental programs’ flow diagram.
Buildings 14 01541 g001
Figure 2. The photos of rubber particles of different sizes.
Buildings 14 01541 g002
Figure 3. Mixing process of the RC.
Buildings 14 01541 g003
Figure 5. Compressive strength of RC: (a) compressive strength with different rubber size, (b) compressive strength with different rubber content.
Buildings 14 01541 g005
Figure 6. Loading failure process of concrete under the static loading.
Buildings 14 01541 g006
Figure 8. The fitting process between rubber content and compressive strength of RC ( R 2 = 0.9 ).
Buildings 14 01541 g008
Figure 10. Neural network training results: (a) neural network training performance, (b) neural network training regression.
Buildings 14 01541 g010
Figure 12. Stress–strain curves of RC with different rubber content and size.
Buildings 14 01541 g012aBuildings 14 01541 g012b
Figure 13. Fragments of RC with different content and size after impact: (a) ν = 8   m / s , (b) ν = 12   m / s , (c) ν = 17   m / s .
Buildings 14 01541 g013aBuildings 14 01541 g013b
Figure 14. The dynamic compressive strength with different rubber content: (a) rubber size: 0.1 mm, (b) rubber size: 0.5 mm, (c) rubber size: 2 mm, (d) rubber size: 5 mm, (e) rubber size: 10 mm, (f) rubber size: 20 mm.
Buildings 14 01541 g014
Figure 15. The dynamic compressive strength with different rubber sizes: (a) rubber content: 2%, (b) rubber content: 5%, (c) rubber content: 15%, (d) rubber content: 30%.
Buildings 14 01541 g015
Figure 16. Comparison of DIF with different rubber content: (a) rubber size: 0.1 mm, (b) rubber size: 0.5 mm, (c) rubber size: 2 mm, (d) rubber size: 5 mm, (e) rubber size: 10 mm, (f) rubber size: 20 mm.
Buildings 14 01541 g016
Figure 17. Fitting process of RC: (a) rubber size: 0.1 mm, (b) rubber size: 0.5 mm, (c) rubber size: 2 mm, (d) rubber size: 5 mm, (e) rubber size: 10 mm, (f) rubber size: 20 mm.
Buildings 14 01541 g017
Figure 18. Calculation method for dynamic toughness index.
Buildings 14 01541 g018
Figure 19. Relationship between content, size, and the toughness index of the RC: (a) strain rate: 84.4–100.6 s−1, (b) strain rate: 162.6–198.8 s−1, (c) strain rate: 248.9–291.7 s−1.
Buildings 14 01541 g019
Table 1. Chemical compositions and physical properties of the cement.
CementDensity (kg·m−3)MgO
(%)
SO3
(%)
Initial Setting (min)Final Setting (h)3d (MPa)28d (MPa)
P·042.531003.03.560621.544.5
Table 2. Concrete mix proportions of RC with different rubber sizes and replacement content (unit: kg·m−3).
SpecimenWaterCementCoarse AggregateFine AggregateRubber
NC22048911135230
RC-0.1-222048911135135
RC-0.1-5220489111348711
RC-0.1-15220489111344534
RC-0.1-30220489111336668
RC-0.5-222048911135135
RC-0.5-5220489111348711
RC-0.5-15220489111344534
RC-0.5-30220489111336668
RC-2-222048911135135
RC-2-5220489111348711
RC-2-15220489111344534
RC-2-30220489111336668
RC-5-222048910915239
RC-5-5220489105752323
RC-5-1522048994652370
RC-5-30220489779523140
RC-10-222048910915239
RC-10-5220489105752323
RC-10-1522048994652370
RC-10-30220489779523140
RC-20-222048910915239
RC-20-5220489105752323
RC-20-1522048994652370
RC-20-30220489779523140
Note: regarding RC-S-C, RC represents the rubberized concrete, S is the rubber size, and C is the rubber substitution rate, and NC represents the normal concrete (see Figure 2).
Table 3. Parameters of fitting curves of Eq.
Size(mm)Fit Method a b R 2
0.1Linear fitting
y = a × C + b
−0.9658.30.99
0.5−0.9958.30.99
2−1.1058.30.99
5−1.2258.30.99
10−1.2858.30.99
20−1.3058.30.98
Table 4. Experimental data collected.
NumberNumber of SpecimensRubber Size/mmContent/%f28d/MPaReferences
1325–1534–40[26]
222–41528.7–35.8[38]
330.3–32054.6–55.3[39]
4241.482.5–2017–41[40]
53205–1025–33[50]
6200.25–220–802.8–22[56]
7250.17–42–1025–40[57]
8130.15–31–616–32.3[59]
944–152–429.26–33.38[60]
102435–509.5–35.4[61]
1191–8.510–3022.1–44.6[62]
1250.510–5017.91–37.76[63]
1361.55–3030–50[64]
14315–2029–35[65]
1521.1615–3021–30[66]
1640.115–1005.3–26.7[67]
1763–55–2020–55.2[68]
1851510–5011–25[69]
1921.845–1037.9–41.5[70]
20161.5–152.16–572.7–34.9[71]
21812.510–1003.8–24.13[72]
2250.8510–5018–37.76[73]
2350.25–2.250.635.12–36.37[74]
Table 5. Prediction value and error value of compressive strength of the RC fitted by neural network and formula.
NumberSpecimenActual ValuesFit FormulaANN
PredictionAbsolute ErrorRelative Error/%PredictionAbsolute
Error
Relative
Error/%
1RC-0.1-550.953.52.65.147.93.05.9
2RC-0.1-3032.129.52.68.129.82.37.2
3RC-0.5-252.1856.34.17.950.02.24.2
4RC-0.5-3028.1728.40.20.830.22.07.1
5RC-2-251.5156.14.68.949.81.73.2
6RC-2-1537.4441.74.311.541.64.111.0
7RC-5-547.3452.24.910.345.81.53.2
8RC-5-3025.4421.83.714.527.42.07.7
9RC-10-1535.7239.13.49.433.91.95.2
10RC-10-3022.5519.92.711.922.50.10.4
11RC-20-1535.7438.83.18.639.74.011.1
12RC-20-3022.8719.33.515.522.30.62.6
Table 6. Concrete mechanical parameters test after dynamic and static.
NumberStrain Rate 1 (s−1) f c , d 1 (MPa)DIF 1Strain Rate 2 (s−1) f c , d 2 (MPa)DIF 2Strain Rate 3 (s−1) f c , d 3 (MPa)DIF 3 f c , s (MPa)
NC84.483.21.427162.6109.51.878270.6129.52.22158.3
RC-0.1-296.373.21.432162.697.51.908267.9123.52.41651.11
RC-0.1-596.873.01.434174.897.21.910259.3123.02.41750.9
RC-0.1-1596.870.21.753174.891.72.290269.999.62.48740.05
RC-0.1-30100.657.01.776166.182.22.561269.891.72.85732.1
RC-0.5-291.882.21.575171.5108.22.074253.3125.02.39652.18
RC-0.5-5100.178.71.697168.199.02.135291.7113.02.43646.38
RC-0.5-1595.865.91.857197.985.02.396269.799.82.81335.48
RC-0.5-3098.254.01.917166.170.02.485280.181.52.89328.17
RC-2-289.580.61.565179.4101.41.969288.1127.02.46651.51
RC-2-594.280.11.701191.397.92.079262.5115.62.45447.1
RC-2-1591.266.11.765193.188.92.374275.2104.92.80237.44
RC-2-3099.664.01.815198.184.02.382270.3100.02.83535.27
RC-5-289.976.61.548197.695.01.920286.5114.02.30449.48
RC-5-592.974.01.563178.593.01.965268.5111.02.34547.34
RC-5-1598.258.81.686198.874.02.122267.986.92.49234.87
RC-5-3099.950.01.965195.767.02.634264.774.02.90925.44
RC-10-299.376.01.469174.899.01.913260.1126.02.43551.75
RC-10-599.971.01.496176.192.01.938259.8117.82.48247.46
RC-10-1599.257.01.596193.273.02.044248.991.02.54835.72
RC-10-3099.939.71.761198.856.92.523264.264.42.85622.55
RC-20-290.169.01.496191.295.82.077259.6104.52.26646.12
RC-20-599.766.01.529176.194.22.182264.4100.02.31643.17
RC-20-1599.860.51.693193.283.02.322270.489.02.49035.74
RC-20-30100.443.61.906192.556.92.488289.670.83.09622.87
Table 7. Parameters of fitting curves of Formula (7).
Size (mm)Rubber Content (%) a b c d R 2
0.100.061.311.57−1.600.99
20.061.312.00−2.110.99
50.061.312.07−2.230.95
150.101.472.26−2.590.97
300.111.552.91−3.210.94
0.500.061.311.57−1.600.99
20.081.411.84−2.030.99
50.101.501.79−1.900.98
150.121.611.95−2.230.98
300.151.762.34−2.730.99
200.061.311.57−1.600.99
20.081.411.74−1.870.97
50.091.481.81−1.920.95
150.111.552.12−2.400.99
300.131.692.28−2.770.98
500.061.311.57−1.600.99
20.081.391.44−1.790.96
50.081.401.67−1.980.99
150.101.491.77−2.370.97
300.171.842.28−2.610.99
1000.061.311.57−1.600.99
20.071.341.95−2.410.98
50.071.352.00−2.510.97
150.091.432.21−2.860.92
300.111.542.59−3.410.99
2000.061.311.57−1.600.99
20.071.361.69−1.810.99
50.081.381.91−2.240.93
150.101.501.89−2.650.98
300.131.652.54−3.210.98
Table 8. Parameters of fitting curves of Formulas (8)–(11).
Size (mm) k 1 k 2 R 2 l 1 l 2 R 2 m 1 m 2 R 2 n 1 n 2 R 2
0.10.180.060.920.901.300.953.771.770.91−4.65−1.860.92
0.50.260.080.911.351.380.922.201.670.91−3.24−1.760.90
20.200.070.911.121.370.912.231.670.92−3.68−1.730.95
50.330.060.951.651.320.952.521.480.93−3.21−1.730.92
100.060.150.990.761.310.992.831.770.88−4.83−2.060.83
200.220.060.991.101.320.992.861.620.91−5.09−1.770.94
Disclaimer/Publisher’s Note: The statements, opinions and data contained in all publications are solely those of the individual author(s) and contributor(s) and not of MDPI and/or the editor(s). MDPI and/or the editor(s) disclaim responsibility for any injury to people or property resulting from any ideas, methods, instructions or products referred to in the content.

