Article

The Effects of Natural Window Views in Classrooms on College Students’ Mood and Learning Efficiency

1
College of Landscape Architecture, Sichuan Agricultural University, Chengdu 611130, China
2
Faculty of Innovation and Design, City University of Macau, Macao 999078, China
3
College of Art and Design, Guangdong University of Science and Technology, Dongguan 523083, China
*
Author to whom correspondence should be addressed.
Buildings 2024, 14(6), 1557; https://doi.org/10.3390/buildings14061557
Submission received: 30 April 2024 / Revised: 23 May 2024 / Accepted: 25 May 2024 / Published: 28 May 2024
(This article belongs to the Section Building Energy, Physics, Environment, and Systems)

Abstract

:
Observing peaceful natural environments has been shown to restore cognitive abilities and reduce stress. As a result, visual access to natural environments is becoming increasingly common in educational settings. However, most current research on classroom window views has examined classroom environments in elementary and secondary schools, and only some university classrooms have been used as study sites. This study investigated the relationship between the naturalness of university classroom window views and physiological and emotional responses and standardized tests of attentional focus (learning efficiency) in university students. Thirty participants (undergraduates 21.16 ± 1.01 years old) viewed architectural window views and natural window views for 3 min each, and physiological measures of EEG, HRV index, and psychometric measures of Semantic Differences Questionnaire and Emotional State Questionnaire generated data. Measurements were generated. The results indicated that the natural window view significantly enhanced theta, alpha, and beta waves of brain activity, provided a sense of comfort, relaxation, and pleasure, and increased learning efficiency compared to the architectural window view. The findings support the beneficial associations between window views on university campuses and students’ mood and learning efficiency, emphasizing the importance of considering natural window views in the planning and designing of university classrooms.

1. Introduction

Mental health problems and their associated disorders, such as depression and anxiety, are emerging as an essential topic in global public health [1], and it is projected that by 2030, these problems may become a key contributor to the increased burden of disease [2]. As a result, governments and public health organizations are gradually increasing their attention and investment in public mental health [1]. Green space is an indispensable link in urban ecosystems and has an indispensable role in maintaining mental health [3]. Much research focuses on older adults [4] and children’s populations [5]. It is argued that green spaces can provide psychological shelter for the elderly and reduce depressive symptoms [6], as well as how they can promote children’s psychologically healthy growth [5]. Compared to children and older adults, undergraduates are not considered a vulnerable group, and therefore, the living conditions of this group have received less attention. However, depression is prevalent in the college student population [7,8]. A growing body of research suggests that college students are a broad group that may be at increased risk for attention fatigue. During the college years, students are exposed to a variety of stressors ranging from academic [9] and personal [10,11] to social pressures [11,12]. These ongoing stressors can negatively affect students’ sleep quality, physical health, and mental health, further impacting academic ability, academic performance, and employment achievement [13]. According to a systematic review, 30.6% of college students suffer from depression, which is significantly higher than the rate reported in the general population [7].
Although nature and green spaces have many positive effects on people, existing studies have also demonstrated that exposure to campus green spaces has a positive impact on student’s mental health and that green environments on campus can significantly enhance students’ mental health and help them recover from stress and mental fatigue [14]. However, college students’ heavy schedules, coursework, and extracurricular work may cause them to spend most of their time indoors, needing more physical activity and preventing easy and frequent access to green spaces on campus [15].
Researchers have been very productive on how green spaces affect human and mental health, with many pioneering studies in environmental psychology [16]. Since the early 1980s, scientific studies have demonstrated the benefits of nature and green spaces for humans and communities [17,18]. The potential benefits of interacting with nature and human health, including stress reduction and psychological restoration, promotion of physical activity, and immune system regulation, have been explored and demonstrated to a considerable extent [19,20]. In addition, access to green spaces can enhance an individual’s psychological well-being, provide opportunities for social interaction, and enhance social cohesion [17,21]. Moreover, a recent study in the United States found that green spaces on campus significantly distract college students and allow them to easily engage in a soft fascination with nature between classes. This soft fascination gave students a mental break from the hard fascination associated with campus life and hectic course schedules [22]. Thus, campus green spaces can be viewed as a health resource for college students undergoing stress [15]. Several theories have been proposed to explain the effects of exposure to green spaces on personal health, such as Attention Restoration Theory (ART) [16], which suggests that exposure to natural environments can help us improve our attention and ability to focus. Stress Reduction Theory (SRT) [23] suggests that exposure to nature may have a direct restorative effect on cognition and may reduce stress.
Since a window view is the fastest and easiest way to observe the outdoor environment, most people usually prefer indoor spaces with a window view, and when they are given a choice between a windowed or windowless office, most will choose a windowed indoor space [24]. Previous research in environmental psychology has shown positive associations between window views and human mental health and well-being. Ulrich [25] demonstrated that patients who saw green space in a hospital recovered faster than those who saw a brick wall. A study by Gilchrist et al. showed [26] that employees were satisfied with office landscaping, especially trees, grasses, and ornamental plants, and these were associated with improved mental health. Similarly, university dormitory residents with more natural views from their windows had a greater capacity for direct attention than those with fewer natural or building views [27]. A study conducted in 29 elementary schools in southwestern Germany showed that the naturalness of window views was positively associated with children’s well-being. Nature experiences contributed to children’s perceived comfort and learning satisfaction, attention and concentration, and social connectedness at school [28]. A survey of five Illinois high schools showed that seeing green landscapes in the classroom significantly improved students’ recovery from stressful experiences compared to seeing built spaces in the classroom [29]. A study conducted in 101 public high schools in southeastern Michigan that examined the effects of nearby natural environments on student academic achievement and behavior showed that seeing a large number of trees and shrubs from a classroom window was positively correlated with standardized test scores, graduation rates, the percentage of students planning to attend four-year colleges, and rates of delinquent behavior [30]. Not much research has been conducted on college students and window views, and it has also been mentioned in a current study that college dormitory residents who see more natural views from their windows have a greater capacity for direct attention than those who have fewer natural or building views [27].
Many past studies have investigated indoor environmental factors that affect learning outcomes, such as lighting, air quality, temperature, acoustics, and non-optical visual elements [28,31,32], and found that poor indoor environments affect students’ health and well-being, leading to absenteeism and lower academic performance [33,34,35,36]. For example, a study by Sleegers et al. [37] concluded that teachers and students have clear preferences for classroom lighting and that reasonable lighting control aids learning. In addition, learning in noise-filled environments tends to distract learners, affecting learning outcomes [38,39]. Various studies have shown that learning in poorly ventilated environments with poor air quality negatively affects learning outcomes and student attendance [35,40].In a study by Wang et al. [41], it was shown that non-light visual factors include factors such as indoor colors, indoor surface textures, spatial design, and window views. Satisfying the non-light visual factors of the indoor environment positively impacts students’ cognitive functioning and overall performance. The view of natural elements favors high learnability and learning satisfaction [28]. For visible features of outdoor or indoor spaces, landscapes with natural features have a positive impact on cognition and performance. High school landscapes lacking natural features have been shown to lower standardized test scores [30], and schools with more trees have a higher percentage of students scoring proficient or advanced on standardized maths and reading tests [42].
The above studies give important insights into this study. However, there are still some shortcomings in the research on college students regarding classroom window views, mental health, and academic performance. ① The current research on classroom window views mainly focuses on primary and secondary school students [28,29], and the impact of window views on more college students in the classroom environment needs to be explored in depth. The stress of primary and secondary school students mainly comes from their need to get good grades in school [43], while the stress of college students comes from many aspects such as finance, health, study, employment, family relationships, and love life [44]. There is a great and growing need for college students to have a restorative and stress-reducing environment [27]. Classroom window landscapes are good moderators, and visual access to natural landscapes is strongly associated with good psychological outcomes [45,46]. Understanding whether a classroom with natural windows would be a supportive environment for coping with college student stress is imperative. We wanted to know whether natural window views would significantly affect college students’ recovery from stressful experiences more than building window views. ② There are differences between the teaching systems of primary and secondary schools and universities. Primary and secondary education mainly adopt a fixed classroom teaching system, where each class is taught to a fixed number of students in a fixed classroom according to a plan for a long period; there is a single classroom window view [47,48]. In the previous studies, the impact of primary and secondary school classroom window views on primary and secondary school students’ long-term learning has mainly been explored [28,30]. University education is based on the elective system. University education mainly adopts the elective, walk-in, and credit systems. There is no more unified lecture classroom; as the classroom environment changes, the window view also changes with mobility [49,50]. Therefore, for college students, choosing a classroom environment with building or natural window views is more conducive to a lesson’s immediate learning efficiency, and student emotions are still worth exploring. ③ Most of the existing studies on the effects of window views on college students’ mood and academic performance have used questionnaires or scoring systems to assess the combined effects of window views on students’ ratings and course grades [46,51,52]. In this study, we chose neuroscientific and psychometric methods to jointly assess the effects of college classroom window views on college students’ moods and academic performance. As researchers and practitioners become increasingly interested in the impact of campus environments on student health, there is a growing emphasis on utilizing scientific knowledge to inform campus design, including cognitive neuroscience approaches. Cognitive neuroscience incorporates many scientific issues, such as the psychology of cognitive processes, anatomy, or human physiology (including the human brain). It focuses on the neural basis of mental processes, combining theories from cognitive psychology and computer modeling with experimental data from the brain [53]. EEG (electroencephalogram) measurements, fMRI (functional magnetic resonance imaging), as well as GSR (galvanic skin current response), HR (heart rate), EMG (electromyography), and eye tracking belong to the cognitive neuroscience approach. Neuroscience-based measurement techniques are less prone to assessment errors and are more objective. They allow information to be obtained from its source (the brain) before it is presented in the form of opinions or judgments (e.g., surveys or interviews) [54,55]. Some of them, such as the EEG, are characterized by a very high temporal resolution, which permits time-accurate measurements of people’s responses to presented stimuli [56,57]. Since information about the surrounding environment is received through the five senses, vision is one of the most important, providing an estimated 83% of the information. Information is captured by visual receptors and then transmitted by neurons to the brain, where it is processed and interpreted [58]. This suggests that there is value in observing brain activity if we are to measure environmental stimulus perception. Moreover, this value is enhanced because different brain parts will be activated in different activities and exposure to different stimuli. Changes in brain waves measured by a portable EEG device in the study of Beyer et al. suggest a biologically plausible link between exposure to green space and reduction in stress and mental fatigue [59]. In the study by Elsadek et al. EEG and heart rate changes showed that viewing green spaces from high-rise buildings can significantly increase alpha waves in the prefrontal and occipital lobes of the brain, which is associated with the physical and mental health of the occupants [45]. Therefore, it may be more valuable to choose neuroscience and psychometric methods to jointly assess the effects of university classroom window views on college students’ mood and academic performance.
This study aimed to investigate the effects of university campus windowscape on college students’ mood and learning efficiency, for which we measured the electroencephalogram (EEG) HRV index and conducted a word association task to examine students’ standardized attention span (learning efficiency), as well as psychological responses through the use of semantic differential (SD) and Profile of Mood States (POMS). Nowadays, most of the studies on physiological measures of EEG and HRV indices have been focused on experiments on the effects of landscaped green spaces or indoor greenery on people’s mental health [45,60] and have not yet been applied to studies of classroom windowscapes on students’ psychological and learning efficiency. The study’s results may help to understand how seeing natural landscapes from a university campus window view affects students’ psychological state and learning efficiency.
Based on the literature reviewed above, we propose the following hypotheses:
H1. 
When college students view natural window views compared to building window views, there is a positive association with increased brain activity and creating a comfortable environment. Natural window views will be associated with more positive emotions (e.g., feelings of comfort and friendliness) and fewer negative emotions (e.g., feelings of anxiety, fatigue, and stress). This is the response expected by Attention Restoration Theory (ART) and Stress Reduction Theory (SRT).
H2. 
HRV scores increase, and states are more stable and relaxed when college students view a natural view than a building one.
H3. 
When college students viewed the nature window view, they were more likely to feel comfortable, relaxed, and happy and were more successful in reducing stress and increasing vitality than when they viewed the building window view.
H4. 
College students perform better, score higher, and learn more efficiently on standardized concentration tests when viewing a natural window rather than a building window view.

2. Materials and Methods

2.1. Participants

This study was conducted with students in a third-year undergraduate class at Sichuan Agricultural University in China, where the same class showed some variability in performance, i.e., there were high and low levels of achievement. The choice of such a study population helps enhance the findings’ general adaptability. There were 30 university student participants in this study, and the mean age of the participants was 21.16 ± 1.01 years (mean ± SE) with normal or corrected-to-normal vision. In addition, no participant was treated for any disease illness or took any medication during the experiment. At the beginning of the experiment, each participant was informed of the study procedures, after which each participant was asked to sign an informed consent form to participate in the study. Participants were asked to refrain from drinking alcohol, caffeine, and smoking throughout the experiment. The study was conducted according to the Declaration of Helsinki, and the Ethics Committee of Sichuan Agricultural University approved the protocol.

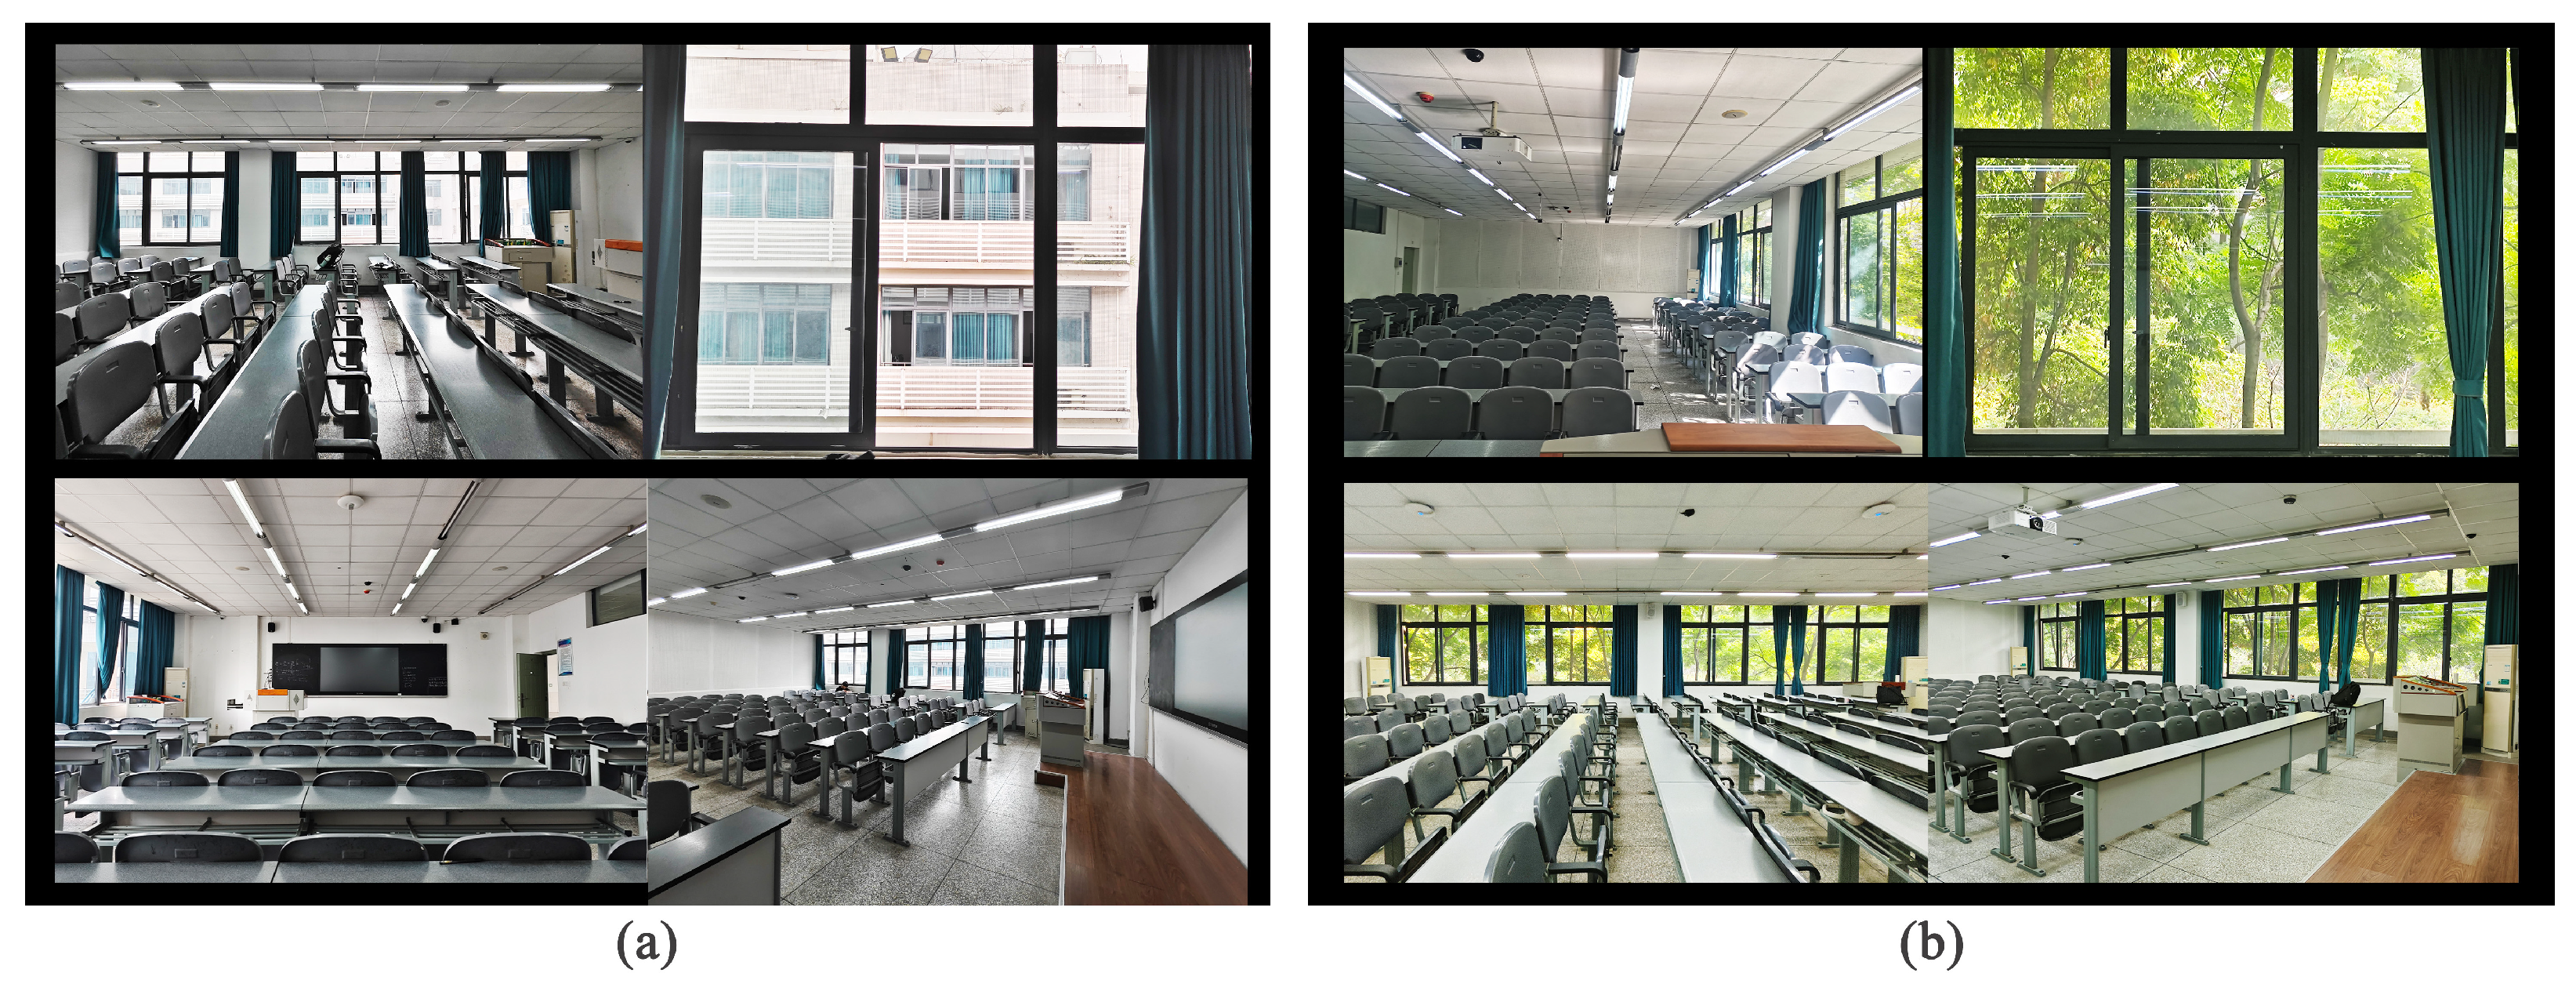
2.2. Experimental Environment

The experiment was held in May 2024 at the Chengdu campus of Sichuan Agricultural University and lasted one week. Two visual stimuli were administered simultaneously during the daytime (08:00 a.m.–12:00 p.m.) to obtain comparable results. Participants were assigned to two conditions—a classroom where students on the 5th floor of the teaching building in Area B could view building window views (Figure 1a) and a classroom where students on the 2nd floor of the teaching building in Area B could view natural window views (Figure 1b).

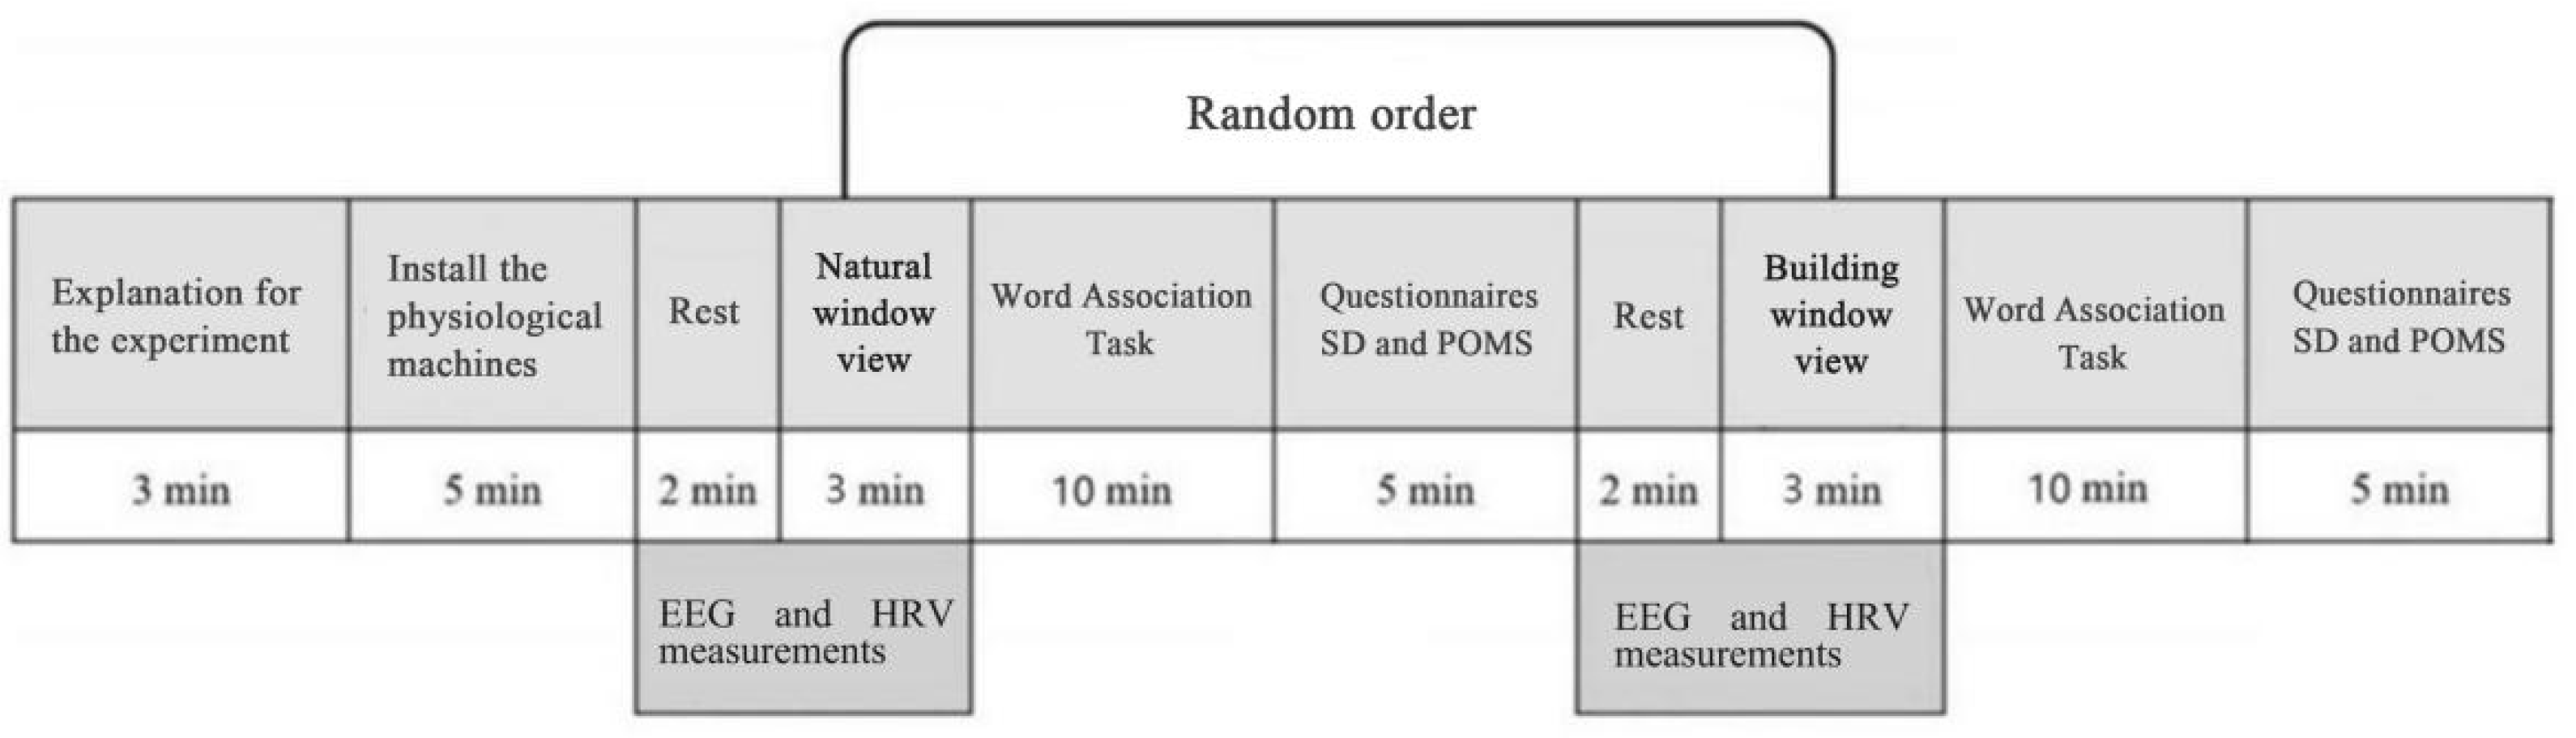
2.3. Experimental Process

The experiment was selected for early summer weather in May 2024, consistent with the human comfort selection. The experiments were conducted in two sessions, with the two experiments completed within a week of each other. The experimental time interval was used to eliminate experimental legacy effects, and the same experimental time (8:00 a.m.–12:00 p.m.) was used to eliminate the effects of daily variations in physiological rhythms. Thirty participants were randomly divided into two groups of 15 participants each. In the second experiment, the groups underwent classroom rotation to eliminate order effects. The purpose and procedure of the study and how to use the apparatus were clearly explained to the participants before the experiment began. After the procedure was explained in detail, each participant was transferred to two classrooms with temperatures at 24 °C ± 0.5 °C and relative humidity at 50 ± 5%, with participants in the 5th-floor classroom in Area B being able to view the architectural window view and participants in the 2nd-floor classroom in Area B being able to view the natural window view. Participants were asked to sit in a chair with the participants’ eyes at a distance of 50 cm from the window visual stimulus. Portable EEG electrodes and HRV heart rate ear clips were fitted for physiological measurements. Participants alternately opened and closed their eyes during four one-minute cycles to verify the reliability/stability of the electrode recordings. Each participant then rested comfortably with their eyes closed for 2 min to adjust themselves to the experimental atmosphere and then was further asked to open their eyes, minimize body movement (to reduce the appearance of irrelevant artifacts in the EEG recordings), and focus on either the natural window view or the building window view (control) for an additional 3 min, with the participant’s physiological responses continuously measured during the test. Following the visual stimulation, each participant performed a word association task; the association task required participants to generate up to 30 words for each adjective listed. The task was in no particular order, so if participants encountered a particular adjective, they could move on to the next one. Participants were asked to complete this task within 10 min, and the final total number of words generated by the participant was considered a score. After the association task, participants were asked to answer two questionnaires, Semantic Differences Scale (SD) and Profile of Mood States (POMS), to examine their subjective psychological responses. The experimental procedure is shown in Figure 2, where each participant experienced two experimental conditions. The duration of one experiment was 30 min, and the total duration of the two experiments was 60 min.

2.4. Physiological Measurement

We used the NeuroSky MindWave EEG instrument to measure brain electrical activity. The EEG instrument consisted of 4 components: (1) headband, (2) EEG electrode sensor, (3) ear clip, and (4) Bluetooth device. The data records of EEG instrument were from electrode sensors with their tips tightly placed against the human forehead to measure the original signals of brain activity, power spectrum, relaxation, and attention levels, as well as environmental noises from human muscles, power outlets, computers, signal light, and other electric instruments [61]. Regarding brain activities, power densities at different frequency ranges could be used to quantify major brain waves across these frequency ranges. The frequency ranges of the power spectra of significant signals are as follows: 8–11 Hz for the relatively slow alpha1, 11–13 Hz for the relatively fast alpha2, 4–8 Hz for theta, 13–15 Hz for relatively low beta1, and 15–30 Hz for the relatively high beta2 [62]. The original EEG data were detected at 512 Hz, and the output frequencies of concentration and relaxation parameters were 1 Hz, that is, one data per second. eSense™ (Beijing, China) is a patented algorithm of NeuroSky that measures people’s current mental state in the form of digital parameters. NeuroSky ThinkGear™ (Silicon Valley, CA, USA) technology first amplified the original EEG signals and filtered out environmental noise and interference caused by the movement of muscle tissues. The device had a microchip that preprocesses data transmitted to a computer via Bluetooth. The eSenseblem algorithm is then utilized to calculate people’s current mental state in terms of a numerical index and to obtain quantitative eSense metric values, including the attention level, which ranges from 1 to 100 (0 to 20: very low; 20 to 40: a little low; 40 to 60: natural state; 60 to 80: a little high; and 80 to 100: very high), i.e., in a state of great concentration [63,64].
The formula is as follows.
Pa = ( + + ) × 100
Pa indicates the level of attention; γ, β, and α are the percentage of EEG energy accounted for by the γ, β, and α waves, respectively; m, n, and t are the weighting coefficients of the γ, β, and α waves, respectively.
The HRV ear clip was used to collect heart rate and HRV index data, which was a PPG-based sensor measuring pulses. The sensor was comprised of a USB adapter and 3.5 mm ear clips, which utilized a USB to a serial port converter to communicate with the computer and could send heart rate, heart rate interval, and HRV index to the computer [65]. The module adopted photoelectric sensors that isolate electrical interference and improve sensor stability. HRV index indicates a subject’s emotional state with a value between 1 and 10 across 10 levels, and the lower the value, the more relaxed the wearer’s state.

2.5. Standardized Focused Attention Test (Word Association Task)

After the physiological test, each participant performed a word association task, which is a creative task. Previous studies have shown that when engaged in a creative task, natural landscapes may promote the production of positive emotions. Creativity increases when people are in a positive mood, and this change in mood affects task performance and learning efficiency [52,66,67]. The word association task required participants to generate up to 30 words for each adjective listed. The task was not in any particular order, so if participants encountered a particular adjective, they could move on to the next one. Participants were asked to complete this task within 10 min. The final number of words generated by the participant was considered the task score [67]. The higher the total number of words produced by the participant in the same amount of time, the higher the task score and the more efficient their learning.

2.6. Psychological Measurement

Upon completing the word association test, participants were asked to evaluate their psychological mood and perceptions of the indoor environment. Two psychological scales, the SD and POMS, were adopted to test participants’ psychological feelings. The SD scale consisted of opposing adjectives such as “comfortable vs. uncomfortable”, “natural vs. artificial”, “relaxed vs. wakened”, and “beautiful vs. ugly”. Depending on the emotional level, each question was scored using a 5-point Likert scale (−2, 1, 0, 1, and 2), and the higher the score, the better the emotional state. The POMS scale is a 5-point self-rating scale comprising 30 adjectives from 0 “not at all” to 4 “very much”. The standard rating of POMS generates an overall distress score called total mood disorder (TMD) and scores of 6 subscales: tension-anxiety (T-A), depression (D), anger-hostility (A-H), fatigue (H), confusion (C) and vitality (V). For T-A, D, A-H, F, and C, the lower the scores, the better the emotional state, and a higher score on the V scale denotes a better emotional state. The total mood disturbance (TMD) score was calculated using the following formula:
TMD score = (T-A) + (D) + (A-H) + (F) + (C) − (V).
A lower total TMD score reflects a better emotional condition [65].

2.7. Data Analysis

The e-SenseTM algorithm analyzes the collected EEG signals to obtain the EEG power spectrum and the mean value of attention [61]. The study used Excel for all the collected sample data for statistical grouping and preprocessing to remove the data with apparent errors and obtain valid data. The data were analyzed using the IBM SPSS statistical software (Windows version 25.0). When observing the natural or building window view, the Wilcoxon signed-rank test was used to analyze the differences in physiological data (EEG, HRV index) and psychological indicators (SD method and POMS) after the two types of visual stimuli. Also, a paired-sample t-test was used to compare the mean scores on the word association task after the two visual stimuli. All data are expressed as mean ± standard deviation (mean ± SD). The significance level was set at p < 0.05. All statistical analyses were performed using Excel and SPSS, and graphics were performed in Origin.

3. Results

3.1. Physiological Reactions

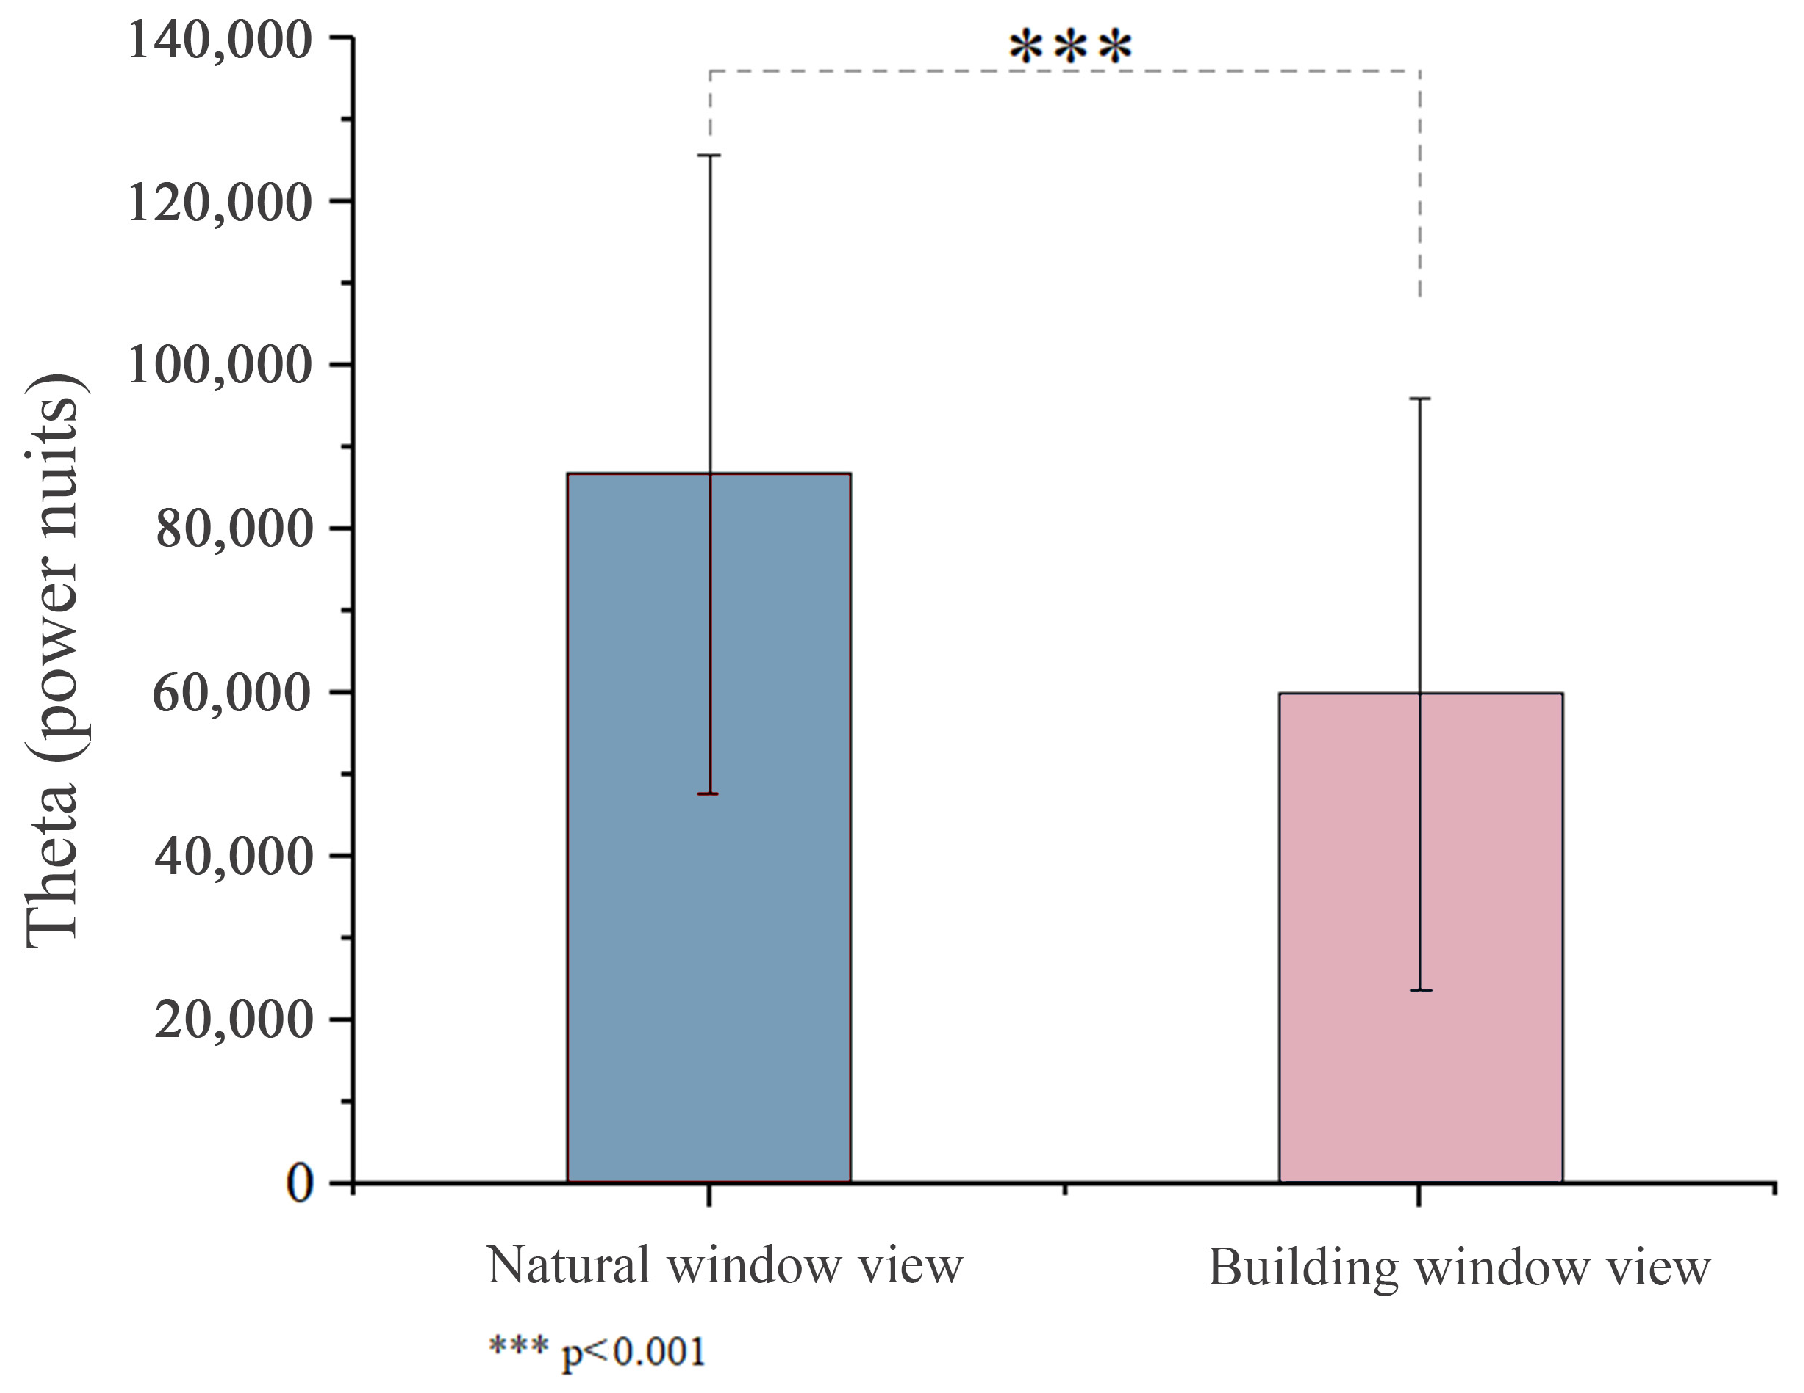
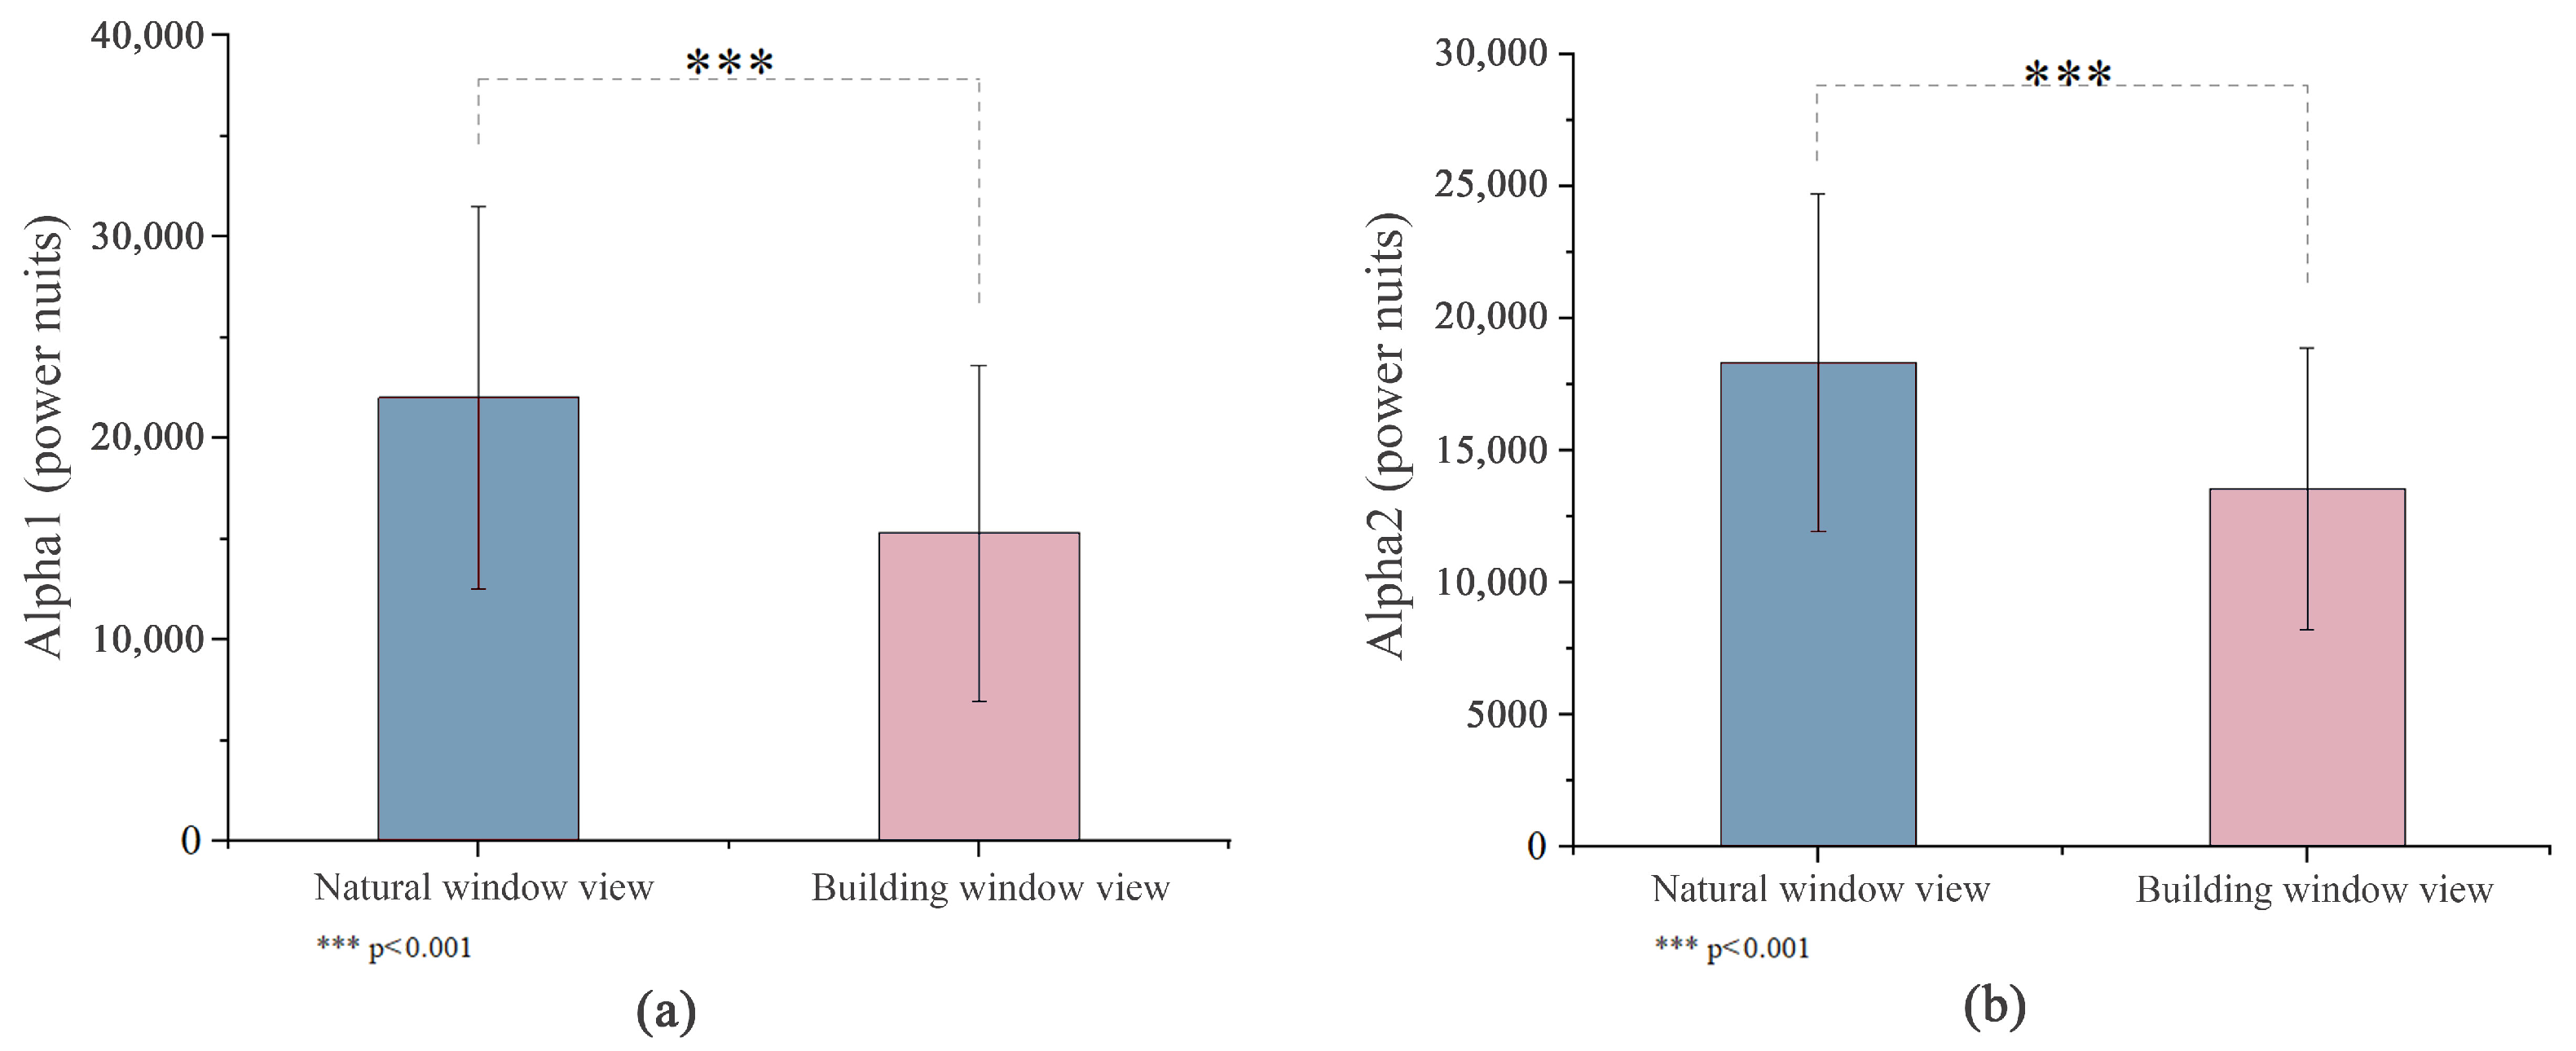
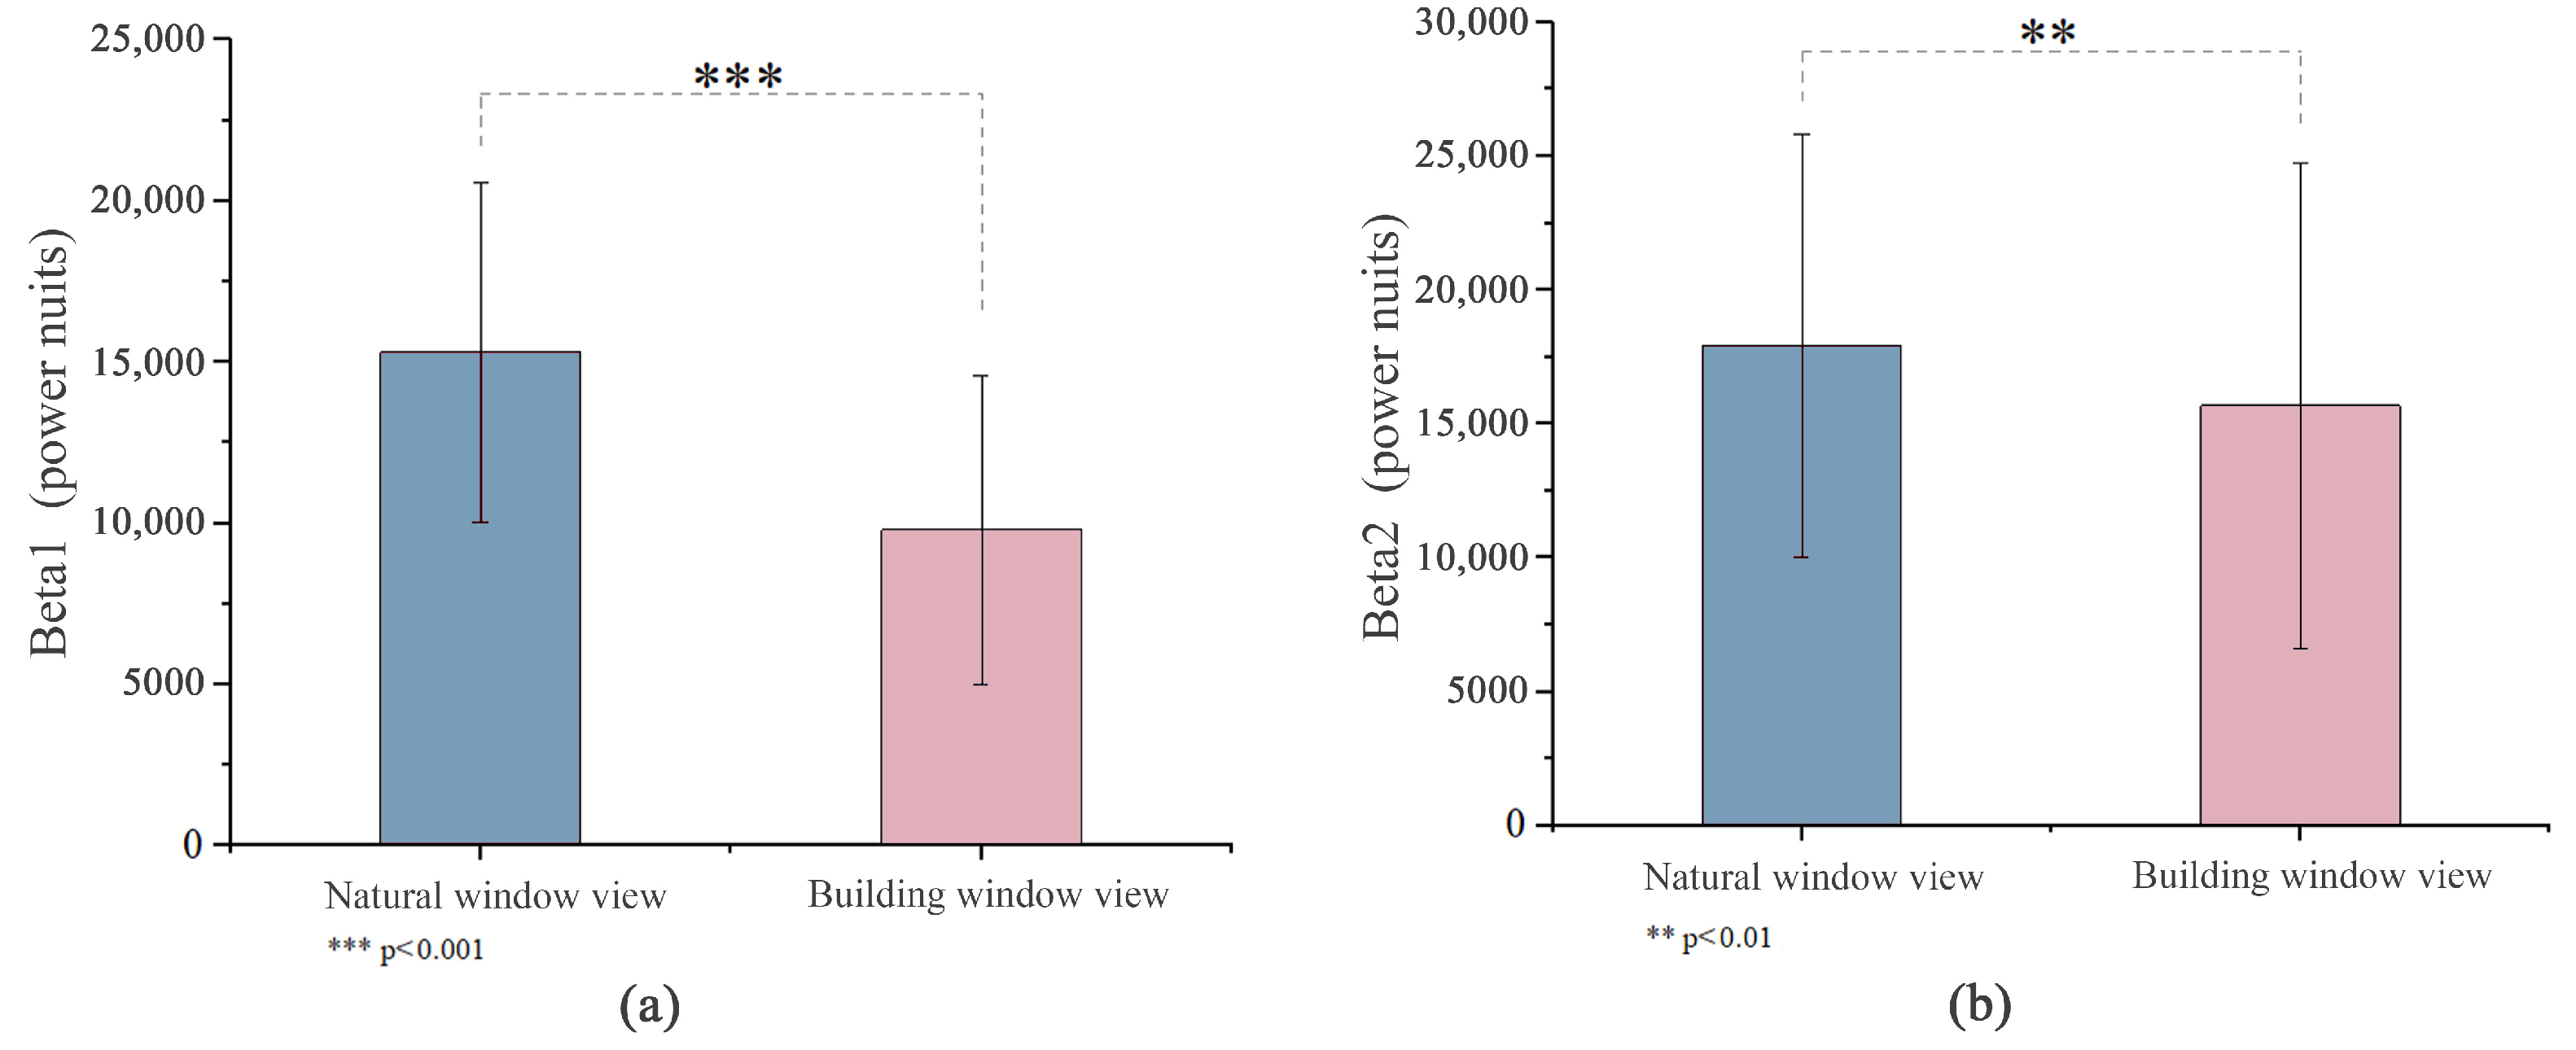
3.1.1. Analysis of EEG Theta, Alpha, and Beta Waves

The paired Wilcoxon signed rank test indicates that when participants watched two visual stimuli, the results of their EEG theta waves changed significantly. The results, as shown in Figure 3, showed that the mean value of theta wave when participants viewed the natural window view (86,838.3 ± 39,066.8) was higher than the mean value of theta wave when they viewed the building window view (59,925.1 ± 36,031.7), with a significant difference at p < 0.001. The results indicate that theta waves significantly increased when participants viewed natural window views.
As shown in Figure 4, the results of the EEG alpha waves changed significantly when the two types of visual stimuli were watched. The mean alpha1 wave when participants viewed the natural window view (22,025.0 ± 9479.9) was higher than the mean alpha1 wave when they viewed the building window view (15,309.4 ± 8315.4), with a significant difference at p < 0.001. In addition, the mean alpha2 wave when participants viewed the natural window view (18,330.9 ± 6371.8) was higher than the mean alpha2 wave when they viewed the building window view (13,549.6 ± 5346.9), p < 0.001, which is a significant difference. These results suggest that alpha waves significantly increased when participants viewed natural window views.
As shown in Figure 5, the results of the EEG beta wave changed significantly when the two types of visual stimuli were watched. The mean beta1 wave when participants viewed the natural window view (15,308.5 ± 5280.7) was higher than the mean beta1 wave when they viewed the building window view (9792.3 ± 4798.7), p < 0.001, which is a significant difference. In addition, the mean beta2 wave when participants viewed the natural window view (17,930.3 ± 7903.1) was higher than the mean beta2 wave when they viewed the building window view (15,677.6 ± 9064.0), p < 0.01, a significant difference. These results suggest that beta waves significantly increased when participants viewed natural window views.

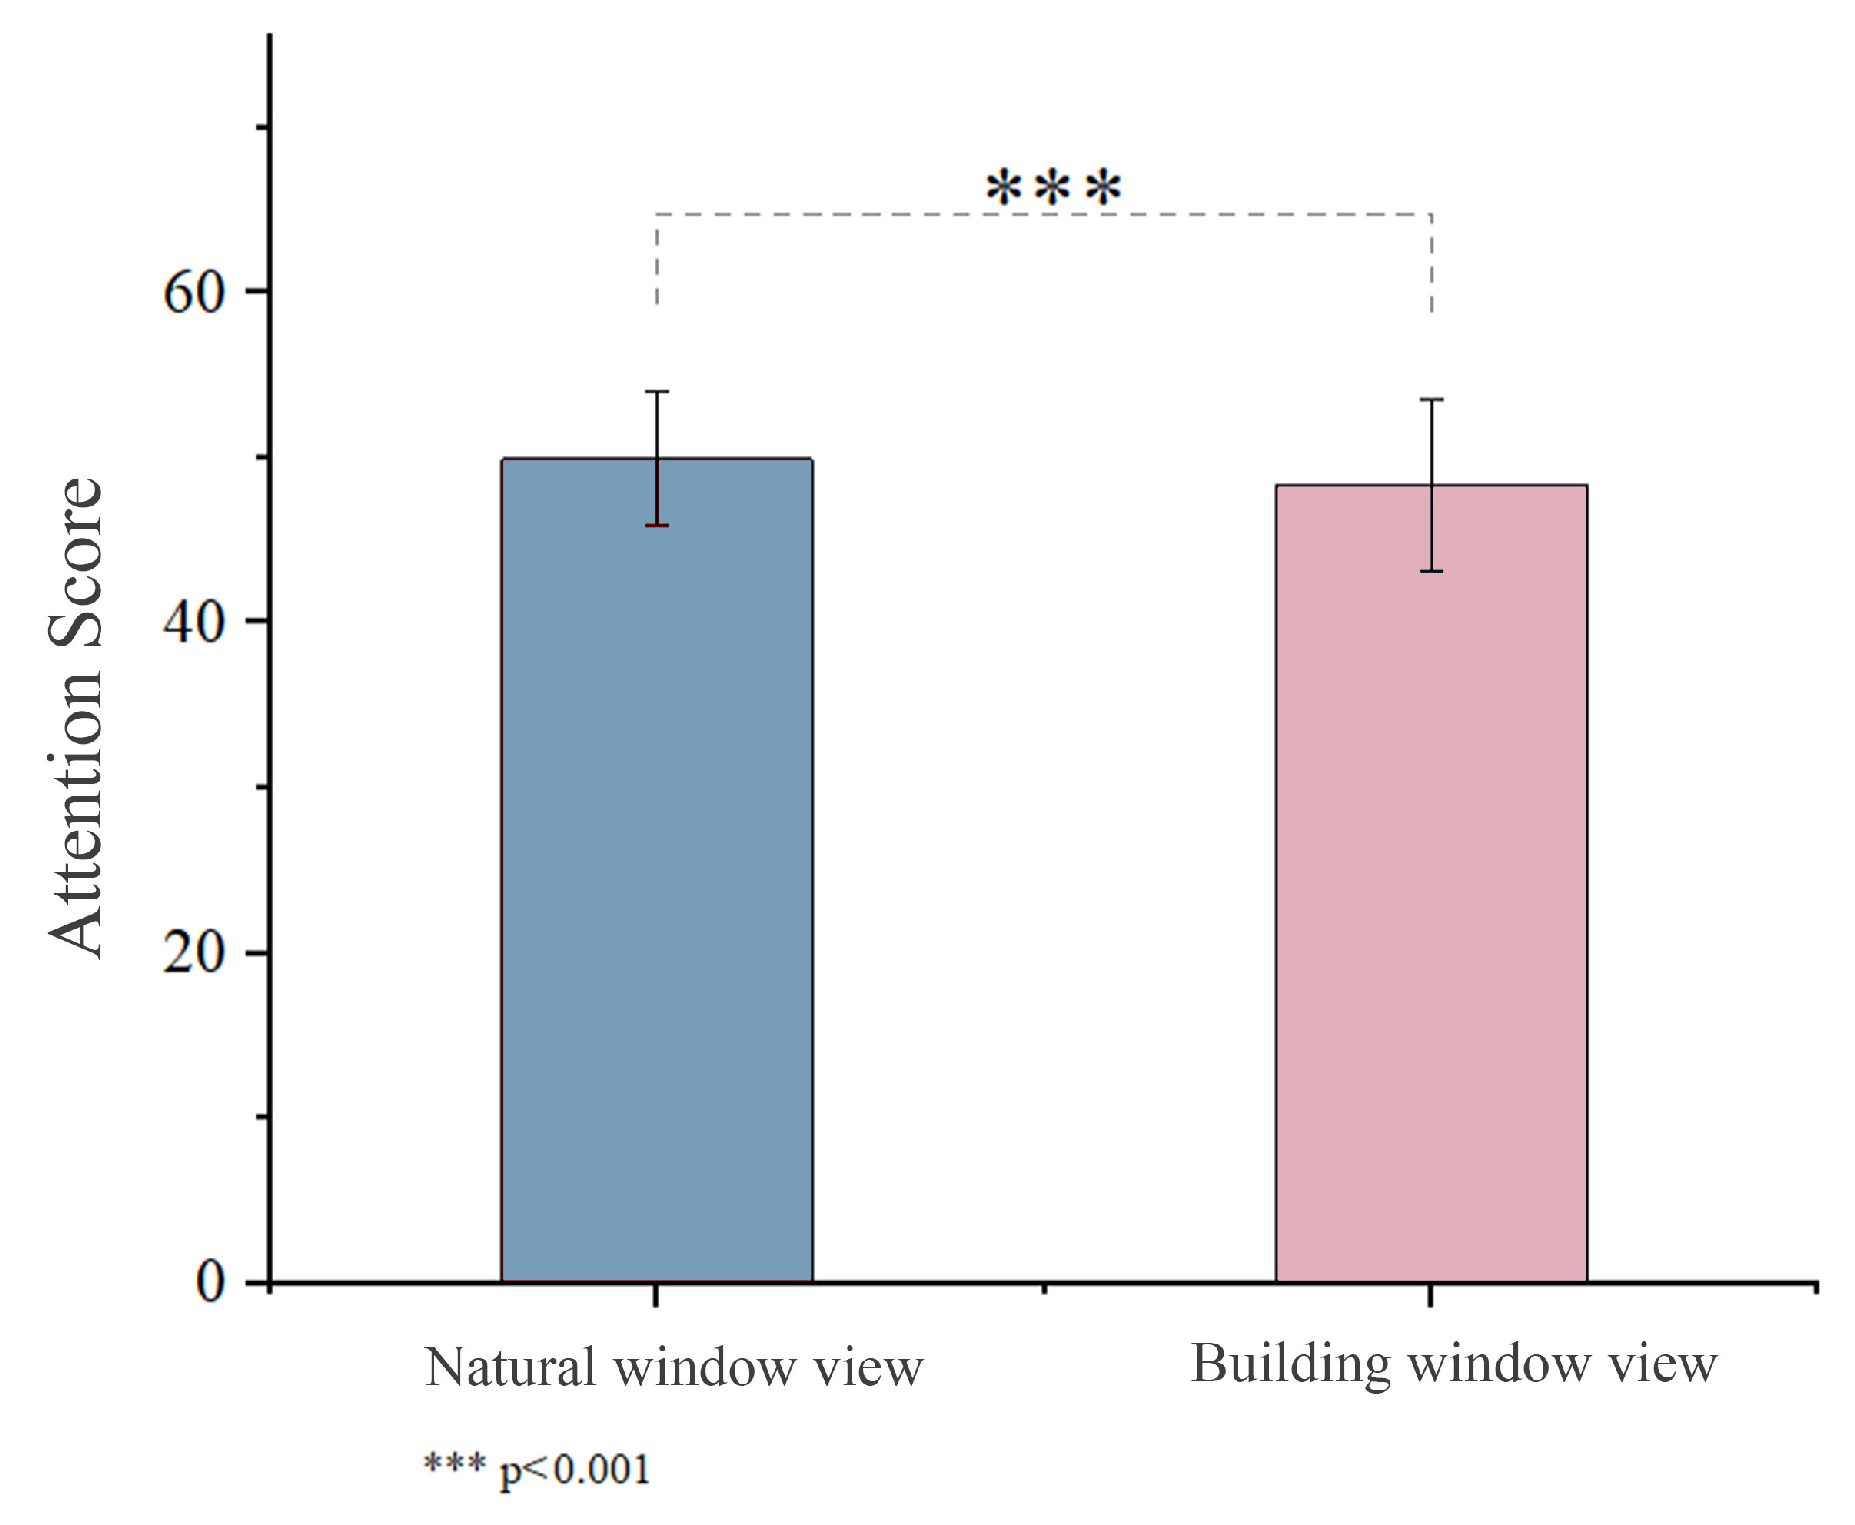
3.1.2. Analysis of Attention Level Results

Participants’ attention levels were significantly changed while viewing the two visual stimuli. As shown in Figure 6, the mean of the participants’ attention levels when they viewed the natural window view (49.9 ± 4.0) was higher than the mean of their attention levels when they viewed the building window view (48.3 ± 5.1), p < 0.001, a significant difference.

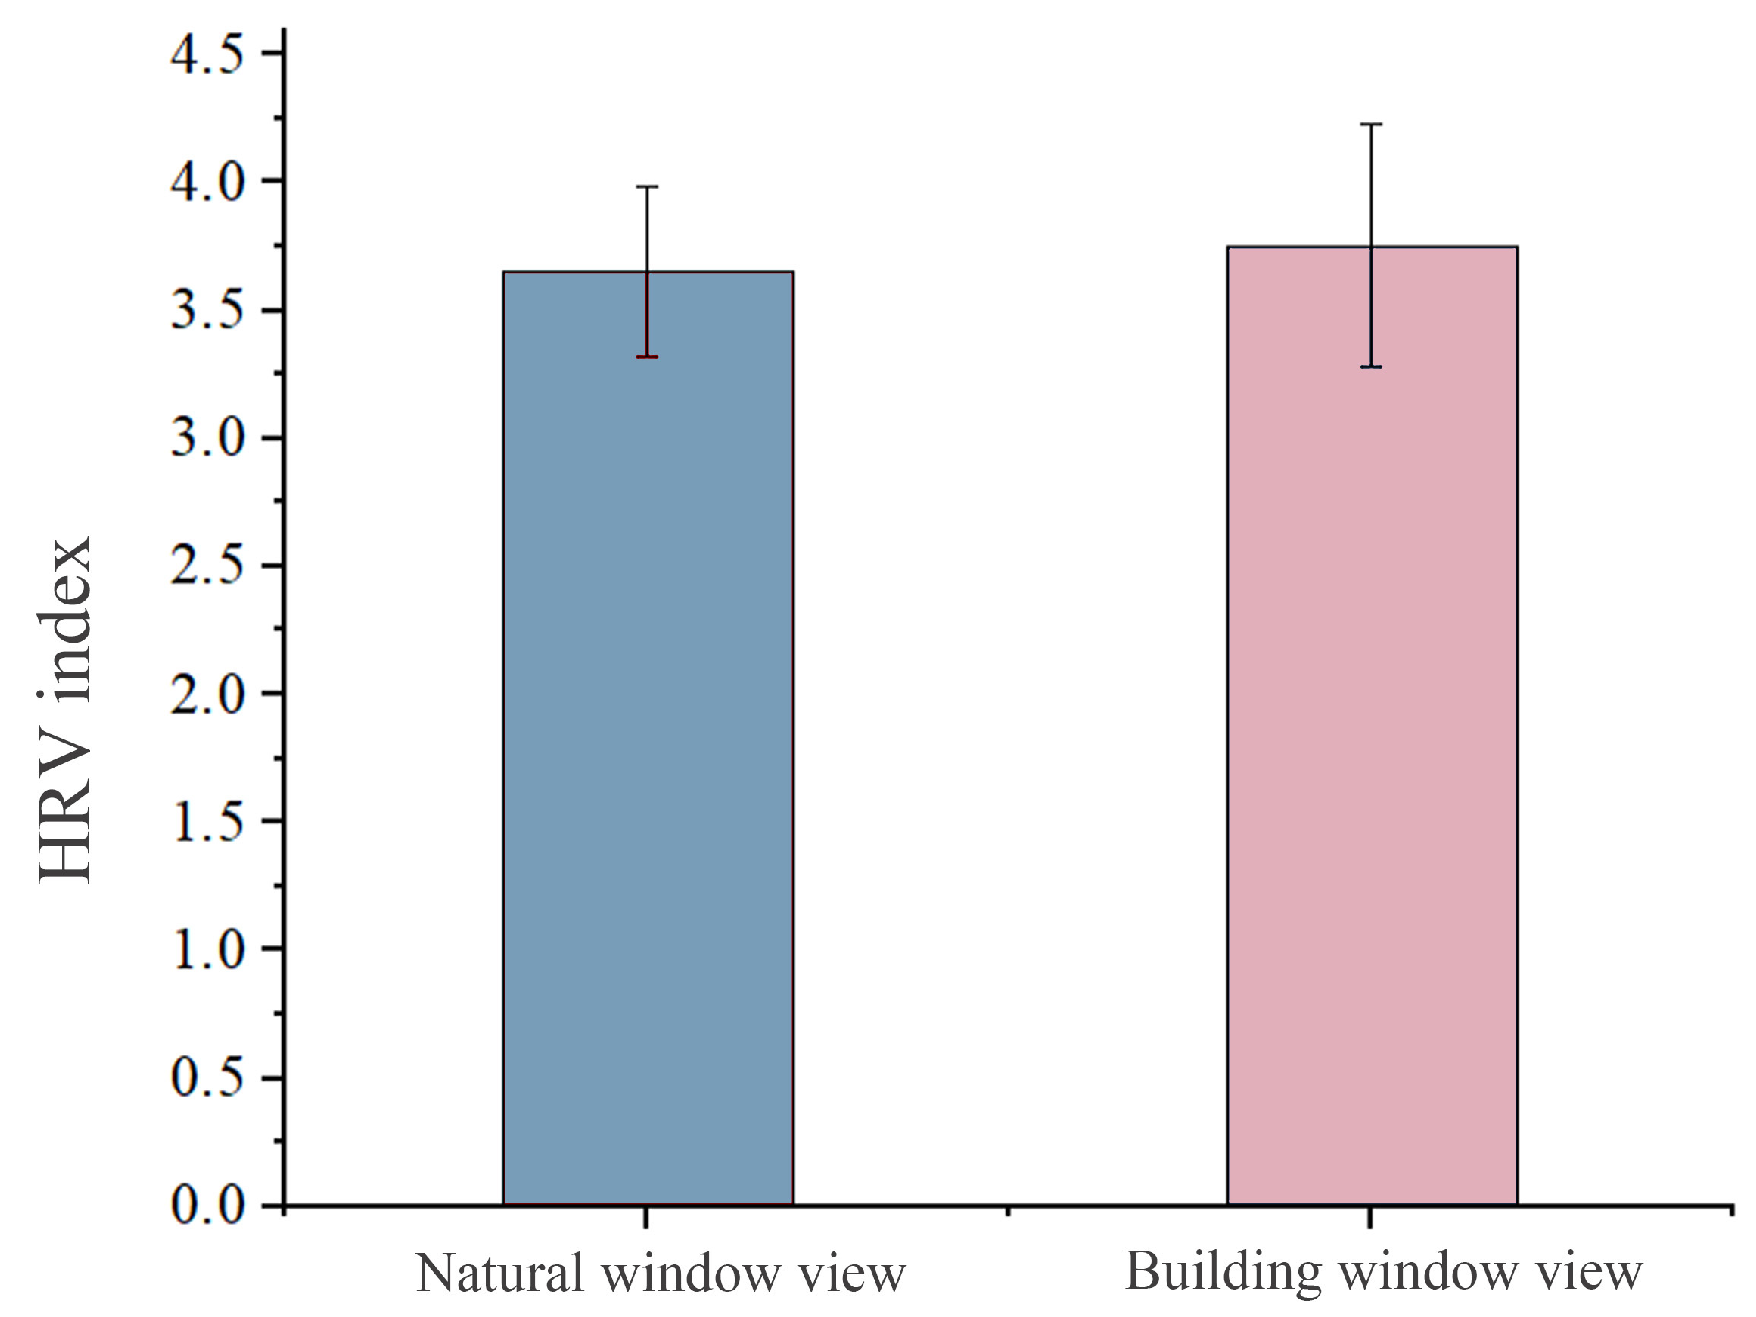
3.1.3. Analysis of HRV Index Results

As shown in Figure 7, participants’ HRV index did not change significantly when the two types of stimuli were watched. There was no significant difference in the HRV index when participants viewed the natural window view (3.65 ± 0.33) versus when they viewed the building window view (3.75 ± 0.47), p > 0.05.

3.2. Psychological Reactions

3.2.1. Reliability of Questionnaire Scales

Cronbach’s α was used to estimate the internal consistency of the experiment. As shown in Table 1, both POMS and SD have a relatively high internal consistency.

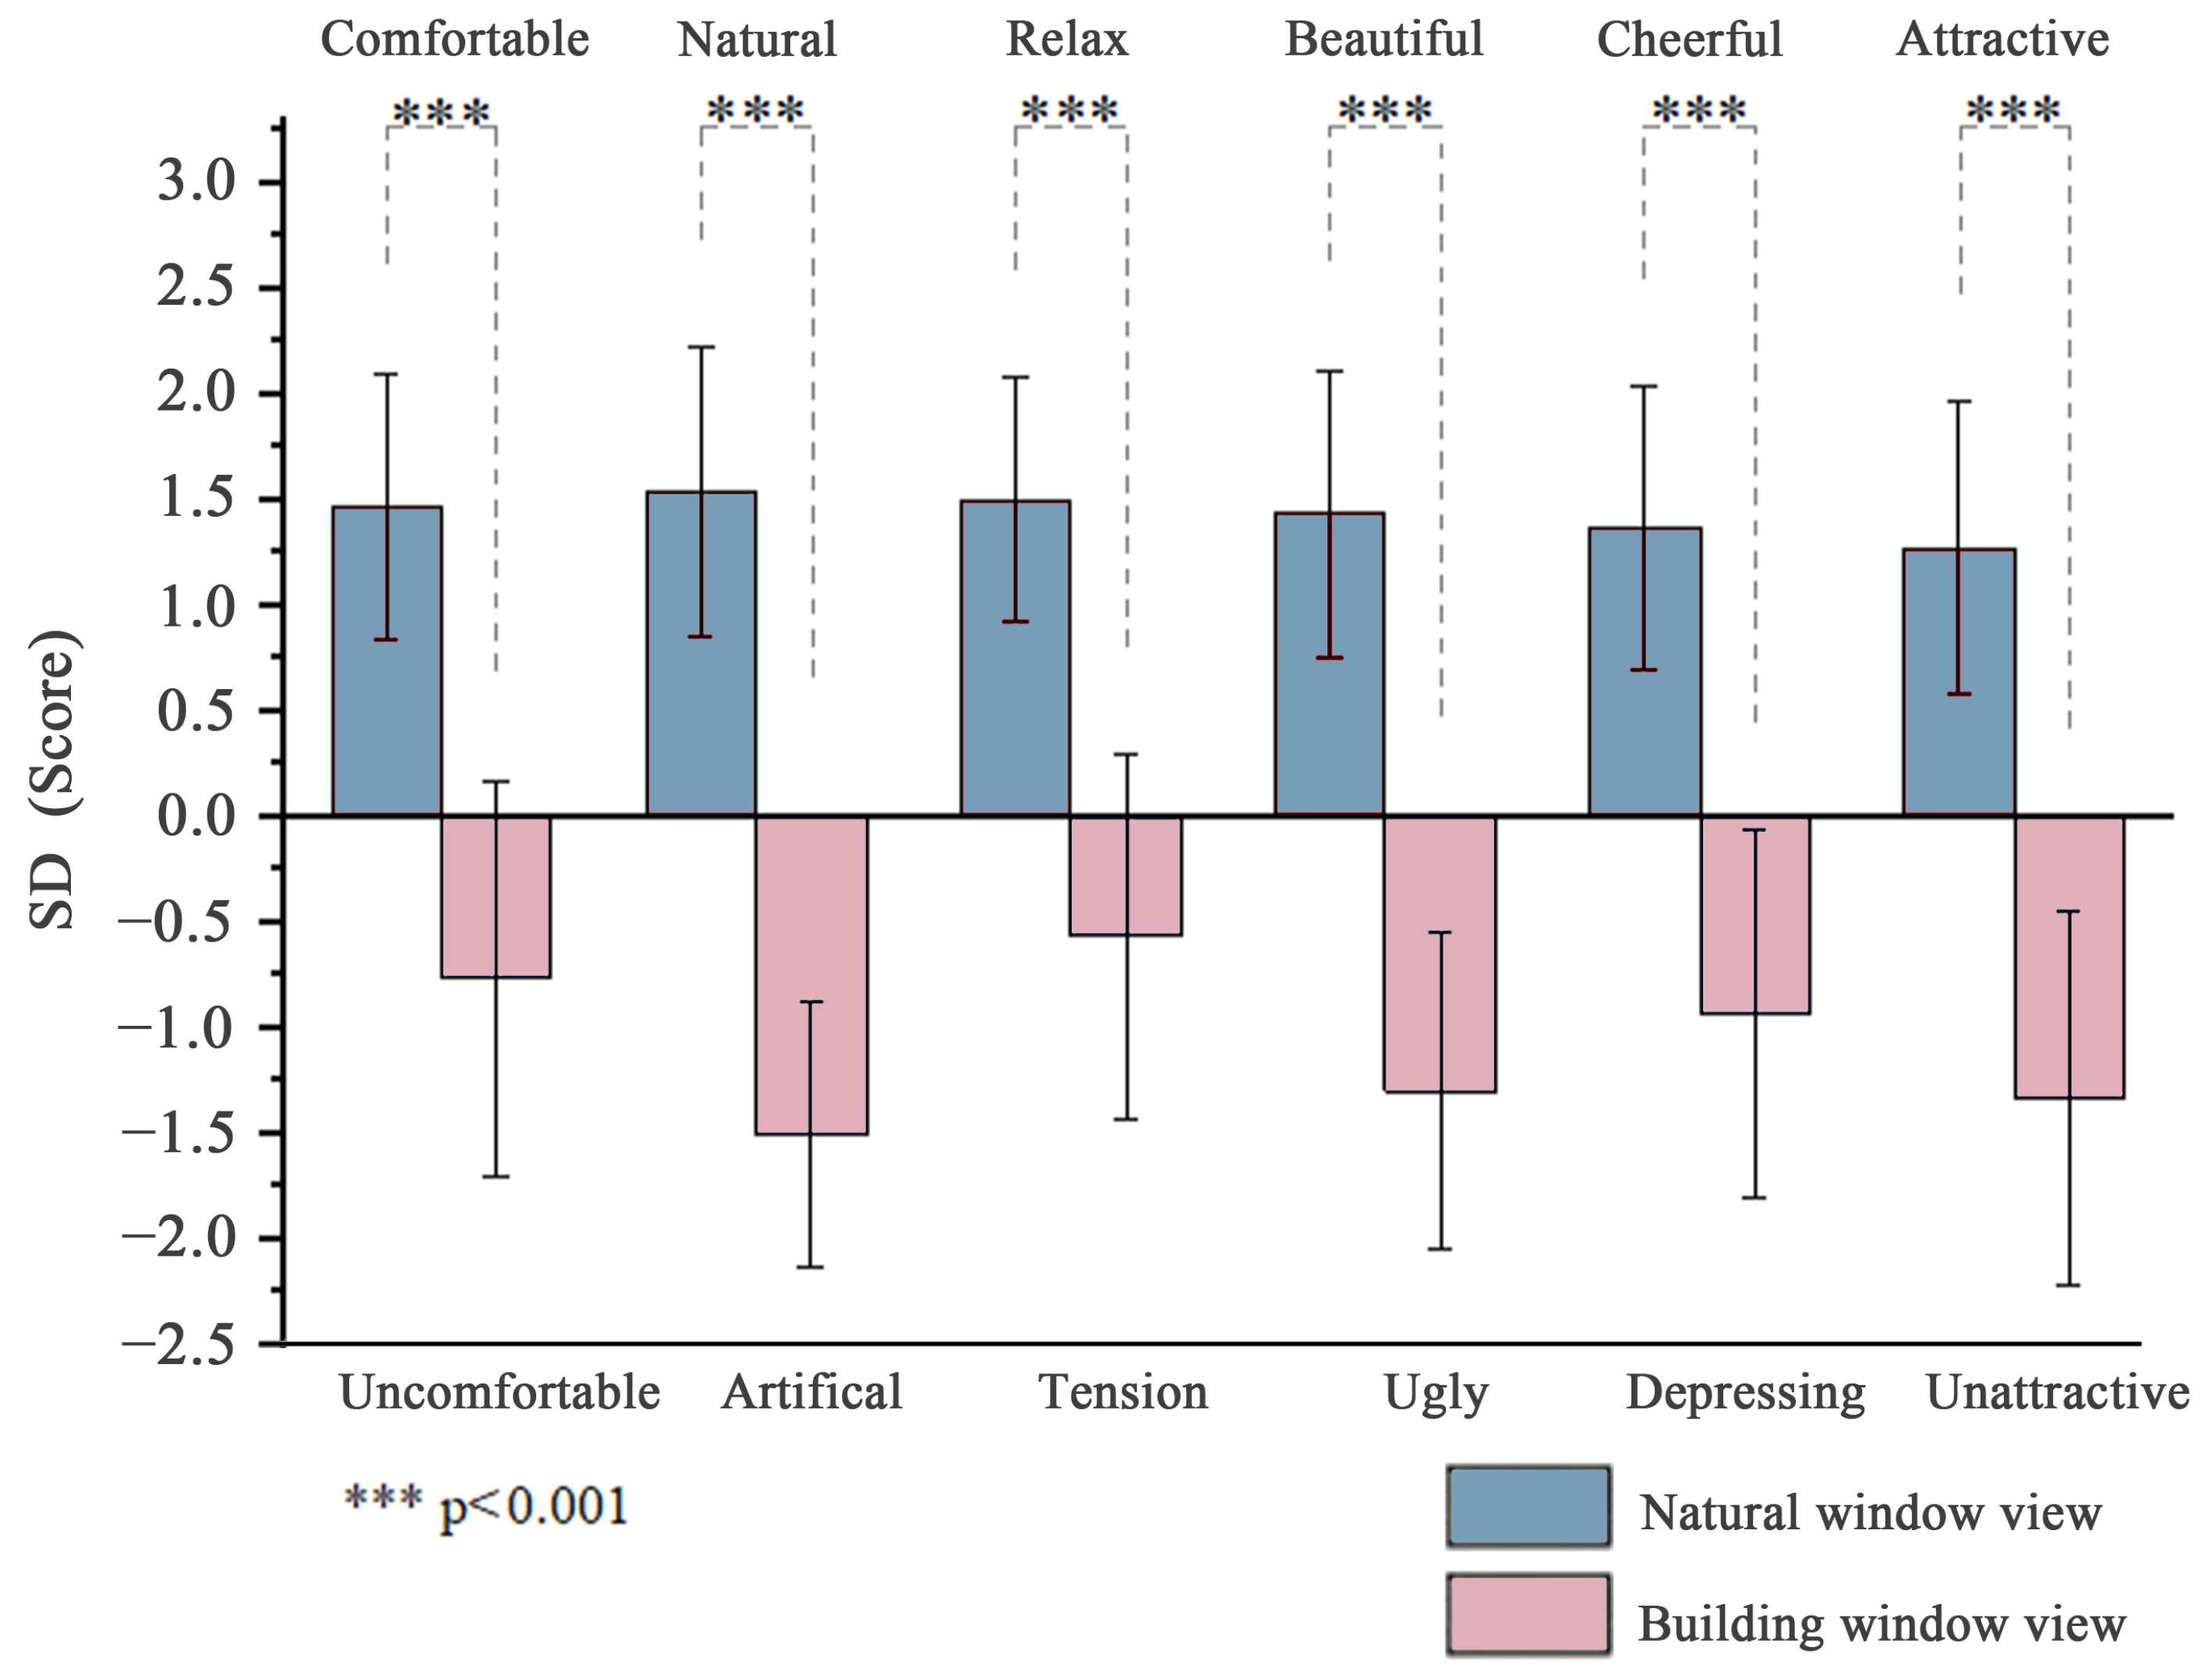
3.2.2. Analysis of SD Scale Results

Figure 8 shows the results of the participants’ psychological feelings assessed by the SD questionnaire after viewing the natural and building window views. The Wilcoxon signed rank test showed that all SD question scores changed significantly after viewing the natural and building window views. Natural window views were rated as significantly more “comfortable”, “natural”, “relaxing”, “beautiful”, “pleasant”, and “attractive” than building window views (p < 0.001). These results suggest that participants were more relaxed and pleased with viewing natural window views than building window views. Thus, participants were more likely to evoke comfort, relaxation, and positive emotions when learning in an environment with natural window views than in an environment with building window views.

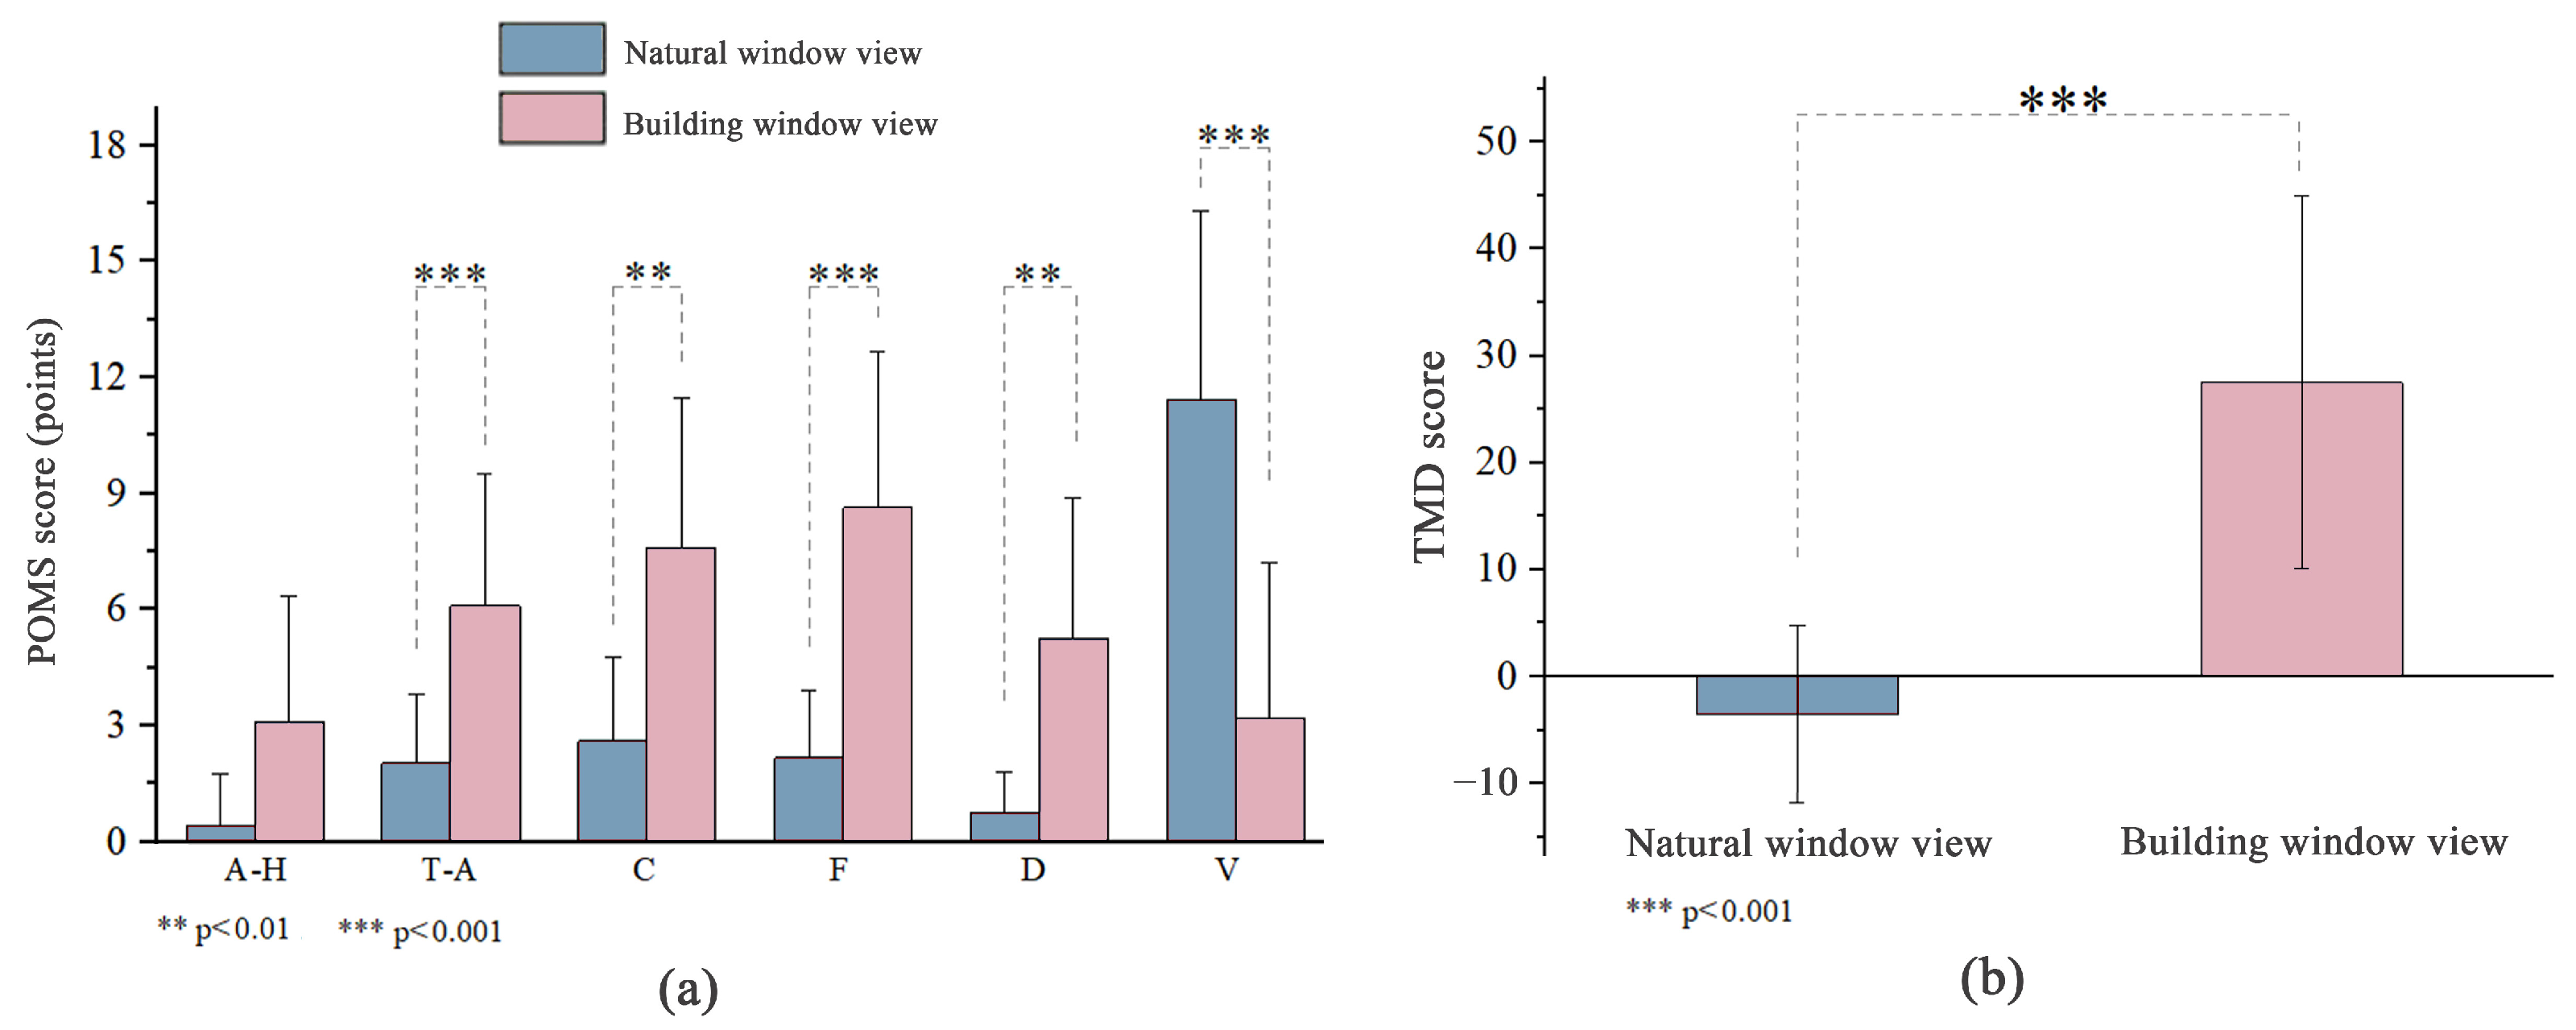
3.2.3. Analysis of POMS Scale Results

Figure 9 summarizes the results of the POMS questionnaire, showing the mean scores and TMD scores for the six subscales after participants viewed the natural window view versus the building window view. Negative subscales T-A (p < 0.001), C (p < 0.01), F (p < 0.001), and D (p < 0.01) of the POMS were significantly reduced, and positive emotional state V (p < 0.001) was significantly increased after viewing the natural window view compared to the building window view. However, the negative scale A-H did not differ significantly between the two visual stimuli. In addition, TMD scores were significantly lower after viewing the natural window view than after viewing the building window view (p < 0.001).

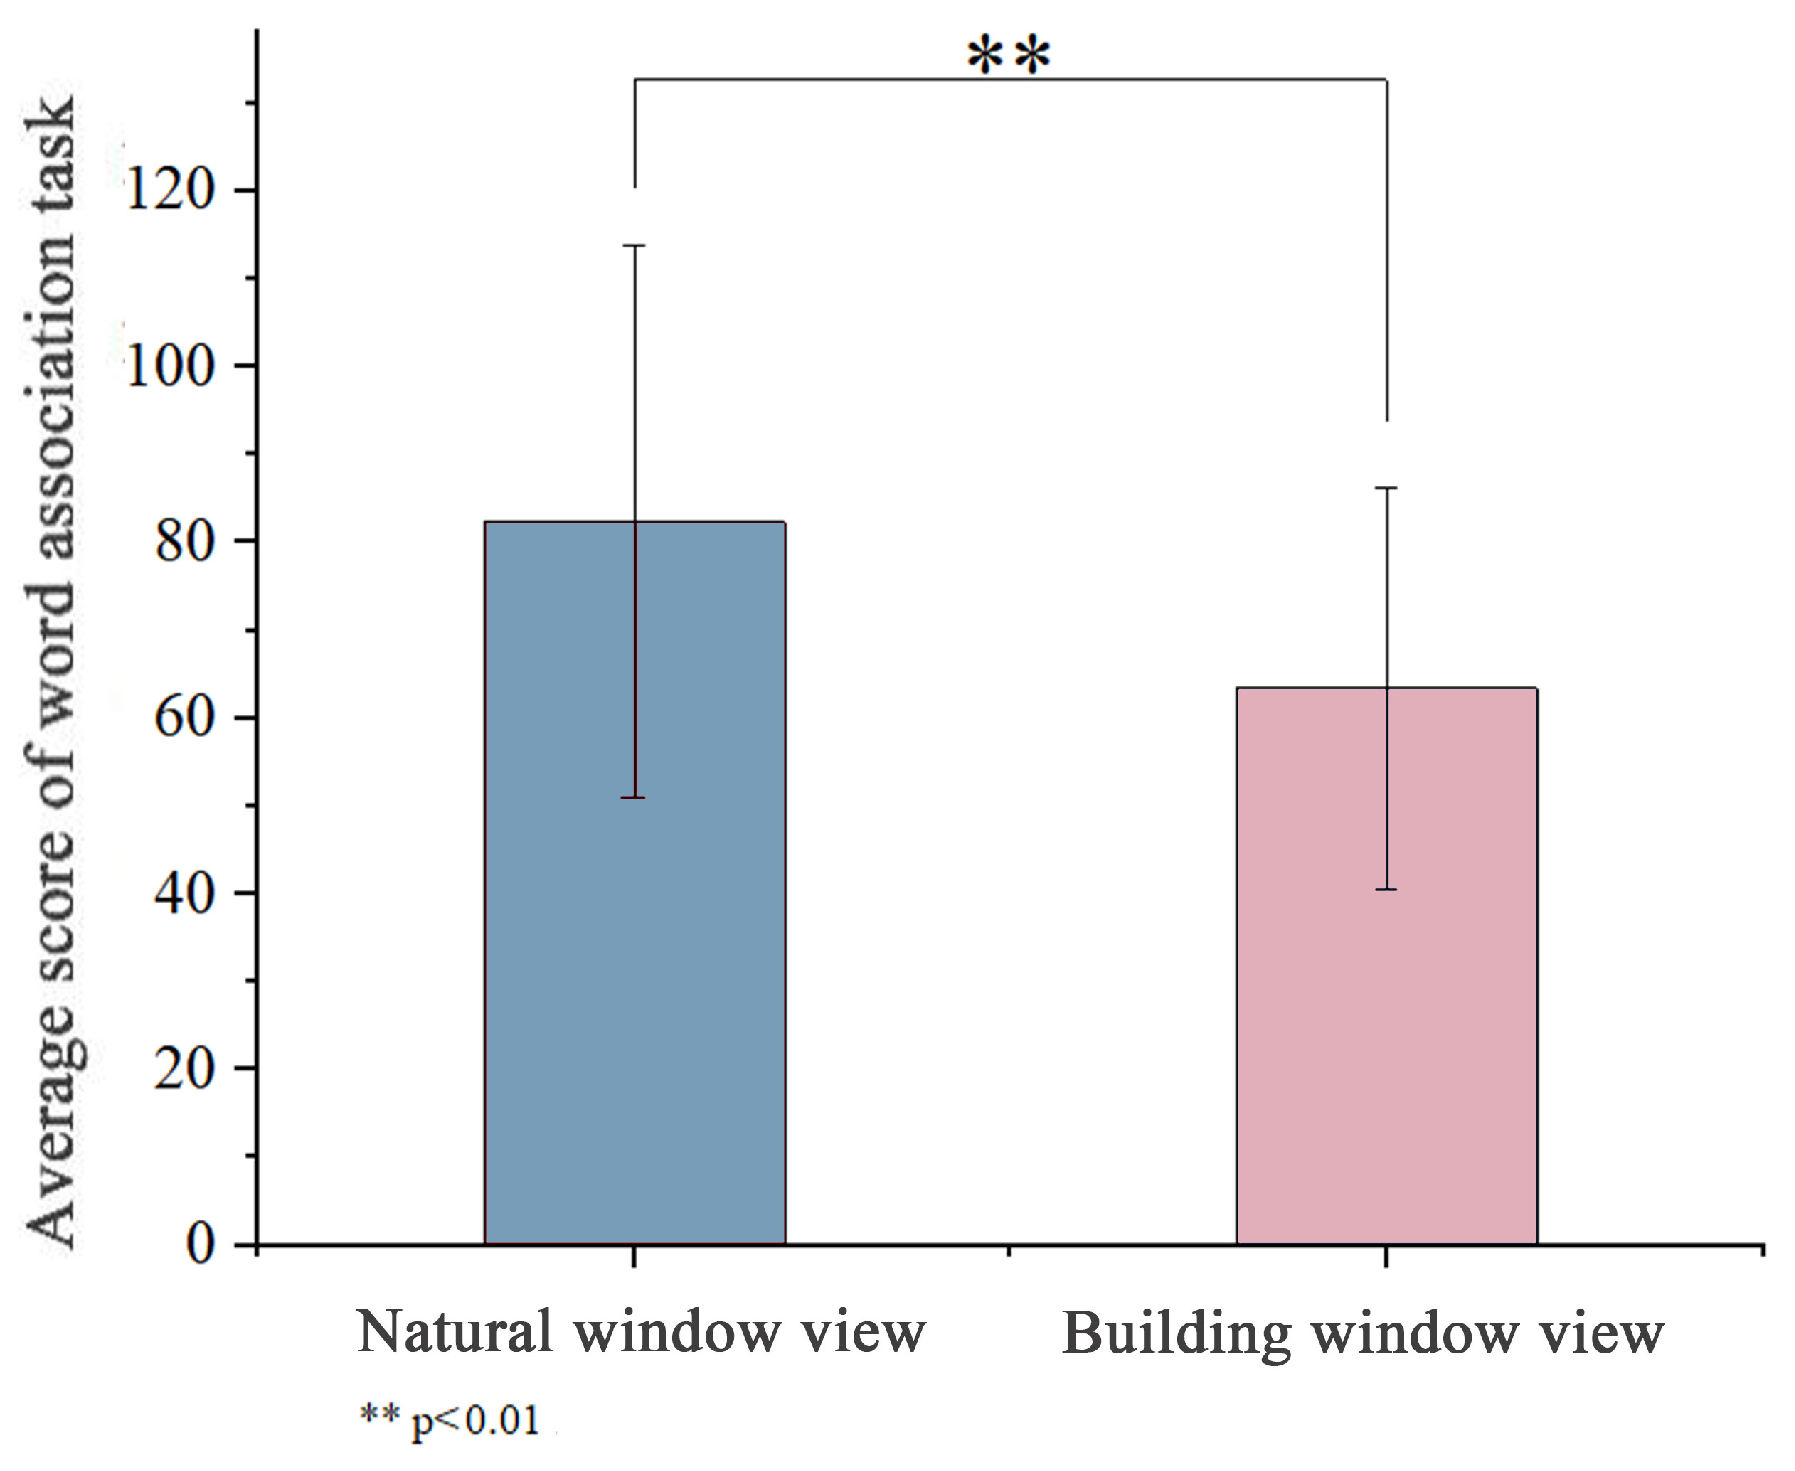
3.3. Analysis of Results of Standardized Focused Attention Test (Word Association Task)

The task score for the word association task is the total number of words generated by the participant. Figure 10 shows the mean scores for the word association task after participants viewed the natural versus architectural window view. The task score when participants viewed the natural window view (82.3 ± 31.4) was higher than the task score when they viewed the architectural window view (63.3 ± 22.8), with a difference of p < 0.01. These results suggest that participants scored higher for viewing natural window views than architectural ones. Therefore, participants learned more efficiently by simultaneously generating more words in the natural window view setting than in the building window view setting. This is consistent with the findings of Hesselink [52], who found that word association task performance was enhanced for participants in rooms with plants compared to those without plants. These positive effects of plants on task performance may be attributed to people’s perception of relaxation and soothing towards nature and plants [52,68].

4. Discussion

In terms of physiological responses, our study showed that when college students viewed natural window views compared to building window views, there was a positive association with increased brain activity and creating a comfortable environment. Analysis of theta waves showed that participants who viewed natural window views had higher mean values of theta waves, indicating that participants were in deep relaxation and reduced stress. Consistent with Schacter’s [69] study, an increase in theta waves implies deep relaxation, in which inspiration and creativity follow. For the alpha waves, the analysis showed that participants who viewed natural window views had higher alpha wave averages, indicating increased attention, decreased depression, calmness, and increased brain awareness within the participants. Consistent with the results of Jang [62], the results elaborated that viewing greenery had a positive effect in relaxing the body, reducing anxiety and improving mood, and increasing physiological activity in the brain, with an increase in the power spectrum of the relatively fast alpha wave and an increase in the level of attentional creativity. Beta wave analysis showed that participants who viewed natural window views had higher beta wave averages, suggesting that participants viewing natural window views reduced their state of exhaustion and had increased levels of awareness. According to previous studies, beta wave activity decreases in the sleepy state and increases in the alert state [70]. The above findings fully support the first hypothesis (H1). Therefore, our findings support the conclusion that the two environments affect brain activity differently. Participants in a classroom with a natural window view feel more relaxed and less stressed and have increased positive emotions compared to a building window view.
As an index further determining the relaxation and stress states of participants, the HRV index was measured. The index quantified heart rate fluctuations related to changes in internal and external environments, especially changes caused by autonomic nervous system activity [65]. However, the study’s results showed that participants’ HRV indices when viewing natural window views were not significantly different from those when viewing building window views, and the second hypothesis (H2) was not confirmed. A possible explanation is that we used natural window views for classrooms, which remained unchanged for at least one year instead of experimental conditions. In intervention studies such as [28,71,72], the effect of introducing plants into classrooms was initially significant on comfort and aesthetic quality, but that effect gradually diminishes with students’ adaptation to the new classroom environment. Since participants in this research were selected from students of the researchers’ university, their familiarity with the window view stimuli may have produced a certain effect on the results. Further, many risk factors such as sex, age, body mass index, smoking status, drinking status, and cardiovascular and other health conditions could all affect measurement results of the HRV index.
Regarding psychological responses, college students felt more comfortable, relaxed, and happy when they viewed the natural window view than when they viewed the building window view, which is consistent with our third hypothesis (H3). From the results of the Semantic Differences Questionnaire, natural window views scored higher on “comfortable” and “relaxing”, and participants felt more “natural”, “beautiful”, “pleasant”, and “attractive”. Thus, the natural window view produced a more comfortable and relaxing feeling than the building window view. This result is consistent with previous research findings that visual interaction with greenery can reduce stress and that urban dwellers can derive great physiological and psychological benefits from green facade viewing [65]. For the POMS questionnaire results, viewing natural window views had a positive effect on participants’ emotional state compared to building window views, with a significant decrease in the four negative POMS scales T-A, C, F, and D, and a significant increase in the positive emotional state scale V. The POMS questionnaire results also positively affected the participants’ emotional states. Low scores on the negative mood scales produce many positive emotions that support student learning in classrooms with natural window views, and viewing natural window views can successfully reduce stress, relax, increase vigor, and improve student learning efficiency.
In this study, we investigated the effects of the naturalness of classroom window views on participants’ performance on a word association task and their mood. The effect of a classroom with natural window views on participants’ performance was apparent; participants performed better, scored higher, and learned more efficiently after viewing natural window views than after viewing building window views. Therefore, the fourth hypothesis (H4) was confirmed. Previous studies have also reported that nature views can reduce stress, restore students’ attention, and improve overall mood, translating into a better classroom experience and higher subjective scores [46].
Taken together, these findings offer some interesting possibilities for real-world applications and raise questions about existing practice and research related to university classroom design. Our study conducted a control test between classrooms with natural window views and classrooms with building window views, and the results showed that the naturalness of classroom window landscapes in universities was related to college students’ emotions and learning efficiency. In a biophile context, natural landscapes can reduce students’ stress, restore their attention, and improve their overall mood, translating into better classroom experience and higher subjective ratings. Lower stress and good mood can also explain college students’ higher learning efficiency.
The results of our research are based on multiple measurement methods, including the physiological measurements (EEG and HRV index), psychological measurements (SD and POMS), and word association tasks, and are scientific and reasonable. Second, there are not many studies about college students and window views [46,51], and it is also mentioned in a current study that college dormitory residents who see more natural landscapes from their windows have a greater capacity for direct attention than those who have fewer natural or architectural landscapes [27]. Therefore, the lack of information on the effects of university campus window views on students’ emotional responses and learning efficiency supports the importance of our study.
Our research has limitations that should be addressed in future studies. First, our samples were not necessarily representative as the research placed more importance on healthy college students, and it is still being determined whether the results are also applicable to students from different ages, sexes, and racial groups. Second, to reduce the stress on the participants, each participant viewed the natural window view and the building window view only once in a relatively short period. Hence, the effect of repeated viewings remains to be seen. Moreover, another limitation is that, because of the experimental design used in the real-world setting of this study, which is an open system, it was not possible to control for all the variables. Therefore, students might still be subject to the effects of other variables (e.g., sunlight, sky landscape, and scent). We failed to control the lighting of classrooms sufficiently, where the full spectrum lighting and green space may affect students’ attention function [29]. Hence, we are still unsure whether consistent results can be obtained if the research is conducted during winter courses with insufficient lighting, less dynamic natural landscape, or less colorful conditions. Further, this research focuses on exploring the effects of window views with natural scenery on college students’ emotions and learning efficiency, and further efforts can be made to examine the beneficial effect of actual natural elements within a specific quantity of living plants on students. The question of which vegetation types and species and their order and quantities are best beneficial for college students’ physiological and psychological health can be investigated. Detailed vegetation characteristics, such as shape, crown width, color, texture, height, flower, fruit, and scent, can be explored to determine what combinations of these factors can satisfy students’ diverse needs. Finally, this study may have some limitations in detecting learning efficiency only through word association tasks, and this approach may not fully reflect the complexity and multidimensionality of learning efficiency. Therefore, we will adopt more diverse and in-depth methods to assess learning efficiency in future exploration. At the same time, we will continue exploring the close relationship between brain waves and learning efficiency to provide a more scientific and effective theoretical basis and practical guidance for improving learning efficiency.

5. Conclusions

In this study, we sought to provide scientific evidence for the link between indoor window views on college campuses and students’ emotional responses and learning efficiency and that viewing natural window views had a positive effect on enhancing brain activity and improving mood to increase learning efficiency compared to viewing building window views. When participants viewed the nature window view, the enhancement of theta, alpha, and beta waves indicated a stress reduction, improving mood and attention levels. Secondly, the results of the word association task also indicated that viewing the natural window view was beneficial for enhancing attention and improving learning efficiency. The Psychoemotional Questionnaire further supported that the window view provided a sense of comfort, nature, relaxation, and pleasure. The results of this research provide promising support for the beneficial connection between window views on college campuses and students’ emotional reactions and learning efficiency and help planners and designers take more account of green space and natural wind views of classrooms in campus design.

Author Contributions

Conceptualization, Y.Z. and Y.T. (Yanhong Tang); methodology, Y.Z.; validation, Y.T. (Yanhong Tang) and X.W.; formal analysis, X.W. and Y.T. (Yuanlong Tan); investigation, Y.Z.; resources, Y.T. (Yuanlong Tan); data curation, Y.Z. and Y.T. (Yanhong Tang); writing—original draft preparation, Y.Z.; writing—review and editing, Y.Z.; supervision, X.W. All authors have read and agreed to the published version of the manuscript.

Funding

This research received no external funding.

Data Availability Statement

The data that support the findings of this study are available upon reasonable request from the authors.

Conflicts of Interest

The authors declare no conflicts of interest.

References

  1. Yang, H.; Wen, J.; Lu, Y.; Peng, Q. A Quasi-Experimental Study on the Impact of Park Accessibility on the Mental Health of Undergraduate Students. Urban For. Urban Green. 2023, 86, 127979. [Google Scholar] [CrossRef]
  2. Ferrari, A.J.; Charlson, F.J.; Norman, R.E.; Patten, S.B.; Freedman, G.; Murray, C.J.L.; Vos, T.; Whiteford, H.A. Burden of Depressive Disorders by Country, Sex, Age, and Year: Findings from the Global Burden of Disease Study 2010. PLoS Med. 2013, 10, e1001547. [Google Scholar] [CrossRef] [PubMed]
  3. Hartig, T.; Mitchell, R.; De Vries, S.; Frumkin, H. Nature and Health. Annu. Rev. Public Health 2014, 35, 207–228. [Google Scholar] [CrossRef] [PubMed]
  4. Dzhambov, A.M.; Dimitrova, D.D. Elderly Visitors of an Urban Park, Health Anxiety and Individual Awareness of Nature Experiences. Urban For. Urban Green. 2014, 13, 806–813. [Google Scholar] [CrossRef]
  5. Putra, I.G.N.E.; Astell-Burt, T.; Cliff, D.P.; Vella, S.A.; Feng, X. Do Physical Activity, Social Interaction, and Mental Health Mediate the Association between Green Space Quality and Child Prosocial Behaviour? Urban For. Urban Green. 2021, 64, 127264. [Google Scholar] [CrossRef]
  6. Helbich, M.; Yao, Y.; Liu, Y.; Zhang, J.; Liu, P.; Wang, R. Using Deep Learning to Examine Street View Green and Blue Spaces and Their Associations with Geriatric Depression in Beijing, China. Environ. Int. 2019, 126, 107–117. [Google Scholar] [CrossRef] [PubMed]
  7. Ibrahim, A.K.; Kelly, S.J.; Adams, C.E.; Glazebrook, C. A Systematic Review of Studies of Depression Prevalence in University Students. J. Psychiatr. Res. 2013, 47, 391–400. [Google Scholar] [CrossRef] [PubMed]
  8. Auerbach, R.P.; Mortier, P.; Bruffaerts, R.; Alonso, J.; Benjet, C.; Cuijpers, P.; Demyttenaere, K.; Ebert, D.D.; Green, J.G.; Hasking, P.; et al. WHO World Mental Health Surveys International College Student Project: Prevalence and Distribution of Mental Disorders. J. Abnorm. Psychol. 2018, 127, 623–638. [Google Scholar] [CrossRef] [PubMed]
  9. Ramachandiran, M.; Dhanapal, S. Academic Stress Among University Students: A Quantitative Study of Generation Y and Z’s Perception. Pertanika J. Soc. Sci. Humanit. 2018, 26, 2115–2128. [Google Scholar]
  10. Pedersen, D.E.; Jodin, V. Stressors Associated with the School Spillover of College Undergraduates. Soc. Soc. Sci. J. 2016, 53, 40–48. [Google Scholar] [CrossRef]
  11. Hetolang, L.T.; Amone-P’Olak, K. The Associations between Stressful Life Events and Depression among Students in a University in Botswana. S. J. Psychol. 2018, 48, 255–267. [Google Scholar] [CrossRef]
  12. Adams, D.R.; Meyers, S.A.; Beidas, R.S. The Relationship between Financial Strain, Perceived Stress, Psychological Symptoms, and Academic and Social Integration in Undergraduate Students. J. Am. Coll. Health 2016, 64, 362–370. [Google Scholar] [CrossRef] [PubMed]
  13. Pascoe, M.C.; Hetrick, S.E.; Parker, A.G. The Impact of Stress on Students in Secondary School and Higher Education. Int. J. Adolesc. Youth 2020, 25, 104–112. [Google Scholar] [CrossRef]
  14. Zhang, J.; Jin, J.; Liang, Y. The Impact of Green Space on University Students’ Mental Health: The Mediating Roles of Solitude Competence and Perceptual Restoration. Sustainability 2024, 16, 707. [Google Scholar] [CrossRef]
  15. Hipp, J.A.; Gulwadi, G.B.; Alves, S.; Sequeira, S. The Relationship Between Perceived Greenness and Perceived Restorativeness of University Campuses and Student-Reported Quality of Life. Environ. Behav. 2016, 48, 1292–1308. [Google Scholar] [CrossRef]
  16. Kaplan, S. The Restorative Benefits of Nature: Toward an Integrative Framework. J. Environ. Psychol. 1995, 15, 169–182. [Google Scholar] [CrossRef]
  17. Jennings, V.; Bamkole, O. The Relationship between Social Cohesion and Urban Green Space: An Avenue for Health Promotion. Int. J. Environ. Res. Public Health 2019, 16, 452. [Google Scholar] [CrossRef] [PubMed]
  18. Lee, A.; Jordan, H.; Horsley, J. Value of Urban Green Spaces in Promoting Healthy Living and Wellbeing: Prospects for Planning. Risk Manag. Healthc. Policy 2015, 131, 131–137. [Google Scholar] [CrossRef] [PubMed]
  19. Shao, Y.; Elsadek, M.; Liu, B. Horticultural Activity: Its Contribution to Stress Recovery and Wellbeing for Children. Int. J. Environ. Res. Public Health 2020, 17, 1229. [Google Scholar] [CrossRef]
  20. Elsadek, M.; Liu, B.; Lian, Z.; Xie, J. The Influence of Urban Roadside Trees and Their Physical Environment on Stress Relief Measures: A Field Experiment in Shanghai. Urban For. Urban Green. 2019, 42, 51–60. [Google Scholar] [CrossRef]
  21. Swierad, E.M.; Huang, T.T.K. An Exploration of Psychosocial Pathways of Parks’ Effects on Health: A Qualitative Study. Int. J. Environ. Res. Public Health 2018, 15, 1693. [Google Scholar] [CrossRef] [PubMed]
  22. Seitz, C.M.; Reese, R.F.; Strack, R.W.; Frantz, S.; West, B. Identifying and Improving Green Spaces on a College Campus: A Photovoice Study. Ecopsychology 2014, 6, 98–108. [Google Scholar] [CrossRef]
  23. Ulrich, R.S.; Simons, R.F.; Losito, B.D.; Fiorito, E.; Miles, M.A.; Zelson, M. Stress Recovery during Exposure to Natural and Urban Environments. J. Environ. Psychol. 1991, 11, 201–230. [Google Scholar] [CrossRef]
  24. Stone, N.J.; Irvine, J.M. Direct or Indirect Window Access, Task Type, and Performance. J. Environ. Psychol. 1994, 14, 57–63. [Google Scholar] [CrossRef]
  25. Ulrich, R.S. View through a Window May Influence Recovery from Surgery. Sci. New Ser. 1984, 224, 420–421. [Google Scholar] [CrossRef]
  26. Gilchrist, K.; Brown, C.; Montarzino, A. Workplace Settings and Wellbeing: Greenspace Use and Views Contribute to Employee Wellbeing at Peri-Urban Business Sites. Landsc. Urban Plan. 2015, 138, 32–40. [Google Scholar] [CrossRef]
  27. Tennessen, C.M.; Cimprich, B. Views to Nature: Effects on Attention. J. Environ. Psychol. 1995, 15, 77–85. [Google Scholar] [CrossRef]
  28. Lindemann-Matthies, P.; Benkowitz, D.; Hellinger, F. Associations between the Naturalness of Window and Interior Classroom Views, Subjective Well-Being of Primary School Children and Their Performance in an Attention and Concentration Test. Landsc. Urban Plan. 2021, 214, 104146. [Google Scholar] [CrossRef]
  29. Li, D.; Sullivan, W.C. Impact of Views to School Landscapes on Recovery from Stress and Mental Fatigue. Landsc. Urban Plan. 2016, 148, 149–158. [Google Scholar] [CrossRef]
  30. Matsuoka, R.H. Student Performance and High School Landscapes: Examining the Links. Landsc. Urban Plan. 2010, 97, 273–282. [Google Scholar] [CrossRef]
  31. Yang, Z.; Becerik-Gerber, B.; Mino, L. A Study on Student Perceptions of Higher Education Classrooms: Impact of Classroom Attributes on Student Satisfaction and Performance. Build. Environ. 2013, 70, 171–188. [Google Scholar] [CrossRef]
  32. Fisher, K.R. The Impact of School Infrastructure on Student Outcomes and Behaviour; Australian Department of Education, Science and Training: Canberra, Australia, 2007. [Google Scholar]
  33. Annesi-Maesano, I.; Baiz, N.; Banerjee, S.; Rudnai, P.; Rive, S. The Sinphonie Group Indoor Air Quality and Sources in Schools and Related Health Effects. J. Toxicol. Environ. Health Part B 2013, 16, 491–550. [Google Scholar] [CrossRef] [PubMed]
  34. Haverinen-Shaughnessy, U.; Shaughnessy, R.J.; Cole, E.C.; Toyinbo, O.; Moschandreas, D.J. An Assessment of Indoor Environmental Quality in Schools and Its Association with Health and Performance. Build. Environ. 2015, 93, 35–40. [Google Scholar] [CrossRef]
  35. Turunen, M.; Toyinbo, O.; Putus, T.; Nevalainen, A.; Shaughnessy, R.; Haverinen-Shaughnessy, U. Indoor Environmental Quality in School Buildings, and the Health and Wellbeing of Students. Int. J. Hyg. Environ. Health 2014, 217, 733–739. [Google Scholar] [CrossRef] [PubMed]
  36. Simons, E.; Hwang, S.-A.; Fitzgerald, E.F.; Kielb, C.; Lin, S. The Impact of School Building Conditions on Student Absenteeism in Upstate New York. Am. J. Public Health 2010, 100, 1679–1686. [Google Scholar] [CrossRef] [PubMed]
  37. Sleegers, P.; Moolenaar, N.; Galetzka, M.; Pruyn, A.; Sarroukh, B.; Van Der Zande, B. Lighting Affects Students’ Concentration Positively: Findings from Three Dutch Studies. Light. Res. Technol. 2013, 45, 159–175. [Google Scholar] [CrossRef]
  38. Downs, D.W.; Crum, M.A. Processing Demands during Auditory Learning under Degraded Listening Conditions. J. Speech Hear. Res. 1978, 21, 702–714. [Google Scholar] [CrossRef]
  39. Juan, Y.-K.; Chen, Y. The Influence of Indoor Environmental Factors on Learning: An Experiment Combining Physiological and Psychological Measurements. Build. Environ. 2022, 221, 109299. [Google Scholar] [CrossRef]
  40. Coley, D.A.; Greeves, R.; Saxby, B.K. The Effect of Low Ventilation Rates on the Cognitive Function of a Primary School Class. Int. J. Vent. 2007, 6, 107–112. [Google Scholar] [CrossRef]
  41. Wang, C.; Zhang, F.; Wang, J.; Doyle, J.K.; Hancock, P.A.; Mak, C.M.; Liu, S. How Indoor Environmental Quality Affects Occupants’ Cognitive Functions: A Systematic Review. Build. Environ. 2021, 193, 107647. [Google Scholar] [CrossRef]
  42. Kweon, B.-S.; Ellis, C.D.; Lee, J.; Jacobs, K. The Link between School Environments and Student Academic Performance. Urban For. Urban Green. 2017, 23, 35–43. [Google Scholar] [CrossRef]
  43. Chen, C. Impact of Nature Window View On High School Students Stress Recovery. Ph.D. Thesis, University of Illinois at Urbana-Champaign, Champaign, IL, USA, 2015. [Google Scholar]
  44. Amanvermez, Y.; Karyotaki, E.; Cuijpers, P.; Ciharova, M.; Bruffaerts, R.; Kessler, R.C.; Klein, A.M.; Wiers, R.W.; De Wit, L.M. Sources of Stress among Domestic and International Students: A Cross-Sectional Study of University Students in Amsterdam, The Netherlands. Anxiety Stress Coping 2023, 1–18. [Google Scholar] [CrossRef]
  45. Elsadek, M.; Liu, B.; Xie, J. Window View and Relaxation: Viewing Green Space from a High-Rise Estate Improves Urban Dwellers’ Wellbeing. Urban For. Urban Green. 2020, 55, 126846. [Google Scholar] [CrossRef]
  46. Benfield, J.A.; Rainbolt, G.N.; Bell, P.A.; Donovan, G.H. Classrooms with Nature Views: Evidence of Differing Student Perceptions and Behaviors. Environ. Behav. 2015, 47, 140–157. [Google Scholar] [CrossRef]
  47. Filges, T.; Sonne-Schmidt, C.S.; Nielsen, B.C.V. Small Class Sizes for Improving Student Achievement in Primary and Secondary Schools: A Systematic Review. Campbell Syst. Rev. 2018, 14, 1–107. [Google Scholar] [CrossRef] [PubMed]
  48. Falch, T.; Sandsør, A.M.J.; Strøm, B. Do Smaller Classes Always Improve Students’ Long-run Outcomes? Oxf. Bull. Econ. Stat. 2017, 79, 654–688. [Google Scholar] [CrossRef]
  49. Phillips, D.E. The Elective System in American Education. Pedagog. Semin. 1901, 8, 206–230. [Google Scholar] [CrossRef]
  50. Parameswaran, A.; Venetis, P.; Garcia-Molina, H. Recommendation Systems with Complex Constraints: A Course Recommendation Perspective. ACM Trans. Inf. Syst. 2011, 29, 1–33. [Google Scholar] [CrossRef]
  51. Holden, L.J.; Mercer, T. Nature in the Learning Environment: Exploring the Relationship between Nature, Memory, and Mood. Ecopsychology 2014, 6, 234–240. [Google Scholar] [CrossRef]
  52. Studente, S.; Seppala, N.; Sadowska, N. Facilitating Creative Thinking in the Classroom: Investigating the Effects of Plants and the Colour Green on Visual and Verbal Creativity. Think. Ski. Creat. 2016, 19, 1–8. [Google Scholar] [CrossRef]
  53. Lieberman, M.D. Social Cognitive Neuroscience: A Review of Core Processes. Annu. Rev. Psychol. 2007, 58, 259–289. [Google Scholar] [CrossRef] [PubMed]
  54. Falk, E.B.; Berkman, E.T.; Mann, T.; Harrison, B.; Lieberman, M.D. Predicting Persuasion-Induced Behavior Change from the Brain. J. Neurosci. 2010, 30, 8421–8424. [Google Scholar] [CrossRef]
  55. Fortunato, V.C.R.; Giraldi, J.D.M.E.; De Oliveira, J.H.C. A Review of Studies on Neuromarketing: Practical Results, Techniques, Contributions and Limitations. JMR 2014, 6, 201. [Google Scholar] [CrossRef]
  56. Piwowarski, M.; Gadomska-Lila, K.; Nermend, K. Cognitive Neuroscience Methods in Enhancing Health Literacy. Int. J. Environ. Res. Public Health 2021, 18, 5331. [Google Scholar] [CrossRef] [PubMed]
  57. Schafer, E.W.P. Brain Responses While Viewing Television Reflect Program Interest. Int. J. Neurosci. 1978, 8, 71–77. [Google Scholar] [CrossRef]
  58. Olszewska-Guizzo, A.; Escoffier, N.; Chan, J.; Puay Yok, T. Window View and the Brain: Effects of Floor Level and Green Cover on the Alpha and Beta Rhythms in a Passive Exposure EEG Experiment. Int. J. Environ. Res. Public Health 2018, 15, 2358. [Google Scholar] [CrossRef] [PubMed]
  59. Beyer, K.M.M.; Kaltenbach, A.; Szabo, A.; Bogar, S.; Nieto, F.J.; Malecki, K.M. Exposure to Neighborhood Green Space and Mental Health: Evidence from the Survey of the Health of Wisconsin. Int. J. Environ. Res. Public. Health 2014, 11, 3453–3472. [Google Scholar] [CrossRef] [PubMed]
  60. Elsadek, M.; Liu, B. Effects of Viewing Flowering Plants on Employees’ Wellbeing in an Office-like Environment. Indoor Built Environ. 2021, 30, 1429–1440. [Google Scholar] [CrossRef]
  61. Deng, L.; Li, X.; Luo, H.; Fu, E.-K.; Ma, J.; Sun, L.-X.; Huang, Z.; Cai, S.-Z.; Jia, Y. Empirical Study of Landscape Types, Landscape Elements and Landscape Components of the Urban Park Promoting Physiological and Psychological Restoration. Urban For. Urban Green. 2020, 48, 126488. [Google Scholar] [CrossRef]
  62. Jang, H.S.; Kim, J.; Kim, K.S.; Pak, C.H. Human Brain Activity and Emotional Responses to Plant Color Stimuli. Color Res. Appl. 2014, 39, 307–316. [Google Scholar] [CrossRef]
  63. Ding, N.; Zhong, Y.; Li, J.; Xiao, Q.; Zhang, S.; Xia, H. Visual Preference of Plant Features in Different Living Environments Using Eye Tracking and EEG. PLoS ONE 2022, 17, e0279596. [Google Scholar] [CrossRef] [PubMed]
  64. Sezer, A.; Inel, Y.; Seçkin, A.Ç.; Uluçinar, U. The Relationship between Attention Levels and Class Participation of First-Year Students in Classroom Teaching Departments. Int. J. Instr. 2017, 10, 55–68. [Google Scholar] [CrossRef]
  65. Elsadek, M.; Liu, B.; Lian, Z. Green Façades: Their Contribution to Stress Recovery and Well-Being in High-Density Cities. Urban For. Urban Green. 2019, 46, 126446. [Google Scholar] [CrossRef]
  66. Shibata, S.; Suzuki, N. Effects of an Indoor Plant on Creative Task Performance and Mood. Scand. J. Psychol. 2004, 45, 373–381. [Google Scholar] [CrossRef] [PubMed]
  67. Shibata, S.; Suzuki, N. Effects of the foliage plant on task performance and mood. J. Environ. Psychol. 2002, 22, 265–272. [Google Scholar] [CrossRef]
  68. Williams, K.J.H.; Cary, J. Landscape Preferences, Ecological Quality, and Biodiversity Protection. Environ. Behav. 2002, 34, 257–274. [Google Scholar] [CrossRef]
  69. Schacter, D.L. EEG Theta Waves and Psychological Phenomena: A Review and Analysis. Biol. Psychol. 1977, 5, 47–82. [Google Scholar] [CrossRef] [PubMed]
  70. Lee, B.-G.; Lee, B.-L.; Chung, W.-Y. Mobile Healthcare for Automatic Driving Sleep-Onset Detection Using Wavelet-Based EEG and Respiration Signals. Sensors 2014, 14, 17915–17936. [Google Scholar] [CrossRef]
  71. Han, K.-T. Influence of Limitedly Visible Leafy Indoor Plants on the Psychology, Behavior, and Health of Students at a Junior High School in Taiwan. Environ. Behav. 2009, 41, 658–692. [Google Scholar] [CrossRef]
  72. Park, S.-H.; Mattson, R.H. Effects of Flowering and Foliage Plants in Hospital Rooms on Patients Recovering from Abdominal Surgery. Hortte 2008, 18, 563–568. [Google Scholar] [CrossRef]
Figure 1. (a) Classroom with building window views on the 5th floor of the school building in Area B; (b) classroom with natural window views on the 2nd floor of the school building in Area B.
Buildings 14 01557 g001
Figure 2. Experiment process.
Buildings 14 01557 g002
Figure 3. Overall mean of theta waves while viewing natural window views and building window views. n = 30, mean ± standard deviation. *** p < 0.001, paired Wilcoxon signed rank test.
Buildings 14 01557 g003
Figure 4. (a) Overall mean of alpha1 wave while viewing natural window view and building window view. n = 30, mean ± standard deviation. *** p < 0.001, paired Wilcoxon signed rank test; (b) alpha2 wave overall mean while viewing natural window views and building window views. n = 30, mean ± standard deviation. *** p < 0.001, paired Wilcoxon signed rank test.
Buildings 14 01557 g004
Figure 5. (a) beta1 wave overall mean while viewing natural window view and building window view. n = 30, mean ± standard deviation. *** p < 0.001, paired Wilcoxon signed rank test; (b) beta2 wave overall mean while viewing natural window views and building window views. n = 30, mean ± standard deviation. ** p < 0.01, paired Wilcoxon signed rank test.
Buildings 14 01557 g005
Figure 6. Mean values of participants’ attention levels while viewing the natural window view and the building window view. n = 30, mean ± standard deviation. *** p < 0.001, paired Wilcoxon signed rank test.
Buildings 14 01557 g006
Figure 7. Overall mean HRV index while viewing natural window views and building window views. n = 30, mean ± standard deviation. No significant change, paired Wilcoxon signed rank test.
Buildings 14 01557 g007
Figure 8. Comparison of subjective feelings after viewing natural window views and building window views according to the semantic differential approach. n = 30, data are expressed as mean ± standard deviation. *** p < 0.001, determined using Wilcoxon signed rank test.
Buildings 14 01557 g008
Figure 9. (a) POMS subscales: tension-anxiety (T-A), depression (D), anger-hostility (A-H), fatigue (H), confusion (C), and vitality (V); (b) total mood disorder (TMD) score. n = 30, data are presented as mean value ± standard deviation. *** p < 0.001, determined by Wilcoxon signed-rank test.
Buildings 14 01557 g009
Figure 10. Mean scores on the word association task after viewing the natural and building window views. n = 30, mean ± standard deviation. ** p < 0.01, paired t-test.
Buildings 14 01557 g010
Table 1. Strength of internal consistency.
ScalesCronbach’s α
SD (Natural window view)0.91
SD (Building window view)0.88
POMS (Natural window view)0.77
POMS (Building window view)0.90
Disclaimer/Publisher’s Note: The statements, opinions and data contained in all publications are solely those of the individual author(s) and contributor(s) and not of MDPI and/or the editor(s). MDPI and/or the editor(s) disclaim responsibility for any injury to people or property resulting from any ideas, methods, instructions or products referred to in the content.

