
Response Comparisons of Prefabricated and Cast-in-Place Subway Station Structures in Liquefiable Soil Foundation with the Ground Surface Slight Inclined


Abstract
1. Introduction
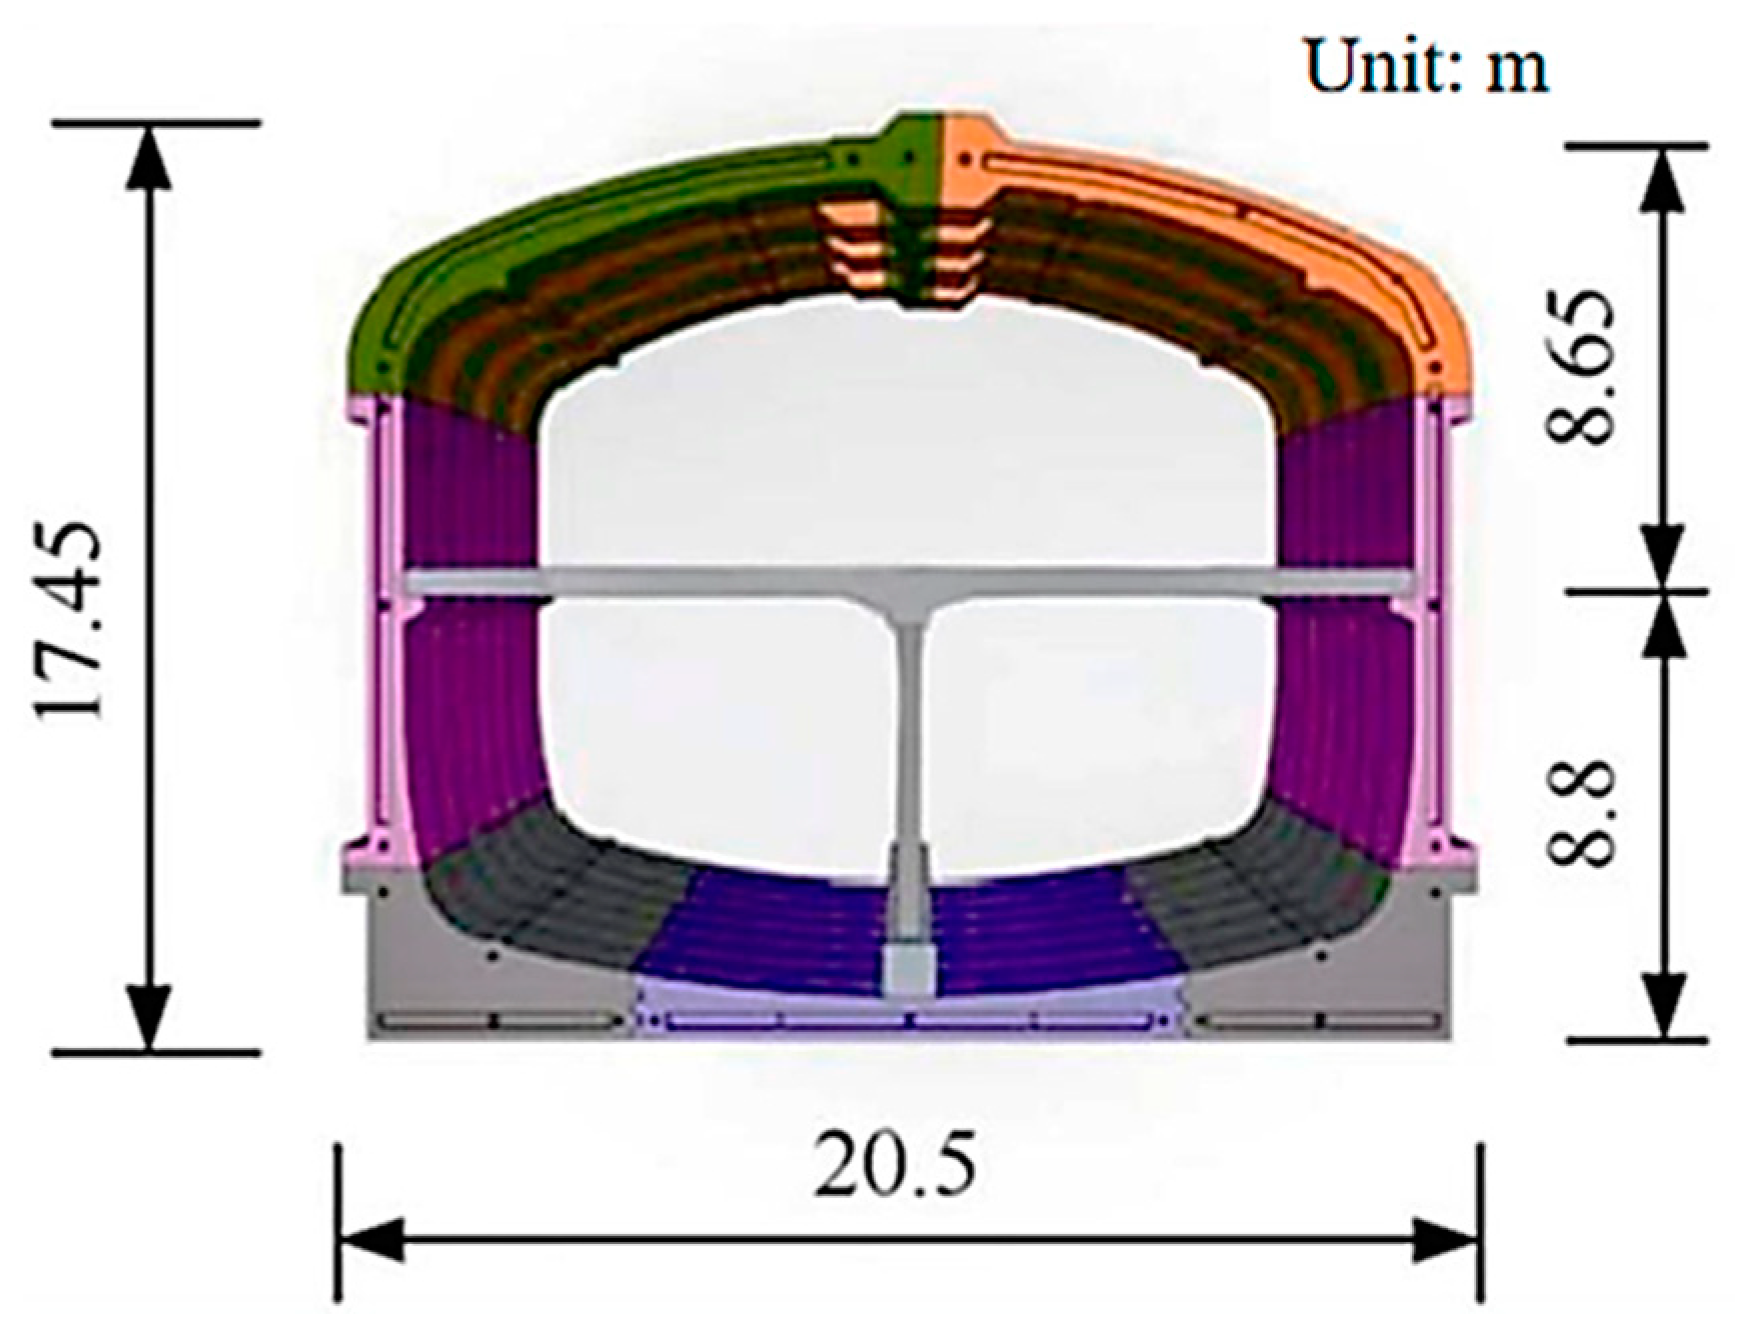
2. Project Overview
3. Numerical Analysis Modeling
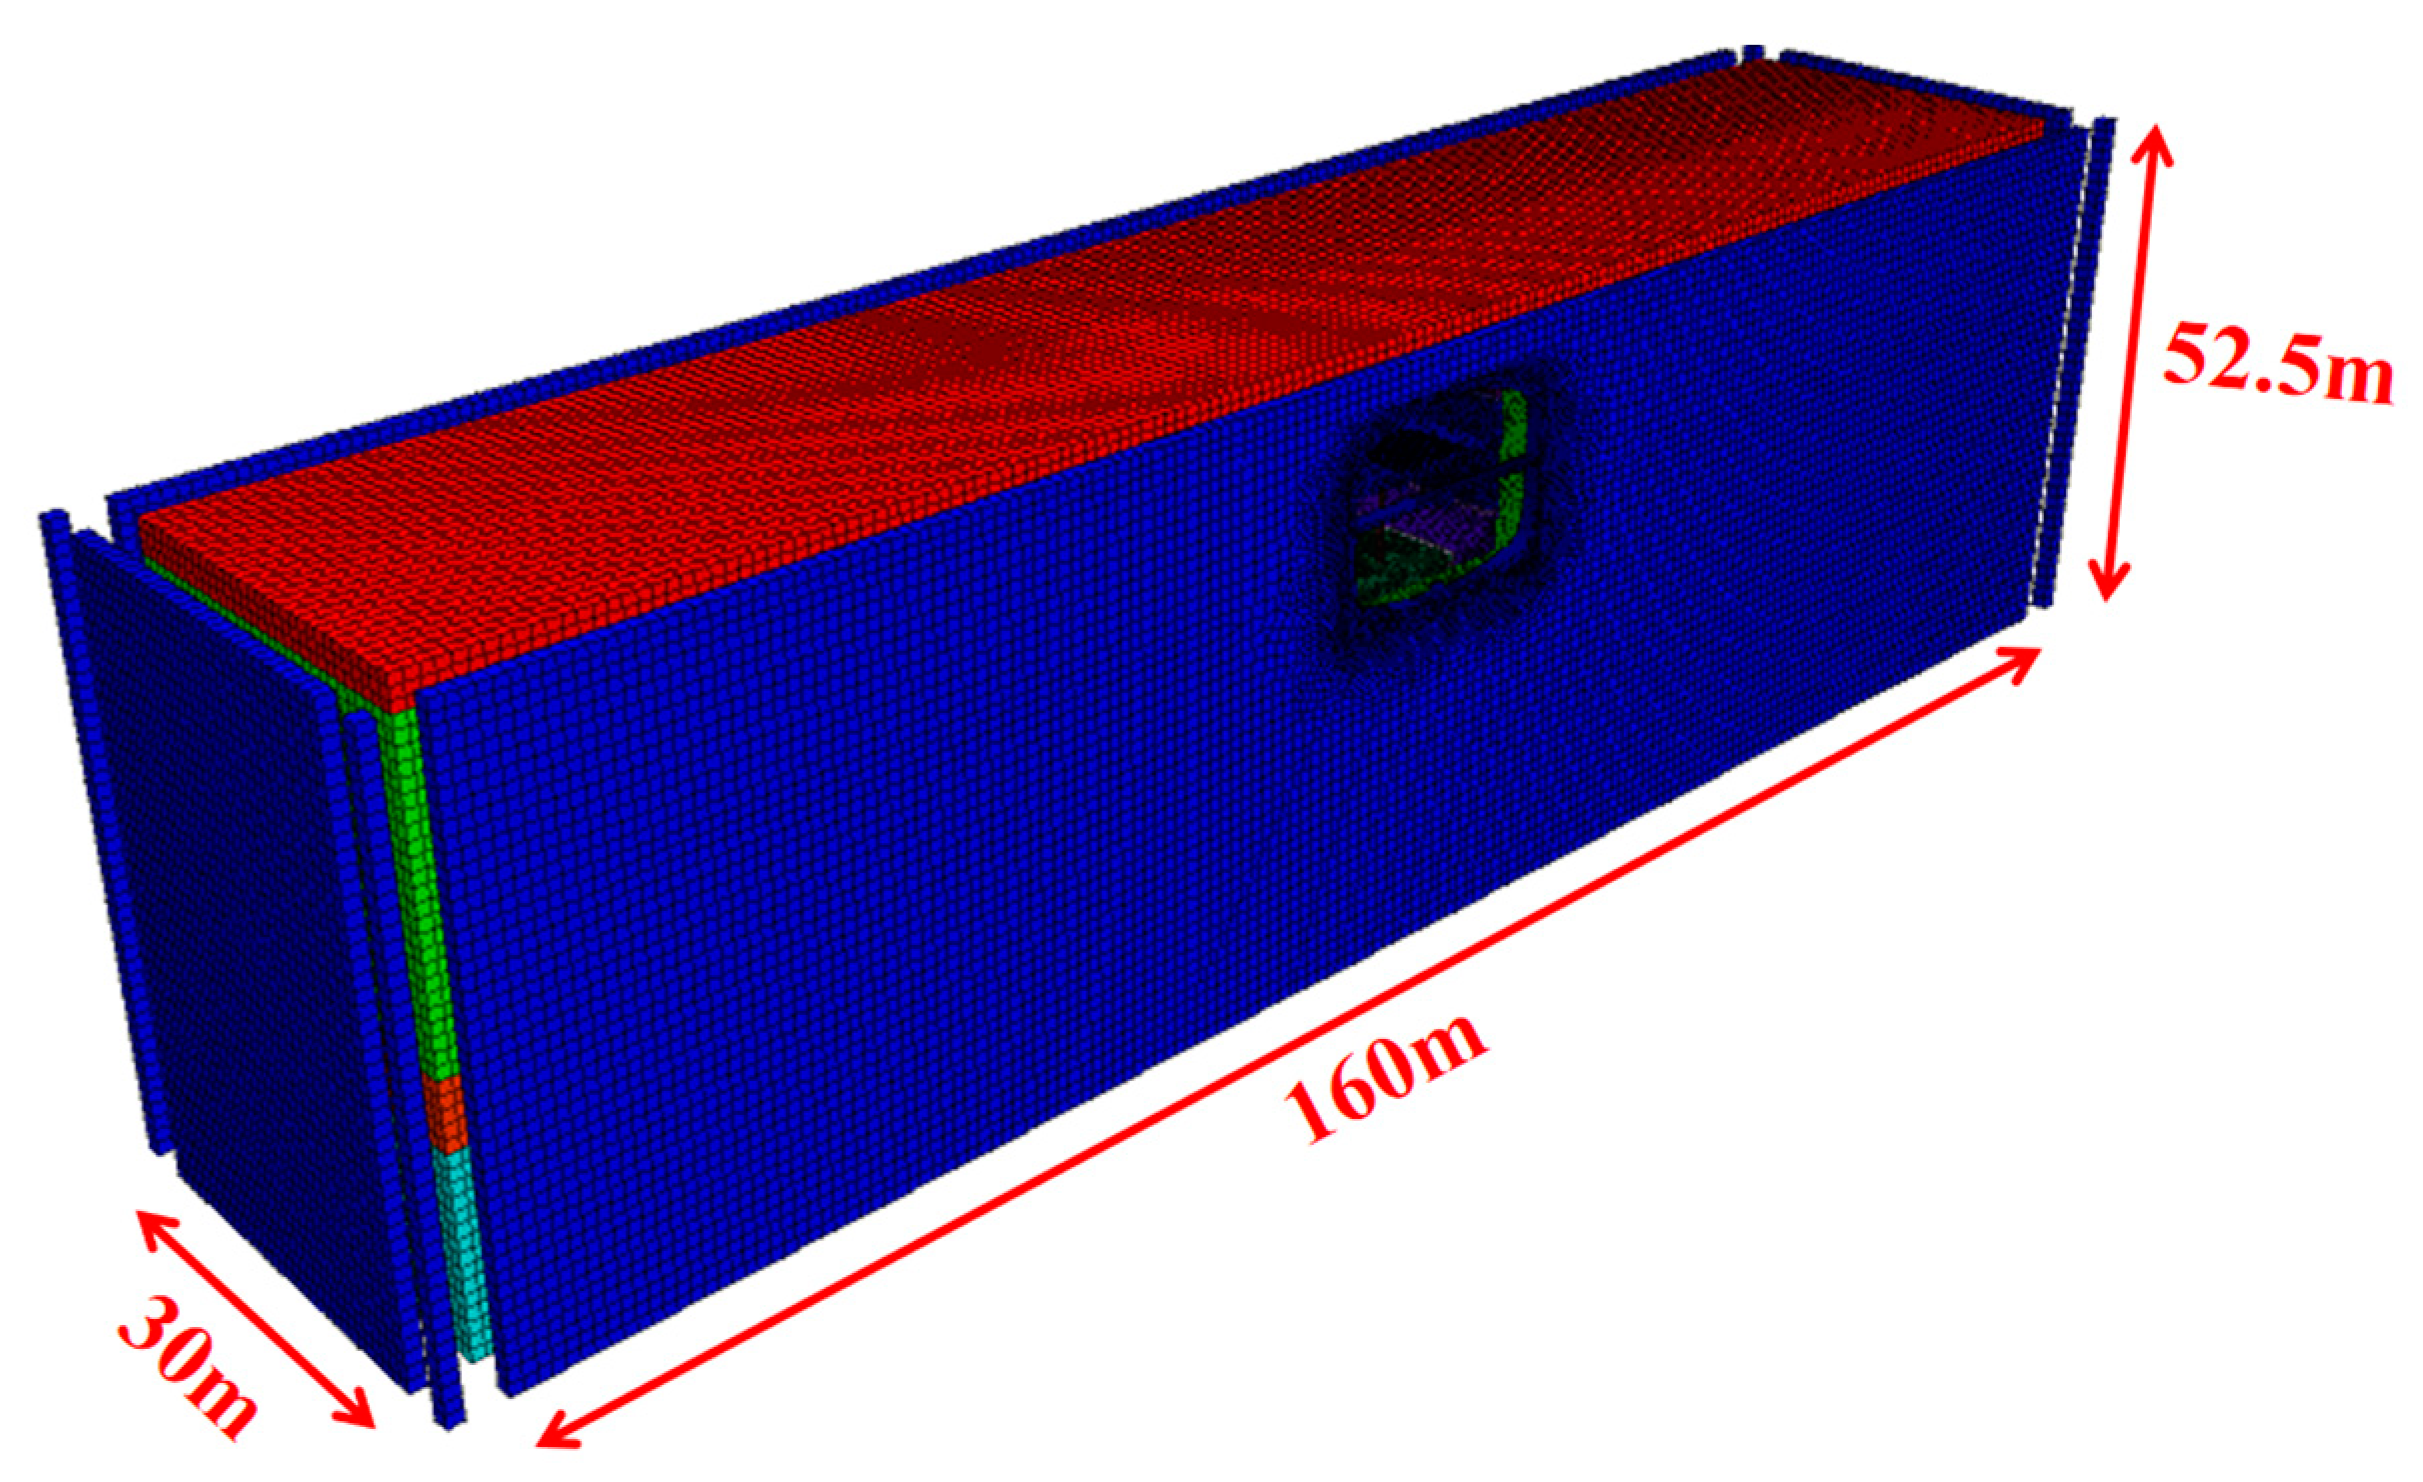
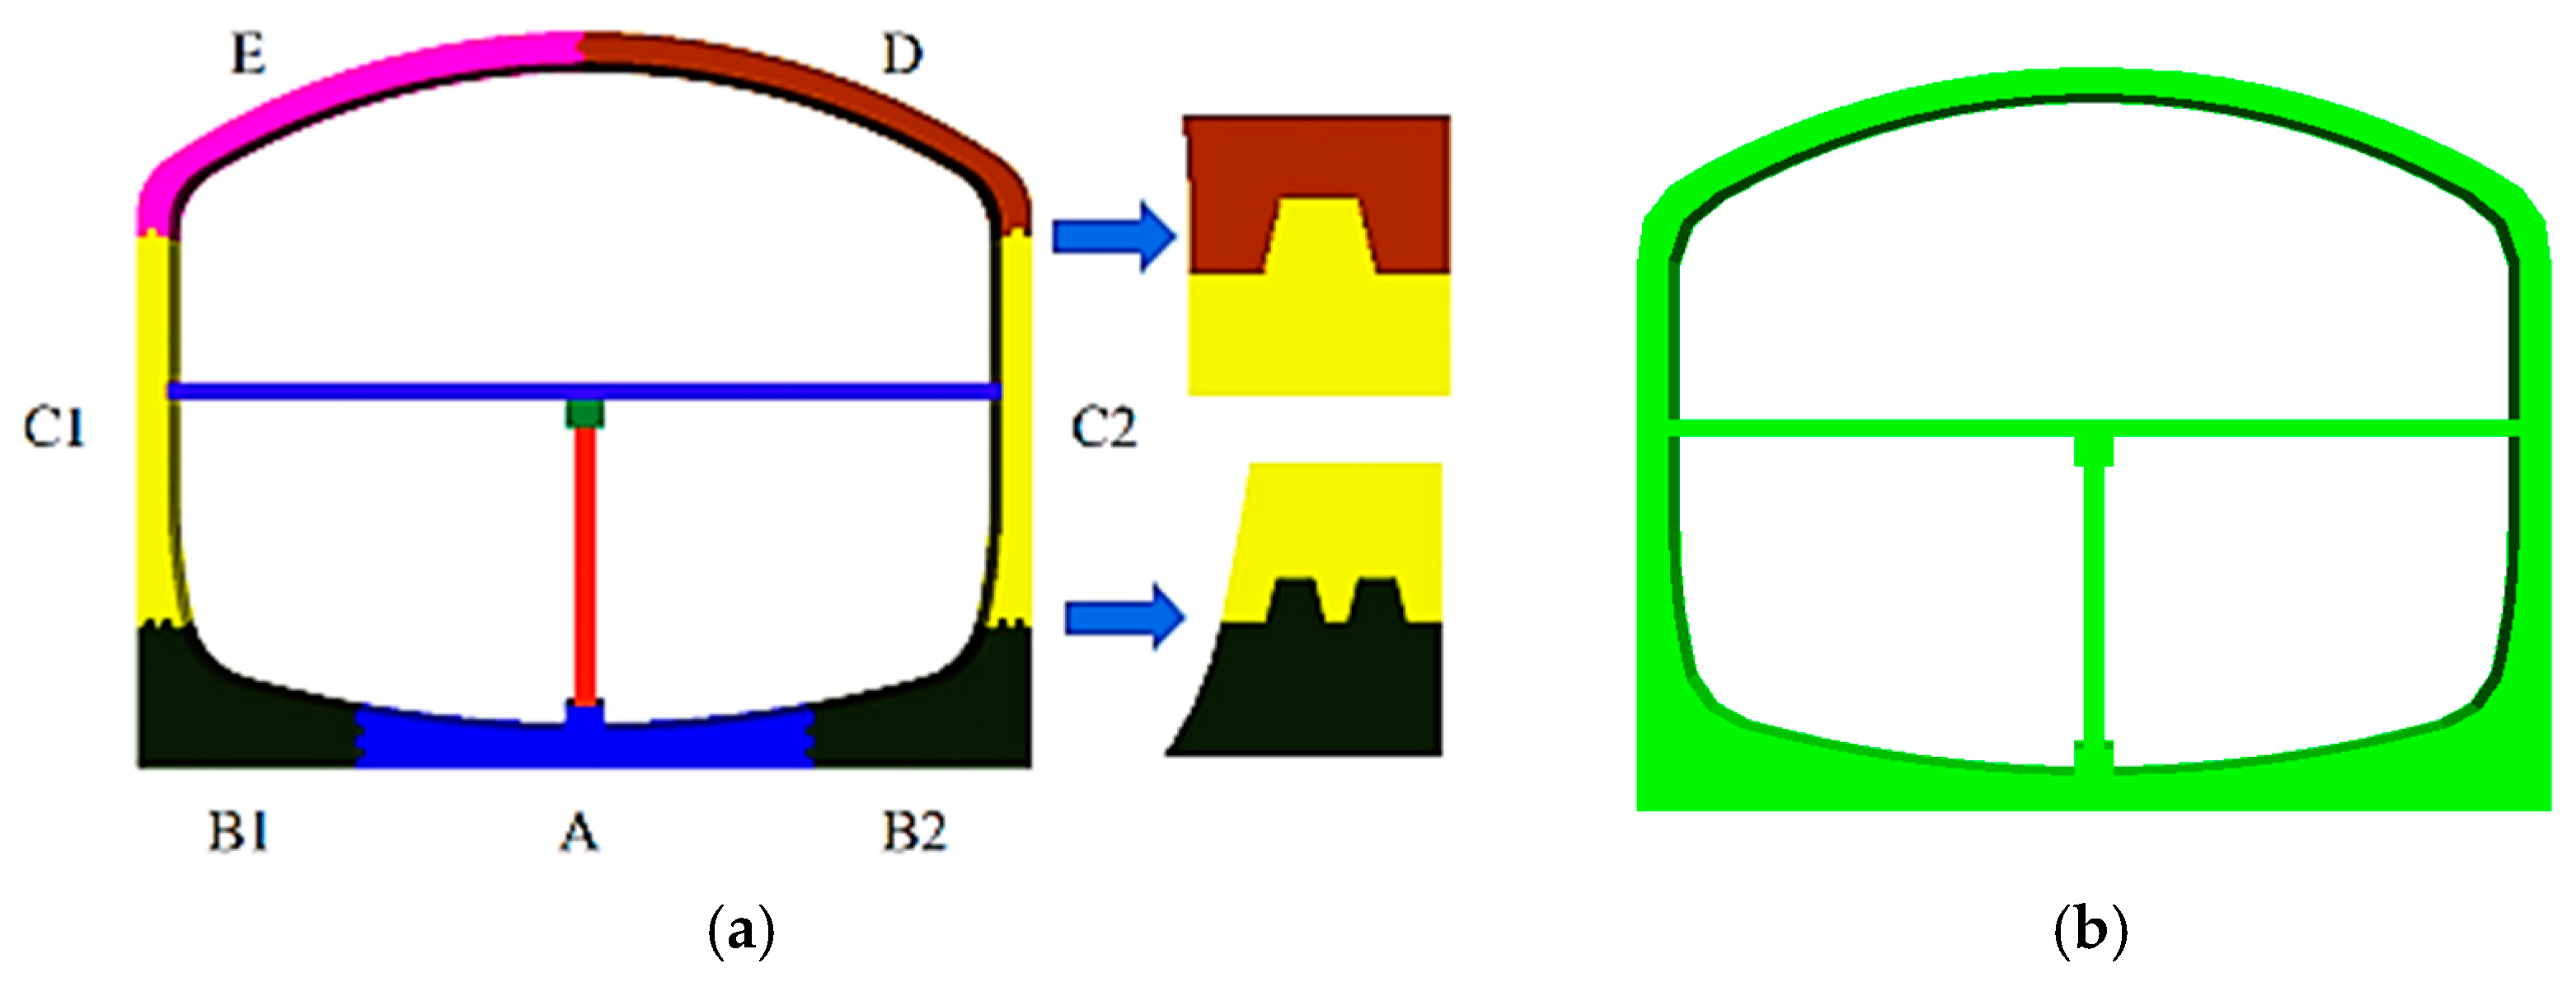
3.1. Numerical Models
3.2. Site Conditions and Parameter Selection
3.3. Contact Surface Setting
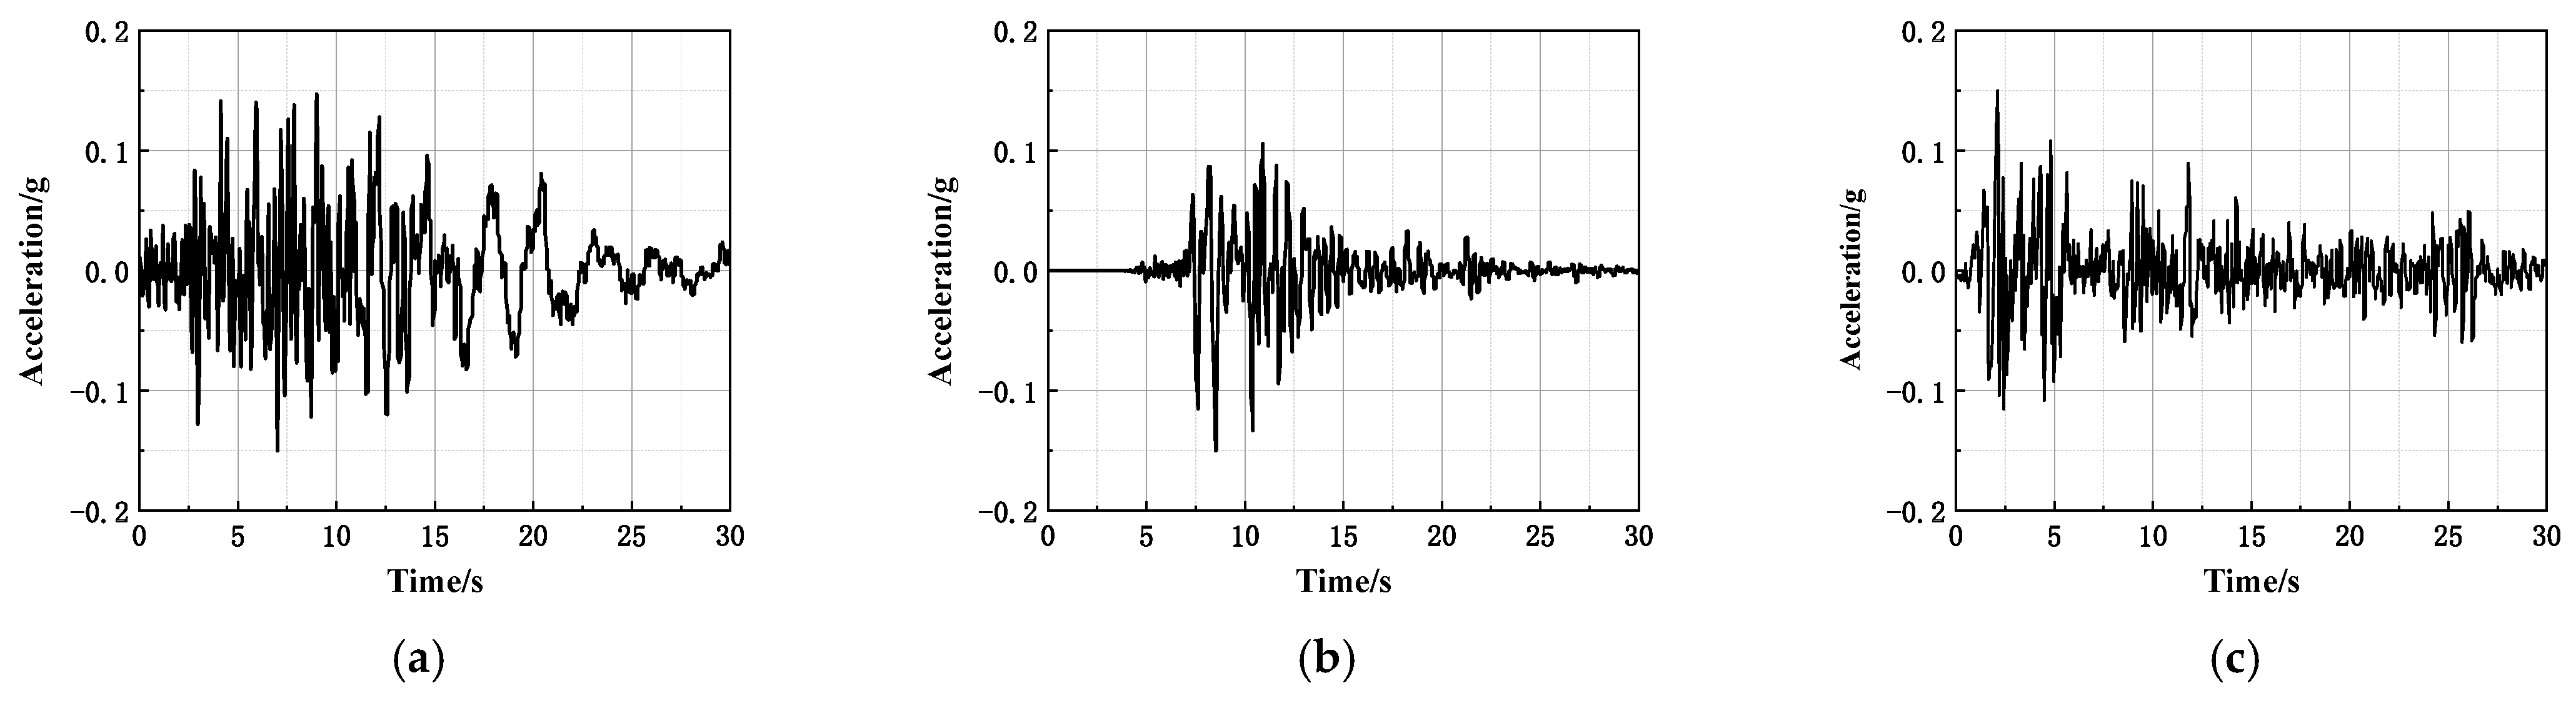
3.4. Input Ground Shaking
4. Stratigraphic Seismic Response Analysis
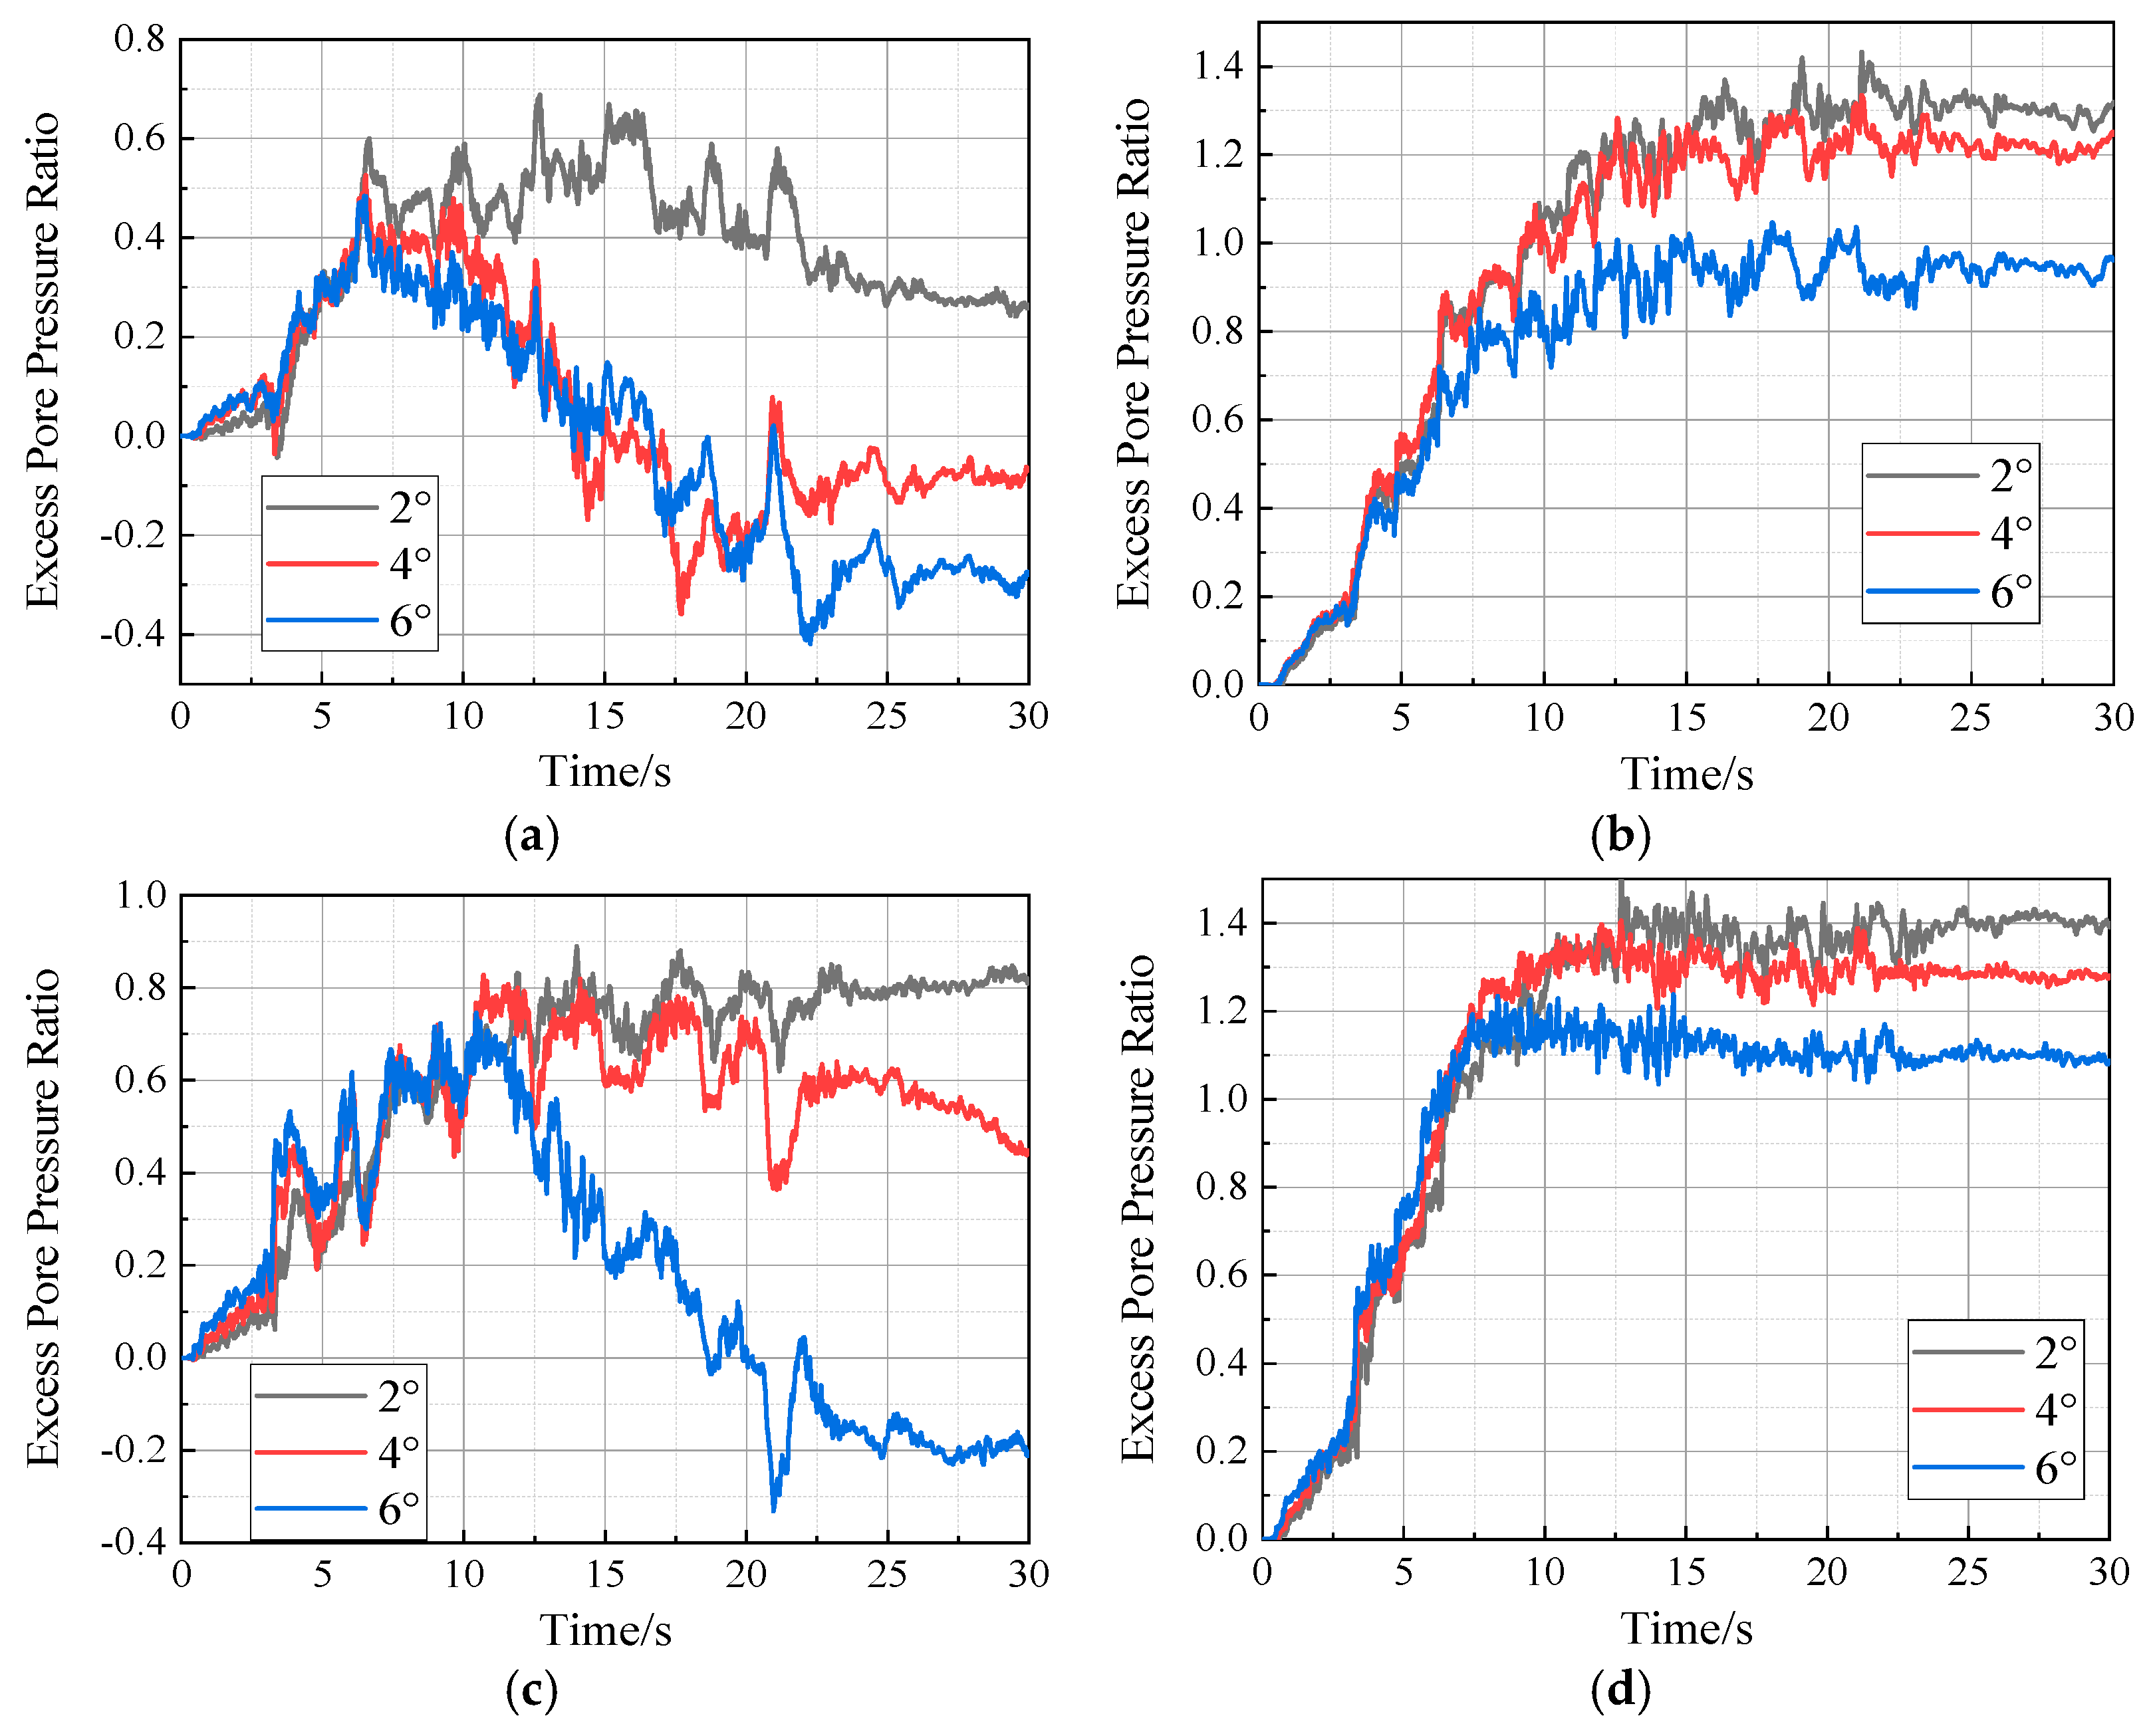
4.1. Pore Water Pressure Analysis
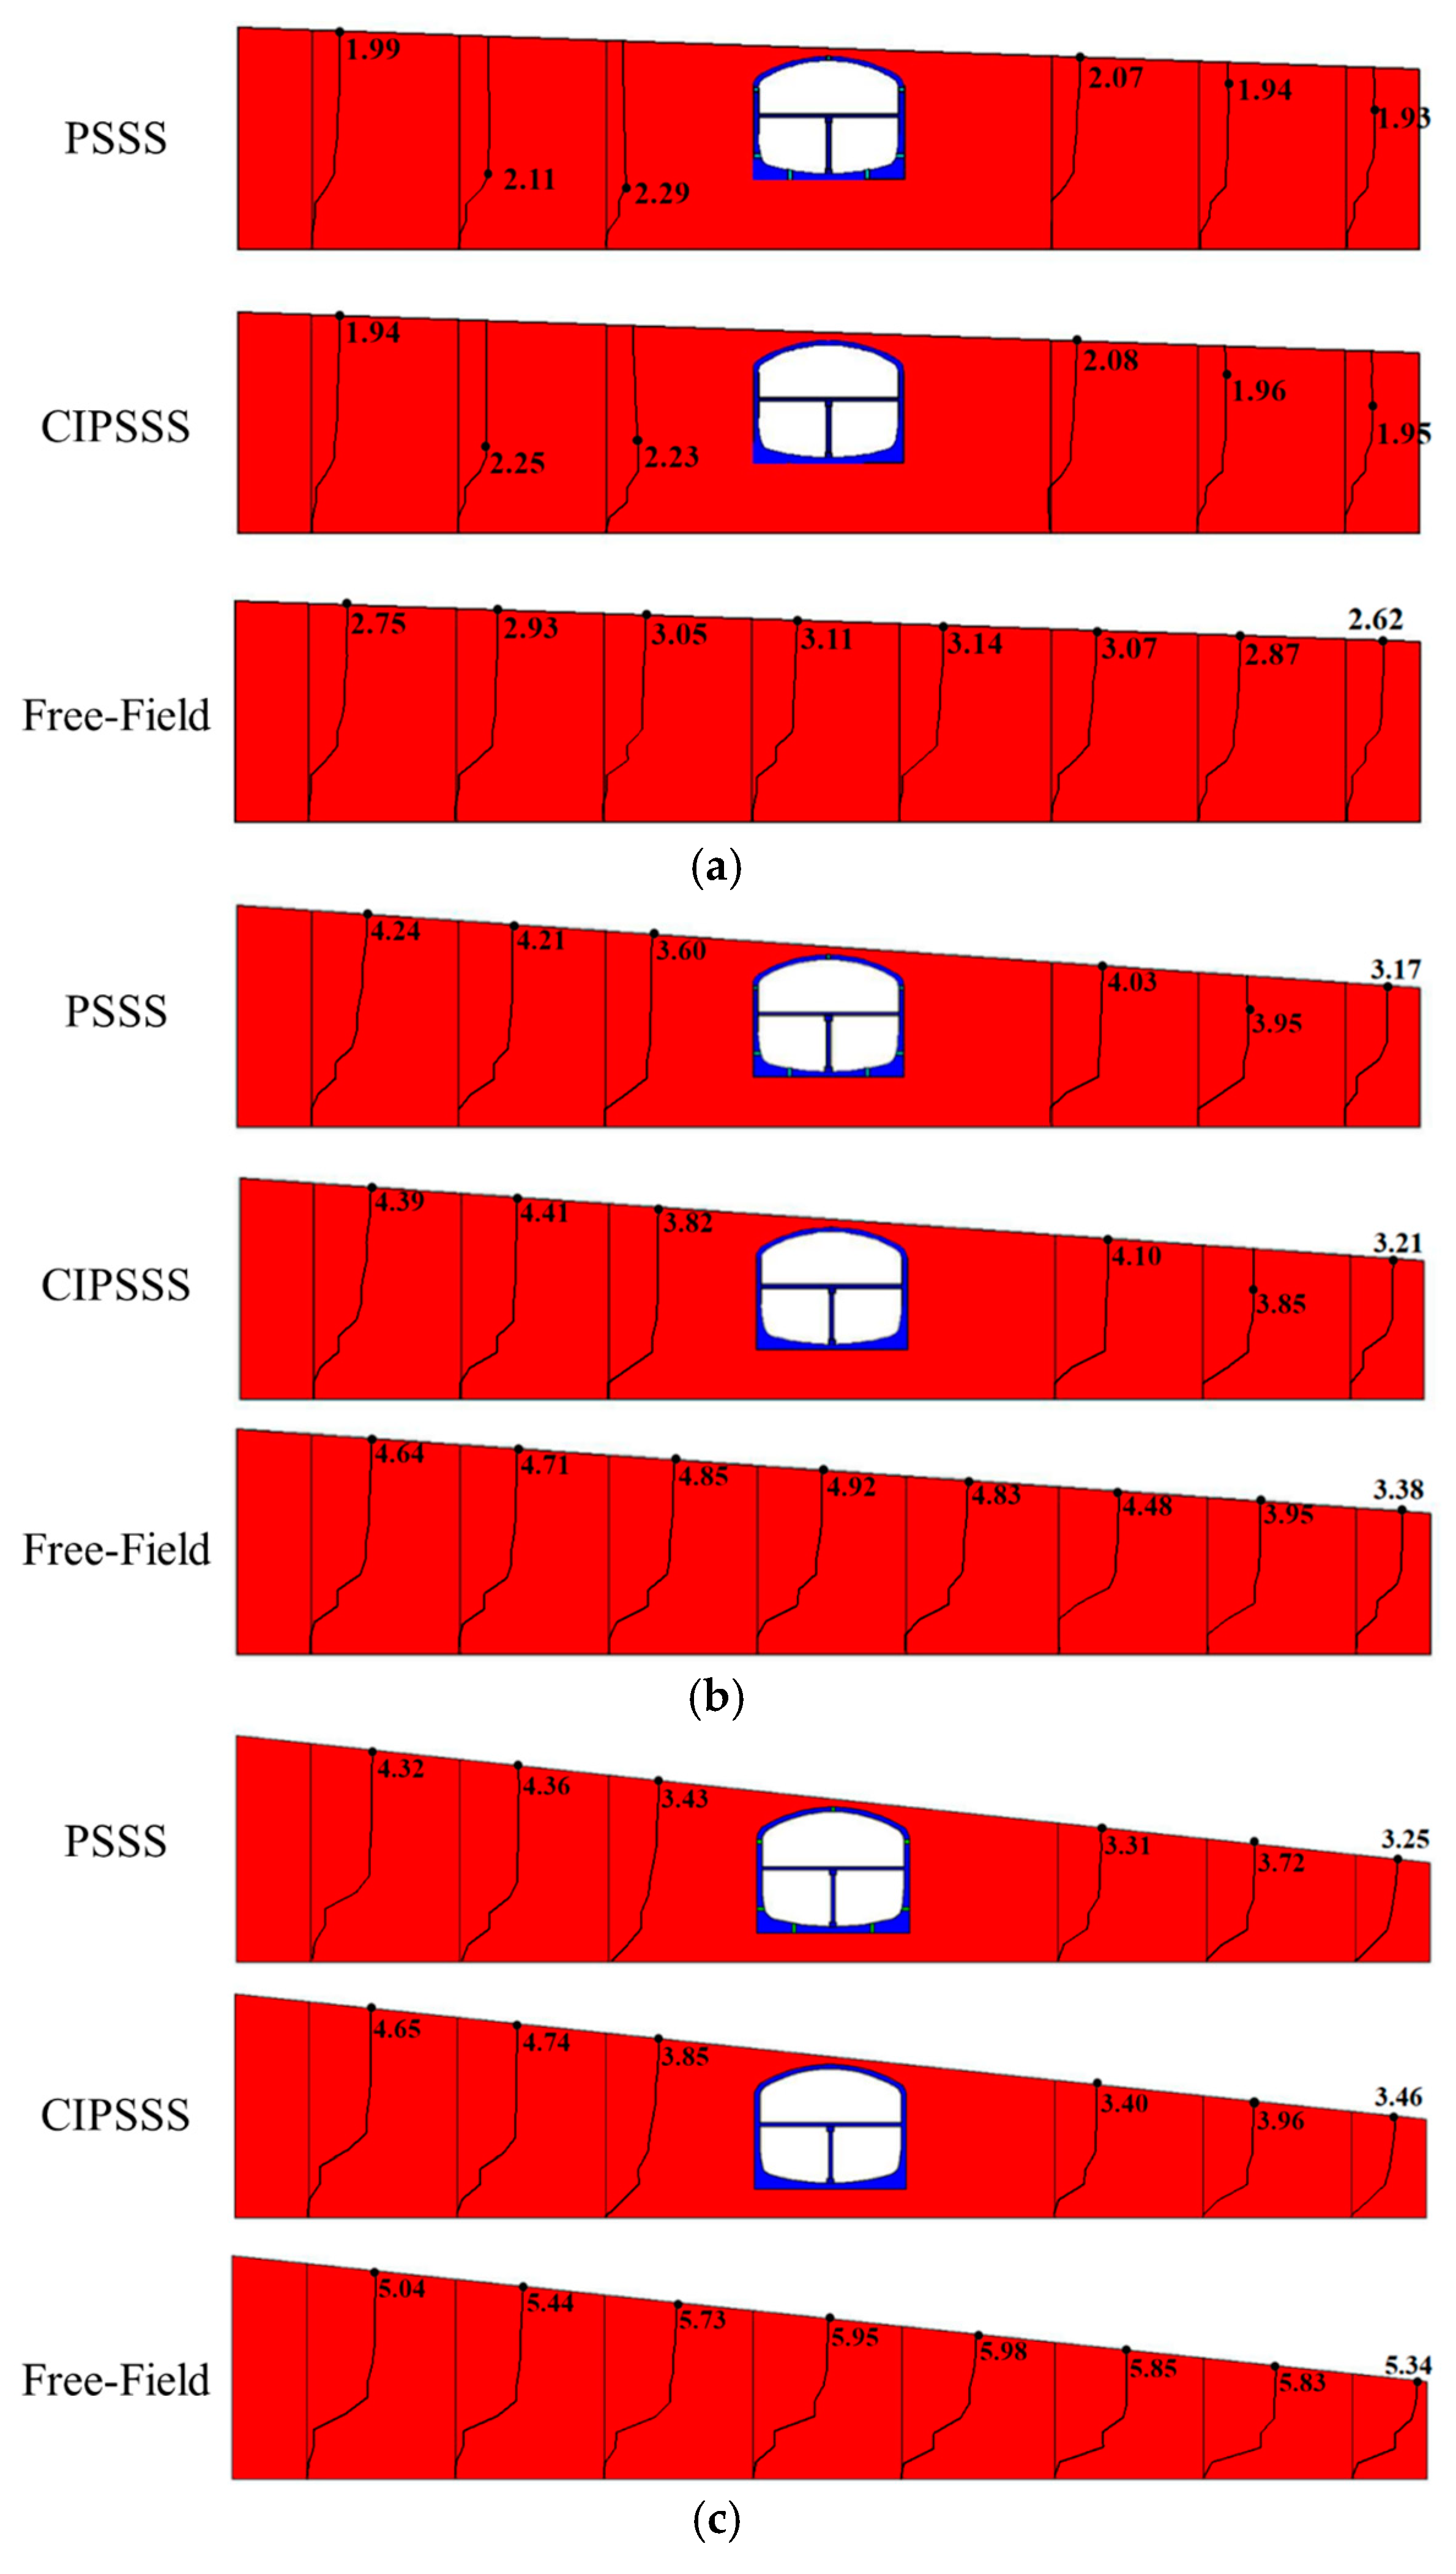
4.2. Peak Acceleration Analysis of the Ground Surface
4.3. Analysis of Lateral Deformation of Liquefiable Soil Body
5. Seismic Response Analysis of Metro Station Structure
5.1. Stress Analysis of Structural Sidewalls (Member C1) in Subway Stations
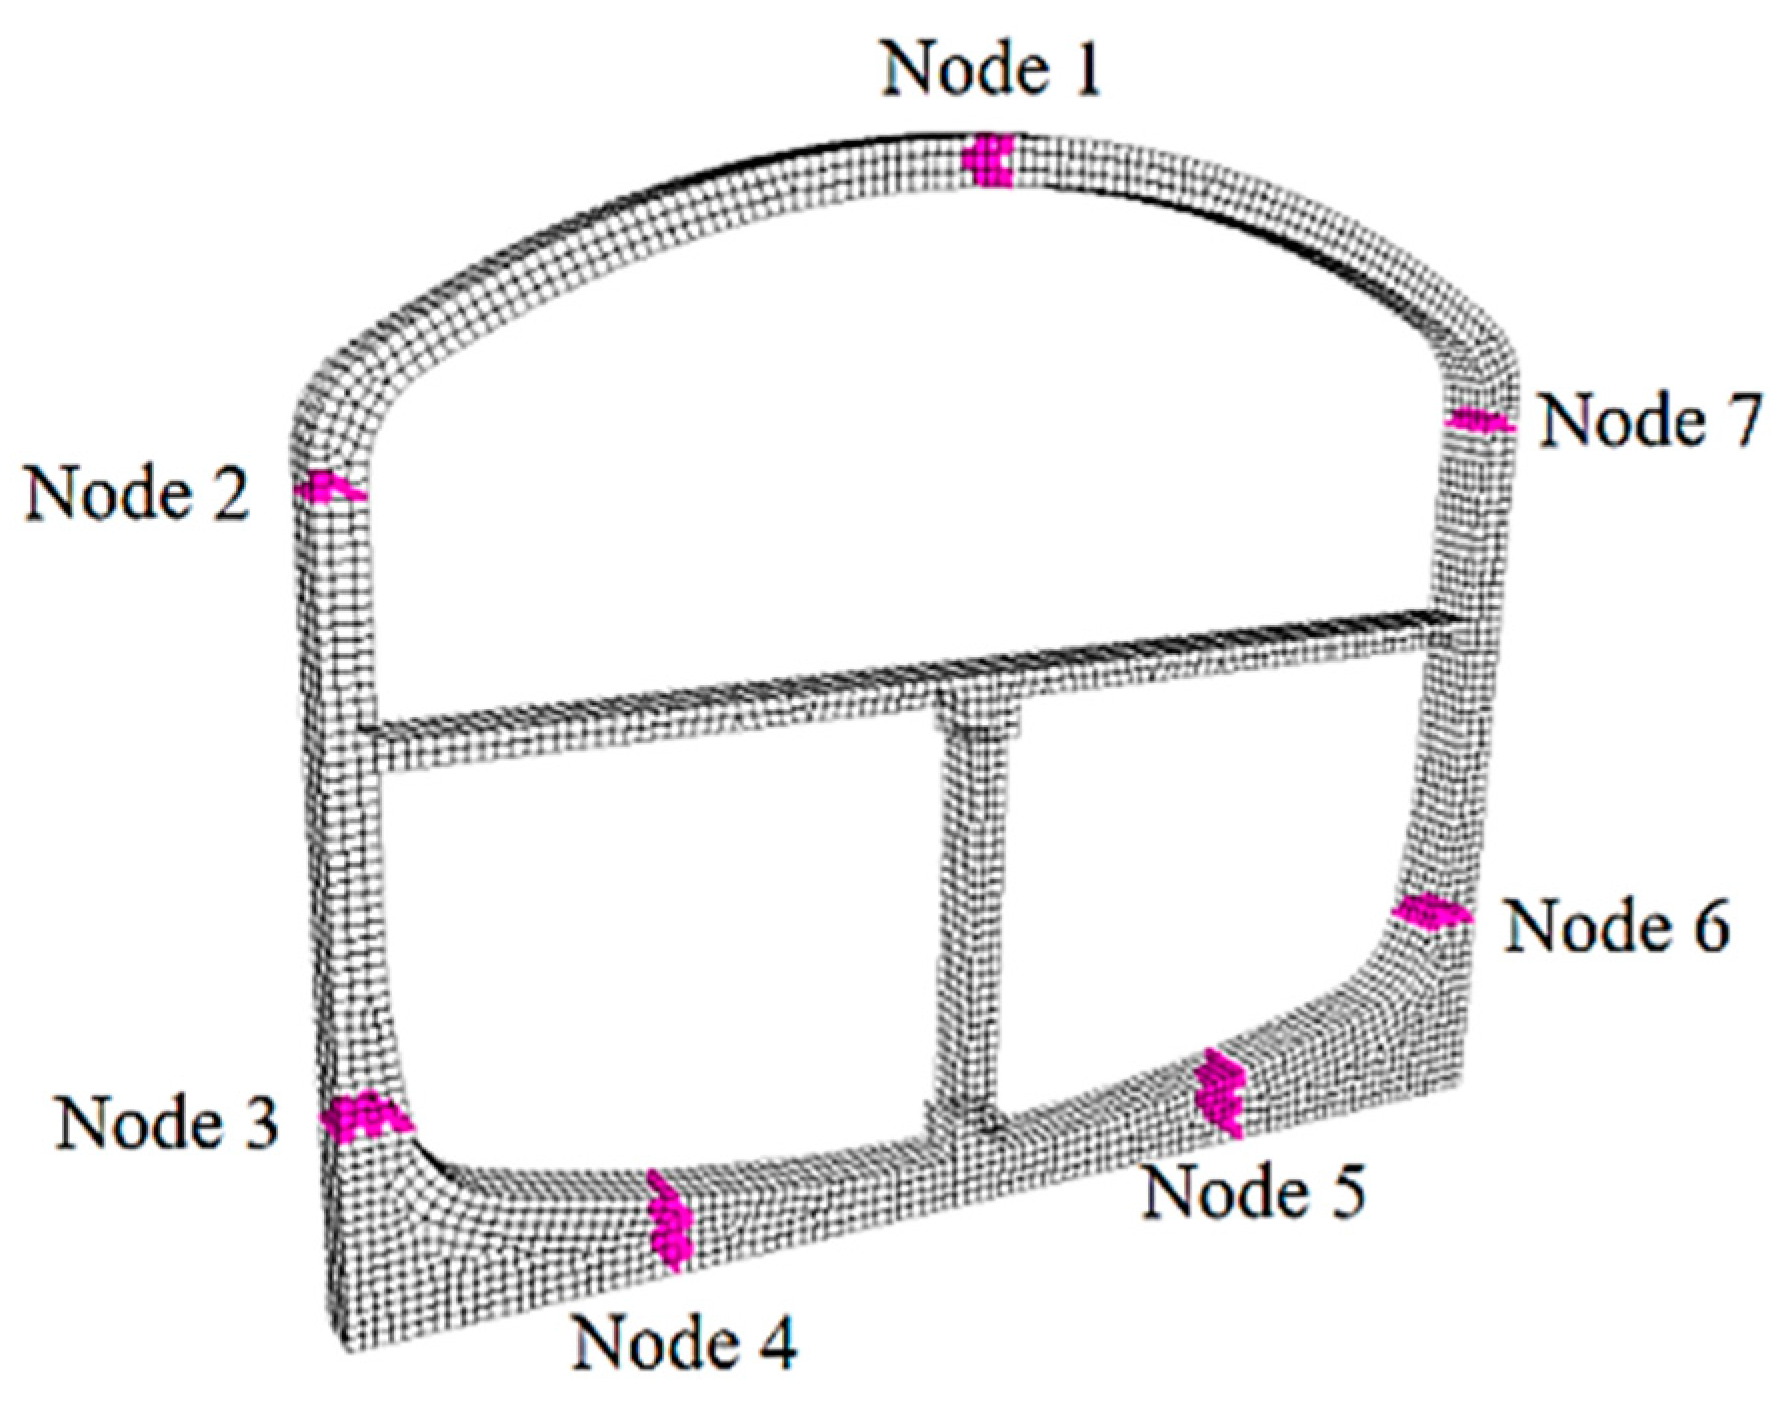
5.2. Stress Analysis at Node Locations of PSSS
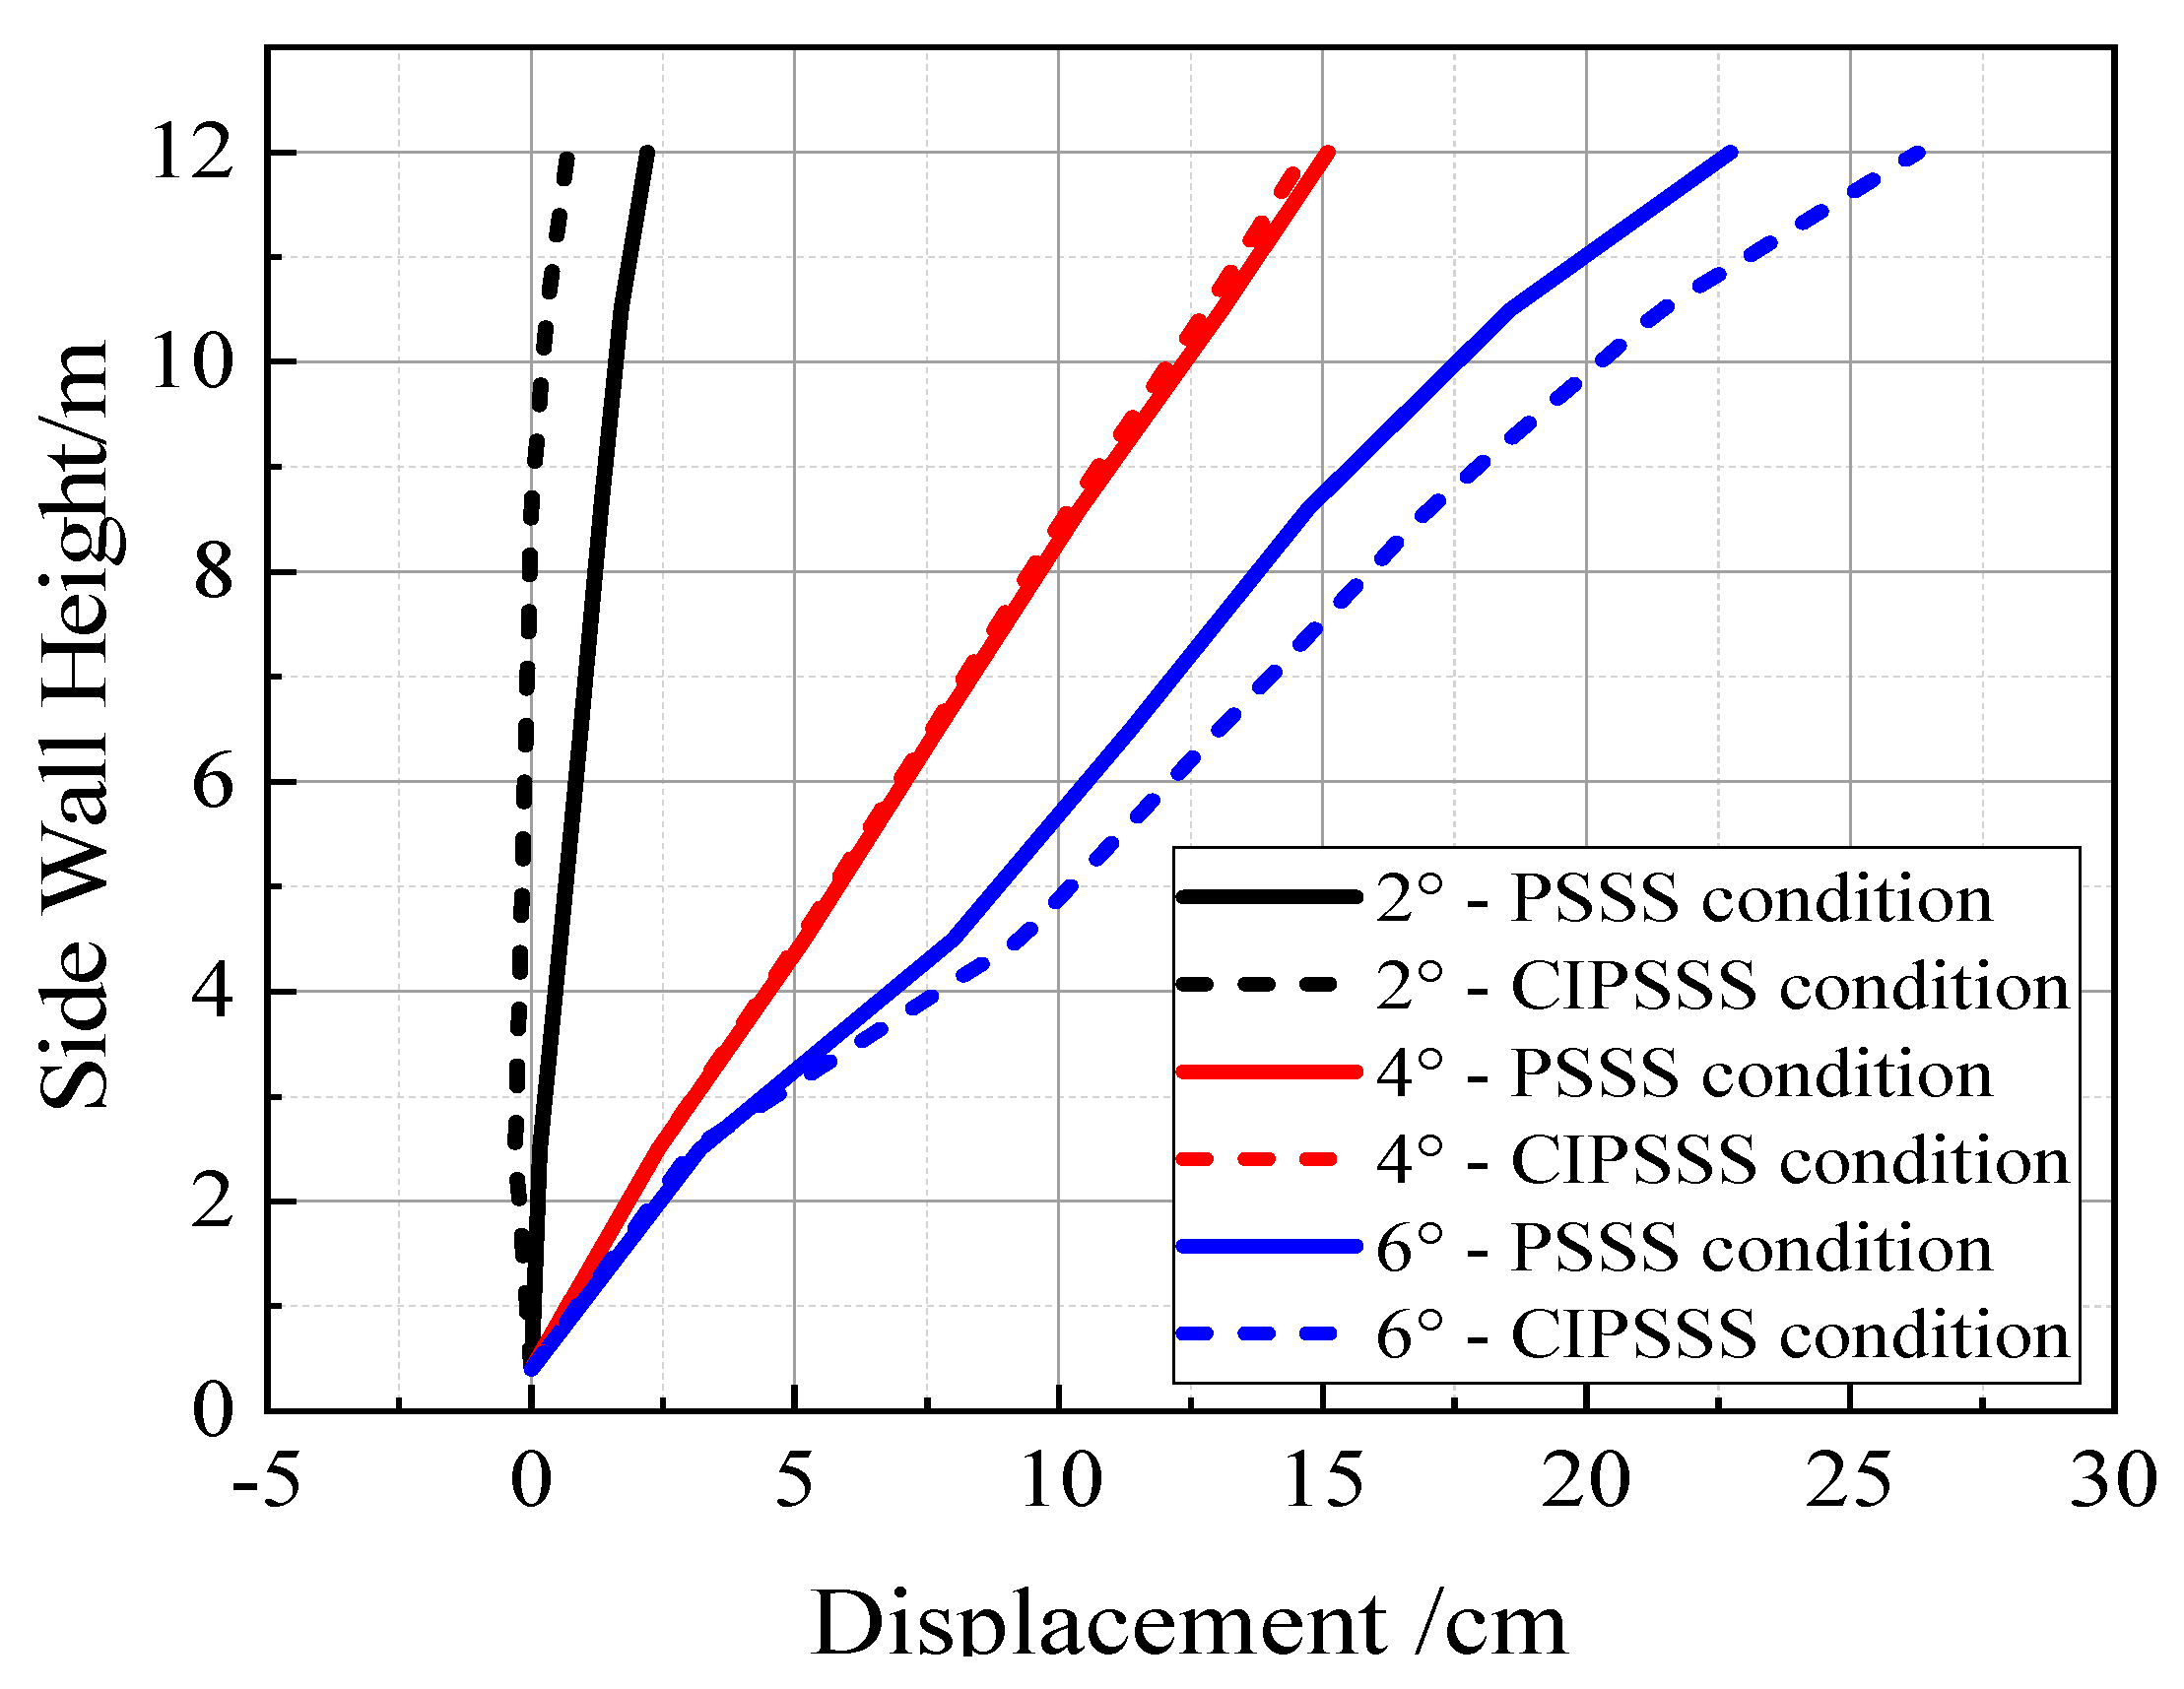
5.3. Analysis of Lateral Deformation of the Subway Station Structure
5.4. Analysis of the Uplift of the Subway Station Structure
6. Discussion
7. Conclusions
- (1)
- The presence of underground structures has a dampening effect on the propagation of seismic waves in the original site soils. When the inclination angle of the ground surface is 2°, the influences of PSSS and CIPSSS on the peak acceleration of the ground surface are 2.5 times and 1.5 times that the structural width of the subway station, respectively. With the increase in the surface inclination angle, the influence range of both structures on the peak acceleration of the surface is basically approximately 1.5 times that of the structure width, and the peak acceleration of the downslope side is significantly larger than that of the upslope side.
- (2)
- The PSSS with flexible connections exhibits less stress on a surface tilt liquefiable site. The maximum stress ratios (the ratio of the maximum stress at the bottom of the left-side wall to the maximum stress at the right-side wall) were 1.08, 1.24, and 1.48 for the left- and right-side walls of the PSSS when the inclination angle of the ground surface was 2°, 4°, and 6°, respectively, and for the cast-in-place structure condition, they were 1.12, 1.25, and 1.50, respectively. The maximum amplitude of the principal stress response and the maximum stress ratio for the side walls of the CIPSSS were both significantly greater than those of the PSSS.
- (3)
- When there is a slope in the ground surface, the soil around the subway station structure will occur due to the slip phenomenon. Whether it is an PSSS or a CIPSSS, the amplitude of the principal stress response of the sidewalls shows an increasing trend with the increase in the inclination angle of the ground surface, and the amplitude of the stress response of the sidewalls on the uphill side of the structure is significantly larger than that of the corresponding position of the sidewalls on the downhill side of the structure, due to the difference in the dynamic soil pressure on both sides of the structure.
- (4)
- The PSSS has better adaptability to ground deformation for sites with large inclination angles. When the inclination angle of the ground surface is 2°, the transverse displacement of the PSSS is obviously larger than that of the CIPSSS, and at this time, the maximum interstory displacement angle of the structure is less than 1/550, which is in the elastic working state. When the inclination angle of the ground surface is increased to 4°, the transverse displacement of the PSSS is slightly larger than that of the CIPSSS, and the difference between the two is very small. When the inclination angle of the ground surface is 6°, the maximum inter-story displacement angle of the PSSS is smaller than that of the CIPSSS. Under 0.3 g ground shaking, the maximum interstory displacement angle of the CIPSSS reaches 1/41, which exceeds 1/50, and the structure is in a state of complete damage.
- (5)
- The PSSS has better overturning resistance than the CIPSSS on inclined liquefiable sites. Both structures were uplifted under ground shaking. As the surface inclination angle increases from 0° to 6°, the maximum uplift of the PSSS is 0.22 m, 0.27 m, 0.28 m, and 0.34 m, while that of the CIPSSS is 0.23 m, 0.29 m, 0.29 m, and 0.38 m. The PSSS first undergoes deflection in the clockwise direction when the surface inclination angle is 2°, and the cast-in-place station structure undergoes deflection in the 4° direction. During this process, the angle of deflection of the two structures was increasing, and the difference in uplift of the two structures was also increasing.
- (6)
- Under the premise of ensuring static waterproofing, the PSSS structure can be applied to the surface tilt liquefiable site.
Author Contributions
Funding
Data Availability Statement
Acknowledgments
Conflicts of Interest
References
- Akin, A.; Sezer, R. A study on strengthening of reinforced concrete frames using precast concrete panels. KSCE J. Civ. Eng. 2016, 20, 2439–2446. [Google Scholar] [CrossRef]
- Ha, S.K.; Yu, S.Y.; Kim, J.S. Experimental study on existing reinforced concrete frames strengthened by L-type precast concrete wall panels to earthquake-proof buildings. KSCE J. Civ. Eng. 2018, 22, 3579–3591. [Google Scholar] [CrossRef]
- Yang, X.R.; Huang, M.Q. Research Strategies on New Prefabricated Technology of Underground Subway Station. Urban Rapid Rail Transit. 2018, 31, 78–85. [Google Scholar] [CrossRef]
- Lai, Y.B.; Wang, M.S.; You, X.H.; He, Z.Y. Overview and outlook for protection and prefabrication techniques of tunnel and underground projects. Build. Tech. Dev. 2015, 42, 24–28. [Google Scholar]
- Zhang, C. Prefabricated tube sheet assembly method construction technology for large-span tunnels in France. Mod. Tunn. Technol. 1997, 10–18. [Google Scholar] [CrossRef]
- Tao, L.J.; Cheng, S.; Ding, P. Shaking table test of the effect of an enclosure structure on the seismic performance of a prefabricated subway station. Tunn. Undergr. Space Technol. 2022, 125, 104533. [Google Scholar] [CrossRef]
- Liu, H.T.; Wang, Z.Y.; Du, X.L. The seismic behavior of precast concrete interior joints with different connection methods in assembled monolithic subway station. Eng. Struct. 2021, 232, 111799. [Google Scholar] [CrossRef]
- Du, X.L.; Liu, H.T.; Lu, D.C. Study on seismic performance of sidewall joints in assembled monolithic subway station. China Civ. Eng. J. 2017, 50, 38–47. [Google Scholar] [CrossRef]
- Ding, P.; Tao, L.J.; Yang, X.R. Three-dimensional Dynamic Response Analysis of a Single-Ring Structure in a Prefabricated Subway Station. Sustain. Cities Soc. 2019, 45, 271–286. [Google Scholar] [CrossRef]
- Tao, L.J.; Cao, Q.; Cheng, S. Seismic Responses of Prefabricated Metro Stations Built at Different Sites. Tunn. Constr. 2022, 42, 378–387. [Google Scholar] [CrossRef]
- Jiang, Z.W.; Yang, X.R.; Li, X. Response Comparisons of Precast and Cast-in-situ Subway Station Structures in the High Seismic Intensity Regione. Eng. Mech. 2023, 1–11. [Google Scholar] [CrossRef]
- Qin, Y.W.; Yang, T.; Guo, H.T. Numerical Analysis of Seismic Response for Fabricated Subway Station. J. Shijiazhuang Tiedao Univ. Nat. Sci. Ed. 2020, 33, 80–87. [Google Scholar] [CrossRef]
- Zucca, M.; Valente, M. On the limitations of decoupled approach for the seismic behaviour evaluation of shallow multi-propped underground structures embedded in granular soils. Eng. Struct. 2020, 211, 110497. [Google Scholar] [CrossRef]
- Committee on Soil Dynamics of the Geotechnical Engineering Division. Definition of terms related to liquefaction. J. Geotech. Eng. Div. 1978, 104, 1197–1200. [Google Scholar] [CrossRef]
- Seed, H.B.; Idriss, I.M. Simplified procedure for evaluating soil liquefaction potential. J. Soil Mech. Found. Div. 1971, 97, 1249–1273. [Google Scholar] [CrossRef]
- Seed, R.B.; Cetin, K.O.; Moss, R.E.S.; Kammerer, A.M.; Wu, J.; Pestana, J.M.; Riemer, M.F.; Sancio, R.B.; Bray, J.D.; Kayen, R.E.; et al. Recent advances in soil liquefaction engineering: A unified and consistent framework. In Proceedings of the 26th Annual ASCE Los Angeles Geotechnical Spring Seminar, Long Beach, CA, USA, 30 April 2003; Available online: https://digitalcommons.calpoly.edu/cenv_fac/8 (accessed on 23 May 2024).
- Ku, C.S.; Lee, D.H.; Wu, J.H. Evaluation of soil liquefaction in the Chi-Chi, Taiwan earthquake using CPT. Soil Dyn. Earthq. Eng. 2004, 24, 659–673. [Google Scholar] [CrossRef]
- Kramer, S.L. Geotechnical Earthquake Engineering; Pearson Education India: London, UK, 1996. [Google Scholar]
- Zhuang, H.Y.; Chen, G.; Hu, Z.; Qi, C. Influence of soil liquefaction on the seismic response of a subway station in model tests. Bull. Eng. Geol. Environ. 2016, 75, 1169–1182. [Google Scholar] [CrossRef]
- Du, X.L.; Wang, G.; Lu, D.C. Earthquake Damage Mechanism Analysis of Dakai Metro Station by Kobe Earthquake. J. Disaster Prev. Mitig. Eng. 2016, 36, 165–171. [Google Scholar] [CrossRef]
- Pitilakis, K.; Tsinidis, G. Earthquake Geotechnical Engineering Design; Springer International Publishing: Berlin/Heidelberg, Germany, 2014; pp. 279–340. [Google Scholar] [CrossRef]
- Chen, J.H.; Zhuang, H.Y.; Wang, W. Shaking table tests on deformation properties of the cone-shaped liquefaction foundation. Geotech. Investig. Surv. 2013, 41, 6–10+29. [Google Scholar]
- Wang, R.; Zhuang, H.Y.; Chen, G.X.; Fu, J.S. Seismic response of subway underground station buried in liquefiable soil foundation with the ground surface slight inclined. Earthq. Eng. Eng. Dyn. 2018, 38, 130–140. [Google Scholar] [CrossRef]
- Zhuang, H.Y.; Zhou, J.P.; Chen, S.; Chen, G.X. Earthquake responses of subway underground structures buried in a liquefiable foundation with a slight inclined ground surface by the shaking table test. Earthq. Eng. Eng. Dyn. 2019, 39, 46–56. [Google Scholar] [CrossRef]
- Qiu, Y.; Zhuang, X.W.; Hu, P. Structure Deformation Analysis of Subway Stations in Gently Inclined Liquefaction Sites. J. Univ. Jinan Sci. Technol. 2023, 37, 727–733. [Google Scholar] [CrossRef]
- Qiu, Y.; Zhang, X. Seismic responses of underground subway station located in gently inclined liquefiable ground. In Civil Engineering and Urban Research, 1st ed.; Mohamed, H.S., Hou, J.F., Eds.; CRC Press: London, UK, 2023; Volume 1, pp. 70–75. [Google Scholar] [CrossRef]
- Yan, G.Y.; Xu, C.S.; Zhuang, Z.H. Influence of soil-structure interface characteristics on seismic response of underground structure in the local liquefaction interlayer site. Chin. J. Rock Mech. Eng. 2023, 42, 3643–3653. [Google Scholar] [CrossRef]
- Wang, K. Seismic Vulnerability Analysis of Assembled Subway Underground Station Structure. Undergraduate Thesis, Xi’an Technological University, Xi’an, China, 2022. [Google Scholar] [CrossRef]
- Yang, X.R. Development Status of and Outlook for Construction Technology for Prefabricated Metro Stations in China. Tunn. Constr. 2021, 41, 1849. [Google Scholar] [CrossRef]
- Chen, Y.M. Research on the Test and Calculation Method of Flow Large Deformation after Liquefaction of Sandy Soil; Hohai University: Nanjing, China, 2007. [Google Scholar]
- Li, Z.P.; Wang, C.; Su, H.F.; Shi, S.F. An experiment study on the evolution law of concrete structure crack and joint seam deformation for tenon groove joints in the prefabricated metro station. China Civ. Eng. J. 2015, 48, 409–413. [Google Scholar]
- Li, Z.P.; Wang, C.; Su, H.F.; Shi, S.; Wang, P. Mechanical property of tenon-groove joints for metro station constructed by prefabricated structure. China Railw. Sci. 2015, 36, 7–11. [Google Scholar] [CrossRef]
- An, J.H.; Liu, Q.F.; Zhang, Y.H.; Zhang, X.H. Seismic Response Comparisons of Prefabricated and Cast In Situ Subway Station Structures in Liquefiable Site. Buildings 2023, 13, 3071. [Google Scholar] [CrossRef]
- Tao, L.J.; Li, Z.Y.; Yang, X.R.; Ding, P.; Shan, X.Y. ABAQUS-based study on the mechanical behavior of prefabricated metro station structure after assembling into a ring. Mod. Tunn. Technol. 2018, 55, 115–123. [Google Scholar] [CrossRef]


| Soil Types | Soil Thickness | Volume Modulus K (Pa) | Shear Modulus G (Pa) | Poisson Ratio γ | Friction Angle φ (°) | Cohesion C (kPa) | Natural Density ρ (g/cm3) | Liquefaction Parameters |
|---|---|---|---|---|---|---|---|---|
| ① Miscellaneous fill | 2.5 | 3 × 10⁷ | 1 × 10⁷ | 0.35 | 25 | 5 | 1900 | — |
| ② Saturated fine sand | 30 | 2 × 10⁷ | 7 × 10⁶ | 0.30 | 35 | 0 | 1800 | Finn C1 = 0.80 C2 = 0.79 C3 = 0.45 C4 = 0.73 |
| ③ Silty clay | 5 | 2.65 × 10⁷ | 1.52 × 10⁷ | 0.28 | 10.5 | 25 | 2000 | — |
| ④ Pebble round gravel | 15 | 3 × 10⁸ | 2 × 10⁸ | 0.22 | 35 | 0 | 2100 | — |
| Structural Types | Elastic Modulus G (GPa) | Density ρ (kg/m3) | Poisson Ratio γ |
|---|---|---|---|
| Prefabricated components A–E (C50) | 34.5 | 2500 | 0.20 |
| Center column, beam (C45) | 33.5 | 2500 | 0.18 |
| Typology | Normal Stiffness (Pa/m) | Shear Stiffness (Pa/m) | Cohesion (kPa) | Internal Friction Angle |
|---|---|---|---|---|
| Contact surface | 3 × 10¹⁰ | 3 × 10⁹ | 10 | 15 |
| Monitoring Point | 2° | 4° | 6° | |||
|---|---|---|---|---|---|---|
| Maximum | Minimum | Maximum | Minimum | Maximum | Minimum | |
| LQ1 | 0.40 | −2.61 | 0.35 | −2.71 | 0.28 | −2.91 |
| LQ2 | 0.23 | −2.52 | 0.23 | −2.62 | 0.63 | −2.93 |
| LQ3 | 1.07 | −2.56 | 1.45 | −2.69 | 1.61 | −2.83 |
| LQ4 | 0.70 | −3.14 | 0.76 | −3.56 | 0.69 | −3.81 |
| LQ5 | 0.33 | −3.36 | 0.21 | −3.57 | 0.24 | −3.95 |
| RQ1 | 0.57 | −2.60 | 0.68 | −2.71 | 1.09 | −2.82 |
| RQ2 | 0.44 | −2.48 | 0.52 | −2.61 | 0.72 | −2.81 |
| RQ3 | 0.63 | −0.54 | 0.50 | −0.66 | 0.40 | −0.71 |
| RQ4 | 0.56 | −2.88 | 0.49 | −2.90 | 0.31 | −2.49 |
| RQ5 | 0.23 | −3.12 | 0.29 | −2.89 | 0.50 | −2.67 |
| Monitoring Point | 2° | 4° | 6° | |||
|---|---|---|---|---|---|---|
| Maximum | Minimum | Maximum | Minimum | Maximum | Minimum | |
| LQ1 | 0.53 | −2.54 | 0.46 | −2.69 | 0.41 | −2.76 |
| LQ2 | 0.28 | −2.48 | 0.22 | −2.64 | 0.74 | −2.93 |
| LQ3 | 1.04 | −2.54 | 1.40 | −2.73 | 1.64 | −2.79 |
| LQ4 | 0.69 | −3.20 | 0.77 | −3.63 | 0.70 | −3.84 |
| LQ5 | 0.13 | −3.59 | 0.02 | −3.79 | 0.16 | −4.23 |
| RQ1 | 0.70 | −2.57 | 0.79 | −2.72 | 1.24 | −2.80 |
| RQ2 | 0.42 | −2.50 | 0.49 | −2.66 | 0.74 | −2.82 |
| RQ3 | 0.62 | −0.54 | 0.47 | −0.65 | 0.41 | −0.68 |
| RQ4 | 0.55 | −2.87 | 0.48 | −2.92 | 0.45 | −2.54 |
| RQ5 | 0.09 | −3.21 | 0.14 | −3.04 | 0.51 | −2.83 |
| Condition | Monitoring Point | 2° | 4° | 6° | |||
|---|---|---|---|---|---|---|---|
| Maximum | Minimum | Maximum | Minimum | Maximum | Minimum | ||
| PSSS | J1 | −0.13 | −1.81 | −0.09 | −1.83 | 0.02 | −2.15 |
| J2 | 0.40 | −2.61 | 0.35 | −2.71 | 0.28 | −2.91 | |
| J3 | 0.33 | −3.36 | 0.21 | −3.57 | 0.24 | −3.95 | |
| J4 | 0.17 | −0.16 | 0.21 | −0.21 | 2.02 | −0.61 | |
| J5 | −2.19 | −3.33 | −2.24 | −2.98 | −0.47 | −2.29 | |
| J6 | 0.23 | −3.12 | 0.29 | −2.89 | 0.50 | −2.67 | |
| J7 | 0.57 | −2.60 | 0.68 | −2.71 | 1.09 | −2.82 | |
| CIPSSS | J1 | 0.05 | −1.81 | 0.0002 | −1.83 | 0.17 | −2.23 |
| J2 | 0.53 | −2.54 | 0.46 | −2.69 | 0.41 | −2.76 | |
| J3 | 0.13 | −3.59 | 0.02 | −3.79 | 0.16 | −4.23 | |
| J4 | 0.25 | −0.04 | 0.31 | −0.07 | 2.15 | −0.41 | |
| J5 | −2.18 | −3.26 | −2.22 | −3.01 | −0.14 | −2.63 | |
| J6 | 0.09 | −3.21 | 0.14 | −3.04 | 0.51 | −2.83 | |
| J7 | 0.70 | −2.57 | 0.79 | −2.72 | 1.24 | −2.80 | |
| PGA 1 | Condition | 2° | 4° | 6° | |||
|---|---|---|---|---|---|---|---|
| B1 2 | B2 | B1 | B2 | B1 | B2 | ||
| 0.15 g | PSSS | 1/780 | 1/850 | 1/333 | 1/197 | 1/106 | 1/100 |
| CIPSSS | 1/812 | 1/869 | 1/341 | 1/202 | 1/103 | 1/98 | |
| 0.25 g | PSSS | 1/578 | 1/590 | 1/133 | 1/79 | 1/55 | 1/53 |
| CIPSSS | 1/589 | 1/606 | 1/136 | 1/81 | 1/43 | 1/41 | |
| Surface Inclination | Structural Form | Displacement Difference/cm |
|---|---|---|
| 0° | PSSS | −2.63 |
| CIPSSS | −2.71 | |
| 2° | PSSS | 0.46 |
| CIPSSS | −1.39 | |
| 4° | PSSS | 11.81 |
| CIPSSS | 12.5 | |
| 6° | PSSS | 21.72 |
| CIPSSS | 23.72 |
Disclaimer/Publisher’s Note: The statements, opinions and data contained in all publications are solely those of the individual author(s) and contributor(s) and not of MDPI and/or the editor(s). MDPI and/or the editor(s) disclaim responsibility for any injury to people or property resulting from any ideas, methods, instructions or products referred to in the content. |
© 2024 by the authors. Licensee MDPI, Basel, Switzerland. This article is an open access article distributed under the terms and conditions of the Creative Commons Attribution (CC BY) license (https://creativecommons.org/licenses/by/4.0/).
Share and Cite
An, J.; Zhang, Y.; Liu, Q.; Guo, F.; Zhang, X. Response Comparisons of Prefabricated and Cast-in-Place Subway Station Structures in Liquefiable Soil Foundation with the Ground Surface Slight Inclined. Buildings 2024, 14, 1559. https://doi.org/10.3390/buildings14061559
An J, Zhang Y, Liu Q, Guo F, Zhang X. Response Comparisons of Prefabricated and Cast-in-Place Subway Station Structures in Liquefiable Soil Foundation with the Ground Surface Slight Inclined. Buildings. 2024; 14(6):1559. https://doi.org/10.3390/buildings14061559
Chicago/Turabian StyleAn, Junhai, Yanhua Zhang, Qiaofeng Liu, Fei Guo, and Xuehui Zhang. 2024. "Response Comparisons of Prefabricated and Cast-in-Place Subway Station Structures in Liquefiable Soil Foundation with the Ground Surface Slight Inclined" Buildings 14, no. 6: 1559. https://doi.org/10.3390/buildings14061559
APA StyleAn, J., Zhang, Y., Liu, Q., Guo, F., & Zhang, X. (2024). Response Comparisons of Prefabricated and Cast-in-Place Subway Station Structures in Liquefiable Soil Foundation with the Ground Surface Slight Inclined. Buildings, 14(6), 1559. https://doi.org/10.3390/buildings14061559