Abstract
Based on the theory of zero bending moment under constant load, various optimization methods exist for the top beam of large-span continuous rigid frame bridges. These include achieving zero bending moment at the root of the cantilever beam, at the control stage section, and through the zero deflection method. This study aims to explore the methods and effects of optimizing roof beam design using the constant load zero bending moment method and the “three group bundle method”. Using finite element modeling, the total number and eccentricity of prestressed tendons required for each suspended pouring block are determined. Additionally, the “three group beam matching method” is employed to adjust the steel beam, adhering to the design concept of “large cantilever beam matching and small cantilever beam matching”, to achieve a reasonable configuration of the top plate beam. Through specific engineering examples, the results demonstrate that utilizing the constant load zero moment method and the “three group bundle method” can significantly enhance the structural performance and economy of large-span continuous rigid frame bridges. Moreover, it offers practical operability, providing an important reference basis for similar project designs.
1. Introduction
Cantilever construction methods have spurred the rapid development of large-span prestressed concrete continuous rigid frame bridges. Nonetheless, during bridge operation, excessive long-term deflection at the mid-span is a prevalent issue in such structures. This deflection can lead to box girder cracking, exacerbating deflection and initiating a detrimental cycle. Traditional prestressed tendon design primarily assesses cross-section stress and bearing capacity compliance with specifications, often overlooking internal forces and post-prestressing deflection states. While meeting design specifications, traditional methods may not ensure an optimally reasonable bridge completion state. Hence, optimizing the prestressed design of large-span precast concrete continuous rigid frame bridges becomes imperative.
The long-term increase in deflection of concrete beam bridges primarily stems from concrete shrinkage, prestress loss, friction coefficient, beam cracking, and construction quality [1,2,3,4]. Additionally, factors such as non-uniform shrinkage, cracks, increased deflection due to continuous loading, and construction quality influence the long-term deflection of these bridges. Analyzing the impact mechanism of these factors on deflection aids in better understanding and predicting changes in long-term deflection of bridges [5,6].
This study evaluated and enhanced existing prediction models for deflection, considering factors such as material and geometric characteristics, construction factors, and cross-sectional properties for calculation. These enhancements result in more accurate predictions of long-term deflection in concrete beam bridges [7,8,9,10,11].
Furthermore, structural parameters of bridges, such as cross-sectional moment of inertia and prestressing force, can also influence the long-term deflection of concrete beam bridges. Effective reduction in deflection relies significantly on reasonable reinforcement arrangement and high construction quality. This reduction can be achieved through optimized design reinforcement, enhanced reinforcement in the compression zone, and the utilization of low-creep concrete [12,13,14,15,16].
Optimizing the design of bridge structures and implementing reinforcement plans for deflection are crucial for controlling deflection [17,18]. Such optimization and adjustments can effectively reduce bridge deflection and enhance their long-term performance. The reinforcement plan for deflection primarily involves increasing prestress, adjusting structural parameters, and enhancing reinforcement in the compression zone. Comparative analysis of different reinforcement plans offers valuable insights for bridge maintenance and reinforcement [19].
This article primarily focuses on the “constant load zero bending moment method” and compares various optimization schemes for top plate bundles to determine the most practical approach. Prestressed concrete continuous rigid frame bridges employ longitudinal prestressed tendons, comprising top plate, web plate, and bottom plate tendons. While web plate tendons contribute minimally to the balanced constant load bending moment, bottom plate tendons primarily counteract bending moments at the mid-span position in the completed bridge. However, their impact on reducing deflection after bridge completion is less significant compared to top plate and web plate tendons. Thus, this article primarily addresses the initial design of top plate tendons.
2. Preliminary Design of Top Plate Bundle
The “constant load zero moment method” addresses the reduction in secondary internal forces caused by concrete creep. This method aims to select prestressing-induced bending moments to counteract those generated by the concrete structure during construction, thus preventing deflection and mitigating the effects of concrete creep [20,21]. Its primary objective is to balance constant load-induced bending moments by adjusting prestressed bending moments, ensuring that the main beam experiences axial deformation without deflection. Specifically, the reverse concentrated bending moment from the prestressed beam of the top plate can offset the bending moment caused by the self-weight of the cantilever section during construction, achieving a constant load zero bending moment state on these sections.
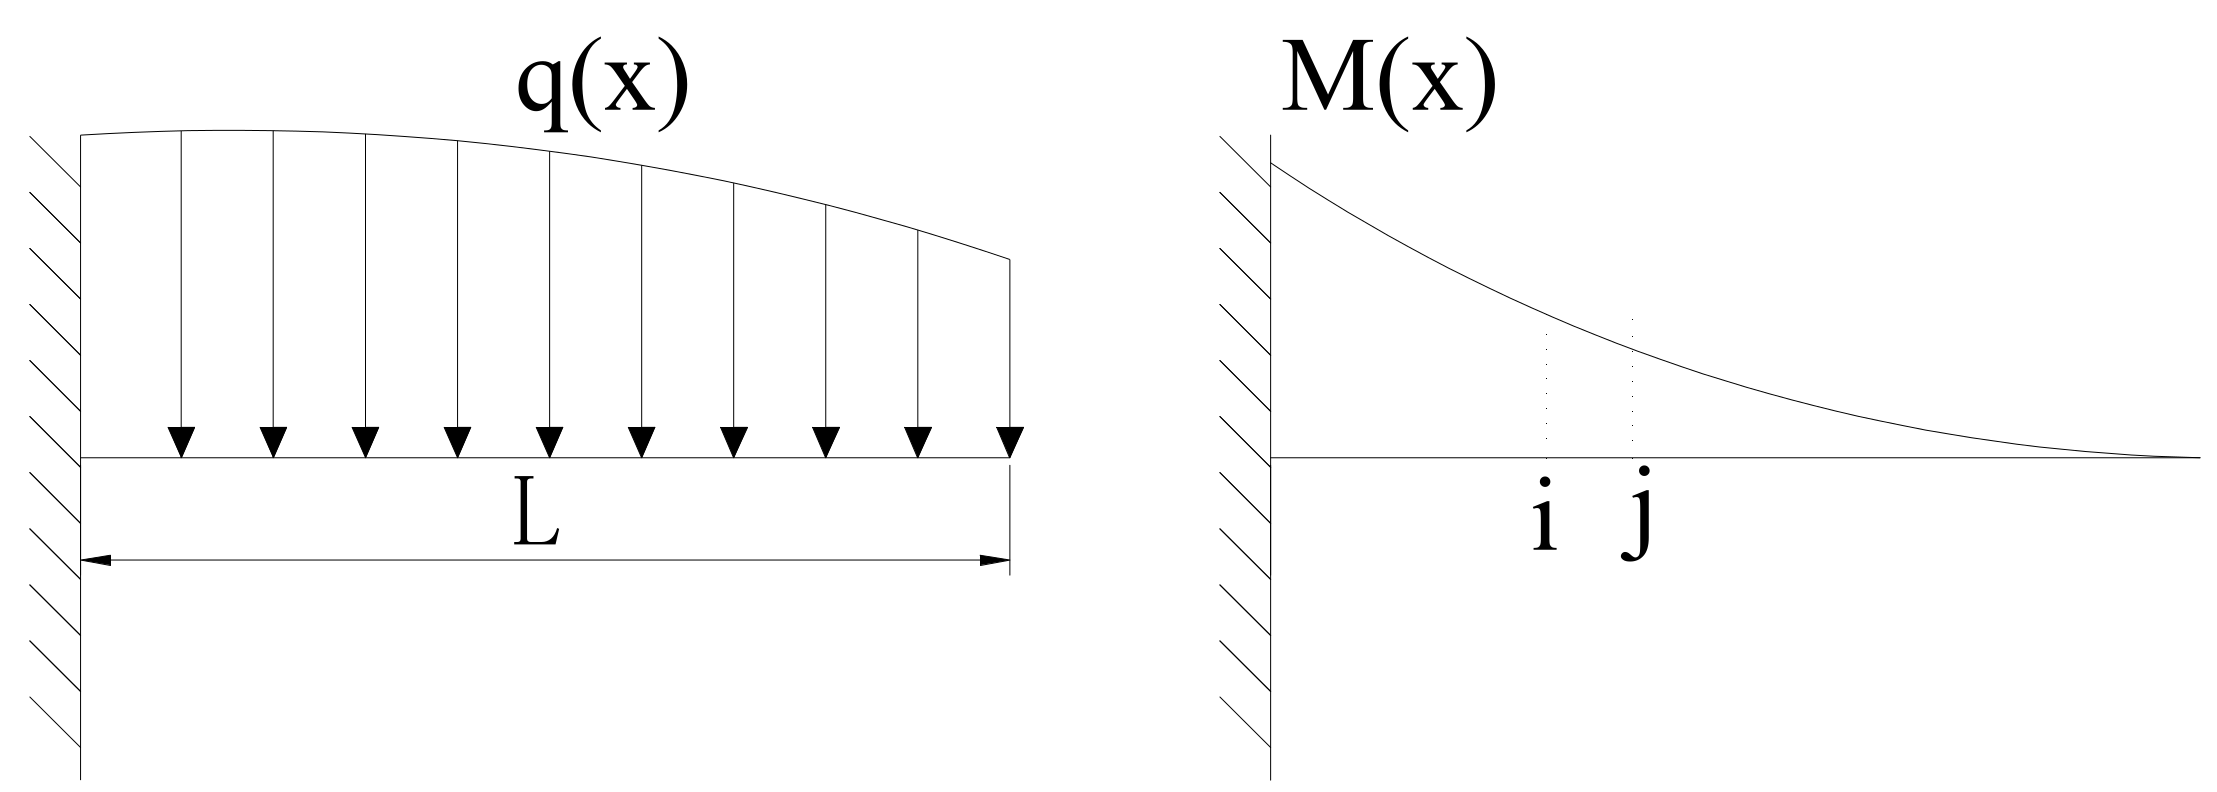
(1) Method 1: In continuous rigid frame bridges constructed with cantilevers, the bending moment at the root of the cantilever beam, induced by prestressed tendons tensioned in a specific section during cantilever construction, counterbalances the bending moment caused by the constant load at the root of the beam in that section [22]. The relevant theoretical analysis reveals that large-span continuous rigid frame bridges often feature variable cross-sectional forms, resulting in varying self-weight distributions along the beams. Figure 1 presents a diagram of the force and bending moment of the beam.

Figure 1.
Distribution load and bending moment diagram of cantilever beam.
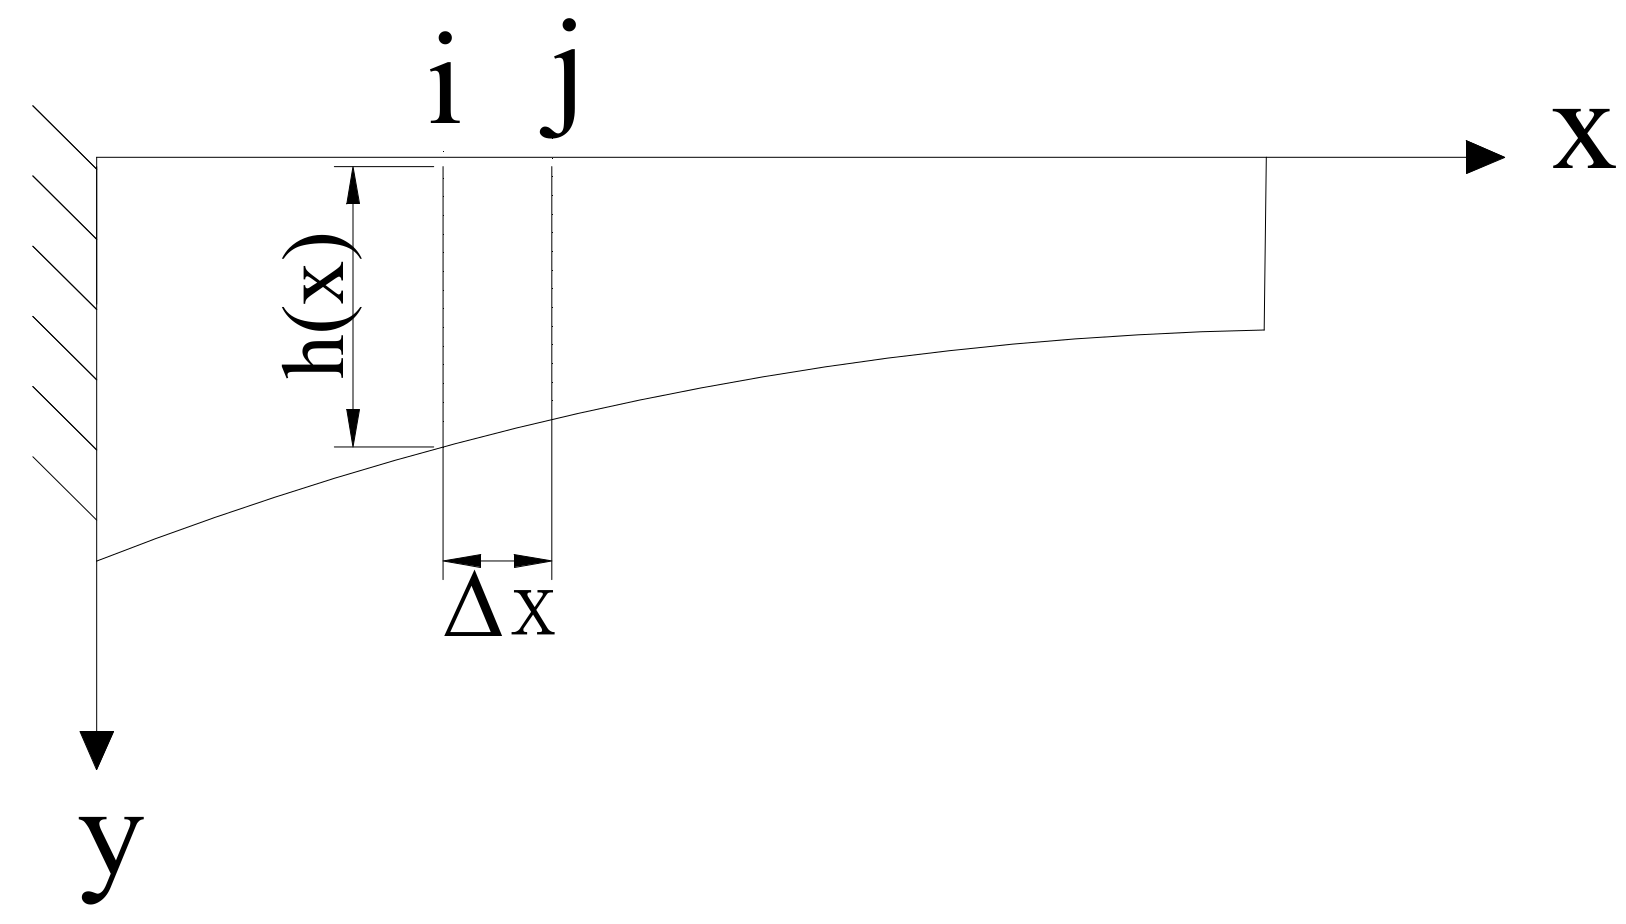
Assuming that the height of the cross-section beam varies by a second parabolic curve, the front view of the cantilever beam is shown in Figure 1.
From Figure 1 and Figure 2, it can be concluded that when cantilever pouring occurs in the section, the self weight of the concrete is:

Figure 2.
Front view of cantilever beam.
According to Equation (1), the self weight bending moment of the segment relative to the 0 # root section located at the top of the pier can be expressed as:
In the formula, is the bulk density of concrete; is the expression for cross-sectional area; represent the height of the section.
According to the condition of zero moment under constant load at the root section of section 0 #, the prestressing of section is carried out, and
According to Equation (3), the prestress of section is
In the formula, is the distance between the centroid of the cross-section and the upper edge of the cross-section; is the thickness of the steel reinforcement protective layer.
(2) Method 2: When the cantilever reaches its maximum extension, the internal forces at each control section achieve equilibrium. This means that the sum of the constant load bending moment and the reverse bending moment induced by the prestressed tendons applied beyond that section counterbalance each other [23].
(3) The “constant load zero bending moment method” aims to control deflection in bridges constructed using cantilever segments. It ensures that the downward deflection caused by the self-weight of the segment is balanced by the upward deflection resulting from the tensioning prestress of the segment. This approach is referred to as the “zero deflection method” [23]. Its expression is as follows:
In the formula, represents the deflection influence coefficient of each prestressed top plate bundle that can be calculated based on the characteristics of cantilever construction. The cantilever construction process is simulated, and the prestressed top plate bundles of each section are tensioned. When tensioning the top plate bundle , the ratio of the deflection generated at the end of section to the tensioning force is called the deflection influence coefficient of top plate bundle on the end of section , expressed as ; , which refers to the deflection generated at the end of section during the construction of section .
3. Comparison of Initial Configuration Schemes for Top Plate Bundles
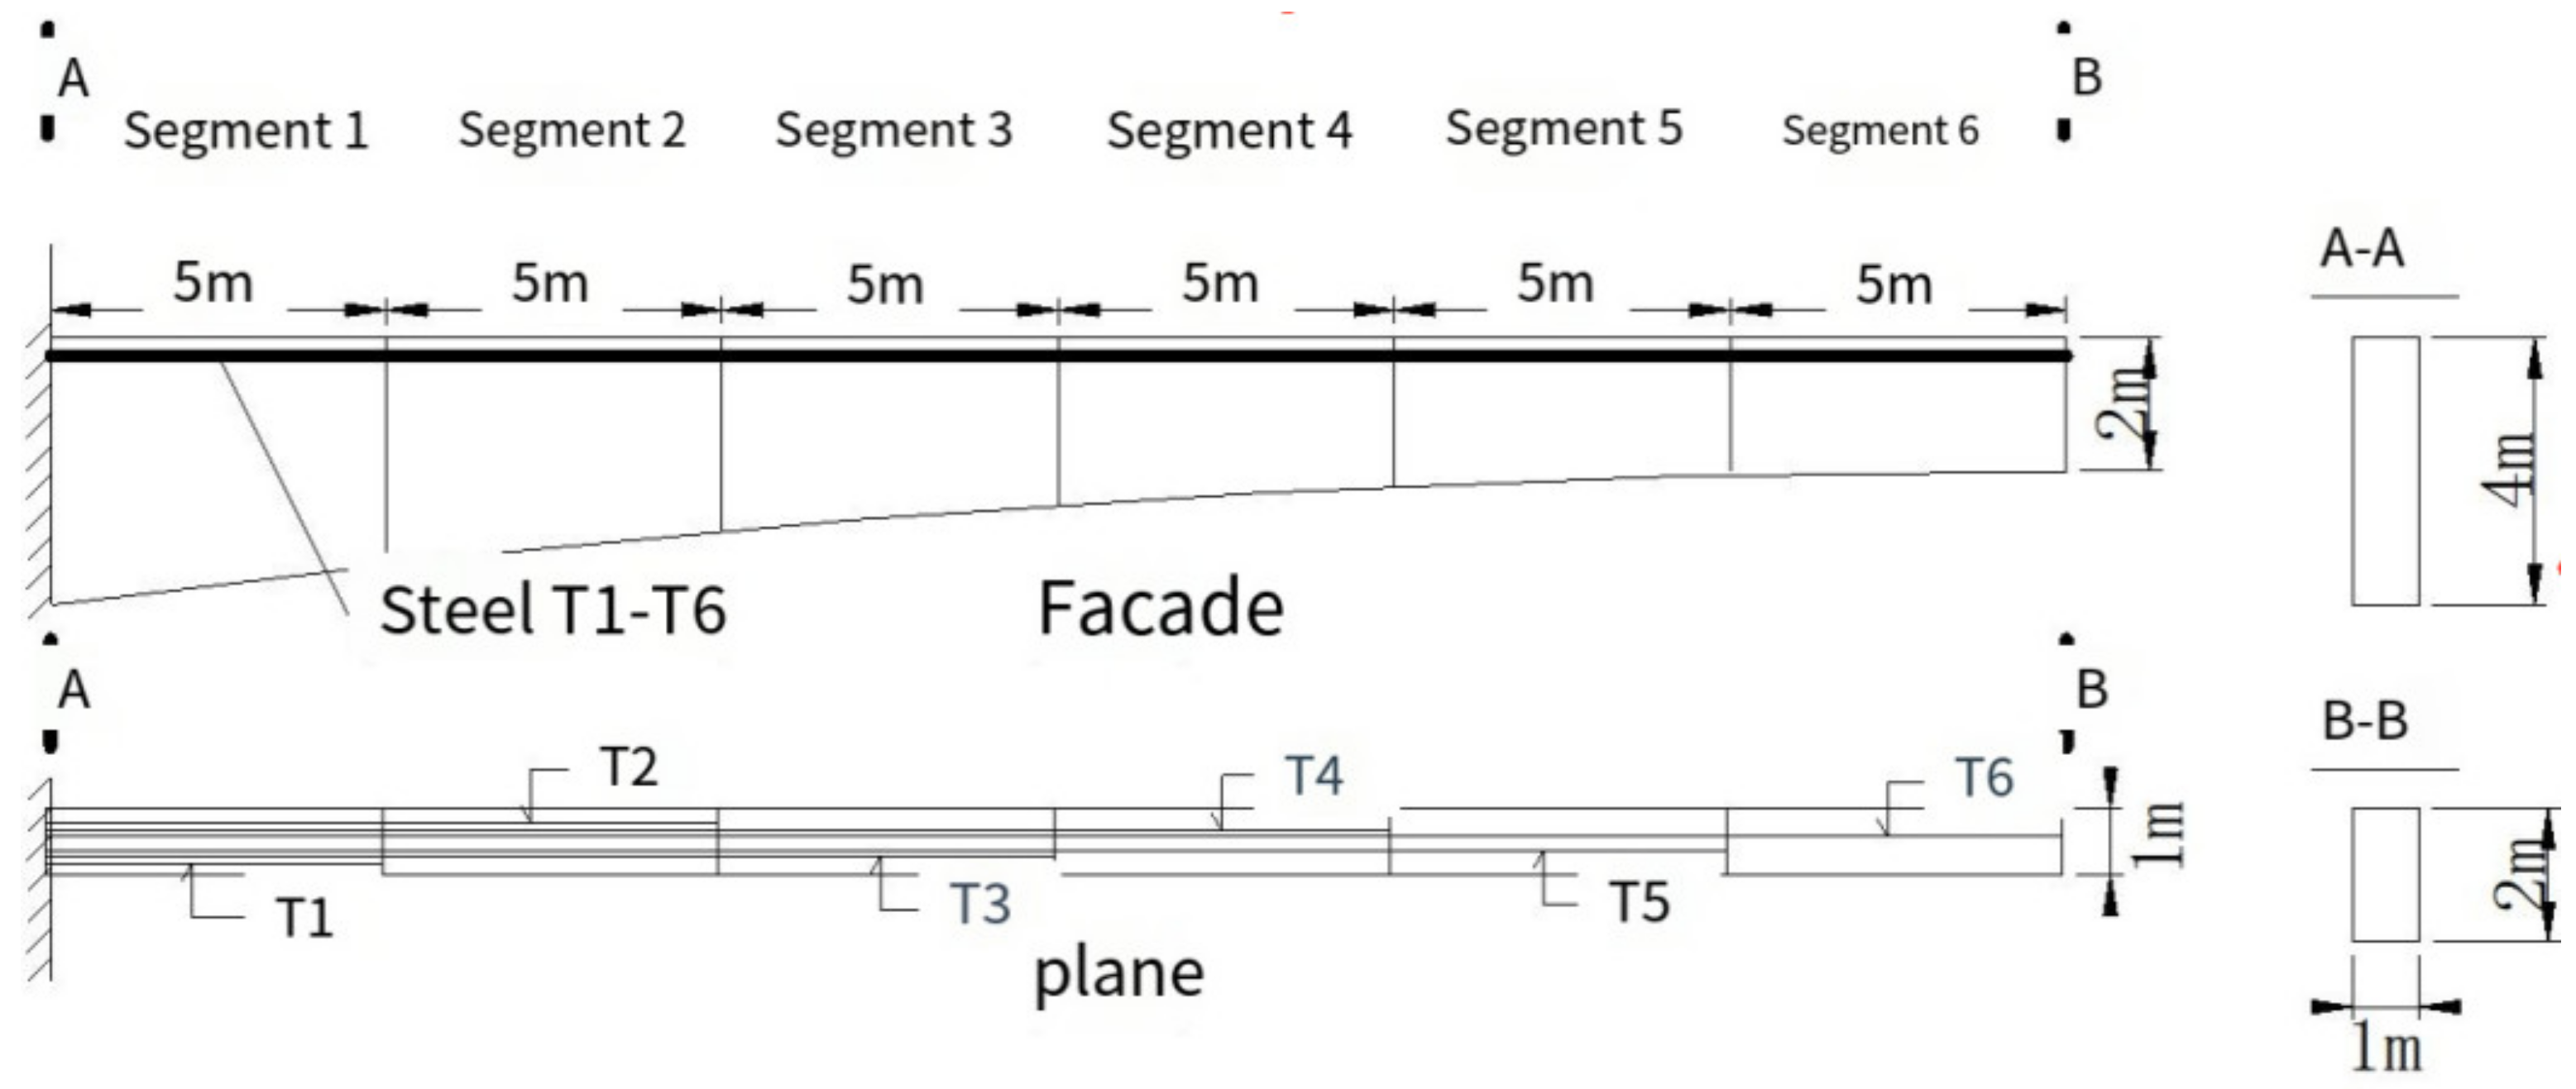
A specific cantilever beam, comprising six segments and spanning 30 m, with each segment being 5 m long, was simulated using the finite element method through six construction stages. The beam’s cross-section is rectangular, transitioning gradually in height from 4 m to 2 m in two parabolic stages, with a constant width of 1 m. The material used is C50 concrete, reinforced with prestressed steel strands labeled T1 to T6, with a tensile stress value of 1395 MPa. The distance between the center of each steel strand and the upper edge of the section is 15 cm. The construction layout of the cantilever beam is depicted in Figure 3, while a simulation model is created using the finite element software Midas/Civil 2019, as illustrated in Figure 4.
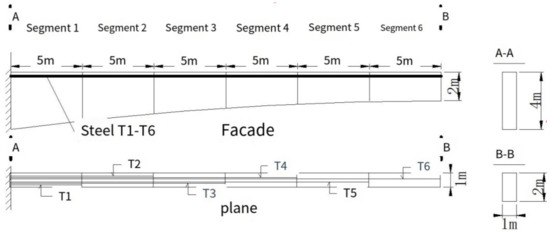
Figure 3.
Cantilever beam construction drawing (unit: m).
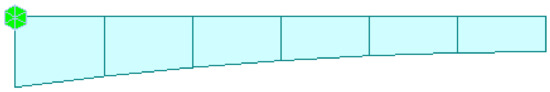
Figure 4.
Cantilever beam simulation model.
(1) Method 1: In the calculation process of the simplified model, we consider the self-weight and prestress (excluding prestress loss), taking the left section of the segment as the control section. The calculation process is outlined as follows:
The calculation results of each prestressed tendon can be obtained from Equation (4) and Table 1, as shown in Table 2.

Table 1.
Negative bending moment generated at the root during each cantilever stage of pouring.
Table 2.
Calculation results of each prestressed tendon.
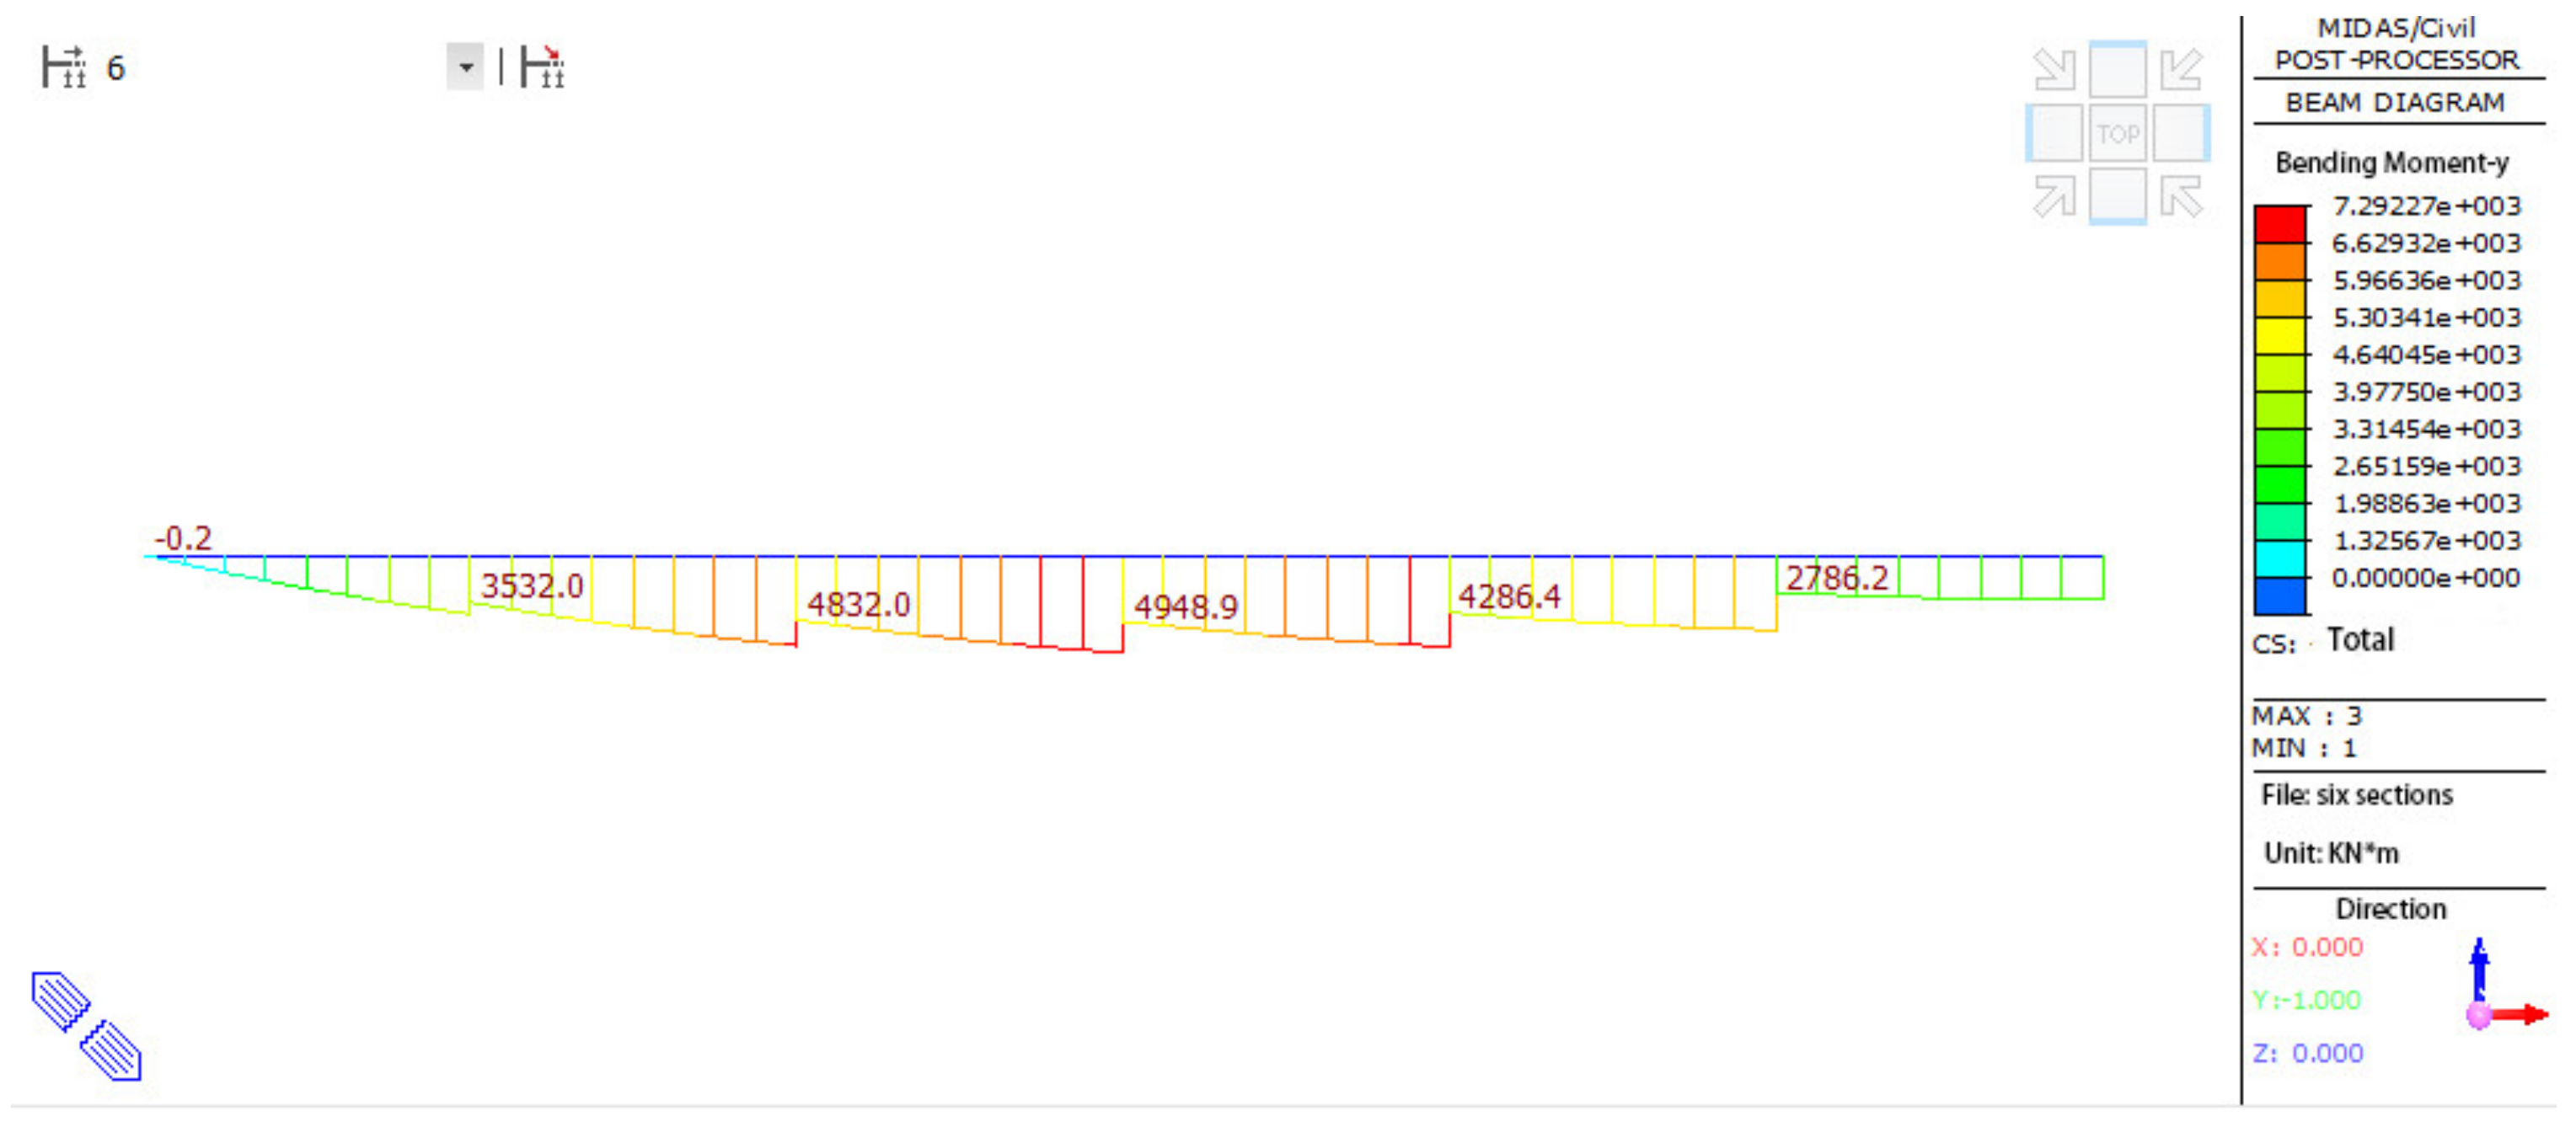
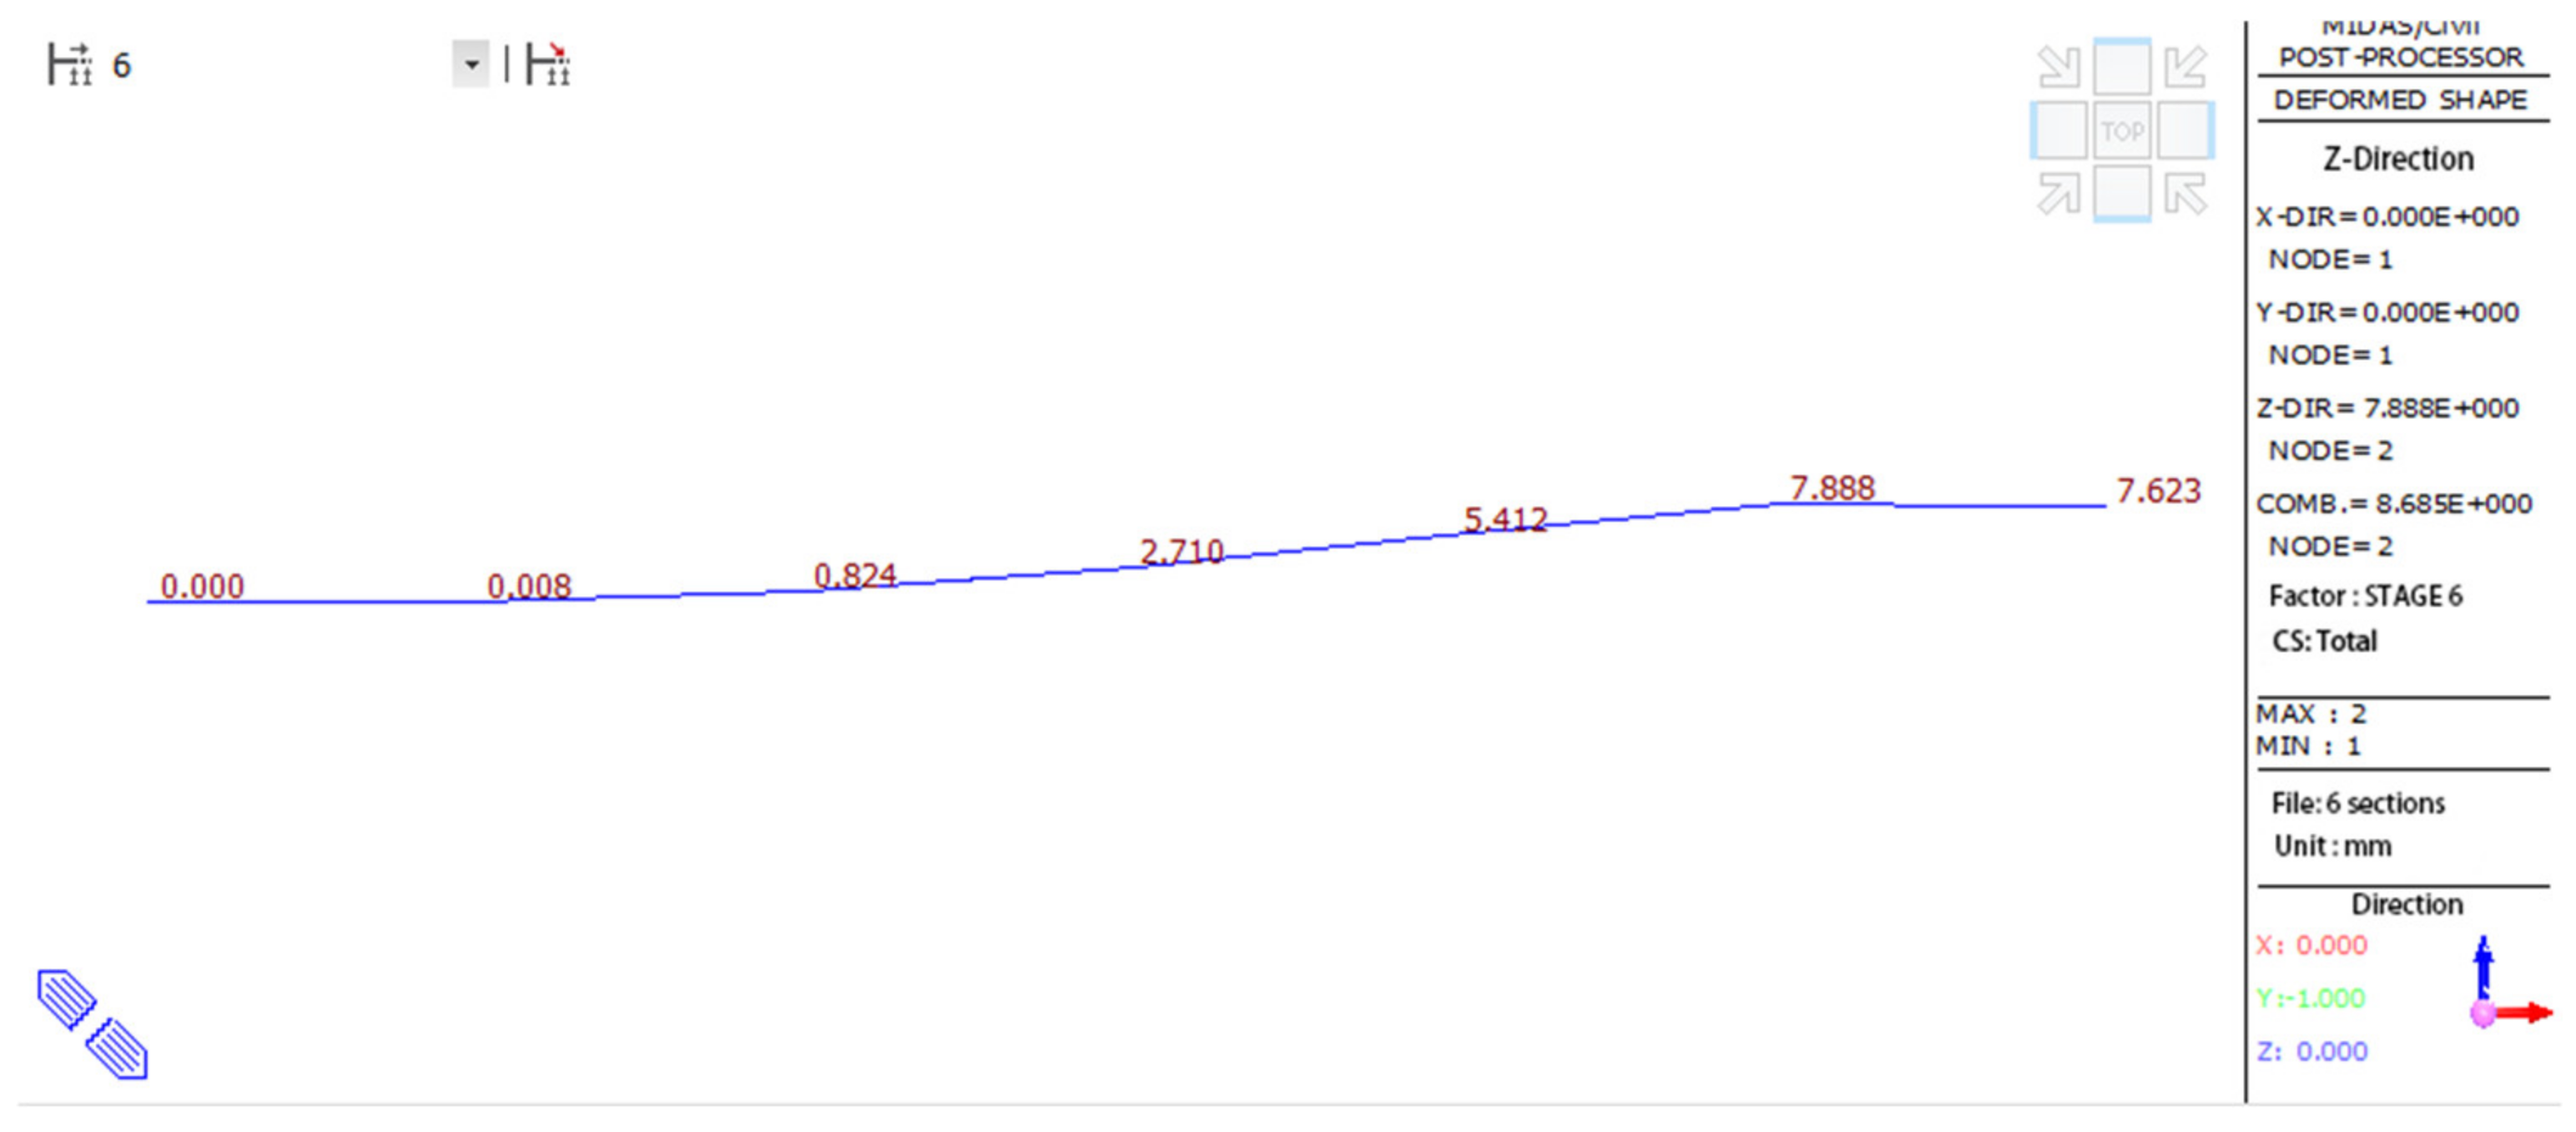
Inputting the calculation results from Table 2 into the finite element model yields the maximum bending moment and cumulative displacement of the beam arrangement method in the cantilever state, depicted in Figure 5 and Figure 6.
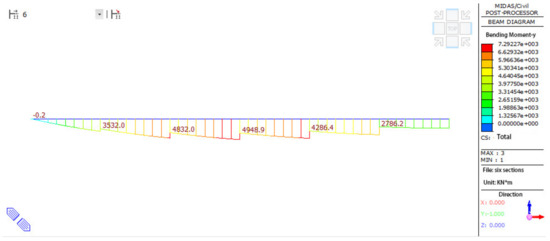
Figure 5.
Maximum cantilever state bending moment diagram (unit: ).
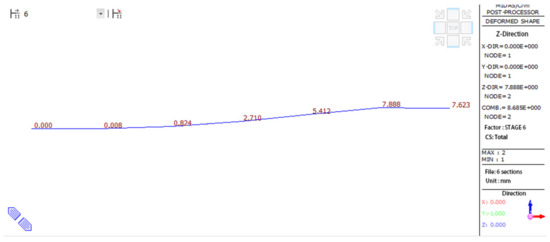
Figure 6.
Maximum cantilever cumulative displacement map (unit: ).
The bending moment diagram in Figure 5 illustrates that each section of the cantilever experiences a positive bending moment. This indicates that selecting the top plate prestressed beam according to Method 1 can effectively balance the reverse bending moment generated by the prestressed beam with the bending moment induced by the self-weight load. In Figure 6, the cumulative displacement of the cantilever segment construction method shows upward deflection.
(2) Method 2: During the calculation process of the simplified model, we account for both the self-weight and prestress (excluding prestress loss), taking the left section of the segment as the control section. The matrix of the influence coefficient of the prestress tendon moment is as follows:
According to Formula (6), the equation is listed and solved using MATLAB 2019 to obtain:
The cross-sectional areas () of prestressed steel strands T1~T6 are:
Substituting the calculated prestressed tendons into the finite element model allows for the determination of the maximum bending moment and cumulative displacement values in the cantilever state of the reinforcement method.
According to the calculation results of Method 2, each section of the cantilever exhibits positive bending moments. This suggests that selecting the top plate prestressed beam according to Method 2 can balance the reverse bending moment generated by the prestressed beam with the bending moment induced by the self-weight load. However, the cumulative displacement of the cantilever segment construction method shows downward deflection.
According to Method 2, the reverse bending moment generated by the prestressed beam in certain construction sections is insufficient to counterbalance the bending moment caused by the self-weight load of that section. This discrepancy results in the cantilever beam bending moment from the tensioned prestressed beam of that section failing to fully offset the cantilever beam bending moment from the self-weight load of that section. Figure 7 illustrates this issue during the construction of Block 5, where the reverse bending moment generated by the prestressed beam is insufficient to counteract the bending moment from the self-weight load, leading to downward deflection in the section. Consequently, as the cantilever extends, its cumulative deflection gradually transitions to a downward direction.
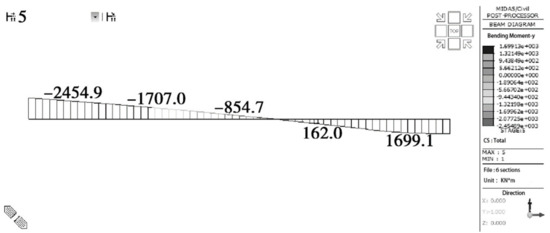
Figure 7.
Bending moment diagram during construction of Block 5 (Unit: ).
(3) Method 3: Using the cantilever structure as a case study, the “zero deflection method” is applied to determine the required amount of prestressed tendons. Then, the deflection influence coefficients of each prestressed tendon are retrieved from the finite element model as described below:
According to Equation (5), the cross-sectional areas () of T1~T6 of prestressed tendons can be solved as follows:
The result obtained from Equation (5) can be utilized in the finite element model to determine the maximum bending moment and cumulative displacement of the cantilever state for the beam configuration method.
From the calculation results of Method 3, it was observed that a negative bending moment occurred at the root of the cantilever beam. This suggests that the reverse bending moment generated by selecting the top plate prestressed tendon according to Method 3 cannot completely offset the bending moment induced by the self-weight load. As a result, the cumulative displacement exhibits downward bending deformation.
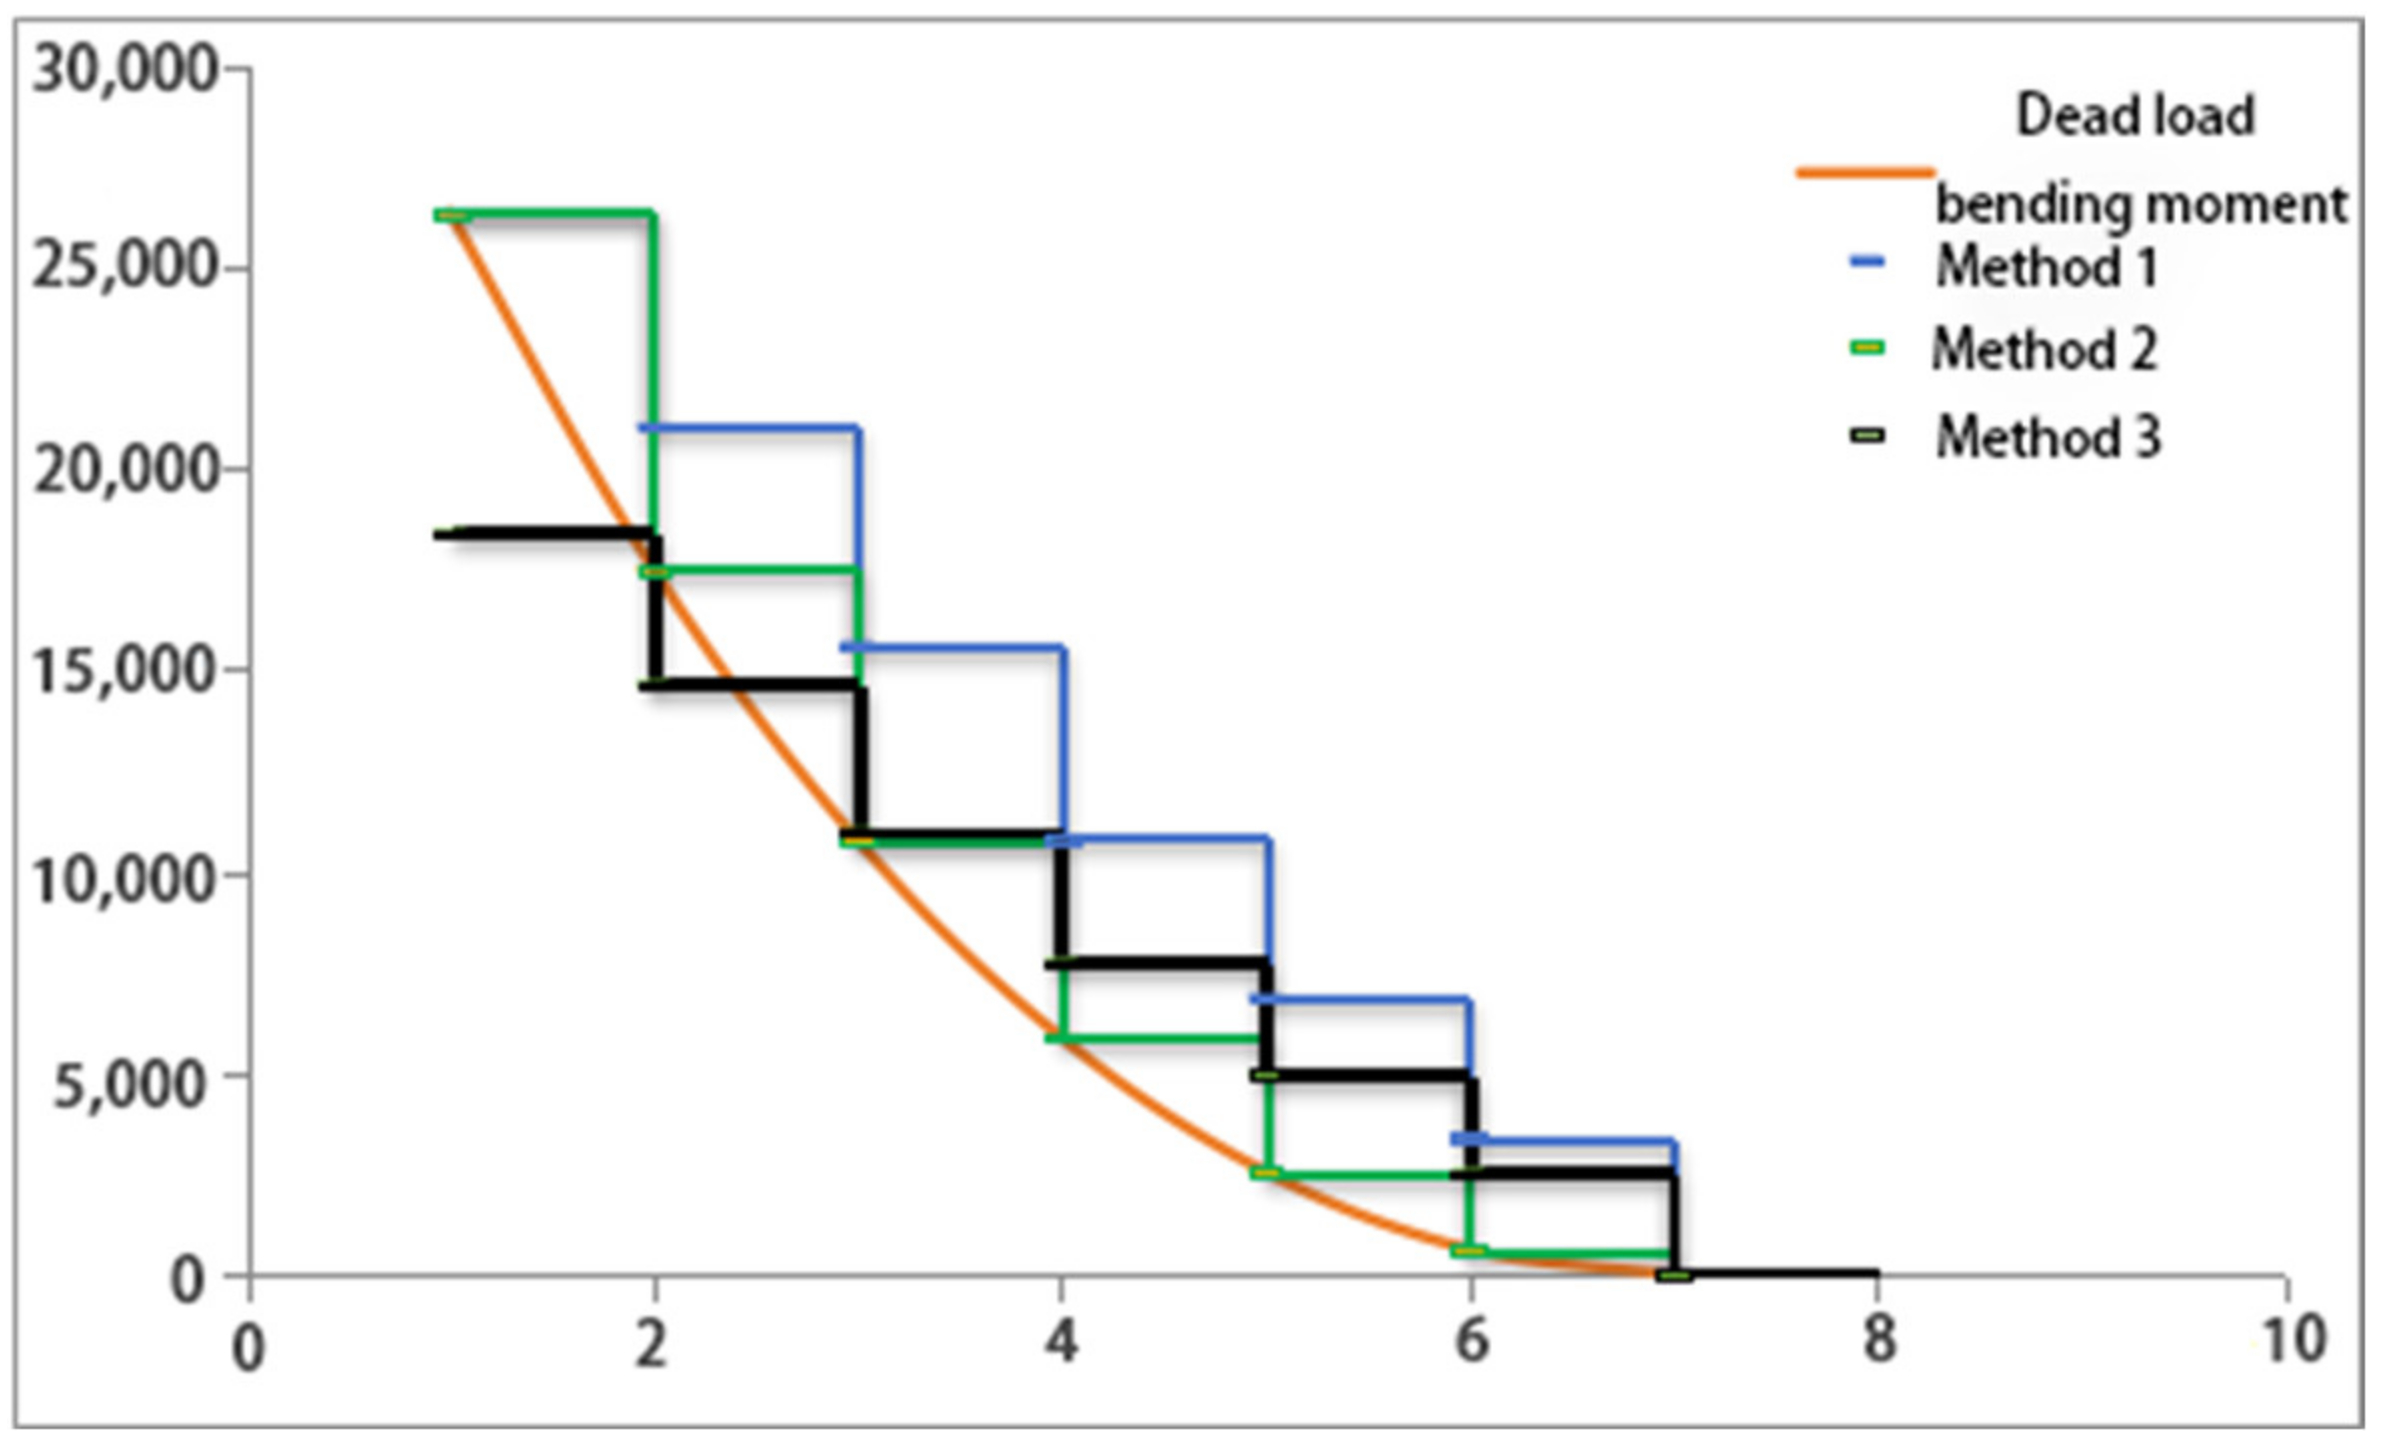
(4) Comparative analysis: The cumulative bending moment and displacement results from Methods 1, 2, and 3 are illustrated in the bending moment envelope diagram in Figure 8 and the cumulative displacement diagram in Figure 9.
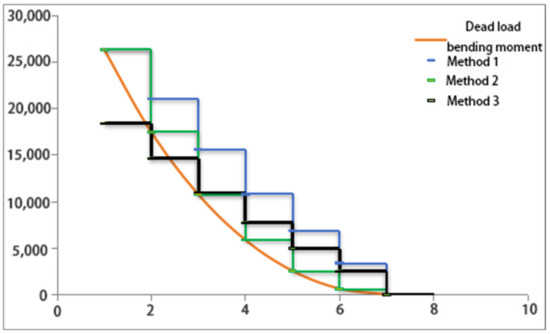
Figure 8.
Maximum cantilever moment envelope diagram. Note: horizontal axis: node number vertical axis: bending moment (Mpa).

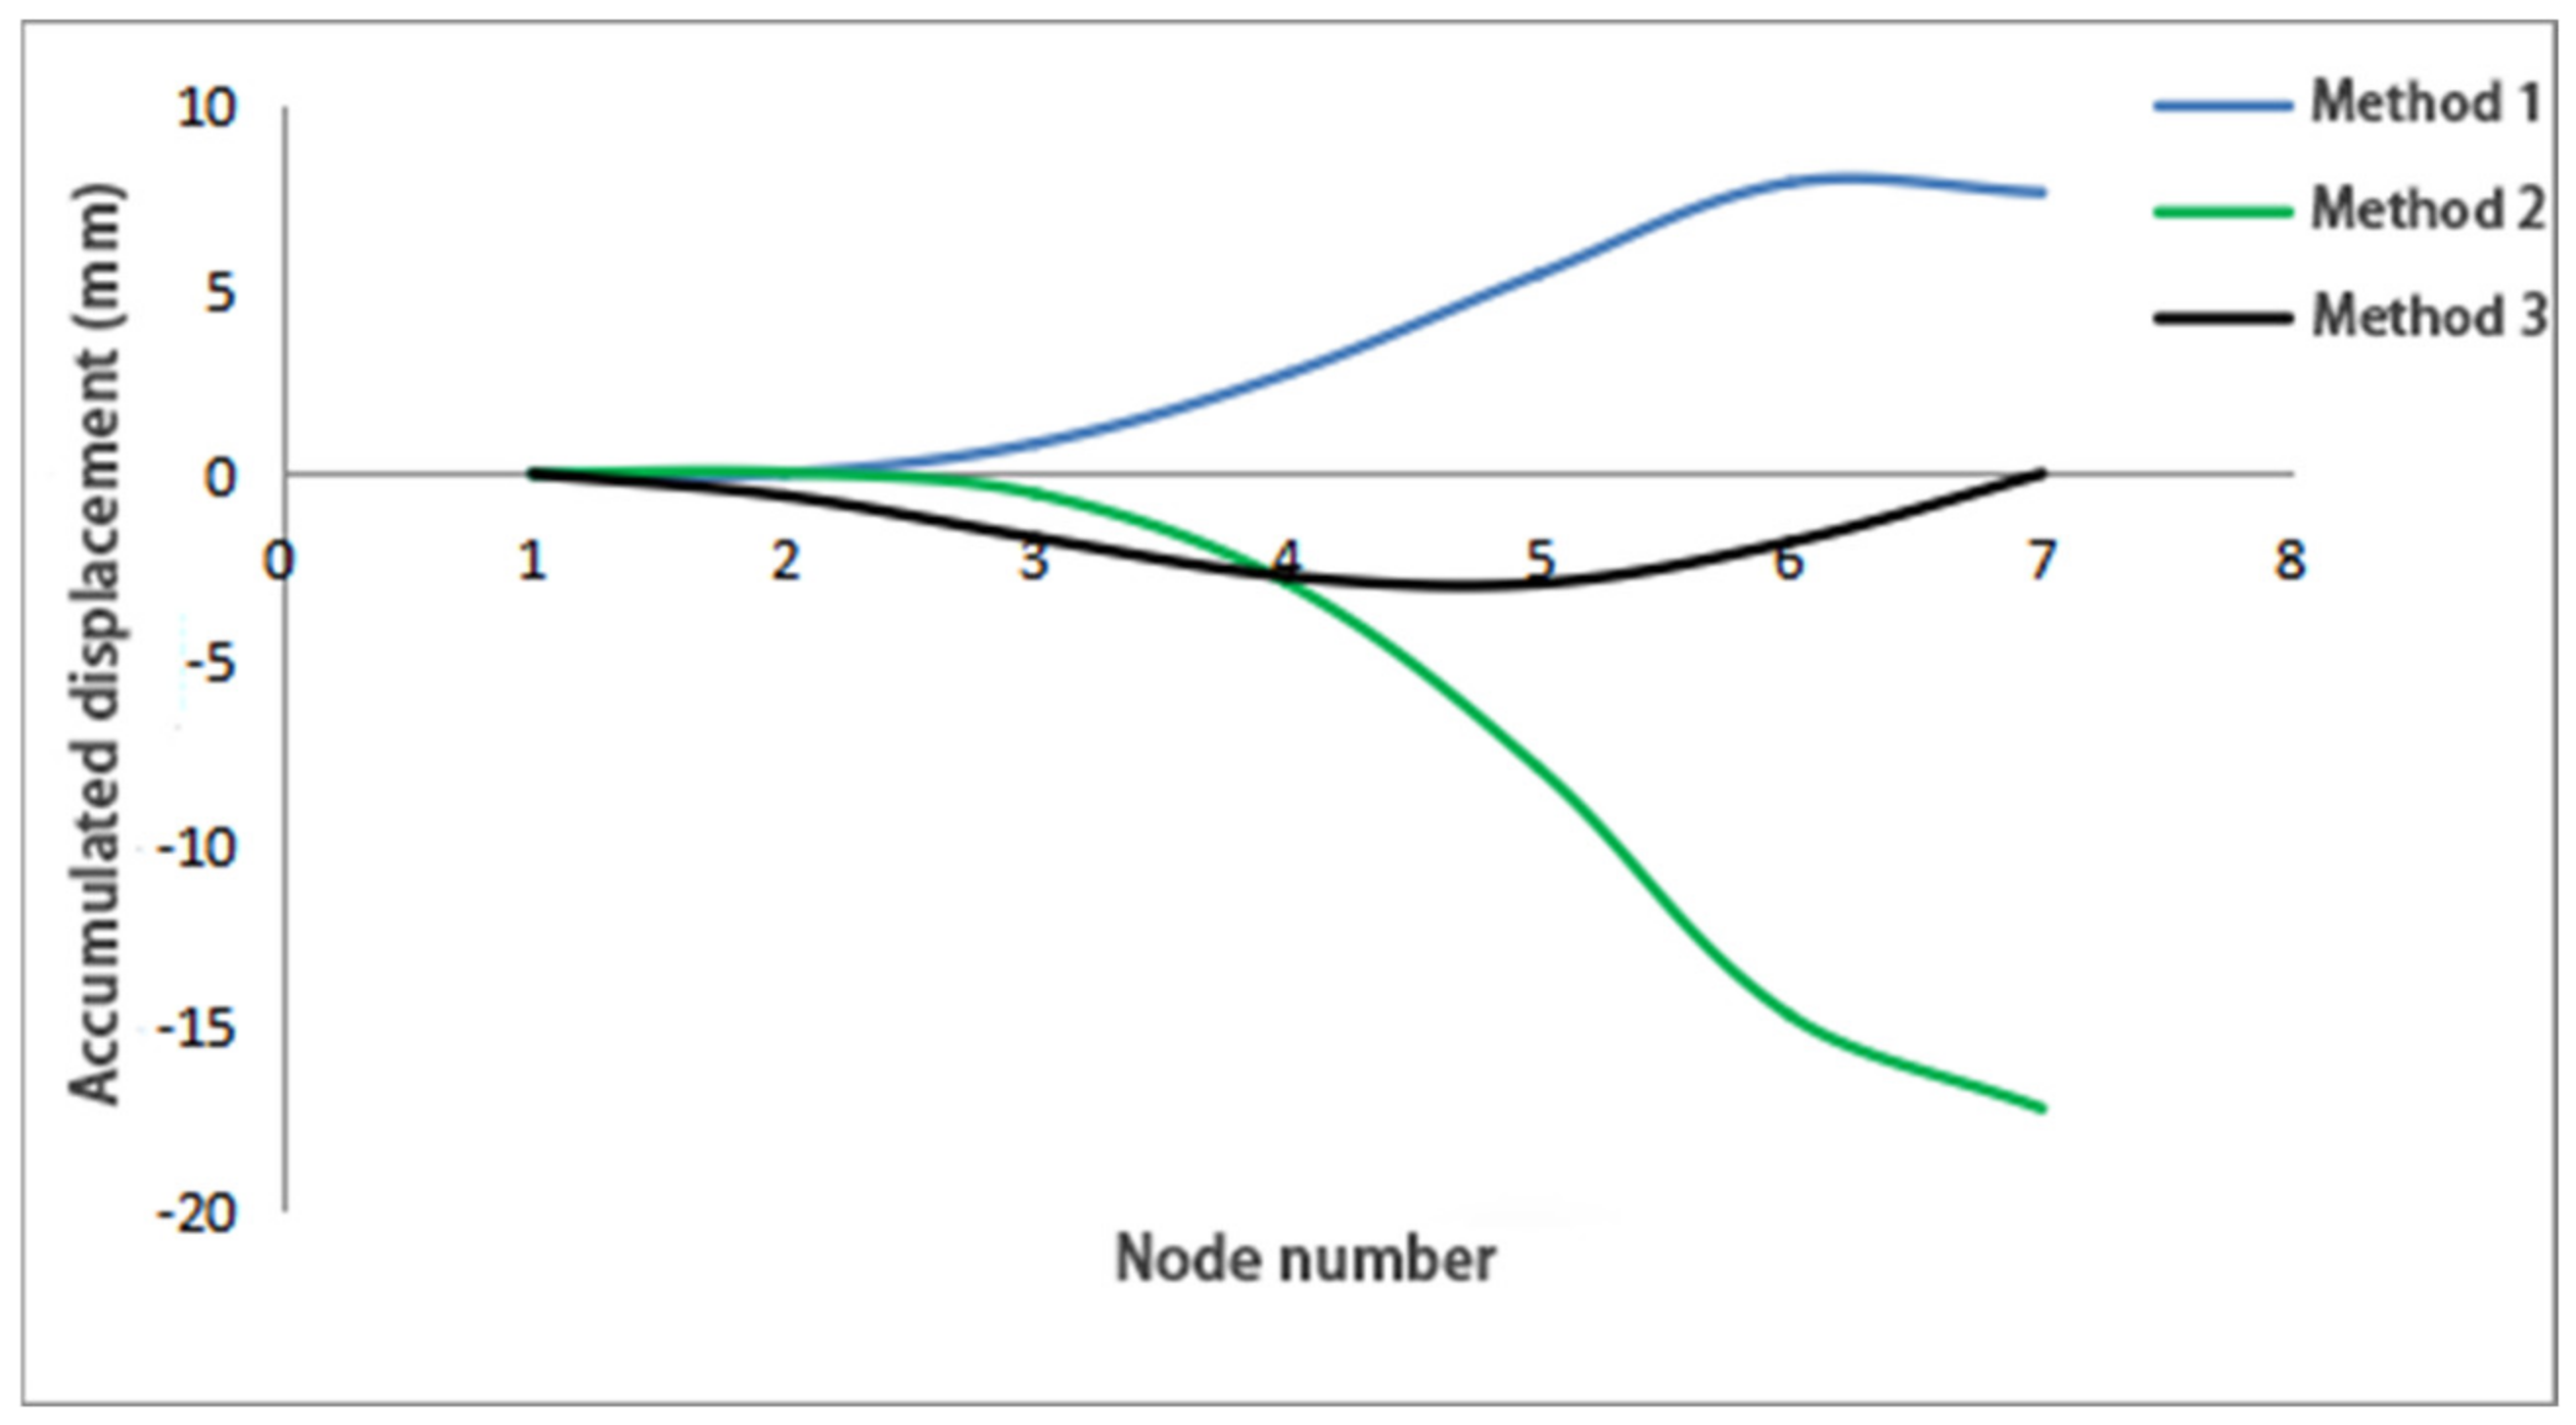
Figure 9.
Maximum cantilever cumulative displacement map.
Due to the negative bending moment at the root of the beam in the maximum cantilever state when using the zero deflection method in Method 3, the prestressing bending moment is insufficient to counterbalance the self-weight bending moment when only considering displacement. This reinforcement approach is deemed impractical. Comparing beam arrangement Methods 1 and 2 proposed by the constant load and zero bending moment theory reveals that Method 1 generally results in a “large cantilever beam arrangement”, while Method 2 leads to a “small cantilever beam arrangement”. Figure 8 illustrates that in the maximum cantilever state, the prestressed tendons of Method 1 exhibit significantly higher bending moments compared to Method 2 after compensating for self-weight bending moments. Additionally, Figure 9 shows that in the maximum cantilever state, Method 1 achieves a cumulative displacement of 7.6 mm, whereas Method 2 records a displacement of −16.6 mm. The superior deflection control effect of Method 1 indicates its suitability for initial top plate tendon configuration. Therefore, the “large cantilever beam arrangement and small cantilever beam arrangement” concept not only ensures balance between prestressed and self-weight bending moments during cantilever construction but also enhances deflection control.
4. Engineering Case Calculation
4.1. Engineering Overview of Bridge A
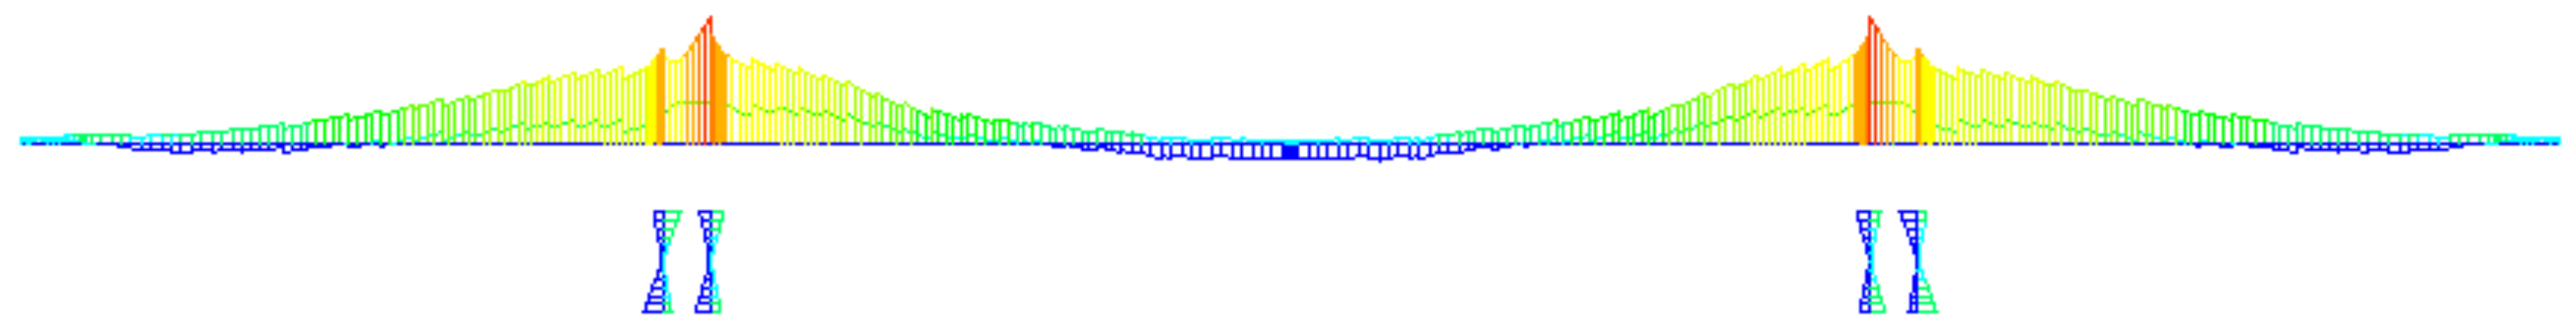
Bridge A is a continuous rigid frame with a total span of 3166 cm, comprising sections of 83 cm, 150 cm, and 83 cm. It features a half width of 22.63 m. The main beam section consists of a single box double chamber, with a box chamber width of 13.65 m and a cantilever flange plate width of 4.49 m. The root beam height of the box girder measures 8.50 m, while the midspan section beam height is 3.00 m. Both the height of the box girder and the thickness of the bottom plate vary according to a parabolic curve, with a multiplier of 1.8. The bottom plate thickness ranges from 30 cm at the midspan to 100 cm at the root of the box girder. The model is depicted in Figure 10.
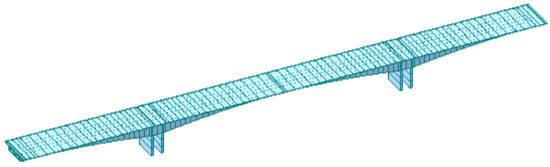
Figure 10.
Finite element model of bridge A.
4.2. Calculation of Initial Beam Arrangement for the Top Plate
For the engineering example in this article, the load balance coefficient values are shown in Table 3.
Table 3.
The value of load balance coefficient for engineering examples.
Based on the comparative analysis conducted in Section 2 regarding the initial layout plan of the top plate bundle, employing Formula (4) for the cantilever construction of continuous rigid frame bridges appears to be the more reasonable approach:
In the formula, is the bulk density of concrete; is the expression for cross-sectional area; represent the height of the section; is the distance between the centroid of the cross-section and the upper edge of the cross-section; is the thickness of the steel reinforcement protective layer.
The established finite element model applies the first and second phase permanent loads of the bridge at different construction stages. The first phase load is incorporated during the cantilever construction process, while the second phase load arises post-system transformation, both being permanent loads. Due to the bridge’s symmetrical structure and space limitations, this study only offers preliminary reinforcement for half of the span. Table 4 illustrates the negative bending moment induced by the dead load on the pier top.
Table 4.
The negative bending moment of each segment’s dead load on the pier top.
The pier top section beam stands at a height of 8.5 m, with a distance of 4.14 m between the section center and the upper edge. The pre-stressed beam of the top plate is arranged in two layers, mirroring the original design. The upper steel beam sits at a distance of 0.15 m from the upper edge, while the layers are spaced 0.16 m apart. The positioning of each top plate beam aligns with the original design. By utilizing Table 4 and Formula (4), the effective prestress required for pouring each section can be computed, as shown in Table 5.
Table 5.
Effective prestress of each section.
During the cantilever construction of large-span reinforced concrete continuous rigid frame bridges, the prestressed tendons listed in Table 5 effectively counteract the negative bending moment at each beam segment’s root. Historically, the quantity of traditional prestressed tendons in each segment has been uniform for construction ease. However, Chapter Four suggests a strategy of “more beams for large cantilevers and fewer beams for small cantilevers” for both construction convenience and optimal bridge completion. Consequently, this study divides the beam arrangement in this engineering example into three groups. For a more convenient explanation of the method of grouping steel strands, it is assumed that the number of prestressed steel strands required to be configured in section i is , and at the same time:
The grouping is as follows: strands 1 to 6 belong to the first group, strands 7 to 12 form the second group, and strands 13 to 18 constitute the third group. Table 6 presents the grouping of steel strands, derived from combining Formulas (9) and (10).
Table 6.
Grouping table of beam steel bundles.
4.3. Comparative Analysis of Bundle Matching Results
4.3.1. Rationality of Bending Moment Distribution
The original model and the calculation model in this paper underwent separate computations using Midas/Civil. Following the guidelines outlined in the “General Code for Design of Highway Bridges and Culverts” (JTG D60-2004), load combinations were applied to generate the bending moment envelope diagram under various load conditions within the normal service limit state.
Comparison of Figure 11 and Figure 12 reveals that the bending moment envelope diagram presented in this paper aligns more closely with the expected internal force distribution of the completed bridge. It demonstrates a larger positive bending moment reserved at the beam’s root and a larger negative bending moment at the mid-span. Consequently, the prestressed tendons proposed in this article appear to be more logically designed.
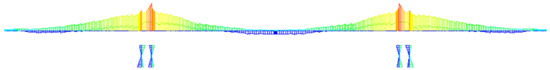
Figure 11.
The envelope diagram of the bending moment at the limit state of normal use in the original design.

Figure 12.
This article designs a bending moment envelope diagram for the limit state of normal use.
4.3.2. Rationality of Stress Distribution
The stress distribution of the pier top section and mid span section in this article’s design calculation and the original design calculation are shown in Table 7 below.
Table 7.
Stress comparison between the cross-section of the support point (pier top box beam) and the mid span section.
As per Table 7, stress levels at the upper edge and support point section of the original bridge design after ten years are lower than those at the lower edge. Conversely, ten years later, stress at the upper edge and support point slightly exceeds that at the lower edge, exhibiting a uniform stress gradient. Additionally, stress at the upper edge of the mid-span section is lower than that at the lower edge. Overall, the design presented in this article aligns more closely with the anticipated state of completion for prestressed concrete bridges.
4.3.3. Rationality of Linear
The calculation results from Midas/Civil for both the original model and the model proposed in this paper are utilized to extract and summarize the mid-span deflection data in Table 8 for comparative analysis.
Table 8.
Comparison table of mid span deflection.
Table 8 illustrates that the deformation and creep deformation of the bridge, as induced by the reinforcement method proposed in this article, are significantly smaller compared to those of the original design. Thus, the approach presented in this study effectively reduces long-term deflection in later stages.
5. Conclusions
This study analyzes the internal forces and deformation states in the design process of large-span prestressed concrete continuous rigid frame bridges, focusing on optimizing the top plate prestressed reinforcement design. The following conclusions emerge:
- (1)
- The prestressed reinforcement significantly influences the bridge’s final state. Thus, ensuring that the prestressed resistance moment exceeds the constant load moment is crucial for minimizing long-term deflection.
- (2)
- Three methods for the initial configuration of top plate tendons are proposed based on the theory of constant load and zero bending moment. Comparative analysis reveals that method one, featuring a combination of “large” and “small” cantilever sections, effectively balances internal forces and controls deflection.
- (3)
- The feasibility of the proposed optimization bundle design method is demonstrated through an engineering example.
- (4)
- Comparative analysis between this article’s reinforcement design and the original design showcases the clear benefits of the proposed approach, particularly in terms of internal force distribution, stress distribution, and linear variation, all contributing significantly to reducing long-term deflection in large-span prestressed concrete continuous rigid frame bridges.
Author Contributions
Formal analysis, X.L. and X.Z.; Investigation, L.G.; Writing—original draft, F.L.; Writing—review & editing, H.F.; Visualization, N.M.; Validation, N.M.; Supervision, Z.G. and X.Z. All authors have read and agreed to the published version of the manuscript.
Funding
This study is funded by the Guangdong Provincial Basic and Applied Basic Research Fund, funding number: 2021A1515012405. This study did not receive APC funding.
Data Availability Statement
Data generated or analyzed during this study are provided in full within the published article.
Conflicts of Interest
Authors Fanggang Liu, and Haishan Fu are employed by the company Guangzhou Highway Co., Ltd. Author. The remaining authors declare that the research was conducted in the absence of any commercial or financial relationships that could be construed as a potential conflict of interest.
References
- Li, B.; Yan, G. Main factors affecting mid span deflection of large-span continuous rigid frame bridges. Railw. Archit. 2008, 11, 1–3. (In Chinese) [Google Scholar]
- Wang, M.; Wen, J.; Shen, C. Research on prestress loss caused by diseased bridges. J. Wuhan Univ. Technol. (Transp. Sci. Eng. Ed.) 2006, 30, 103–105. (In Chinese) [Google Scholar]
- Alwjs, W.A.M.; Olorunniwo, A.; Ang, K.K. Long-Term Deflection of RC Beams. J. Struct. Eng. 1994, 120, 2220–2226. [Google Scholar] [CrossRef]
- Birhane, F.N.; Kim, S.I.; Jang, S.Y. Long-Term Deflection of Prestressed Concrete Bridge Considering Nonuniform Shrinkage and Crack Propagation by Equivalent Load Approach. Appl. Sci. 2020, 10, 7754. [Google Scholar] [CrossRef]
- Shariq, M.; Prasad, J.; Abbas, H. Long-term deflection of RC beams containing GGBFS. Mag. Concr. Res. 2013, 65, 1441–1462. [Google Scholar] [CrossRef]
- Utrilla, M.A.; Samartín, A. Optimized design of the prestress in continuous bridge decks. Comput. Struct. 1997, 64, 719–728. [Google Scholar] [CrossRef]
- Robertson, I.N. Prediction of vertical deflections for a long-span prestressed concrete bridge structure. Eng. Struct. 2005, 27, 1820–1827. [Google Scholar] [CrossRef]
- Kilpatrick, A.E.; Gilbert, R.I. Simplified calculation of the long-term deflection of reinforced concrete flexural members. Aust. J. Struct. Eng. 2018, 19, 34–43. [Google Scholar] [CrossRef]
- Vakhshouri, B.; Nejadi, S. Limitations and uncertainties in the long-term deflection calculation of concrete structures. Vulnerability Uncertain. Risk: Quantif. Mitig. Manag. 2014, 535–546. [Google Scholar] [CrossRef]
- Eom, T.S.; Kim, J.Y.; Choi, S.M.; Jang, D.W. Prediction of Long-Term Deflections of Cracked Reinforced Concrete Flexural Members under Service Loading. J. Thearchitectural Inst. Korea Struct. Constr. 2011, 27, 21–29. [Google Scholar]
- Ha, L.J. Prediction of Long-term Deflection of Prestressed Concrete Bridges Considering Various Construction Processes and Girder Section Characteristics. J. Korean Soc. Hazard Mitig. 2019, 19, 25–33. [Google Scholar]
- Sousa, H.; Mitoulis, S.A.; Psarras, K.; Tegos, I.A. Control of long-term deflections of RC beams using reinforcements and low-shrinkage concrete. Proc. Inst. Civ. Eng.-Bridge Eng. 2020, 173, 63–77. [Google Scholar] [CrossRef]
- Gross, S.P.; Walkup, S.L.; Musselman, E.S.; Stefanski, D.J. Influence of Gross-to-Cracked Section Moment of Inertia Ratio on Long-Term Deflections in GFRP-Reinforced Concrete Members. J. Compos. Constr. 2018, 22, 04018059. [Google Scholar] [CrossRef]
- Ngo, D.; Scordelis, A.C. Finite element analysis of reinforced concrete beams. J. Am. Concr. Inst. 1967, 64, 152–163. [Google Scholar]
- Thomas, J.; Ramaswamy, A. Finite element analysis of shear critical prestressed SFRC beams. Comput. Concr. 2006, 3, 65–77. [Google Scholar] [CrossRef]
- Vrablik, L.; Kristek, V. An analysis of long time deflection of long span prestressedconcretebridges. In Bridge Maintenance, Safety, Management and Life-Cycle Optimization, Proceedings of the 5th Internationgal Conference on Bridge Maintenance, Safety and Management, Philadelphia, PA, USA, 11–15 July 2010; CRC Press: Boca Raton, FL, USA, 2010; pp. 1479–1481. [Google Scholar]
- Pan, Z.; Fu, C.C.; Lu, Z. Impact of longitudinal tendons on long-term deflectiongs of Long-span concrete cantilever bridges. In Bridge Maintenance, Safety, Management and Life-Cycle Optimization, Proceedings of the 5th International Conference on Bridge Maintenance, Safety and Management, Philadelphia, PA, USA, 11–15 July 2010; CRC Press: Boca Raton, FL, USA, 2010; pp. 2319–2324. [Google Scholar]
- Kristek, V.; Kohoutkova, A. Excessive deflections of concrete bridges affect safety, maintenance and management. In Advances in Bridge Maintenance, Safety Management, and Life-Cycle Performance, Set of Book & CD-ROM, Proceedings of the 3rd International Conference on Bridge Maintenance, Safety and Management-Bridge Maintenance, Safety, Management, Life-Cycle Performance and Cost, Porto, Portugal, 16–19 July 2006; CRC Press: Boca Raton, FL, USA, 2006; pp. 355–356. [Google Scholar]
- Wang, F.; Shi, X. Long term deflection control research on large-span prestressed concrete bridges. Highway 2006, 72–76. (In Chinese) [Google Scholar]
- Fan, L. Pre Stressed Concrete Continuous Beam; People’s Transportation Press: Beijing, China, 1988. (In Chinese) [Google Scholar]
- Xiang, H. Advanced Bridge Structure Theory; People’s Transportation Press: Beijing, China, 2013. (In Chinese) [Google Scholar]
- Chen, H. Long Term Deflection Analysis of Long-Span PC Continuous Rigid Frame Bridges; South China University of Technology: Guangzhou, China, 2011. (In Chinese) [Google Scholar]
- Zhang, S. Design Principles of Reinforced Concrete and Prestressed Concrete Bridge Structures; People’s Transportation Press: Beijing, China, 2004. (In Chinese) [Google Scholar]


Disclaimer/Publisher’s Note: The statements, opinions and data contained in all publications are solely those of the individual author(s) and contributor(s) and not of MDPI and/or the editor(s). MDPI and/or the editor(s) disclaim responsibility for any injury to people or property resulting from any ideas, methods, instructions or products referred to in the content. |
© 2024 by the authors. Licensee MDPI, Basel, Switzerland. This article is an open access article distributed under the terms and conditions of the Creative Commons Attribution (CC BY) license (https://creativecommons.org/licenses/by/4.0/).