Article

Effectiveness of the Concrete Equivalent Mortar Method for the Prediction of Fresh and Hardened Properties of Concrete

Civil Engineering Mechanics and Materials Laboratory (L2MGC), CY Cergy-Paris University, 95031 Neuville-sur-Oise, France
*
Author to whom correspondence should be addressed.
Buildings 2024, 14(6), 1610; https://doi.org/10.3390/buildings14061610
Submission received: 2 March 2024 / Revised: 26 May 2024 / Accepted: 28 May 2024 / Published: 1 June 2024
(This article belongs to the Special Issue Innovative Solutions towards Sustainable Precast Concrete Products)

Abstract

:
Modern concrete mix design is a complex process involving superplasticisers, fine powders, and fibres, requiring time and energy due to the high number of trial tests needed to achieve rheological properties in the fresh state. Concrete batching involves the extensive use of materials, time, and the testing of chemical admixtures, with various methodologies proposed. Therefore, in some instances, the required design properties (physical and mechanical) are not achieved, leading to the loss of resources. The concrete equivalent mortar (CEM) method was introduced to anticipate concrete behaviour at fresh and hardened states. Moreover, the CEM method saves time and costs by replacing coarse aggregates with an equivalent sand mass, resulting in an equivalent specific surface area at the mortar scale. This study aims to evaluate the performance of fibre in CEM and concrete and determine the relationships between the CEM and the concrete in fresh and hardened states. Steel and polypropylene fibres were used to design three series of mixtures (CEM and concrete): normal-strength concrete (NSC), high-strength concrete (HSC), high-strength concrete with fly ash (HSCFA), and equivalent normal-strength mortar (NSM), high-strength mortar (HSM), and high-strength mortar with fly ash (HSMFA). This study used three-point bending tests and digital image correlation to evaluate load and crack mouth opening displacement (CMOD) curves. An analytical mode I crack propagation model was developed using a tri-linear stress–crack opening relationship. Post-cracking parameters were optimised using inverse analysis and compared to actual MC2010 characteristic values. The concrete slump is approximately half of the CEM flow; its compressive strength ranges between 78% and 82% of CEM strength, while its flexural strength is 60% of CEM strength. The post-cracking behaviour showed a significant difference attributed to the presence of aggregates in concrete. The fracture energy of concrete is 28.6% of the CEM fracture energy, while the critical crack opening of the concrete is 60% of that of the CEM.

1. Introduction

Concrete’s availability, affordability, and versatility make it a popular building material. However, it has limitations like brittleness and cracking [1]. With global resource depletion, high-strength concrete (HSC) is a viable solution [2]. HSC increases strength compared to normal-strength concrete NSC, reducing the structural load and allowing for more innovative architectural designs. However, its brittleness increases with its compressive strength enhancement [3]. Therefore, resource preservation strategies are vital in modern construction projects. Concrete has a major mechanical drawback due to its limited tensile strength and absence of ductile properties. In some design procedures, its tensile strength is negligible. The failure of concrete under tension is attributed to micro-cracking at the interface between cement and aggregates, and the ability of these cracks to propagate under tensile loads explains its weakness [3]. In recent years, fibre-reinforced concrete (FRC), comprising both normal-strength (NSC-FRC) and ultra-high-performance fibre-reinforced concrete (UHP-FRC), has gained traction across various structural applications, such as high-rise buildings, long-span bridge girders, critical structures, and the repair or reinforcement of existing infrastructure [4,5,6]. Fibre composites are being developed to improve the mechanical properties of brittle materials with limited post-cracking ductility [7,8,9,10]. The process depends on factors like the fibre type, aspect ratio, strength, surface bonding characteristics, content, orientation, and strength of the cementitious matrix. Fibres can be incorporated into various types, including steel, glass, polypropylene, and natural fibres [9,10]. For instance, adding a 2% steel fibre volume fraction with a blast furnace slag can increase compressive strength by up to 30% and peak flexural strength by 49% [11]. Additionally, steel fibres can improve flexural toughness by 26.36% and 57.79% and compressive strength by 13.26% [12]. They also enhance the strength properties of concrete, including the compression, tensile, and flexure strengths [13]. Steel fibres can increase concrete’s compressive strength by up to 25%. A 1% volume fraction enhances compressive and flexural strength by 10% and 80%, respectively. They outperform polypropylene fibres in improving the compressive strength (10–12%) and flexural strength (51–66%) of both normal- and high-strength concretes [13]. Researchers found that adding polypropylene fibres to concrete increases splitting tensile strength by 20–50%. Fibres also enhance post-peak performance, ductility, and residual flexural tensile strength. The optimal dosage is 1%. Adding 4 kg/m3 and 6 kg/m3 fibres improves splitting tensile strength by 28.7% and 41.9%, respectively, and improves post-cracking properties [14]. Polypropylene fibres with varying contents also enhance the fracture behaviour of self-compacting concrete [13].
Adding micro- or macro-fibres to conventional concrete produces fibre-reinforced concrete (FRC), which addresses the brittle failure and poor toughness inherent in conventional concrete. This contribution of the fibre improves mechanical properties, such as increased strength, flexibility, and toughness [15]. Fibre-reinforced concrete (FRC) has gained popularity for its ability to address traditional concrete’s brittleness and cracking issues. However, while there is extensive research on the mechanical properties of FRC, particularly focusing on parameters like compressive strength, splitting tensile strength, and flexural strength, there is a lack of emphasis on post-cracking properties, which are crucial for structural performance. This research aims to bridge this gap by examining the fracture properties of concrete with and without fibres, specifically focusing on the role of fibres in enhancing post-cracking behaviour. UHP-FRC, a type of ultra-high-performance concrete reinforced with fibres, has varying properties depending on the type of fibre, ranging from micro-fibres with diameters below 0.2 mm to macro-fibres exceeding 0.25 mm. Using micro-fibres, UHPC promotes synergistic interactions between the fibre, matrix, and interface, resulting in significant tensile ductility through the development of fine cracks [15]. Various standards and studies explain and classify UHP-FRC based on its compressive strength, including standards such as those established by the Association Française de Génie Civil (AFGC) [16] and BS EN 206-1 [17]. Akça and İpek [18] investigated various factors affecting the properties of UHPC for precast applications, finding that standard water curing increased the compressive strength by 11.2% and flexural tensile strength by 19%, hybrid fibres improved the compressive strength by 16.7% and flexural tensile strength by 48%, and different aggregate types significantly influenced the flexural tensile strength, ultimately. The study found that an increased fly ash content in cementitious materials prolongs the hydration process, enhances cement hydration, and positively impacts the interfacial transition zone of UHPC [19].
Fly ash offers three main benefits to concrete: a pozzolanic effect, micro aggregate effect, and morphological effect. The pozzolanic effect activates AI2O3 and SiO2, increasing gel hydration, strengthening concrete capillaries, and enhancing density. Mineral additives in concrete mixtures have gained importance due to their economic properties and concerns about greenhouse gas emissions (GHG). Unfortunately, the cement industry is one of the major contributors to GHG emissions, accounting for approximately 7% of global CO2 emissions [20,21]. Using mineral additives, particularly fly ash (FA), as a substitute for cement is crucial for environmental sustainability, as it is the most commonly used raw material in industrial waste. Research by Golewski and Buragohain et al. [21,22] suggests that the spherical and glassy grains of FA produce a “ball bearing” effect, enhancing the workability of the mixture and reducing its water requirement by 5–15%. When incorporated into cementitious materials, fly ash improves the long-term compressive strength and durability, with its effectiveness influenced by factors like the particle size, fineness, and CaO content [23]. When added to cementitious materials, FA improves the microstructure of cementitious materials through its pozzolanic action [24].
The testing of engineering materials, including cement–matrix composites, has long been based on fracture mechanics parameters. The strength of a material is typically determined by its weakest point, often an initial crack that can propagate at loads below the material’s capacity, leading to eventual structural failure. While traditional strength parameters such as compressive strength tests are commonly used to assess concrete quality, research suggests that concrete strength is closely linked to initial crack initiation and subsequent microcrack propagation, ultimately leading to structural deterioration and failure due to the stress concentration and spatial cracking [25].
From 2010 to 2023, there has been a steady increase in studies on fibre-reinforced concrete-based composite materials, with 20,183 indexed documents, according to Scopus records and the reviewed study conducted [26]. Most studies focus on classical mechanical characteristics, comparing the compressive strength, splitting tensile strength, flexural strength, and modulus of elasticity, with only 11% examining post-cracking properties. Steel fibre is the most used, followed by glass, basalt, and polypropylene fibres. More scientific papers on the fracture properties of concretes with and without fibre are needed due to the need for specialised materials like clip gauges. Measuring the displacement or deformation of structural elements or materials under external loads is crucial in various engineering applications. These strain measurements help identify potential strength issues in the structural components [27]. The traditional strain measurement instruments commonly employed as point-wise sensors (PWS), such as strain gauges and LVDTs, need to improve the quality of information collected, i.e., data accuracy and reproducibility, and cannot provide strain maps. Furthermore, the set-up test requires more time and precision. However, the Digital Image Correlation (DIC) technique, which falls under optical, non-interferometric methods, allows for full-field strain measurements and is less time-consuming. This method determines deformations by comparing images of the object’s surface before and after deformation. The primary aim of this study is to evaluate the performance of the fibre in a concrete equivalent mortar (CEM) and concrete and compare the properties at fresh and hardened states. Moreover, it confirms the validity of the DIC technique used to describe the flexural behaviour of materials up to fracture. The Digital Image Correlation (DIC) method is an optical technique that allows for the non-contact measurement of displacement and deformation in structural components or materials subjected to external loading [28]. Traditional testing methodologies for concrete, such as point-wise sensors (PWS), have limitations in providing full-field strain measurements and may require more time and precision. The Digital Image Correlation (DIC) technique is a promising alternative for non-contact displacement and deformation measurement, offering advantages such as full-field strain measurements and reduced testing times. However, this technique must be validated in describing the flexural behaviour of materials up to fracture. This research aims to validate the use of the DIC technique and establish its applicability in evaluating the performance of fibres in concrete and CEM.
Concrete batching involves the extensive testing of chemical admixtures, with various methodologies proposed. The concrete-equivalent-mortar (CEM) method is introduced to anticipate concrete behaviour across various fluidity levels [29]. The CEM method accurately predicts the effect of the admixture type and dosage on concrete rheological behaviour. It includes a specific amount of sand in the mortar blend, equivalent to the surface area of coarse aggregates exceeding 5 mm. The method accurately calculates the yield stress and apparent viscosity at the fresh state [30]. The CEM method is introduced as a time-saving and cost-effective approach to predicting concrete behaviour based on mortar properties. However, while the method accurately predicts rheological behaviour in the fresh state, there is limited information on its performance and correlation with concrete properties in the hardened state. Therefore, there is a gap in understanding the long-term effects and reliability of the CEM method, which this research aims to fill by evaluating the performance of fibres in CEM and concrete and establishing relationships between CEM and concrete properties at fresh and hardened states.

2. Materials and Methods

2.1. Raw Materials

A CEM I 52.5 N CE CP2 NF produced by Eqiom company, Argiesans, France, has been used for all the experimental work of this study. The cement has a Blaine surface area and specific density of 3950 cm2/g and 3.11 g/cm3, respectively. Class F fly ash manufactured by SYCTOM company, Paris, France, was also used during the experiments, with a Blaine surface area and specific density of 4654 cm2/g and 2.11 g/cm3, respectively. The average particle size of the Class F fly ash is 7.32 um.
This study used Sika 5930 L by Sika company, Paris, France, a discrete superplasticiser with a 35% solids content. According to EN 934-2 [31], this superplasticiser is approved as a water-reducing additive. This study utilised copper-coated smooth micro-steel fibres supplied by Bekaert company, Paris, France. These fibres are 13 mm long, have a diameter of 0.2 mm, and have an average tensile strength of 2850 MPa. The ratio of the length to the diameter (l/d) of the fibre, known as the aspect ratio, is 65, making them suitable for high-strength concrete applications (Figure 1a). Copper-coated smooth micro-steel fibres were adopted due to the relatively small size of the mortar. Prismatic CEM specimens were cast, 40 × 40 × 160 mm in size. The 13 mm fibre length was chosen to enhance the micro-cracking resistance and material homogeneity. Additionally, sika fibre force 54, a polypropylene fibre with an aspect ratio of 158.8, by Sika company, France, was incorporated for further reinforcement. This fibre possesses a density of 0.92 g/cm3, a tensile strength of 689 MPa, and an elastic modulus of 5.57 GPa (Figure 1b).
The study employed 0–4 mm washed semi-crushed sand and 4–10 mm limestone gravel for the mixing operations. The sieving process adhered to the standard NF EN 933-1:1996 [32]. Figure 2 illustrates the particle size distribution. Table 1 summarises the physical properties of the aggregates, which were measured according to the standard NF EN 1097-6 [33].
Using the compressible packing model developed at “Laboratoire central des ponts et chaussées” (LCPC) in France, this model makes it possible to predict the real packing density of a mixture of several granular classes from the knowledge of the compactness of each one-dimensional class and the energy of the set-up. The optimum gravel-to-sand ratio (G/S) was obtained as 1.22. The binary granular mixture comprises 45% sand and 55% gravel. To confirm the results obtained, the granular binary mixture was optimised using the Fuller curve given in Equation (1), and the results were compared.
P i % d i D m a x n × 100
Pi is the passing percentage of the granular class; di is the particle size of the granular class; Dmax is the maximum aggregate size; i is the granular class; and n is recommended as equal to 0.5 for binary mixtures of gravel and sand. Indeed, the theoretical mixture was composed of particle size distributions of sand and gravel using Equation (2).
P i % = α d s , i + β d g , i
The parameters above were found using Excel’s solver, which minimised the differences between the binary mixtures and Fuller’s curves, where ds,i is the size of the sand fraction and di,g is the size of the gravel fraction. At the same time, α and β are parameters to be found numerically. The alpha and beta are 45% and 55%, respectively, defining the same ratios found using the compactness method (Figure 2).

2.2. Mix Design Method

Three types of concrete were developed in this work: Normal-Strength Concrete (NSC), High-Strength Concrete (HSC), and High-Strength Concrete with Fly Ash (HSCFA). The concretes were designed for an environmental exposure class XC4 (Cyclic wet and dry) following the standard NF EN 206-1 [17]. For this class, which is relatively close to the environment’s surrounding structures in Nigeria, the minimum equivalent binder content is 330 kg/m3, and the maximum water-to-binder ratio is 0.5. Moreover, the minimum strength class is C30/37. The target class of workability is S4, where the slump is between 160 and 210 mm. For normal-strength concrete (NSC), the cement content was equal to 380 kg/m3. For high-strength concrete (HSC), the cement content was chosen to equal 500 kg/m3, and the minimum strength class is C50/60 based on EN 206-1 guidelines. The binder for the mixture of HSCFA was composed of 475 kg/m3 of cement and 50 kg/m3 of fly ash. The water-to-cement ratio (W/C) was equal to 0.5 for NSC and 0.3 for HSC and HSCFA based on flowability tests on the cement paste tests.
The proportions of mixture constituents must be calculated by volume to obtain one cubic meter, dividing mass by density. Reference concretes were formulated without fibres. Steel fibres (SF) were added to the concrete mixes at two contents, 0.6% and 0.8% by volume. Polypropylene fibre, named long synthetic fibre (LSYNF), was added at two contents, 0.6% and 1.0% by volume. All the concretes developed as part of this work are shown in Figure 3. The type of fibre follows the kind of concrete, and the percentage is the terminology used.
Workability tests were conducted on concrete equivalent mortars (CEM) to simplify the experimental procedures for determining the superplasticiser dosage. The concrete equivalent mortar process involves replacing gravel with sand, resulting in the same surface. Schwartzentruber and Catherine developed this method in the early 2000s and discovered a linear relationship between mortar and concrete workability due to water conservation and the solid component surface. Research studies show that concrete’s vertical slump corresponds to a spread at the mortar scale. The equivalent mortar’s derivation involves determining a developed surface using aggregates, with sand and gravel modeled as perfectly spherically shaped particles to simplify surface and volume calculations. The volume of a granular with diameter di is determined. The total developed surface for all granular classes is the sum of developed surfaces for all granular classes. The analysis shows that the surface produced by the sand is 6.02 m2/kg, while it is only 0.367 m2/kg for the gravel. For example, 1000 kg of gravel can be replaced by (1000 × 0.367)/6.02 = 61 kg. The substitution by mass reduces the volume to one cubic meter, and all quantities must be multiplied by the inverse of the reduced volume to achieve unity.
The mortar’s vertical slump and horizontal flow are measured using a mini cone with dimensions derived from Abram’s cone, with an upper diameter of 50 mm, a lower diameter of 100 mm, and a height of 150 mm (Figure 4). The superplasticiser dosage was gradually increased, and the CEM flow and the corresponding concrete flow were measured for each dosage using a mini cone and Abraham’s cone [29]. The relation between the CEM and concrete flowability was checked for the three concretes of the present work, and the results are plotted in Figure 5. This figure shows that a mean CEM wafer’s diameter of 340 ± 10 mm allows for obtaining concrete of the S4 class of workability [17,35].
The superplasticiser dosages for all concrete mixtures were set based on the flow results obtained on the equivalent concrete mortars (CEM) scale. The correlation between the CEM flow and concrete slump is depicted in Figure 6. As shown, mixing concretes with a workability class of S4 is possible regardless of the concrete by using a superplasticiser dosage that allows for a flow of 340 ± 10 mm on the mortar scale. Although the analytical relationships do not definitively define true values, they provide insight into the concrete slump. The final compositions of CEM and the corresponding concrete are in Table 2 and Table 3, respectively.

2.3. Experimental Tests

The mechanical performance of mortar and concrete mixes was assessed at 28 days using compressive, splitting tensile, and flexural strengths tests. 40 × 40 × 160 mm prismatic specimens were prepared from mortar mixes and cured in water at room temperature (20 °C) for 28 days. In addition, 100 × 100 × 400 mm prisms and 110 × 220 mm cylinders were prepared from concrete mixes.
The flexural test was conducted using an electromechanical Zwick testing machine with a 250 kN load cell with a displacement loading rate of 0.5 mm/min. The press was also used to perform the splitting tensile test with a loading rate of 0.5 MPa/s. A notch equal to one-quarter of the specimen height was made in the centre of the mortar and concrete specimens to control the crack opening. The compressive-strength test on 40 × 40 × 40 mm mortar cubes was conducted using a 3R testing machine with a 1250 kN load cell at a 2.77 kN/s loading rate. The compressive test was conducted on concrete cylinders using a hydraulic servo Schenck press with a 3500 kN capacity and 0.5 MPa/sec loading rate. The static elastic modulus tests were performed on concrete cylindrical specimens using an extensometer with three linear variable differential transducers (LVDTs) coupled to the tested specimen according to the standard EN NF 12390-13 [36]. The test was conducted by performing three loading–unloading cycles between 0.5 MPa and 33% of the cylinder compressive strength at a loading rate of 0.5 MPa/s using a Perrier press with a capacity of 1250 kN.
Flexural specimens were photographed using a Canon-5D Mark IV camera with a 6720 × 4480 pixels resolution and a focal length of 70 mm. The camera was placed 0.48 m from the specimen, supported by a tripod and two direct current lights. A weight was attached for stability. The exposure and parameters remained constant, with the optical axis perpendicular to the specimen’s SOI. The sensor sensitivity was adjusted for photo brightness and noise reduction. Manual settings were maintained (Figure 7). A continuous video was recorded for each tested specimen at 25 fps for DIC research. The film was converted to a photo every two seconds using the free VideoLAN client (VLC) media player, version 3.0.20, and the GOM correlate 2D software, a start free 2019 version, was used to analyse greyscale images, measuring full-field in-plane displacements and strains using tools like virtual extensometers, deviation labels, and distance variation in ascending numerical order. To reduce noise, the images were converted to greyscale using XnViewMP version 2.51.6 [37]. The GOM correlate software analysed greyscale images and measured full-field in-plane displacements and strains using virtual extensometers, deviation labels, and distance variation in ascending numerical order.

3. Results

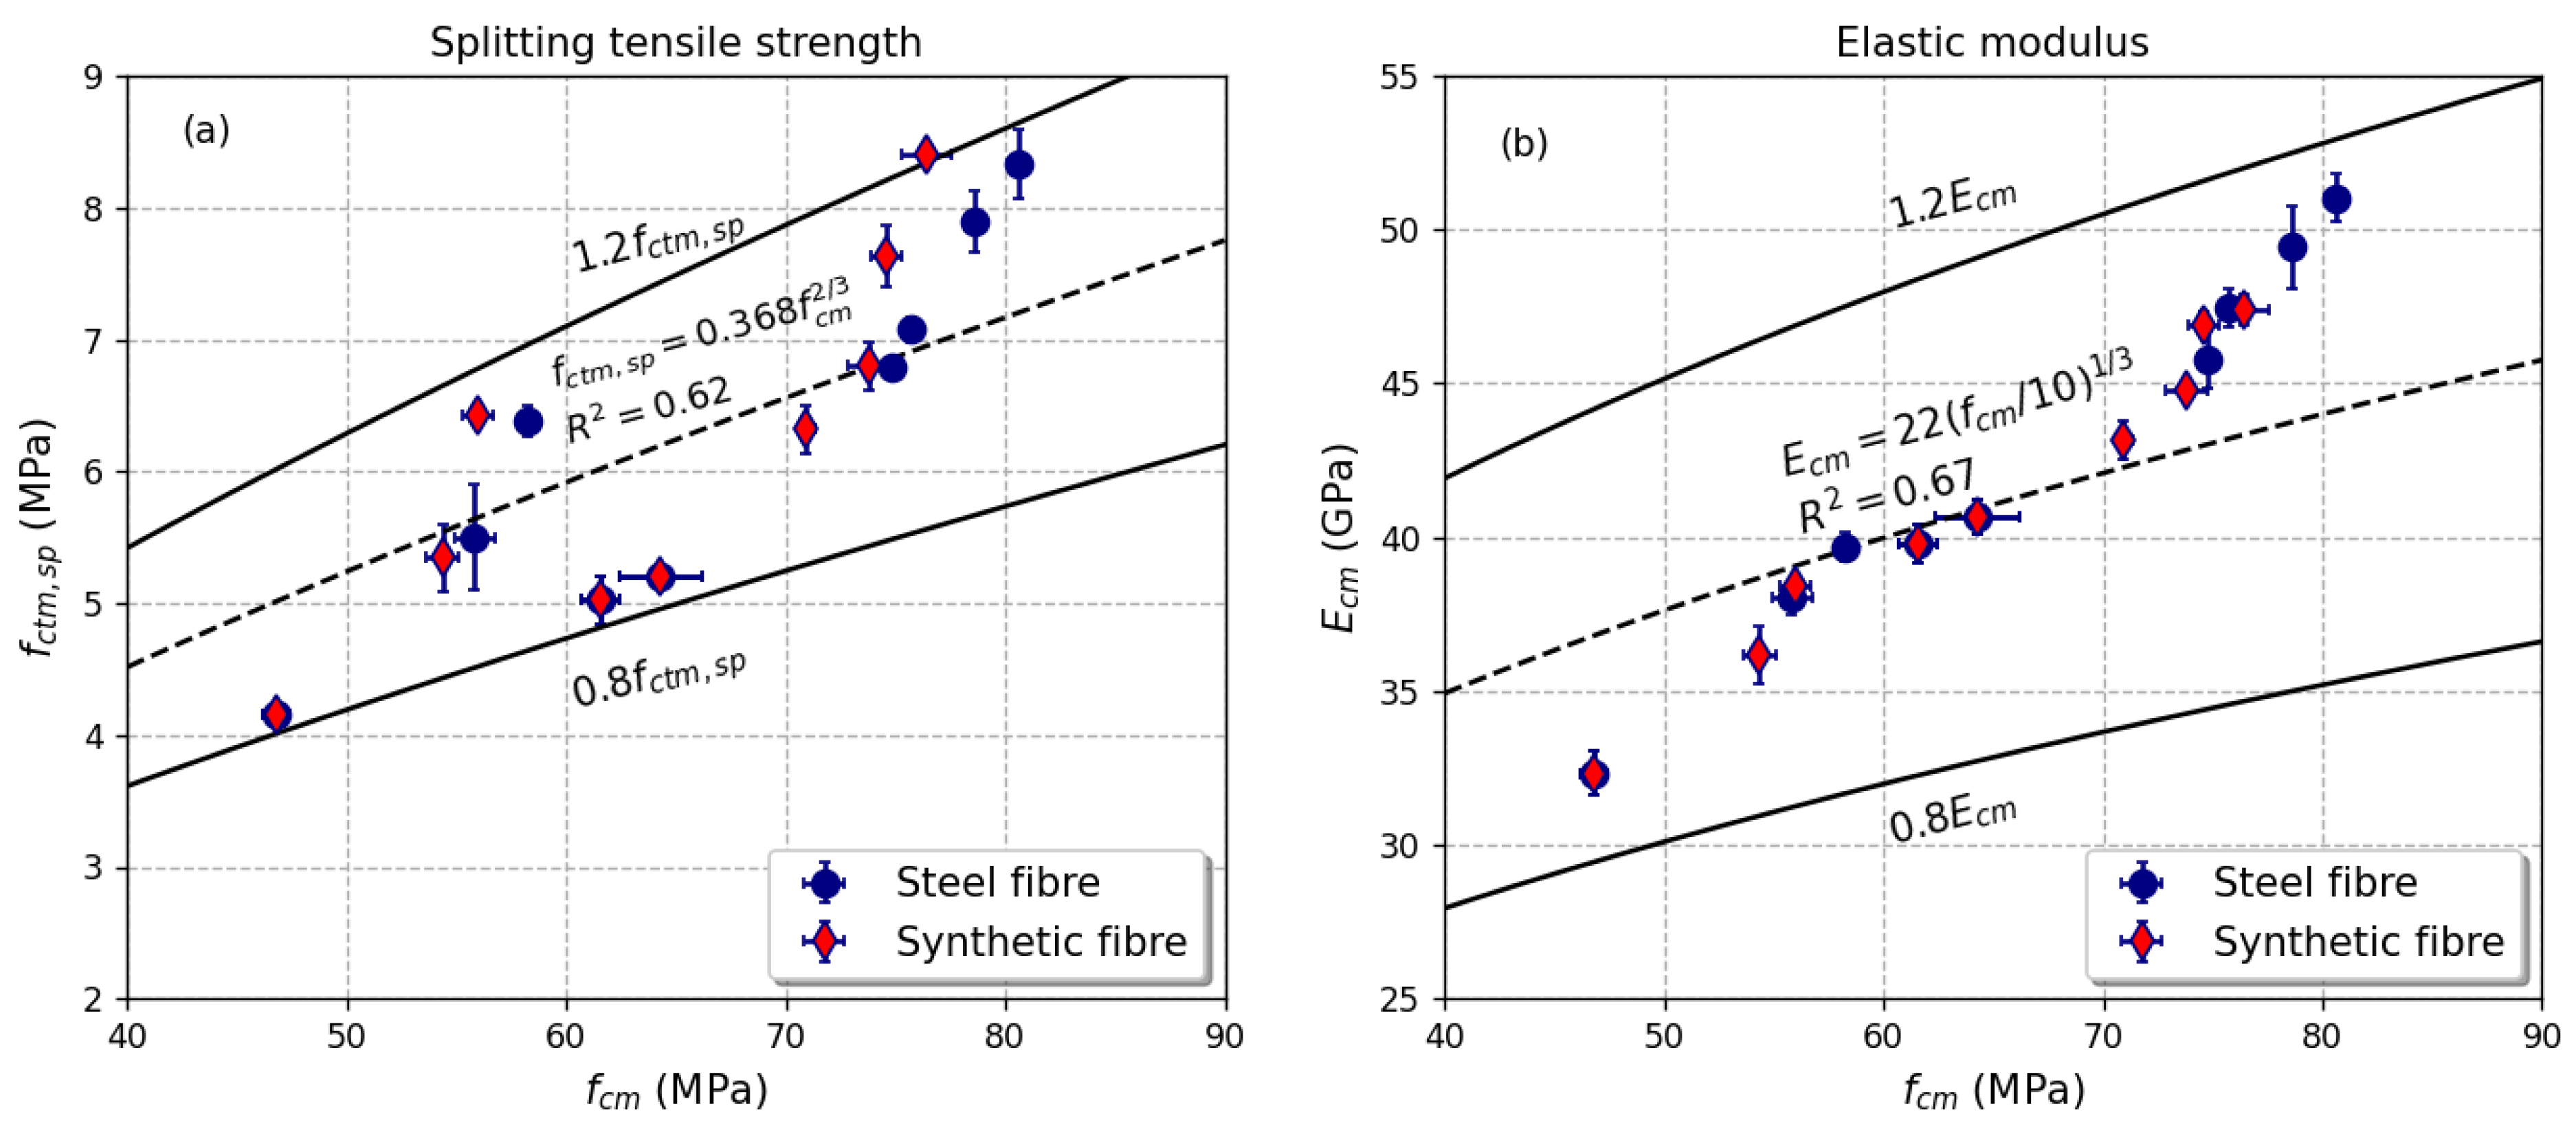
3.1. Basic Mechanical Properties

Figure 8a for steel fibres and Figure 8b for polypropylene fibres show the correlation between the concrete and CEM compressive strength. The results show a consistent pattern across all strength classes. CEM and concrete have almost the same compressive strength.
The results in Figure 9 show that concrete’s flexural strength is lower than that of CEM. However, there is a good correlation between them. This decline in flexural strength can be attributed to coarse aggregates in concrete, which introduce weaknesses in the interfacial regions between the aggregates and the cement matrix. These interfaces are more prone to cracking and contribute to a decrease in flexural strength. The size effect is well-known in concrete mechanics, where smaller specimens exhibit higher strength than their larger counterparts.
Figure 10 illustrates the relationships between splitting tensile strength and compressive strength (Figure 10a) and the elastic modulus versus the compressive strength (Figure 10b). Within the limits of the available data, the relationship between splitting tensile strength and compressive strength can be modeled by a modified version of EC2. The proposed relationship is f sub, CTM, sp end subscript equals 0.686f sub cm to the open paren 2 over 3 close parens with a correlation factor R2 = 0.62. Moreover, the expression of E sub cm equals 22 open parens f sub cm over 10, close paren to the 22 open paren f sub cm over 10, close paren to the 22 f c m 10 1 / 3 remains valid for the elastic modulus.

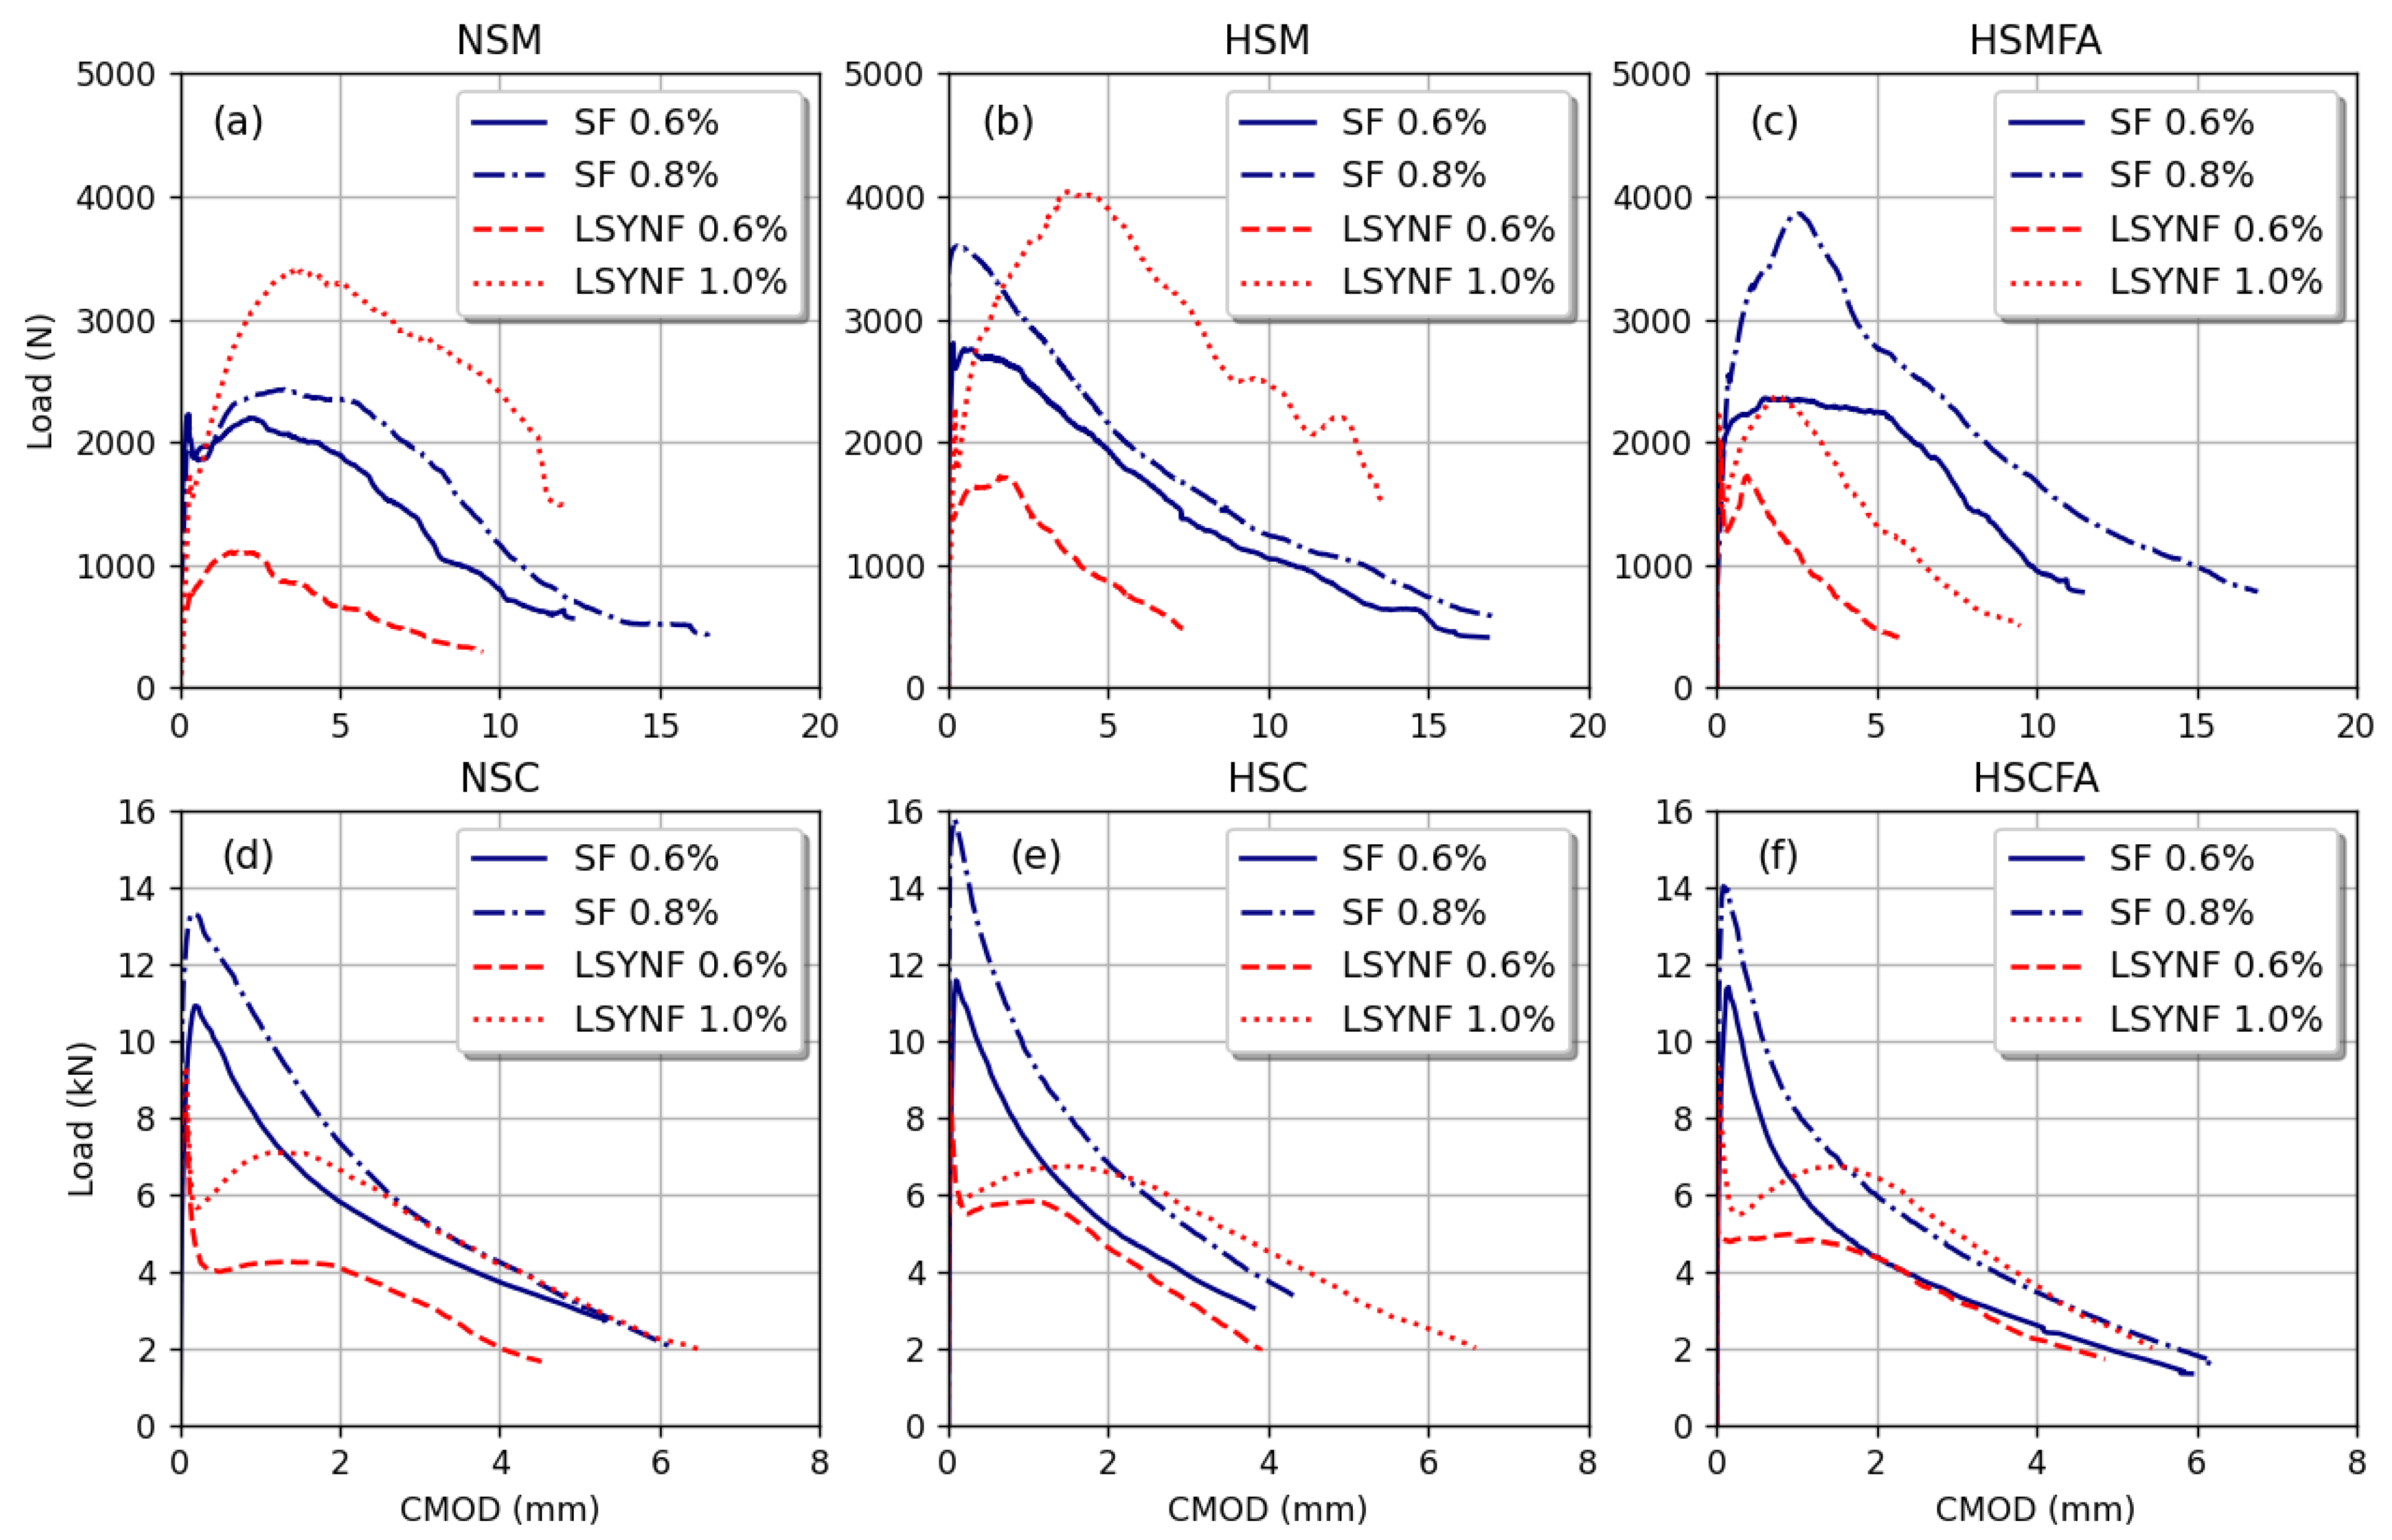
3.2. Post-Cracking Behaviour

The behaviour of the pre-notched specimens was investigated using GOM software based on the DIC technique. With the help of GOM software, numerical extensometers can be placed in any direction, and the variation in the strain on the surface of interest (SOI) can be seen (Figure 11). Furthermore, the crack’s path can be predicted before it becomes invisible to the naked eye. Using the DIC method, a virtual extensometer on GOM software was inserted into the notch opening to achieve the crack mouth opening displacement (CMOD). The results obtained by DIC, using the GOM correlate, in deflection were first compared with those obtained by the machine. This result allowed us to consider that the crack openings obtained numerically were reliable.
The load–crack opening curves obtained using the DIC are shown in Figure 12 for both CEM and concrete. Figure 12a–c shows the behaviour of mortars reinforced with steel and polypropylene fibres. It can be observed that the post-cracking behaviour of any fibre type is enhanced when the dosage is increased, indicating a higher residual tensile strength. NSM and HSM mortars experience a drop in strength after cracking, followed by an increase in tensile strength. Steel fibres compensate for cracking resistance, while polypropylene fibres exhibit softening at 0.6% and hardening at 1%, resulting in excess cracking resistance. For the HSMFA mortar, steel fibres are more effective than polypropylene fibres, regardless of the content. It shows continuous softening in the post-peak phase, while the mortar reinforced with polypropylene fibres shows hardening behaviour. The post-cracking behaviour of the corresponding concretes NSC, HSC, and HSCFA is similar to that of mortar, with steel fibres superior at the concrete scale, as shown in Figure 12d–f.

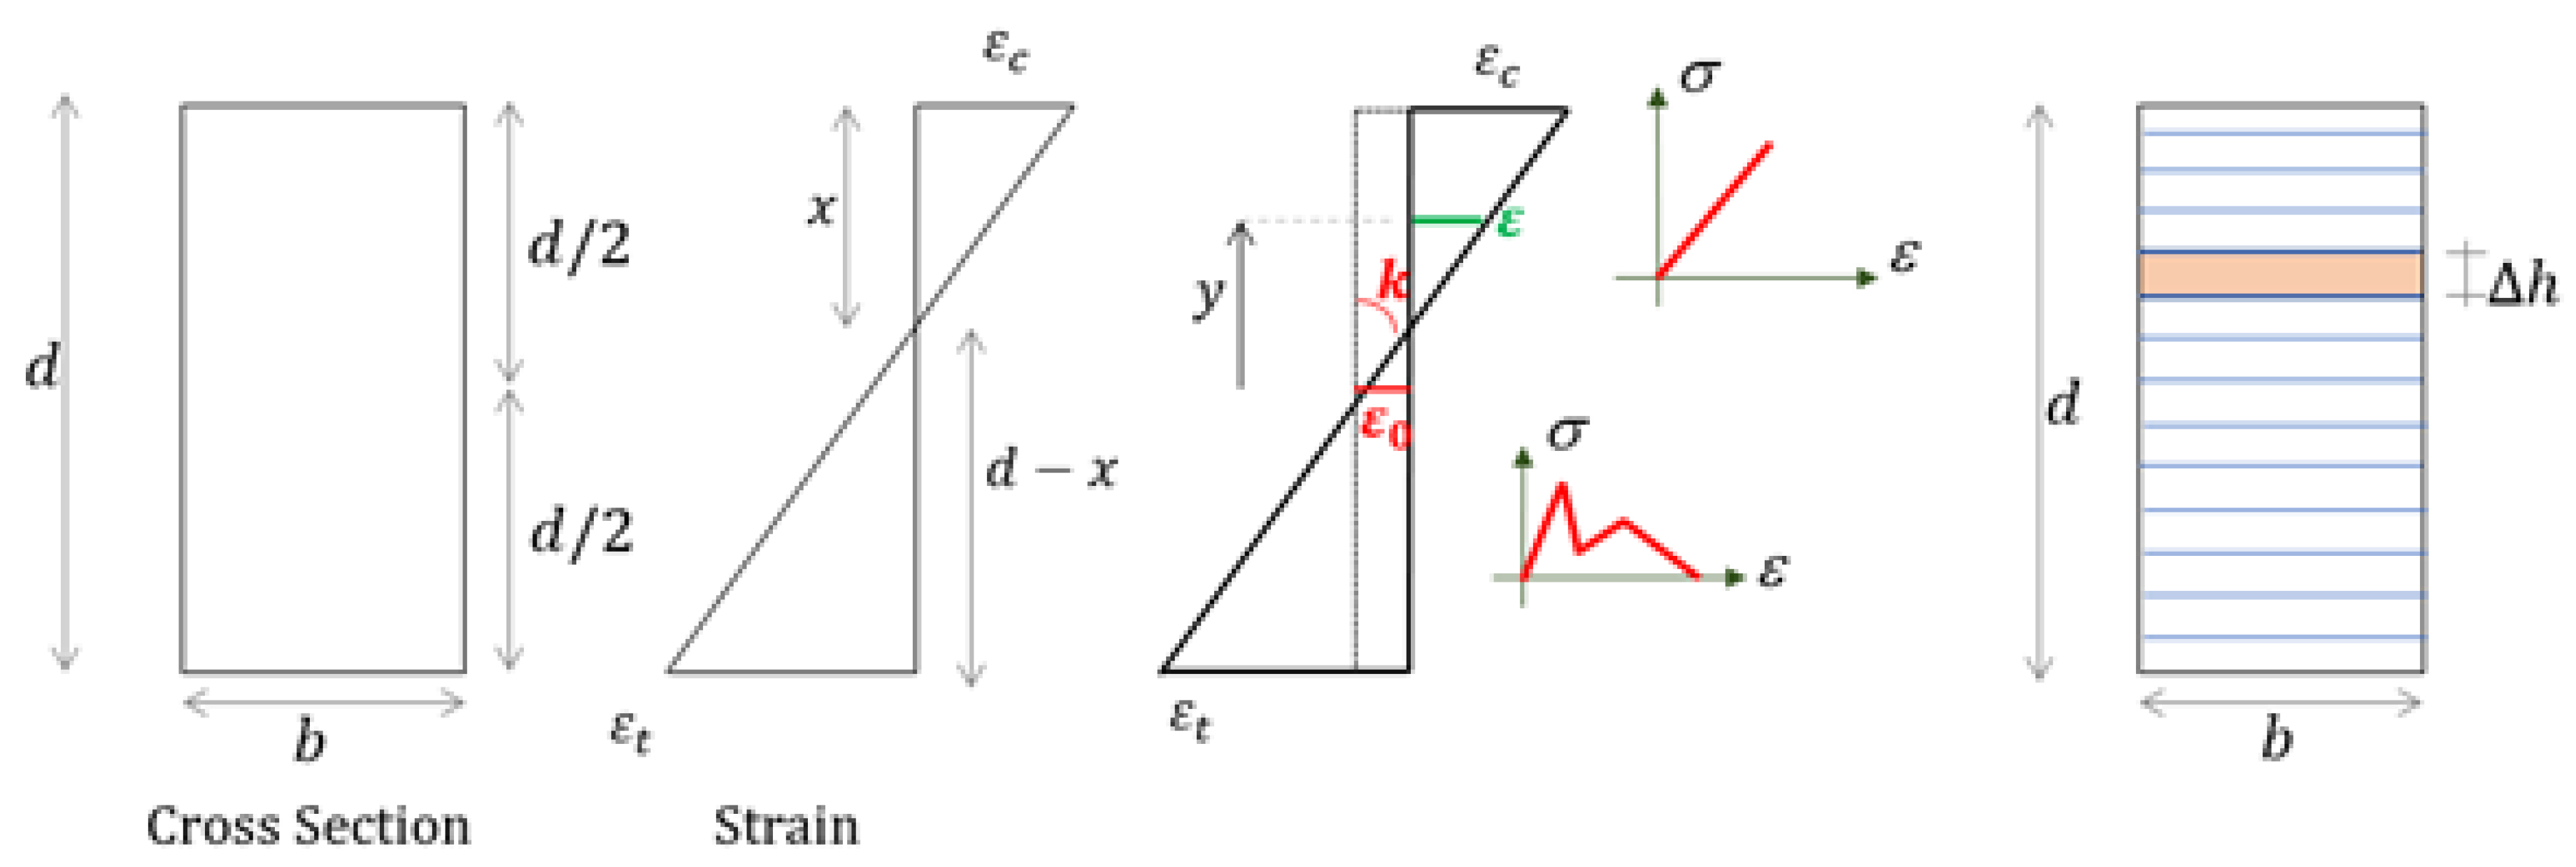
3.3. Analytical Modeling of Flexural Behaviour

The post-cracking behaviour in fibre-reinforced materials is based on the findings of Figure 12, involving a drop in the strength, followed by an increase in the residual stress and a final drop. When the tensile stress reaches the tensile strength, cracking occurs. As crack width increases, the tensile strength decreases until the crack width equals w1 and the corresponding stress is s1. The tension rises and reaches a maximum at w2 relative to the opening and stress s2. The softening law, known as the trilinear softening curve, begins from the last point up to the critical opening. The proposed softening law can be called the trilinear softening curve.
The non-linear hinge model was used to study the flexural behaviour of pre-notched beams, assuming failure is due to a single crack propagating in the centre (Figure 13) [38]. The behaviour is non-linear in a small hinge area, while linear elastic behaviour is outside. The model represents the beam using span l, the section height H, the width b, and the notch height a0. The failure occurs in the hinge area, with the width s estimated to be equal to d/2, with d = H − a0 being the effective height. The crack in a beam occurs when the tensile stress at the tensioned lower fibres exceeds the tensile strength, ft, and spreads within the hinge. As the load increases, different points along the fracture path are in one of five possible states (Figure 13c):
-
Linear elastic (Phase 0),
-
Cracked with softening behaviour (Phases I, II, and III),
-
Cracked without stress transfer between the crack lips (Phase IV).
The softening law represented in Figure 13a and abbreviated as σ-w is the function that describes the evolution of the tensile stress as a function of the crack opening. The following equation can express the proposed trilinear stress–strain softening curve:
σ = σ ε = E ε P r e c r a c k e d   s t a t e σ w = g w f c t m C r a c k e d   s t a t e
fctm is the tensile strength, E is the elastic modulus, ε is the elastic strain, w is the crack opening, and g(w) is the stress–crack opening connection. The following equation mathematically represents the function g(w):
g w = b 1 a 1 w 0 w < w 1 b 2 + a 2 w w 1 w w 2 b 3 a 3 w w 2 w w c
where b 1 = 1 , w 1 = 1 b 2 a 1 + a 2 , w 2 = b 3 b 2 a 2 + a 3 , and w c = b 3 a 3
wc stands for the critical opening, beyond which the material can no longer withstand tensile stress; w1 and w2 are for the bifurcation points. Equation (5) can be used to find the fracture energy GF, which is the area under the strain–softening curve:
G F = 0.5 f c t m σ 1 × w 1 + 0.5 σ 2 + σ 1 × w 2 w 1 + 0.5 σ 2 w c w 1
The multilinear softening law makes writing explicit equations for internal forces and bending moments challenging, so a numerical method for reinforced concrete elements was used in this work. Figure 14 illustrates the strain distribution diagram on a notched section, illustrating the compressive strain in the upper fibre εc, the tensile strain in the bottom fibre εt, the height of the compressive zone denoted as x, the beam width b, and the effective height d = H − a0. The method calculates the deformation of each fibre in the cross-section based on the curvature named k and the mean normal strain, e0, at the beam axis. It calculates the strain in a strip positioned at a distance of y from the beam bottom using Equation (6) [39].
ε ( y ) = ε 0 + d 2 y κ
The beam’s cross-section consists of layered strips (Figure 14) with one degree of freedom: elongation. Hook’s law determines the compressive stress in the compression zone, while Equation (4) determines the stress in the tensile zone. The neutral axis is determined by the equilibrium of compressive and tensile forces acting on the section when subjected to an external bending moment (Equation (7)).
N i n t e r n a l = h / 2 + h / 2 σ . d A = b . h i = 1 n σ i = 0                           M i n t e r n a l = h / 2 + h / 2 y . σ . d A = b . h i = 1 n y i . σ i = M e x t e r n a l  
The equilibrium equations for internal and external forces are non-linear due to the material’s non-linear behaviour. An analytical model is needed to solve these equations. The cross-section is divided into n + 1 strips, defining n layers (Figure 14). Forces are calculated for each layer, and strain and stress values are calculated. The Newton–Raphson method is used for the numerical solution, with two variables (ε0 and κ) determined using MATLAB’s solve function. The crack width for each strip in the tension crack zone is calculated based on the strip’s strain (Equation (8)).
w / s = ε f c t m E b 1 a 1 w 0 w < w 1 ε f c t m E b 2 + a 2 w w 1 w < w 2 ε f c t m E b 3 a 3 w ε w 2 w < w 3 w > w c
with s = d/2 being the width of the nonlinear hinge.
The crack mouth opening displacement (CMOD) at the bottom of a beam is determined by three factors: the elastic deformation of the beam, the crack presence at the notch’s tip, called w0, and the geometric opening related to the distance from the crack tip to the measuring point, named wg. CMOD thus gives the total CMOD =   w e + w 0 + w g .
This is found in Bakleh et al. [39]: w e = 6 P L a 0 E b H 2 v 1 ( x ) with
v 1 x = 0.76 2.28 x + 3.87 x 2 2.04 x 3 + 0.66 1 x 2 x = a 0 + d H + d
P represents the applied load on the beam. wg occurs after the cracking of the beam and is expressed as follows:
w g = 2 a 0 + d s f c t m H E θ 1   with   θ = d E κ 0 2 f c t m
w0 is calculated based on Equation (8) at the crack tip.
Before performing the direct analysis, it is necessary to ascertain the properties of the strain–softening curve (a1, b1, a2, b2, a3, b3), the beam dimensions (L, b, H, a0), the tensile strength (fctm), and the elastic modulus E. The analysis’s output is the Force–CMOD curve. However, if the parameters of the strain–softening law are unknown, an inverse analysis needs to be conducted. An optimisation approach is employed to determine the optimal softening curve parameters for the experimental P-CMOD curve. These softening parameters involve calculating the tensile strength, elastic modulus, and strain–softening curve parameters. The optimisation is based on the mean square of differences between experimental and computed forces, using MATLAB’s simplex search method version 9.9.0.246802, 2020b.

3.4. Results of the Inverse Analysis

The inverse analysis, intrinsic and size effect-independent, shows that all materials achieve a 2.5 mm crack opening, as defined by fib MC2010 [40], as the ultimate crack opening value (Figure 15). Polypropylene fibres at a 1% dosage in mortar are more effective than metal fibres at a 0.8% dosage, except for HSCFA mortar. In all the mortars examined, stress σ2 is higher when the fibre content is higher, except for HSMFA.
At the concrete scale, the post-cracking σ-w law of steel fibre-reinforced material is bilinear, reflecting the role of aggregates in the cracking process. The aggregate size is nearly the same as the fibres’s length, preventing them from playing a hardening role. The law of concrete reinforced with polypropylene fibre remains trilinear. Moreover, the critical crack opening for concrete is lower than the critical crack opening of mortars due to the presence of aggregates. The stress σ2 ranges between 0.4 and 0.6 of the tensile strength, with the highest value for NSC with a corresponding crack opening w2 of about 1 mm.
Figure 16 compares the fracture properties of CEM and concrete in terms of fracture energy GF and critical crack opening wc. A good correlation is observed between the properties of CEM and concrete with acceptable correlation factors. The correlation coefficients will likely improve when additional results are available.
The steel-reinforced concrete’s performance is evaluated using residual flexural stresses from three-point bending tests on notched prisms. The performance is measured in tension in terms of the residual flexural tensile strength f R j = 3 F j 𝓁 2 b d 2 (j = 1,2,3,4), corresponding to CMODj values (CMOD1 = 0.5 mm, CMOD2 = 1.5 mm, CMOD3 = 2.5 mm, CMOD4 = 3.5 mm), as per MC2010 [40]. The limit of proportionality (fLOP) is a crucial performance value representing the first cracking stress. At the same time, the MC2010 defines post-cracking behaviour parameters at a serviceability limit state (SLS) and ultimate limit state (ULS) using the residual flexural tensile strength (fR1k) and residual strength ratio (fR3k/fR1k). Fibre reinforcement can partially or completely replace conventional reinforcement if fR1 ≥ 0.4 fLOP and fR3/fR1 ≥ 0.5 are met. The results given in Table 4 show that all studied materials fulfil the recommendation.

4. Conclusions

This study examined the effectiveness of the concrete equivalent mortar method for predicting the fresh and hardened concrete properties of normal-, high-, and high-strength with fly ash concrete with steel and long polypropylene fibres. Concerning the obtained results, the following conclusions can be drawn:
Despite data limitations affecting the accuracy of the analytical relationship, the correlation between the CEM flow and concrete slump is good. Concrete slump accounts for around half of the CEM flow.
The study shows consistent trends in the relationship between concrete’s compressive and flexural strength and CEM reinforced with steel and long polypropylene fibres. With a flexural strength of 0.6 of the CEM values and a compressive strength of 0.78 to 0.82 of the CEM values, concrete’s strength is reduced compared to mortar. The decrease is due to coarse aggregates in the concrete, which weakens the interface between the aggregate and the surrounding cement paste.
CEM and concrete also observed a good correlation between the fracture energy and critical crack opening. The fracture energy of the concrete is 0.286 of that of the CEM, while the critical crack opening is 0.6 of that of the CEM. All prepared mortars and concretes exhibit excellent post-cracking performance and meet the MC20210 requirements.
CEM effectively predicts concrete properties, saving material, time, and energy, but confirmation testing on a concrete scale is still crucial.

Author Contributions

Conceptualisation, H.I. and G.W.; methodology, H.I., G.W., H.F. and E.G.; modelling, H.I., G.W. and E.G.; validation, G.W. and H.F.; formal analysis, H.I., H.F. and G.W.; investigation, writing—original draft preparation, H.I., G.W., H.F. and E.G.; writing—review and editing, G.W., H.F. and E.G.; visualisation, H.I. and G.W.; supervision, G.W., H.F. and E.G. All authors have read and agreed to the published version of the manuscript.

Funding

This research received no external funding.

Data Availability Statement

The data supporting this study’s findings are available from the corresponding author, George WARDEH, upon reasonable request.

Conflicts of Interest

The authors declare no conflicts of interest.

References

  1. Louro, A.S. Concrete Structures; Springer: Cham, Switzerland, 2021. [Google Scholar]
  2. Aïtcin, P.-C. High-Performance Concrete; CRC Press: Boca Raton, FL, USA, 2019. [Google Scholar]
  3. Wang, D.; Shi, C.; Wu, Z.; Xiao, J.; Huang, Z.; Fang, Z. A review on ultra-high-performance concrete: Part II. Hydration, microstructure and properties. Constr. Build. Mater. 2015, 96, 368–377. [Google Scholar] [CrossRef]
  4. Rahmani, F.; Paterno, D.; Gharehbaghi, S. Performance of FRC and GPC for High-Rise Construction: Case Studies. IOP Conf. Series Mater. Sci. Eng. 2020, 829, 12002. [Google Scholar] [CrossRef]
  5. Bertola, N.; Schiltz, P.; Denarié, E.; Brühwiler, E. A Review of the Use of UHPFRC in Bridge Rehabilitation and New Construction in Switzerland. Front. Built. Environ. 2021, 7, 769686. [Google Scholar] [CrossRef]
  6. Gastaldi, D.; Bertola, F.; Irico, S.; Paul, G.; Canonico, F. Hydration behaviour of cement with reduced clinker factor in mixture with sulfoaluminate binder. Cem. Concr. Res. 2021, 139, 106261. [Google Scholar] [CrossRef]
  7. More, F.M.; Subramanian, S.S. Impact of Fibres on the Mechanical and Durable Behaviour of Fibre-Reinforced Concrete. Buildings 2022, 12, 1436. [Google Scholar] [CrossRef]
  8. Shi, J. Fibre-Reinforced Polymers and Fibre-Reinforced Concrete in Civil Engineering. Buildings 2023, 13, 1755. [Google Scholar] [CrossRef]
  9. Farinha, C.B.; de Brito, J.; Veiga, R. Incorporation of high contents of textile, acrylic and glass waste fibres in cement-based mortars. Influence on mortars’ fresh, mechanical and deformability behaviour. Constr. Build. Mater. 2021, 303, 124424. [Google Scholar] [CrossRef]
  10. Hannawi, K.; Bian, H.; Prince-Agbodjan, W.; Raghavan, B. Effect of different types of fibers on the microstructure and the mechanical behavior of Ultra-High Performance Fiber-Reinforced Concretes. Compos. Part B Eng. 2016, 86, 214–220. [Google Scholar] [CrossRef]
  11. Kaikea, A.; Achoura, D.; Duplan, F.; Rizzuti, L. Effect of mineral admixtures and steel fibre volume contents on the behaviour of high performance fibre reinforced concrete. Mater. Des. 2014, 63, 493–499. [Google Scholar] [CrossRef]
  12. Bellum, R.R. Influence of steel and PP fibres on mechanical and microstructural properties of fly ash-GGBFS based geopolymer composites. Ceram. Int. 2021, 48, 6808–6818. [Google Scholar] [CrossRef]
  13. Buratti, N.; Mazzotti, C.; Savoia, M. Post-cracking behaviour of steel and macro-synthetic fibre-reinforced concrete. Constr. Build. Mater. 2011, 25, 2713–2722. [Google Scholar] [CrossRef]
  14. Kazmi, S.M.S.; Munir, M.J.; Wu, Y.-F.; Patnaikuni, I. Effect of macro-synthetic fibres on the fracture energy and mechanical behaviour of recycled aggregate concrete. Constr. Build. Mater. 2018, 189, 857–868. [Google Scholar] [CrossRef]
  15. Pourbaba, M.; Chakraborty, R.; Pourbaba, M.; Belarbi, A.; Yeon, J.H. A New Insight into the Design Compressive Strength of Ultra-High Performance Concrete. Buildings 2023, 13, 2909. [Google Scholar] [CrossRef]
  16. Setra Service D’études Techniques des Routes et Autoroutes, Association Française de Génie Civil. Documents Scientifiques et Techniques Bétons Fibrés à Ultra-Hautes Performances Ultra High Performance Fibre-Reinforced Concrètes. Recommandations provisoires, Interim Recommendations; Association Française de Génie Civil: Paris, France, 2002. [Google Scholar]
  17. EN 206-1; Concrete (Specctn, performance, product, and conformity). European Standard Norms on Concrete. European Standards Organization: Brussels, Belgium, 2002.
  18. Akca, K.R.; Ipek, M. Effect of different fibre combinations and optimisation of an ultra-high performance concrete (UHPC) mix applicable in structural elements. Constr. Build. Mater. 2022, 315, 125777. [Google Scholar] [CrossRef]
  19. Fang, Z.; Luo, Y.; Chen, H.; Gao, Y.; Yang, W.; Wang, C. Research on mechanical properties and hydration characteristics of ultra-high performance concrete with high-volume fly ash microsphere. J. Build. Eng. 2023, 78, 107738. [Google Scholar] [CrossRef]
  20. Golewski, G.L. Measurement of fracture mechanics parameters of concrete containing fly ash thanks to use of Digital Image Correlation (DIC) method. Measurement 2019, 135, 96–105. [Google Scholar] [CrossRef]
  21. Golewski, G.L. Effect of curing time on the fracture toughness of fly ash concrete composites. Compos. Struct. 2018, 185, 105–112. [Google Scholar] [CrossRef]
  22. Buragohain, P.; Sreedeep, S.; Lin, P.; Garg, A. Investigation of fly ash for sorption of copper ions in multiple contaminant system: An implication on re-use of waste material under concept of sponge city. Measurement 2018, 124, 522–528. [Google Scholar] [CrossRef]
  23. Win, T.T.; Wattanapornprom, R.; Prasittisopin, L.; Pansuk, W.; Pheinsusom, P. Investigation of Fineness and Calcium-Oxide Content in Fly Ash from ASEAN Region on Properties and Durability of Cement–Fly Ash System. Eng. J. 2022, 26, 77–90. [Google Scholar] [CrossRef]
  24. Win, T.T.; Panwisawas, C.; Jongvivatsakul, P.; Pansuk, W.; Prasittisopin, L. Effects of Fly Ash Composition to Mitigate Conversion of Calcium Aluminate Cement Composites. Buildings 2023, 13, 2453. [Google Scholar] [CrossRef]
  25. Golewski, G.L. Effect of fly ash addition on the fracture toughness of plain concrete at third model of fracture. J. Civ. Eng. Manag. 2017, 23, 613–620. [Google Scholar] [CrossRef]
  26. Scopus Record. Paper’s on Cement-Based Composite Materials Reinforced with Fibre Polymer; Elsevier: Amsterdam, The Netherlands, 2023. [Google Scholar]
  27. Górszczyk, J.; Malicki, K.; Zych, T. Application of digital image correlation (DIC) method for road material testing. Materials 2019, 12, 2349. [Google Scholar] [CrossRef] [PubMed]
  28. Dai, S.; Liu, X.; Nawnit, K. Experimental Study on the Fracture Process Zone Characteristics in Concrete Utilizing DIC and AE Methods. Appl. Sci. 2019, 9, 1346. [Google Scholar] [CrossRef]
  29. Schwartzentruber, A.; Catherine, C. La méthode du mortier de béton équivalent (MBE)—Un nouvel outil d’aide à la formulation des bétons adjuvantés. Mater. Struct. 2000, 33, 475–482. [Google Scholar] [CrossRef]
  30. Assaad, J.J.; Harb, J.; Khayat, K.H. Use of Triaxial Compression Test on Mortars to Evaluate Formwork Pressure of Self-Consolidating Concrete View project 3D Concrete Printing View Project. 2009. Available online: https://www.researchgate.net/publication/297452138 (accessed on 12 December 2023).
  31. NF EN 934-2; European Standard on Admixture for Concrete, Mortar, and Grout. European Standards Organization: Brussels, Belgium, 2012.
  32. BS EN 933-1; Determination of Particle Size Distribution (Modified) Nominal Size of Aggregate 40 mm or Greater. British Standards Institution: London, UK, 1996.
  33. NF EN 1097-6; Tests for Mechanical and Physical Properties of Aggregates—Part 6. European Standards Organization: Brussels, Belgium, 2022.
  34. Omary, S.; Ghorbel, E.; Wardeh, G. Relationships between recycled concrete aggregates characteristics and recycled aggregates concretes properties. Constr. Build. Mater. 2016, 108, 163–174. [Google Scholar] [CrossRef]
  35. NF EN 12350-2; Testing Fresh Concrete—Part 2: Slump Test. European Standards Organization: Brussels, Belgium, 2019.
  36. NF EN 12390-13; Secant Modulus of Elasticity, Report. European Standards Organization: Brussels, Belgium, 2021.
  37. Gougelet, P. XnView MP Windows. 2021. Available online: https://www.xnview.com/en/xnviewmp/ (accessed on 14 April 2022).
  38. Ulfkjrer, J.P.; Brincker, R. Fracture energy of normal strength concrete, high strength concrete and ultra-strength -ultra ductile steel fibre reinforced concrete. J. Eng. Mech. 1995, 121, 7–15. [Google Scholar]
  39. Bakleh, B.; Hasan, H.; Wardeh, G. Analytical Model for the Prediction of Instantaneous and Long-Term Behaviour of RC Beams under Static Sustained Service Loads. Appl. Mech. 2023, 4, 31–43. [Google Scholar] [CrossRef]
  40. CEB-FIP, Model Code, (1990). fib Bulletin 65: Model Code 2010, Final draft—Volume 1, Bullatin 65. Available online: https://www.fib-international.org/publications/fib-bulletins/model-code-2010-final-draft,-volume-1-detail.html (accessed on 12 December 2023).
Figure 1. Steel and polypropylene fibres are used in the present work.
Buildings 14 01610 g001
Figure 2. Particle size distribution of the solid constituents.
Buildings 14 01610 g002
Figure 3. Concrete mixtures developed in the present work.
Buildings 14 01610 g003
Figure 4. CEM mini cone flow test [17,35].
Buildings 14 01610 g004
Figure 5. Relationships between CEM flow and concrete slump.
Buildings 14 01610 g005
Figure 6. Relationships between CEM flow and concrete slump for fibre-reinforced materials: (a) steel fibre, and (b) long polypropylene fibre.
Buildings 14 01610 g006
Figure 7. Experimental setup for deformation measurement.
Buildings 14 01610 g007
Figure 8. Comparison between the compressive strength of CEM and concrete: (a) steel fibre and (b) polypropylene fibre.
Buildings 14 01610 g008
Figure 9. Comparison between the flexural strength of CEM and concrete: (a) steel fibre and (b) polypropylene fibre.
Buildings 14 01610 g009
Figure 10. (a) Splitting tensile versus compressive strength. (b) Elastic modulus versus compressive strength.
Buildings 14 01610 g010
Figure 11. Strain and crack visualisation (εx) map on a flexural test specimen using GOM at (a) stage 0, (b) the stage before the crack, (c) the stage at the visible crack, and (d) the stage at the maximum crack.
Buildings 14 01610 g011
Figure 12. Load–crack mouth displacement opening. (a) NSM, (b) HSM, (c) HSMFA, (d) NSC, (e) HSC, (f) HSCFA.
Buildings 14 01610 g012
Figure 13. (a) Trilinear softening curve, (b) non-linear hinge model, and (c) stress distributions in different phases.
Buildings 14 01610 g013
Figure 14. Cross-section with a strain distribution diagram and division into layers.
Buildings 14 01610 g014
Figure 15. Stress–strain post-cracking curves for studied materials: (a) NSM, (b) HSM, (c) HSMFA, (d) NSC, (e) HSC, (f) HSCFA.
Buildings 14 01610 g015
Figure 16. (a) Comparison between the fracture energy of CEM and concrete with steel fibre; (b) CEM critical crack opening versus concrete crack opening.
Buildings 14 01610 g016
Table 1. Physical properties of aggregates.
Density ρrdWater Absorption WA24 (%)Fineness ModulusLos Angeles (%) [34]
Sand 0–4 mm2.551.142.82-
Gravel 4–10 mm2.700.67-17.5
Table 2. Mix proportions of CEM mortars (1 m3).
Mortars IdentificationCement (kg/m3)Fly Ash
(kg/m3)
Water
(kg/m3)
Sand
(kg/m3)
Fibre
(kg/m3)
Superplasticiser (kg/m3)
NSMReferenceNSM_ref577-2891251-4.4
Steel fibresNSM_SF_0.6%576-2881237454.9
NSM_SF_0.8%575-2881235614.9
Polypropylene fibresNSM_LSYNF_0.6%578-288123664.6
NSM_LSYNF_1.0%576-288123094.6
HSMReferenceHSM_ref757-2271208-27.2
Steel fibresHSM_SF_0.6%737-22111724535
HSM_SF_0.8%731-21911596649
Polypropylene fibresHSM_LSYNF_0.6%753-2261159628
HSM_LSYNF_1.0%750-2251151932
HSMFAReferenceHSMFA_ref701732331131-35
Steel fibresHSMFA_SF_0.6%7007423311274435
HSMFA_SF_0.8%6947323110996649
Polypropylene fibresHSMFA_LSYNF_0.6%710762061180628
HSMFA_LSYNF_1.0%708752061175932
Table 3. Mix proportions of concrete (1 m3).
Concrete IdentificationCement (kg/m3)Fly Ash
(kg/m3)
Water
(kg/m3)
Sand
(kg/m3)
Gravel
(kg/m3)
Fibre
(kg/m3)
Superplasticiser (kg/m3)
NSCReferenceNSC_ref380-190763991-2.9
Steel fibresNSC_SF_0.6%380-190758985303.4
NSC_SF_0.8%380-190759983453.4
Polypropylene fibresNSC_LSYNF_0.6%380-19075898463.0
NSC_LSYNF_1.0%380-19075598193.2
HSCReferenceHSC_ref500-150744966-22.5
Steel fibresHSC_SF_0.6%500-1507409613022.5
HSC_SF_0.8%500-1507249414535
Polypropylene fibresHSC_LSYNF_0.6%500 150737957622
HSC_LSYNF_1.0%500 150727944928
HSCFAReferenceHSCFA_ref47550145715928-26.1
Steel fibresHSCFA_SF_0.6%475501457109223026.1
HSCFA_SF_0.8%475501457019104533.3
Polypropylene fibresHSCFA_LSYNF_0.6%47550145730948624
HSCFA_LSYNF_1.0%47550145718933926
Table 4. Residual stress analysis.
w < 0.05 mmw = 0.5 mmw = 1.5 mmw = 2.5 mm
fLOPfR1%fLOPfR2%fLOPfR3%fR1
NSMNSM_SF_0.6%9.24 ± 0.547.83 ± 0.65848.72 ± 0.38949.05 ± 39116
NSM_SF_0.8%9.27 ± 0.157.84 ± 0.40809.33 ± 0.501009.96 ± 0.50127
NSM_LSYNF_0.6%5.95 ± 0.443.39 ± 0.60564.55 ± 0.22764.48 ± 0.53132
NSM_LSYNF_1.0%7.15 ± 0.649.11 ± 0.3612710.95 ± 0.7115313.14 ± 0.10144
HSMHSM_SF_0.6%11.70 ± 0.0811.46 ± 0.369811.19 ± 0.189510.37 ± 0.6390
HSM_SF_0.8%11.68 ± 0.814.91 ± 0.8412813.77 ± 0.6011712.35 ± 0.3583
HSM_LSYNF_0.6%9.95 ± 0.616.85 ± 0.206810.95 ± 0.5011013.14 ± 0.71192
HSM_LSYNF_1.0%9.52 ± 0.809.11 ± 0.619512.93 ± 0.9513515.02 ± 0.48165
HSMFAHSMFA_SF_0.6%7.5 ± 0.179.6 ± 0.031219.8 ± 0.451309.77 ± 0.72102
HSMFA_SF_0.8%10.43 ± 0.5510.93 ± 0.3210514.14 ± 0.3713516.7 ± 0.73153
HSMFA_LSYNF_0.6%8.28 ± 0.305.68 ± 0.90686.22 ± 0.56754.66 ± 0.3582
HSMFA_LSYNF_1.0%9.25 ± 0.687.20 ± 0.77789.50 ± 0.701029.45 ± 0.62131
NSCNSC_SF_0.6%7.14 ± 0.786.54 ± 0.38 92 4.54 ± 0.3864 3.7 ± 0.0957
NSC_SF_0.8%8.99 ± 0.547.54 ± 0.6484 6.36 ± 0.5671 4.6 ± 0.24 61
NSC_LSYNF_0.6%4.95 ± 0.84 3.19 ± 0.3065 4.16 ± 0.13843.64 ± 0.04114
NSC_LSYNF_1.0%5.89 ± 0.54 3.45 ± 0.3559 6.64 ± 0.21 794.01 ± 0.23 116
HSCHSCF_SF_0.6%7.64 ± 0.63 5.97 ± 0.4578 4.41 ± 0.28 58 3.92 ± 0.20 65
HSCF_SF_0.8%10.23 ± 0.477.56 ± 0.78746.27 ± 0.12 62 5.33 ± 0.0971
HSCF_LSYNF_0.6%6.22 ± 0.713.94 ± 0.03 62 3.36 ± 0.08 583.13 ± 0.07 79
HSCF_LSYNF_1.0%7.18 ± 0.443.97 ± 0.04 55 4.38 ± 0.08 614.11 ± 0.13 104
HSCFAHSCFA_SF_0.6%7.55 ± 0.585.49 ± 0.4473 4.46 ± 0.04 60 3.86 ± 0.06 70
HSCFA_SF_0.8%9.18 ± 0.397.23 ± 0.69 795.26 ± 0.28574.61 ± 0.28 64
HSCFA_LSYNF_0.6%5.71 ± 0.50 3.27 ± 0.04 57 4.38 ± 0.01 78 3.96 ± 0.22 121
HSCFA_LSYNF_1.0%6.34 ± 0.81 3.87 ± 0.11 61 4.53 ± 0.13 713.84 ± 0.2199
Disclaimer/Publisher’s Note: The statements, opinions and data contained in all publications are solely those of the individual author(s) and contributor(s) and not of MDPI and/or the editor(s). MDPI and/or the editor(s) disclaim responsibility for any injury to people or property resulting from any ideas, methods, instructions or products referred to in the content.

