Abstract
This study aims to address quality issues in the production of prefabricated steel structural components for buildings by investigating challenges in quality risk assessment. It identifies key factors contributing to quality problems and establishes an evaluation index system. Traditional methods encounter limitations in handling uncertainty and conducting quantitative analysis. Therefore, the fuzzy Bayesian network (FBN) theory is utilized to perform a probabilistic analysis of quality risks during the production phase. This research achieves a more accurate and dynamic risk assessment by integrating the strengths of fuzzy logic and Bayesian networks (BNs) and by utilizing expert knowledge, the similarity aggregation method (SAM), and the noisy-OR gate model. The study reveals that factors such as the “low professional level of designers”, “poor production refinement”, and “poor storage conditions for finished products” have a significant impact on quality risks. This study offers a scientific risk assessment tool designed to address the quality control challenges commonly experienced in the manufacturing of steel structural components. Identifying the critical risk factors that influence quality empowers actual production enterprises to develop risk management strategies and improvement measures in a more focused manner, thereby facilitating more effective resource allocation and risk prevention and control. Consequently, this approach has a significant impact on enhancing the overall production level and quality within the industry.
1. Introduction
In recent years, there has been a substantial increase in the utilization of prefabricated steel structural construction and steel component consumption, indicating the inevitable advancement of prefabricated steel structures [1,2]. This trend is driven by the increasing demand for sustainable development in the construction industry, bolstered by policies advocating for energy efficiency, environmental protection, and green building practices [3]. In this context, the significance of quality control for steel structural components during the production phase, including the critical adherence to specifications concerning dimensional deviations, cracks, deformations, and mechanical properties, has become more apparent. The quality of prefabricated components directly impacts the safety performance of engineering projects and plays a vital role in advancing construction industrialization [4]. Therefore, conducting a risk assessment of the quality of steel structural components during the production phase is of paramount importance.
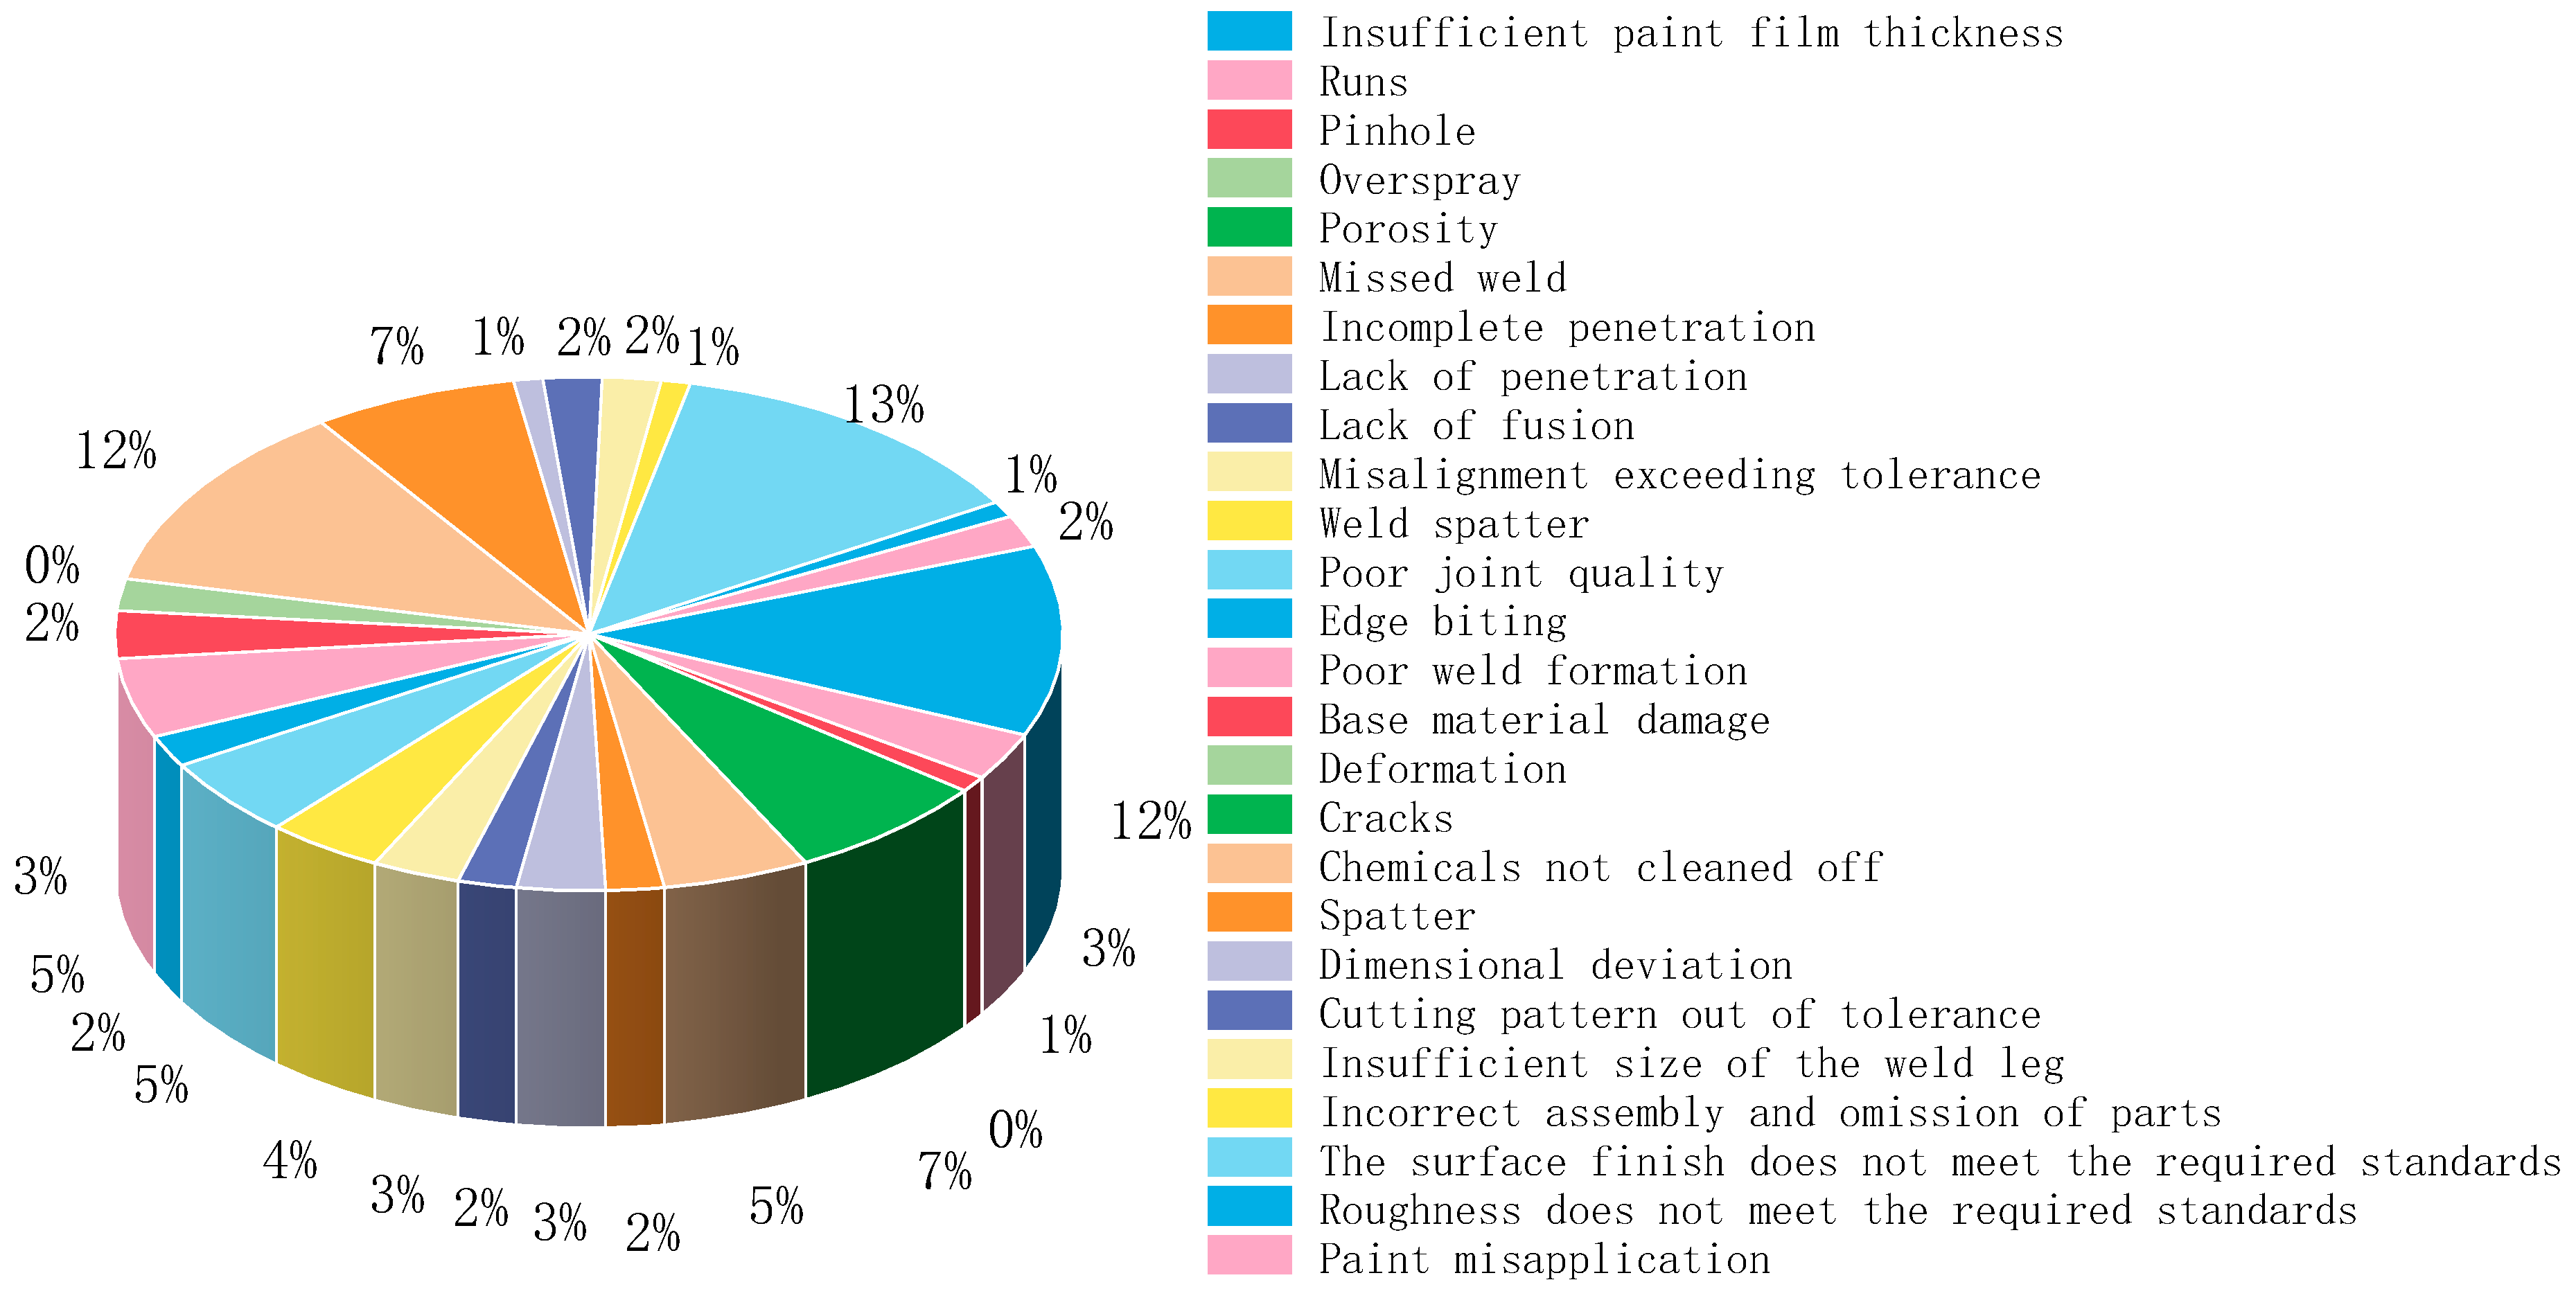
Currently, the entire lifecycle of quality control of steel prefabricated components is essential to ensuring the success of the construction project. The process comprises three primary phases: production, transportation and storage, and on-site construction, each of which employs specific control measures to guarantee the quality and performance of the components [5]. During the production stage, starting with the selection and inspection of raw materials, every phase of the process must be executed precisely, including cutting, forming, welding, and surface treatment, to ensure that the size, shape, and quality of the components meet the design requirements. Quality inspection methods include ultrasonic testing [6] to detect internal defects in component welds and materials, magnetic particle testing [7] to detect indicative defects in component welds and materials, and 3D laser Doppler vibrometry (3D LDV) [8], a non-contact measurement that enables real-time monitoring of the dynamic properties of products to assess their structural integrity and production quality. Destructive testing consists of tensile, flexural, and impact tests to verify that the component’s performance meets the requirements for use [9]. Secondly, quality testing during the transportation and storage phases is critical to ensure that the integrity and performance of the components are not compromised before they arrive at the construction site. This includes visual inspection techniques that utilize high-resolution cameras and drones to provide clear images from multiple angles [10], which help to inspect surfaces for corrosion, scratches, or other damage caused by transportation. Finally, during the field construction phase, quality inspection is crucial to ensure the safety and durability of the overall structure. The utilization of advanced technologies has led to the widespread use of innovative inspection methods and equipment in the quality control of on-site construction. For instance, the mobile test station [11] employs the impulse excitation technique (IET), which is an effective and cost-effective means of inspecting components in the field. This approach is suitable for a multitude of situations, including storage, and has proven to be a useful tool in quality control. Despite the existing quality inspection tools and methods being relatively comprehensive and primarily focused on identifying and eliminating substandard components, these measures are primarily reactive in nature and do not offer effective prevention and control of the quality risks associated with structural steel components. In particular, the production stage of front-end quality control for steel components presents numerous and complex challenges [12], as illustrated in Figure 1, which depicts the various quality issues encountered by a component production plant in Changchun, Jilin, China. These issues, if not properly categorized and managed, limit the ability of enterprises to recognize and manage potential risks during the production phase of assembled steel structure components, thereby impacting the overall safety and reliability of assembled steel structure buildings. To address these challenges, this paper will employ FBN and design a risk analysis framework by integrating the noisy-OR gate model and SAM.
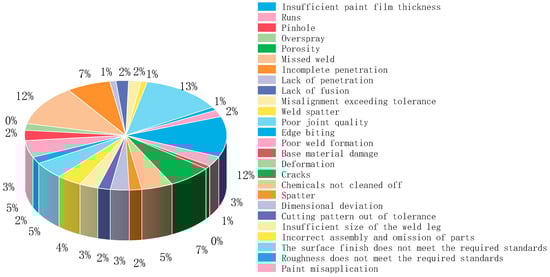
Figure 1.
Frequency of quality issues during the production phase of prefabricated steel structural components.
This study aims to develop a probabilistic analysis framework based on FBN for assessing quality risks during the production phase of prefabricated steel structural components. Through this framework, various quality issues and their underlying causes encountered during production are systematically dissected and clarified. Additionally, it offers a novel tool for quality risk assessment and management for steel component manufacturers. Importantly, the FBN-based framework provides scientific and rational strategies and recommendations for quality control and risk management at the production stage. This approach improves the production quality of prefabricated steel structural components and ensures the safety and reliability of prefabricated steel structure buildings. This research fills a gap in quality risk analysis during the production phase of prefabricated steel structural components, making a significant contribution to the sustainable development of the steel structure construction industry and the objectives of energy conservation, emission reduction, and green building.
2. Literature Review
Significant progress has been made in assessing construction quality risks and construction risks in prefabricated construction. This research encompasses various dimensions, including evaluating safety performance risks in prefabricated buildings [13], controlling project investment risks [14], and conducting risk assessments during the construction phase [15,16]. Additionally, studies on risk management across different stages of prefabricated steel structure construction have become more comprehensive [17]. Notably, Leu & Chang et al. [18] utilized fault trees and Bayesian networks to develop a model for assessing safety risks at construction sites. However, the quality of prefabricated components remains a central concern in the prefabricated construction sector, with the evaluation of quality risks associated with these components being an important yet underexplored area.
Currently, most studies predominantly focus on prefabricated concrete components [19], with diverse assessment models being developed for identifying and managing quality risks. Notably, Monte Carlo simulations and numerical methods utilizing the LS-DYNA physical computing program have been employed to estimate the maximum support rotation and predict damage to prefabricated concrete wall panels under various threat scenarios [20]. Additionally, they have assessed the performance of prefabricated concrete sandwich panels [21,22]. These investigations have significantly contributed to enhancing the assessment of quality risks in prefabricated components. However, studies on prefabricated steel structural components are notably limited. Current research primarily focuses on postproduction inspection and problem analysis for steel structural components [23,24] and the assessment of seismic performance [25,26]. There is a noticeable gap in identifying and assessing potential risks during the production process. Although innovative techniques such as 3D laser scanning [27], dynamic Bayesian networks (DBNs) [28], and Bayesian updating methods combined with Markov chain Monte Carlo (MCMC) techniques [29] have been introduced for quality inspection and crack prediction, they predominantly focus on postproduction evaluations and monitoring, overlooking risk prevention and control during the production phase. This oversight underscores the urgent need for systematic identification, assessment, and management of quality risks in the production of prefabricated steel structural components, which is crucial for enhancing quality management and ensuring safety in construction and engineering projects.
In the realm of risk assessment, traditional methods such as the fuzzy evaluation method (FEM), fault tree analysis (FTA), and failure mode and effects analysis (FMEA) are extensively utilized. However, they exhibit limitations: difficulty in capturing dynamic changes, inability to support complex model construction, lack of effective backward reasoning capabilities, and failure to accurately depict variable dependencies [30]. In contrast, BNs, a type of probabilistic graphical model, are adept at managing uncertainties and intervariable dependencies [31]. These networks are capable of dynamically updating probabilities in response to new information and facilitating causal reasoning within complex risk systems. Such capabilities render BNs invaluable for conducting more precise and dynamic risk assessments in safety evaluation and risk analysis [32,33], with widespread applications across various domains [34,35,36,37]. This approach enhances the flexibility of risk analysis and deepens the understanding of risk levels in complex systems. Thus, BNs play an essential role in modern risk assessment by providing effective tools for addressing uncertainty and dependencies within complex systems.
3. Methodology
3.1. Bayesian Networks
Bayesian networks, introduced by Pearl in 1985, are probabilistic graphical models designed to describe the conditional dependencies and probabilistic relationships among variables [38,39]. These networks are depicted using directed acyclic graphs (DAGs), in which each node signifies a random variable and directed edges represent causal or conditional dependencies between variables. Each node is associated with a conditional probability table (CPT) that specifies the probability distribution conditional on the states of its parent nodes; variables with no parents are governed by prior probability distributions. BNs facilitate predictive reasoning (from causes to effects) and diagnostic reasoning (from effects to causes). The probability distribution for the node set is:
This model operates on Bayes’ theorem, which permits the updating of prior probabilities with new evidence to compute posterior probabilities [40]. It is applicable in scenarios that assume conditional independence. The formula for Bayes’ theorem is presented below:
3.2. Fuzzy Set Theory and the Fuzzy Bayesian Method
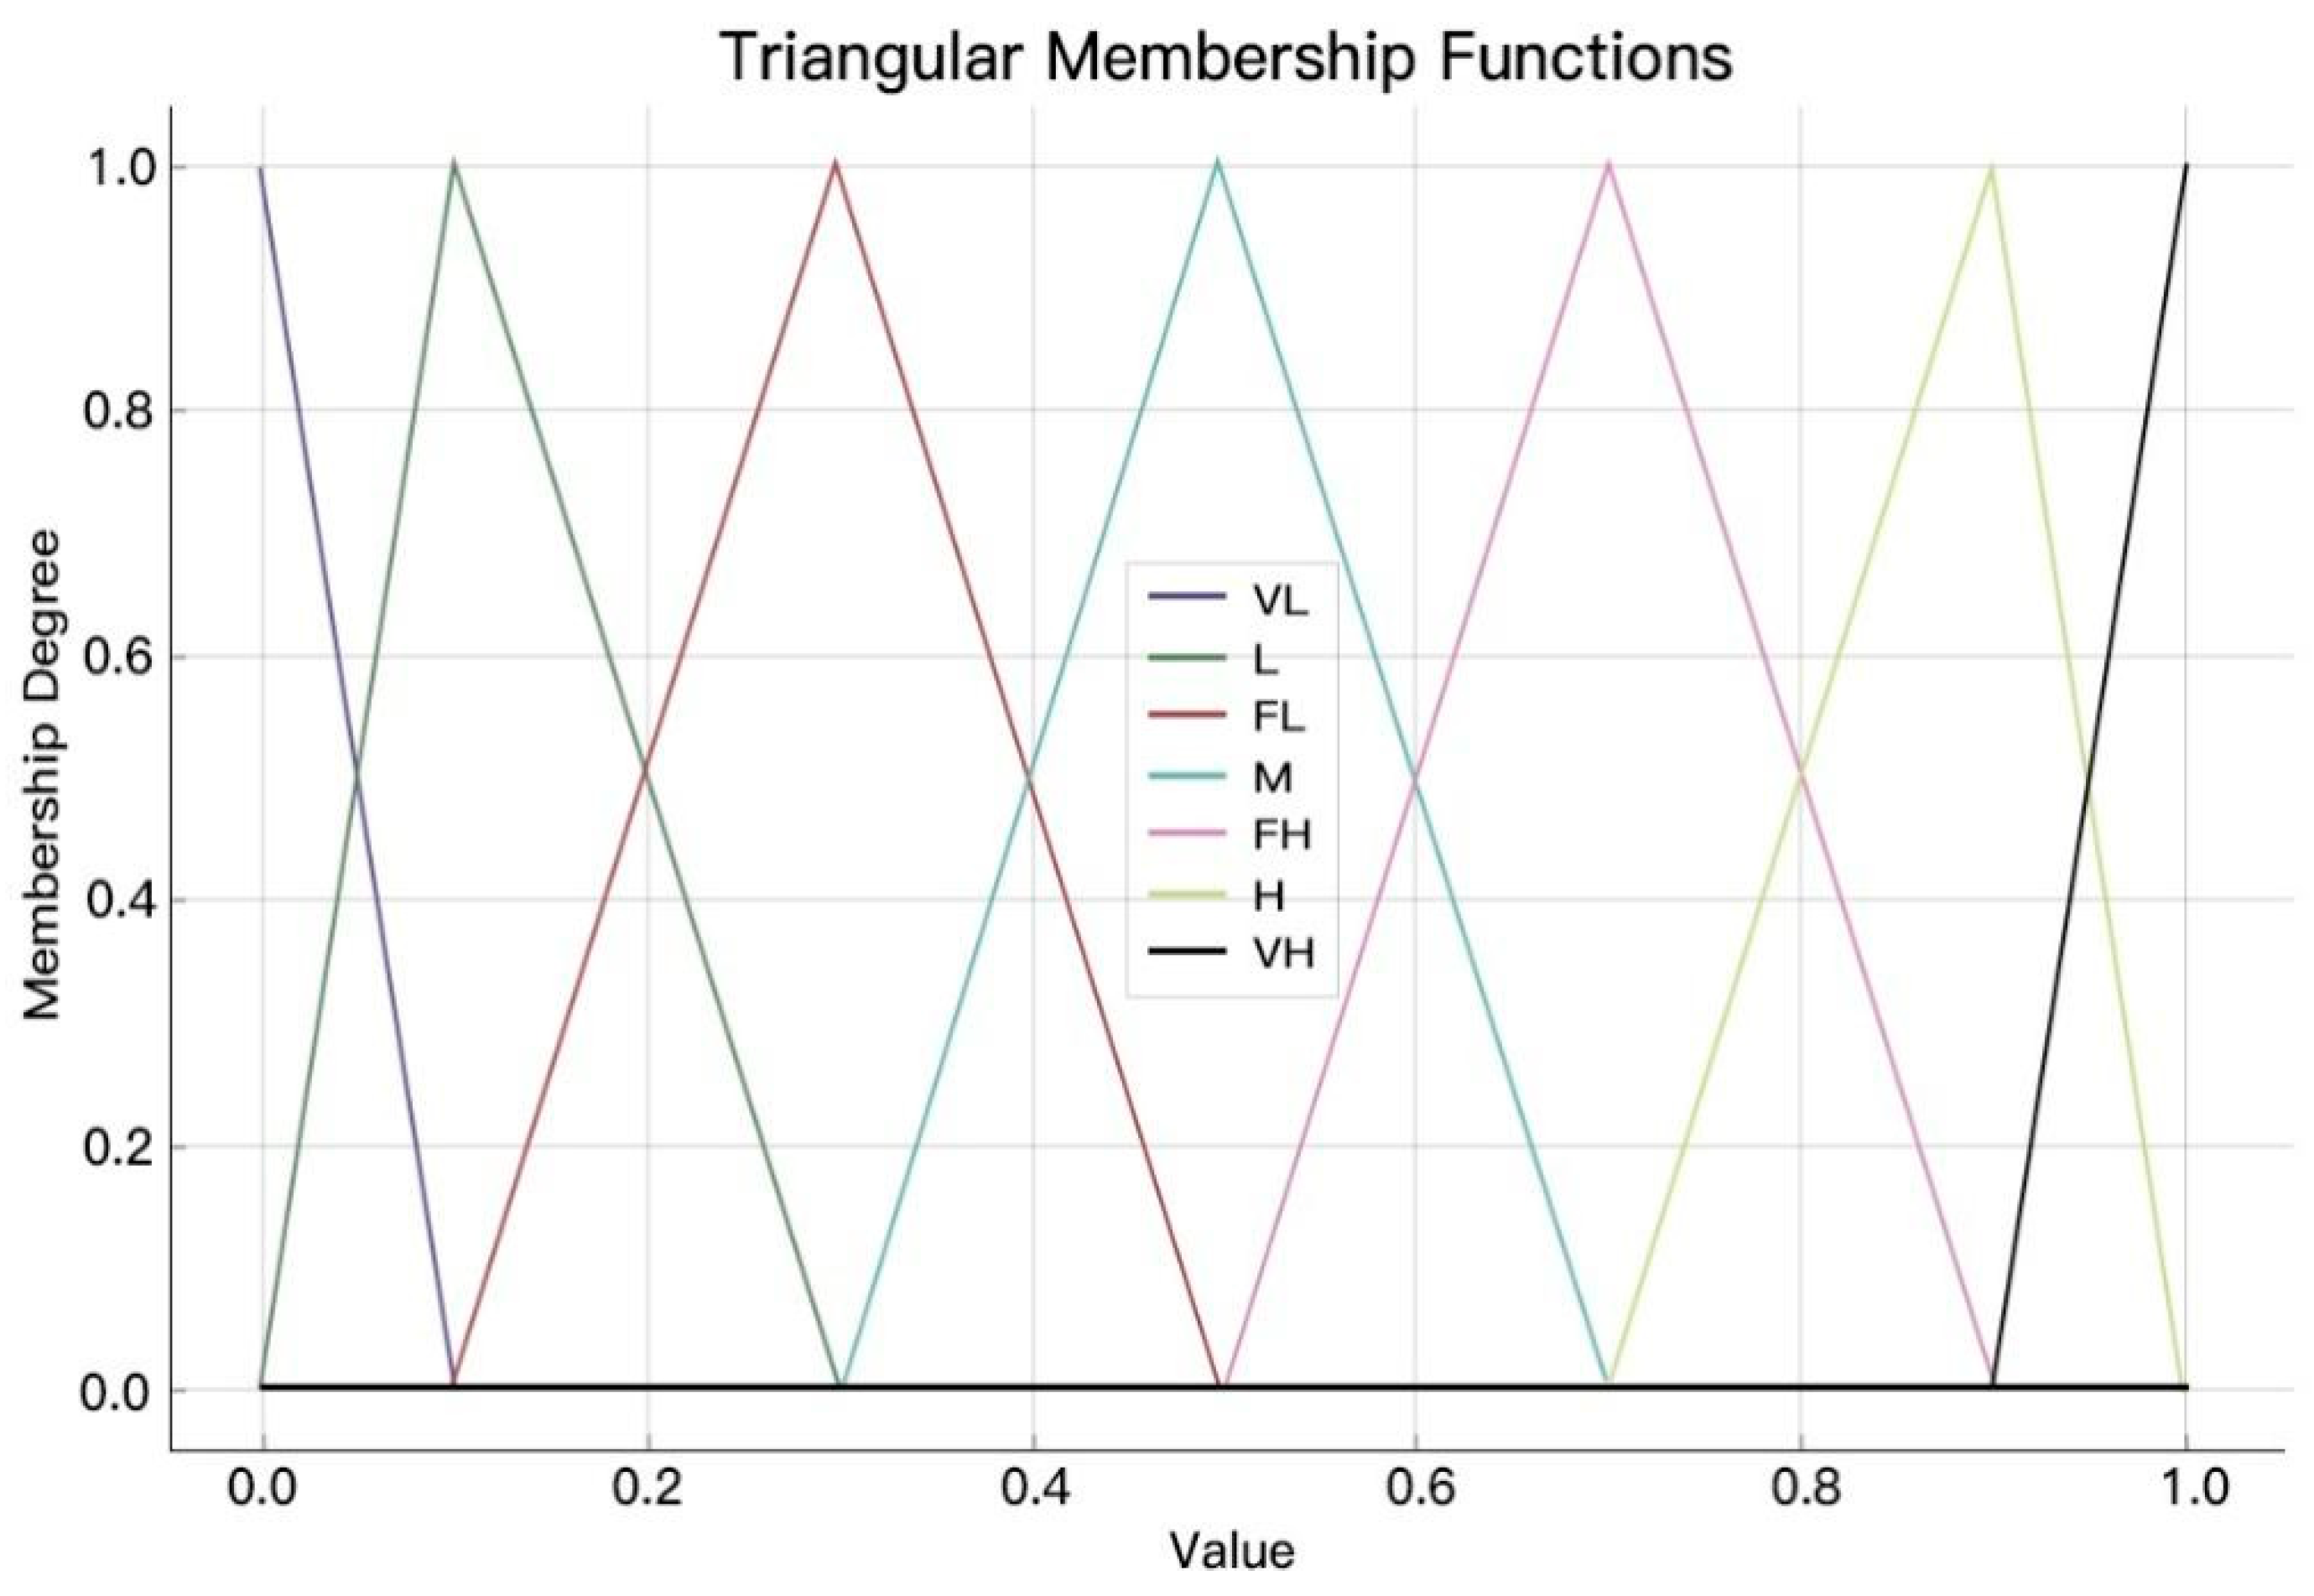
Fuzzy set theory (FST), introduced by Zadeh [41] in 1965, is designed to address uncertainties caused by imprecision and vagueness, making it ideal for scenarios characterized by uncertainty, subjectivity, or incomplete information [42,43,44]. In risk assessment, fuzzy theory is utilized to quantitatively analyze risk factors that cannot be precisely quantified [45,46] and has been established as a vital tool in this field [47]. The integration of fuzzy theory with BNs has resulted in the creation of FBN, which enhance the ability to manage uncertain information and broaden their use in complex decision-making. In FBNs, the selection of suitable fuzzy probability measures is critical [48]. Prominent fuzzy numbers currently employed include triangular fuzzy numbers [49], trapezoidal fuzzy numbers [50], and Gaussian fuzzy numbers [51], with triangular fuzzy numbers being widely favored for their advantages in processing imprecision and ease of computation. This research adopts triangular fuzzy numbers to express the probability of event occurrences. The function image is depicted in Figure 2, and the membership function is defined in Equation (3):
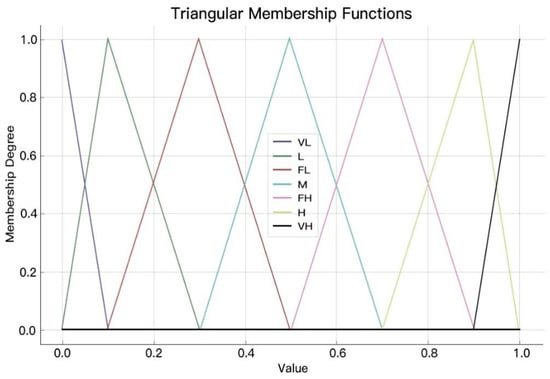
Figure 2.
Membership functions of natural language variables and triangular fuzzy numbers.
4. Model Construction
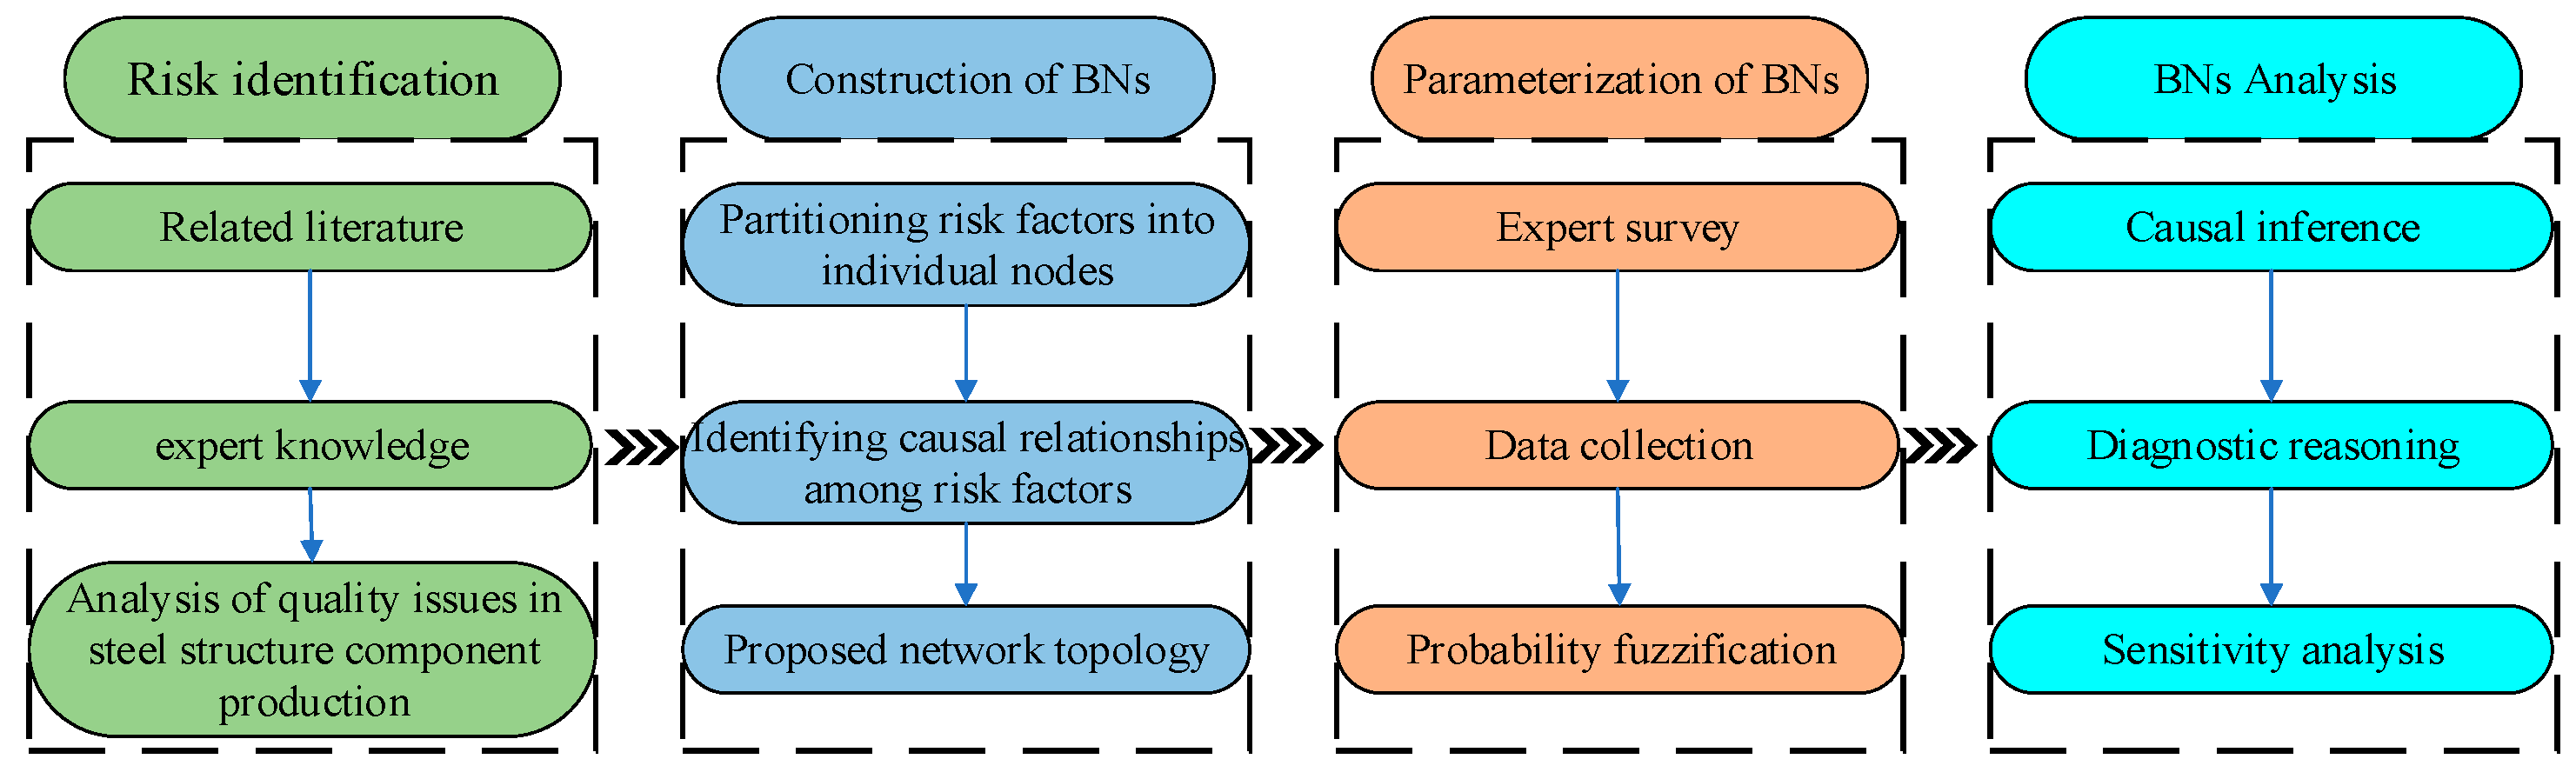
To comprehensively assess the quality risks associated with the production of prefabricated steel structural components, the model construction encompasses four steps. Initially, potential risks and their causative factors are identified through a literature review and expert consultation. Subsequently, a BN model that links all variables is constructed. Thereafter, FST and expert judgments are integrated, utilizing the SAM to calculate and defuzzify the probabilities of the risk nodes. Ultimately, GeNIe 4.1 software and Bayesian reasoning are employed to evaluate the risks. The detailed processes are illustrated in Figure 3.
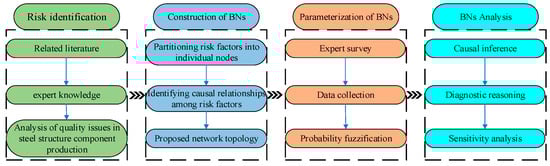
Figure 3.
Risk assessment process for the quality of prefabricated steel structural components in construction.
4.1. Risk Identification for the Quality of Steel Component Production
The primary aim of risk identification in the production of steel structural components is to promptly and accurately detect risk factors that affect quality, a crucial element in developing an effective risk assessment model. This research integrates quality management theory with actual risk identification practices to establish a risk identification framework, further incorporating the 5M1E theory, as discussed by P. Cao et al. [52] and Friederich & Lazarova-Molnar [53]. Subsequently, the theoretical framework was revised based on the findings from actual production surveys: the “measurement” factor has been substituted with “management scheme” risk to accurately reflect the impact of management decisions on production quality; similarly, “method” has been replaced by “technological” risk, highlighting the pivotal role of production technology and process flows in risk management. Through comprehensive surveys and domain expert knowledge, risk factors were meticulously refined and categorized into six main dimensions, , and 21 secondary factors, , with names, symbols, and descriptions as detailed in Table 1 and Table 2, ensuring the scientific integrity, systematic approach, and comprehensiveness of the assessment indicator system.

Table 1.
Classification and description of primary risk factors for the quality of prefabricated steel structural components.
Table 2.
Classification and description of the secondary quality risk factors for prefabricated steel structure components.
4.2. Structure of Bayesian Networks
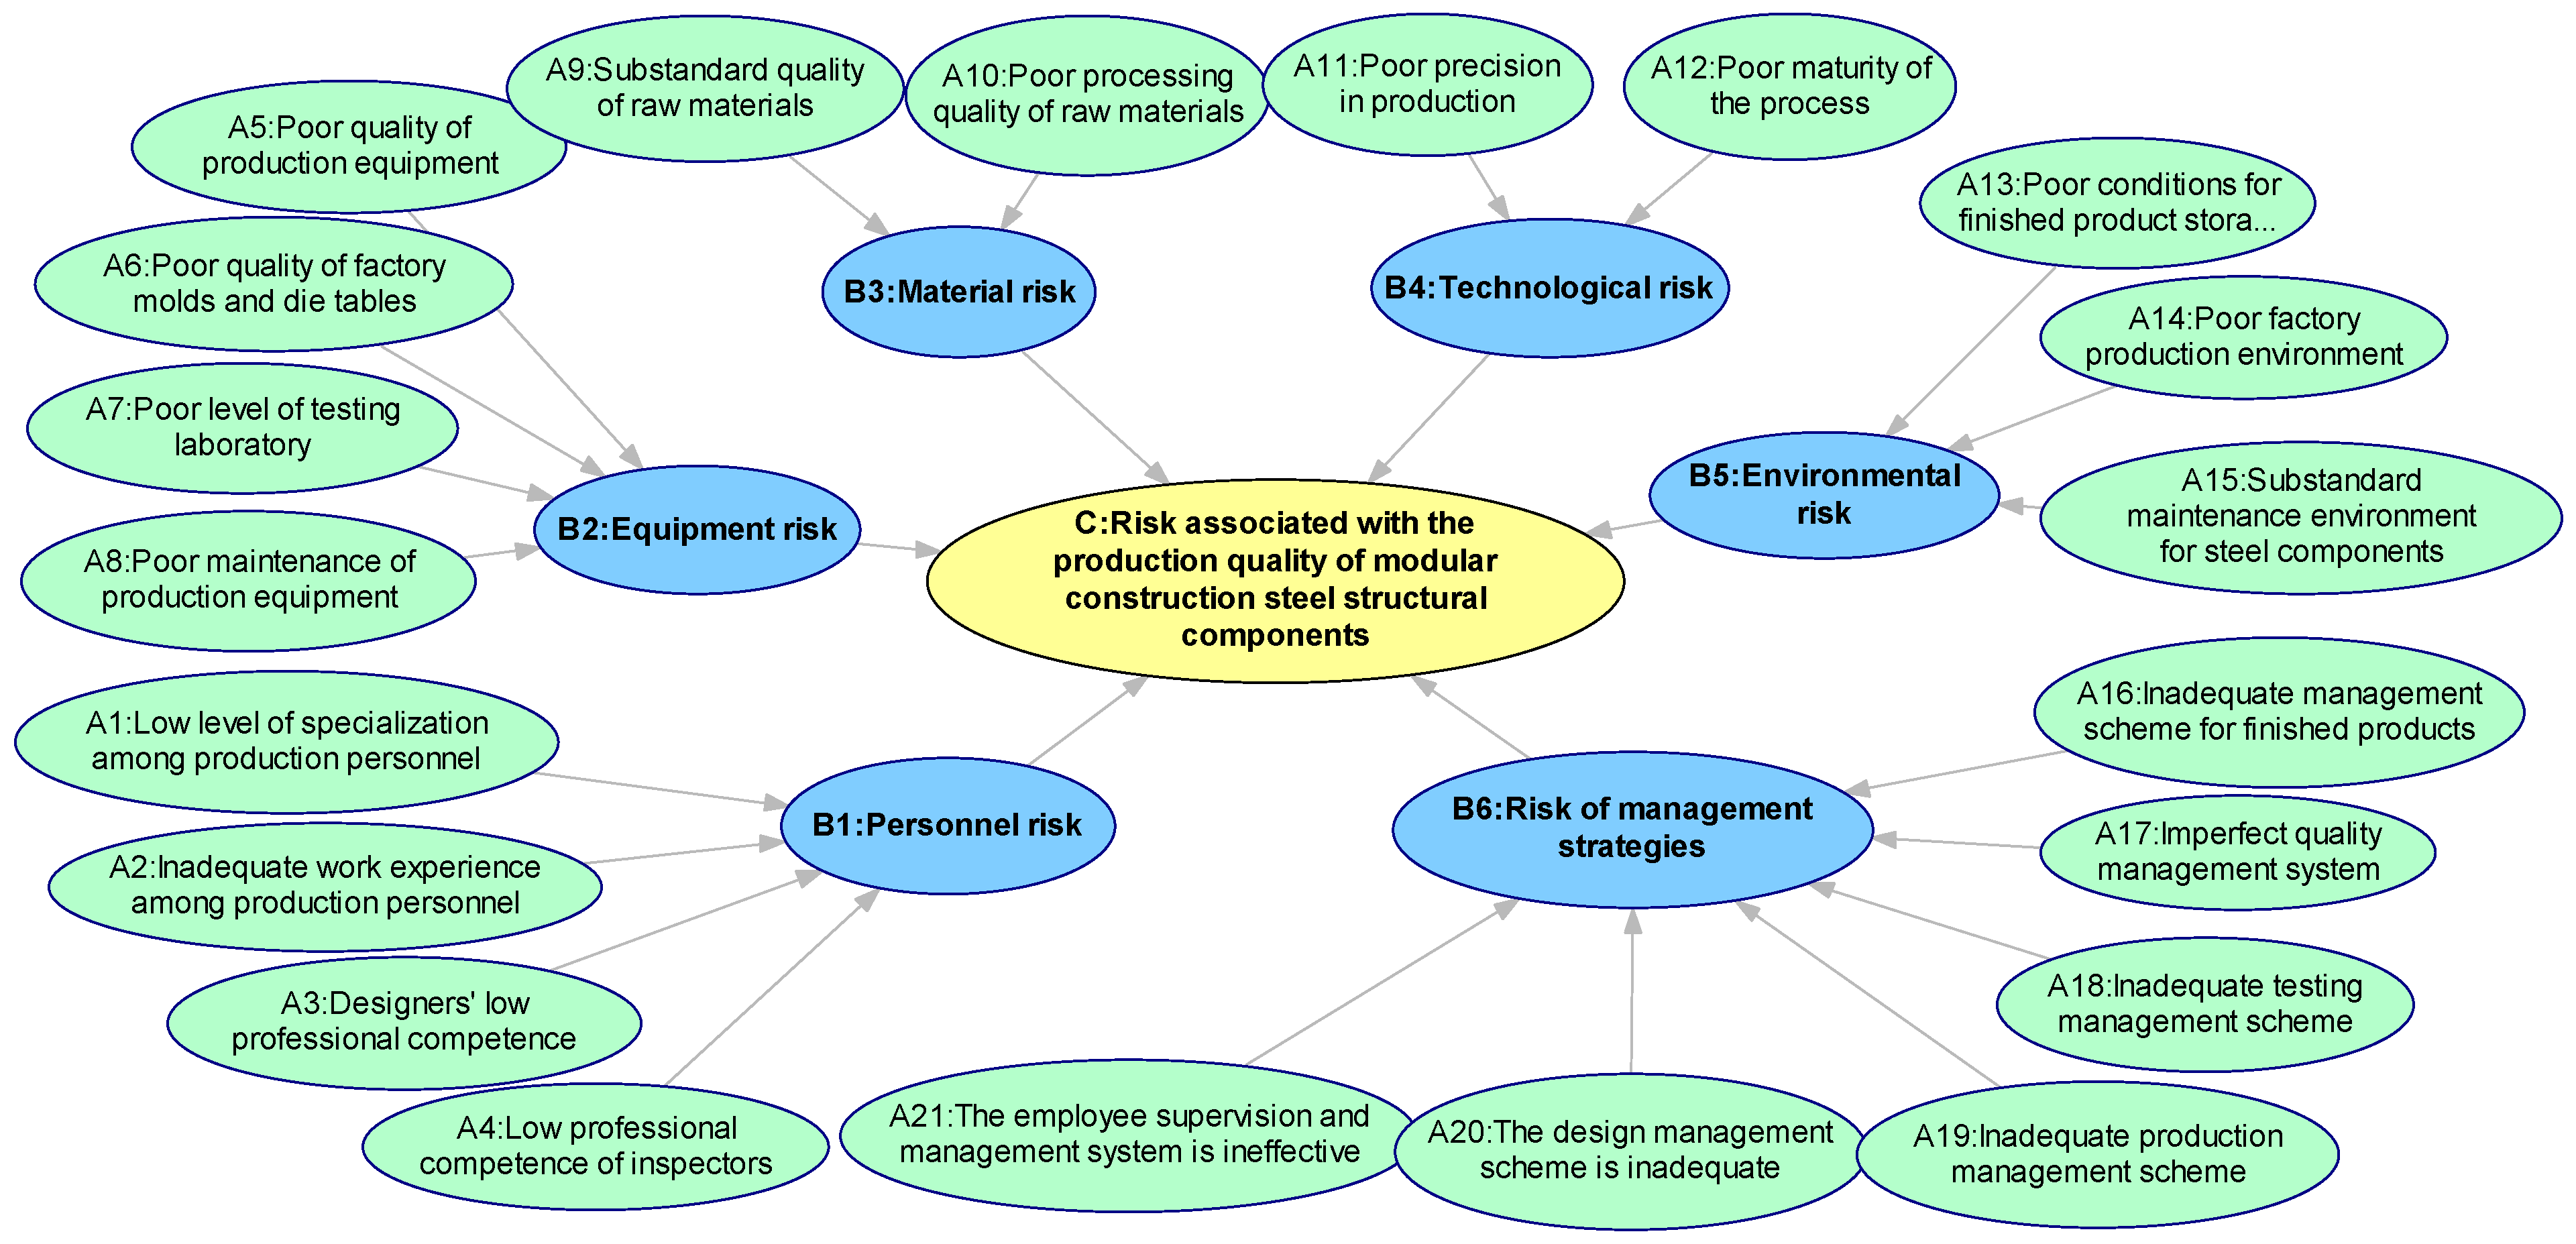
This study utilizes expert interviews and analyses conducted during the production phase of prefabricated components to ensure the universality of the Bayesian network structure employed for assessing quality risks in producing steel structural components for prefabricated buildings. After clarifying the variables of each node and their dependencies, the foundational architecture of the Bayesian network for quality risk factors in steel structural component production was established. In this network, root nodes are represented by green fill, intermediate nodes by blue, and target nodes by yellow highlighting, as shown in Figure 4.
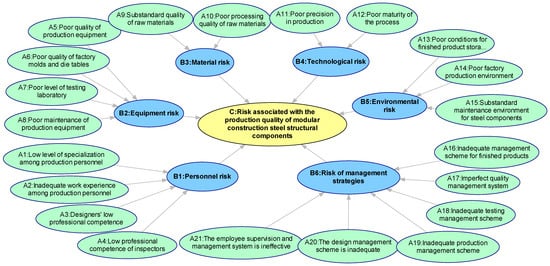
Figure 4.
Bayesian network for quality incidents during the production phase of prefabricated steel structural components.
4.3. Bayesian Network Parameter Learning
Parameter learning in Bayesian networks is focused on determining the prior probabilities for root nodes and the CPTs for intermediate and target nodes. This process aims to enhance the efficiency and accuracy of probability estimates during this phase and to optimize the integration of expert judgments. In this study, the probabilities of all nodes within the network are calculated by integrating FST, expert judgment methods, and the SAM.
4.3.1. Determining the Prior Probabilities of Root Nodes
Obtaining data on quality issues during steel structural component production is often challenging. Due to the multitude of quality risk sources and significant uncertainties in production, domain experts commonly utilize FST for fuzzy judgments, typically ranging from 5 to 9 levels [54]. To align expert opinions with triangular fuzzy numbers, a 7-level natural language variable scale [55] is employed to assess the probabilities of root nodes. These linguistic variables are then converted into specific fuzzy numbers, with detailed divisions of fuzzy probability intervals outlined in Table 3. Subsequently, the SAM [56,57,58] aggregates assessments from various experts. In complex decision-making contexts, the integration of FBN and SAM demonstrates considerable advantages over alternative methods (e.g., fuzzy prioritization, game theory, arithmetic averaging, maximum-minimum Delphi, etc.) in conjunction with FBN. To begin with, FBN effectively handles the uncertainty and vagueness of information, while SAM optimizes this process by effectively incorporating multiple expert viewpoints through statistical means, thereby reducing individual bias and enhancing the accuracy of decision support [59]. Moreover, FBN in conjunction with SAM can more effectively manage and analyze large volumes of data and their intricate interrelations, making it particularly well-suited for big data environments. Conversely, other techniques such as fuzzy prioritization or Delphi methods may prove less efficient when dealing with extensive data sets [60]. Arithmetic averaging, on the other hand, may oversimplify expert opinions and disregard crucial distinctions among them. Although game theory accounts for the interactions among decision-makers, it may be overly complex and difficult to apply directly to all types of decision problems in practical settings [61]. Therefore, the combination of FBN and SAM not only enhances the flexibility and adaptability of the model, but also improves the accuracy and practicality of decision-making, which is especially beneficial for scenarios that require the integration of substantial amounts of intricate information.
Table 3.
Natural language variables and their corresponding membership functions.
The fusion of FBN and SAM is applied with the aim of improving the accuracy and reliability of risk assessment of the production quality of assembled steel components. In this study, the structure of FBN is first defined, including nodes and edges. Each node represents a risk factor, such as the designer’s level of expertise, production fineness, and the preservation environment of the finished product. The edges, on the other hand, represent the causal relationship between these factors. Next, initial probability distributions and fuzzy logic parameters are set for each risk factor node, which are initially set based on historical data and preexisting expert opinions. SAM is used to integrate opinions from multiple experts to enhance the consistency and objectivity of the assessment, and first collects the ratings of multiple experts on the impact level of each risk factor. By calculating the similarity of assessments between experts, SAM aggregates these assessments into a single composite score. This process, in which each expert’s judgment is assigned a different weight based on its similarity to other experts’ assessments, ensures that the aggregated assessments reflect both expert consensus and retain key individual insights. Fuzzy number defuzzification is extremely critical in the decision-making process [62], where fuzzy numbers aggregated through the SAM method are defuzzified through the center-of-area (CoV) method [63,64] and converted into specific probability values [65,66], which ultimately lead to the specific probability value of each root node, which is used to update the fuzzy logic parameters in the FBN, reflecting the degree of the impact of each risk factor on the quality of production, enabling the FBN to more accurately simulate the real risk situation and laying the foundation for further quality risk assessment.
However, there are potential biases in using expert judgment for parameter learning at this stage. These biases may affect the results and conclusions of the study. First, the main sources of bias are personal experience and cognitive bias, information availability bias, confirmation bias, and collective homogenization [67]. For example, personal experience and cognitive bias can cause experts’ subjective judgments during assessment to be biased toward their own past experiences, thus overestimating or underestimating certain risk factors. In addition, information availability bias makes it possible for experts to over-rely on easily accessible information and ignore difficult-to-obtain but equally important data. Further, confirmation bias leads to selective bias in individuals’ processing of information, with a tendency to validate their own expectations or beliefs. Collective homogenization emphasizes the tendency of experts to express and support similar or identical views in assessments, thereby reducing the objectivity of the views. The presence of these biases may not only affect the development of risk management strategies, but may also reduce the reliability of model predictions, thus affecting the effectiveness of decision-making in component manufacturing plants. Therefore, in order to reduce the impact of biases in expert judgment in parameter learning and to enhance the objectivity and reliability of the study, several mitigation measures were taken during the questionnaire process for domain experts. First, structured multi-expert judgments are implemented, whereby multiple experts with different backgrounds independently conduct assessments and compare their perspectives, which helps to identify and reduce individuality bias and collective homogenization bias [68]. In addition, combining some quantitative data provided by actual steel component manufacturers’ and experts’ judgment and combining empirical data with subjective assessments of experts can effectively calibrate and validate the experts’ judgments, thus improving the prediction accuracy of the model and the effectiveness of the decision. Through these comprehensive measures, the credibility and practicality of the research results can be significantly improved.
4.3.2. Determination of the CPTs for Intermediate and Target Nodes
The noisy-OR gate model is a simplified probabilistic graphical model utilized for describing binary output nodes, particularly in cases where multiple factors exert influence. In Bayesian networks, when a node has numerous parent nodes, the impact of these parents on the child node can be complex and not entirely independent. The noisy-OR gate model posits that each parent node contributes independently to the activation state of the child node with some probability, while the inactivated state of the child node is attributable to the joint probability of all parents failing to activate it. In the process of parameter learning for Bayesian networks, particularly when the amount of data is insufficient to fully characterize all conditional probabilities, a substantial amount of data is required to directly compute the CPT. The noisy-OR gate model offers an efficient approach to estimate node dependencies [69]. Its advantage lies in the assumption of independence of the parent nodes’ influence on the child nodes, which allows for the approximation of complex CPTs with fewer parameters, making it suitable for small datasets and multi-parent node scenarios [70]. For instance, in this study, we employ a noisy-OR gate model to estimate the effect of individual factors, such as the quality of production equipment or environmental problems in preserving finished products, on final product quality. Within the noisy-OR gate model, node statuses are designated as either “Yes” or “No”. When solely is marked as “Yes” while all other parent variables are set to “No”, the probability for the child node is formulated as follows:
Subsequently, are calculated to determine the additional terms in the CPT of the child node , as shown in the following equation:
The conditional probability is obtained through expert judgment.
4.4. BN Inference and Sensitivity Analysis
This study utilizes GeNIe4.1 software to process Bayesian networks, enabling the input of network structure, prior probabilities, and conditional probabilities. This study establishes a framework for causal reasoning, diagnostic reasoning, and sensitivity analysis. Causal reasoning occurs through forward inference in BNs, calculating the conditional probabilities of target nodes based on known states of child nodes, thereby quantitatively assessing risks under specific conditions. Conversely, diagnostic reasoning employs backward inference in BNs, setting specific states for target nodes and calculating posterior probabilities of child nodes. Elevated posterior probabilities highlight key risk factors, informing risk diagnosis and control. This method identifies critical risk pathways, aiding in the development of risk prevention and control measures.
5. Application of BN Models
This section conducts a risk assessment for steel structural component production based on identified risk factors and the construction process of the BN network model outlined in Section 3. Initially, causal relationships among the risk factors are established (see Figure 4). Subsequently, expert assessments of the probabilities for each risk factor are gathered through surveys, which are then used to compute the probabilities for the root nodes, leaf nodes, and target nodes. Finally, the risk assessment analysis was performed using GeNIe4.1 software.
5.1. Prior Probabilities of BN Root Nodes
In the process of establishing the prior probabilities for the root nodes, this study involved four domain experts from steel component manufacturing firms and academic institutions in a questionnaire survey. Given that variations in experts’ work experience, educational backgrounds, qualifications, and confidence in assessment could subjectively affect the accuracy and consistency of their opinions, the objective weights of the experts were calculated based on a background survey [71]. These weights were evaluated using the criteria listed in Table 4, and the final weights assigned to the four experts are displayed in Table 5.
Table 4.
Criteria for calculating expert weights.
Table 5.
Expert weights.
The judgments of the four experts are aggregated and subjected to defuzzification, yielding calculations of and . The details of the expert judgments and the corresponding calculation results for the root nodes are presented in Table 6.
Table 6.
Expert judgments for root nodes, aggregated fuzzy numbers, , and .
To minimize redundancy, the calculation of the prior probability for “Poor Factory Production Environment ” is presented as an example to illustrate the application of the SAM in computing root nodes. A relaxation factor of is employed to calculate the consensus coefficient and is derived based on Table 4. The steps involved in the calculation are detailed in Table 7.
Table 7.
The probability calculation process for “Poor Factory Production Environment ”.
5.2. The Conditional Probabilities of the Leaf Nodes and the Target Nodes Are Determined
The conditional probabilities of the leaf nodes and the target nodes are determined using the noisy-OR gate model. To elucidate the calculation process, “Environmental Risk ()”, which has three parent nodes, is employed as a case study. The detailed process is outlined Table 8. This discussion focuses exclusively on the derivation of conditional probabilities, omitting the initial aggregation of fuzzy numbers, which are detailed for other leaf and target nodes in Table 9.
Table 8.
The CPT for the intermediate node “Environmental Risk ()”.
Table 9.
Expert assessments of leaf nodes and target nodes.
The probability of environmental risk is determined to be 12.492%. Following the computation of other nodes’ probabilities using the same method, risk propagation and sensitivity analyses are conducted using BN to identify the primary factors and pathways influencing the production of steel structural components.
5.3. Inference Results
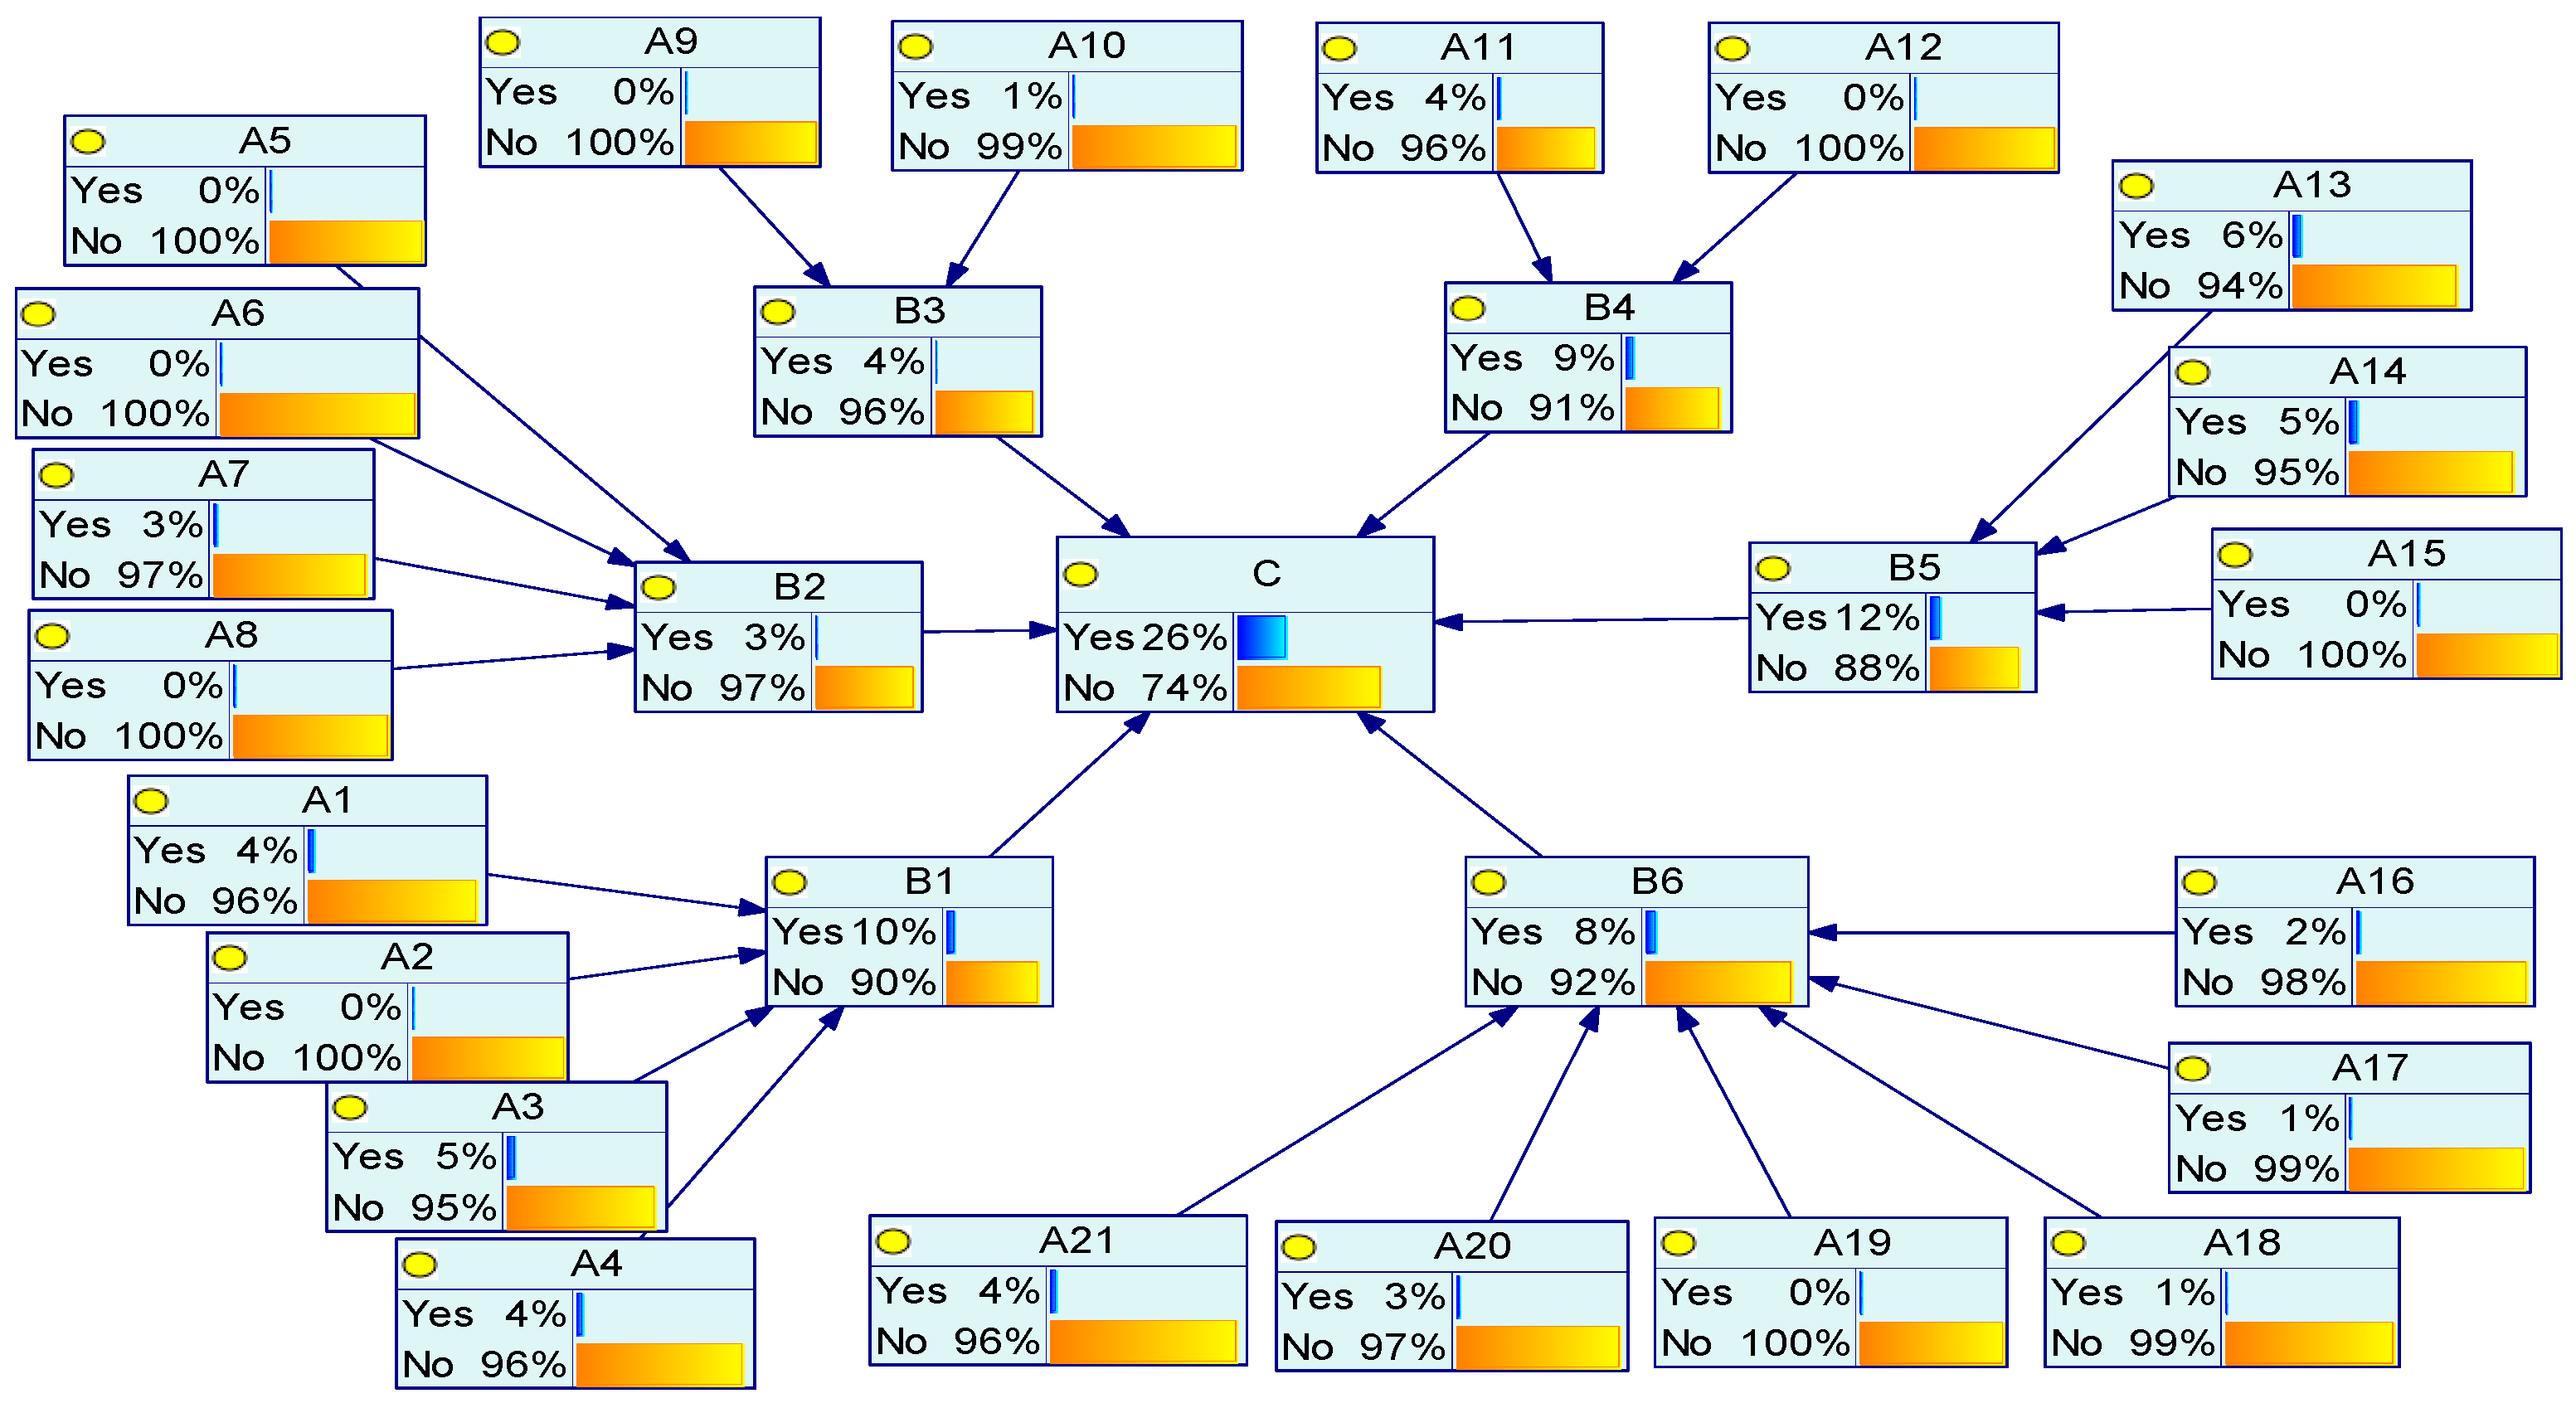
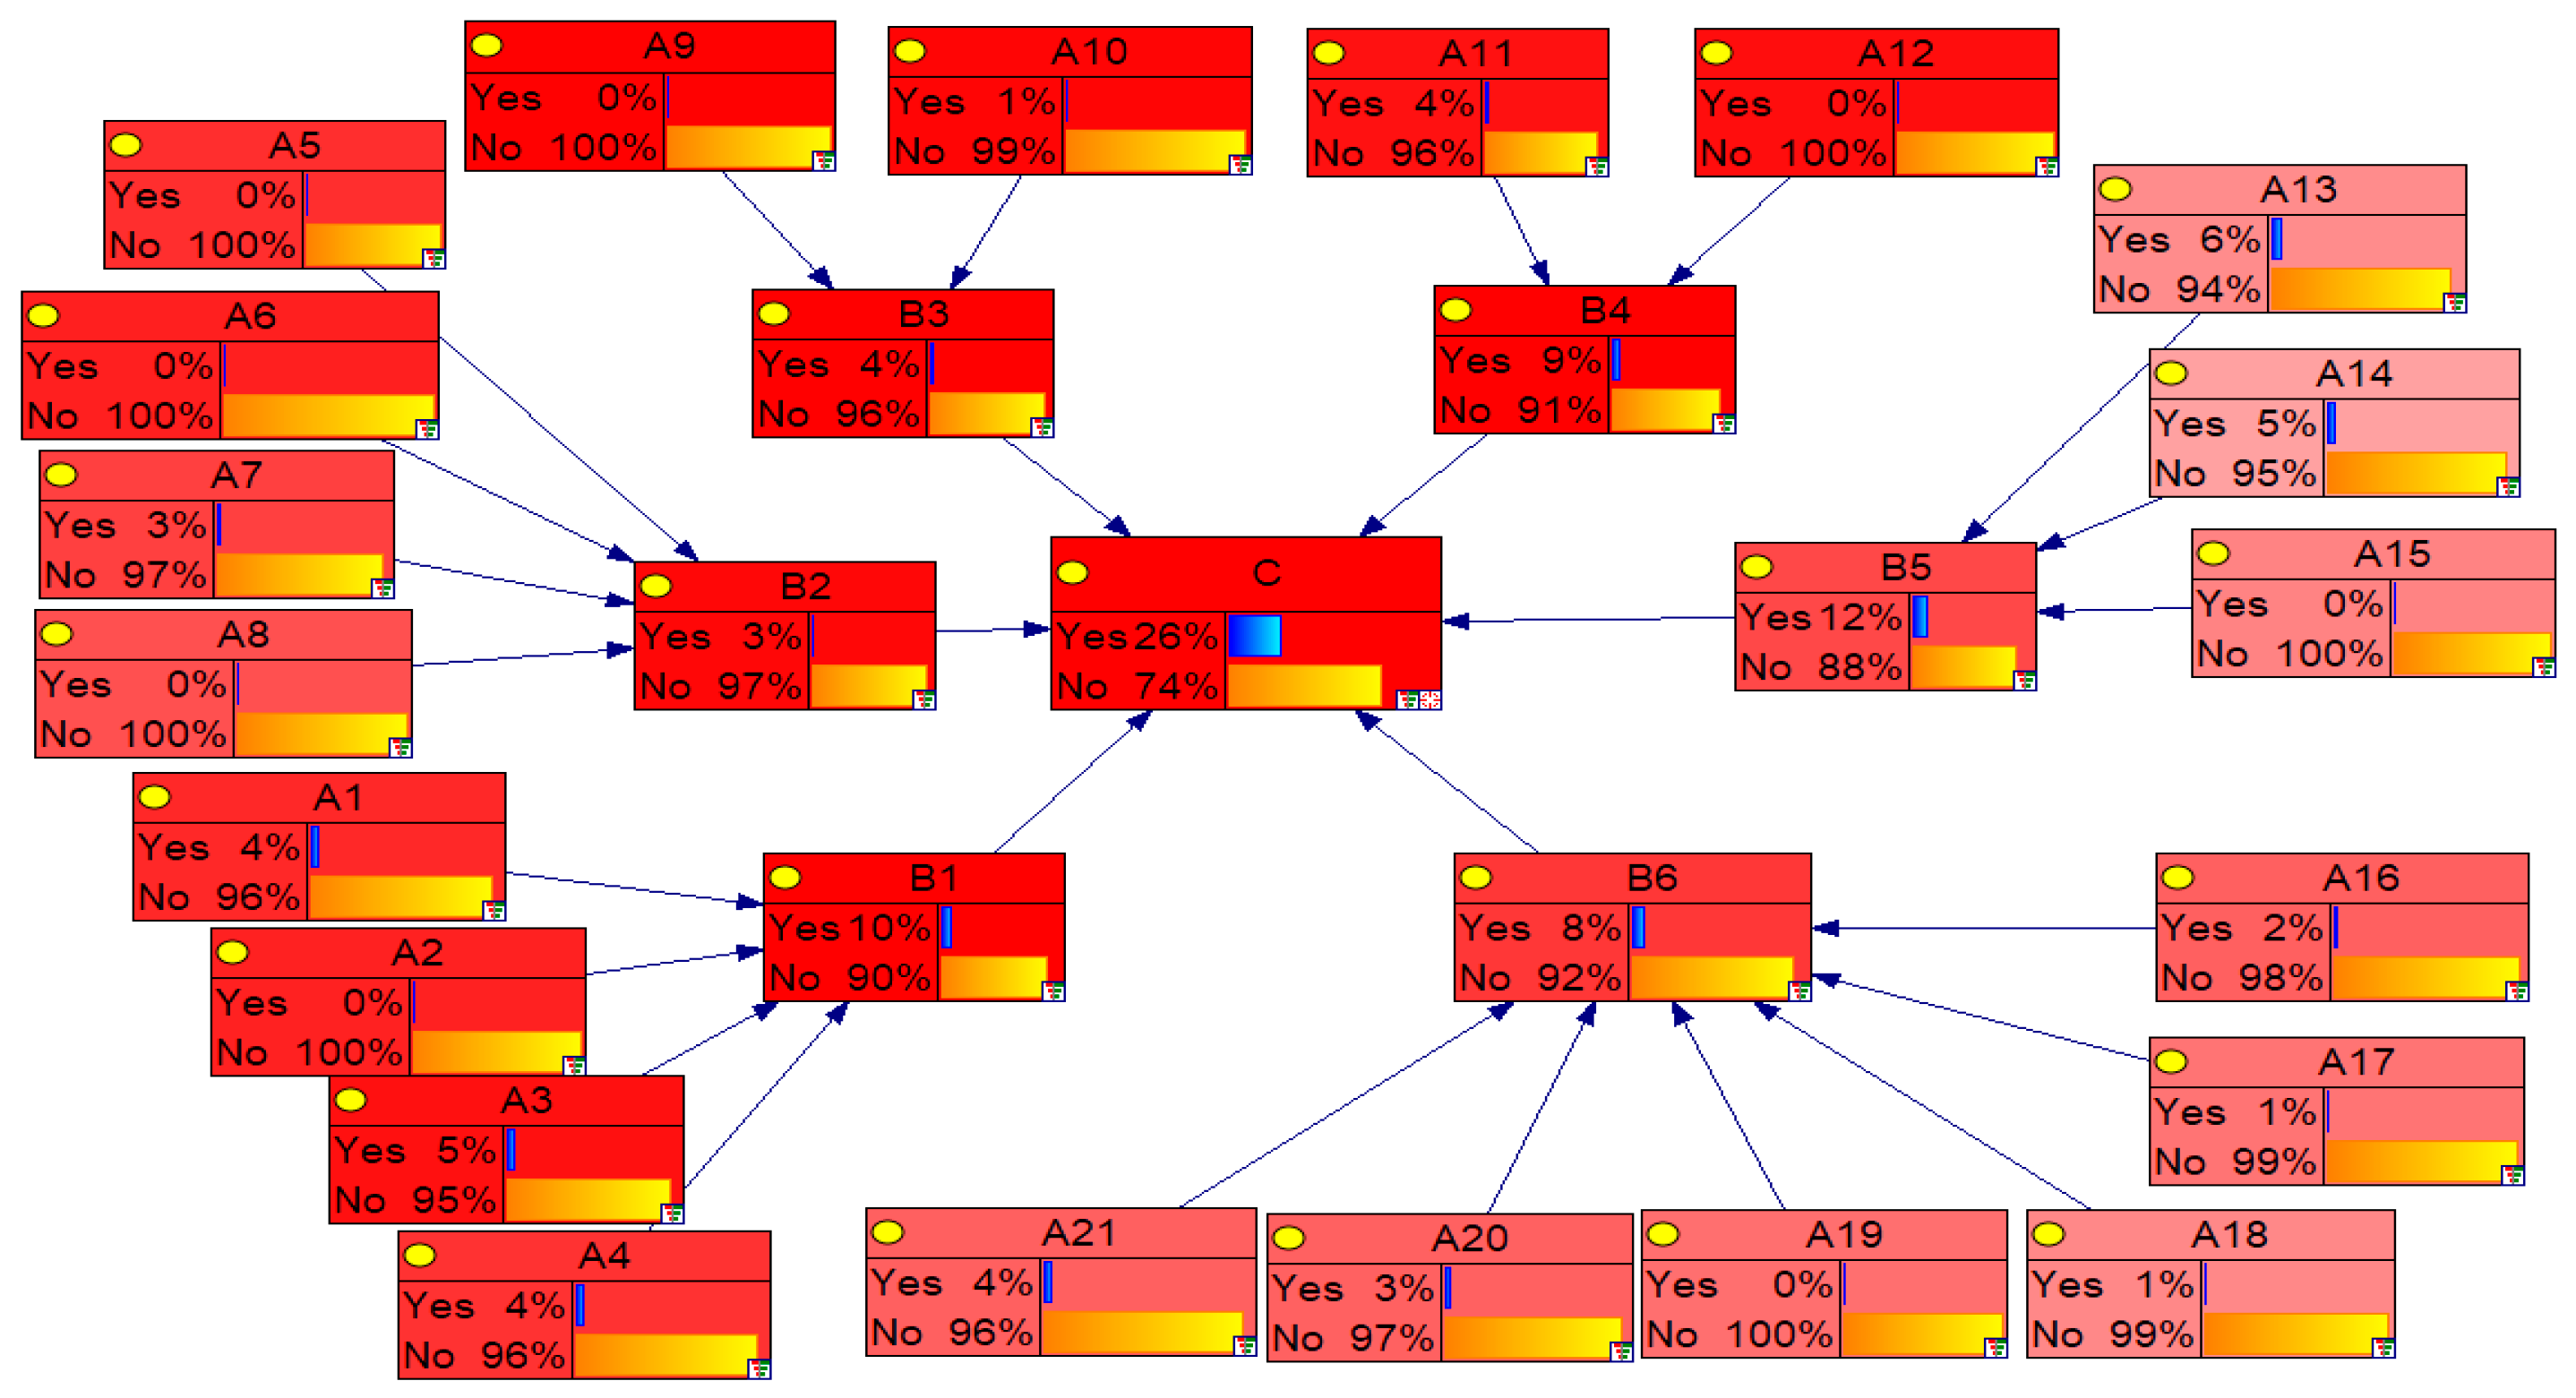
Following the derivation of prior probabilities for root nodes and conditional probabilities for leaf and target nodes using the method described above, these probabilities are uploaded into the GeNIe4.1 software. This facilitates the establishment of probabilistic connections among the nodes, culminating in a Bayesian model for assessing quality risks associated with the production phase of prefabricated building steel structural components, as depicted in Figure 5.
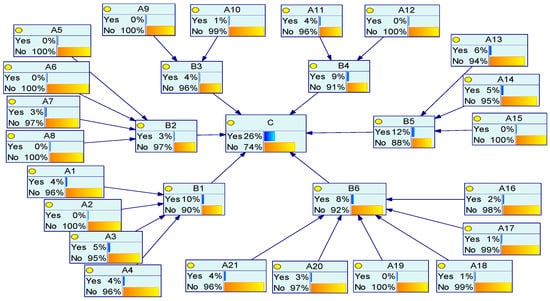
Figure 5.
BN diagram of quality risk assessment during the production phase of prefabricated building steel structural components.
Bayesian forward inference revealed that the probabilities of occurrence for personnel risk , equipment risk , material risk , technical risk , environmental risk , and management plan risk were 10%, 3%, 4%, 9%, 12%, and 8%, respectively. The cumulative quality risk during the production phase of steel structural components reaches 26%, significantly surpassing the minor event threshold of 5% [72], highlighting notable quality risks. Low professionalization of production personnel, designers, and inspectors may drive personnel risk, while technical risk primarily stems from insufficient production precision. Environmental risk is influenced by storage conditions and the manufacturing environment; management plan risk could result from flawed management strategies or ineffective oversight. With the probabilities of these risks exceeding 5%, further investigation into the causal pathways and critical sensitive factors is warranted to establish a foundation for developing preventive measures.
5.4. Diagnostic Reasoning
The occurrence probability of “quality risk in prefabricated building steel structural component production” is set at 100%, and diagnostic inference using GeNIe4.1 software facilitates the analysis of the principal causes and pathways of risk propagation. Figure 6 illustrates that “Personnel Risk ” has the highest occurrence at 34%, whereas “Equipment Risk ” has the lowest occurrence at 9%. A deeper examination of the chief propagation routes for intermediate nodes, as depicted in Table 10, shows the increments in each risk factor. Specifically, increases of 24% were observed for personnel risk, 6% for equipment risk, 8% for material risk, 18% for technical risk, 14% for environmental risk, and 10% for management plan risk. Consequently, the primary direct causes are “Personnel Risk ”, “Technical Risk ”, and “Environmental Risk ”, with significant influences arising from “Low Professionalism of Designers ”, “Inadequate Production Precision ”, and “Poor Finished Product Storage Environment ”. These elements are pivotal to the quality risk during the production stage of steel structural components.
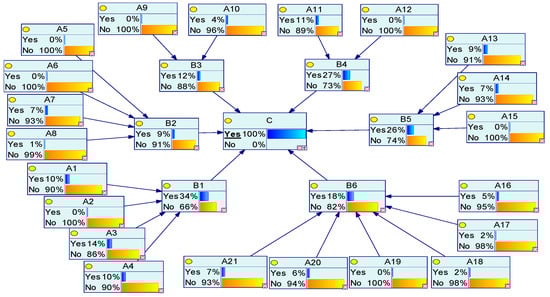
Figure 6.
Outcomes of reverse inference.
Table 10.
Primary propagation pathways from root nodes to leaf nodes to target nodes.
5.5. Sensitivity Analysis
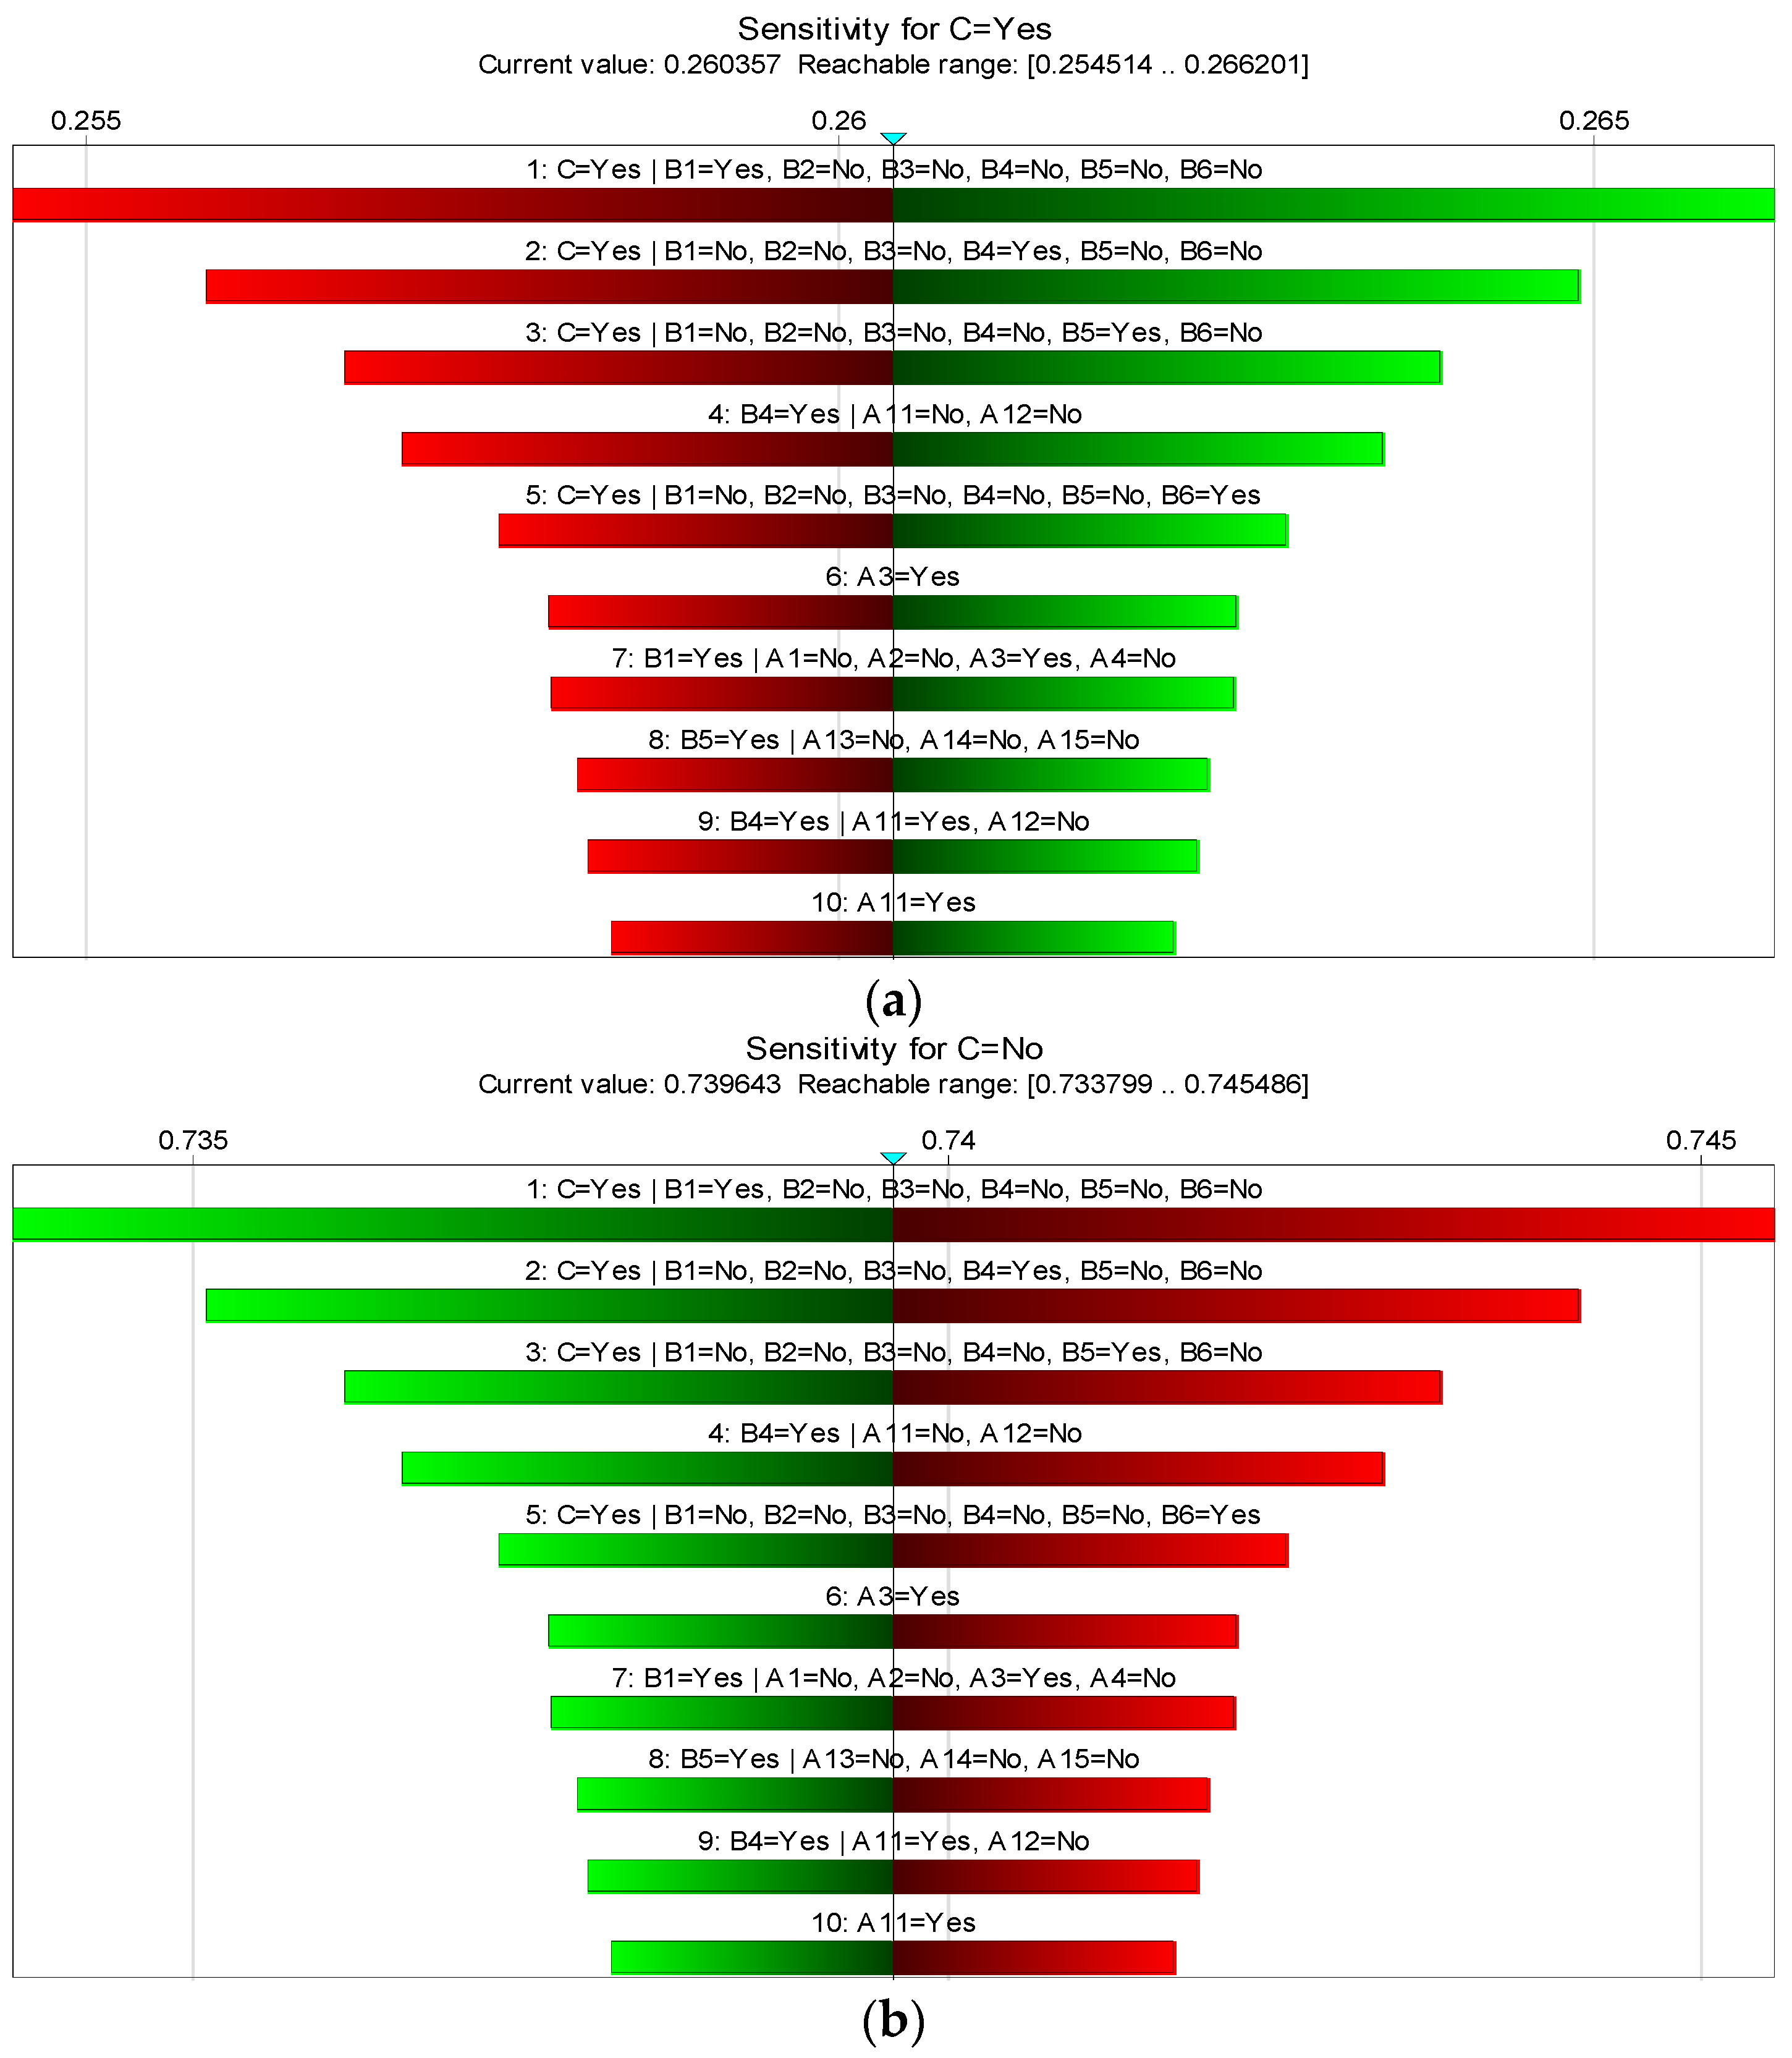
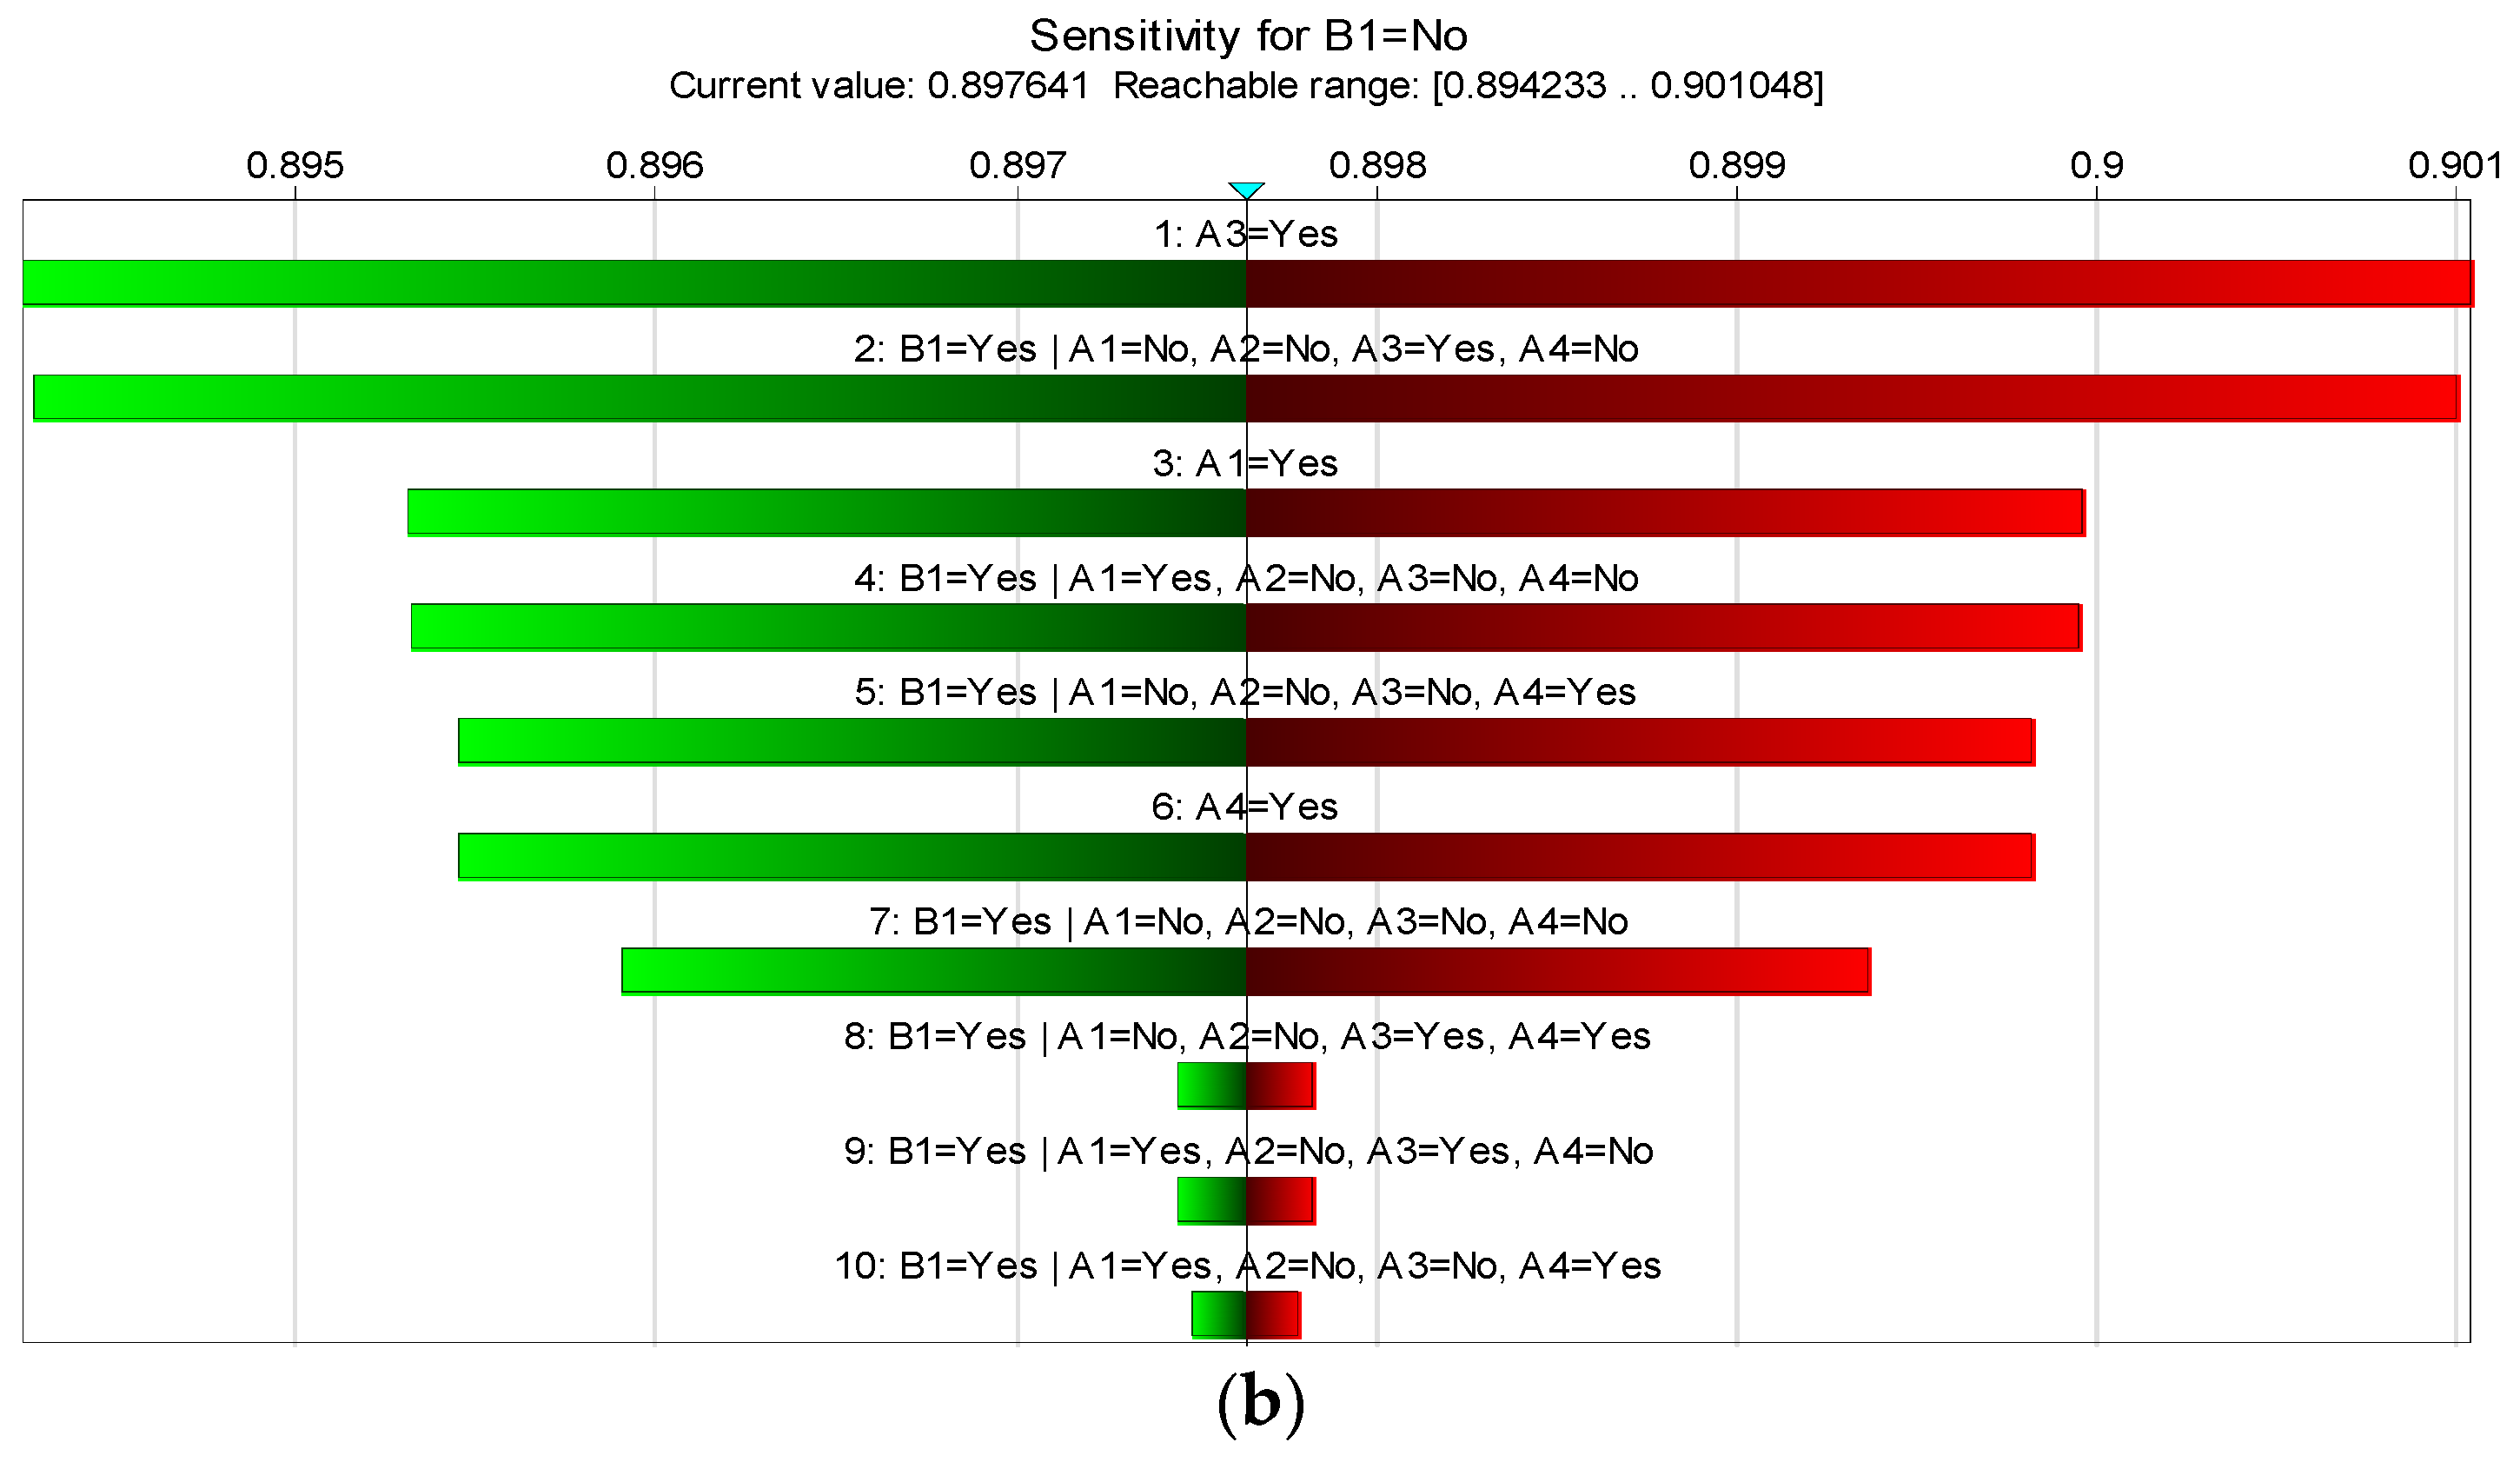
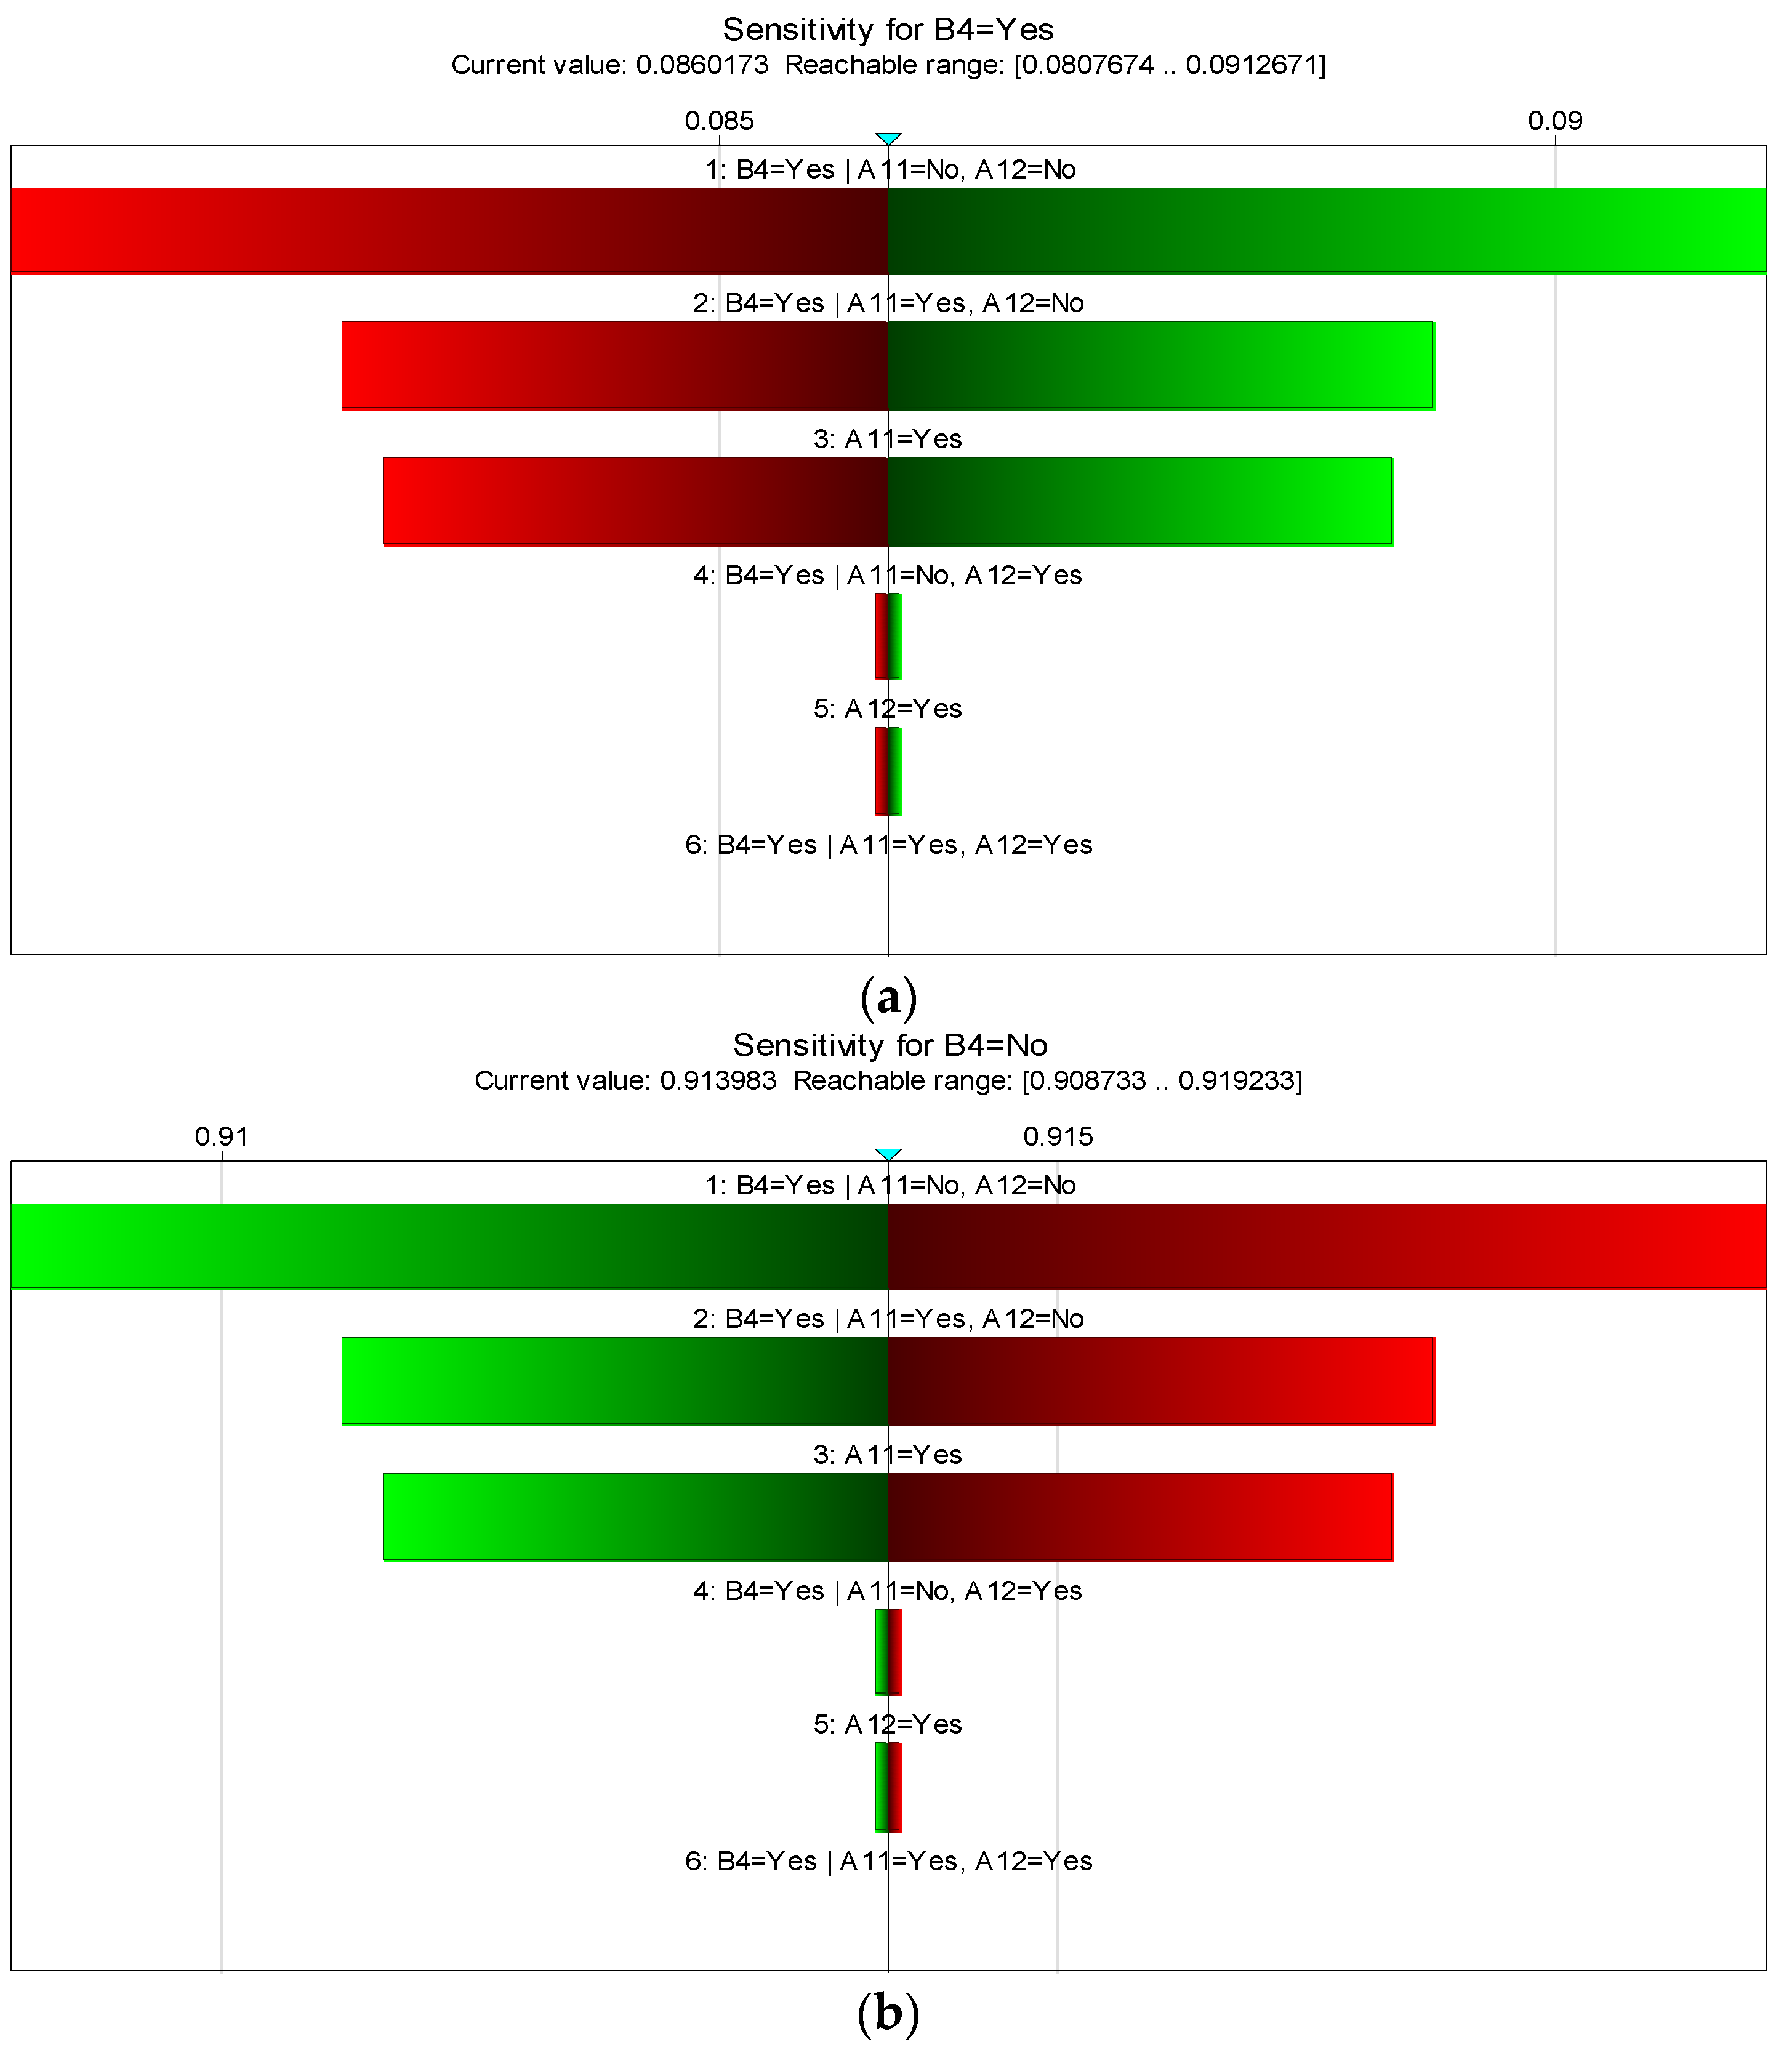
Sensitivity analysis aids in identifying significant risk-affecting events within the BN model [73], enhancing the understanding of the model. A sensitivity analysis of the “Quality Risk in Prefabricated Building Steel Structural Component Production C” conducted in GeNIe4.1 software is depicted in Figure 7, which shows that the depth of red in node colors reflects the sensitivity to risk, with deeper red indicating higher sensitivity. For clarity, sensitivity is represented by the length of the bars in the bar charts, with color changes indicating the direction of impact: red for negative changes and green for positive changes. As shown in Figure 8, personnel risk , technical risk , and environmental risk are the primary direct factors of quality risk. Further sensitivity analysis, as shown in Figure 9, Figure 10 and Figure 11, reveals that “Low Professionalism of Designers ” has the greatest impact on “Personnel Risk ”, followed by “Low Professionalism of Production Personnel ”; “Poor Production Precision ” leads to “Technical Risk ”, followed by “Poor Process Maturity ”; “Poor Finished Product Storage Environment ” and “Poor Factory Production Environment ” are the primary and secondary influencing factors for “Environmental Risk ”, respectively. Combined with forward and diagnostic reasoning analysis, “Low Professionalism of Designers ”, “Poor Production Precision ”, and “Poor Finished Product Storage Environment ” are identified as key risk factors.
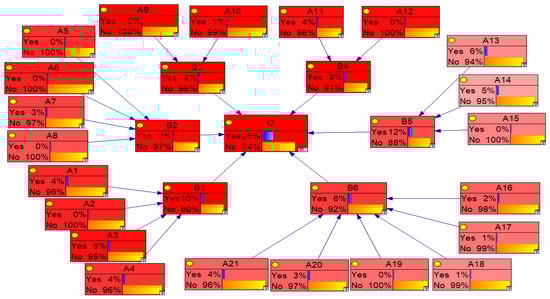
Figure 7.
Sensitivity analysis results for quality risk in steel component production.
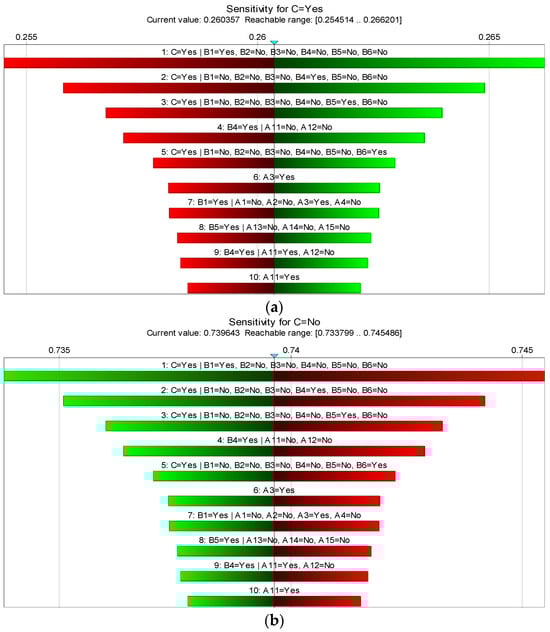
Figure 8.
Sensitivity rankings of quality risks in prefabricated building steel structural component production: (a) in the “Yes” state; (b) in the “No” state.
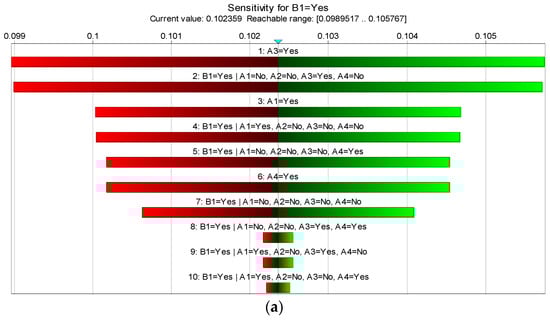
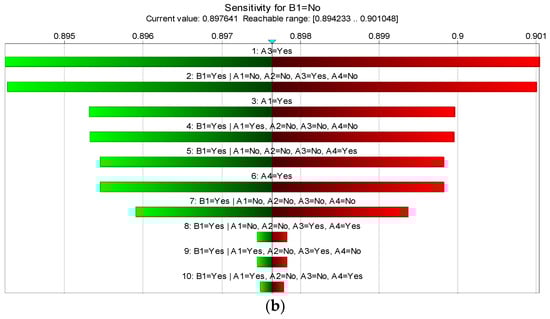
Figure 9.
Sensitivity analysis of “personnel risk ”: (a) in the “yes” state; (b) in the “no” state.

Figure 10.
Sensitivity analysis of “technical risk ”: (a) in the “yes” state; (b) in the “no” state.
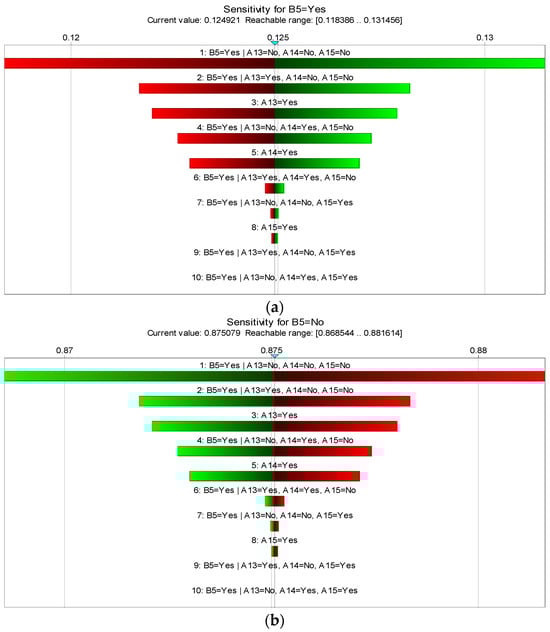
Figure 11.
Sensitivity analysis of “environmental risk ”: (a) in the “yes” state; (b) in the “no” state.
5.6. Validation of the BN Model
To ascertain the reliability of the model, this study modified the occurrence probabilities of six primary risk factors and assessed the consequent reductions in the quality risks associated with the production of prefabricated building steel structural components. Using GeNIe4.1 software, these risk factors were set to a 0% occurrence rate, and the resulting changes in target node risks are shown in Table 11. This analysis identified personnel, technical, and environmental risks as the most impactful to production quality. Further investigation into the roots of these risks involved setting the occurrence states of their parent nodes to 0% and observing the changes in initial probabilities, as detailed in Table 12, Table 13 and Table 14. The findings underscored “Low Professionalism of Designers ”, “Poor Production Precision ”, and “Poor Finished Product Storage Environment ” as the principal factors affecting these risks. In summary, the BN model has proven highly practical and effective for assessing quality risks in the production of prefabricated building steel structural components.
Table 11.
The alteration in probability associated with the target node.
Table 12.
The variation in probability for the intermediary node .
Table 13.
The fluctuation in probability associated with the intermediary node .
Table 14.
The shift in probability for the intermediary node .
6. Discussion
This study provides a new methodology for the systematic identification, assessment, and management of quality risks in the production of steel structural components for assembly buildings by constructing a fuzzy Bayesian network-based quality risk assessment model for the production phase of steel structural components for assembly. Through the comprehensive use of fuzzy set theory and Bayesian network, the experience and fuzzy evaluation from experts in multiple fields are effectively integrated, thus overcoming the limitations of traditional risk assessment methods in dealing with uncertain information in complex systems.
In practice, the model provides a nuanced insight into risk by accurately quantifying the impact of three key factors: the designer’s level of expertise, production finesse, and the environment in which the finished product is kept. For example, the model reveals that designers with low levels of expertise may significantly increase the risk of component quality defects due to design flaws, in which case the product may have structural weaknesses that are difficult to correct at the end of production. In addition, lack of production finesse was identified as another important factor for problems during production, while poor finished product preservation environments may lead to a risk of performance degradation of produced high-quality components before they are installed, and even superb-quality components may be subjected to performance degradation due to environmental factors such as excessive humidity or large temperature variations.
Further, the model not only identifies these risk factors but also quantifies their interactions, providing a dynamic risk assessment framework. This enables component manufacturers to output a risk assessment closer to the actual situation based on the model, and dynamically adjust their risk management strategy according to the current production conditions and environment. For example, if the model predicts an increase in risk due to a designer’s lack of expertise, the company can choose to conduct additional design audits or provide more training to reduce the likelihood of the risk occurring. In addition, the application of the model helps companies allocate resources more accurately. By identifying those factors that have the greatest impact on quality risk, companies can prioritize the allocation of resources to critical areas, such as strengthening the control of the design process in terms of flow, improving the fineness of the production process, or rectifying the humidity and temperature of the environment in which the finished product is stored in terms of storage conditions, so as to maximize the overall production efficiency and product quality. In conclusion, the fuzzy Bayesian network-based assessment model developed in this study not only enhances the scientific and systematic nature of risk management in the production process of steel prefabricated components, but also provides a feasible solution to help producers ensure product quality while maintaining competitiveness, which lays a solid foundation for the sustainable development and technological advancement of the assembled building industry.
Despite significant theoretical and practical progress, certain limitations persist. Firstly, the model’s accuracy largely depends on the accuracy of expert judgments, which may introduce subjective bias. Secondly, fuzzy Bayesian networks can manage uncertain information, but their scalability and flexibility may be constrained when dealing with intricate systems. Furthermore, the existing study mainly concentrates on model construction and validation, without adequate depth in examining the interactions and dynamic changes among risk factors.
Future research may take several paths: firstly, by integrating additional empirical evidence to improve the model’s accuracy and dependability; secondly, by utilizing advanced data analytics and machine learning strategies to enhance the model’s ability to handle intricate systems; and thirdly, by investigating the interactions and recurring patterns among risk factors to strengthen the model’s predictive powers. Furthermore, given the multi-state nature of production quality risks, future investigations will examine the potential benefits of incorporating multi-state representations to enhance the model’s capabilities.
7. Conclusions and Recommendations
This study developed an FBN model to systematically assess quality risks during the production phase of prefabricated steel structural components and identified key risk factors. Expert interviews and field surveys were utilized to establish the structure of the Bayesian network. FST combined with the SAM and noisy-OR gate model was employed to calculate node probabilities, reducing subjective biases from expert assessments and enhancing computational efficiency. The findings revealed a 26% probability of quality risks and identified three main risk propagation paths through diagnostic reasoning. Control measures targeting these paths significantly mitigated quality risks. This study offers an effective tool for quality risk assessment and management in steel structural component production, enhancing product quality and production safety. Considering key risk factors such as designer professionalism, production precision, and the finished product storage environment, the following measures are recommended to reduce quality risks during production: (1) Strengthen designer training through regular courses and workshops to improve the understanding of new technologies and standards and foster design innovation. (2) Enhance production precision by utilizing advanced equipment and technology and implementing stringent quality controls to ensure production quality. (3) The finished product storage environment should be improved by adjusting the warehouse temperature and humidity to prevent quality deterioration during storage. These measures, along with continuous process optimization and management system improvement, effectively reduce production quality risks and enhance product quality.
Author Contributions
Conceptualization, C.Z. and J.P.; methodology, C.Z. and J.P.; software, J.P.; validation, C.Z. and J.P.; formal analysis, C.Z. and J.P.; investigation, C.Z. and J.P.; resources, C.Z.; data curation, C.Z. and J.P.; writing—original draft preparation, J.P.; writing—review and editing, C.Z. and J.P.; visualization, J.P.; supervision, C.Z.; project administration, C.Z. All authors have read and agreed to the published version of the manuscript.
Funding
This research received no external funding.
Data Availability Statement
The original contributions presented in the study are included in the article, further inquiries can be directed to the corresponding author.
Conflicts of Interest
The authors declare no conflicts of interest.
References
- Jiang, Z.-Q.; Niu, Z.-Y.; Cheng, K.-K.; Yan, T.; Zhang, A.-L. Experimental study of earthquake-resilient high ductility prefabricated opening-web steel channel beam-column joint. J. Build. Eng. 2022, 49, 104041. [Google Scholar] [CrossRef]
- Navaratnam, S.; Satheeskumar, A.; Zhang, G.; Nguyen, K.; Venkatesan, S.; Poologanathan, K. The challenges confronting the growth of sustainable prefabricated building construction in Australia: Construction industry views. J. Build. Eng. 2022, 48, 103935. [Google Scholar] [CrossRef]
- Darko, A.; Chan, A.P. Critical analysis of green building research trend in construction journals. Habitat Int. 2016, 57, 53–63. [Google Scholar] [CrossRef]
- Wuni, I.Y.; Shen, G.Q.; Hwang, B.-G. Risks of modular integrated construction: A review and future research directions. Front. Eng. Manag. 2020, 7, 63–80. [Google Scholar] [CrossRef]
- Zhang, J.; Wang, M.; Zhao, L.; Chen, M. Analysis of factors affecting prefabricated building quality based on ISM-BN. Sustainability 2023, 15, 9682. [Google Scholar] [CrossRef]
- Rodríguez-Mariscal, J.; Canivell, J.; Solís, M. Evaluating the performance of sonic and ultrasonic tests for the inspection of rammed earth constructions. Constr. Build. Mater. 2021, 299, 123854. [Google Scholar] [CrossRef]
- Sacarea, A.I.; Oancea, G.; Parv, L. Magnetic particle inspection optimization solution within the frame of NDT 4.0. Processes 2021, 9, 1067. [Google Scholar] [CrossRef]
- Scislo, L. Single-point and surface quality assessment algorithm in continuous production with the use of 3D laser doppler scanning vibrometry system. Sensors 2023, 23, 1263. [Google Scholar] [CrossRef]
- Saba, N.; Jawaid, M.; Sultan, M.T.H. An overview of mechanical and physical testing of composite materials. Mechanical and Physical Testing of Biocomposites, Fibre-Reinforced Composites and Hybrid Composites; Elsevier: Amsterdam, The Netherlands, 2019; pp. 1–12. [Google Scholar]
- Vinod, S.; Shakor, P.; Sartipi, F.; Karakouzian, M. Object detection using esp32 cameras for quality control of steel components in manufacturing structures. Arab. J. Sci. Eng. 2023, 48, 12741–12758. [Google Scholar] [CrossRef]
- Scislo, L.; Szczepanik-Scislo, N. Quantification of Construction Materials Quality via Frequency Response Measurements: A Mobile Testing Station. Sensors 2023, 23, 8884. [Google Scholar] [CrossRef]
- Ayalp, G.G.; Ay, I. Model validation of factors limiting the use of prefabricated construction systems in Turkey. Eng. Constr. Archit. Manag. 2021, 28, 2610–2636. [Google Scholar] [CrossRef]
- Pinto, A. QRAM a Qualitative Occupational Safety Risk Assessment Model for the construction industry that incorporate uncertainties by the use of fuzzy sets. Saf. Sci. 2014, 63, 57–76. [Google Scholar] [CrossRef]
- Taillandier, F.; Sauce, G.; Bonetto, R. Risk-based investment trade-off related to building facility management. Reliab. Eng. Syst. Saf. 2019, 94, 785–795. [Google Scholar] [CrossRef]
- Pervez, H.; Ali, Y.; Pamucar, D.; Garai-Fodor, M.; Csiszárik-Kocsir, Á. Evaluation of critical risk factors in the implementation of modular construction. PLoS ONE 2022, 17, e0272448. [Google Scholar] [CrossRef]
- Tatari, A. Simulating Cost Risks for Prefabricated Construction in Developing Countries Using Bayesian Networks. J. Constr. Eng. Manag. 2023, 149, 04023037. [Google Scholar] [CrossRef]
- Zhang, Y. Application of risk management plan to technical risks in metro construction: Case study of the Grand Paris Express project. Tunn. Undergr. Space Technol. 2024, 147, 105716. [Google Scholar] [CrossRef]
- Leu, S.-S.; Chang, C.-M. Bayesian-network-based safety risk assessment for steel construction projects. Accid. Anal. Prev. 2013, 54, 122–133. [Google Scholar] [CrossRef]
- Kim, S.; Hwang, S.; Son, J. Safety Management Guidelines for Precast Concrete Production Plants Using Importance-Performance Analysis. J. Constr. Eng. Manag. 2022, 148, 04022038. [Google Scholar] [CrossRef]
- Shi, Y.; Stewart, M.G. Damage and risk assessment for reinforced concrete wall panels subjected to explosive blast loading. Int. J. Impact Eng. 2015, 85, 5–19. [Google Scholar] [CrossRef]
- Kontoleon, K.J.; Georgiadis-Filikas, K.; Tsikaloudaki, K.G.; Theodosiou, T.G.; Giarma, C.S.; Papanicolaou, C.G.; Triantafillou, T.C.; Asimakopoulou, E.K. Vulnerability assessment of an innovative precast concrete sandwich panel subjected to the ISO 834 fire. J. Build. Eng. 2022, 52, 104479. [Google Scholar] [CrossRef]
- O’Hegarty, R.; Kinnane, O.; Grimes, M.; Newell, J.; Clifford, M.; West, R. Development of thin precast concrete sandwich panels: Challenges and outcomes. Constr. Build. Mater. 2021, 267, 120981. [Google Scholar] [CrossRef]
- Balkos, K.D.; Sjaarda, M.; West, J.S.; Walbridge, S. Static and Fatigue Tests of Steel-Precast Composite Beam Specimens with Through-Bolt Shear Connectors. J. Bridge Eng. 2019, 24, 04019036. [Google Scholar] [CrossRef]
- Bechtel, A.; McConnell, J.; Chajes, M. Ultimate Capacity Destructive Testing and Finite-Element Analysis of Steel I-Girder Bridges. J. Bridge Eng. 2011, 16, 197–206. [Google Scholar] [CrossRef]
- Usefi, N.; Sharafi, P.; Mortazavi, M.; Ronagh, H.; Samali, B. Structural performance and sustainability assessment of hybrid-cold formed modular steel frame. J. Build. Eng. 2021, 34, 101895. [Google Scholar] [CrossRef]
- Wang, M.; Zhang, C.; Sun, Y.; Dong, K. Seismic performance of steel frame with replaceable low yield point steel connection components and the effect of structural fuses. J. Build. Eng. 2022, 47, 103862. [Google Scholar] [CrossRef]
- Tzortzinis, G.; Ai, C.; Brena, S.F.; Gerasimidis, S. Using 3D laser scanning for estimating the capacity of corroded steel bridge girders: Experiments, computations and analytical solutions. Eng. Struct. 2022, 265, 114407. [Google Scholar] [CrossRef]
- Gbagba, S.; Maccioni, L.; Concli, F. Advances in Machine Learning Techniques Used in Fatigue Life Prediction of Welded Structures. Appl. Sci. 2023, 14, 398. [Google Scholar] [CrossRef]
- Chen, M.-C.; Fang, W.; Yang, C.; Xie, L. Bayesian prediction and probabilistic model of fatigue cracks in steel structures. Eng. Fail. Anal. 2019, 103, 335–346. [Google Scholar] [CrossRef]
- Kabir, S.; Papadopoulos, Y. Applications of Bayesian networks and Petri nets in safety, reliability, and risk assessments: A review. Saf. Sci. 2019, 115, 154–175. [Google Scholar] [CrossRef]
- Borunda, M.; Jaramillo, O.A.; Reyes, A.; Ibargüengoytia, P.H. Bayesian networks in renewable energy systems: A bibliographical survey. Renew. Sustain. Energy Rev. 2016, 62, 32–45. [Google Scholar] [CrossRef]
- Amin, T.; Khan, F.; Imtiaz, S. Dynamic availability assessment of safety critical systems using a dynamic Bayesian network. Reliab. Eng. Syst. Saf. 2018, 178, 108–117. [Google Scholar] [CrossRef]
- Khakzad, N. Application of dynamic Bayesian network to risk analysis of domino effects in chemical infrastructures. Reliab. Eng. Syst. Saf. 2015, 138, 263–272. [Google Scholar] [CrossRef]
- Yazdi, M.; Kabir, S. A fuzzy Bayesian network approach for risk analysis in process industries. Process Saf. Environ. Prot. 2017, 111, 507–519. [Google Scholar] [CrossRef]
- Göksu, B.; Yüksel, O.; Şakar, C. Risk assessment of the Ship steering gear failures using fuzzy-Bayesian networks. Ocean Eng. 2023, 274, 114064. [Google Scholar] [CrossRef]
- Aydin, M.; Akyuz, E.; Turan, O.; Arslan, O. Validation of risk analysis for ship collision in narrow waters by using fuzzy Bayesian networks approach. Ocean Eng. 2021, 231, 108973. [Google Scholar] [CrossRef]
- Senol, Y.E.; Yasli, F. A risk analysis study for chemical cargo tank cleaning process using Fuzzy Bayesian Network. Ocean Eng. 2021, 235, 109360. [Google Scholar] [CrossRef]
- Pearl, J. From Bayesian Networks to Causal Networks. In Mathematical Models for Handling Partial Knowledge in Artificial Intelligence; Coletti, G., Dubois, D., Scozzafava, R., Eds.; Springer: New York, NY, USA, 1995; pp. 157–182. [Google Scholar] [CrossRef]
- Kitson, N.K.; Constantinou, A.C.; Guo, Z.; Liu, Y.; Chobtham, K. A survey of Bayesian Network structure learning. Artif. Intell. Rev. 2023, 56, 8721–8814. [Google Scholar] [CrossRef]
- van de Schoot, R.; Depaoli, S.; King, R.; Kramer, B.; Märtens, K.; Tadesse, M.G.; Vannucci, M.; Gelman, A.; Veen, D.; Willemsen, J.; et al. Bayesian statistics and modelling. Nat. Rev. Methods Primers 2021, 1, 1. [Google Scholar] [CrossRef]
- Zadeh, L.A. Fuzzy sets. Inf. Control 1965, 8, 338–353. [Google Scholar] [CrossRef]
- Diaz-Curbelo, A.; Andrade, R.A.E.; Municio, A.M.G. Role of Fuzzy Logic to Dealing with Epistemic Uncertainty in Supply Chain Risk Assessment: Review Standpoints. Int. J. Fuzzy Syst. 2020, 22, 2769–2791. [Google Scholar] [CrossRef]
- Omidvar, M.; Zarei, E.; Ramavandi, B.; Yazdi, M. Fuzzy bow-tie analysis: Concepts, review, and application. In Linguistic Methods Under Fuzzy Information in System Safety and Reliability Analysis; Springer: Cham, Switzerland, 2022; pp. 13–51. [Google Scholar]
- Mahmood, Y.A.; Ahmadi, A.; Verma, A.K.; Srividya, A.; Kumar, U. Fuzzy fault tree analysis: A review of concept and application. Int. J. Syst. Assur. Eng. Manag. 2013, 4, 19–32. [Google Scholar] [CrossRef]
- Ferdous, R.; Khan, F.; Veitch, B.; Amyotte, P.R. Methodology for computer aided fuzzy fault tree analysis. Process Saf. Environ. Prot. 2009, 87, 217–226. [Google Scholar] [CrossRef]
- Cho, H.-N.; Choi, H.-H.; Kim, Y.-B. A risk assessment methodology for incorporating uncertainties using fuzzy concepts. Reliab. Eng. Syst. Saf. 2002, 78, 173–183. [Google Scholar] [CrossRef]
- Gholamizadeh, K.; Zarei, E.; Omidvar, M.; Yazdi, M. Fuzzy sets theory and human reliability: Review, applications, and contributions. In Linguistic Methods Under Fuzzy Information in System Safety and Reliability Analysis; Springer: Cham, Switzerland, 2022; pp. 91–137. [Google Scholar]
- Halliwell, J.; Shen, Q. Linguistic probabilities: Theory and application. Soft Comput. 2009, 13, 169–183. [Google Scholar] [CrossRef]
- Lavasani, S.M.; Yang, Z.; Finlay, J.; Wang, J. Fuzzy risk assessment of oil and gas offshore wells. Process Saf. Environ. Prot. 2011, 89, 277–294. [Google Scholar] [CrossRef]
- Dombi, J.; Jónás, T. Ranking trapezoidal fuzzy numbers using a parametric relation pair. Fuzzy Sets Syst. 2020, 399, 20–43. [Google Scholar] [CrossRef]
- Mandal, S.; Maiti, J. Risk analysis using FMEA: Fuzzy similarity value and possibility theory based approach. Expert Syst. Appl. 2014, 41, 3527–3537. [Google Scholar] [CrossRef]
- Cao, P.; Shen, X.; Duan, G.; Liu, J.; Guo, K. Quality-integrated diagnostic platform for aerospace complex product assembly processes. Comput. Ind. Eng. 2024, 189, 109796. [Google Scholar] [CrossRef]
- Friederich, J.; Lazarova-Molnar, S. Reliability assessment of manufacturing systems: A comprehensive overview, challenges and opportunities. J. Manuf. Syst. 2024, 72, 38–58. [Google Scholar] [CrossRef]
- Dikmen, I.; Birgonul, M.T.; Han, S. Using fuzzy risk assessment to rate cost overrun risk in international construction projects. Int. J. Proj. Manag. 2007, 25, 494–505. [Google Scholar] [CrossRef]
- Dawes, J. Do Data Characteristics Change According to the Number of Scale Points Used? An Experiment Using 5-Point, 7-Point and 10-Point Scales. Int. J. Mark. Res. 2008, 50, 61–104. [Google Scholar] [CrossRef]
- Bai, L.; Kang, S.; Zhang, K.; Zhang, B.; Pan, T. Modeling for external stakeholder risk assessment of project portfolios. Eng. Constr. Archit. Manag. 2024, 31, 737–766. [Google Scholar] [CrossRef]
- Hsu, H.-M.; Chen, C.-T. Aggregation of fuzzy opinions under group decision making. Fuzzy Sets Syst. 1996, 79, 279–285. [Google Scholar] [CrossRef]
- Lu, M.; Jin, Y.; Lin, J.; Liu, Q.; Du, Y.; Yang, Y. Fuzzy fault tree analysis of EVAC system based on improved SAM- FFTA with butterfly optimization algorithm. Eng. Fail. Anal. 2023, 154, 107658. [Google Scholar] [CrossRef]
- Kumar, R.; Zarour, M.; Alenezi, M.; Agrawal, A.; Khan, R.A. Measuring security durability of software through fuzzy-based decision-making process. Int. J. Comput. Intell. Syst. 2019, 12, 627–642. [Google Scholar] [CrossRef]
- Belton, I.; MacDonald, A.; Wright, G.; Hamlin, I. Improving the practical application of the Delphi method in group-based judgment: A six-step prescription for a well-founded and defensible process. Technol. Forecast. Soc. Change 2019, 147, 72–82. [Google Scholar] [CrossRef]
- Palafox-Alcantar, P.G.; Hunt, D.V.L.; Rogers, C.D.F. The complementary use of game theory for the circular economy: A review of waste management decision-making methods in civil engineering. Waste Manag. 2020, 102, 598–612. [Google Scholar] [CrossRef]
- Zarei, E.; Yazdi, M.; Abbassi, R.; Khan, F. A hybrid model for human factor analysis in process accidents: FBN-HFACS. J. Loss Prev. Process Ind. 2019, 57, 142–155. [Google Scholar] [CrossRef]
- Runkler, T.A.; Glesner, M. A set of axioms for defuzzification strategies towards a theory of rational defuzzification operators. In Proceedings of the Second IEEE International Conference on Fuzzy Systems, San Francisco, CA, USA, 28 March–1 April 1993; pp. 1161–1166. [Google Scholar] [CrossRef]
- Varghese, A.; Varghese, R.R.; Balakrishnan, K.; Paul, J.S. Level identification of brain MR images using histogram of a LBP variant. In Proceedings of the 2012 IEEE International Conference on Computational Intelligence and Computing Research, Coimbatore, India, 18–20 December 2012; pp. 1–4. [Google Scholar] [CrossRef]
- Chen, P.; Zhang, Z.; Huang, Y.; Dai, L.; Hu, H. Risk assessment of marine accidents with Fuzzy Bayesian Networks and causal analysis. Ocean Coast. Manag. 2022, 228, 106323. [Google Scholar] [CrossRef]
- Onisawa, T. An application of fuzzy concepts to modelling of reliability analysis. Fuzzy Sets Syst. 1990, 37, 267–286. [Google Scholar] [CrossRef]
- Dimara, E.; Franconeri, S.; Plaisant, C.; Bezerianos, A.; Dragicevic, P. A task-based taxonomy of cognitive biases for information visualization. IEEE Trans. Vis. Comput. Graph. 2018, 26, 1413–1432. [Google Scholar] [CrossRef]
- Nyimbili, P.H.; Erden, T. Comparative evaluation of GIS-based best–worst method (BWM) for emergency facility planning: Perspectives from two decision-maker groups. Nat. Hazards 2021, 105, 1031–1067. [Google Scholar] [CrossRef]
- Lai, J.; Wang, K.; Xu, J.; Wang, P.; Chen, R.; Wang, S.; Beer, M. A failure probability assessment method for train derailments in railway yards based on IFFTA and NGBN. Eng. Fail. Anal. 2023, 154, 107675. [Google Scholar] [CrossRef]
- Chin, K.-S.; Tang, D.-W.; Yang, J.-B.; Wong, S.Y.; Wang, H. Assessing new product development project risk by Bayesian network with a systematic probability generation methodology. Expert Syst. Appl. 2009, 36, 9879–9890. [Google Scholar] [CrossRef]
- Zhang, J.; Li, M. Group decision-making method based on expert credibility with multi-granularity probabilistic linguistic Z-number preference relation. Inf. Sci. 2023, 650, 119664. [Google Scholar] [CrossRef]
- Li, M.; Wang, D.; Shan, H. Risk assessment of mine ignition sources using fuzzy Bayesian network. Process Saf. Environ. Prot. 2019, 125, 297–306. [Google Scholar] [CrossRef]
- Liwång, H. Survivability of an ocean patrol vessel—Analysis approach and uncertainty treatment. Mar. Struct. 2015, 43, 1–21. [Google Scholar] [CrossRef]


Disclaimer/Publisher’s Note: The statements, opinions and data contained in all publications are solely those of the individual author(s) and contributor(s) and not of MDPI and/or the editor(s). MDPI and/or the editor(s) disclaim responsibility for any injury to people or property resulting from any ideas, methods, instructions or products referred to in the content. |
© 2024 by the authors. Licensee MDPI, Basel, Switzerland. This article is an open access article distributed under the terms and conditions of the Creative Commons Attribution (CC BY) license (https://creativecommons.org/licenses/by/4.0/).