Article

Stability Analysis of “321” Prefabricated Highway Steel Truss Bridge

1
National Engineering Laboratory of Bridge Safety and Technology (Beijing), Research Institute of Highway Ministry of Transport, Beijing 100088, China
2
Chongqing Highway Affairs Center, Chongqing 401120, China
*
Author to whom correspondence should be addressed.
Buildings 2024, 14(6), 1626; https://doi.org/10.3390/buildings14061626
Submission received: 4 August 2023 / Revised: 6 May 2024 / Accepted: 10 May 2024 / Published: 1 June 2024
(This article belongs to the Special Issue Mechanical Performance of Steel and Composite Beams)

Abstract

:
The “321” prefabricated highway steel truss bridge is widely used for highway rescue, disaster relief, and emergency traffic. This paper uses a 33 m double-row monolayer “321” prefabricated highway steel truss bridge to analyze its mechanical properties and component stability. The actual traffic flow capacity of a total weight of 53.32 tons is used in this study. The results show that the maximum internal force in the truss chord (including the stiffening chord) occurs in the middle span section when a centrally distributed load is applied. Meanwhile, the maximum internal force of truss diagonal members and truss vertical bars appears at the fulcrum section. Under the eccentrically distributed load, the maximum internal forces of truss chords (including stiffening chords) appear in the middle span section, which is closest to the vehicle load, while the maximum internal forces of truss diagonal members and truss vertical bars appear in the fulcrum section, which is closest to the vehicle load. While the maximum internal forces under the eccentrically distributed load are greater than the maximum internal forces under the centered-layout load, under the vehicle load, truss chords (including stiffening chords) are prone to buckling instability, and the buckling mode is mainly reverse out-of-plane buckling. The inclined members of the truss are prone to buckling instability, and the buckling mode is mainly the combination of out-of-plane bending and two-way out-of-plane bending. Truss vertical bars have good stability and are not easy to buckle. The main conclusions of this paper can provide references for the optimal design and operation safety of prefabricated highway steel truss bridges.

1. Introduction

The prefabricated highway steel truss bridge has its own advantages: strong adaptability, convenient disassembly and assembly, and fast erection speed. It is mainly used for highway rescue and disaster relief and emergency traffic. The prefabricated highway steel truss bridge is composed of a truss girder, deck system, connection system, and foundation and is equipped with special erection tools. There are two main types of structures in prefabricated highway steel truss bridges, “321” and “200”, with basically the same appearance. The main beams are each connected by 3 m long trusses. The main difference between the “321” and “200” is the truss size. The height of “200” is 1.5 m and the height of “321” is 2.234 m. The bridge deck width is also increased from 3.7 m to 4.2 m. The strength, stiffness, stability, and fatigue resistance of the bridge have all been improved [1]. However, the bearing capacity and span of prefabricated highway steel truss bridges are relatively too small to meet the repair and maintenance needs of long-span control bridge projects. During the Wenchuan earthquake emergency rescue in 2008, the “321” and “200” prefabricated highway steel truss bridges could meet the needs of rapid emergency traffic guarantee bridges with a single span of less than 40 m after appropriate combination. However, they cannot meet the needs of bridges with a single span of more than 50 m to complete the emergency repair in a short time [2]. Therefore, the main focus is on developing more economical, reasonable, and convenient structural types of prefabricated highway steel truss bridges with high bearing capacity and large span capacity [3,4,5,6]. At present, the research on prefabricated highway steel truss bridges mainly focuses on bearing capacity analysis, stability analysis, dynamic performance analysis, fatigue failure analysis, and durability analysis. Zhang and Li [7] adopted a numerical analysis method to analyze the reliability of the deflection, bending stress, and buckling of the main truss of the prefabricated highway steel bridge, which ensured the safety and reliability of the structure. In order to verify the overall stability of the structure, Burroughs [1] conducted a whole bridge destructive test on a 21 m single-row monolayer “321” steel bridge and compared the test results with the finite element analysis results and the code calculation results. The results were consistent, which verified that the overall stability of the steel bridge under the design code can be guaranteed. In order to accurately analyze the structural dynamic performance, Macioce et al. [8] calculated and analyzed the modal parameters and mode shapes of a prefabricated steel truss bridge, using the 3-dimensional space finite element analysis method. These results were compared with the real bridge dynamic parameters obtained using environmental excitation. The theoretical analysis results were highly consistent with the actual test results, providing a basis for the dynamic analysis of prefabricated steel bridges.
In addition, Yin and Shi [9] described in detail the engineering characteristics, structural design and calculation, manufacturing and construction methods, and engineering applications of prefabricated highway steel bridges, which have a high guiding significance for the promotion and application of prefabricated highway steel bridges. The axial forces in beam members can also be obtained by local vibration measurements [10,11].
This paper analyzes a 33 m double-row monolayer “321” prefabricated steel truss bridge, focusing on the structural stress of the in-service prefabricated steel truss bridge under heavy trucks, researching and analyzing the stress mechanism and mechanical performance of truss chords (including stiffening chords), truss diagonal members, and truss vertical bars. On this basis, the stability of the structure under the heavy trucks is analyzed, then the stress state and weak links of the structure are judged to accurately evaluate the safety of the structure. This paper presents a systematic stability analysis method for the “321” prefabricated highway steel truss bridge. The analysis process of this paper is shown in Figure 1.

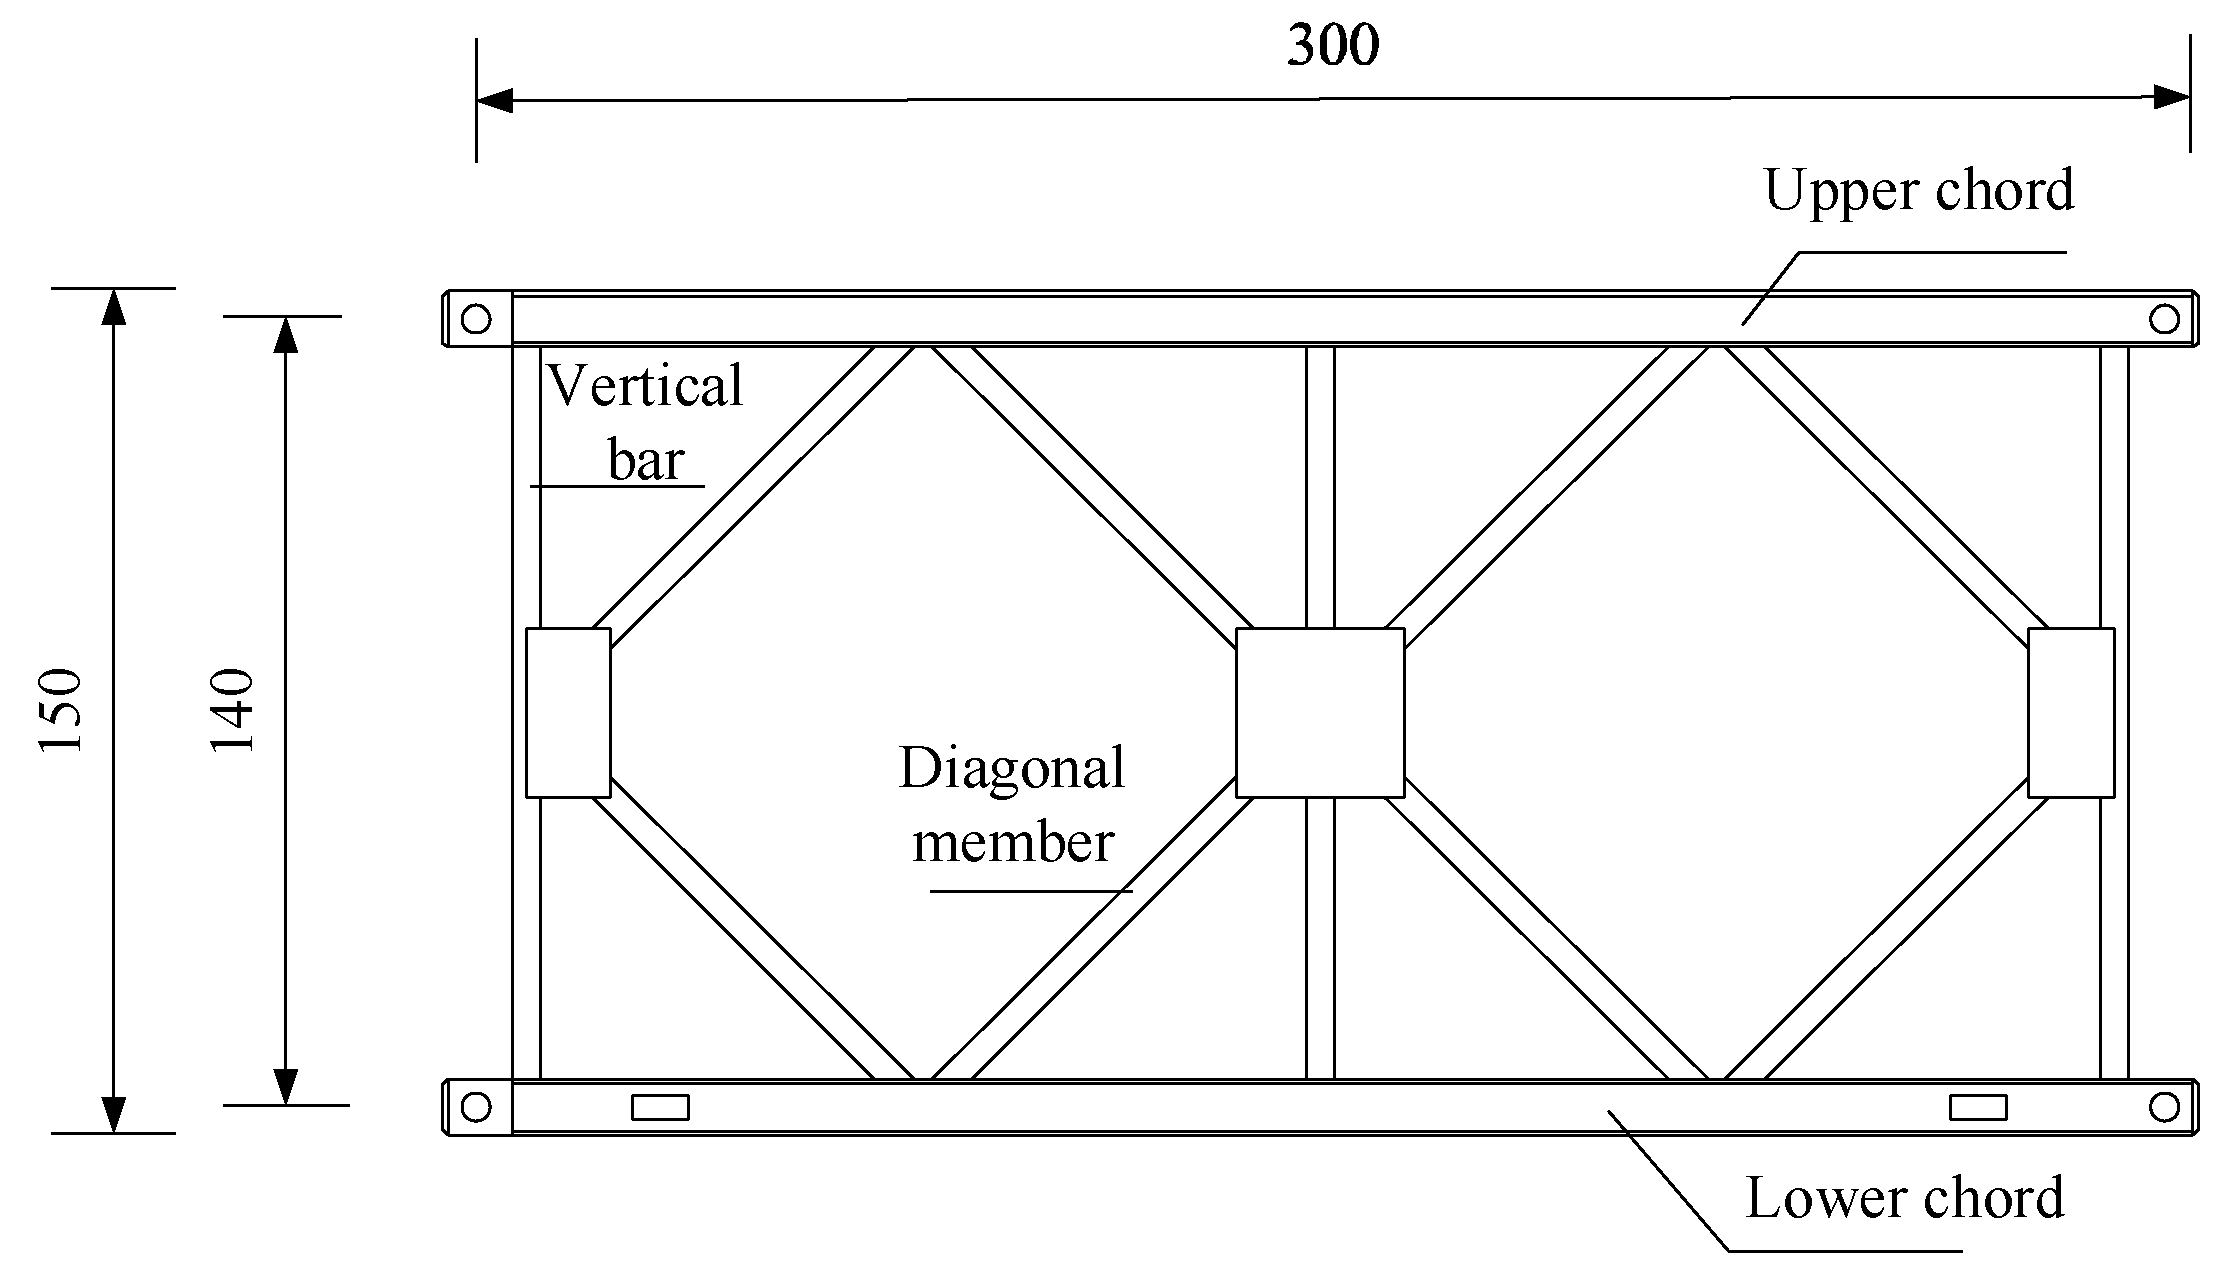
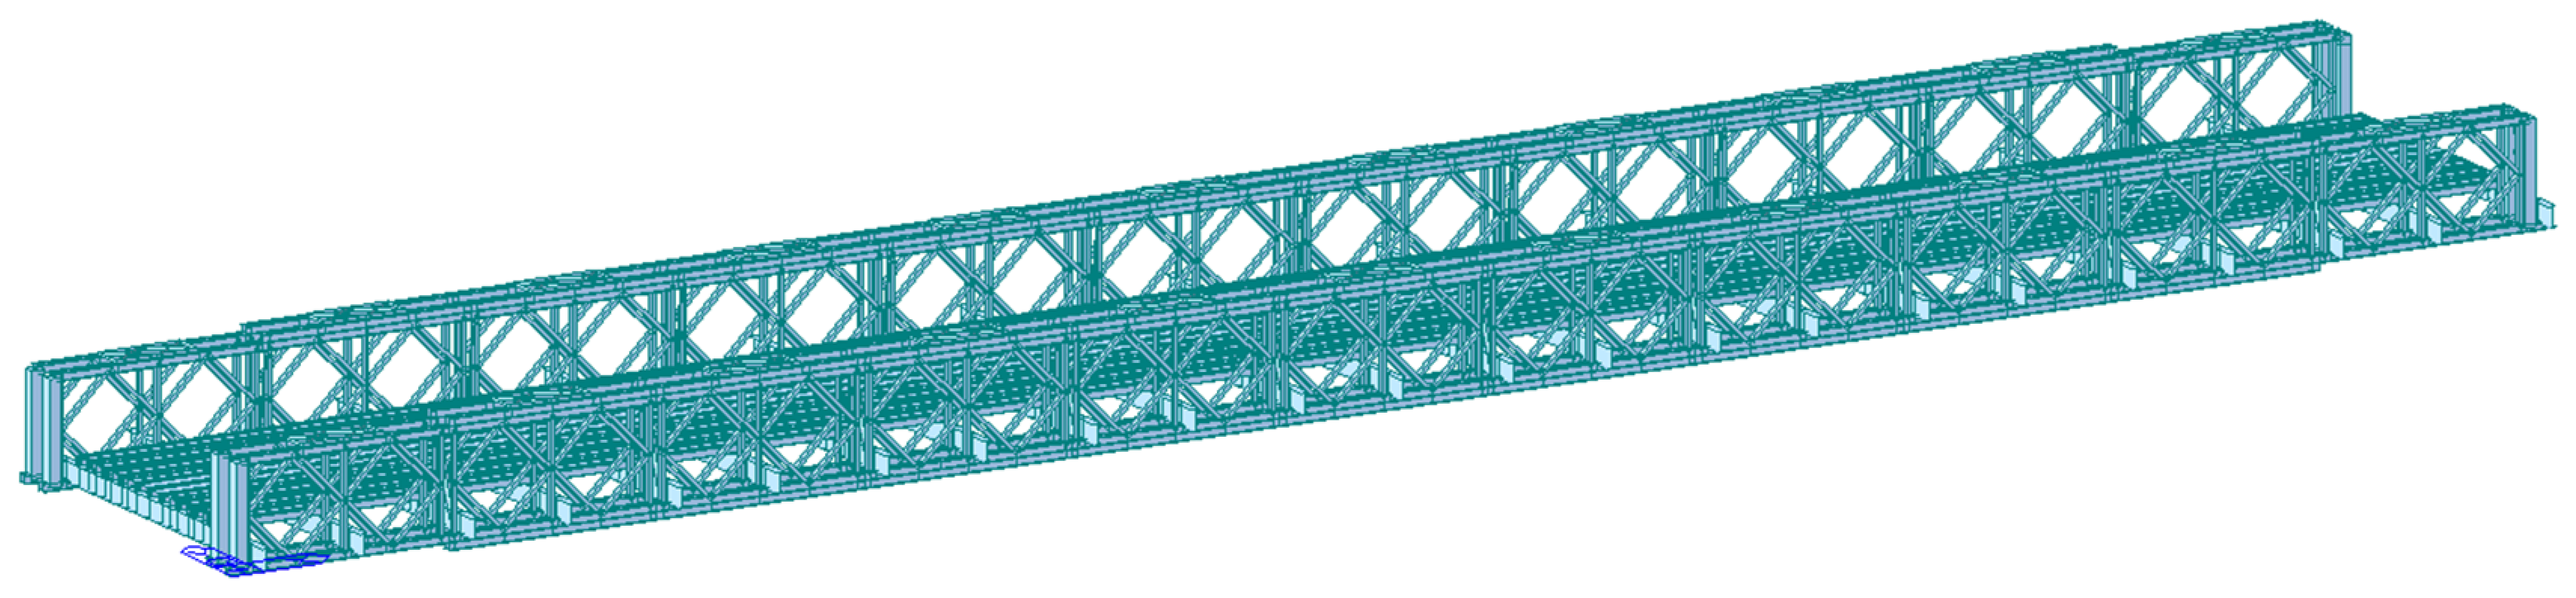
2. Structural Composition and Characteristics

The bridge is a 33 m double-row monolayer “321” prefabricated steel truss bridge. Each section of the “321” prefabricated steel truss is 3 m with a height of 1.5 m, as shown in Figure 2. There are 44 trusses in the whole bridge. The design load of the bridge is Class II highway in China. The bridge deck is made of steel with a clear width of 3.7 m. The main beam is located on both sides of the carriageway and is connected by a truss with pins. Each 3 m long truss section is provided with 2 beams, on which a steel bridge deck is laid. The main beam is supported on the bearing through the end column. In the transition section, the road and bridge are connected by the bridge approach slab. The whole bridge is equipped with diagonal braces, wind-resistant pull rods, support frames, and connecting plates, which make the bridge form a stable spatial structure.
Under moving load, the internal force distribution of the “321” prefabricated steel truss bridge that is 33 m in length is calculated using a numerical analysis method. The chords, diagonal members, vertical bars, and cross beams in the prefabricated steel truss bridge are simulated by beam element. The bridge deck is simulated by plate element. The model is divided into 2102 nodes and 2861 units, all of which are made of 16 Mn steel (Q345). The whole bridge model is shown in Figure 3.
The calculated load of the bridge mainly includes dead load and live load. The dead load is calculated based on the unit weight of each component. The live load is mainly the actual traffic flow capacity with a total weight of 53.32 tons. The loading mode includes centered-layout load and eccentrically distributed load. The eccentrically distributed load is set at a distance of 0.5 m from the truss. Considering the impact of vehicle load on prefabricated steel truss bridge, the impact coefficient of the bridge is 1.3 [12].
The truss chords (including stiffening chords) are composed of two U-steels. The sections of truss diagonal members and truss vertical bars are the same, both of which are made of I beams.
Two finite element models of the truss chord (including stiffening chord) and truss diagonal member (truss vertical bar) are established in ABAQUS, as shown in Figure 4. The element type is structured hexahedron (C3D8) and three layers of grids are divided along the direction of the minimum thickness of the steel plate. The double ends of the truss members are constrained in three translation directions. The steel model of the truss is 16 Mn steel. The constitutive model adopts the secondary plastic flow model. The material parameters are shown in Table 1.

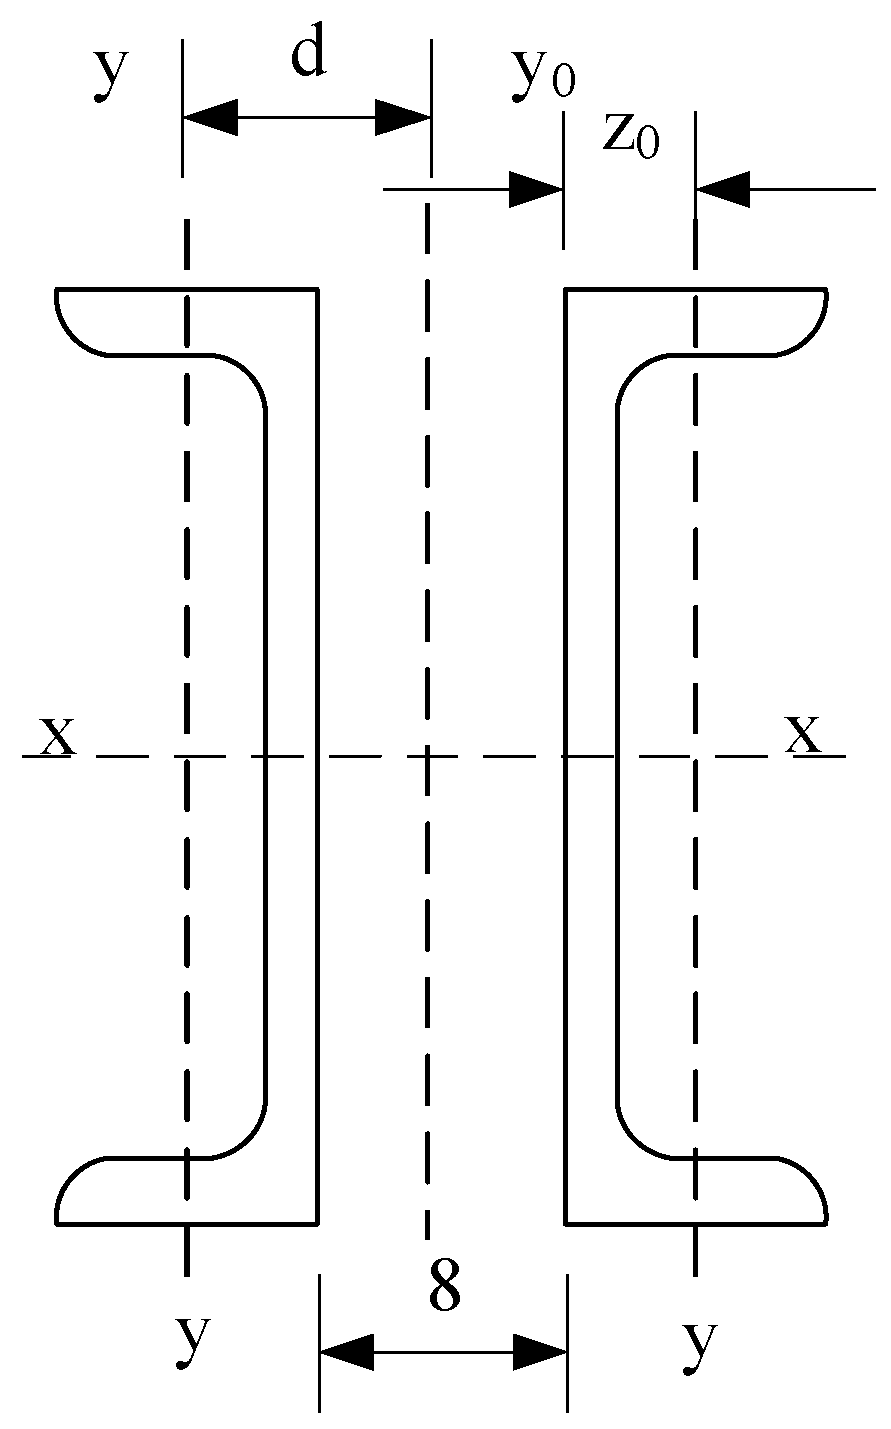
3. Stability Analysis of Truss Chord

Truss chords mainly bear tension or pressure, which can make full use of the strength of materials, save materials, and reduce self-weight. In Table 2, under centered-layout load, the maximum internal force of the chord of the prefabricated steel truss bridge appears at the middle span section, where the top chord is compressed with a maximum value of 536.8 kN. When the lower chord is under tension, the maximum value is 479.4 kN. Under the eccentrically distributed load, the maximum internal force of the chord of the prefabricated steel truss bridge appears at the middle span section with the closest position to the vehicle load, where the upper chord is compressed with the maximum value of 660.3 kN while the lower chord is tensioned with the maximum value of 590.1 kN. It can be concluded from the analysis that the maximum internal force of the truss chord mainly occurs in the middle span section and the internal force under eccentrically distributed load is greater than that under centered-layout load.
The stiffening chords in the prefabricated steel truss bridge are mainly used to strengthen the bearing capacity of the truss chords. Their materials, sections, and structures are the same as those of the truss chords, except that the height of the bedplate of the chord bolt hole is different from that of the bedplate of the upper hole of the truss chord. The stress mode of the stiffening chord of the prefabricated steel truss bridge is basically the same as that of the truss chord, but the magnitude is different. Under the centered-layout load, the maximum internal force of the stiffening chord of the prefabricated steel truss bridge appears at the middle span section, where the upper stiffening chord is compressed with the maximum value of 740.6 kN and the lower stiffening chord is tensioned with the maximum value of 641.1 kN. Under the eccentrically distributed load, the maximum internal force of the stiffening chord of the fabricated steel truss bridge appears at the middle span section, in the nearest position to the vehicle load, where the upper stiffening chord is compressed with the maximum value of 857.5 kN and the lower stiffening chord is tensioned with the maximum value of 730.7 kN. Through analysis, it was concluded that the internal force distribution characteristics of the stiffening chord are basically consistent with that of the truss chord. The maximum internal force of the stiffening chord is greater than the corresponding maximum internal force of the truss chord.
The section of the truss chord (including the stiffening chord) is shown in Figure 5, and the section area is A = 2 × 12.74 = 25.48 cm2. The effective section coefficient of the chord is determined by the in-plane stability of the truss and the out-of-plane stability of the truss. According to calculation and analysis, when the truss is stable in the plane, the effective section coefficient of chord φ is 0.977. When the truss is stable out of the plane, the effective section coefficient R of the chord is 0.809. Taking the smaller value of the φ and R, the effective section coefficient actually used for the chord φ is 0.809 and the allowable bearing capacity of the chord is calculated as follows.
[ N ] = φ R [ σ ] = 0.809 × 25.48 × 1.3 × 21 = 563   kN
Based on the internal force calculation results above, the maximum axial force of the truss chords (including the stiffening chords) under compression is greater than the allowable bearing capacity under heavy load. The maximum axial force under compression is 857.5 kN, which is far more than the theoretical allowable bearing capacity of 563 kN and is prone to buckling.
The Eigenvalue buckling analysis is conducted by the finite element method, and the first five buckling modes are obtained as shown in Figure 6. The first mode is the reverse out-of-plane buckling of the bilateral C-shaped steel members; the second mode is the out-of-plane buckling of the bilateral C-shaped steel members in the same direction; the third mode is the local buckling of the flange of the unilateral C-shaped steel member; and the fourth and fifth modes are the local buckling of the flange and web of the unilateral C-shaped steel member at the same time.
As shown in Figure 7, initial defects, which are introduced by the first five modes, the material nonlinearity and geometric nonlinearity are considered to conduct the nonlinear buckling analysis of axial compression. The axial force–displacement curve of the chord is shown in Figure 7a. The buckling critical load of the chord is 598 kN, which is close to the allowable bearing capacity calculated by Formula (1). When the axial displacement is 30 mm, it still has a certain bearing capacity of 211 kN. When the axial displacement is 30 mm, the maximum buckling deformation is located in the middle of the chord, with a value of 90.8 mm. The deformation mode is relatively consistent with the first mode, as shown in Figure 7b. When the axial displacement is 30 mm, the chord stress exceeds the yield stress and enters the stage of plastic buckling deformation, as shown in Figure 7c. It can be concluded that the chords of the prefabricated steel truss bridge are prone to buckling instability when the actual traffic flow capacity is a total weight of 53.32 tons, and the buckling mode is mainly reverse out-of-plane buckling.

4. Stability Analysis of Truss Diagonal Member

The truss diagonal member is conducive to increasing the overall stiffness of the truss so that the structural stress is shared by the whole truss. Under the centered-layout load, the maximum internal force of the truss diagonal member of the prefabricated steel truss bridge appears at the fulcrum node. The truss diagonal member is basically in the tension–compression transition state for which the maximum internal force of the truss diagonal member is 183.5 kN under the compression. The maximum internal force of the truss diagonal member is 181.2 kN under the tension. With the eccentrically distributed load, the maximum internal force of the truss diagonal member of the prefabricated steel truss bridge appears at the fulcrum node with the closest position to the vehicle load, which is consistent with the internal force distribution characteristics of the centered-layout load. The truss diagonal member is in the tension–compression transition state with a maximum value of 206.6 kN when the axial force is pressure. The maximum value is 199.8 kN when the axial force is tension. It can be concluded that under the centered-layout load and eccentrically distributed load, the distribution characteristics of the internal forces of the truss diagonal members are basically the same in the tension–compression transition state. The maximum internal forces appear at the fulcrum nodes, and the maximum internal forces of the truss diagonal members under the eccentrically distributed load are greater than the maximum under the centered-layout load.
As shown in Figure 8, the section area of the truss diagonal member is 9.52 cm2. The effective section coefficient φ of the inclined bar is 0.66, so the allowable bearing capacity of the inclined bar is:
[N] = φA[σ] = 0.66 × 9.52 × 1.3 × 21 = 171.5 kN
According to the internal force calculation results above, the maximum axial force of truss diagonal members is greater than the allowable bearing capacity under heavy load with the maximum compressive axial force being 206.6 kN, which exceeds the theoretical allowable bearing capacity of 171.5 kN. Buckling may occur easily.
In Figure 9, Eigenvalue buckling analysis is carried out for the first five buckling modes. The first mode is out-of-plane buckling, the second mode is bidirectional out-of-plane buckling, the third mode is torsional buckling, and the fourth and fifth modes are combined buckling.
In Figure 10, initial defects, which are introduced by the first five modes, the material nonlinearity, and geometric nonlinearity are considered to conduct the nonlinear buckling analysis of axial compression. The axial force–displacement curve of the diagonal member is shown in Figure 10a. The buckling critical load of the diagonal member is 190 kN, which is close to the allowable bearing capacity calculated by Formula (2).
When the axial displacement is 30 mm, it still has a certain bearing capacity of 43 kN. When the axial displacement is 30 mm, the maximum buckling deformation is located in the lower middle of the diagonal member, with a value of 82.6 mm. The deformation mode is mainly a combination of the first mode and the second mode, as shown in Figure 10b. When the axial displacement is 30 mm, the diagonal member stress exceeds the yield stress and enters the stage of plastic buckling deformation, as shown in Figure 10c. It can be concluded that the chords of the prefabricated steel truss bridge are prone to buckling instability when the actual traffic flow capacity is a total weight of 53.32 tons, and the buckling mode is mainly the combination of out-of-plane bending and two-way out-of-plane bending.

5. Stability Analysis of Truss Vertical Bar

The truss vertical bar is made of an I beam and its stress characteristics are similar to the truss diagonal member. Under centered-layout load, the maximum value of the truss vertical bar appears at the fulcrum node. The maximum internal force of the truss vertical bar under compression is 112.7 kN. The maximum internal force of the truss vertical bar under tension is 180.9 kN. Under the eccentrically distributed load, the maximum internal force of the truss vertical bar appears at the fulcrum node with the position closest to the vehicle load. The maximum internal force of the truss vertical bar under compression is 126.3 kN. The maximum internal force of the truss vertical bar under tension is 205.6 kN.
The section of the truss diagonal member is the same as that of the truss vertical bar with the section area A = 9.52 cm2. Considering the differences in geometric length, free length, radius of gyration, slenderness ratio, and other factors of the vertical bar, the effective section coefficient φ of the truss vertical member is 0.818. Therefore, the allowable bearing capacity of the vertical bar is:
[ N ] = 0 . 818 × 9 . 52 × 1 . 3 × 21 = 212.6     kN
Internal force calculation results show that the maximum axial force of the truss vertical bar is 126.3 kN when the actual traffic flow capacity is a total weight of 53.32 tons. This is much less than the theoretical allowable bearing capacity of 212.6 kN and the member stability is good.

6. Conclusions

This paper uses a 33 m double-row monolayer “321” prefabricated highway steel truss bridge to analyze its mechanical performance under the actual traffic flow capacity with a total weight of 53.32 tons. Then further analyzes the stability of truss chords (including stiffening chords), truss inclined bars, and truss vertical bars under various load conditions. Finally, the following main conclusions and recommendations are given from the calculated results.
(1)
The maximum internal force of truss chords (including stiffening chords), truss diagonal members, and truss vertical bars under eccentrically distributed load is greater than their maximum internal force under centered-layout load. Therefore, the vehicle shall be driven in the middle when passing through a “321” prefabricated steel truss bridge.
(2)
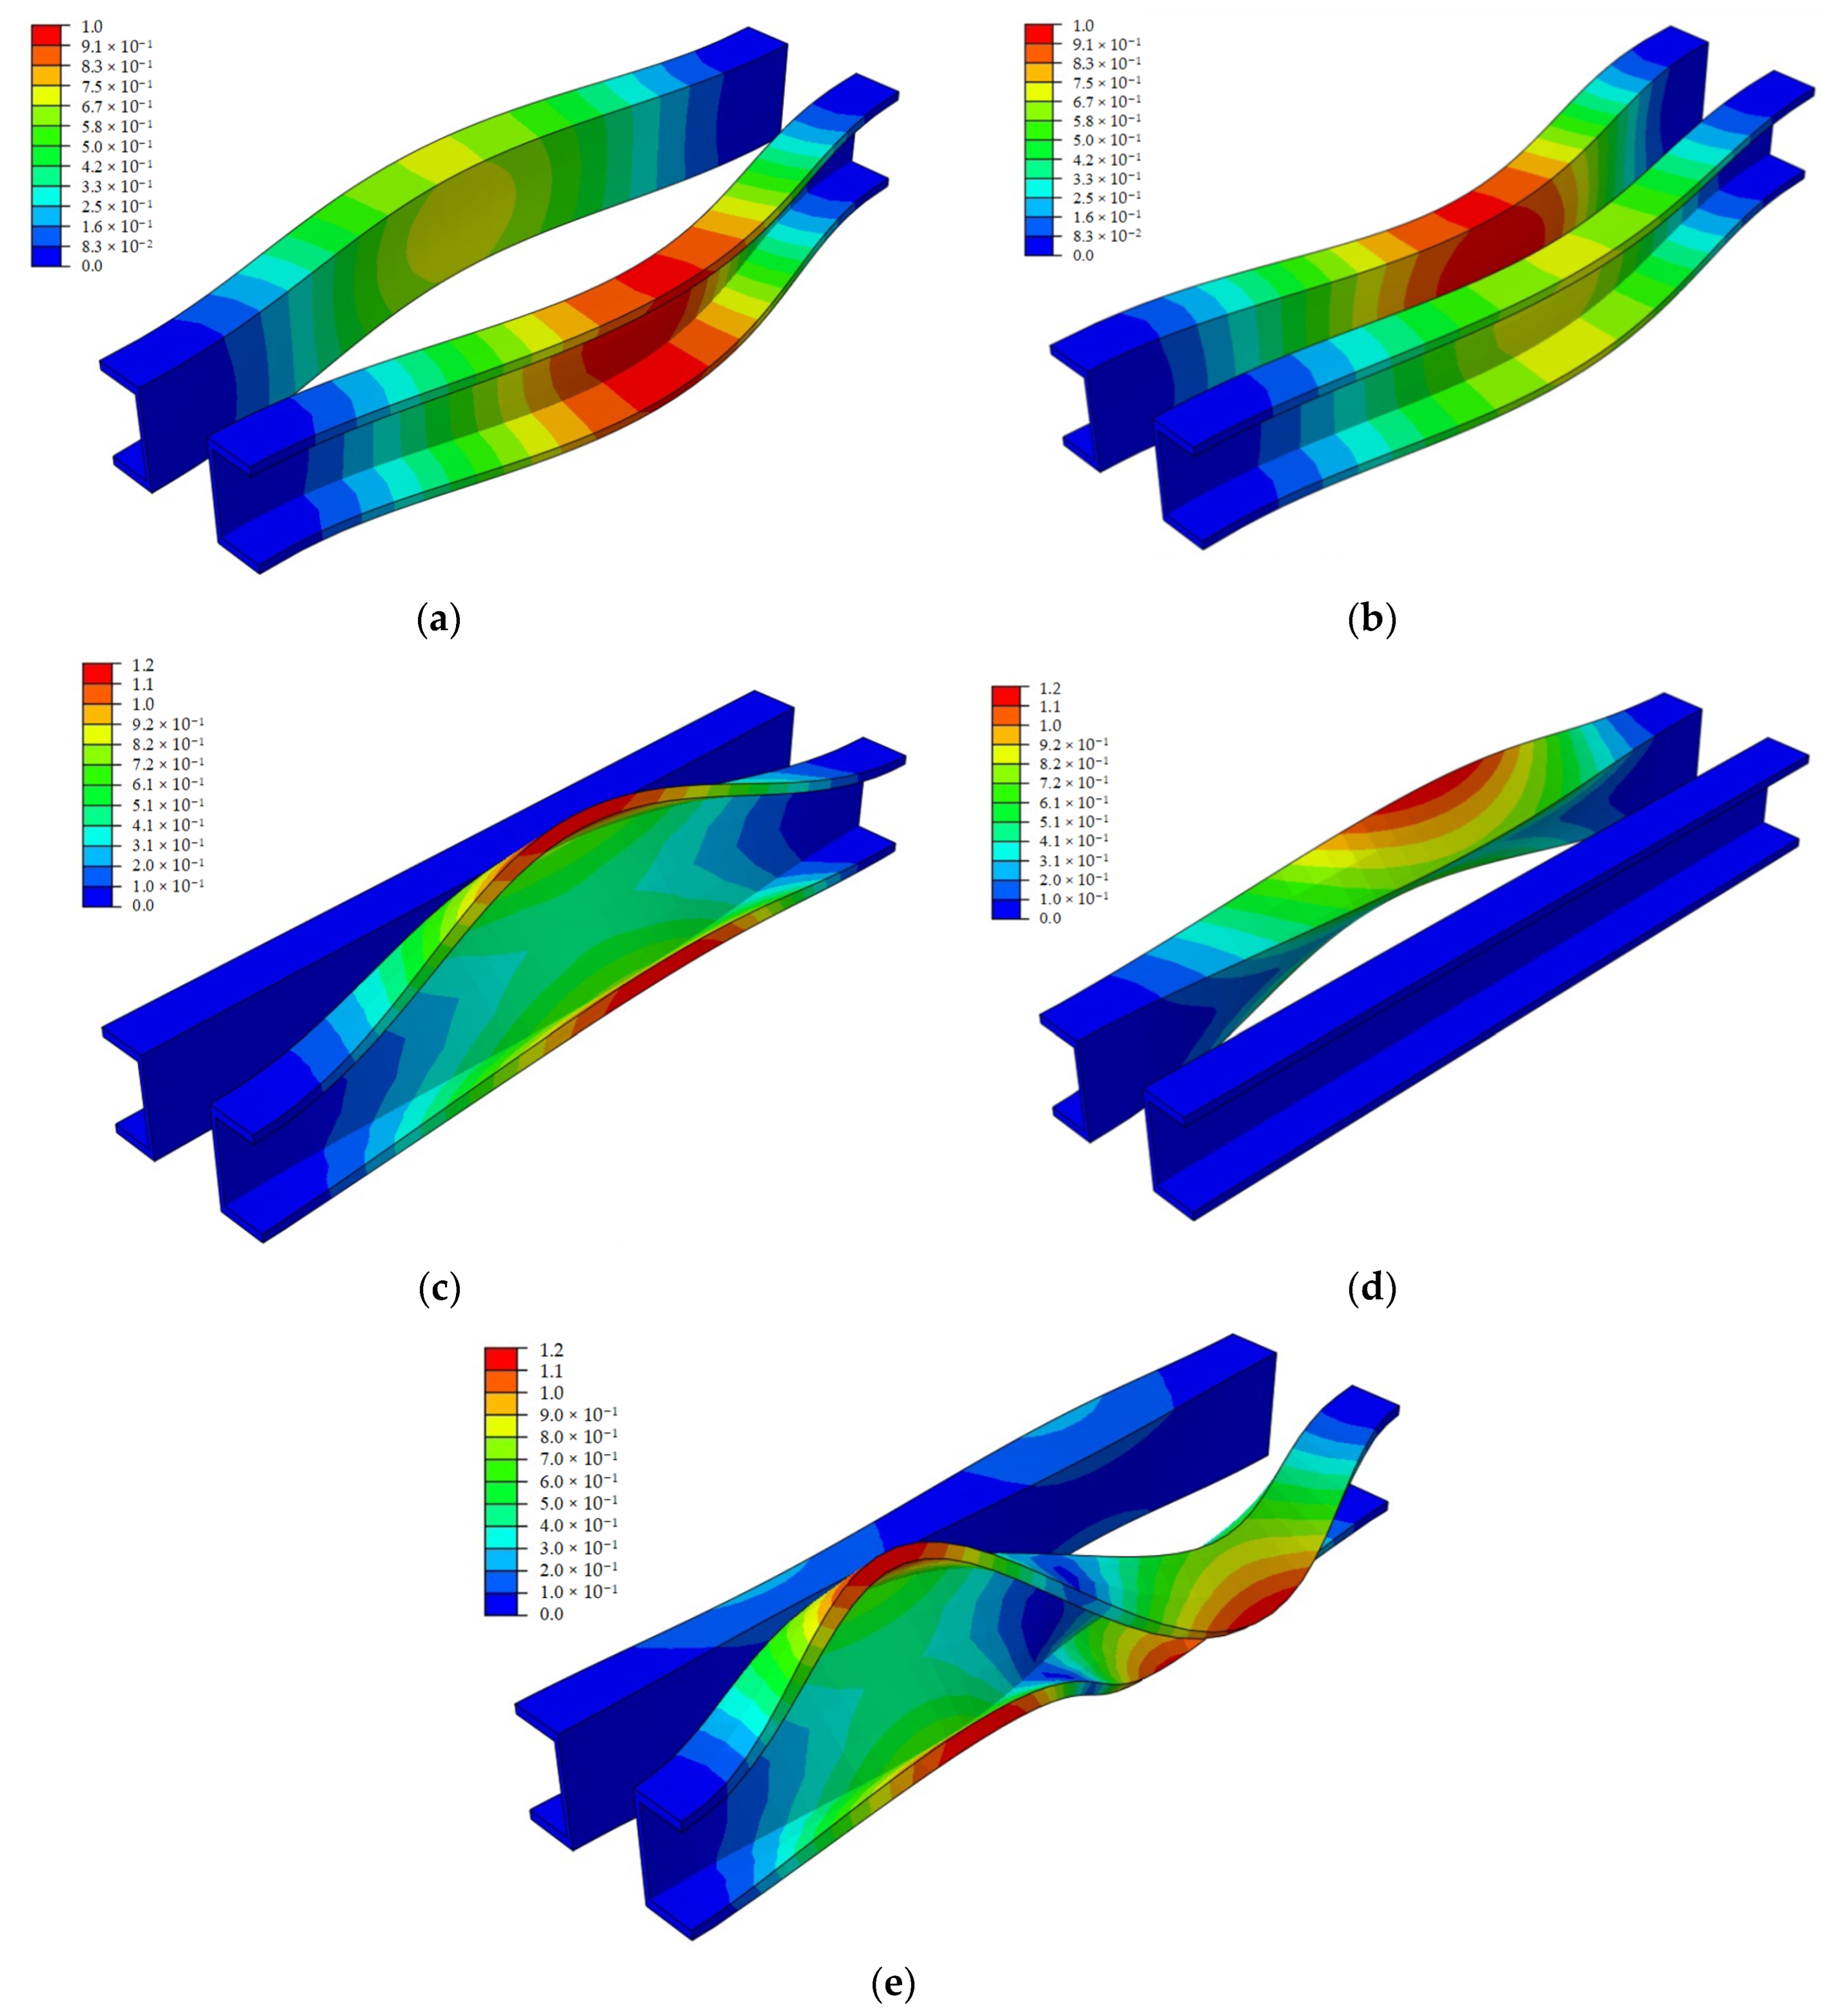
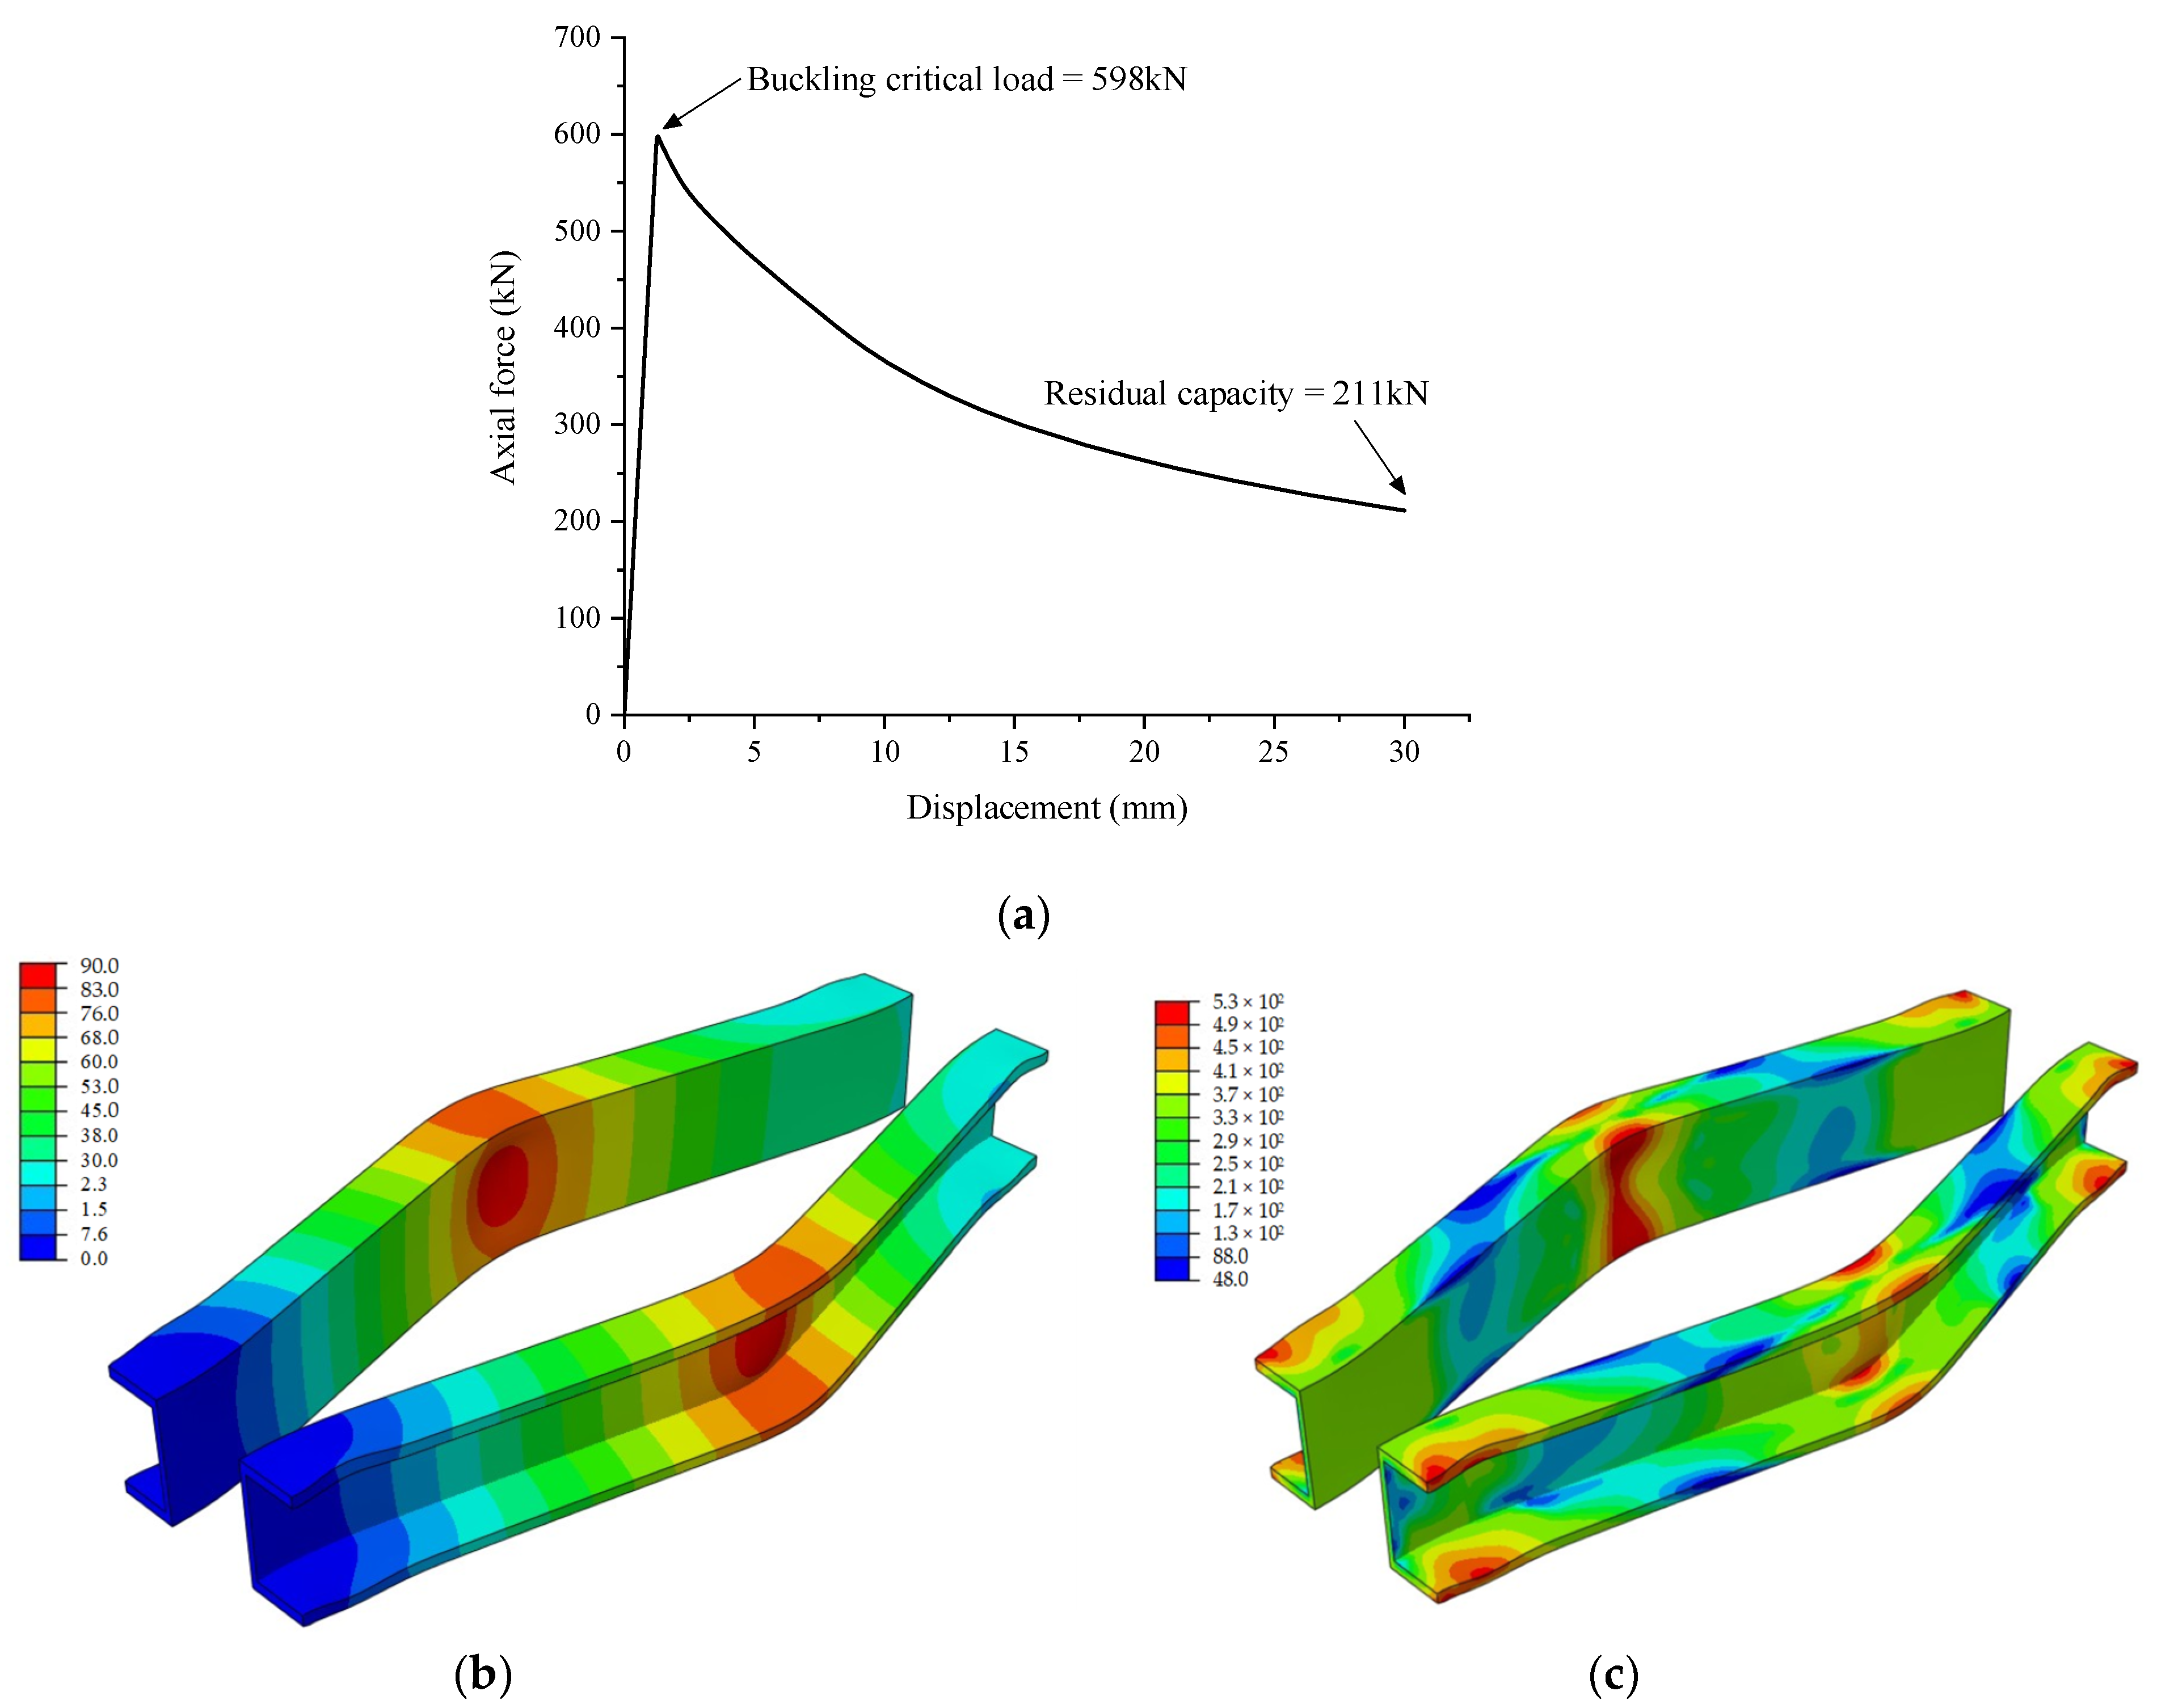
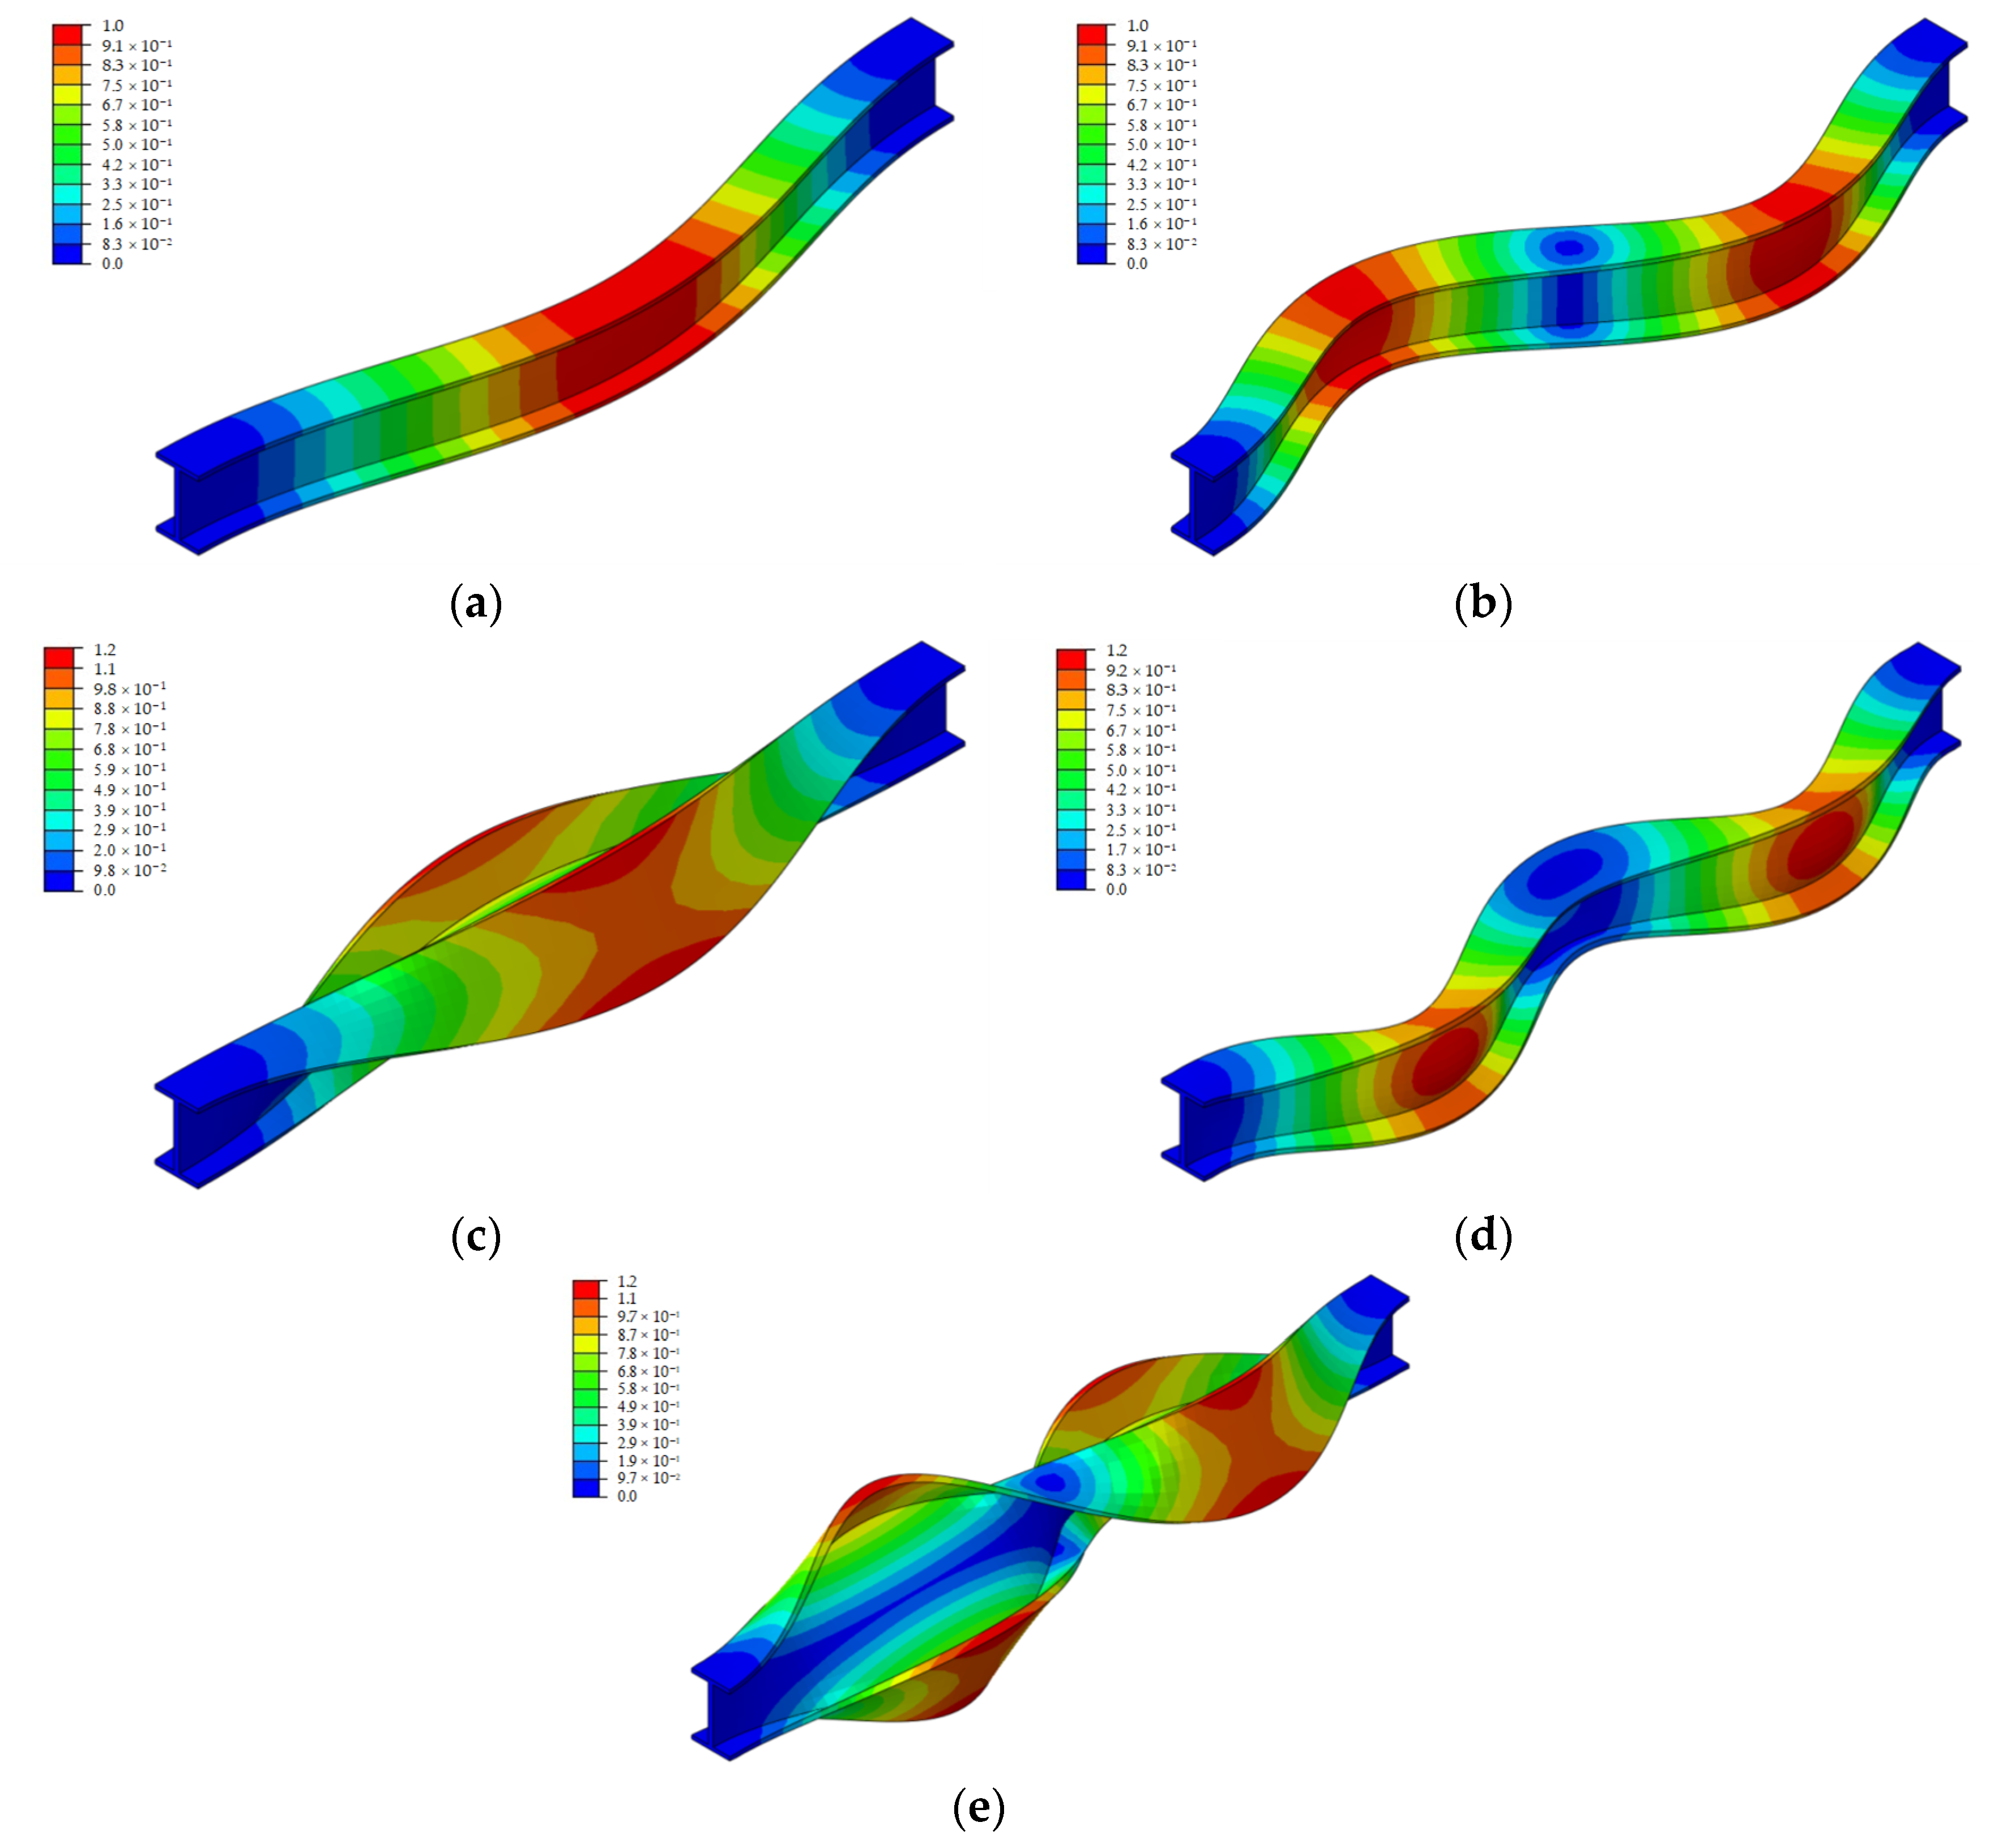
Under the centered-layout load, the maximum internal force of the truss chord (including the stiffening chord) appears at the middle span section. Under the eccentrically distributed load, the maximum internal force of the truss chord (including the stiffening chord) appears at the middle span section, which is the nearest position to vehicle loading. The maximum internal force of the stiffening chord shall be greater than the maximum internal force of the corresponding truss chord. Under vehicle load, truss chords (including stiffening chords) are prone to buckling instability and the buckling mode is mainly reverse out-of-plane buckling.
(3)
The stress and internal force distribution characteristics of truss inclined members and truss vertical bars are similar. Under the centered-layout load, the maximum internal forces of the truss diagonal members and truss vertical bars appear at the fulcrum joints. Under the eccentrically distributed load, the maximum internal forces of the truss diagonal members and truss vertical bars appear at the fulcrum node, which is the nearest position to vehicle loading.
(4)
Under vehicle load, the truss diagonal members are prone to buckling instability. The buckling mode is mainly a combination of out-of-plane bending and two-way out-of-plane bending.
(5)
The internal force of the truss vertical bar is less than its allowable bearing capacity, and it is not easy to buckle and lose stability. The truss vertical bar has good stability.
(6)
Some experiments are needed in future work to verify the conclusions drawn from this research.

Author Contributions

Methodology, S.C.; Software, H.L.; Investigation, Y.Z.; Writing—original draft, H.H.; writing—review and editing, N.A. and Z.F. All authors have read and agreed to the published version of the manuscript.

Funding

This research is funded by the Open Project of the National Engineering Laboratory of Bridge Safety and Technology (Beijing) (Grant No. 2020-GJKFKT-8).

Data Availability Statement

Data is contained within the article.

Acknowledgments

This research is funded by the Open Project of the National Engineering Laboratory of Bridge Safety and Technology (Beijing) (Grant No. 2020-GJKFKT-8). This support is gratefully acknowledged. The results and conclusions presented in the paper are those of the authors and do not necessarily reflect the views of the sponsors.

Conflicts of Interest

The authors declare no conflict of interest.

References

  1. Burroughs, D.; Price, K. High performance steel bridge concepts. Mod. Steel Constr. 1999, 39, 45–52. [Google Scholar]
  2. Han, Q.; Du, X.; Liu, J.; Li, Z.; Li, L.; Zhao, J. Seismic damage of highway bridges during the 2008 Wenchuan earthquake. Earthq. Eng. Eng. Vib. 2009, 8, 263–273. [Google Scholar] [CrossRef]
  3. Barker, M.G.; Schrage, S.D. High performance steel: Design and cost comparisons. Mod. Steel Constr. 2000, 40, 35–41. [Google Scholar] [CrossRef]
  4. Mertz, D.R.; Hartmann, J.L. Evolution vs. revolution: The culture of steel bridge construction. In Proceedings of the Structures Congress XV, Portland, OR, USA, 13–16 April 1997; Structural Engineering Institute of the American Society of Civil Engineers: Reston, VA, USA, 1997; pp. 403–407. [Google Scholar]
  5. Horton, R.; Power, E.; Van Ooyen, K.; Azizinamini, A. High performance steel cost comparison study. Transp. Res. Rec. 2002, 1814, 27–36. [Google Scholar] [CrossRef]
  6. Wilson, A.D. Properties of recent production of A709 HPS-70W bridge steels. In Proceedings of the International Symposium on Steel from Fabricated Structures, Hong Kong, China, 15–17 December 1999. [Google Scholar]
  7. Zhang, Y.; Li, B. Application of ANSYS to reliability analysis of prefabricated steel bridge. J. Syst. Simul. 2015, 27, 1907–1913. [Google Scholar]
  8. Macioce, T.P.; Thompson, B.G.; Zielinski, B.J. Pennsylvania’s experience and future plans for high performance steel bridges. In Steel Bridge Design and Construction for the New Millennium with Emphasis on High Performance Steel: Conference Proceedings; National Bridge Research Organization: Lincoln, NE, USA, 2000; pp. 146–156. [Google Scholar]
  9. Yin, H.; Shi, G. Finite element analysis on the seismic behavior of fully prefabricated steel frames. Eng. Struct. 2018, 173, 28–51. [Google Scholar] [CrossRef]
  10. Bonopera, M.; Chang, K.C.; Chen, C.C.; Lin, T.K.; Tullini, N. Bending tests for the structural safety assessment of space truss members. Int. J. Space Struct. 2018, 33, 026635111880412. [Google Scholar] [CrossRef]
  11. Maes, K.; Peeters, J.; Reynders, E.; Lombaert, G.; De Roeck, G. Identification of axial forces in beam members by local vibration measurements. J. Sound Vib. 2013, 332, 5417–5432. [Google Scholar] [CrossRef]
  12. Wasserman, E.; Pate, H. Tennessee’s experience with high performance steel: An owner’s perspective. In Steel Bridge Design and Construction for the New Millennium with Emphasis on High Performance Steel: Conference Proceedings; National Bridge Research Organization: Lincoln, NE, USA, 2000; p. 138d145. [Google Scholar]
Figure 1. Analysis process.
Buildings 14 01626 g001
Figure 2. Structural drawing of monolithic truss.
Buildings 14 01626 g002
Figure 3. Numerical model of steel truss bridge.
Buildings 14 01626 g003
Figure 4. Finite element model of truss members. (a) Truss chord (including stiffening chord). (b) Truss diagonal member (truss vertical bar).
Buildings 14 01626 g004
Figure 5. Section of truss chord.
Buildings 14 01626 g005
Figure 6. Eigenvalue buckling analysis of chord under axial compression. (a) First buckling mode; (b) Second buckling mode; (c) Third buckling mode; (d) Fourth buckling mode; (e) Fifth buckling mode.
Buildings 14 01626 g006
Figure 7. Nonlinear buckling analysis of chord under axial compression. (a) The axial force–displacement curve; (b) Displacement nephogram under axial displacement 30 mm (unit: mm); (c) Stress nephogram under axial displacement 30 mm (unit: MPa).
Buildings 14 01626 g007
Figure 8. Cross section of diagonal member.
Buildings 14 01626 g008
Figure 9. Eigenvalue buckling analysis of diagonal member under axial compression. (a) First buckling mode; (b) Second buckling mode; (c) Third buckling mode; (d) Fourth buckling mode; (e) Fifth buckling mode.
Buildings 14 01626 g009
Figure 10. Nonlinear buckling analysis of diagonal member under axial compression. (a) The axial force–displacement curve; (b) Displacement nephogram under axial displacement 30 mm (unit: mm); (c) Stress nephogram under axial displacement 30 mm (unit: MPa).
Buildings 14 01626 g010
Table 1. Material Parameters of 16 Mn Steel (Q345).
Elastic Modulus (MPa)Shear Modulus (MPa)Coefficient of Linear Expansion (1/°C)Poisson’s RatioDensity (kg/m3)
2.06 × 1050.790 × 10512 × 10−60.317850
Table 2. Maximum Axial Force of Steel Truss Chord.
ConditionRowSectionMaximum Axial Force of Lower Chord (Tension)/kNMinimum Axial Force of Upper Chord (Compression)/kN
Medium
Load
16479.3−536.7
26497.3−553.3
36497.3−553.3
46479.4−536.8
Eccentrically distributed load16402.3−460.5
26429.1−467.1
36590.1−660.3
46557.4−613.0
Disclaimer/Publisher’s Note: The statements, opinions and data contained in all publications are solely those of the individual author(s) and contributor(s) and not of MDPI and/or the editor(s). MDPI and/or the editor(s) disclaim responsibility for any injury to people or property resulting from any ideas, methods, instructions or products referred to in the content.

