Article

The Cyclic Performance and Macro-Simplified Analytical Model of Internal Joints in RC-Assembled Frame Structures Connected by Unbonded Prestressed Strands and Mortise-Tenon Based on Numerical Studies

Department of Civil Engineering, Key Laboratory of Earthquake Engineering and Structural Retrofit of Beijing, Beijing University of Technology, Beijing 100124, China
*
Author to whom correspondence should be addressed.
Buildings 2024, 14(6), 1629; https://doi.org/10.3390/buildings14061629
Submission received: 25 April 2024 / Revised: 21 May 2024 / Accepted: 27 May 2024 / Published: 2 June 2024
(This article belongs to the Special Issue Innovation of Seismic Behavior in Structural Engineering)

Abstract

:
This paper introduces a novel type of connection that integrates unbonded prestressed strands (UPS) and mortise-tenon in an assembly frame structure (UPS-MTF). First, the damage process and failure modes of the joints under reciprocating horizontal loads were systematically analyzed using refined numerical models. The recommended values of the design parameters of the joints were derived from the parametric analysis results. Refined numerical modeling results reveal the diagonal compression strut mechanism within the core region of the joint. The diagonal compression struts model assists in establishing the theoretical calculation formula for the skeleton curve of shear stress–strain in the core region. Second, a genetic algorithm (GA) parameter was identified for the restoring force model of the core region to determine the parameters of the hysteresis rules. Finally, a macro-simplified analytical model of the joint was created based on the restoring force model of the core region, and parameter analysis was conducted to verify the applicability of this macro-simplified analytical model. The research results prove that the damaged form of the joint proposed in this paper originates from the shear and relative slip damage between the components in the core region. The axial compression ratio significantly affects the hysteretic performance of the joints, and the upper and lower limit values were identified for the axial compression ratio of the joints. The area and initial effective stress of the UPS exert a minimal effect on the hysteretic performance of the joint. Based on the method proposed in this paper for determining the restoring force model in the core region of the joints, the hysteresis curves obtained from the macro-simplified analytical model closely match the refined numerical analysis model results. This correspondence verifies the applicability of the macro-simplified analytical model.

1. Introduction

Assembled structures have witnessed significant development and applications in recent years, especially with the introduction of various assembled frame structures [1]. The widespread applications and associated research into the assembled frame structures primarily stem from their characteristics, such as extensive engineering applicability and outstanding structural performance [2,3]. The connection performance of joints plays a crucial role in the seismic performance of assembled structures, and assembled structure connections can be categorized in different ways [4,5,6,7,8]. Connections can be categorized into equivalent cast-in-place connections and non-equivalent cast-in-place connections based on the different resistance modes. Equivalent cast-in-place connection is achieved through the mechanical connection of reinforcement bars, grouting sleeves, and grouted corrugated ducts for the equivalent linked-up connection of reinforcement bars [9].
Lu studied the precast prefabricated frame beam column connections with double sleeves [10,11,12], and the results showed that the double sleeve connections were superior to the cast-in-place connections in terms of strength and stiffness. Breccolotti’s study indicated that although equivalent cast-in-place connections can meet the strength and stiffness requirements of cast-in-place structures, they do not address the problem of concentrated and difficult-to-repair damage inherent in cast-in-place structures [13,14]. Therefore, in recent years, non-equivalent cast-in-place connections corresponding to equivalent cast-in-place connections have been widely studied [15,16], especially the prestressed connections for the dry connection methods [17,18,19,20,21].
Priestley was the first to apply prestressed connection technology to the assembled concrete frame structures in the 1990s [22]. The role of the unbonded, prestressed strands (UPS) in prestressed connections can be divided into two categories. First, it generates restoring forces (self-centering) to create a resilient mechanism that reduces the residual displacement of the structure. Second, it also provides the initial effective preload for the prefabricated components during the assembly construction stage, establishing the conditions for the structural system [23]. One of the more standard applications of prestressed connections is the formation of different kinds of structures with a rocking system, such as rocking bridge piers, rocking frames, rocking shear walls, and so on [24].
Iqbal proposed a prestressed multi-layer timber structure frame, and based on the seismic performance test of the joint, it was shown that prestressed connections have good recovery ability, but the energy dissipation capacity requires additional energy dissipation devices [25]. Naserpour proposed a prefabricated shear wall structure with additional rocking columns, and the results indicated that the additional rocking column system can effectively reduce the residual deformation [26]. Guo proposed a PPEFF system based on prestressed connection technology and studied the seismic performance of the joint through experiments and numerical analysis. The results showed that prestressing can provide good restoring force in the PPEFF system [27]. Li proposed a prefabricated structure based on pre-stressed hybrid connections and studied the seismic performance of a transverse frame structure through experiments and numerical simulations [28]. The results showed that the transverse frame structure meets the requirements of a strong column weak beam.
The results of the above studies indicate that the energy dissipation capacity of the structures or joints created solely by prestressed connections is relatively weak due to the lack of corresponding energy-consuming components. So the combination of prestressed connections with various energy-consuming components, such as multiple types of metal dampers and energy-consuming braces, was needed for the structures or joints. Although several types of energy-consuming components can significantly improve the energy-consuming capacity of the structural systems, it is crucial to consider factors such as the durability and reliability of various kinds of energy-consuming components, their impact on the building function, and the higher manufacturing, installation, and maintenance costs associated with them [29]. These factors can restrict their widespread applications and promotions in various building structures [30,31].
The mortise-tenon connection is commonly used in traditional Chinese wood structures. Due to the unique structure of the mortise-tenon connection and the characteristics of the wood itself, the mortise-tenon joints in wood structures typically exhibit good ductility and corresponding seismic performance [32,33,34]. However, mortise-tenon connections in wood structures are typically crafted by hand, and the specialized nature of these connections hampers the applications of diverse types of existing precast concrete structures. Existing research indicated that mortise and tenon joints undergo significant cumulative damage deformation and exhibit pronounced adhesive sliding phenomena after entering the plastic stage, resulting in more considerable residual deformation [12,35].
Based on the analysis of the prestressed connections, it is evident that the prestressed connections can minimize the residual displacement of structures. Therefore, the combination of mortise-tenon connection and prestressed connection can be considered for all types of precast-assembled concrete structures to reduce the high residual deformation similar to that in wood structures. Building upon this concept, this paper introduces a novel connection system that combines prestressing and mortise-tenon techniques for assembled frame structures. This integrated connection system capitalizes on the benefits of prestressing and mortise-tenon methods.
Reasonable macro-simplified analysis models are the foundation for transitioning from the joint to the structural level in various assembled structures [36]. The computational accuracy and efficiency of a macro-simplified analysis model at the joint level are critical for the seismic design and performance evaluation of the overall structure. Developing a simplified analytical model, particularly the restoring force model, for mortise-tenon joints poses a significant challenge in seismic design and performance evaluation for traditional wood structures. Related scholars have extensively investigated the simplified analytical models of mortise-tenon joints. For instance, Dong developed the DoweType generalized restoring force model [37,38,39]. Lacourt [40], Blasetti [41] and Xie [42,43] proposed the restoring force model expressed by the combination of the multi-springs, respectively. Although those simplified analytical models can effectively express the restoring force for the different mortise-tenon joints, establishing restoring force models and determining related parameters are relatively complicated. Furthermore, their universality is not strong, making them inconvenient for practical engineering applications.
Based on the above analysis, this paper first systematically investigates the seismic performance of the internal joint combined with the proposed connections of the prestressing and mortise-tenon using the refined numerical analysis model. The hysteresis performance, damage process, and damage pattern of the combined connection are analyzed in detail. A simplified analysis model applicable to the combined connection presented in this paper is developed to meet the requirements for the efficient analysis and calculation of the entire assembled frame structure. This model focuses on determining the relevant parameters of the restoring force model, which are analyzed in detail. Ultimately, the feasibility of the simplified analysis model proposed in this paper is confirmed via comparison with the refined numerical model.

2. Significance of This Study

The main research significance of this paper is reflected in the following three aspects: (1) This paper proposes a new type of connection for the assembled concrete frame structure. The joint primarily consists of mortise-tenon and pre-stressing connections, which not only enable efficient assembly construction but also allow for the disassembly of each prefabricated part. (2) For the new joint proposed in this paper, the core region consists of multiple prefabricated parts. The seismic performance of the joint is significantly different from that of other assembled joints and cast-in situ joints, making it a subject worthy of further study. (3) For the new frame structure proposed in this paper, a macro-simplified analysis model is necessary for the overall frame structure analysis. Therefore, the macro-simplified analysis model was proposed for the new joint in this paper.

3. New Connection in the Assembly Structure

Building upon the integration of the prestressing and mortise-tenon connections, this paper proposes a novel assembled concrete frame structure that incorporates both the prestressing and mortise-tenon connections (Figure 1a). This newly assembled concrete frame structure mainly comprises precast frame columns, integrated precast beam slabs, and UPS. In the joint, the ends of the upper columns, lower columns, and integrated beam plates are designed with the mortise-tenon and cup structure. Connection tenons are provided at the bottom of the upper columns and the end of the integrated beam slabs. In contrast, cups are provided at the top of the lower columns, and the specific details of the internal joint are illustrated in Figure 1b.
The upper precast and lower precast columns feature pre-drilled apertures in the centers for placing the UPS. The overall frame structure is assembled using mortise-tenon connections, and the initial preload of UPS enhances collaborative work among various components and the stiffness of the joints.

4. Establishment and Validation of the Refined Analysis Model

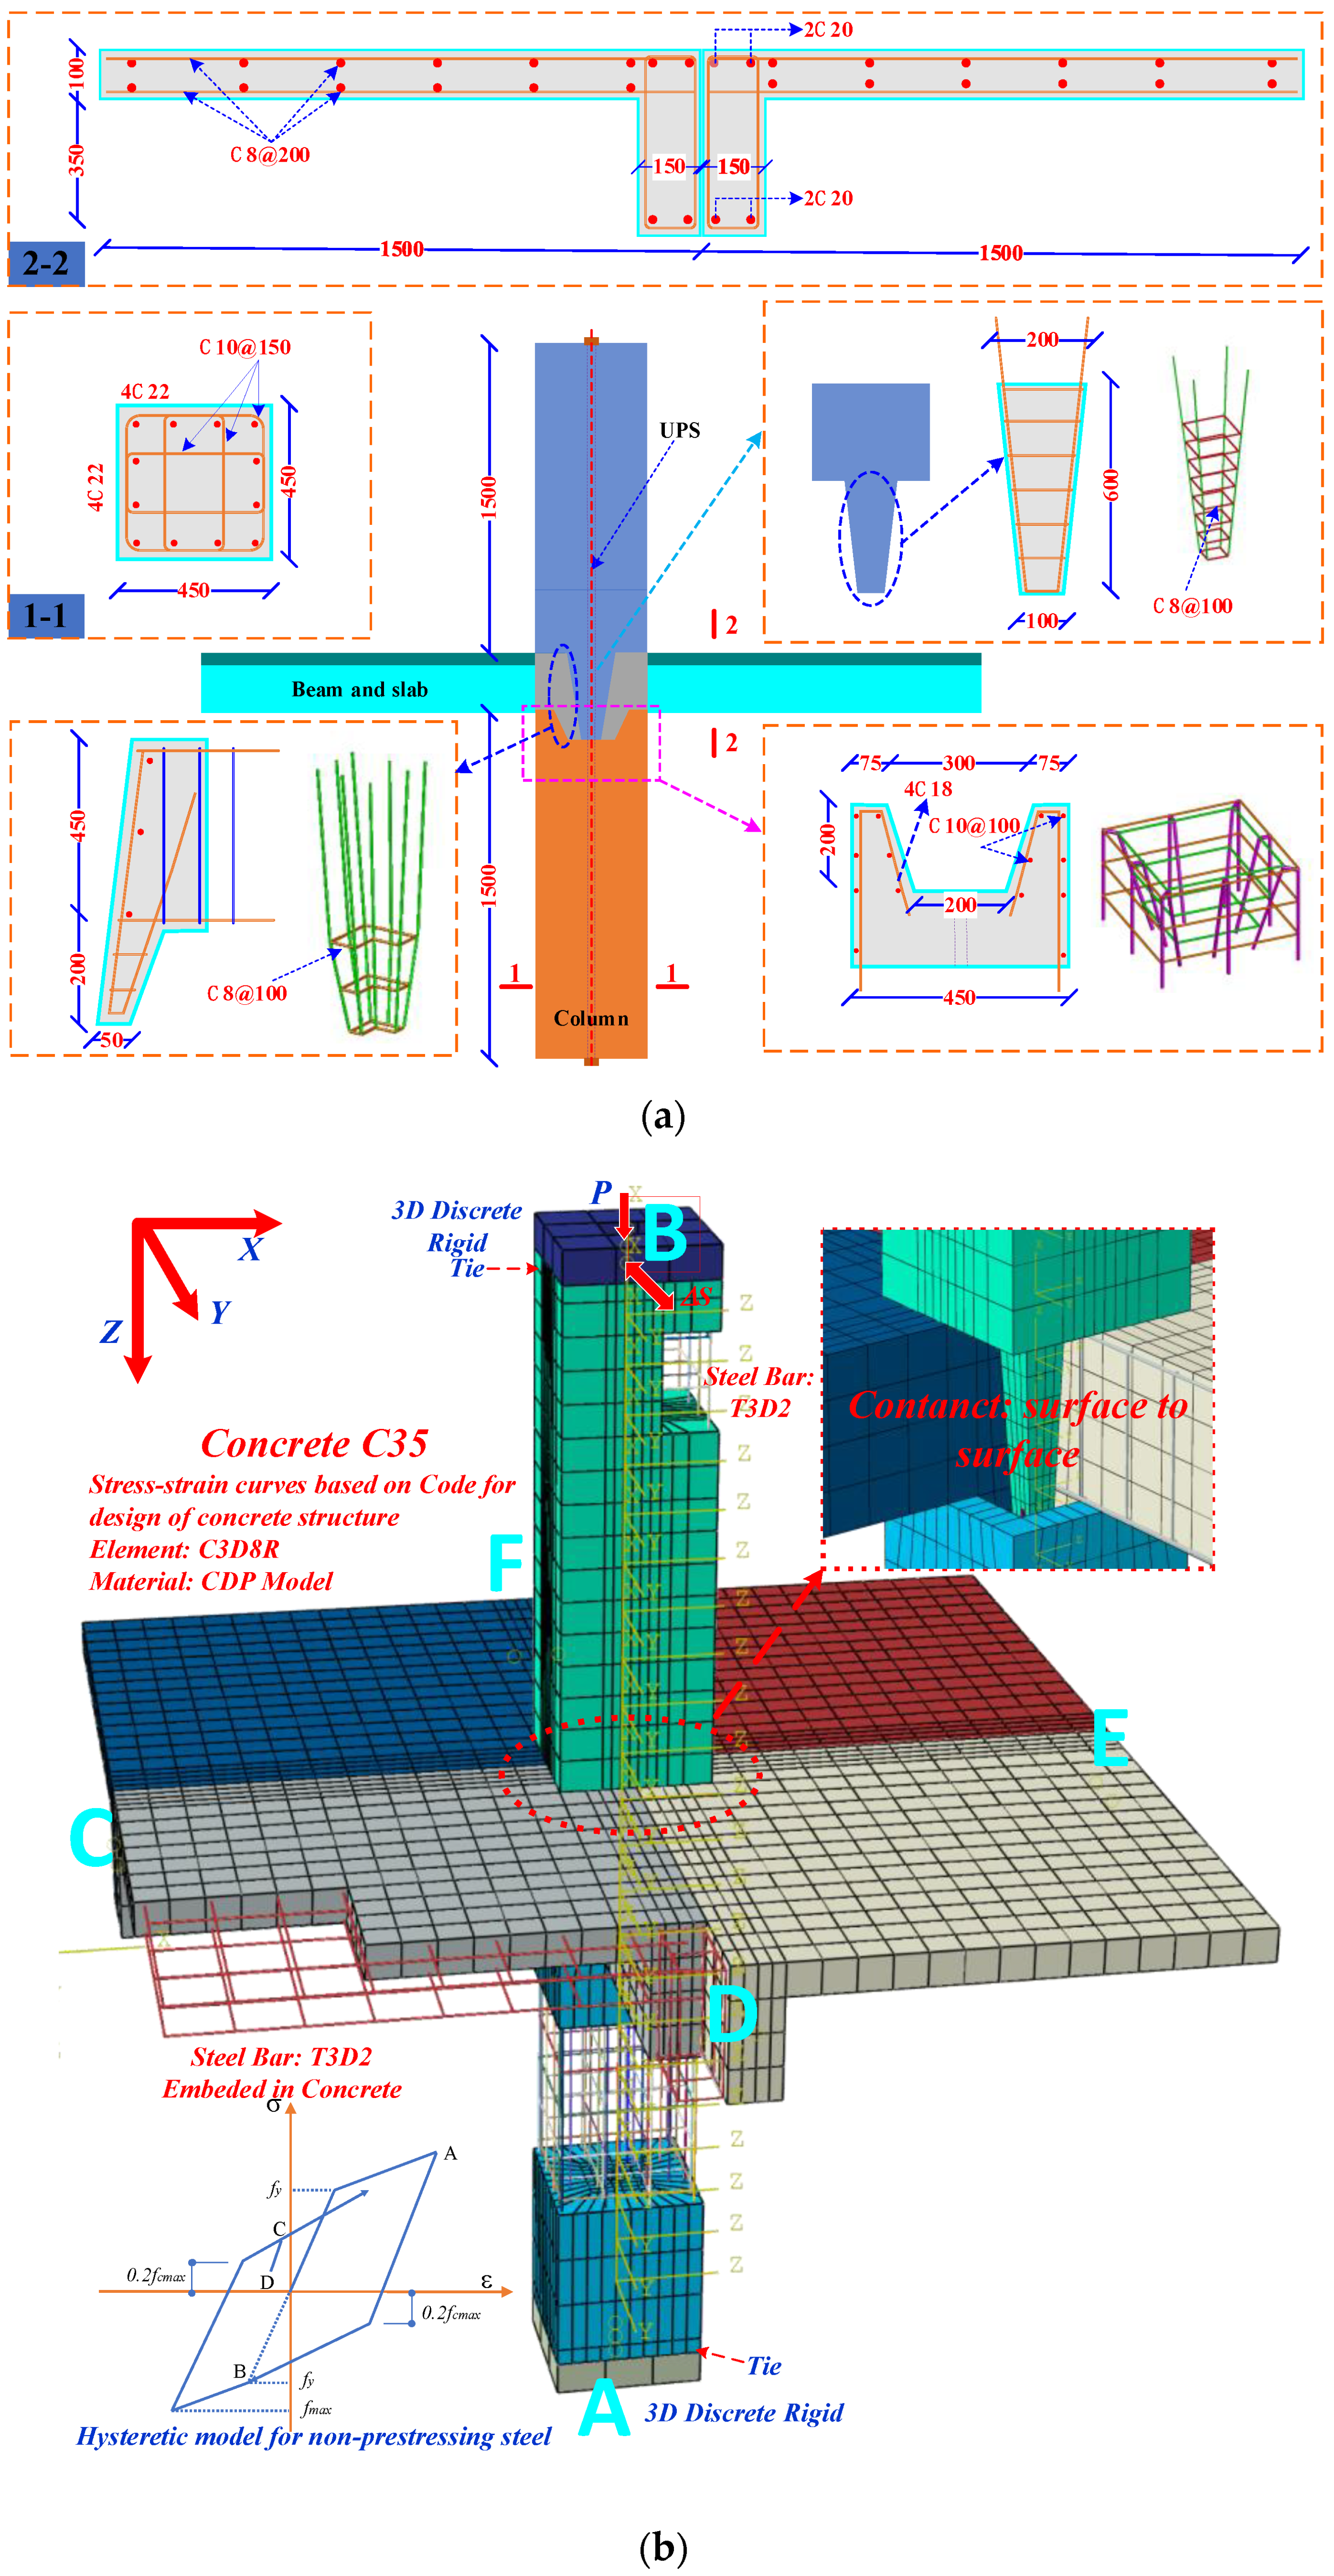
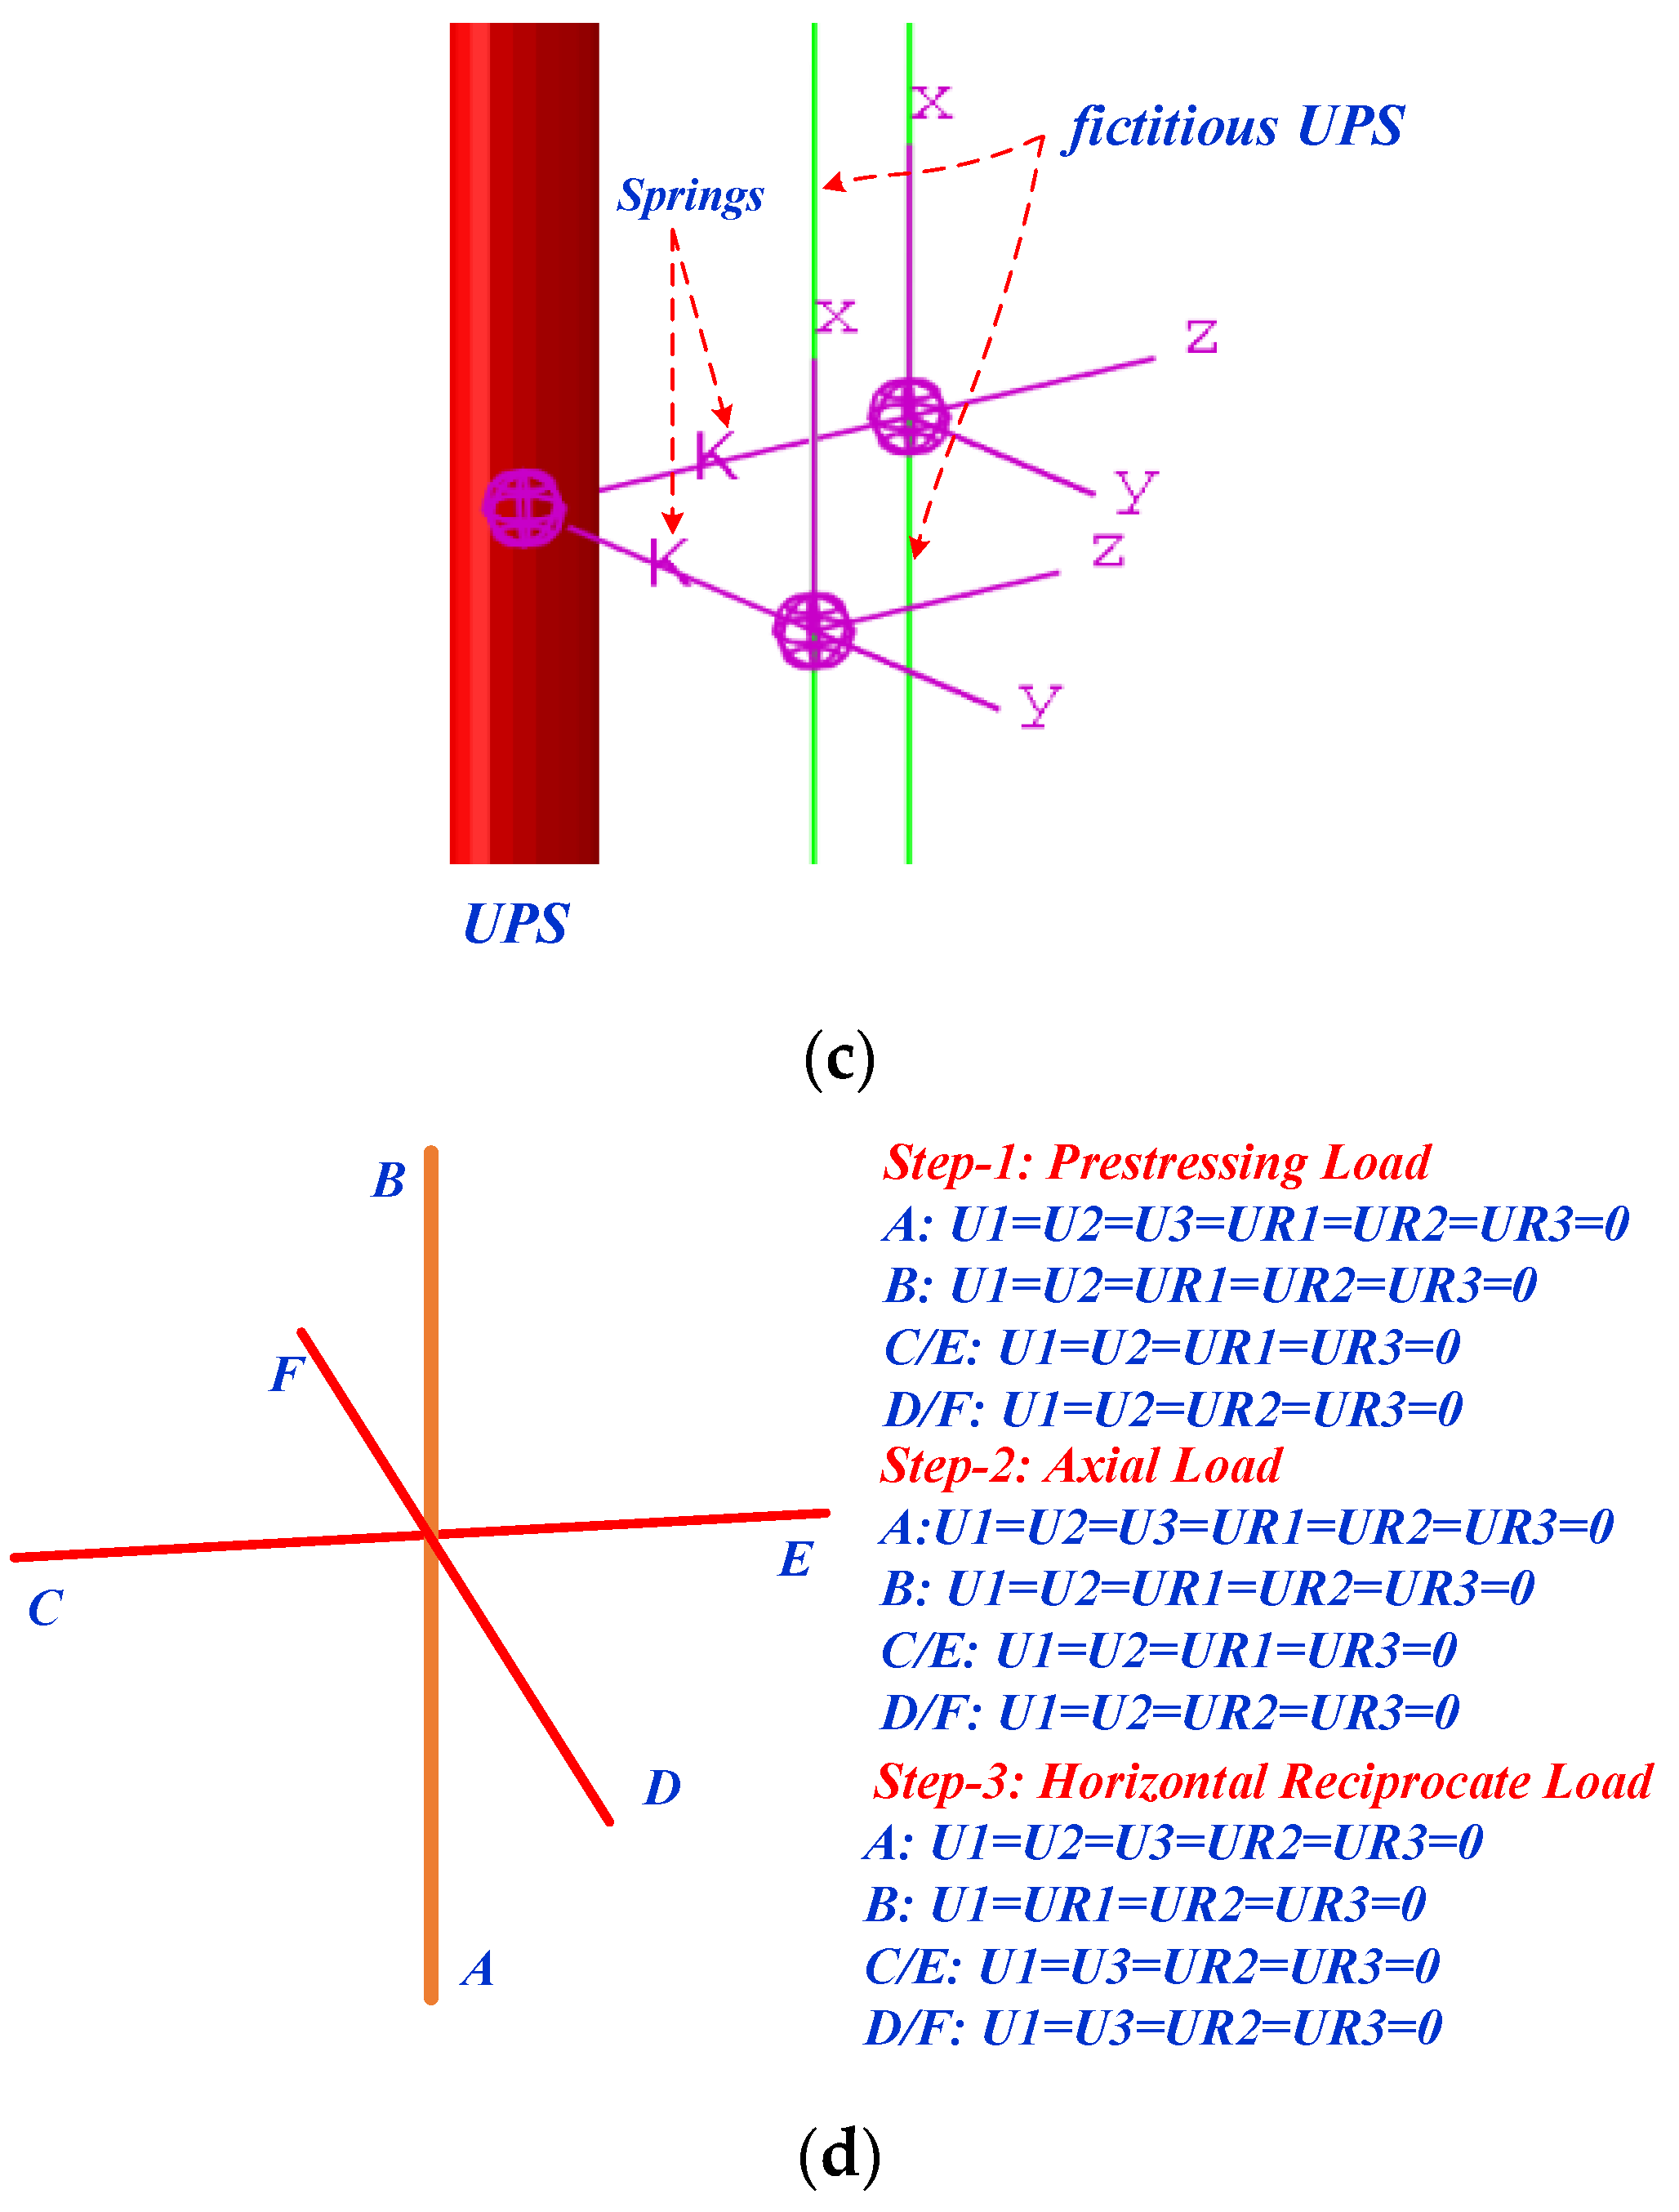
4.1. Establishment of the Refined Analysis Model

A refined numerical analysis model of the joints is established using ABAQUS 6.14 to analyze the seismic performance of the joints in the assembled frame structure proposed in this paper (Figure 2). The details on the design of the internal joint are displayed in Figure 2a. The concrete damaged plasticity (CDP) model is selected for the concrete constitutive model [44,45]. The concrete’s stress–strain curve is selected per GB50010-2010 [46], and C40 was selected as the strength of the concrete. The random reinforcement double-fold model is chosen for the UPS constitutive model, and the strength grade of the steel strands used in the joint is 1860 MPa. The Clough double-fold model is selected for ordinary steel reinforcement to consider bearing capacity degradation, and the yield strength of the steel reinforcement is 400 MPa. Discrete rigid blocks are designed at the ends of the upper and lower columns for the UPS to support loading and anchoring.
The C3D8R element (eight-node hexahedral linear-reduced integral element) is utilized for concrete. The T3D2 two-node linear 3D truss element is employed for ordinary steel reinforcement and the UPS. Concrete-to-concrete contact surfaces are modeled using “hard contact” in the normal direction and the Coulomb friction model in the tangential direction.
The bond slip between ordinary steel reinforcement and concrete is not considered, and ordinary steel reinforcement is embedded into the concrete. To ensure deformation coordination between the UPS and the concrete of the columns, two virtual UPSs parallel to the UPS are set up in line with the column’s direction. The virtual prestressing tendons are embedded into the concrete. The virtual UPS and the UPS are equipped with rigid springs in two orthogonal directions at the corresponding nodes.
Coupling is used between the ends of the UPS and rigid blocks, whereas tie connections are used between the rigid blocks and the end faces of the upper and lower columns. Three steps are designed to accomplish the application and modification of loads and boundary conditions in different stages. Step 1: The effective initial stresses of the UPS were induced by adjusting the temperature. Step 2: Axial forces were applied to the upper columns. Step 3: Horizontal reciprocating cyclic loads were applied at the ends of the upper columns. Figure 2 illustrates the alterations in boundary conditions in each step.

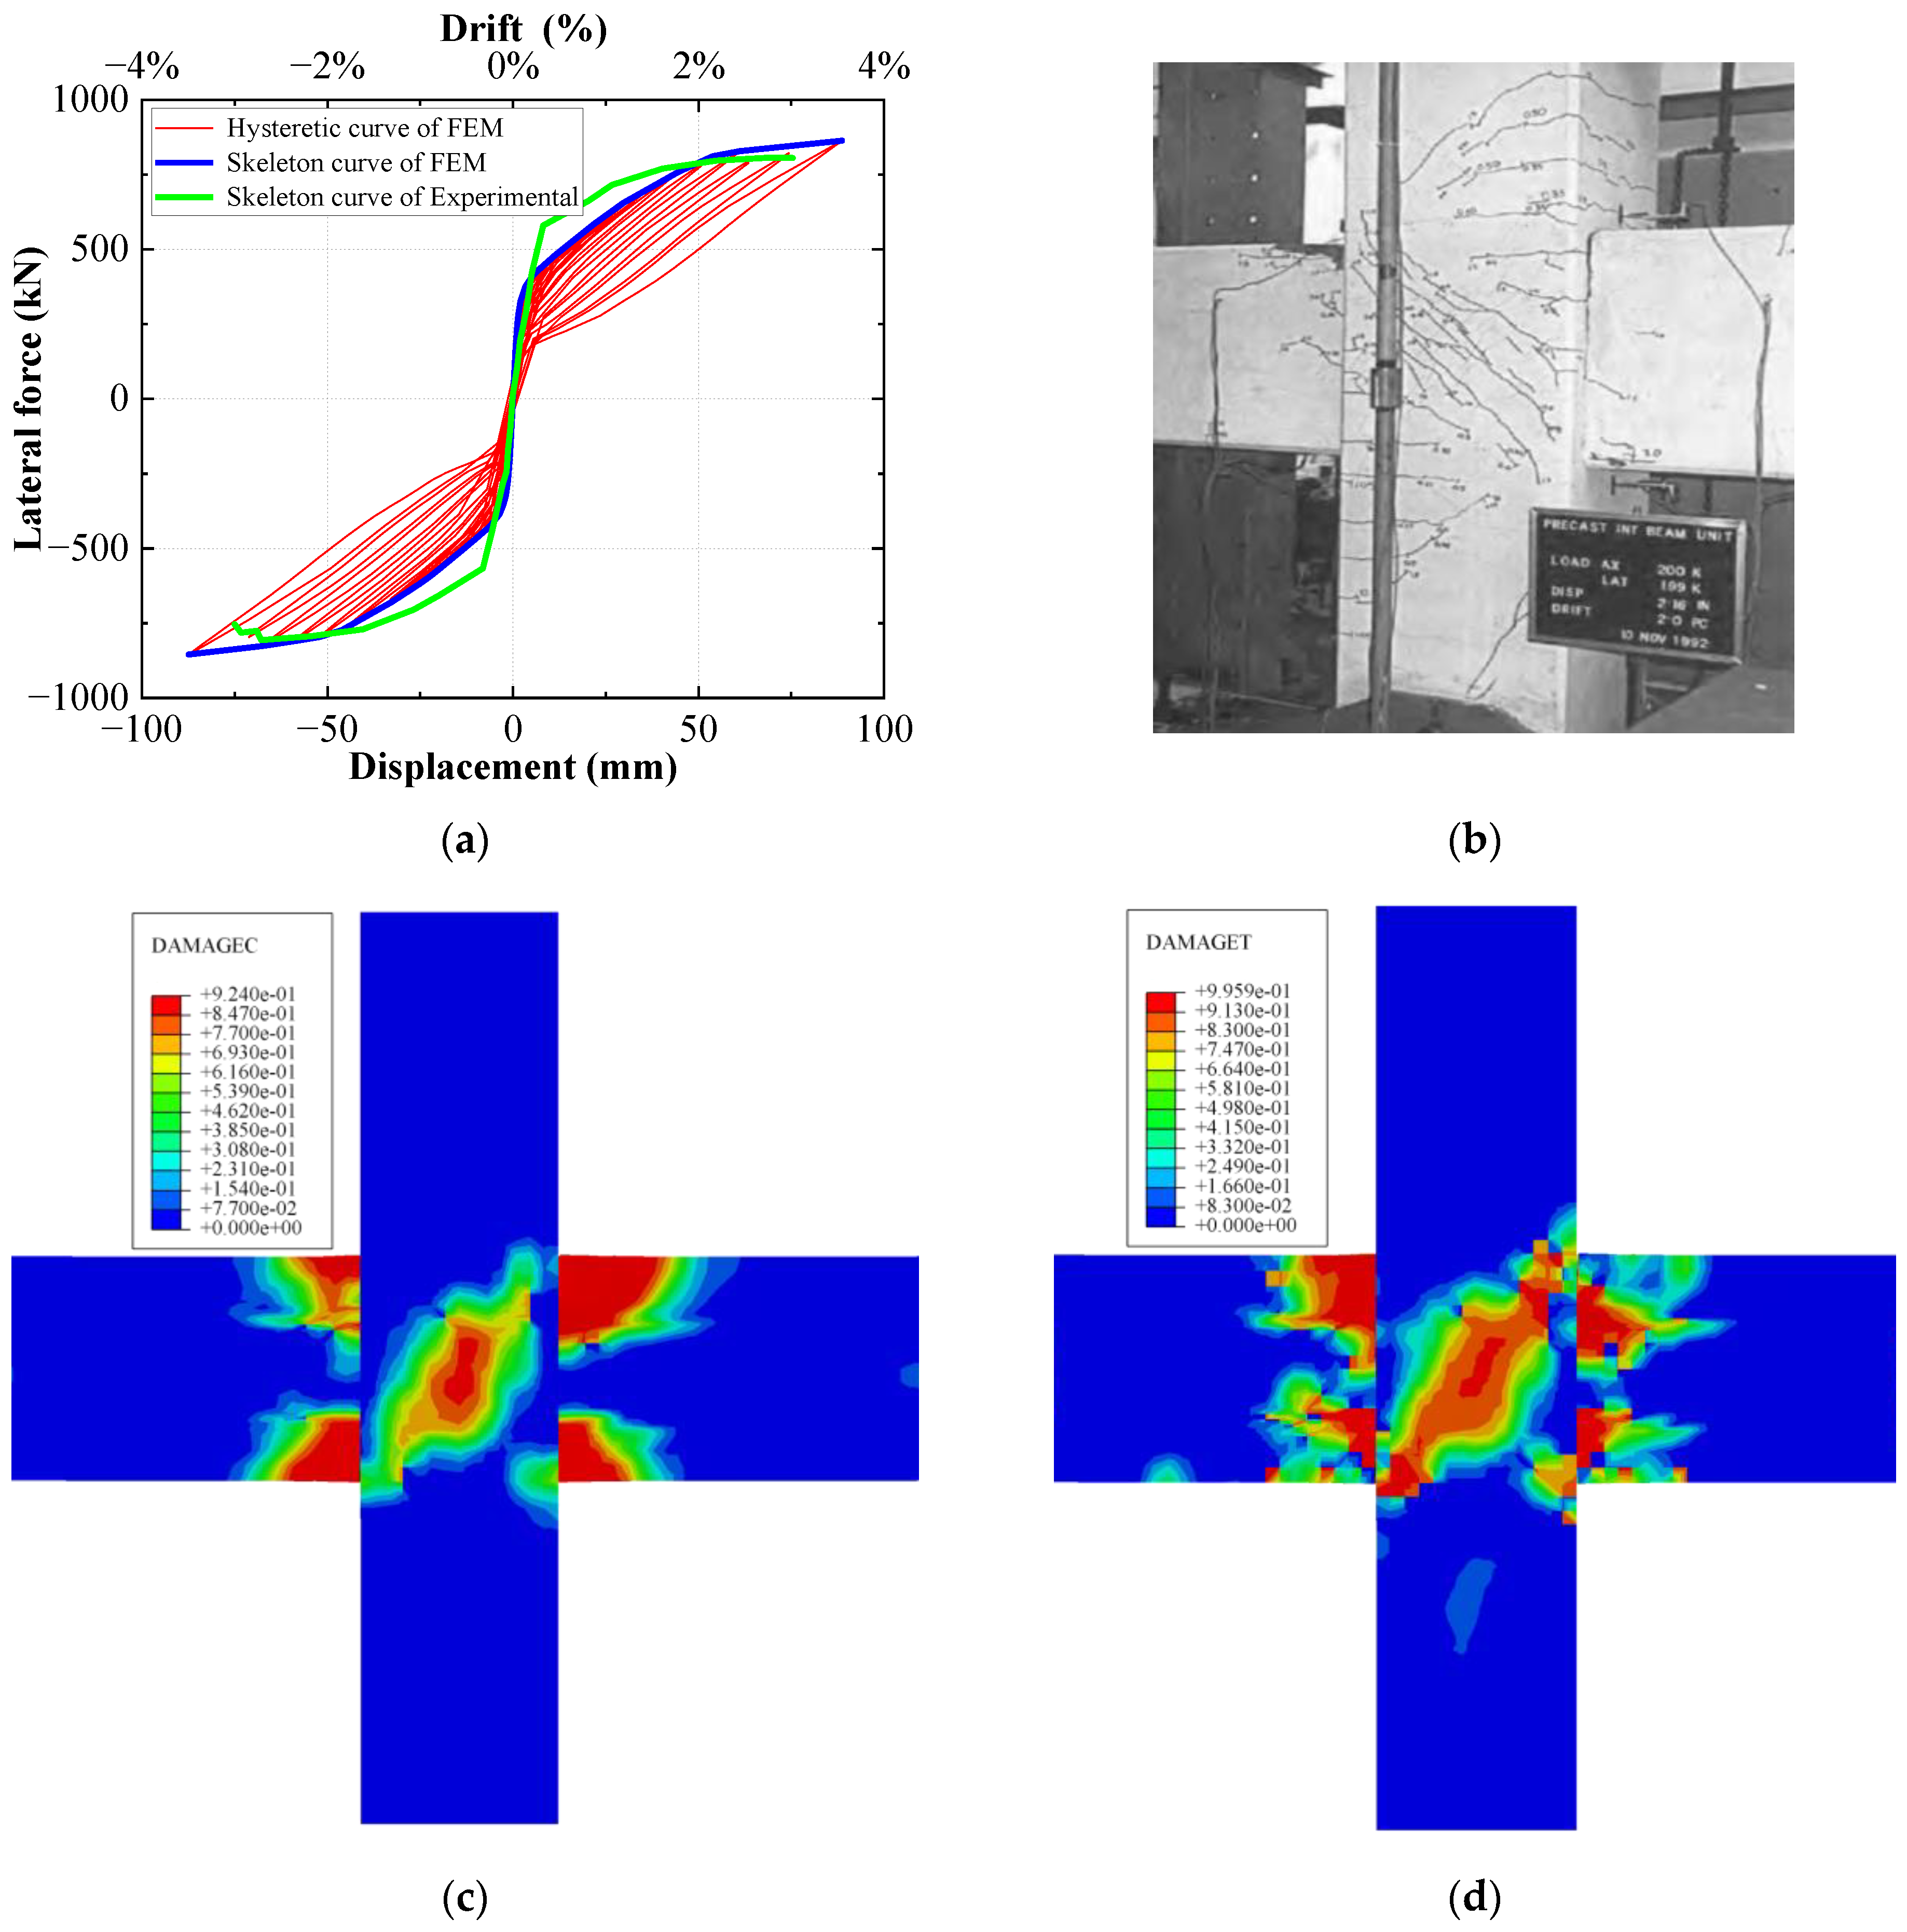
4.2. Model Validation

Considering the versatility of the finite element method (FEM), the feasibility of the modeling technique used in this paper is verified by comparing it with the test results of the prestressed assembled frame in the Precast Seismic Structural System (PRESSS) project. The test results of the internal joint from the literature [33] and the results calculated using the modeling technique in this paper are shown in Figure 3a, Figure 3b, Figure 3c, Figure 3d, respectively. Figure 3b especially displays the damage patterns of the joint as observed in the literature [33].
Comparison results demonstrate that the skeleton curve of the joint from the literature [33] is slightly larger than the skeleton curve calculated by the FEM established in this paper. The main reason for this discrepancy is that the selection of the concrete material in the FEM cannot be completely consistent with the concrete material involved in the test. Furthermore, the tensile and compressive damages in the core region of the joint under the horizontal repeated loading precisely correspond with the test results, indicating a similar distribution form of the diagonal crack in the core region. The above results validate the feasibility and accuracy of the FEM technique employed in this paper.

5. Analysis Results of the Refined Analysis Model

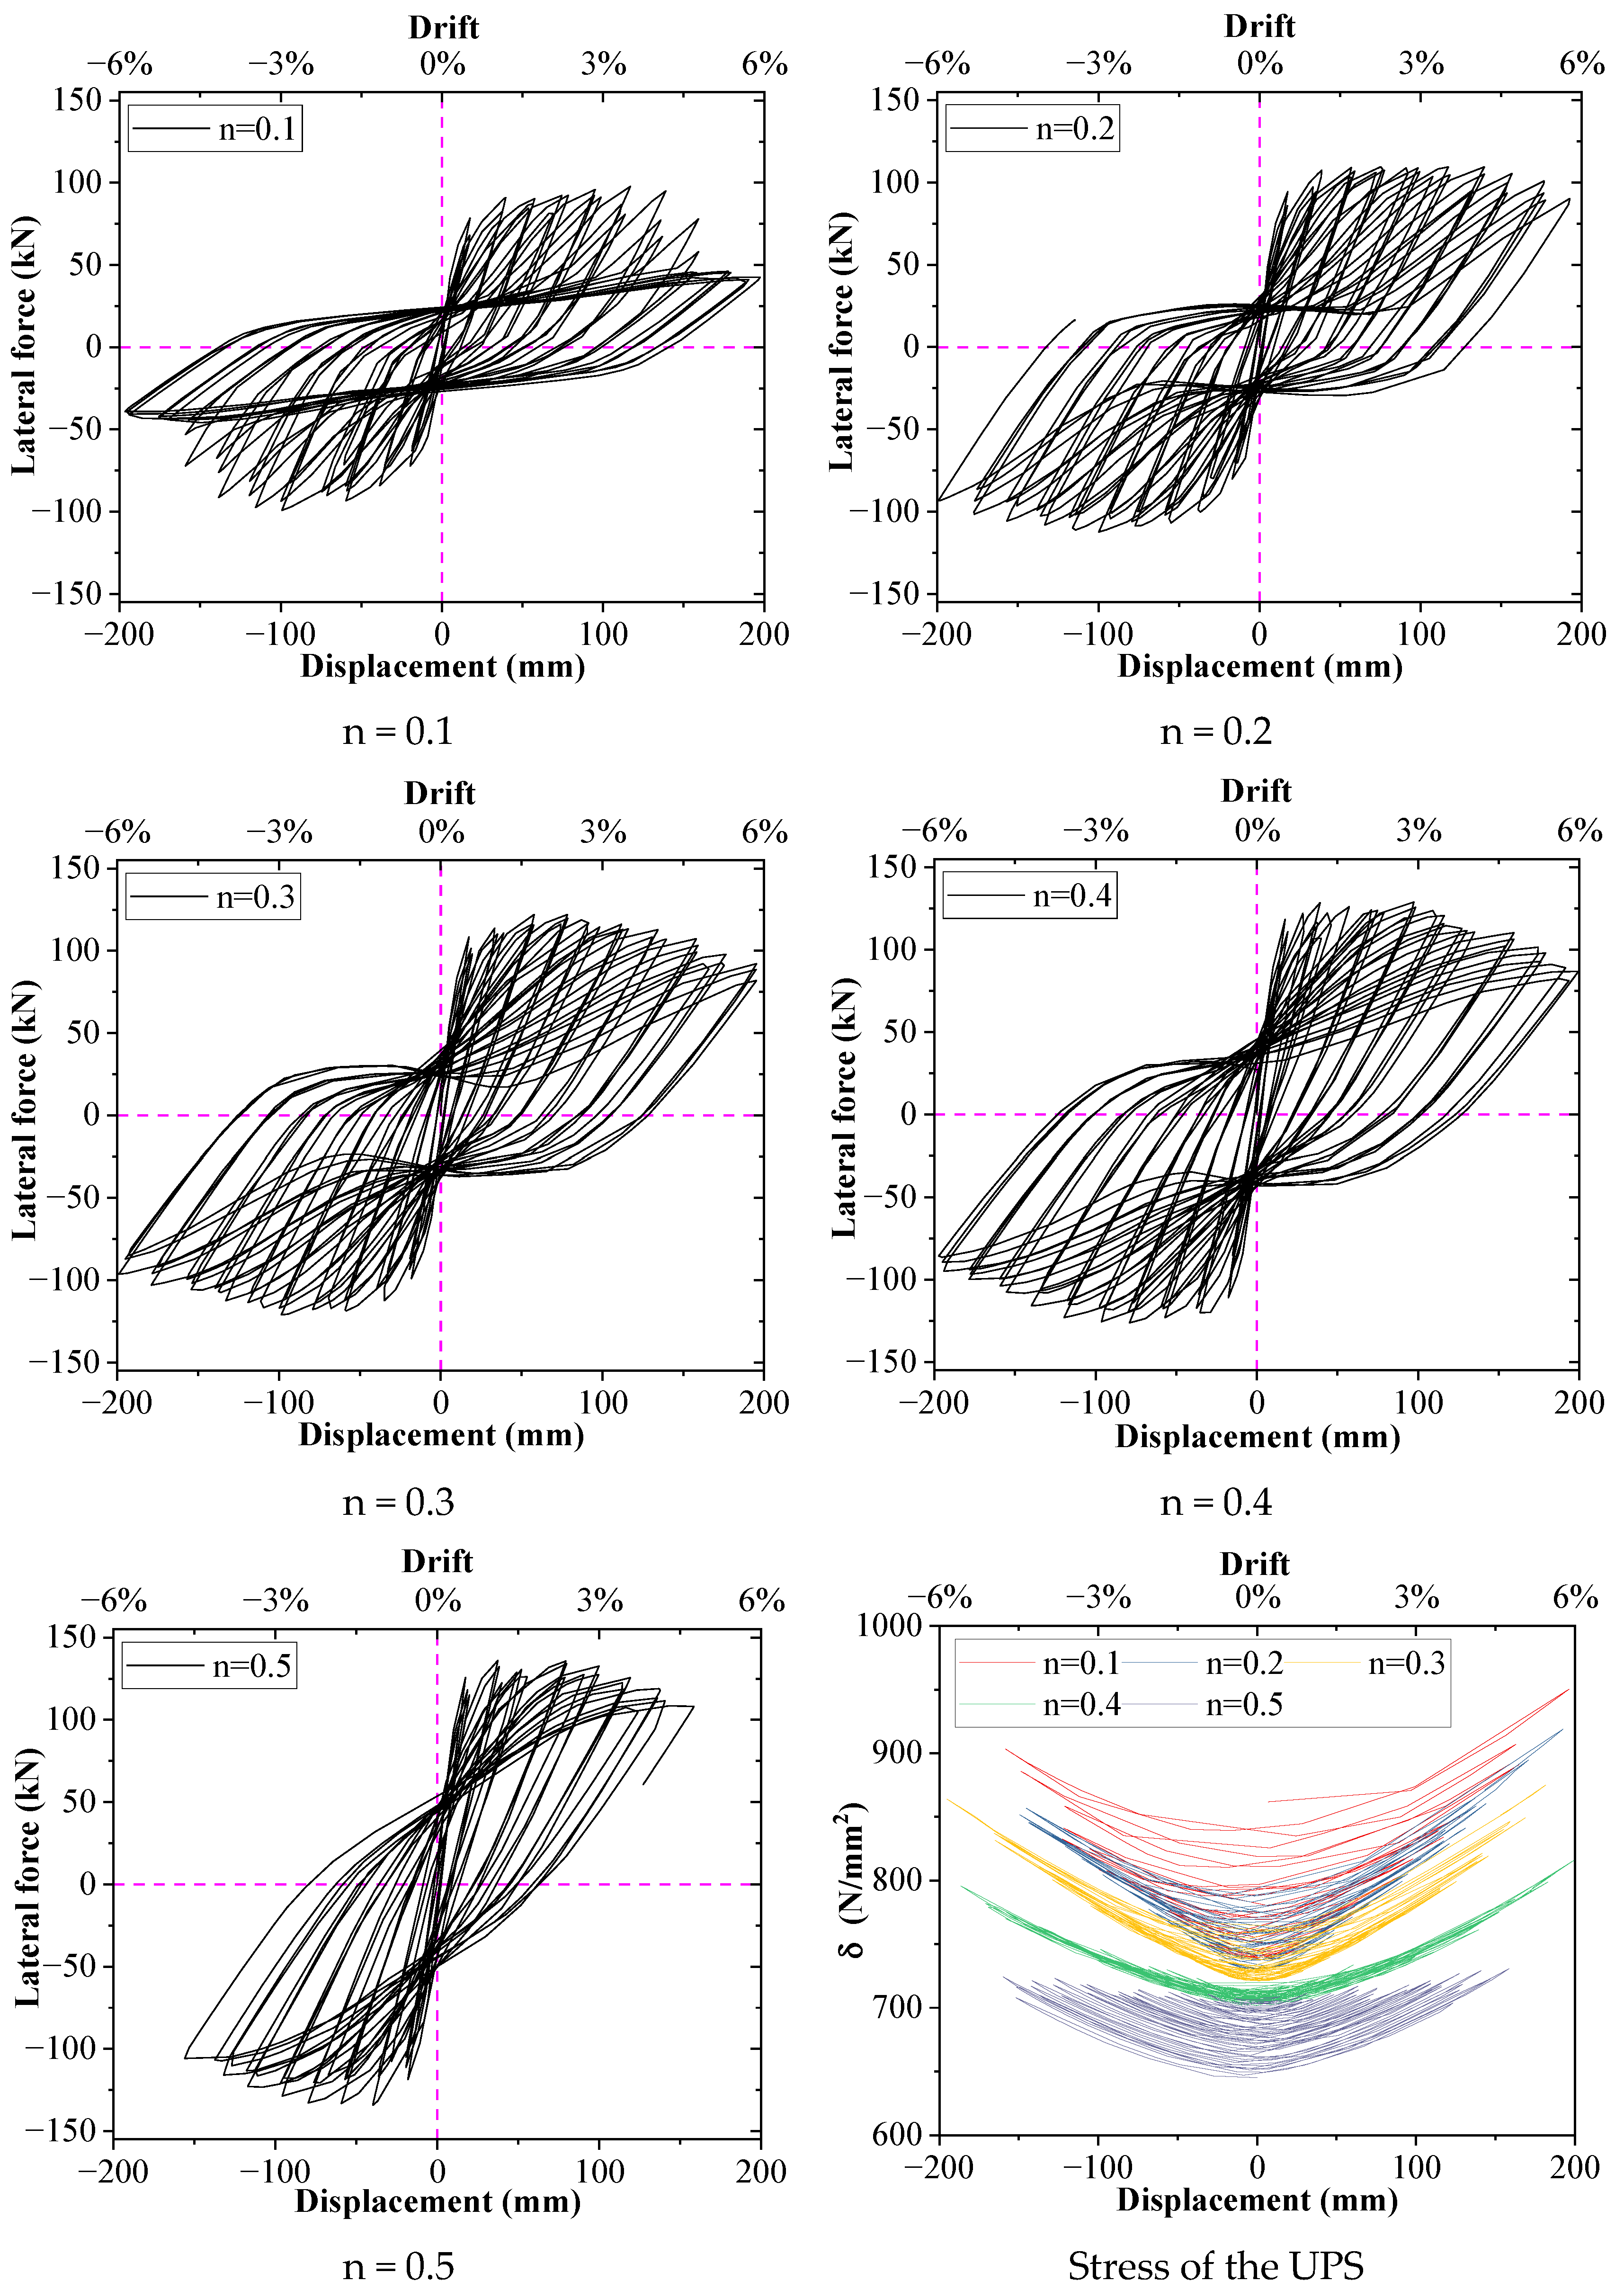
5.1. Hysteresis Curves Analysis

Building upon the modeling techniques introduced in Section 3, this section conducts a parametric analysis of the internal joints, including the axial compression ratio, the UPS area, and the initial effective stress of the UPS. Figure 4, Figure 5, and Figure 6 depict the hysteresis curves of each parameter and the stress change in the UPS of the internal joints, respectively.
In this section, the axial compression ratio (calculated by the section of the column that is outside the joint) parameter was selected within the range of 0.1–0.5. Based on Figure 4, it can be observed that the initial stiffness and peak load of the joints increase with an increase in the axial compression ratio. Furthermore, the slope of the descending stage of the hysteresis curve increases with an increase in the axial compression ratio, indicating a decrease in the ductility of the joints.
Meanwhile, Figure 4 demonstrates that the hysteresis curve of the joint exhibits a significant slip phenomenon in the late stage (corresponding to the descending stage) under small axial compression ratios. Therefore, while controlling the axial compression ratio of the joints proposed in this paper, if the axial compression ratio is small, the joint’s stiffness will be relatively low, leading to slip phenomena that will reduce its resistance to deformation.
Although the axial compression ratio is too large, the deformation ability of the joint is limited, resulting in a reduction in ductility. Furthermore, even though the axial compression ratio is too large, the local damage to the joint core region becomes too severe. Therefore, the axial compression ratio of the joint proposed in this paper should be controlled simultaneously within both an upper limit and a lower limit value. This paper suggests that the axial compression ratio of the joint be taken to be greater than 0.1 and less than 0.4.
In this paper, four parameter classes of 280 mm2, 420 mm2, 560 mm2 and 700 mm2 are designed for the UPS area, respectively. Figure 5 shows that with the increase in the UPS area, the initial stiffness of the joint undergoes little change, but the yield load and peak load show varying degrees of improvement. However, when the area of the UPS reaches a certain degree, the UPS’s role in improving the joint’s strength becomes less evident.
With the increase in the prestressing tendon area, the stress amplitude of the UPS exhibits a decreasing trend, indicating that the rise in the UPS area will reduce its utilization in the internal joints. This paper recommends that the UPS area should not be lower than As (n = 0.02) and not higher than As (n = 0.1). Here, As (n = 0.1) represents the UPS area when the initial stress ensemble of the UPS produces the corresponding initial axial compression ratio of 0.1.
Figure 6 shows that the impact of the effective stress level of the UPS on the joint is essentially similar to the effect of the UPS area. To ensure the integrity of the joint connection, it is essential to ensure that the UPS operates under elastic conditions during all loading stages. As specified in the tension control stress requirements for the UPS in the Code for the Design of Prestressed Concrete Structures JGJ 369-2016 [47], this paper suggests that the initial effective stress of the UPS should not exceed 0.75 times the ultimate tensile strength of the prestressing tendon (fpu).

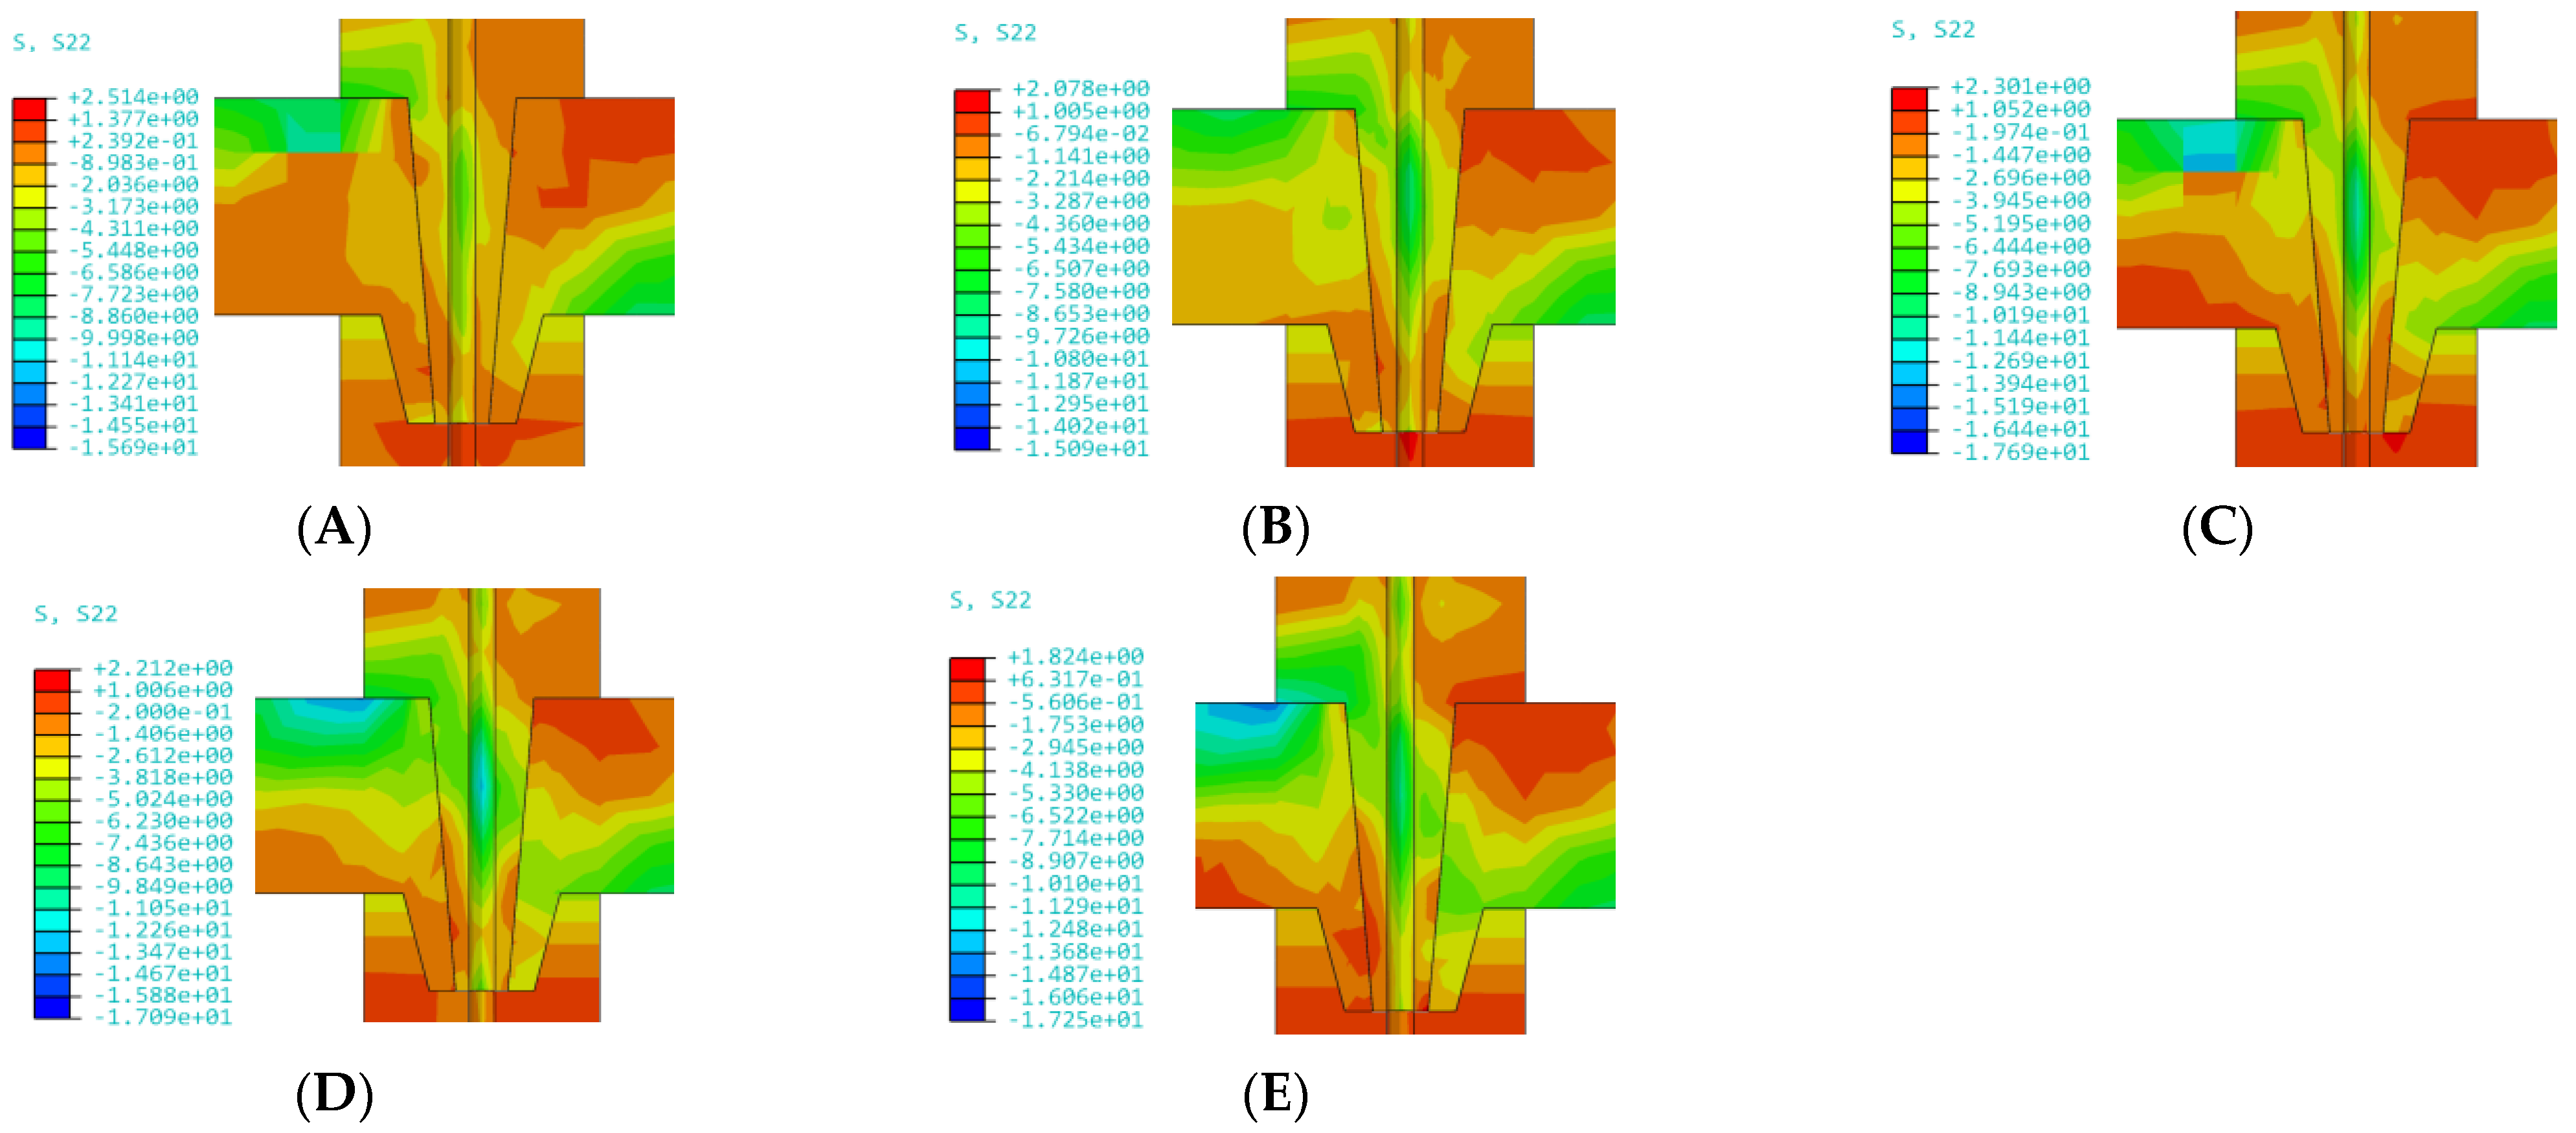
5.2. Deformation and Failure Process of the Joint

The load–displacement curves of the joints under horizontal monotonic and reciprocating conditions are obtained based on the refined numerical analysis model (Figure 7a,b). Points A, B, C, D, and E were selected as five representative points for the typical stress state in the load–displacement curves, and the corresponding stress distribution for each typical stress state in the core region of the joint is depicted in Figure 8 and Figure 9, respectively.
Figure 7 shows that the joint undergoes four stages under horizontal loading: elastic, yielding, plastic deformation expansion, and failure. As the core region of the joint comprises multiple components, the connection interface exists, and the steel reinforcement at the connection interface is not continuous. The damage to the joint originates from the accumulation of plastic deformation in the core region. As the horizontal load increases, a portion of the area of the concrete becomes deactivated, corresponding to the surrounding region where the steel reinforcement starts to yield, leading to a gradual increase in the joint’s damage. There is a relative slip between the prefabricated parts in the core region of the joint, which results in a rapid reduction in the joint’s horizontal bearing capacity and signifies the joint’s failure.
Based on the analysis of the stress distribution in the core region of the joint in Figure 8 and Figure 9, an apparent diagonal compression strut region exists in the core region of the joint under the horizontal load. This finding demonstrates that although the core region of the proposed joint transmits force through the interface of each component, the unique structure of the mortise-tenon and the presence of the UPS enable the transmission mechanism of diagonal compression struts, which are commonly used in the analysis of cast-in-place monolithic joints, to apply to the novel joint proposed in this paper. Therefore, the shear deformation analysis of the joint proposed in this paper can still be conducted using the diagonal compression struts model.

6. The Establishment of the Macro-Simplified Analytical Model

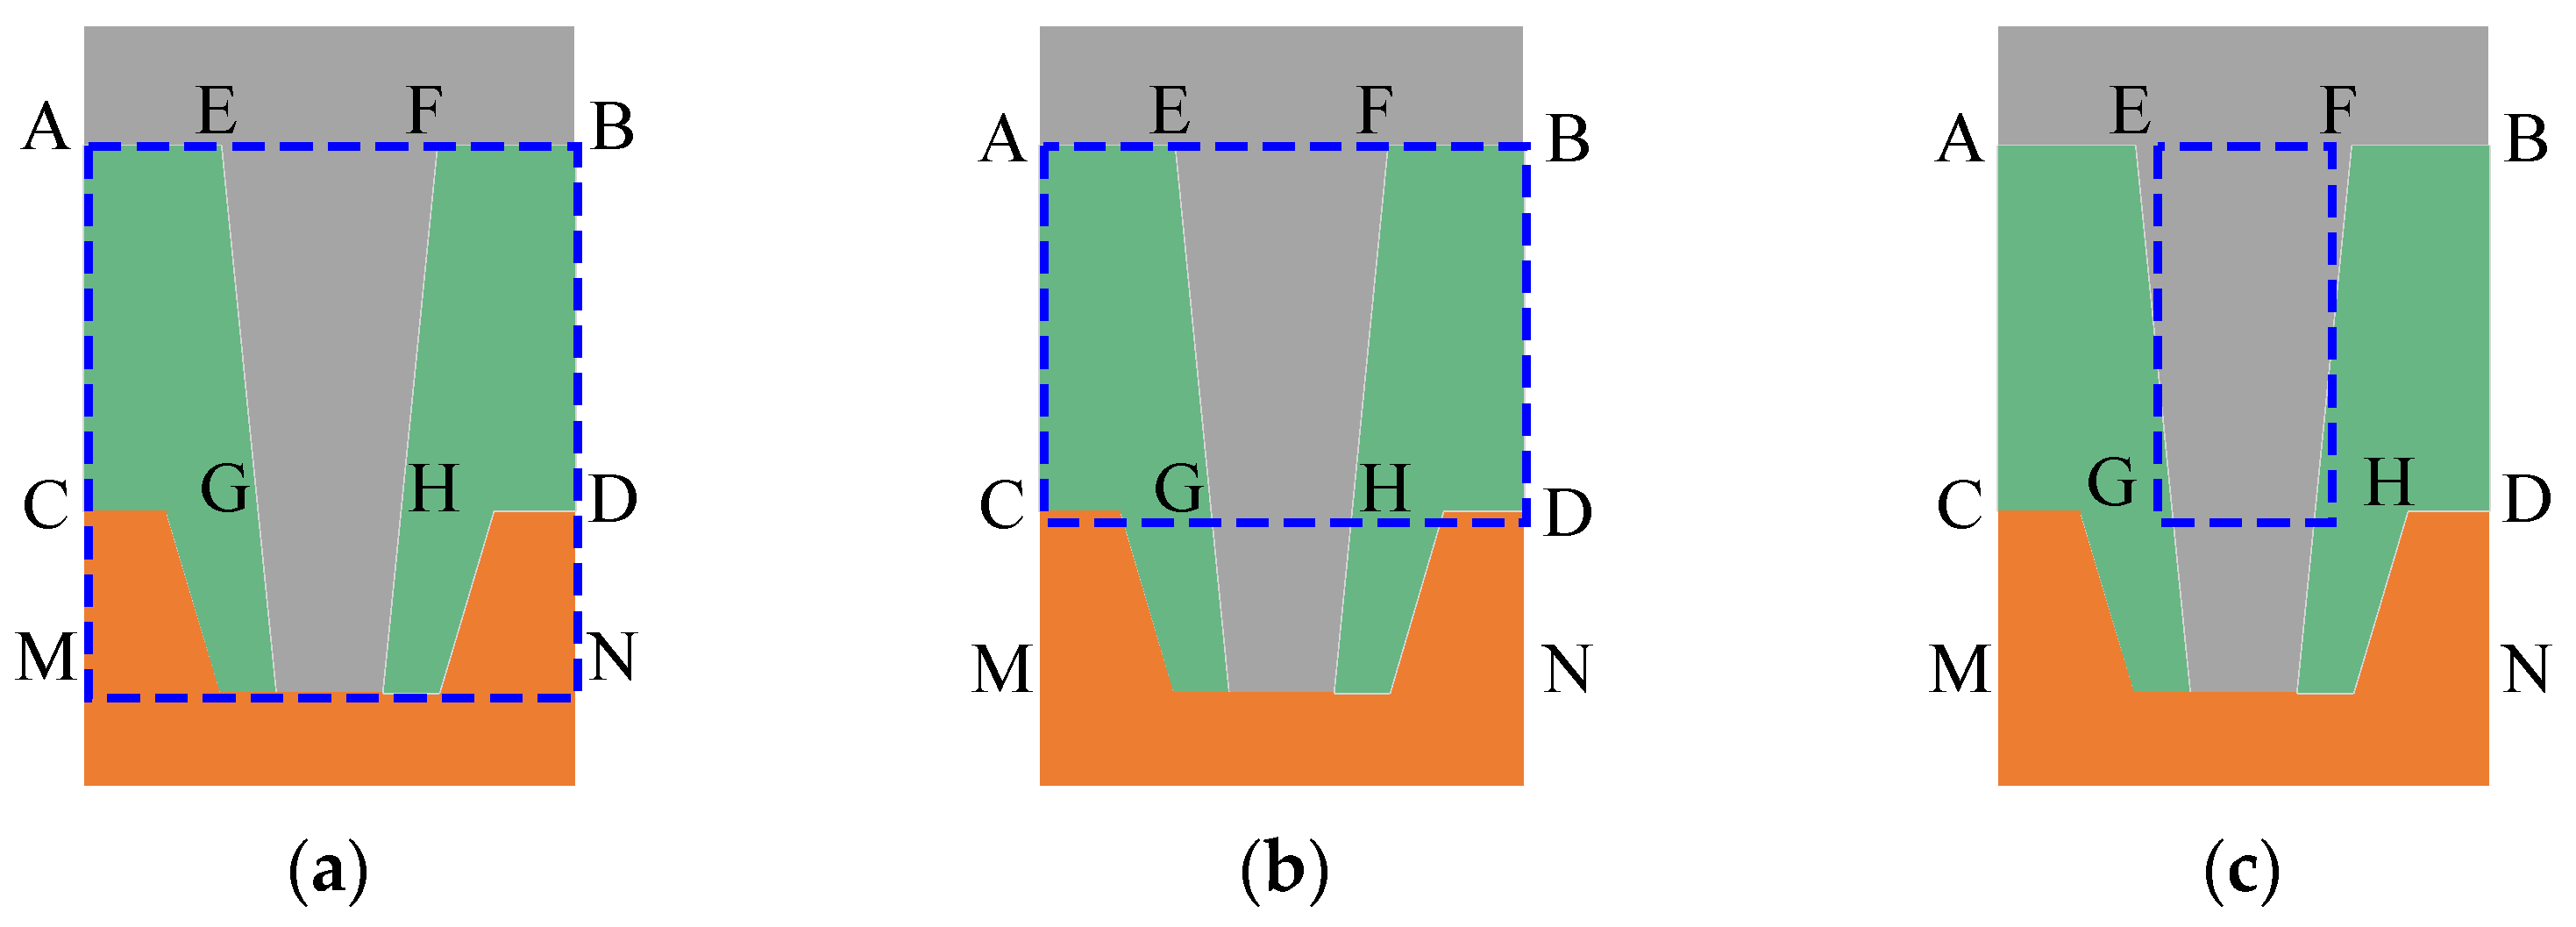
6.1. The Size of the Core Region of the Joint

The size of the core region of beam-column joints determines the calculation range of the shear deformation. Therefore, a reasonable size of the core region significantly affects the accuracy of the shear deformation calculation of the joint. The core region typically refers to the overlap region of beams and columns in cast-in-place frame structures or common assembled monolithic structures. However, for some unique connections in the assembled structure, like dry connections, it is necessary to determine the core region based on joint deformation.
Figure 10 shows the local cross-section of the core region of the joint. For the internal joint proposed in this paper, the types of the core region of the joint can be categorized into three cases based on the composition and distribution of each prefabricated component. (1) Both the frame beam and the lower column cup are considered a part of the core region of the joint, and the width or thickness of the core region is taken as the width of the beam, as illustrated in Figure 10a; (2) Only the height of the frame beam is counted into the height of the core region of the joint, and the width or thickness of the core region is taken as the beam’s width (Figure 10b; (3) Considering the composition of each component in the joint, the misalignment slip deformation between prefabricated components cannot be neglected in the overall deformation of the joint. Therefore, only the tenon of the upper column in the height range of the frame beam is counted into the height of the core region of the joint, and the width or thickness of the core region is taken as the width of the tenon of the upper column (Figure 10c).
Figure 11 shows the deformation of the core region of the internal joint based on the refined numerical analysis model. Based on Figure 12, the deformation of the core region of the internal joint primarily comprises the shear and bending deformation of the upper column tenon and connection region of the frame beam slab and the local compression and bending deformation of the lower column cup.
Based on whether the cup height of the lower column is included in the range of the core region of the joint, the core region of the joint can be categorized into two categories. In the first category, the core region of the joint does not include the cup height of the lower column. Figure 11c shows the calculation sketch illustrating the corresponding shear deformation. In the second category, the lower column cup height is included in the core region of the joint. Figure 11d depicts the calculation sketch, demonstrating its shear deformation. According to Figure 11c, the displacements of the left and right beams and the upper columns caused by the shear deformation of the core region can be accurately characterized when only the height of the corresponding beam is included in the range of the core region. However, there is some error in expressing the displacement of the lower columns caused by the shear deformation of the core region, which is primarily attributed to the neglect of the deformation caused by the top cup of the lower columns.
Figure 11d depicts that if the top cup of the lower column is included in the height range of the core region, the displacement of the upper and lower columns caused by the shear deformation of the core region can be characterized more accurately, and the displacement errors of the left and right beams caused by the shear deformation of the core region are significant. In the case of the distribution form of the core region of the joint (Figure 10c), it may accurately express the deformation of the left and right beams and the deformation of the upper and lower columns caused by the shear deformation of the core region of the joint. However, the calculation of the moment-angle relationship of the beam end to the core region is more complicated and is not considered in this paper.
Comprehensively analyzing the above, the top cup of the lower column is not included in the calculation height of the core region of the joint, and the displacement calculation error of the lower column caused by shear deformation is ignored. The schematic diagrams illustrating the core region before and after deformation are presented in Figure 10b and Figure 11c, respectively.

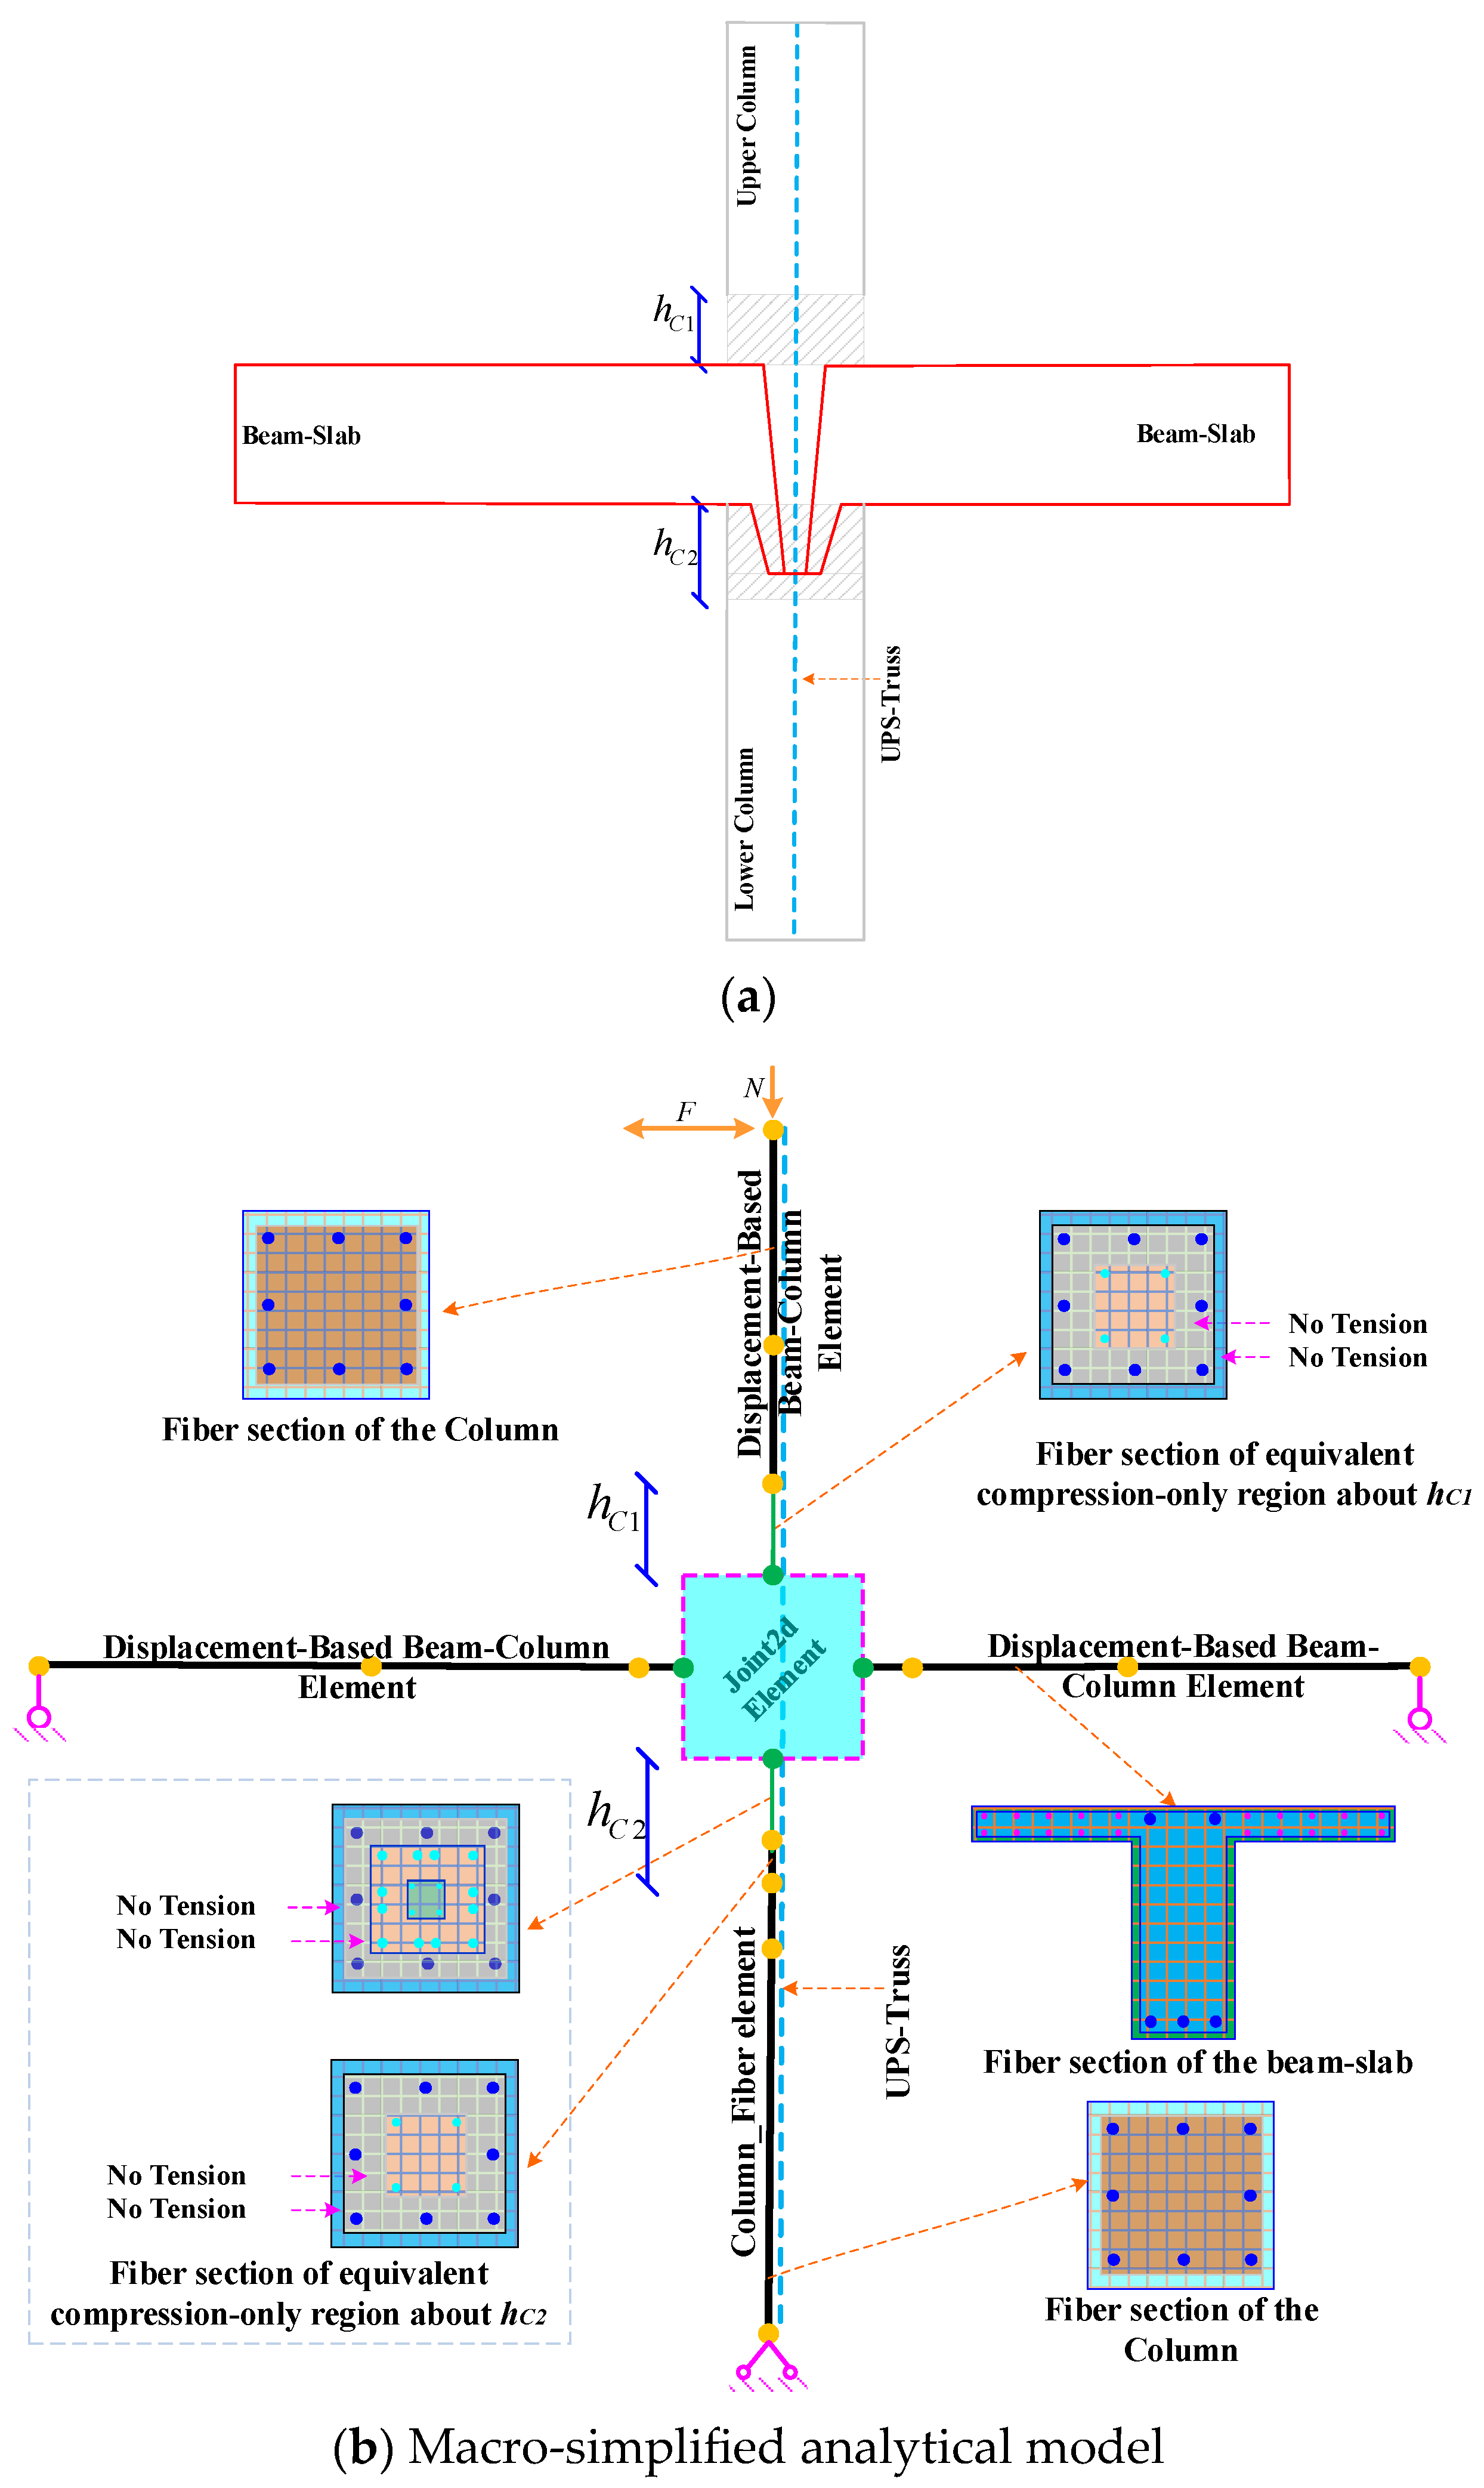
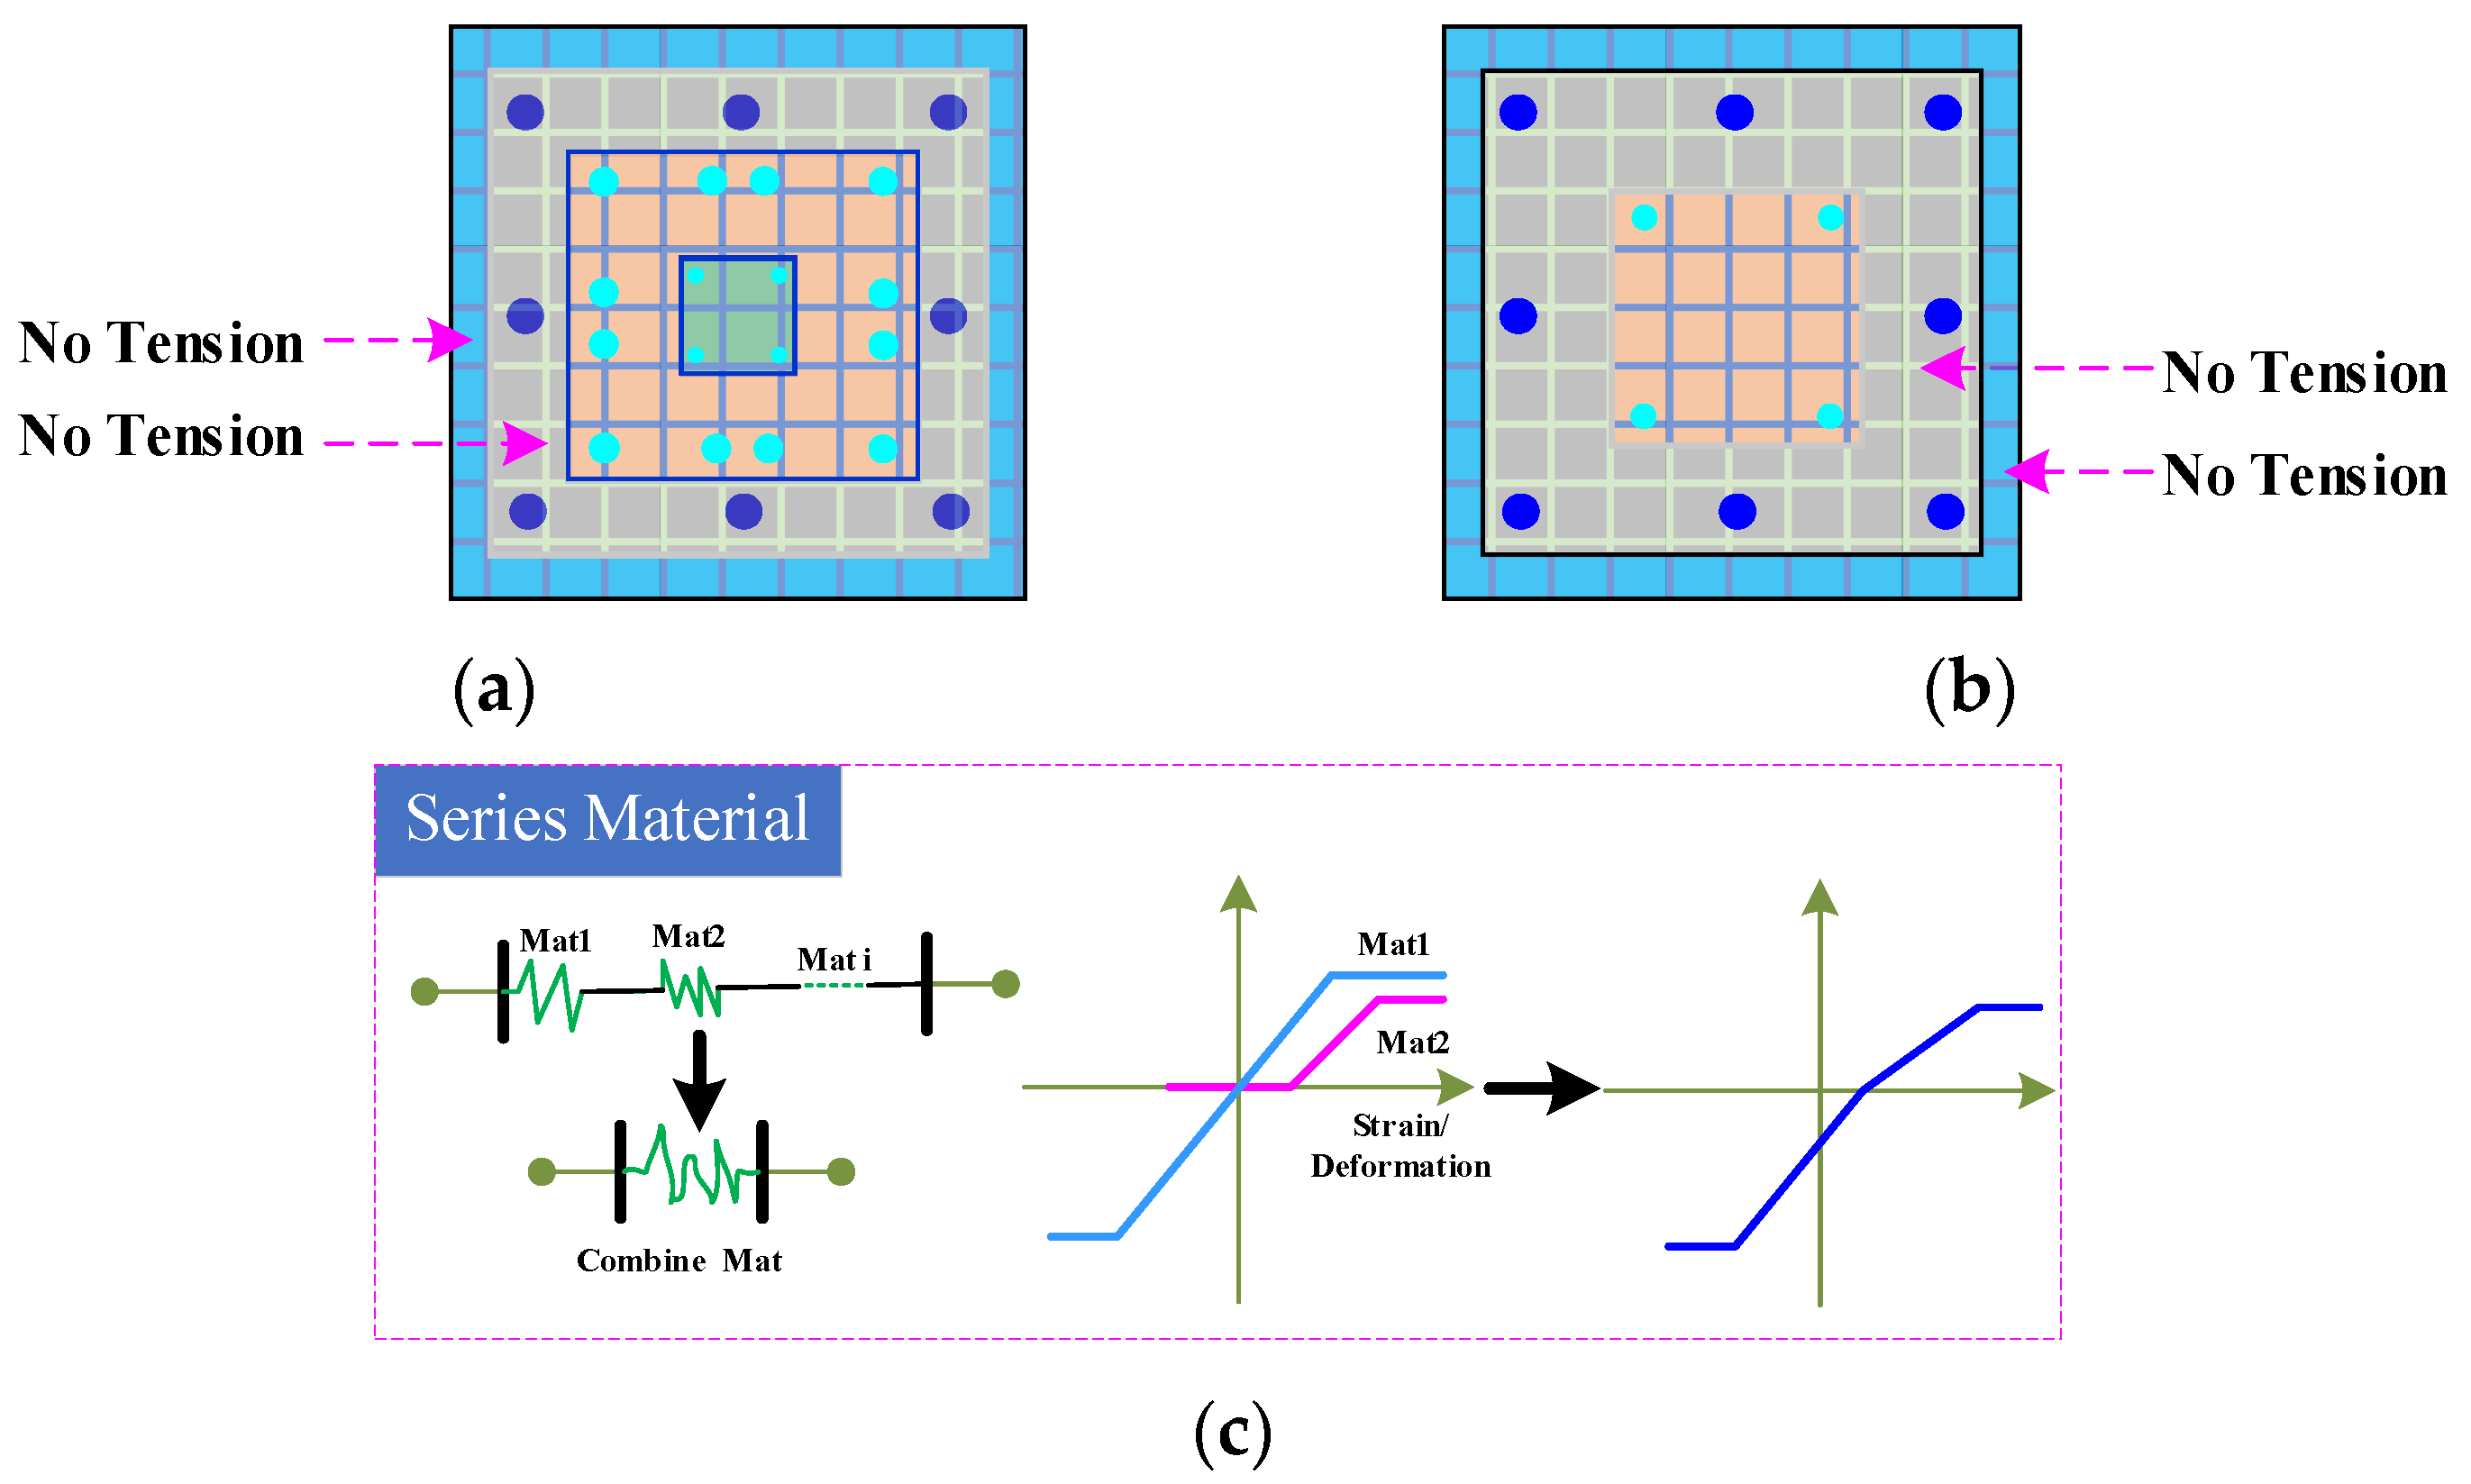
6.2. Macro-Simplified Analytical Model

The refined numerical analysis model is a method used to systematically examine the joints or local configurations of assembled frame structures, which can obtain detailed information such as stress changes in various locations. However, the refined numerical analysis model becomes impractical due to the complexity of modeling and computational efficiency requirements for analyzing the overall structure. In practical engineering design, the simplified analysis model is commonly applied for analyzing the overall structure. Therefore, this paper proposes a simplified analysis model for the internal joint based on the refined numerical analysis model. This enables the analysis of the entire assembled structure in the future. The simplified analytical model of the joints proposed in this paper primarily comprises columns, beams, upper columns with the equivalent compression-only region, lower columns in the equivalent compression-only region, shear plates in the core region of the joint, and the UPS (Figure 12).
Due to the presence of tenons and interfaces between the bottom of the upper frame columns and the top of the beam end, these interfaces are separated after experiencing tension. Consequently, within a specific range of heights, there is an absence of tension observed in the concrete and steel reinforcement located in the part region of the section at the bottom of the upper columns.
Similar to the lower region of the upper columns, a mortise-tenon connection is created between the combined tenon and the lower column cup. This combined tenon comprises the tenon of the upper column and the beam. Within a specific range of heights, there is also an absence of tension observed in the concrete and steel reinforcement located in the part region of the section at the top of the lower columns.
In this paper, this region exhibiting solely compression characteristics is called the equivalent compression-only region. The equivalent compression-only height of the upper column is defined as hC1, and that of the lower column is defined as hC2, respectively. Based on the refined numerical modeling results, it is evident that various factors, including the size and reinforcement of the cross-section size, influence the distribution height of the equivalent compression-only region. Furthermore, these distribution heights exhibit slight variations in different stress stages. To simplify the analysis, this study only considers the effect of the column cross-section width size hb on the distribution height of the equivalent compression-only region, hC1 is taken as 0.5 hb, hC2 is taken as hbk + 0.25 hb, where hbk is the height of the cup at the top of the lower column.

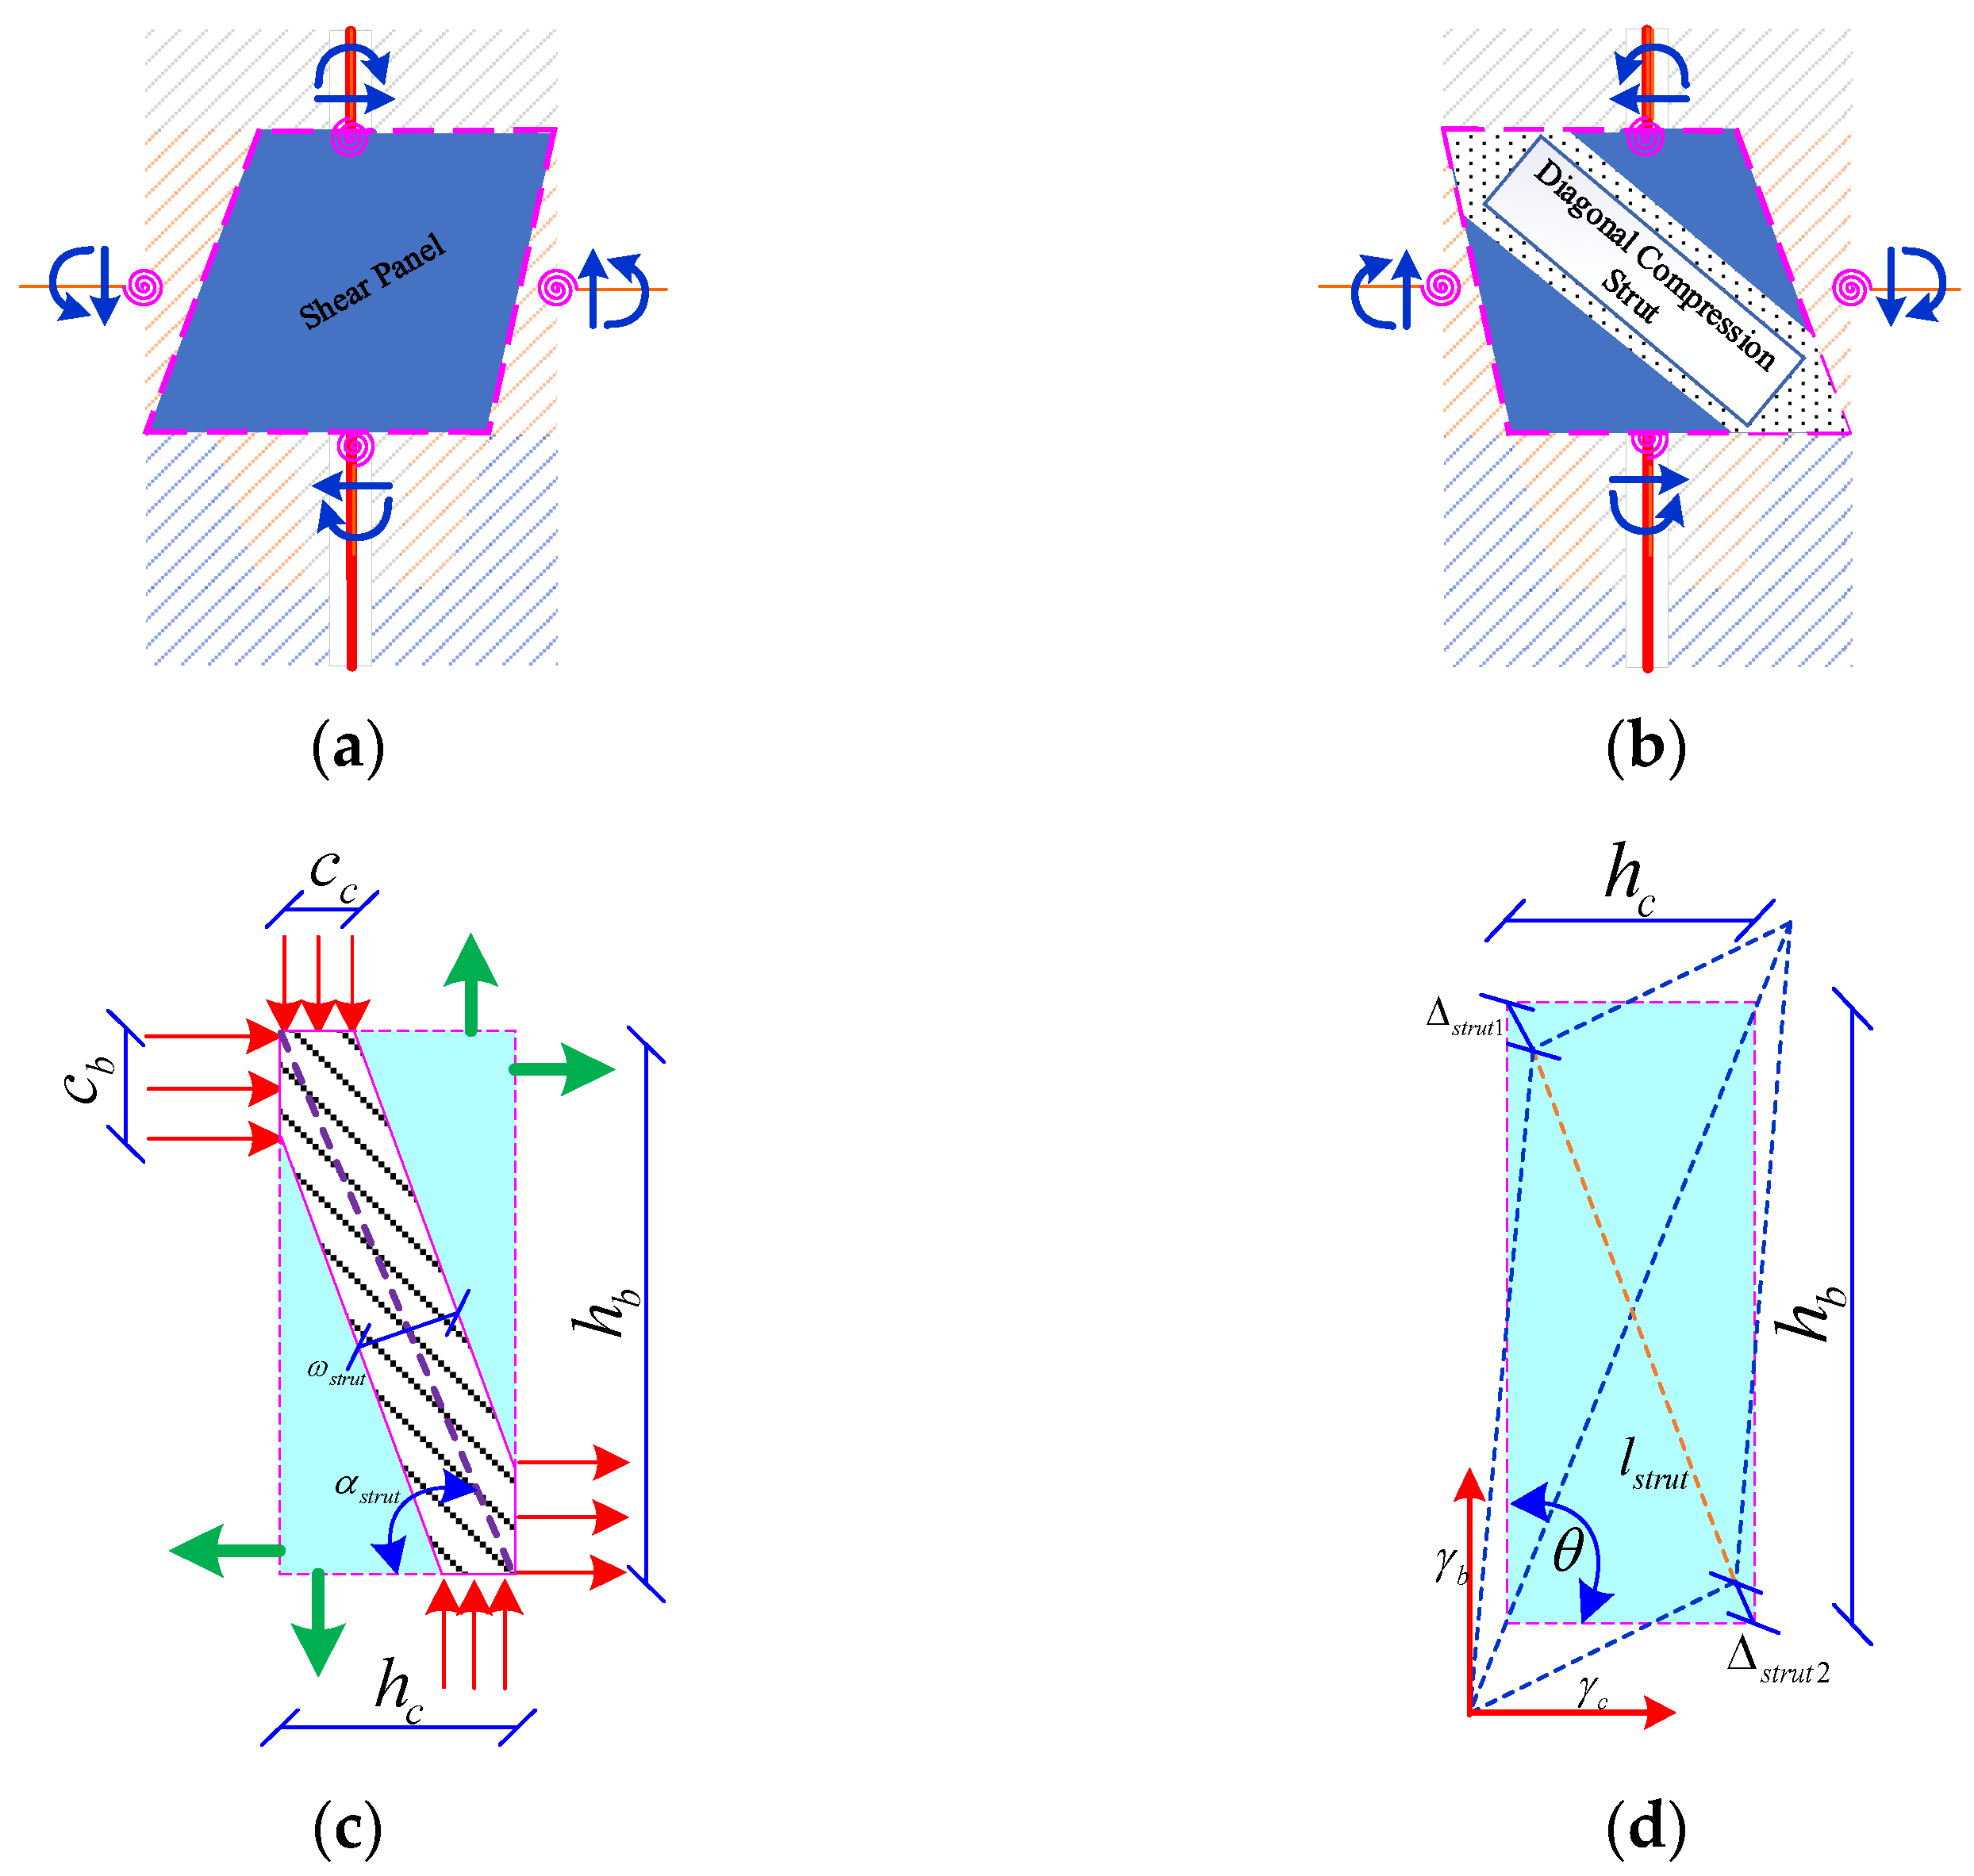
6.3. The Size of the Diagonal Compression Strut

The dimensions of the core region of the joint determined are illustrated in Figure 10b, as derived from Section 5.1. The sizes of the shear block in the core region are taken as the height of the beam slabs, the section height of the column, and the section width of the beam in the height, width, and thickness directions, respectively. Based on the refined numerical analysis results, due to the separation of the interfaces between the top and bottom of the shear blocks in the core region, the actual dimension of the core region in this paper is smaller than that of the corresponding dimensions of the cast-in-place structure.
Because the skeleton curve of the shear block in the core region can usually be calculated using the model of the diagonal compression strut [48]. In the calculation using the diagonal compression strut model, the first step is to determine the dimensions of the diagonal compression strut, which correspond to the height of the compression region of the components around the core region of the joint, respectively. The dimensions of the existing diagonal compression strut model are usually taken as a proportion of the section heights of the columns and beams [49,50,51,52,53].
Due to the presence of the connection interface, the actual size of the core region of the joint in this paper must subtract the corresponding region where the tension characteristics are not present under the horizontal loading conditions within the width of the interface connection region at the bottom of the upper column and the top of the lower column from the ideal size of the core region, as shown in Figure 13a,b.
If the size of the shear block is determined, then the size of the diagonal compression strut can be further determined. For simplicity of calculation, in this paper, the vertical height of the diagonal compression strut is converted from an oblique to an orthogonal form to the horizontal dimensions of the diagonal compression strut (Figure 13c). The dimensions cb and cc of the diagonal compression strut are adopted in the form of the formulas suggested by Hwang [49,50]. The dimensions are corrected based on the results of the refined numerical analysis model. The final formulas for the diagonal compression strut of the combined joint proposed in this paper are shown in Equations (1) and (2):
w s t r u t = c b 2 + c c 2
c c = ( 0.25 + 0.85 N A g f c ) h c ,   c b = h b 3

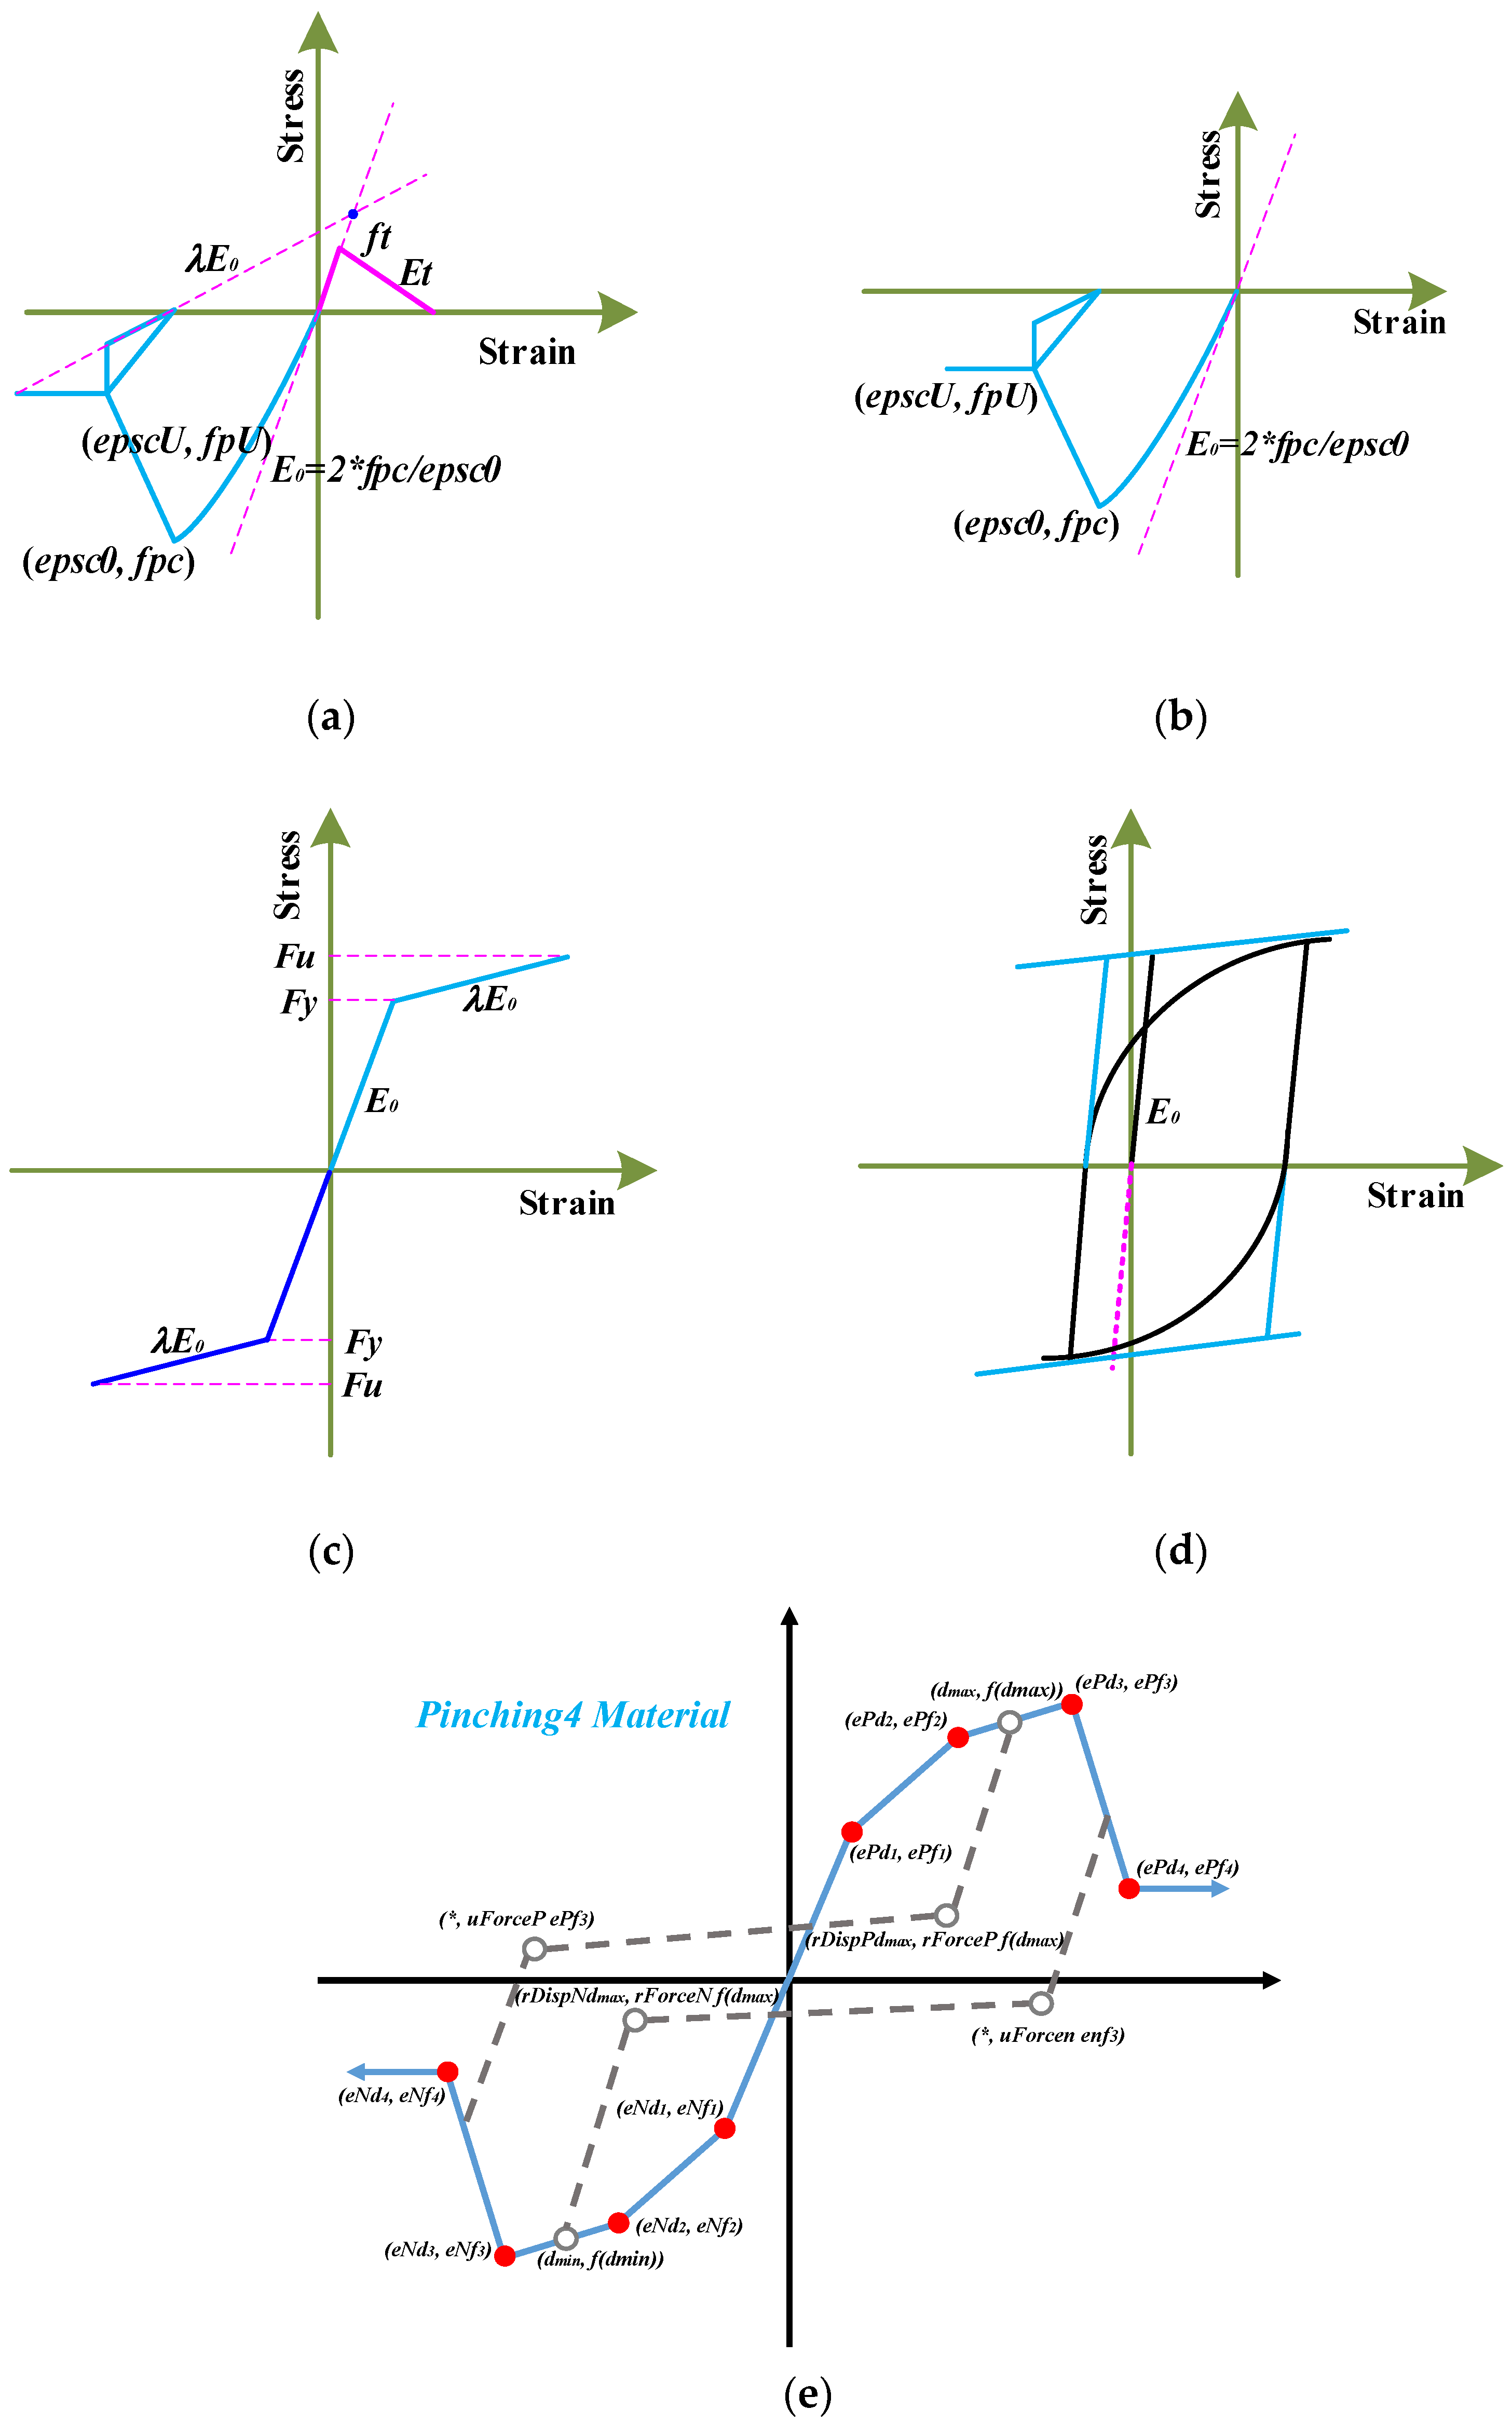
6.4. The Skeleton Curve of the Shear Block in the Core Region

According to the suggestion provided by Mitra [54], the primary procedure for calculating the stress–strain relationship of the shear in the core region using the diagonal compression strut model is described as follows: (1) Determine the dimensions of the core region of the joint and the dimensions of the diagonal compression strut; (2) Calculate the shear stress; (3) Determine the concrete constitutive model in the corresponding region of the diagonal compression strut model; (4) Calculate the shear strain. The dimensions of the core region of the joints and the dimensions of the diagonal compression strut are provided in Section 6.2 and Section 6.3, respectively. The diagonal compression strut model assumes that the shear stresses on the shear block of the core region are uniformly distributed, and these stresses are only transferred via the diagonal compression strut mechanism. Equation (3) can be used to compute the shear stresses within the shear block in accordance with the equilibrium condition:.
τ = f c , s t r u t A s t r u t cos α s t r u t h c b j = f c , s t r u t ω s t r u t cos α s t r u t h c
The concrete within the region of the diagonal compression strut in the core region of the joint follows the Mander constrained concrete model as follows:
f c , s t r u t f c , M a n d e r = 3.62 ε t ε c c 2 2.82 ε t ε c c + 1       ( ε t ε c c < 0.39 ) 0.45       ( ε t ε c c 0.39 )
Based on the deformation of the shear block in the core region under shear-only conditions, the normal strain of the shear block is ignored. Combined with the mechanics of materials, it is known that the compressive strain εstrut of the diagonal compression strut is equal to its principal tensile strain εt. From Figure 13c, based on the cosine rule, the shear deformation of the shear block fulfills the geometric deformation Equation (5):
l s t r u t 2 = h c 2 + h b 2 2 h c h b cos θ
When the core region of the joint produces a slight deformation, the elongation or compression of the diagonal compression strut is εstrut, γ is the shear strain of the shear block body. Differentiating Equation (5) yields Equation (6):
2 l s t r u t d ( l s t r u t ) = 2 h c d h c + 2 h b d h b + 2 h c h b sin θ d θ
In Equation (6), d(lstrut) = εstrut, dθ = γ, sinθ = 1. Because hc and hb are constants for the determined core region of the joint, dhc = dhb = 0. As a result, Equation (6) simplifies to Equation (7):
l s t r u t Δ strut = h c h b γ
Furthermore, according to geometric relationships, Equation (8) can be determined as follows:
sin α s t r u t = h b / l s t r u t ,   cos α s t r u t = h c / l s t r u t
Equation (9) is used to calculate the compressive strain of the diagonal compression strut:
ε s t r u t = Δ s t r u t / l s t r u t = w h γ l s t r u t 2 = l s t r u t cos α s t u r t l s t r u t sin α s t u r t γ l s t r u t 2 = γ sin α s t r u t cos α s t r u t
Next, the formula for shear strain calculation in the core region of the joint, expressed as Equation (10):
γ = ε s t r u t sin α s t r u t cos α s t r u t
Based on the determined dimensions of the core region, the grade of the concrete, and the degree of constraint of the diagonal compression strut, the characteristic points of the shear stress–strain skeleton curves of the shear block in the core region are calculated according to Equations (3)–(10). After obtaining the shear stress-shear strain skeleton curve of the shear block within the core region, it is further transformed into the skeleton curve representing the bending moment–angle relationship of the shear block based on the dimensions of the shear block.

6.5. Materials and Elements of the Macro-Simplified Analytical Model

Because the upper column tenon has extended into the interior of the core region and the upper column is a monolithic member with its tenon, the upper column can be viewed as fixed to the top of the shear plate. Similarly, the combined tenon comprising the lower column tenon and the beam slab tenon can be considered a unified region fixed to the bottom of the shear plate. The distribution height of the equivalent compression-only region existed at both the top of the upper column and the bottom of the lower column, denoted as hC1 and hC2, respectively. Figure 14a,b show the fiber sections of the equivalent compression-only region.
Within the equivalent compression-only zones hC1 and hC2, the steel reinforcement materials are connected in series with elastic no tension (ENT) materials, which have higher stiffness (elastic modulus set to a larger value) (Figure 14c). This configuration simulates the absence of tension properties in the steel reinforcement materials within these zones. The Concrete01 model is selected for the concrete materials within the fiber sections of this height, which does not consider the tensile behavior of concrete.
For the concrete materials in other parts of the model, such as the columns and beams, the Concrete02 model, which considers the tensile plastic behavior of concrete, is selected (Figure 15a). For the concrete cover, the Concrete01 model is selected, which does not consider the tensile behavior of concrete (Figure 15b).
The Steel02 model is selected for both ordinary steel reinforcement and the UPS (Figure 15c,d). The initial prestress of the UPS is set through the “$igInit” parameter. The Pinching4 material model is selected for the core region of the joint [54] (Figure 15e). The parameters related to the hysteresis behavior in the Pinching4 material model are detailed in Section 6.
The Joint2d element is used to simulate the core region of the joint in OpenSees 3.5.0. The displacement-based nonlinear beam-column elements are used to simulate the frame beams and columns, with ten integration points set along the length of each element.
The UPS is simulated using the corotational truss element, which is more suitable for considering geometric nonlinearity than the ordinary truss element. In actual loading conditions, the UPS can only endure tension and cannot withstand compression. The Steel02 material and the Elastic-PP-Gap material are connected in series, with the elastic modulus of the Elastic-PP-Gap material set to a large value.
The nodes of the UPS truss element and the frame column element are constrained using the “EqualDOF” constraint. The constraints along the vertical direction between the nodes are released, allowing for relative free deformation in the vertical direction while enabling coordination between the UPS and the surrounding concrete in the horizontal direction. The ends of the UPS are connected to the ends of the columns using “Rigid beams” to achieve anchorage of the UPS with the frame columns.

7. Hysteresis Parameter Identification

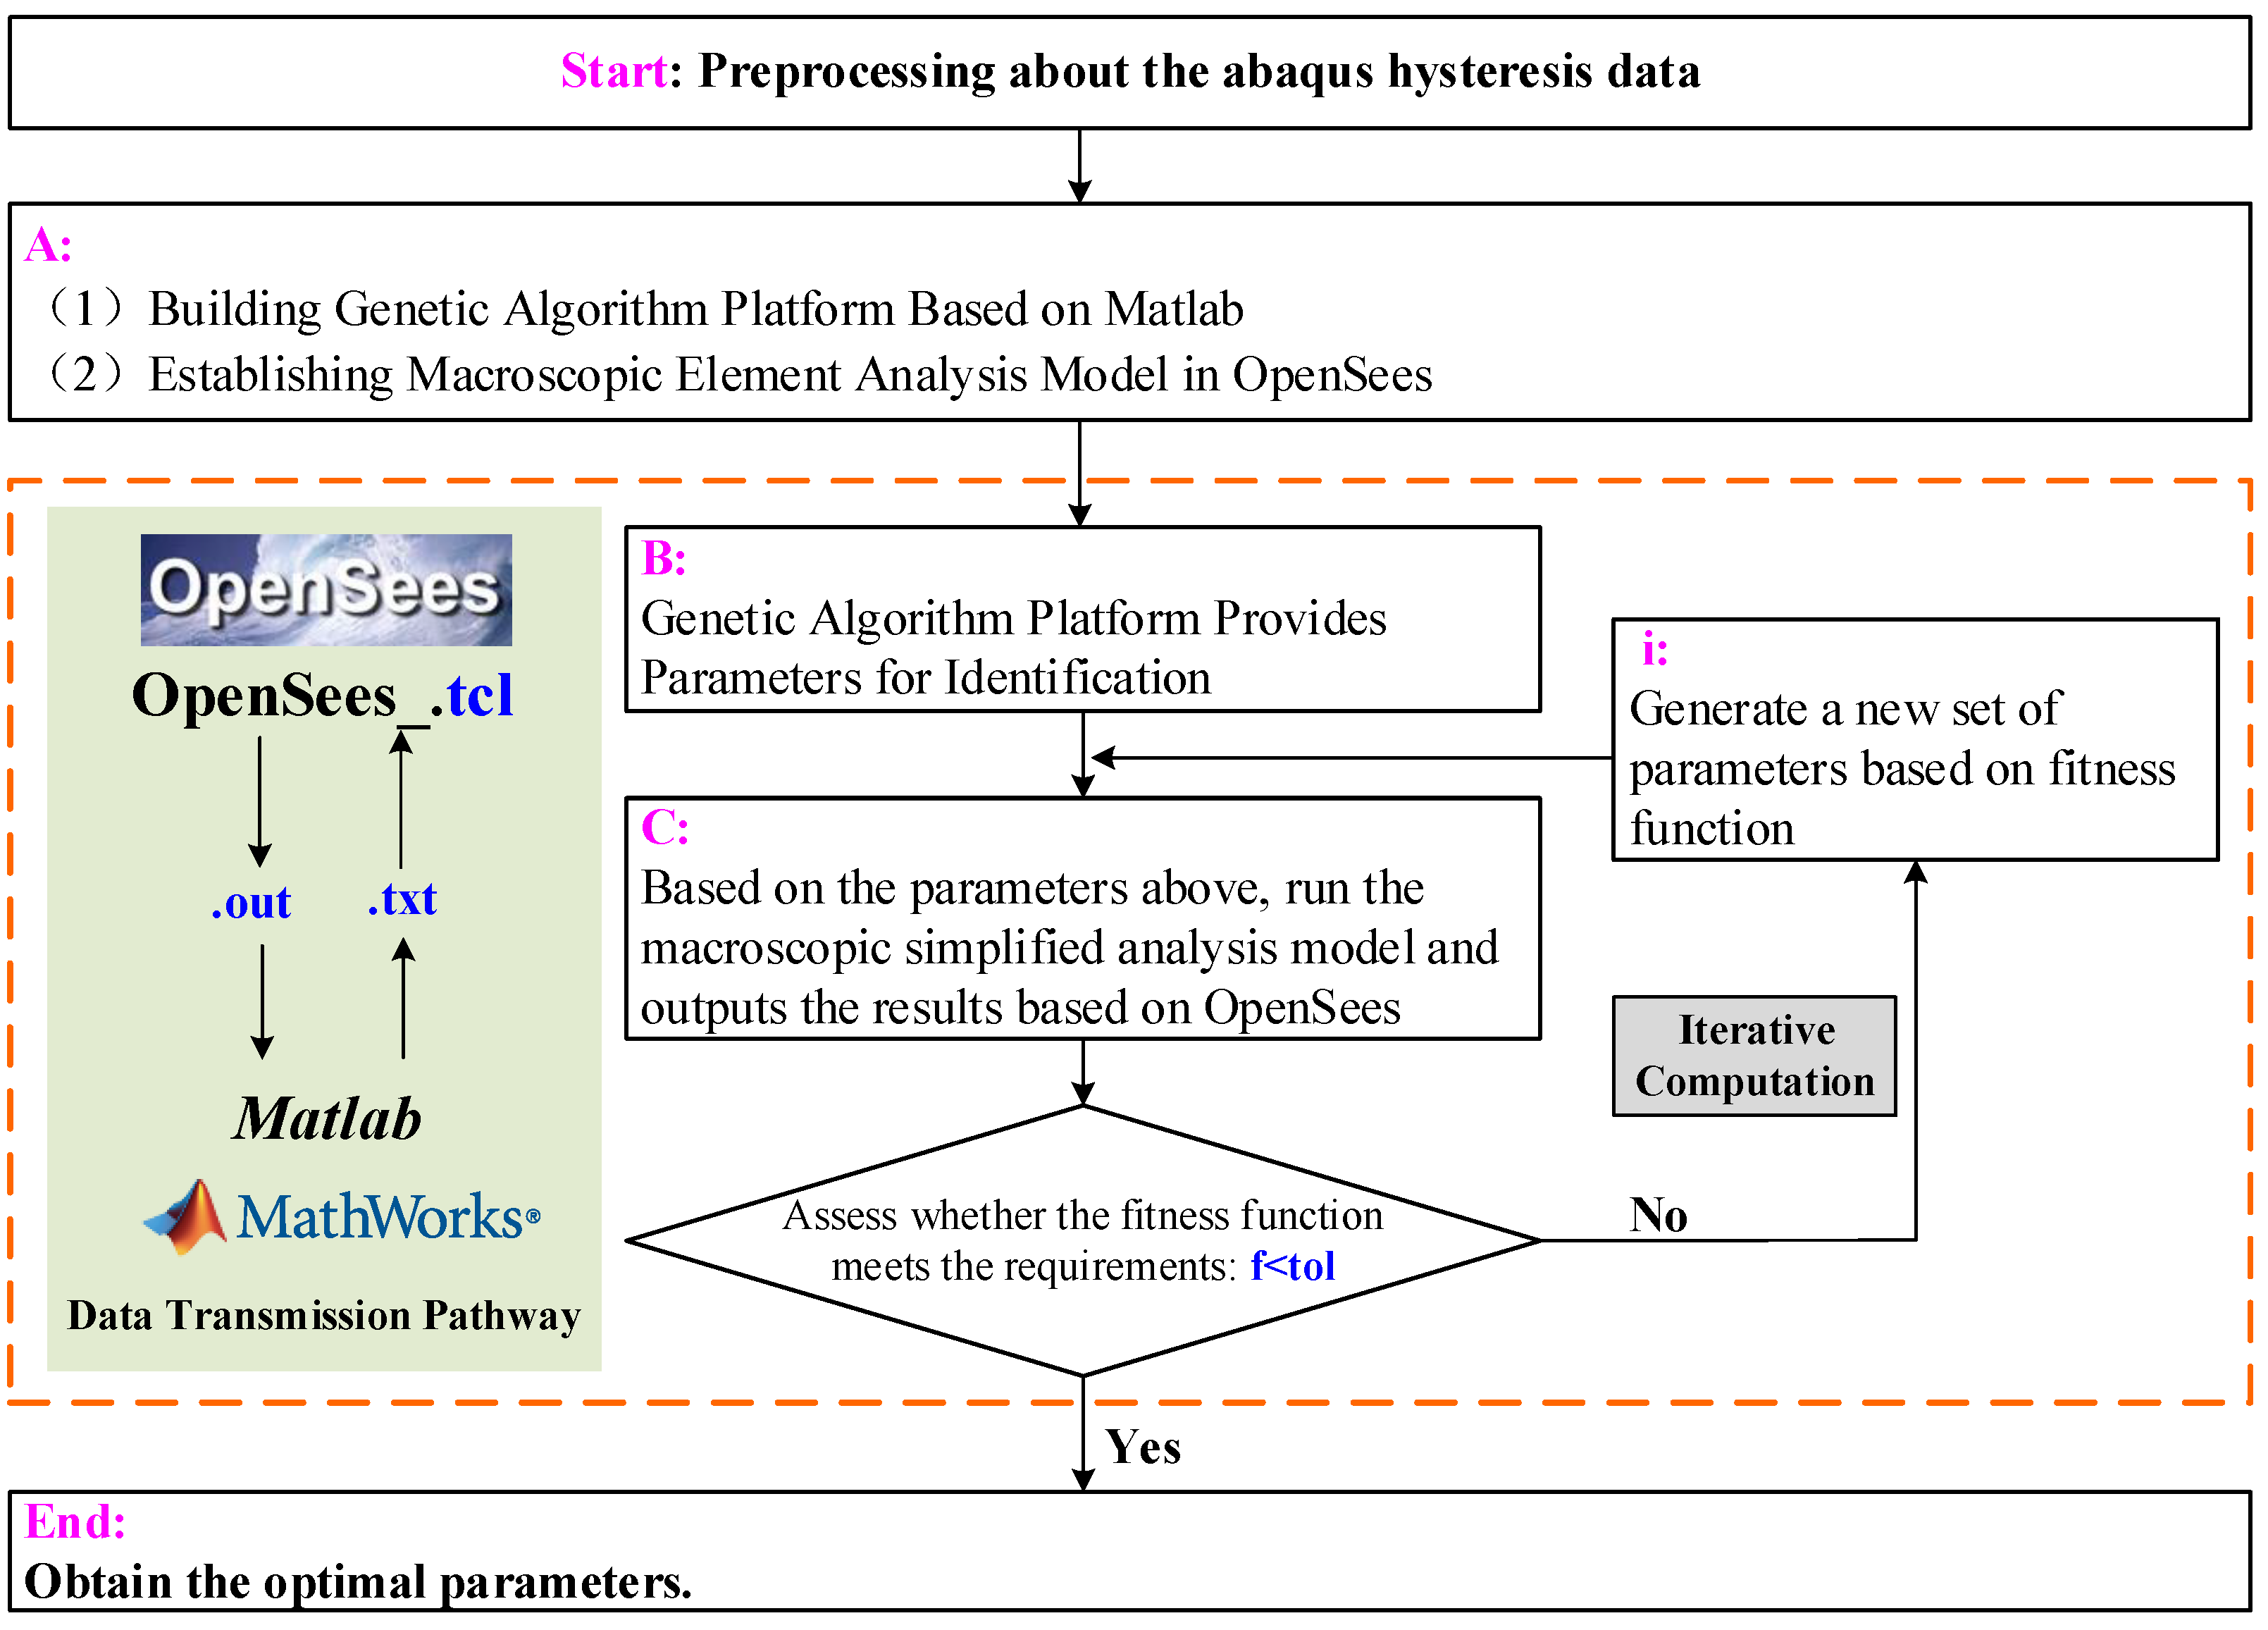
7.1. Introduction to Parameter Identification

In simulating the hysteresis performance of various structures or components using existing generalized material constitutive models, it is often necessary to set the appropriate parameters. Indeed, the setting of the parameters significantly affects the accuracy of the numerical calculation results. It remains a challenging problem to solve in numerical computation.
In OpenSees, there are several generalized material models available for the core region of the joint, such as the Pinching4 material, Bouc-Wen Material, Pinching Hysteretic Bouc-Wen Material, Hysteretic Material, DowelType, Modified Ibarra-Medina-Krawinkler Deterioration Model with Pinched Hysteretic Response, SAWS Material and others [55].
These generalized material models typically consist of skeleton features and hysteresis rules, which commonly encompass stiffness degradation, strength degradation, and pinching effects. In various hysteresis rules, the control parameters are not singular, and most of them do not have clear physical meanings. At the same time, the parameters exhibit a strong correlation with each other. Due to the control function’s strong nonlinear characteristics, obtaining the relevant control parameters for hysteresis models has always been a significant obstacle.
In recent years, relevant scholars have researched the parameters of restoring force models, and various algorithms have been applied to identify these parameters [56,57]. According to the different types of algorithms, they can be divided into two categories: the first type is the traditional numerical algorithms, including least squares, extended Kalman filter, gradient descent, and others. The second type includes various intelligent algorithms, such as GAs, differential/differential evolution algorithms, simulated annealing algorithms, ant colony algorithms, particle swarm optimization algorithms, GSO algorithms, hybrid algorithms, and others. Various intelligent algorithms offer higher advantages in terms of computational accuracy and efficiency compared to traditional numerical algorithms. Among these, GAs are the most commonly utilized ones in various optimization problems [58,59,60]. The GA is a bio-inspired computational method that simulates the processes of genetic selection and natural evolution. It has advantages such as wide adaptability, good parallelism, and strong global optimization performance. The GA achieves iterative computation of the optimal population through operations such as selection, crossover, and mutation [61].
In the Joint2d element, Pinching4 material is commonly used to simulate the deformation characteristics of the shear plate in the core region with a one-dimensional load-deformation relationship. A generalized force-deformation relationship for the core region of the joint is established by defining skeleton curves, unloading and reloading paths, and damage rules. The skeleton curve of the Pinching4 material is defined by a four-segment line with eight characteristic points [55,62]. The damage rule for the Pinching4 material is based on the damage index proposed by Park and Ang in 1985 [63,64]. The formulas for calculating the damage index are shown in Equations (11)–(15):
δ K = K 1 ( d max ) K 3 + K 2 ( E i E m ) K 4 L i m i t
δ D = D 1 ( d max ) D 3 + D 2 ( E i E m ) D 4 L i m i t
δ F = F 1 ( d max ) F 3 + F 2 ( E i E m ) F 4 L i m i t
d max = max ( d max i d e f max , d min i d e f min )
E i = d E
δK, δD and δF represent the indexes for unloading stiffness degradation damage, reloading stiffness degradation parameters, and strength degradation parameters, respectively. Ki represents the process definition parameters for unloading stiffness degradation damage index, where K1 and K3 primarily define damage degradation caused by deformation, and K2 and K4 primarily define damage degradation related to energy dissipation. Similarly, Di and Fi are similar to Ki, representing the parameters for reloading stiffness degradation and strength degradation, respectively. defmax and defmin represent the failure deformation in positive and negative directions, respectively, during monotonic loading. dmaxi and dmini represent the maximum and minimum deformation for the current cycle, respectively. E represents the hysteresis energy, Em represents the energy dissipated until failure under monotonic loading, and Limit is the limit value for the damage index.
Furthermore, the coefficient for energy dissipation, denoted as gE, defines the maximum energy dissipation value under cyclic loading. The total energy dissipation capacity is defined as this coefficient multiplied by the dissipated energy under monotonic loading. The parameter DmgType is used to define the type of damage, with two options: “Cycle” and “Energy,” and “Energy” is selected in this paper.
Table 1 presents the parameters necessary for the Pinching4 material. The parameters for the skeleton curve can be computed according to Section 6.3. The coefficient for energy dissipation, denoted as gE, is set to 10, whereas $gKLim, $gDLim, and $gFLim are all set to 0.99. The remaining parameters for the Pinching4 material are determined using the GA.

7.2. Implementation Route for Parameter Identification by GA

Based on the implementation objectives of the GA in this paper, the fitness function is determined, as shown in Equation (16). According to Table 1, it is known that the total number of parameters to be identified for each joint is 15. Considering the effects of precision and computational efficiency in the GA, the population size is set to 80, and the number of iterations is set to 500. The upper and lower limits of the parameters are continuously narrowed down through identification, ultimately obtaining the optimal values for each parameter in the restoring force model:
F u n c t = F a b a F o p s M a x a b a M i n a b a
Faba, Fops, Maxaba, and Minaba represent the restoring force calculated by the refined numerical model, the restoring force calculated by the simplified analysis model, the maximum restoring force calculated by the refined numerical model, and the minimum restoring force calculated by the refined numerical model, respectively.
Based on the above analysis, MATLAB R2023a was used to build the GA platform, and the OpenSees program was run by MATLAB to establish the data communication between MATLAB and OpenSees to realize the iterative calculation based on the GA. Figure 16 depicts the technical route for identifying the GA parameter.

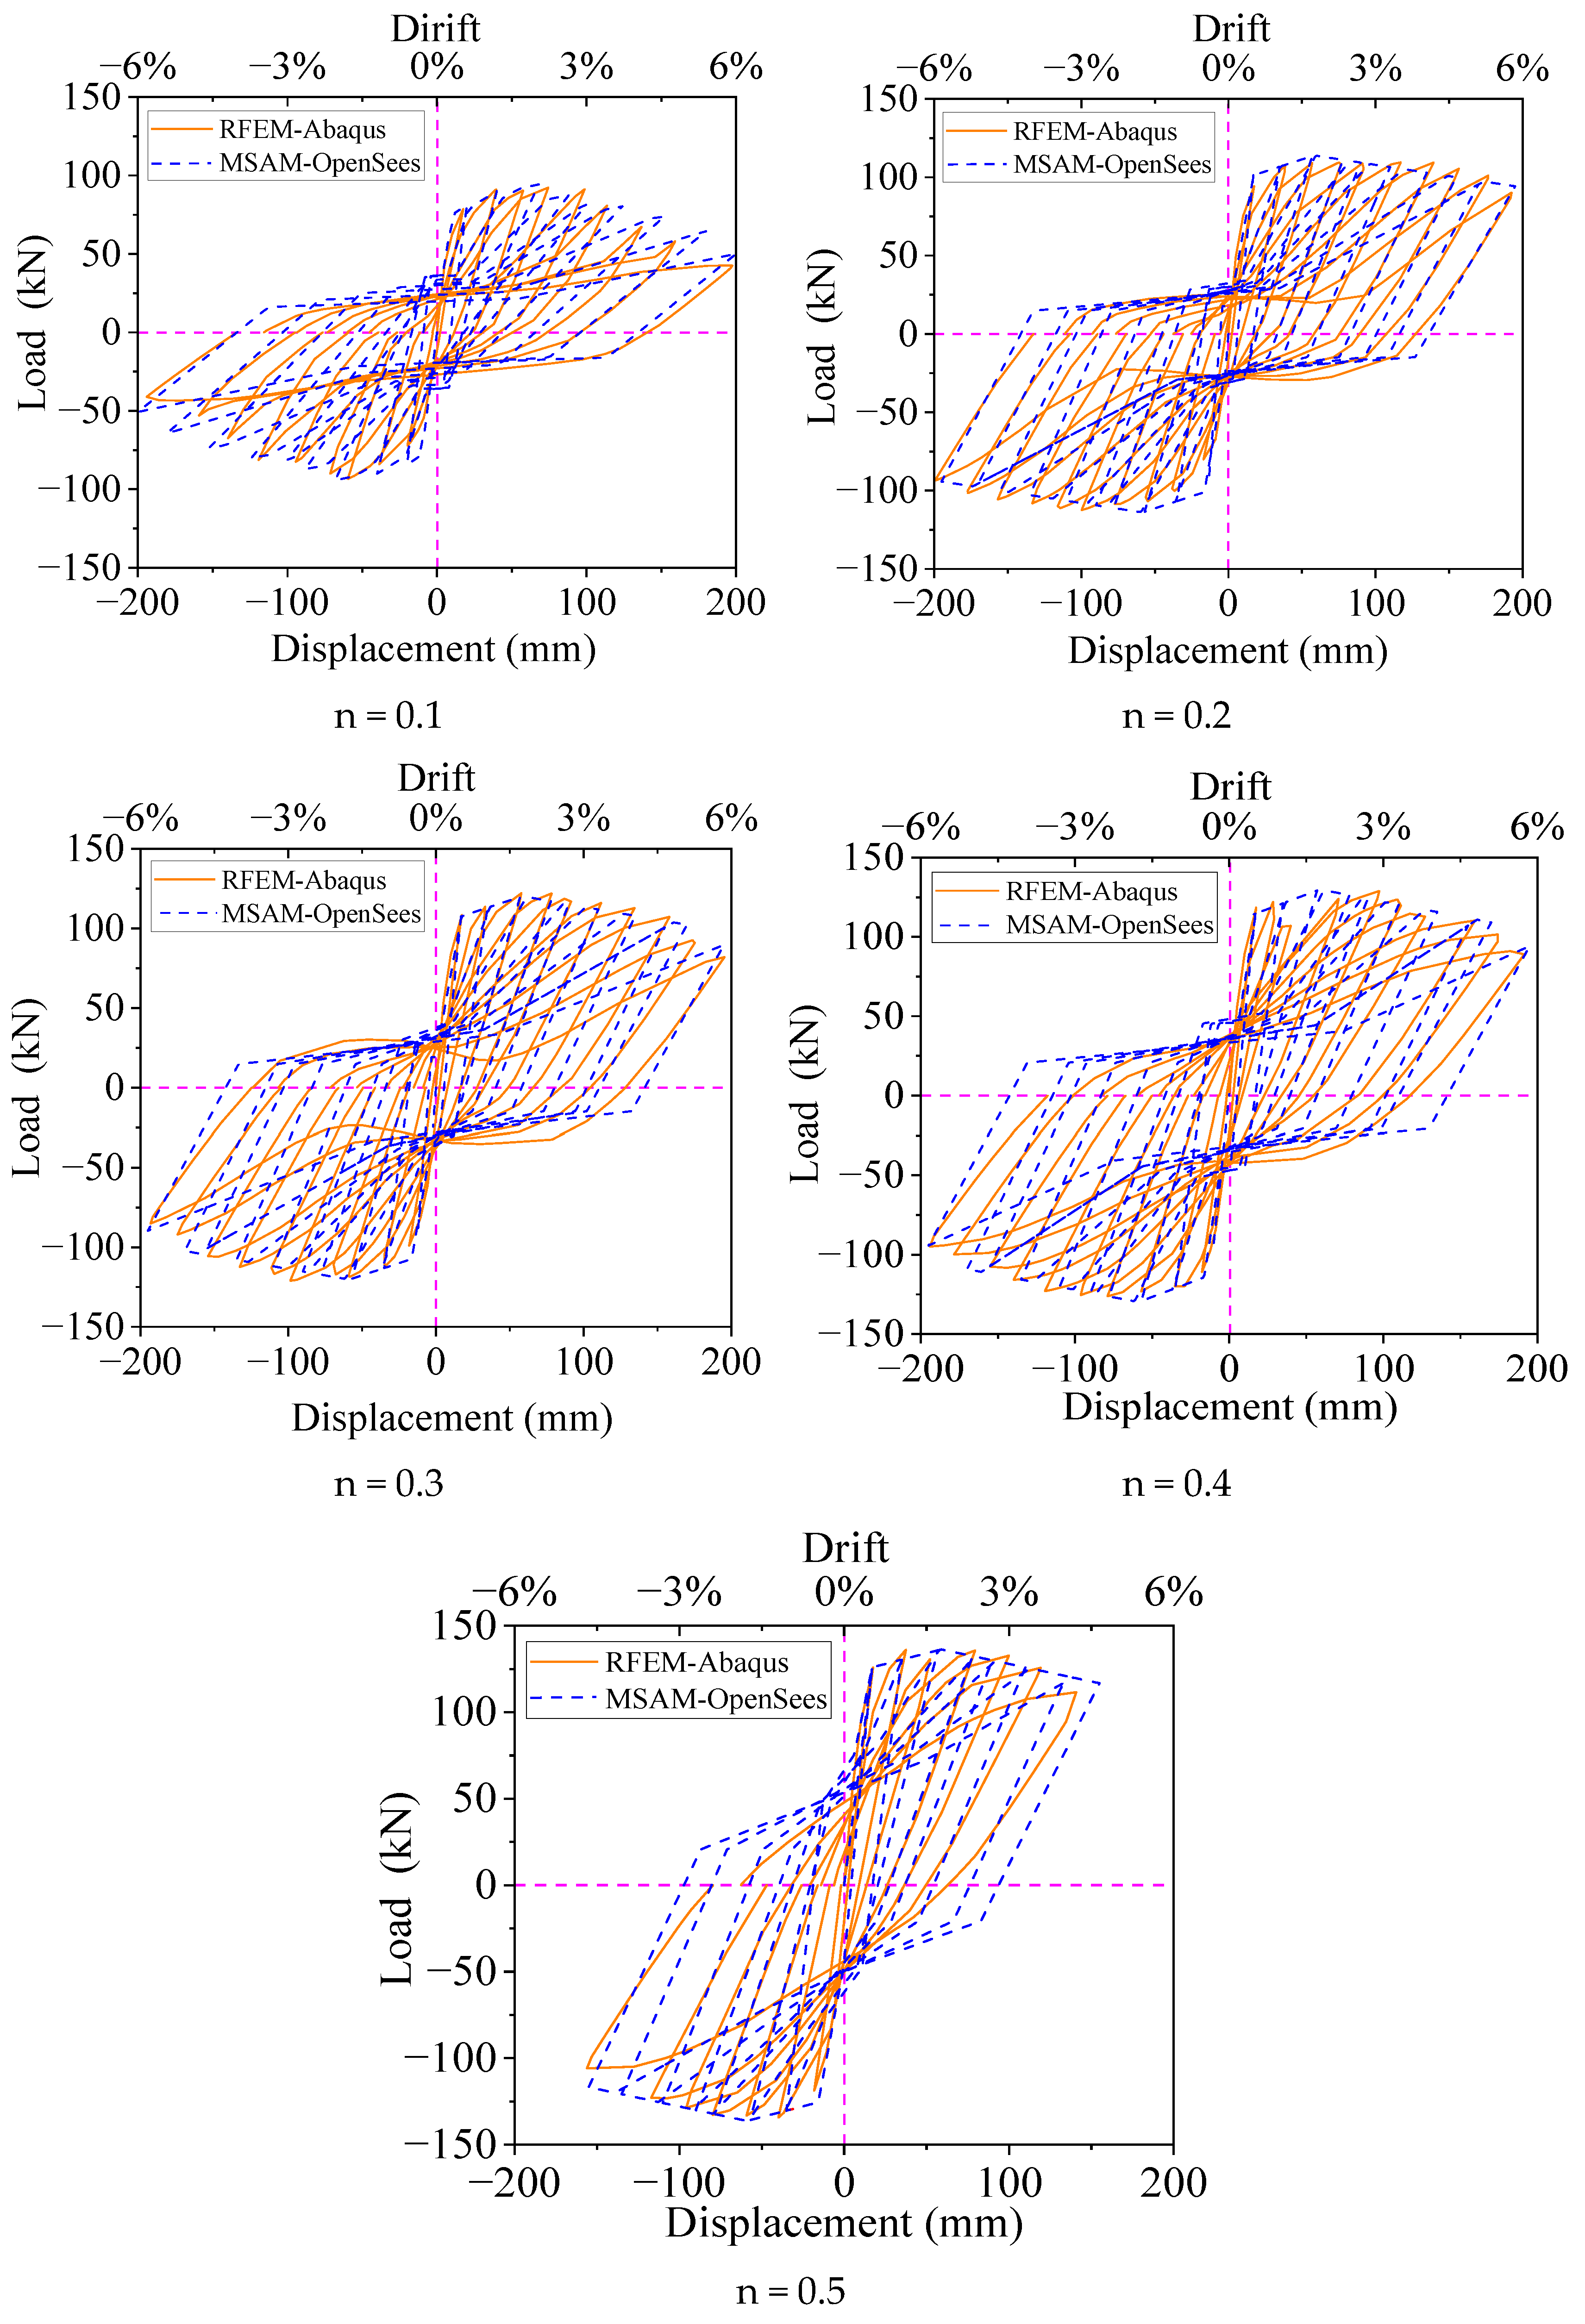
8. Validation of Macro-Simplified Analysis Models

Table 1 shows the shear stress–strain skeleton curve data calculated by the method in Section 6.4. Table 2 and Table 3 show the relevant parameters of the Pinching4 material identified based on the GA. Figure 17, Figure 18 and Figure 19 illustrate the comparison between the results obtained from the refined numerical analysis model and the simplified analysis model under the different parameters. RFEM-Abaqus represents the results calculated based on refined numerical analysis models using ABAQUS, and MSAM-OpenSees represents the results calculated based on macroscopic simplified analysis models using OpenSees. The relevant parameters in the restoring force model can be effectively determined by combining the theoretical analysis of the skeleton curves with parameter identification using GA techniques. The simplified analysis model proposed in this paper effectively captures the hysteresis behavior of the joints in the frame structure proposed herein.

9. Conclusions

This paper proposes a new type of assembled frame structure with the combination connection of the prestressed and mortise-tenon. The hysteresis performance, damage process, and damage mode of the internal joint under horizontal loads were analyzed based on the refined numerical analysis model. The simplified numerical analysis model is proposed, and a GA is used to identify some parameters to be determined in the simplified analysis model. The main conclusions are described as follows:
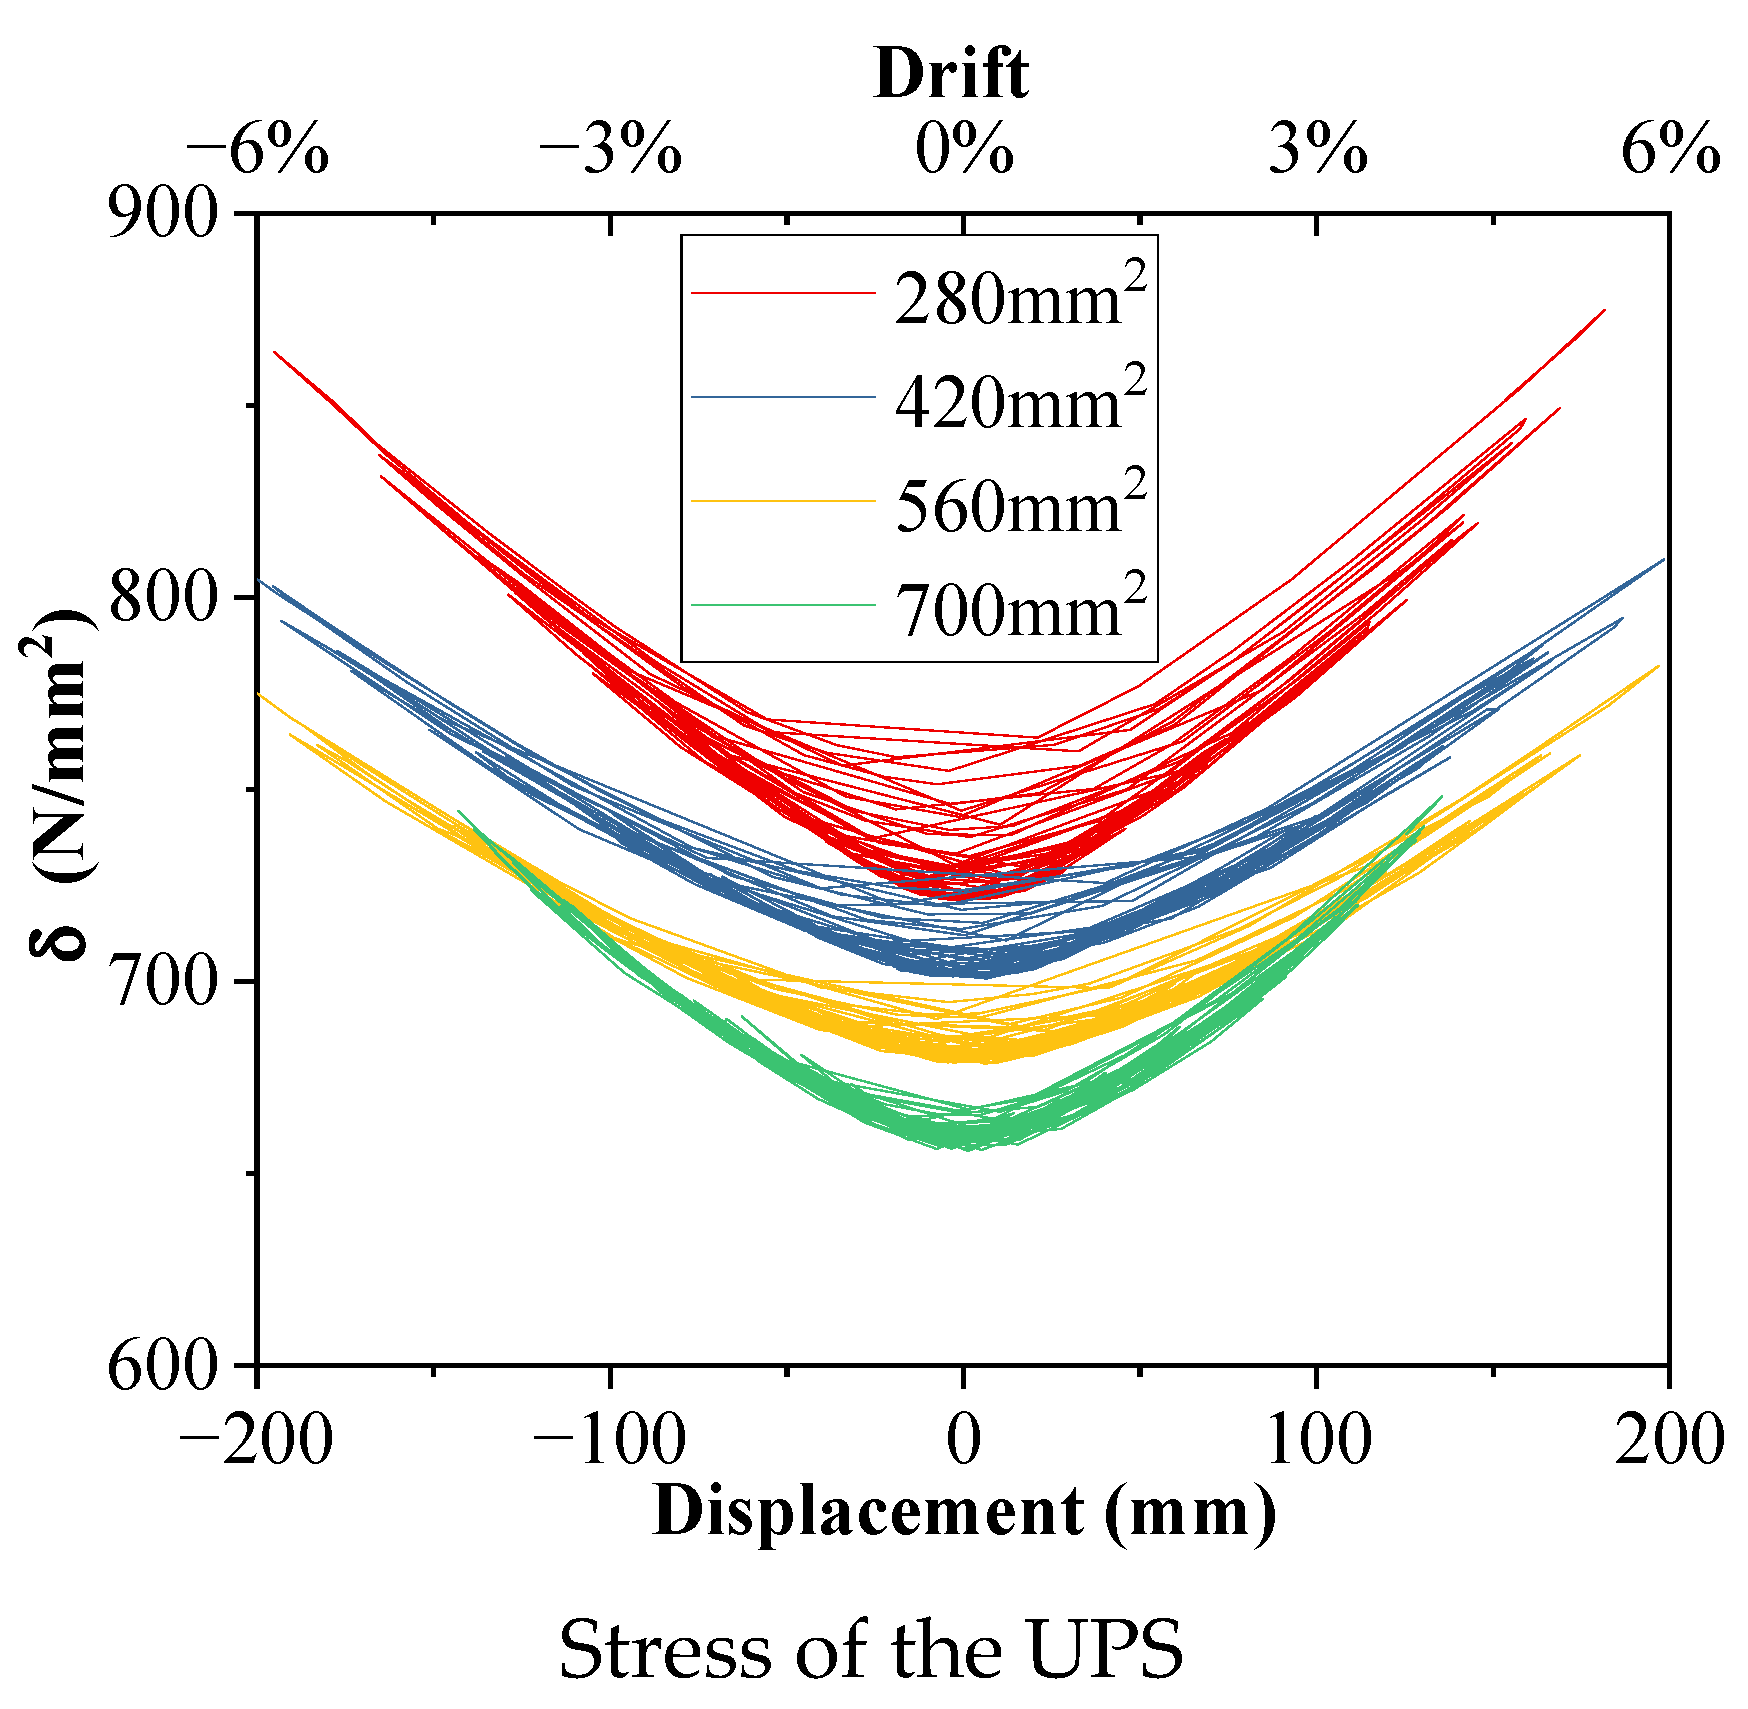
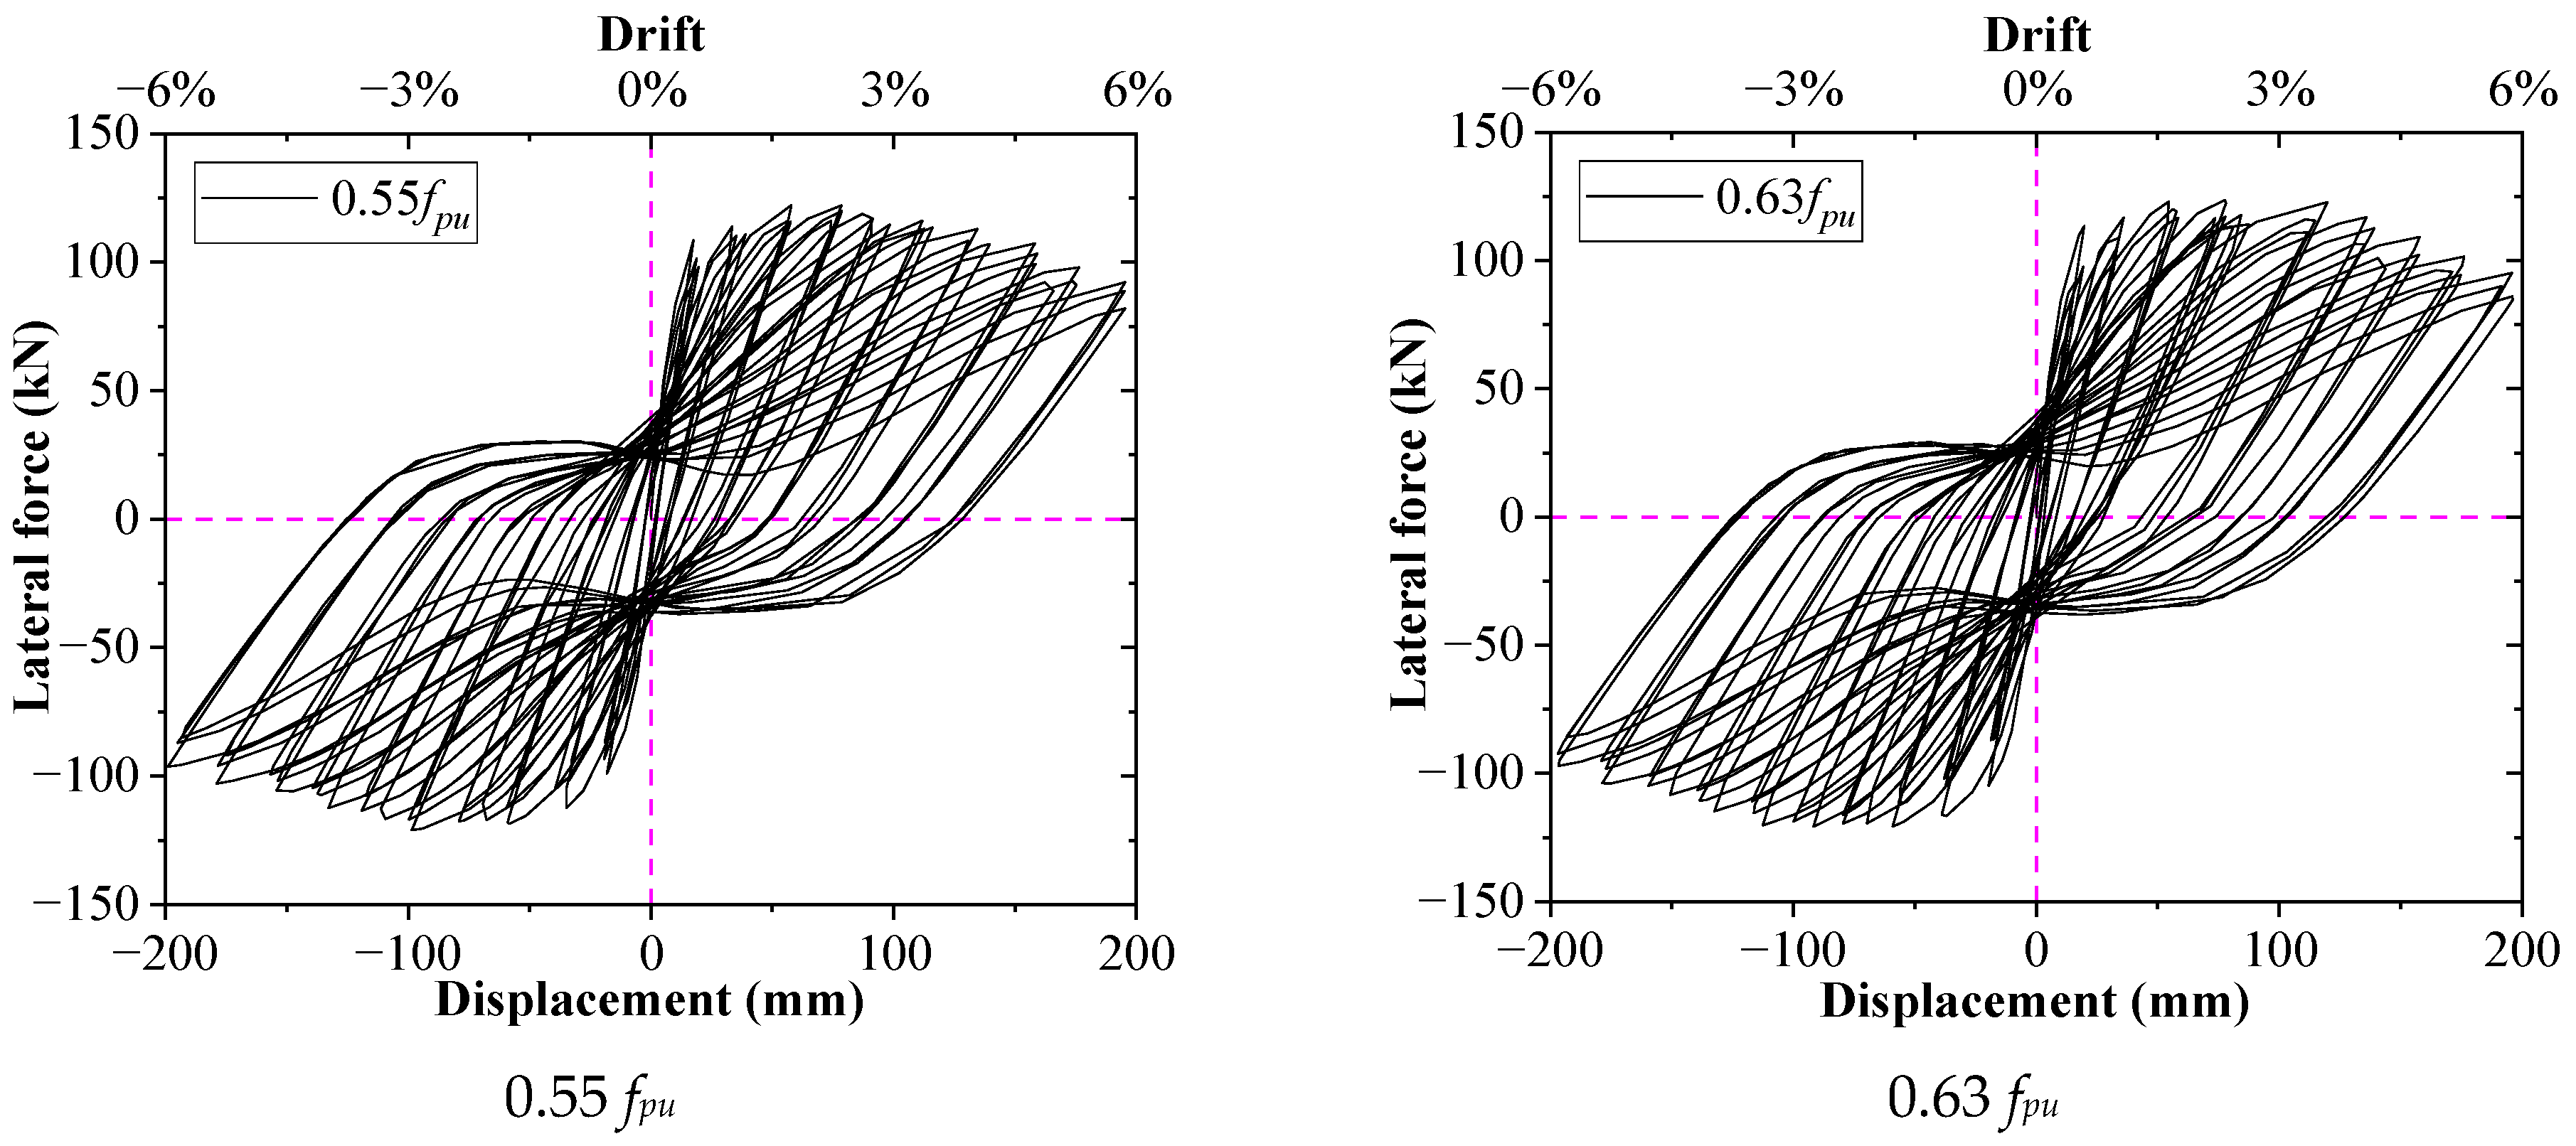
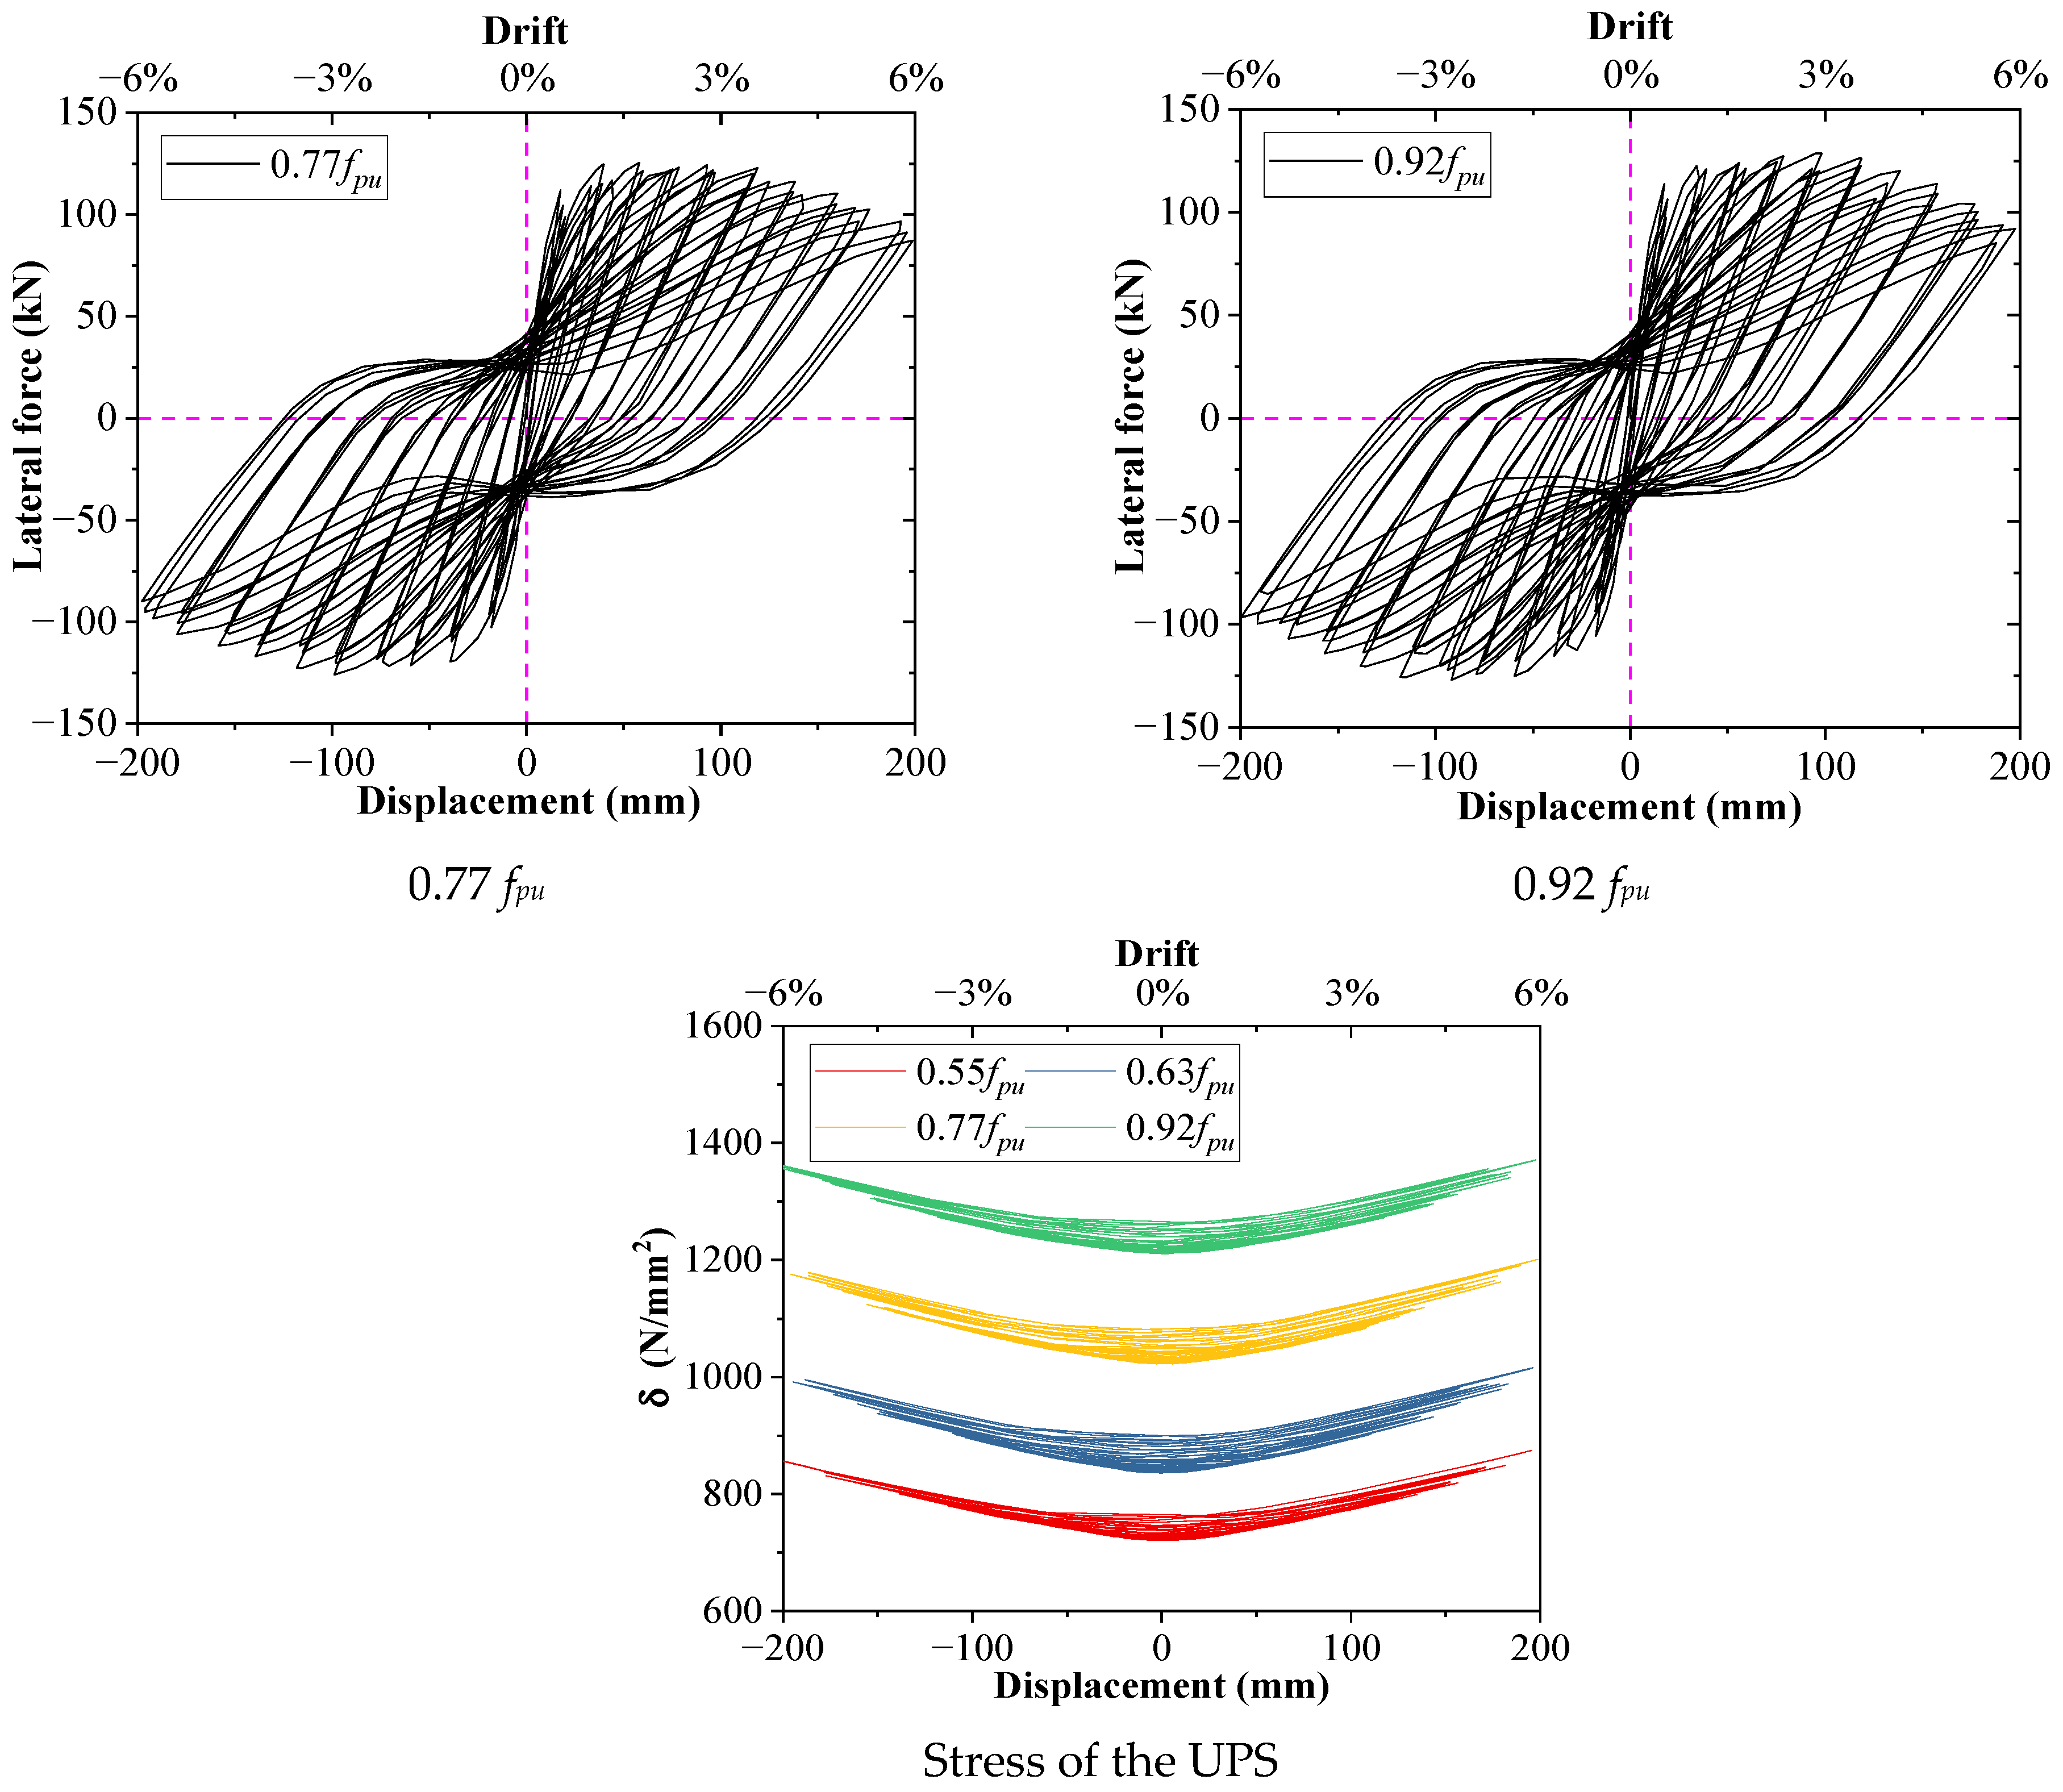
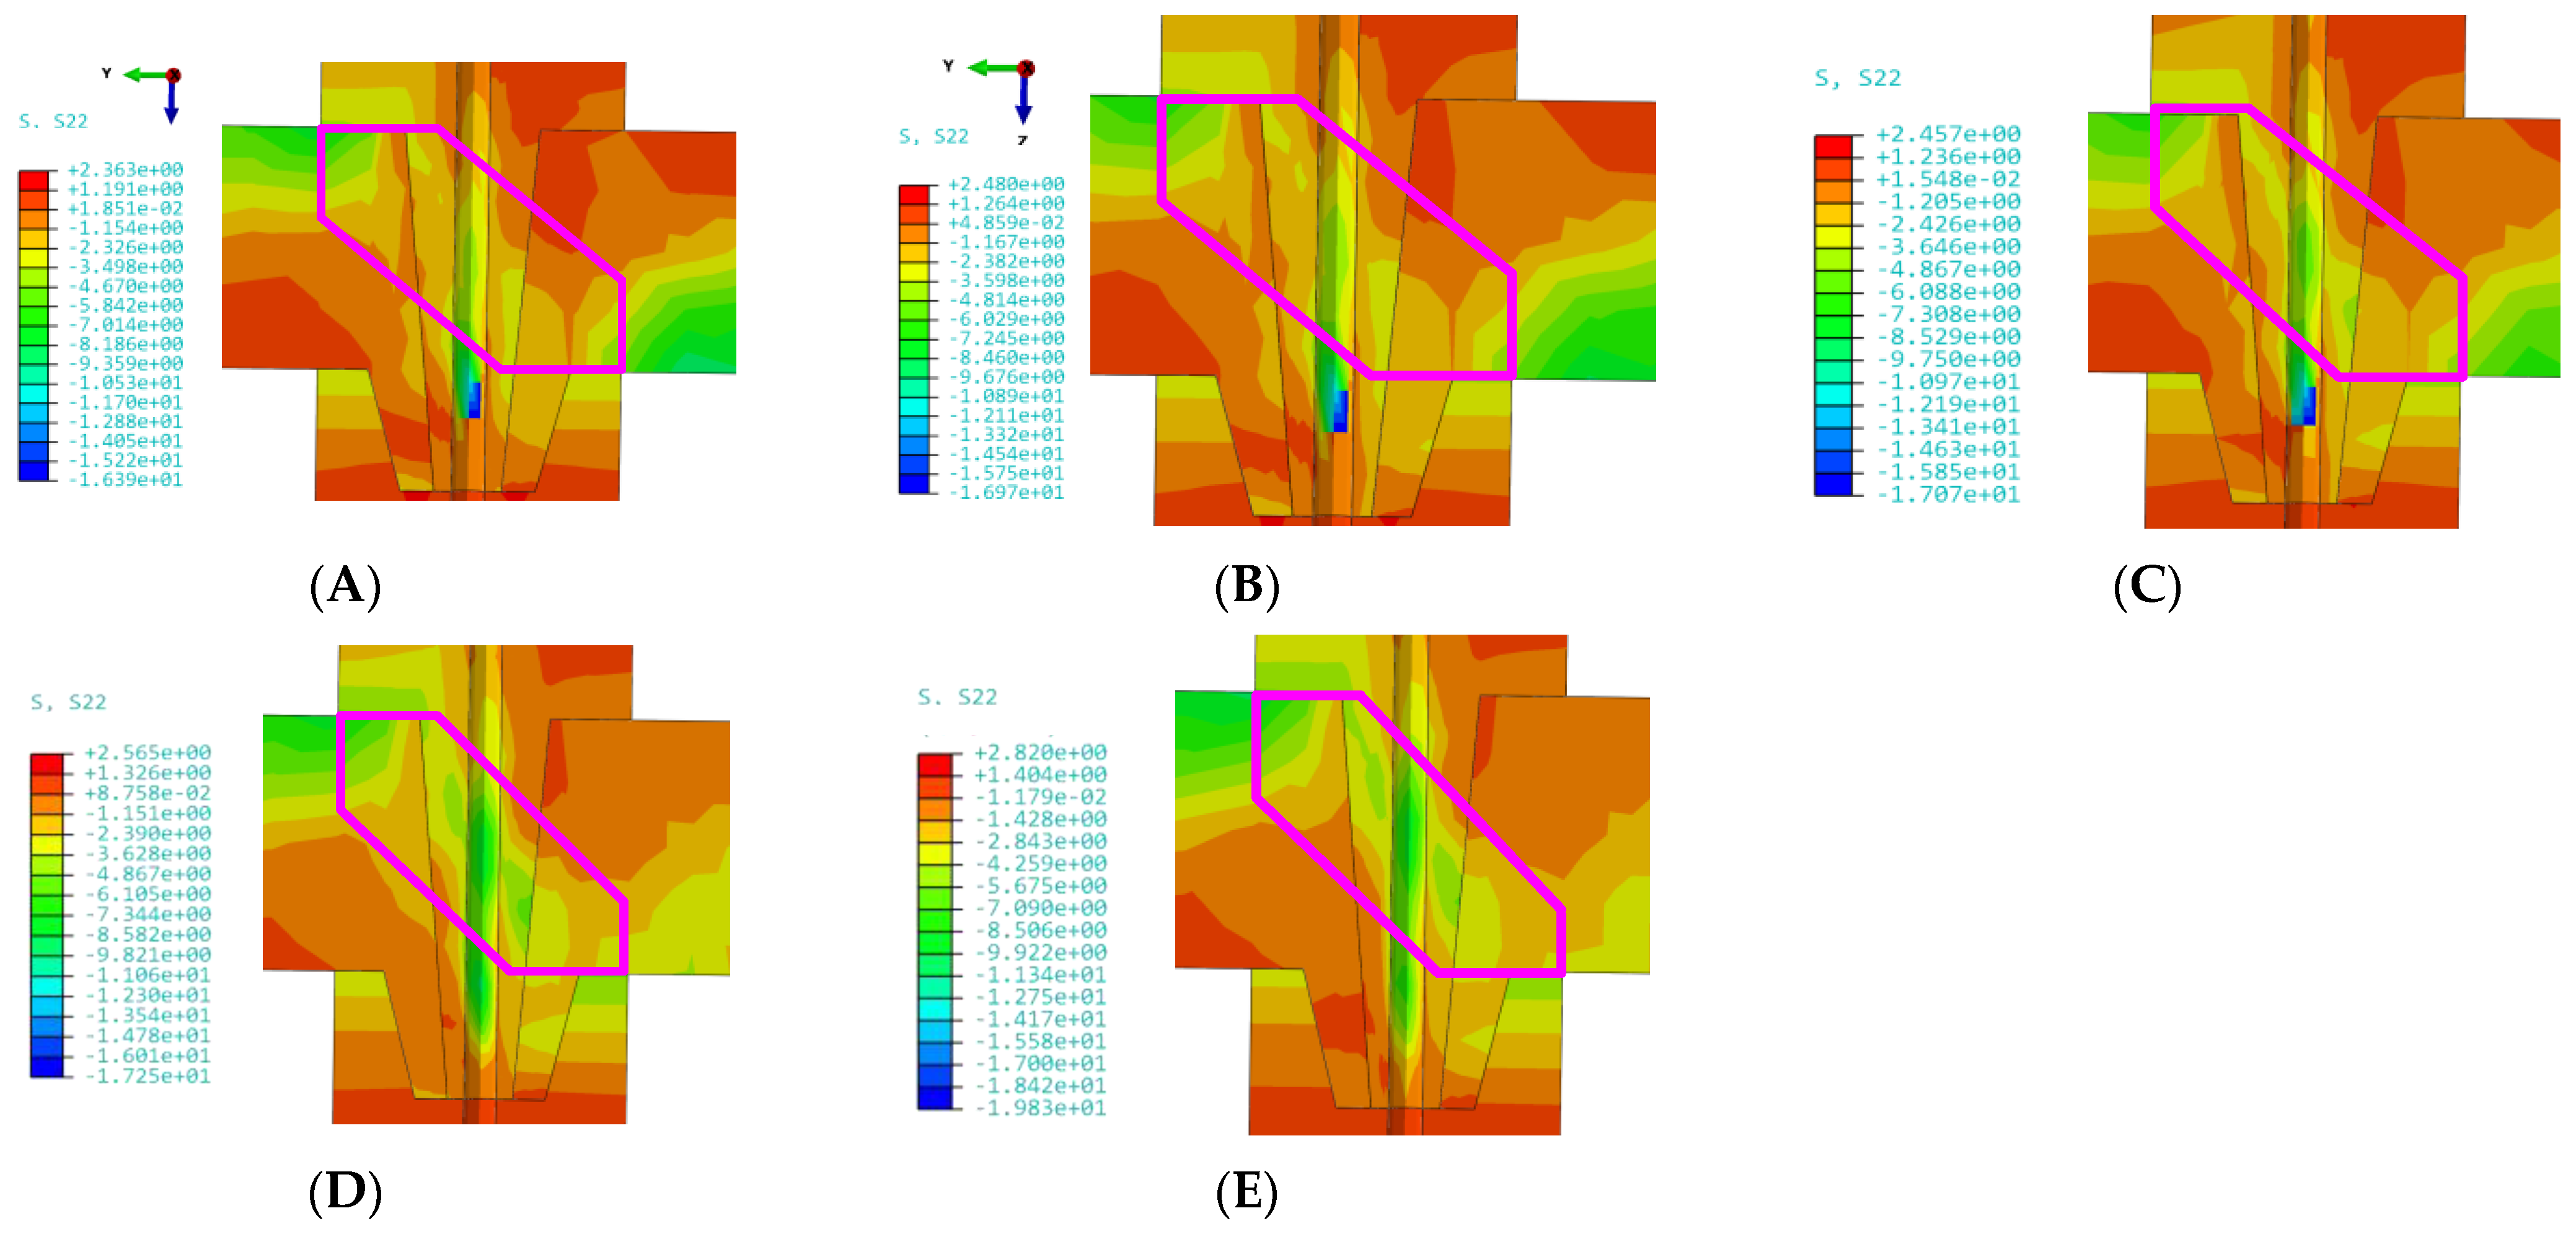
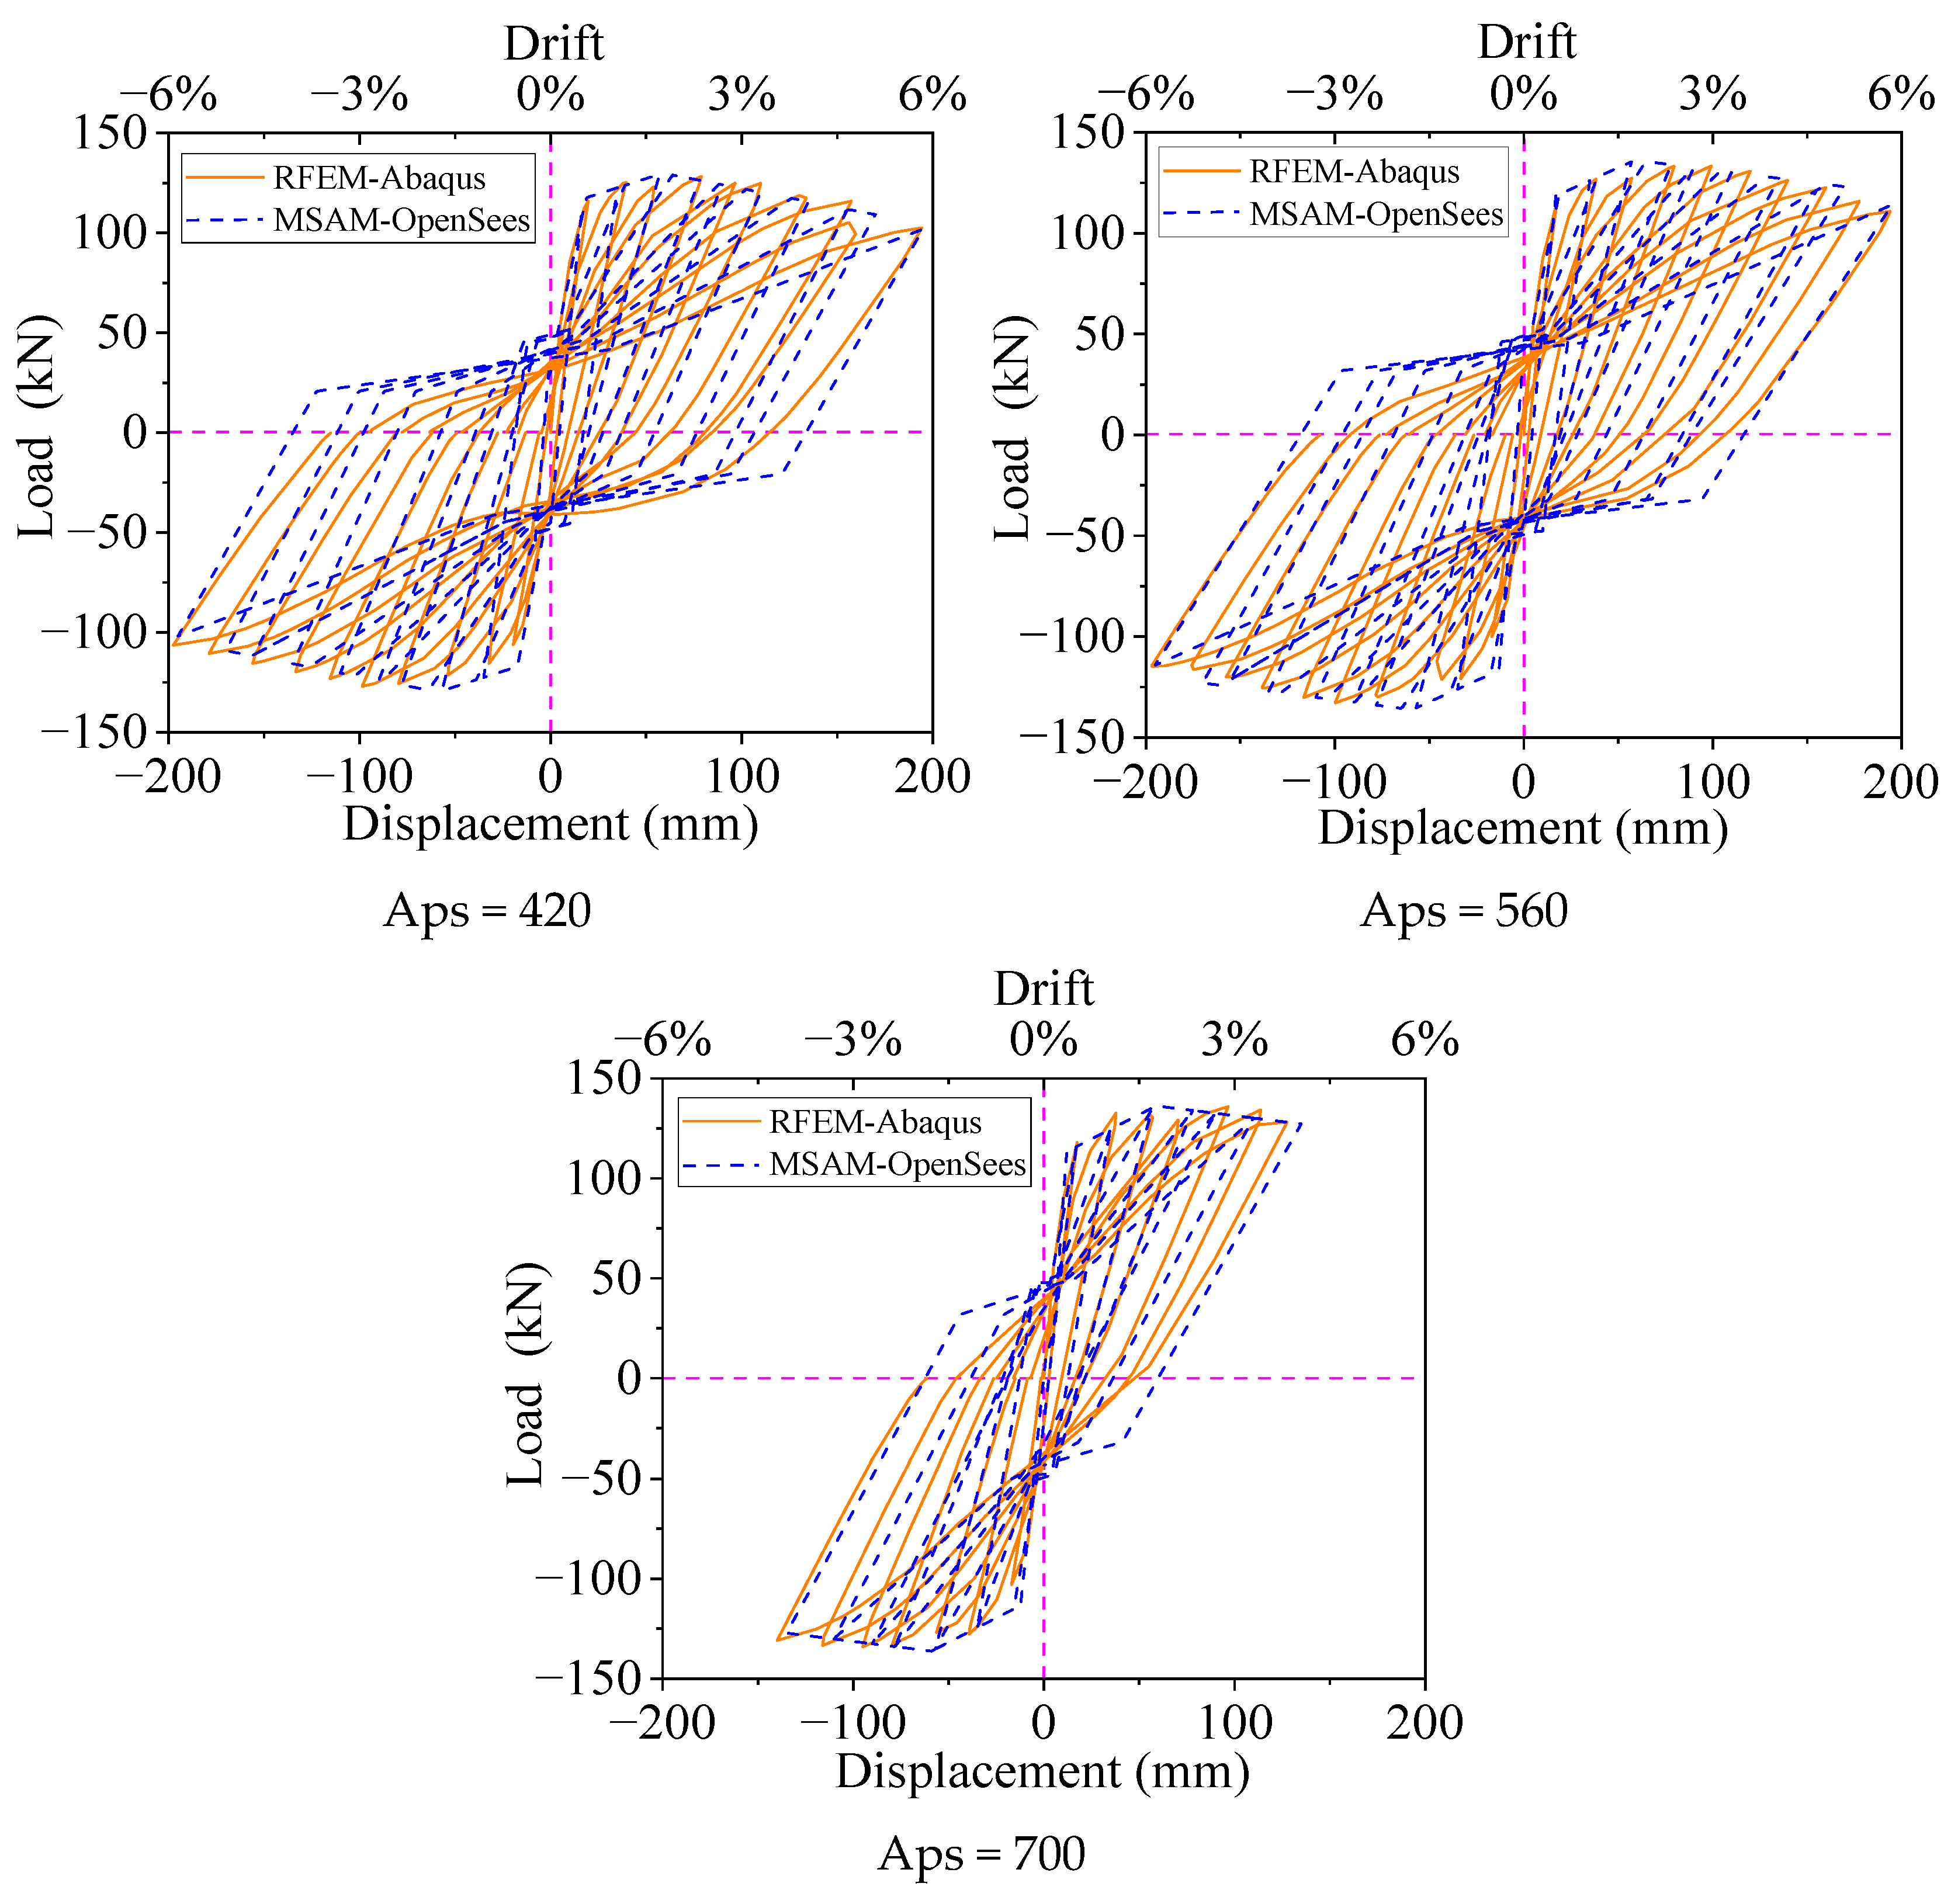
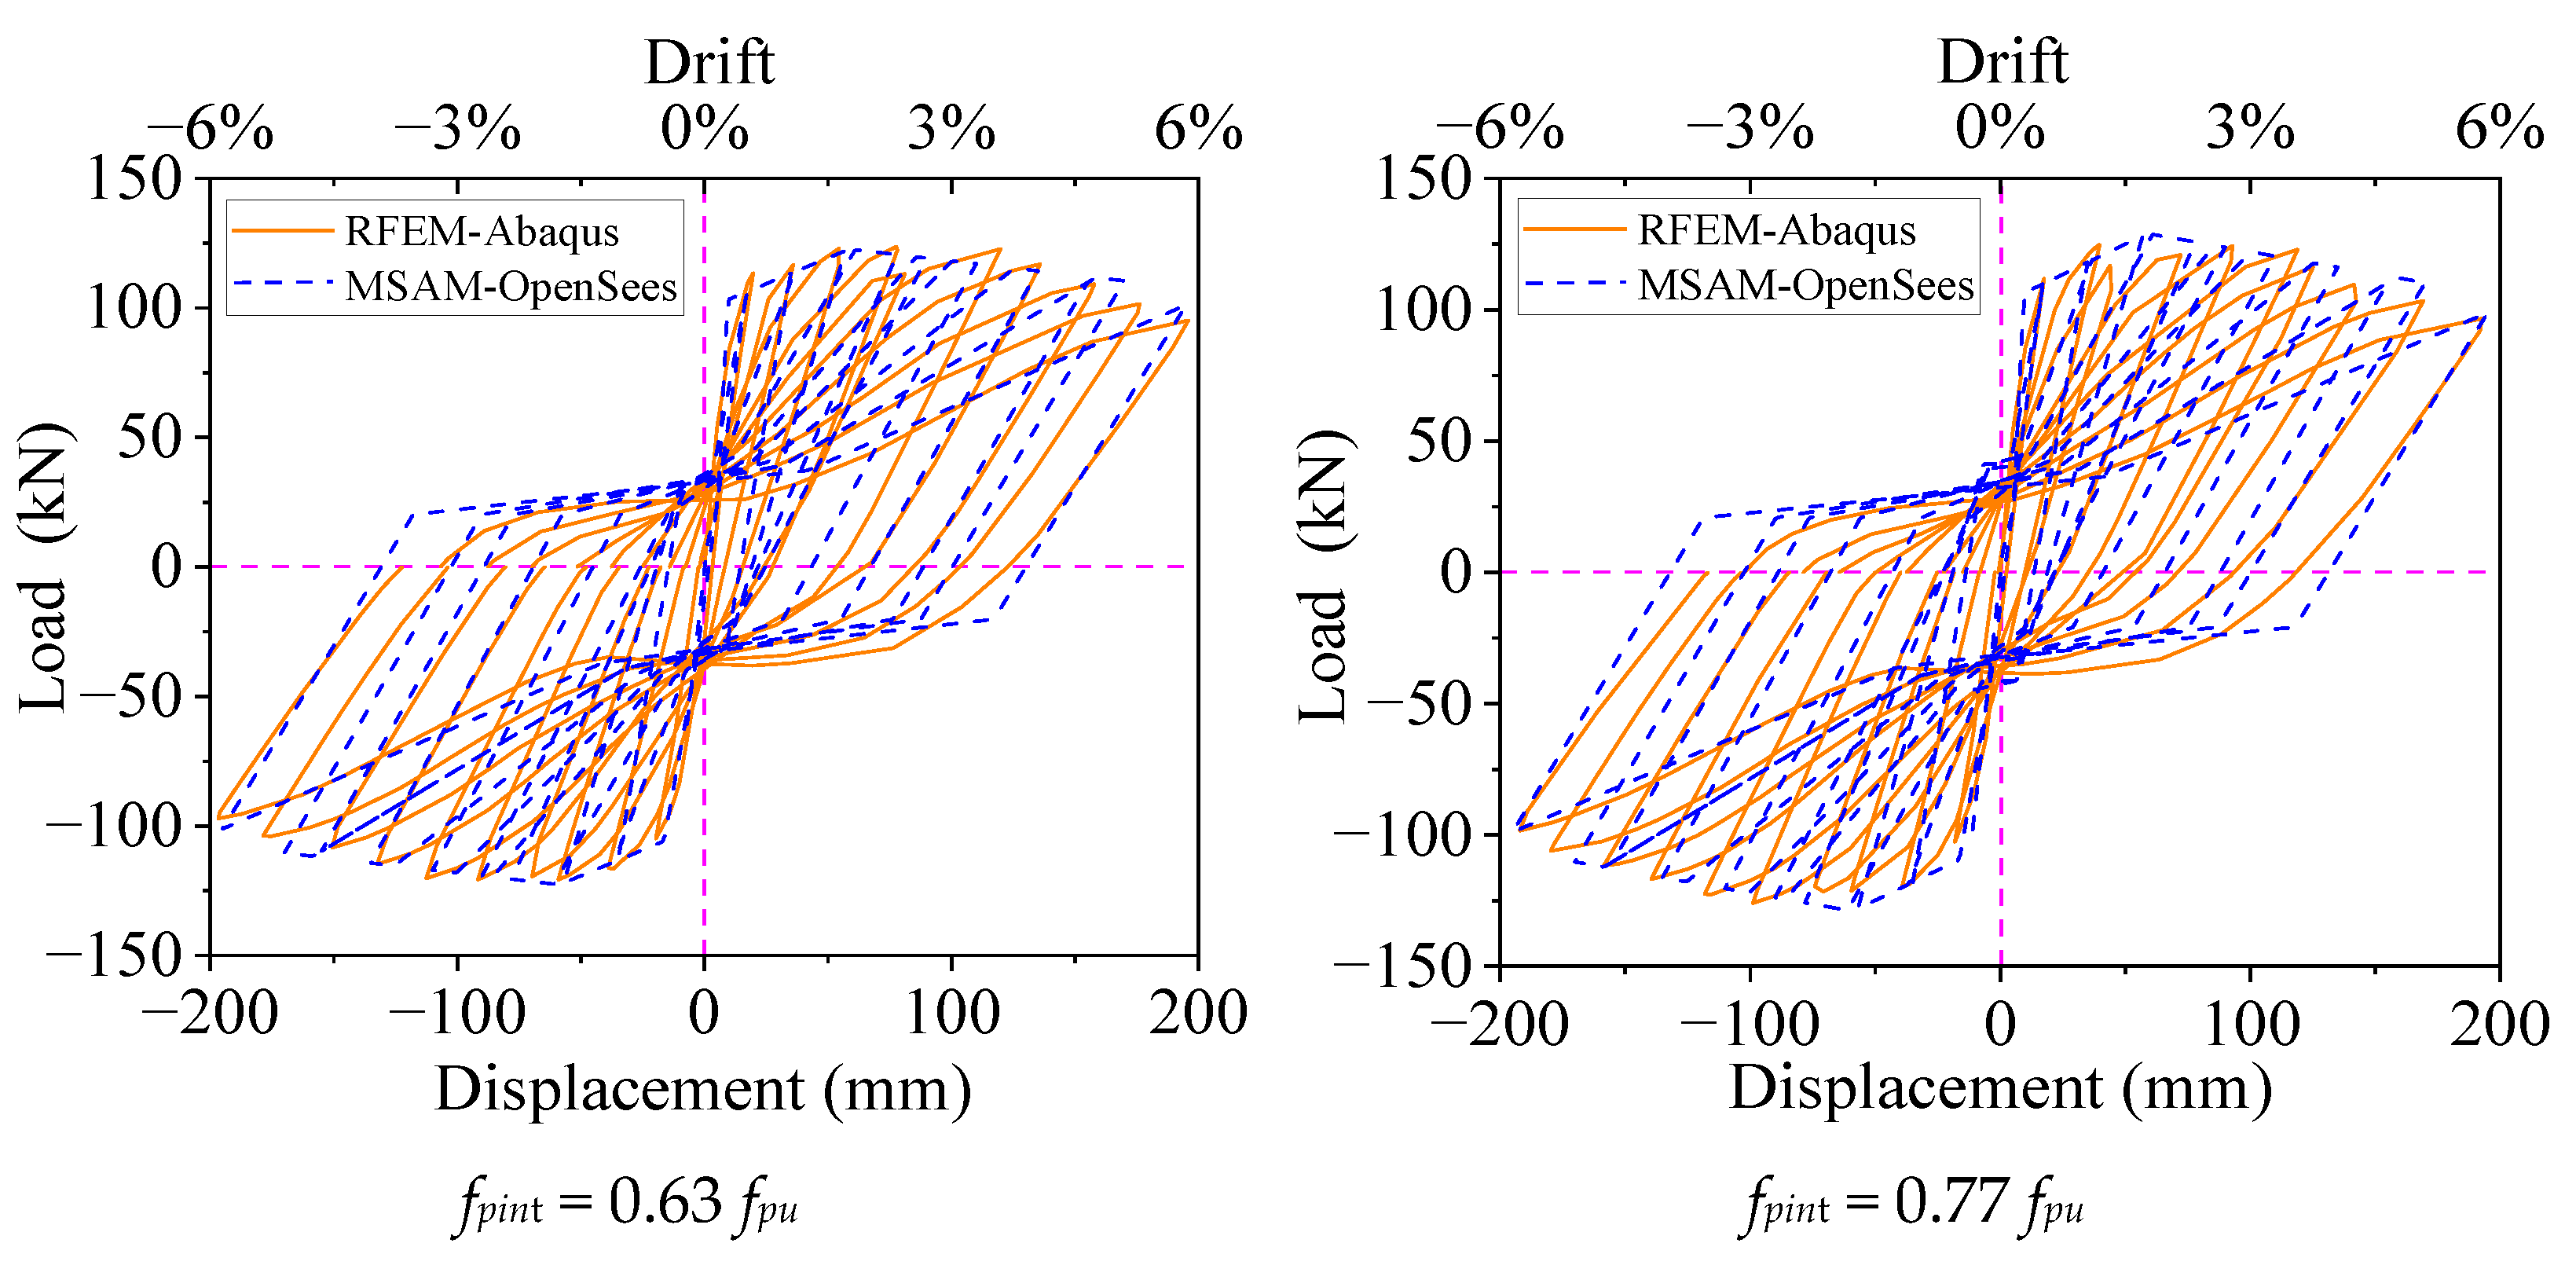
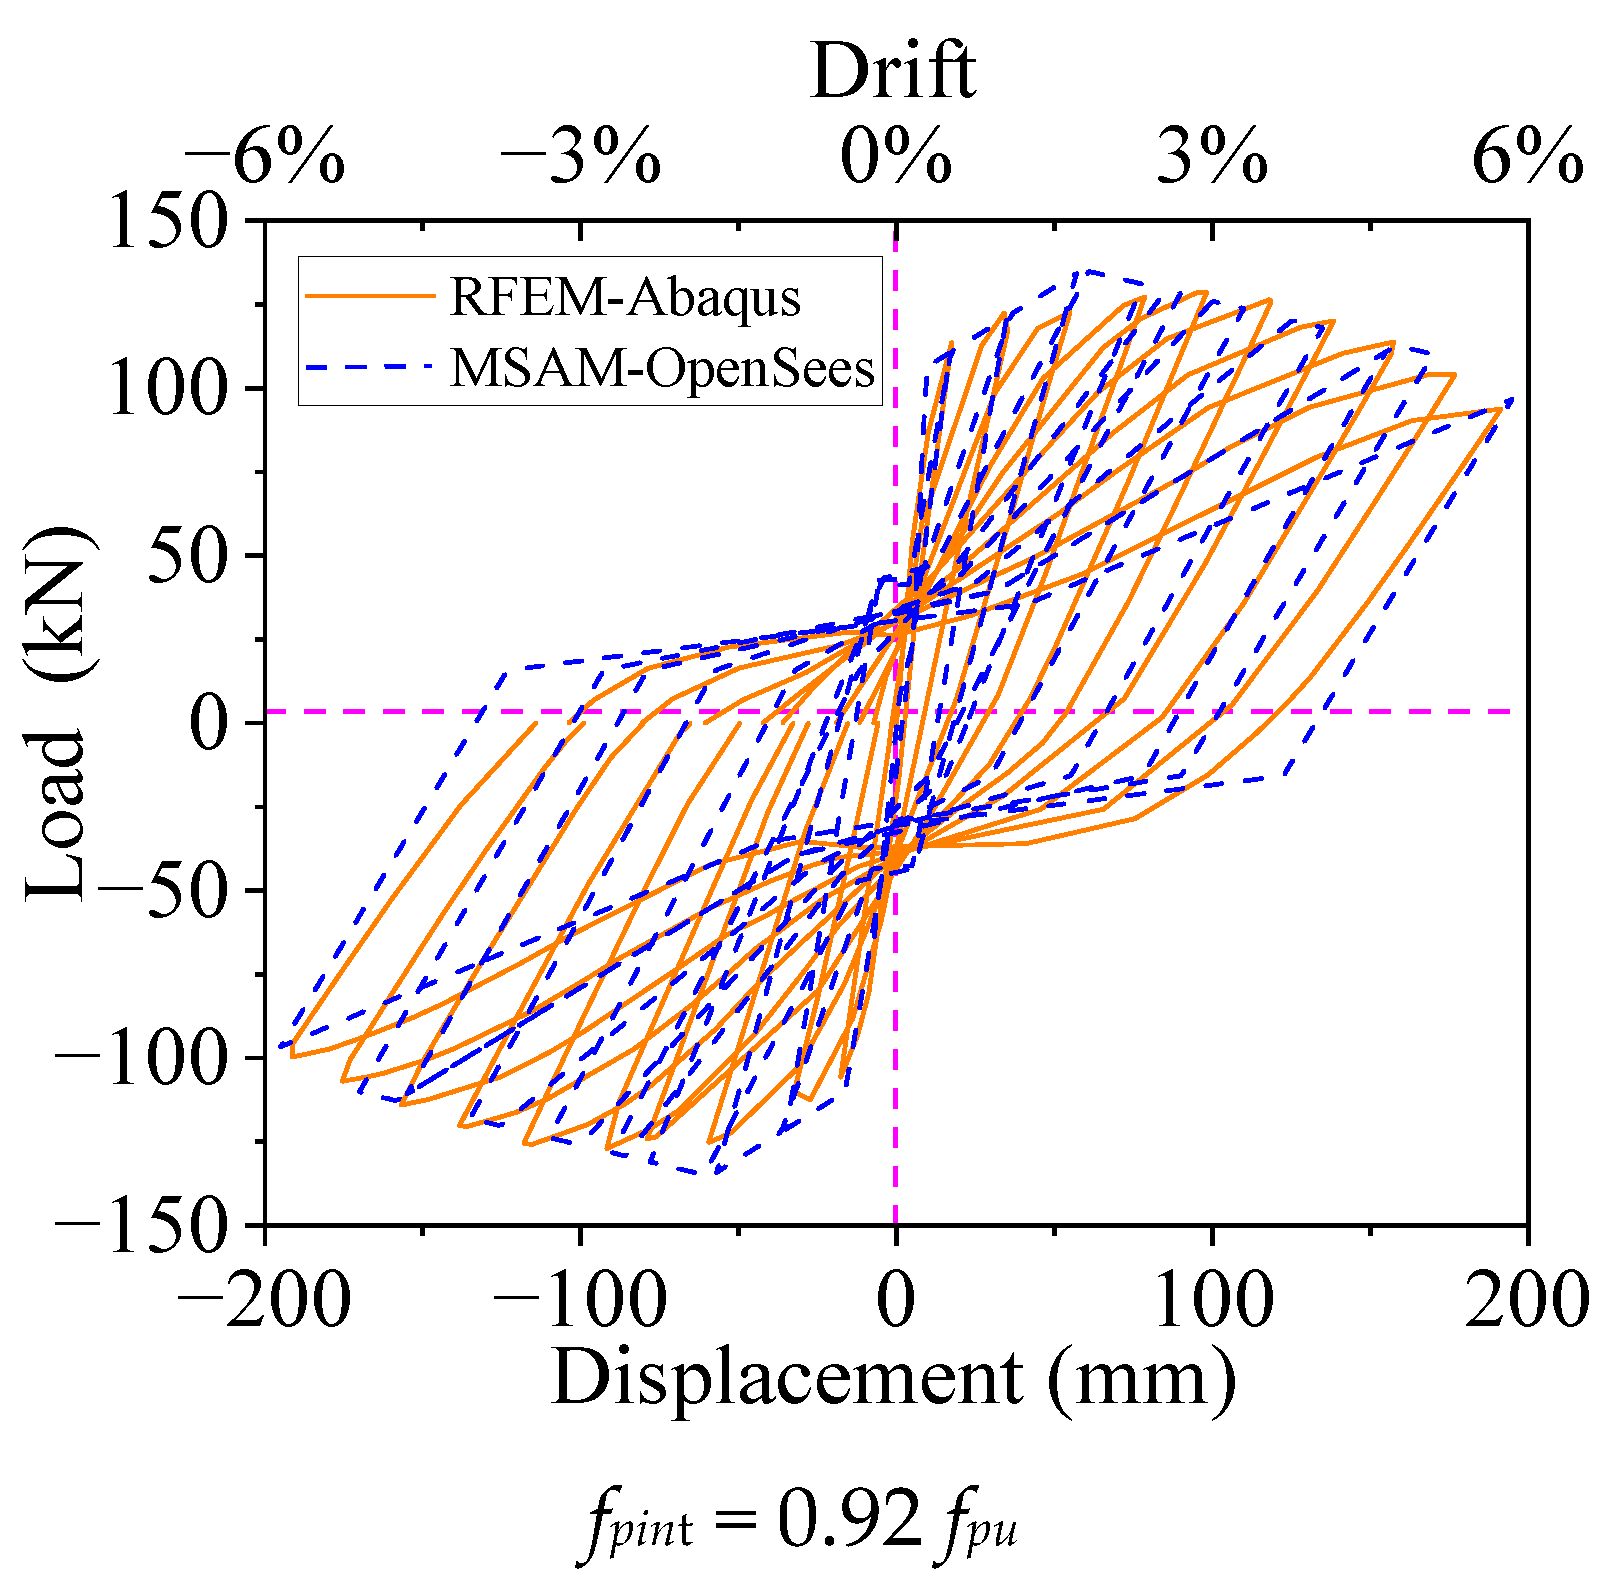
  • The failure of the novel joint under horizontal cyclic loading begins with the failure of the core region. Under smaller axial compression ratios, the degree of relative constraint of the joints is weaker, and the relative slippage between prefabricated components becomes more significant. It is recommended that the axial compression ratio not be less than 0.1 and not exceed 0.4. Increasing the area of and the initial effective stress of the UPS can enhance the joint’s yield and peak load. However, their impact on the joint’s initial stiffness and hysteresis performance is minimal. The recommended range for the area of the UPS is from As (n = 0.02) to As (n = 0.1), with the initial effective stress of the UPS set at 0.75 fpu.
  • The core region of the joint comprises multiple prefabricated components. The force mechanism of the diagonal compression strut still occurs in the core region under horizontal loading. The shear stress–strain skeleton curve of the core region of the joint is computed based on the diagonal compression strut.
  • Based on the equivalent compression-only region surrounding the core region of the joint, this paper constructs a simplified numerical analysis model suitable for the proposed joint. The parameters obtained through GA identification in the restoring force models can effectively reflect the hysteresis performance of the joint under various conditions.
  • Meanwhile, this paper also highlights that further theoretical analysis and relevant experimental verification are needed for the internal joint. This research is necessary to obtain improved connections and design parameters. For parameter identification by GA, the relevant algorithms still need further optimization to improve the accuracy and efficiency of parameter identification.

Author Contributions

Conceptualization, W.Z. and J.W.; validation, C.Z.; data curation and writing—original draft preparation, J.W.; writing—review and editing, J.W.; visualization, J.W. and C.Z. All authors have read and agreed to the published version of the manuscript.

Funding

This research received no external funding.

Data Availability Statement

The original contributions presented in the study are included in the article, further inquiries can be directed to the corresponding authors.

Conflicts of Interest

The authors declare no conflicts of interest.

References

  1. Breccolotti, M.; Gentile, S.; Tommasini, M.; Materazzi, A.L.; Bonfigli, M.F.; Pasqualini, B.; Colone, V.; Gianesini, M. Beam-column joints in continuous RC frames: Comparison between cast-in-situ and precast solutions. Eng. Struct. 2016, 127, 129–144. [Google Scholar] [CrossRef]
  2. Guaygua, B.; Sanchez-Garrido, A.J.; Yepes, V. A systematic review of seis-mic-resistant precast concrete buildings. Structures 2023, 58, 105598. [Google Scholar] [CrossRef]
  3. Lee, J.Y.; Heo, J.H.; Byun, H.W.; Kim, K.H.; Shin, D. Comparison of emulation evaluation methods of precast concrete moment resistance structures. Eng. Struct. 2023, 291, 116416. [Google Scholar] [CrossRef]
  4. Martins, R.; do Carmo, R.; Costa, H.; Julio, E. A review on precast structural concrete walls and connections. Adv. Struct. Eng. 2023, 26, 2600–2620. [Google Scholar] [CrossRef]
  5. Liu, W.H.; Zhang, H.; Wang, Q.; Hua, T.R.; Xue, H. A Review and Scientometric Analysis of Global Research on Prefabricated Buildings. Adv. Civ. Eng. 2021, 2021, 8869315. [Google Scholar] [CrossRef]
  6. Yu, S.; Liu, Y.; Wang, D.; Bahaj, A.S.; Wu, Y.; Liu, J. Review of thermal and environmental performance of prefabricated buildings: Implications to emission reductions in China. Renew. Sustain. Energy Rev. 2021, 137, 110472. [Google Scholar] [CrossRef]
  7. Ferdous, W.; Bai, Y.; Ngo, T.D.; Manalo, A.; Mendis, P. New advancements, challenges and opportunities of multistorey modular buildings-A state-of-the-art review. Eng. Struct. 2019, 183, 883–893. [Google Scholar] [CrossRef]
  8. Sánchez-Garrido, A.J.; Navarro, I.J.; García, J.; Yepes, V. A systematic literature review on modern methods of construction in building: An integrated approach using machine learning. J. Build. Eng. 2023, 73, 106725. [Google Scholar] [CrossRef]
  9. Brunesi, E.; Nascimbene, R.; Bolognini, D.; Bellotti, D. Experimental investigation of the cyclic response of reinforced precast concrete framed structures. PCI J. 2015, 60, 57–79. [Google Scholar] [CrossRef]
  10. Lu, Z.W.; Huang, J.; Dai, S.B.; Liu, J.X.; Zhang, M.Z. Experimental study on a pre-cast beam-column joint with double grouted splice sleeves. Eng. Struct. 2019, 199, 109589. [Google Scholar] [CrossRef]
  11. Ye, Z.H.; Giriunas, K.; Sezen, H.; Wu, G.; Feng, D.C. State-of-the-art review and investigation of structural stability in multi-story modular buildings. J. Build. Eng. 2021, 33, 101844. [Google Scholar] [CrossRef]
  12. Song, X.B.; Li, K.; Crayssac, E.; Wu, Y.J. Lateral Performance of Traditional Heavy Timber Frames with Mortise-Tenon Joints Retrofitted Using Self-Tapping Screws. J. Struct. Eng. 2018, 44, 04018187. [Google Scholar] [CrossRef]
  13. Breccolotti, M.; Bonfigli, M.F.; Colone, V.; Materazzi, A.L.; Pasqualini, B.; Tommasini, M. Wet-joint techniques for the construction of precast concrete pipe rack structures in remote seismic zones. PCI J. 2017, 62, 45–58. [Google Scholar] [CrossRef]
  14. Chang, H.; Choi, I.; Kim, J.; Hong, S.Y. Experimental investigation on seismic performance of two types of member-panel zone unified joints for precast concrete moment-resisting frame. J. Build. Eng. 2021, 43, 103202. [Google Scholar] [CrossRef]
  15. Yang, C.T.; Xie, L.L.; Li, A.Q.; Wang, X.Y. A dry-connected rotational friction dissipative beam-to-column joint for precast concrete frame: Full-scale experimental and numerical investigations. J. Build. Eng. 2022, 54, 104685. [Google Scholar] [CrossRef]
  16. Building Seismic Safety Council (US). NEHRP Recommended Provisions for Seismic Regulations for New Buildings; FEMA: Washington, DC, USA, 1994. [Google Scholar]
  17. Bhandari, S.; Riggio, M.; Jahedi, S.; Fischer, E.C.; Muszynski, L.; Luo, Z.X. A review of modular cross laminated timber construction: Implications for temporary housing in seismic areas. J. Build. Eng. 2023, 63, 105485. [Google Scholar] [CrossRef]
  18. Nzabonimpa, J.D.; Hong, W.K. Experimental and Nonlinear Numerical Analysis of Precast Concrete Column Splices with High-Yield Metal Plates. J. Struct. Eng. 2019, 145, 04018254. [Google Scholar] [CrossRef]
  19. Oettel, V.; Joachim, L.; Schmidt, B. Calculation approach of multi keyed dry joints for sustainable modular precast element constructions made of UHPFRC. Constr. Build. Mater. 2023, 370, 130687. [Google Scholar] [CrossRef]
  20. Dubina, D.; Stratan, A. Behaviour of welded connections of moment resisting frames beam-to-column joints. Eng. Struct. 2002, 24, 1431–1440. [Google Scholar] [CrossRef]
  21. Zhang, Y.; Li, D.S. Seismic behavior and design of repairable precast RC beam–concrete-filled square steel tube column joints with energy-dissipating bolts. J. Build. Eng. 2021, 44, 103419. [Google Scholar] [CrossRef]
  22. Priestley, M. Overview of PRESSS Research program. PCI J. 1991, 4, 50–57. [Google Scholar] [CrossRef]
  23. Priestley, M.N.; Sritharan, S.; Conley, J.R.; Pampanin, S. Preliminary results and conclusions from the PRESSS five-story precast concrete test building. PCI J. 1999, 44, 42–67. [Google Scholar] [CrossRef]
  24. Dong, H.; Wen, J.; Han, Q.; Bi, K.; Zhou, Y.; Du, X. A novel self-centering braced double-column rocking bent for seismic resilience. J. Earthq. Eng. 2023, 27, 1215–1236. [Google Scholar] [CrossRef]
  25. Iqbal, A.; Pampanin, S.; Buchanan, A.H. Seismic Performance of Full-Scale Post-Tensioned Timber Beam-Column Connections. J. Earthq. Eng. 2016, 20, 383–405. [Google Scholar] [CrossRef]
  26. Naserpour, A.; Fathi, M.; Dhakal, R.P. Numerical analysis of inclined demountable precast concrete walls with rocking-based composite columns for seismic protection of building structures. J. Build. Eng. 2023, 75, 107009. [Google Scholar] [CrossRef]
  27. Guo, Z.P.; Guo, H.S.; Li, L.M.; Shi, P.F. Nonlinear finite element analysis of post-tensioned precast prestressed slab-beam-column joints. Structures 2023, 58, 105438. [Google Scholar] [CrossRef]
  28. Li, D.B.; Chai, Y.K.; Li, W.L.; Xiang, R. Experimental study and finite element analysis of seismic behaviour of novel precast prestressed concrete frames. Structures 2022, 38, 402–415. [Google Scholar] [CrossRef]
  29. Wang, J.W.; Zhou, W. Experimental and numerical response of unbonded post-tensioned rocking wall under lateral cyclic loading. J. Build. Eng. Ing 2023, 66, 105827. [Google Scholar] [CrossRef]
  30. Lv, Q.F.; Han, T.C.; Liu, Y. Models and design procedure for cross-laminated bamboo rocking walls. Structures 2022, 38, 1031–1049. [Google Scholar] [CrossRef]
  31. Piri, M.; Massumi, A. Seismic performance of steel moment and hinged frames with rocking shear walls. J. Build. Eng. 2022, 50, 104121. [Google Scholar] [CrossRef]
  32. Zhang, H.Y.; Geng, X.R.; Zhou, W. Experiments on the hysteretic response of self-centering RC columns prestressed by unbonded posttensioned tendons. J. Earthq. Eng. 2022, 26, 6763–6777. [Google Scholar] [CrossRef]
  33. Priestley, M.J.N.; MacRae, G.A. Seismic tests of precast beam-to-column joint subassemblages with unbonded tendons. PCI J. 1996, 41, 64–80. [Google Scholar] [CrossRef]
  34. Xin, Z.Y.; Baber, K.; Gattas, J.M. A novel tension strap connection for rapid assembly of temporary timber structures. Eng. Struct. 2022, 262, 114320. [Google Scholar] [CrossRef]
  35. Aloisio, A.; Contento, A.; Alaggio, R.; Briseghella, B.; Fragiacomo, M. Probabilistic assessment of a light-timber frame shear wall with variable pinching under repeated earth-quakes. J. Struct. Eng. 2022, 148, 04022178. [Google Scholar] [CrossRef]
  36. Huang, H.; Wu, Y.T.; Li, Z.; Sun, Z.W.; Chen, Z.X. Seismic behavior of Chuan-Dou type timber frames. Eng. Struct. 2018, 167, 725–739. [Google Scholar] [CrossRef]
  37. Dong, H.; He, M.; Wang, X.; Christopoulos, C.; Li, Z.; Shu, Z. Development of a uniaxial hysteretic model for dowel-type timber joints in OpenSees. Constr. Build. Mater. 2021, 288, 123112. [Google Scholar] [CrossRef]
  38. Bolmsvik, A.; Linderholt, A.; Brandt, A.; Ekevid, T. FE modelling of light weight wooden assemblies-Parameter study and comparison between analyses and experiments. Eng. Struct. 2014, 73, 125–142. [Google Scholar] [CrossRef]
  39. Wang, X.J.; He, M.J.; Dong, H.L.; Li, Z. Numerical modeling strategies and parametric analyses of platform-type and balloon-type cross-laminated timber (CLT) shear walls under lateral load. Eng. Struct. 2023, 295, 116857. [Google Scholar] [CrossRef]
  40. Lacourt, P.A.; Crisafulli, F.J.; Mirasso, A.E. Finite element modelling of hysteresis, degradation and failure of dowel type timber joints. Eng. Struct. 2016, 123, 89–96. [Google Scholar] [CrossRef]
  41. Blasetti, A.S.; Hoffman, R.M.; Dinehart, D.W. Simplified hysteretic finite element model for wood and viscoelastic polymer connections for the dynamic analysis of shear walls. J. Struct. Eng. 2008, 134, 77–86. [Google Scholar] [CrossRef]
  42. Zhang, B.Z.; Xie, Q.F.; Li, S.Y.; Zhang, L.P.; Xue, J.Y. Numerical analysis of traditional Chinese timber structure: Simplified finite element model and composite elements of joints. J. Build. Eng. 2023, 67, 106027. [Google Scholar] [CrossRef]
  43. Zhang, B.Z.; Xie, Q.F.; Liu, Y.J.; Zhang, L.P.; Li, S.Y. Effects of gaps on the seismic performance of traditional timber frames with straight mortise-tenon joint: Experimental tests, energy dissipation mechanism and hysteretic model. J. Build. Eng. 2022, 58, 105019. [Google Scholar] [CrossRef]
  44. Wang, C.; Xiao, J.; Liu, W.; Ma, Z. Unloading and reloading stress-strain relationship of recycled aggregate concrete reinforced with steel/polypropylene fibers under uniaxial low-cycle loadings. Cem. Concr. Compos. 2022, 131, 104597. [Google Scholar] [CrossRef]
  45. Wang, C.Q.; Wu, H.X.; Li, C.X. Hysteresis and damping properties of steel and polypropylene fiber reinforced recycled aggregate concrete under uniaxial low-cycle loadings. Constr. Build. Mater. 2022, 134, 12619. [Google Scholar] [CrossRef]
  46. GB50010-2010; Code for Design of Concrete Structures. China Construction Industry Press: Beijing, China, 2010.
  47. JGJ 369-2016; Code for Design of Prestressed Concrete Structures. China Construction Industry Press: Beijing, China, 2016.
  48. Cook, R.D.; Malkus, D.S.; Plesha, M.E.; Robert, J. Witt. Concepts and Applications of Finite Element Analysis; Wiley: New York, NY, USA, 1974. [Google Scholar]
  49. Hwang, S.J.; Lee, H.J. Analytical model for predicting shear strengths of interior reinforced concrete beam column joints for seismic resistance. ACI Struct. J. 2000, 97, 35–44. [Google Scholar]
  50. Hwang, S.J.; Lee, H.J. Analytical model for predicting shear strengths of exterior reinforced concrete beam column joints for seismic resistance. ACI Struct. J. 2000, 96, 846–857. [Google Scholar]
  51. Paulay, T.; Priestley, M.J.N. Seismic Design of Reinforced Concrete and Masonry Buildings; Wiley Interscience: Hoboken, NJ, USA, 1992. [Google Scholar]
  52. Alath, S.; Kunnath, S.K. Modeling inelastic shear deformation in RC beam-column joints. In Proceedings of the 10th Conference on Engineering Mechanics, New York, NY, USA, 21–24 May 1995; ASCE: Reston, VA, USA, 1995; pp. 822–825. [Google Scholar]
  53. Biddah, A.; Ghobarah, A. Modelling of shear deformation and bond slip in reinforced concrete joints. Struct. Eng. Mech. 1999, 7, 413–432. [Google Scholar] [CrossRef]
  54. Mitra, N. An Analytical Study of Reinforced Concrete Beam-Column Joint Behavior under Seismic Loading; University of Washington: Washington, DC, USA, 2007; pp. 1–210. [Google Scholar]
  55. Mazzoni, S.; McKenna, F.; Scott, M.H.; Fenves, G.L. OpenSees User’s Manual; PEER, University of California: Berkeley, CA, USA, 2004. [Google Scholar]
  56. Negash, B.A.; You, W.; Lee, J.; Lee, K. Parameter identification of Bouc-Wen model for magnetorheological (MR) fluid damper by a novel genetic algorithm. Adv. Mech. Eng. 2020, 12, 1687814020950546. [Google Scholar] [CrossRef]
  57. Li, Z.; Noori, M.; Zhao, Y.; Wan, C.F.; Feng, D.C. A multi-objective optimisation algorithm for Bouc-Wen-Baber-Noori model to identify reinforced concrete columns failing in different modes. J. Mater. Des. Appl. 2021, 235, 2165–2182. [Google Scholar]
  58. Ma, Y.; Wu, Z.B.; Cheng, X.B.; Sun, Z.G.; Chen, X.Y. Parameter identification of hysteresis model of reinforced concrete columns considering shear action. Structures 2023, 47, 93–104. [Google Scholar] [CrossRef]
  59. Sengupta, P.; Li, B. Modified Bouc-Wen model for hysteresis behavior of RC beam–column joints with limited transverse reinforcement. Eng. Struct. 2013, 46, 392–406. [Google Scholar] [CrossRef]
  60. Charalampakis, A.E.; Koumousis, V.K. Identification of Bouc-Wen hysteretic systems by a hybrid evolutionary algorithm. J. Sound Vib. 2008, 314, 571–585. [Google Scholar] [CrossRef]
  61. Raviolo, D.; Civera, M.; Fragonara, L.Z. A comparative analysis of optimization algorithms for finite element model updating on numerical and experimental benchmarks. Buildings 2023, 13, 3010. [Google Scholar] [CrossRef]
  62. Available online: https://opensees.berkeley.edu/wiki/index.php/Command_Manual (accessed on 2 March 2011).
  63. Lowes, L.N.; Mitra, N.; Altoontash, A. A Beam-Column Joint Model for Simulating the Earthquake Response of Reinforced Concrete Frames; Pacific Earthquake Engineering Research Center, College of Engineering, University of California: Berkeley, CA, USA, 2003. [Google Scholar]
  64. Park, Y.J.; Ang, A.H.S. Mechanistic seismic damage model for reinforced concrete. J. Struct. Eng. ASCE 1985, 111, 722–739. [Google Scholar] [CrossRef]
Figure 1. Detailed diagram of the new prefabricated frame structure and its internal joint, (a) the new assembly frame structure; (b) the specific details of the internal joint.
Buildings 14 01629 g001
Figure 2. Details on the design and refined numerical analysis model of the internal joint, (a) Details on the design of the internal joint; (b) Refined numerical analysis model of the internal joint; (c) Rigid springs between the virtual UPS and the UPS; (d) Changes in boundary conditions for each analysis step.
Buildings 14 01629 g002aBuildings 14 01629 g002b
Figure 3. Comparison between the experimental results in reference [33] and the FEM results, (a) Comparison of hysteresis curves; (b) Damage patterns of the internal joint in reference [33]; (c) Compressive damage distribution by FEM; (d) Tension damage distribution by FEM.
Buildings 14 01629 g003
Figure 4. Hysteresis curves under different axial compression ratios.
Buildings 14 01629 g004
Figure 5. Hysteresis curves under different areas of the UPS.
Buildings 14 01629 g005aBuildings 14 01629 g005b
Figure 6. Hysteresis curves under different initial stresses of the UPS.
Buildings 14 01629 g006aBuildings 14 01629 g006b
Figure 7. Load-displacement curve, (a) Monotonic horizontal loading; (b) Horizontal reciprocating loading.
Buildings 14 01629 g007
Figure 8. Stress of the core region under monotonic horizontal loading, (AE) represent the stress distribution in different stage.
Buildings 14 01629 g008
Figure 9. Stress of the core region under horizontal reciprocating loading, (AE) represent the stress distribution in different stage.
Buildings 14 01629 g009
Figure 10. Classification of the core region, (a) Core region ABNM; (b) Core region ABDC; (c) Core region EFGH.
Buildings 14 01629 g010
Figure 11. Deformation analysis of the core region based on the local cross-section of the core region of the joint, (a) Before deformation of the core region; (b) After deformation of the core region; (c) Type I of the core region; (d) Type II of the core region.
Buildings 14 01629 g011aBuildings 14 01629 g011b
Figure 12. The diagram and macro-simplified analytical model of the joint, (a) The diagram of the joint model; (b) Macro-simplified analytical model.
Buildings 14 01629 g012
Figure 13. The sizes of the actual core region and the diagonal compression strut, (a) the core region I of the joint; (b) the core region II of the joint; (c) the size of diagonal compression strut; (d) the calculation model of diagonal compression strut.
Buildings 14 01629 g013
Figure 14. The fiber section of the equivalent compression-only zones and the series of materials, (a) The fiber section in the height of hC2; (b) The fiber section in the height of hC1; (c) Series material.
Buildings 14 01629 g014
Figure 15. Constitutive models of the materials in the macro-simplified analysis model [55], (a) Concrete02 model; (b) Concrete01 model; (c) skeleton cure of the UPS; (d) Constitutive model of the steel reinforcement; (e) Pinching4 material.
Buildings 14 01629 g015
Figure 16. The technical route for GA parameter identification.
Buildings 14 01629 g016
Figure 17. Comparison of macro simplified analysis model and refined model calculation results under different axial compression ratios.
Buildings 14 01629 g017
Figure 18. Comparison of macro simplified analysis model and refined model calculation results under different area of the UPS.
Buildings 14 01629 g018
Figure 19. Comparison of macro simplified analysis model and refined model calculation results under different initial stress of the UPS.
Buildings 14 01629 g019aBuildings 14 01629 g019b
Table 1. The material constitutive model parameters for the core region.
Connection LocationMaterial ModelInput Parameters
Core region Pinching4$ePf1 $ePd1 $ePf2 $ePd2 $ePf3 $ePd3 $ePf4 $ePd4
<$eNf1 $eNd1 $eNf2 $eNd2 $eNf3 $eNd3 $eNf4 $eNd4>
$rDispP $rForceP $uForceP <$rDispN $rForceN $uForceN >
$gK1 $gK2 $gK3 $gK4 $gKLim
$gD1 $gD2 $gD3 $gD4 $gDLim
$gF1 $gF2 $gF3 $gF4 $gFLim
$gE $dmgType
Note: Shadowing indicates parameters to be identified using GAs.
Table 2. The shear stress–strain skeleton curve data.
TypeAxial Compression Ratio nArea of UPS ApInitial Stress of UPS fpeff
0.10.20.30.40.54205607000.630.770.92
Pf11.1711.2041.4421.9052.4521.4831.7432.0851.4681.4791.621
Pd10.000080.000090.000100.000140.000180.00011 0.000130.000150.000110.000110.00012
Pf22.9773.0603.5664.8435.7333.7694.4305.2993.7323.8544.174
Pd20.002600.002170.003200.004230.005450.003290.003870.004630.003260.003510.00382
Pf33.1353.2233.8615.1016.5653.9704.6675.5813.9314.1284.207
Pd30.017080.017260.018030.019790.018760.019620.022420.023400.019410.020030.02110
Pf42.5012.5713.0804.0695.2373.1663.7224.4523.1363.3733.575
Pd40.032940.03386 0.040570.053590.068970.041700.049030.058640.041300.044420.04840
Units: Pfi: MPa, Pdi: rad.
Table 3. Parameter identification results of the Pinching4 material.
TypeAxial Compression Ratio nArea of UPS ApInitial Stress of UPS fpeff
0.10.20.30.40.54205607000.630.770.92
rDispP0.210.220.220.150.120.250.180.050.220.230.25
rForceP0.280.300.400.420.450.400.400.400.400.400.40
uForceP0.260.250.250.240.180.230.150.110.250.250.25
K10.650.700.720.750.750.750.750.770.710.710.72
K20.200.350.150.180.250.300.300.300.150.150.15
K30.040.040.050.060.0650.090.110.150.050.080.15
K40.150.120.180.140.100.100.120.120.180.180.18
D10.180.250.330.410.350.100.330.330.330.330.35
D20.150.120.100.120.00.400.100.100.100.100.11
D30.800.820.930.901.01.00.930.930.930.930.93
D40.120.150.140.120.00.500.140.140.140.140.14
F10.350.500.550.550.650.530.550.650.650.550.55
F10.280.150.250.100.250.250.250.230.250.250.25
F30.020.040.040.060.0550.050.040.050.040.040.04
F40.800.901.11.11.01.01.11.11.11.11.1
gKLim:0.99, gDLim:0.99, gFLim:0.99, gE:10, dmgType: energy.
Disclaimer/Publisher’s Note: The statements, opinions and data contained in all publications are solely those of the individual author(s) and contributor(s) and not of MDPI and/or the editor(s). MDPI and/or the editor(s) disclaim responsibility for any injury to people or property resulting from any ideas, methods, instructions or products referred to in the content.

