
Research on Optimization Design Strategies for Natural Ventilation in Living Units of Institutional Elderly Care Facilities Based on Computational Fluid Dynamics Simulation


Abstract
1. Introduction
1.1. Natural Ventilation Research
1.2. CFD Simulation Studies Based on Architecture
1.3. Research on Elderly Care Living Facilities
1.4. Research Objectives
2. Analysis of Natural Ventilation Requirements and Extraction of Typical Floor Plans
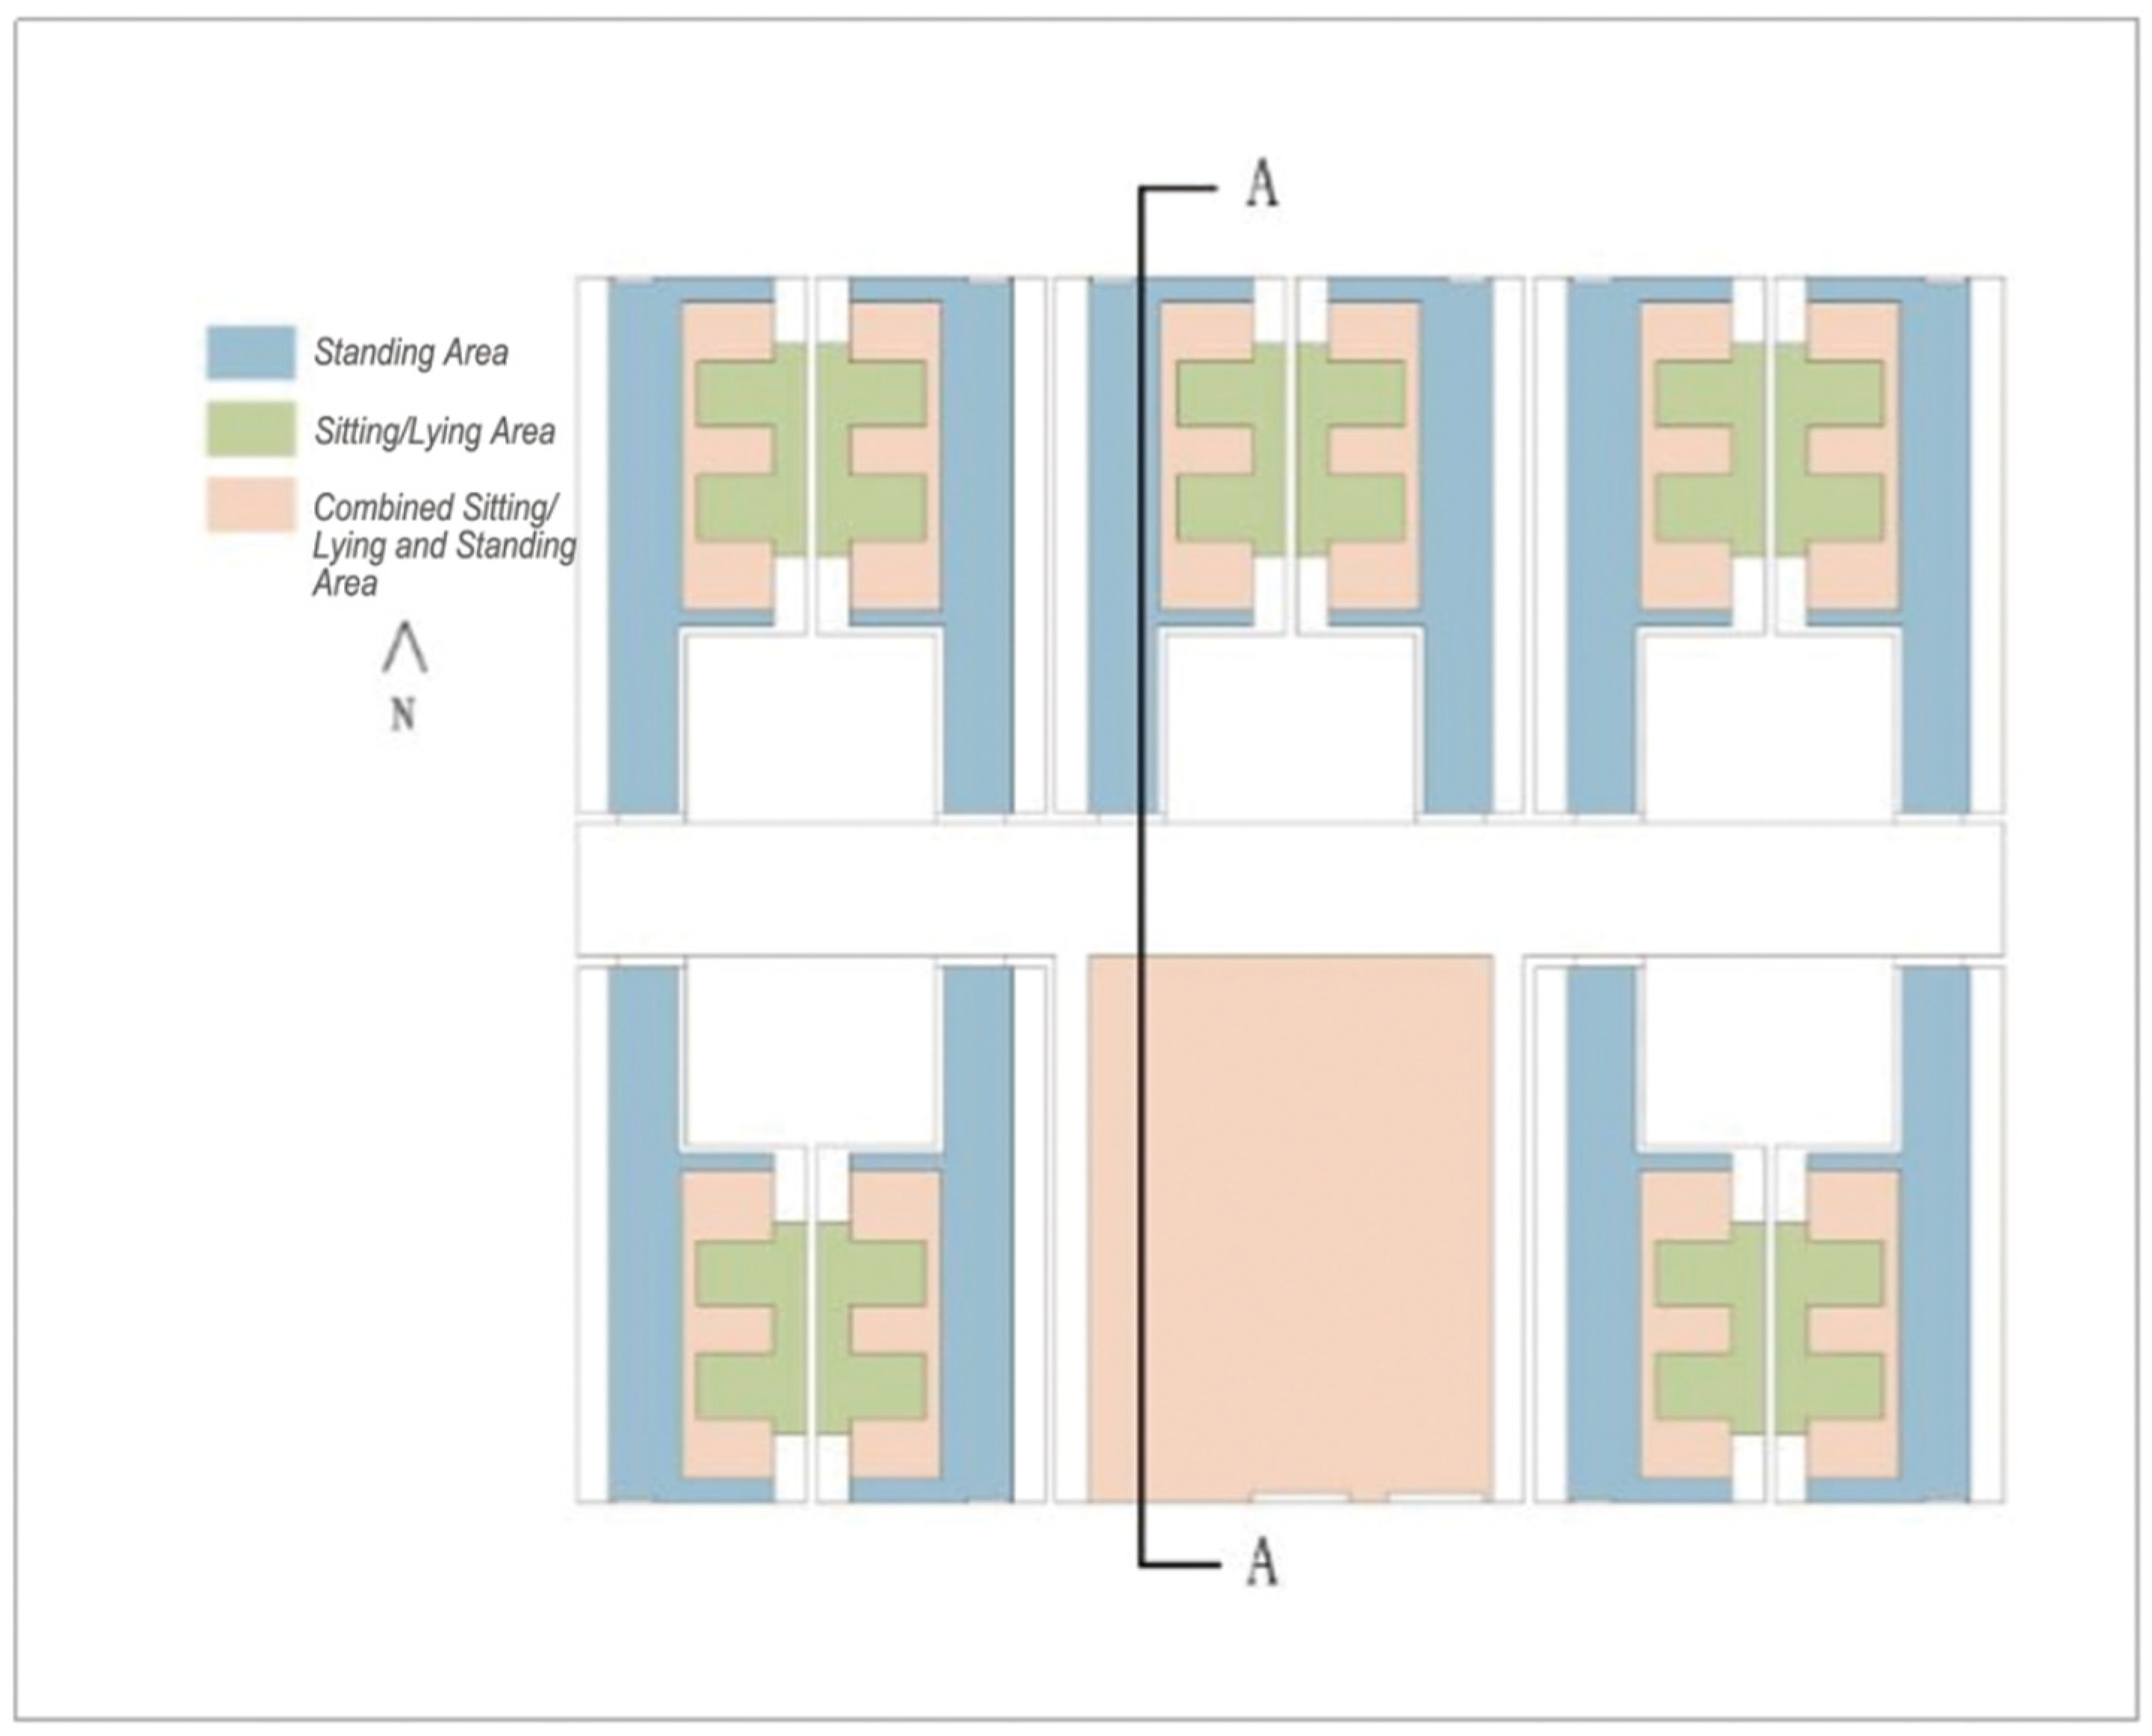
2.1. Analysis of Natural Ventilation Requirements
- (1)
- Regarding preference for natural ventilation, 100% of the elderly believe that opening windows effectively promotes air circulation, and 97.3% prefer natural ventilation over mechanical ventilation systems. Reasons include discomfort from the cool air of mechanical systems, a personal preference for opening windows, and unfamiliarity with operating mechanical ventilation systems.
- (2)
- Usage of Mechanical Ventilation Systems: Although all elderly residents use mechanical ventilation systems for half an hour daily, this process is managed by staff and the systems are turned off before the residents return to their rooms. In summer, 26% of the elderly extend the use of mechanical ventilation systems to one hour, especially during rainy or humid conditions when natural ventilation is insufficient.
- (3)
- Window- and Door-Opening Habits: In summer, most elderly residents keep balcony doors open all day, even with curtains drawn, as it feels comfortable and does not hinder rest and communication. Some elderly residents close windows and doors at night, and a very small number keep them open for less than six hours due to physical discomfort, mental illness, or mobility issues, relying on staff to manage window operations. In winter, almost all elderly residents open windows for 0–6 h daily, mainly in the morning and after naps, to refresh the air.
2.2. Typical Layout Construction of Elderly Care Living Facilities
- (1)
- Key Influencing Factors in Overall Building Layout:
- (a)
- Traffic Flow Organization: A rational layout ensures comfortable movement for residents and prevents corridors and public areas from becoming barriers to air circulation.
- Functional Zone Division: Scientifically separating living areas from rest areas can manage and guide airflow, enhancing natural ventilation.
- (b)
- Balcony Configuration: Balconies provide additional resting space and are crucial for promoting air circulation. Their design should consider orientation, size, and shading to enhance ventilation.
- (c)
- Room Organization and Air Convection: Room and public space layouts should promote natural air circulation and avoid dead zones. This involves considering aerodynamic characteristics when designing room positions and the orientation of doors and windows.
- (2)
- Main Influencing Factors in Individual Room Layouts:
- (a)
- Room Size and Layout: Proper room dimensions and layouts significantly enhance air convection and temperature control, improving ventilation efficiency.
- (b)
- Door and Window Design: The size, type, and placement of windows and doors directly affect air entry and circulation patterns. Cross-placed windows, for example, can greatly promote cross-ventilation.
- (c)
- Bathroom Ventilation: Proper ventilation design in bathrooms is crucial for overall air quality. Effective exhaust facilities and their placement can prevent humidity and odors from spreading to other areas.
- (3)
- Study Methodology
- (4)
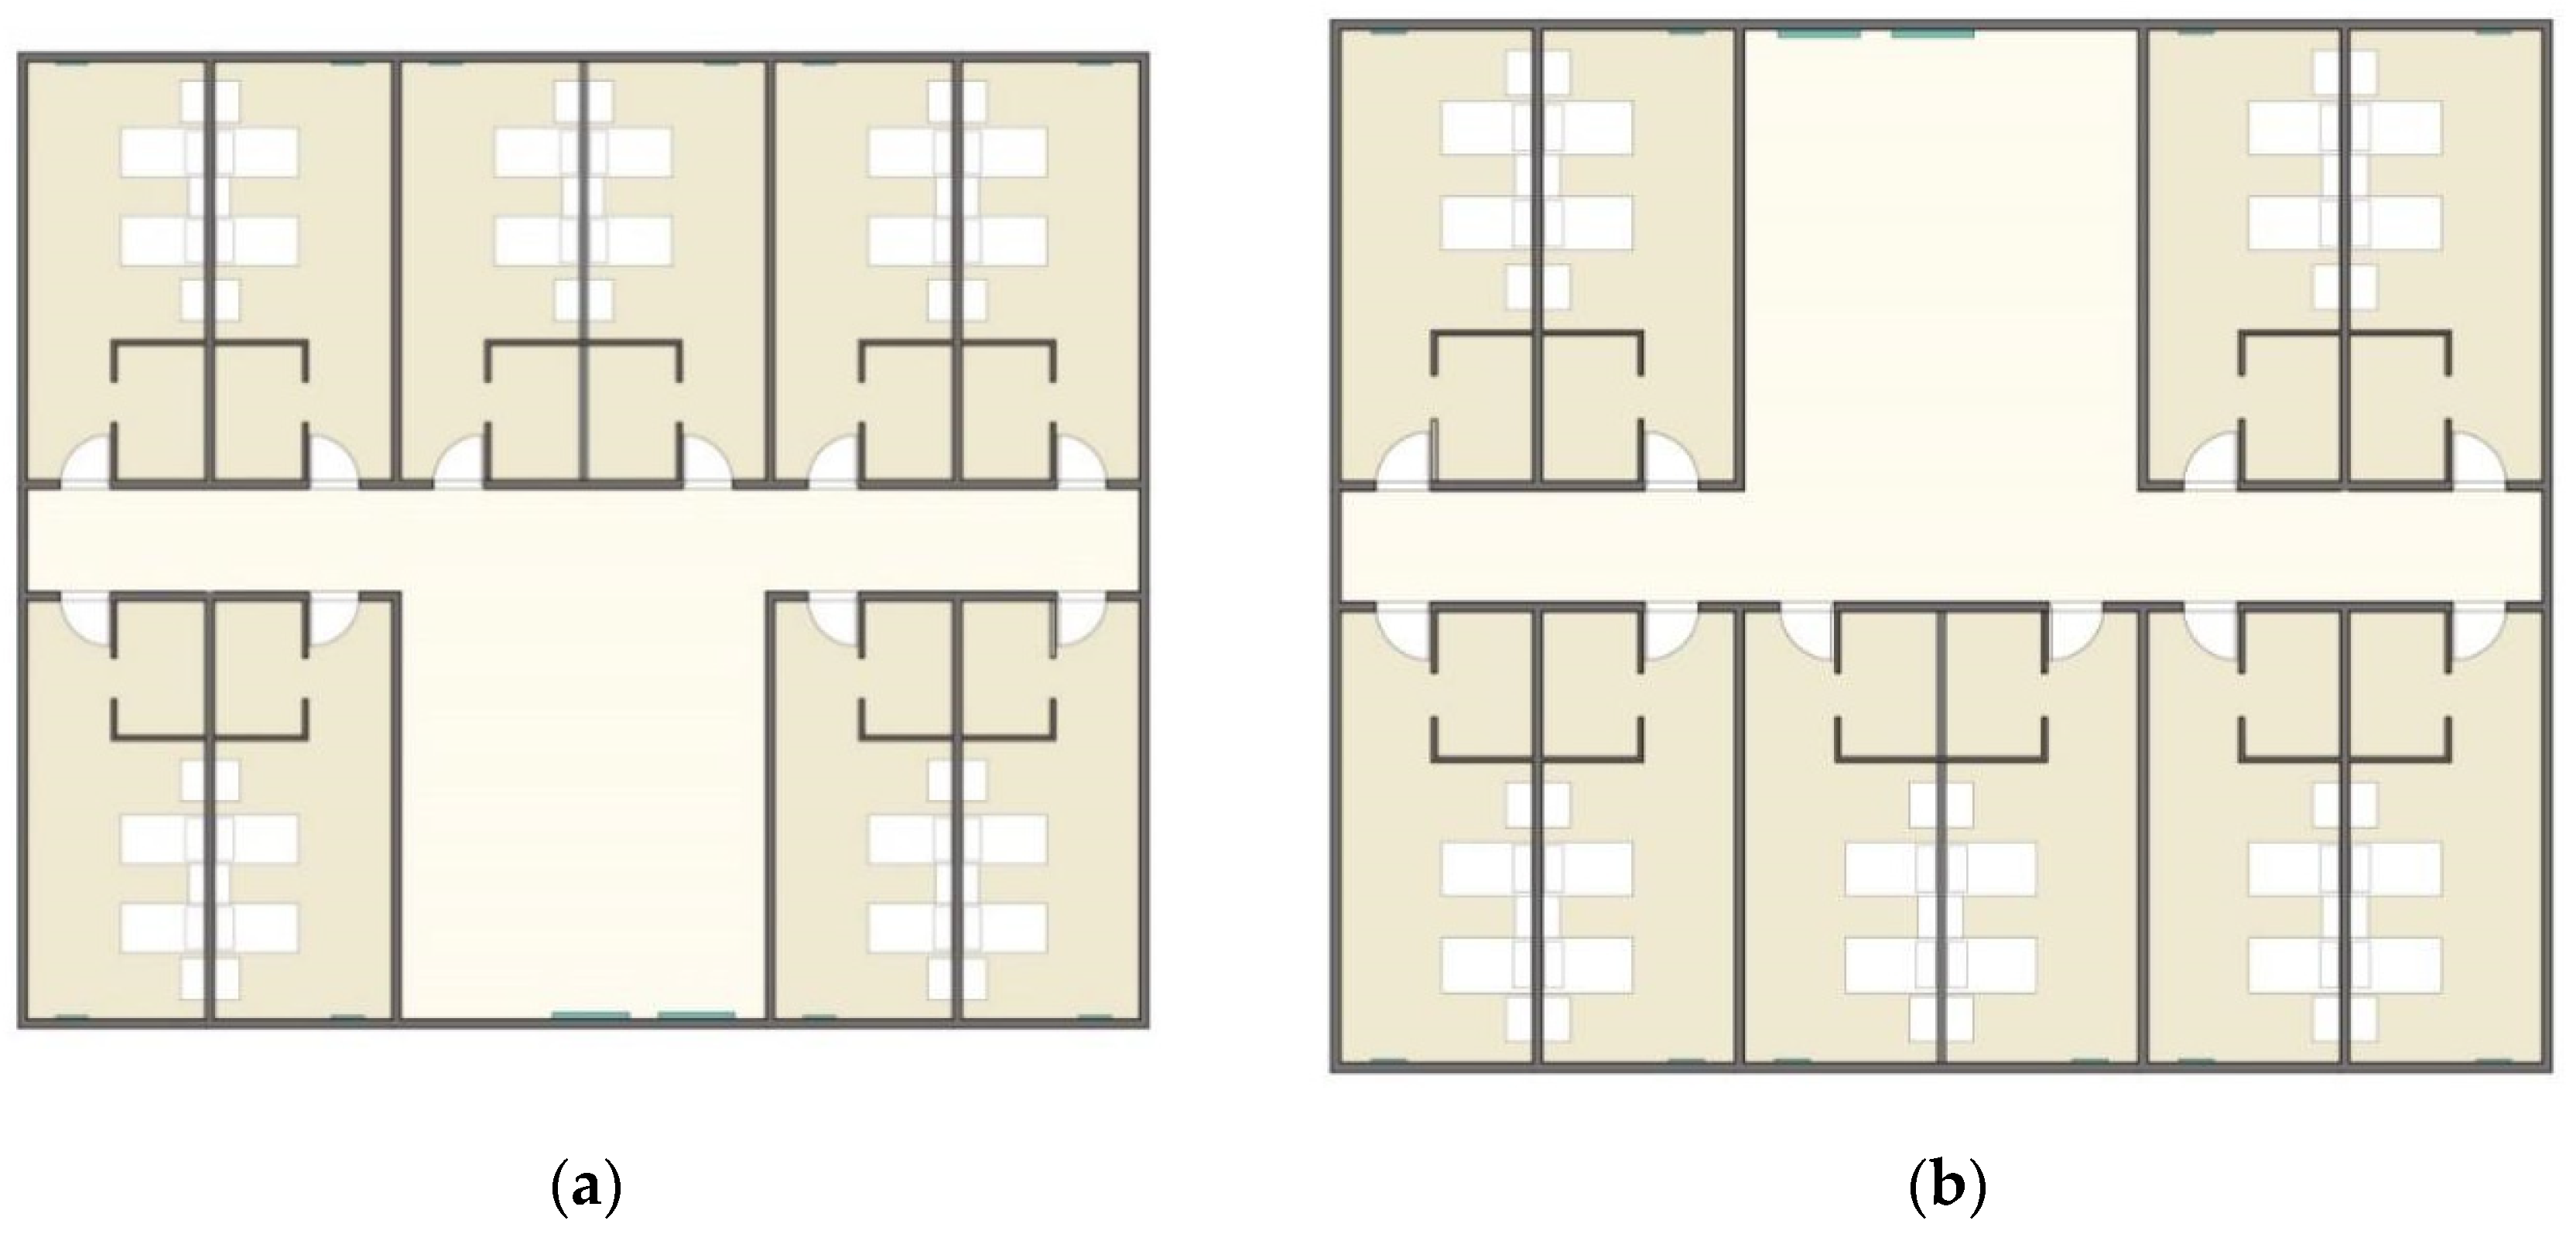
- Findings and Typical Floor Plans
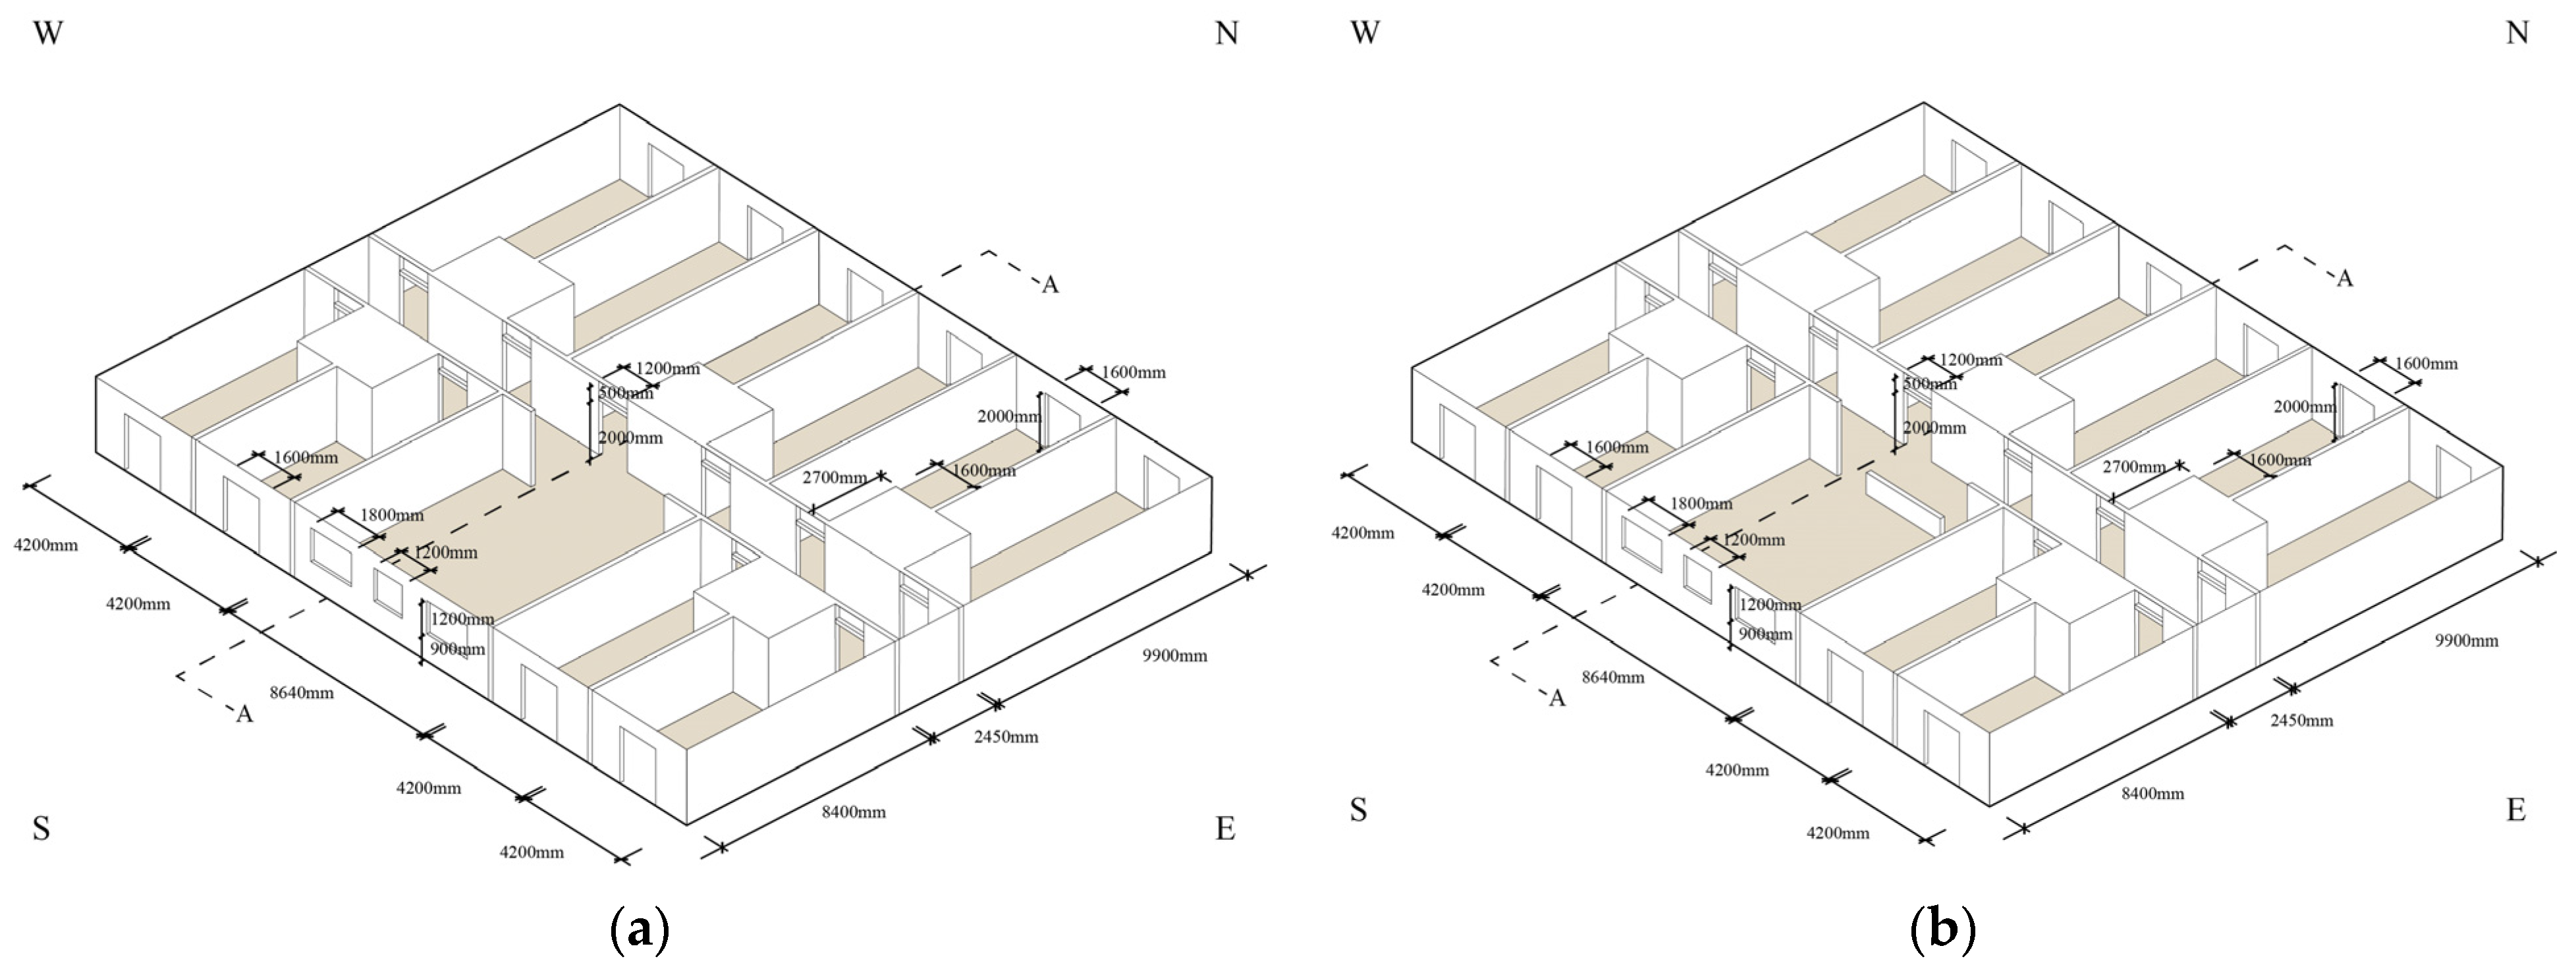
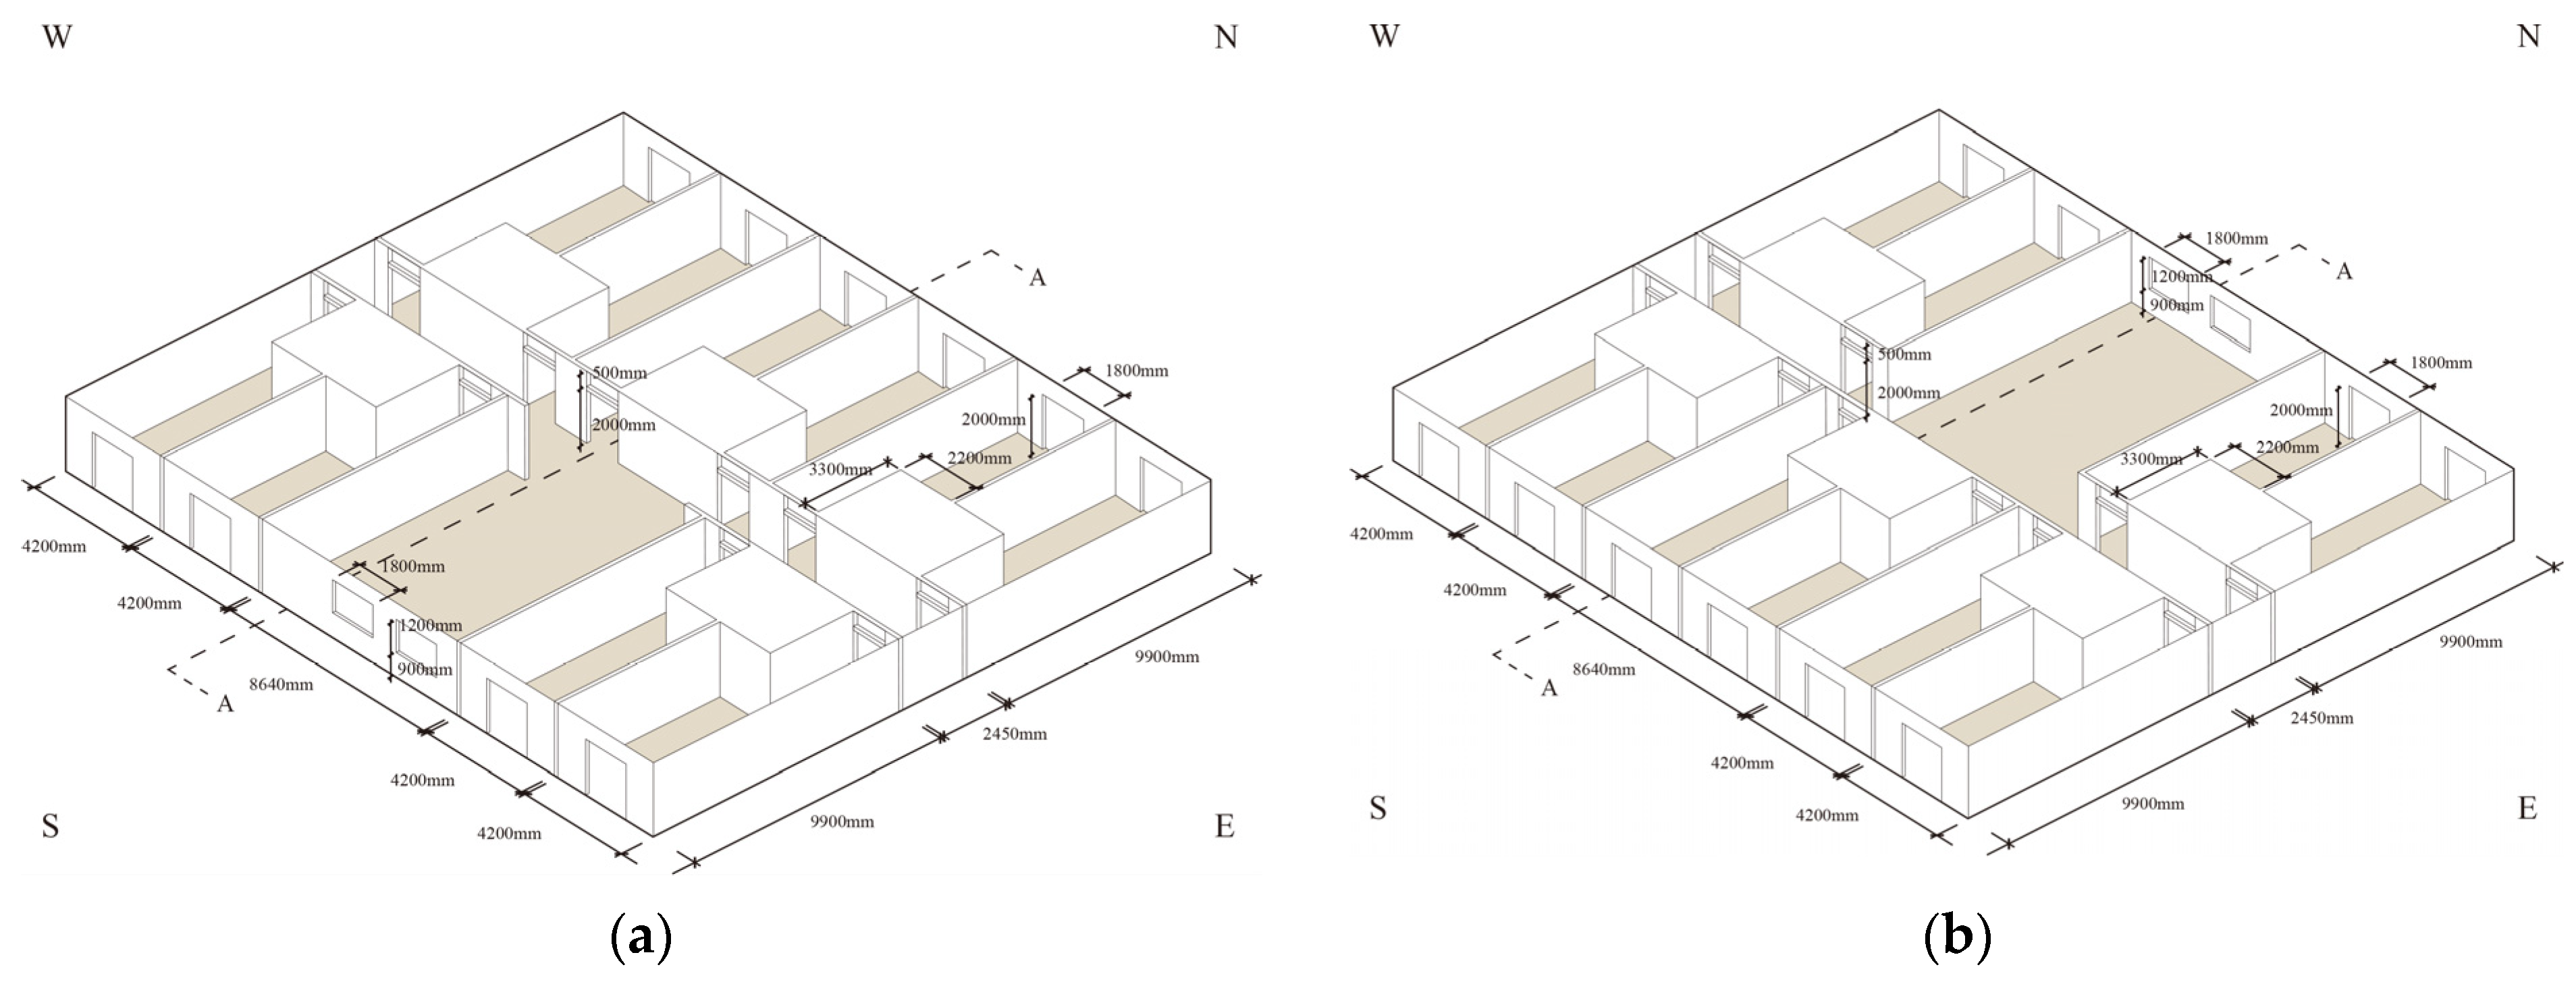
- (a)
- Living rooms on the south side with double rooms on both sides.
- (b)
- Living rooms on the north side with double rooms on both sides.
3. Numerical Model of Indoor Wind Environment under Natural Ventilation
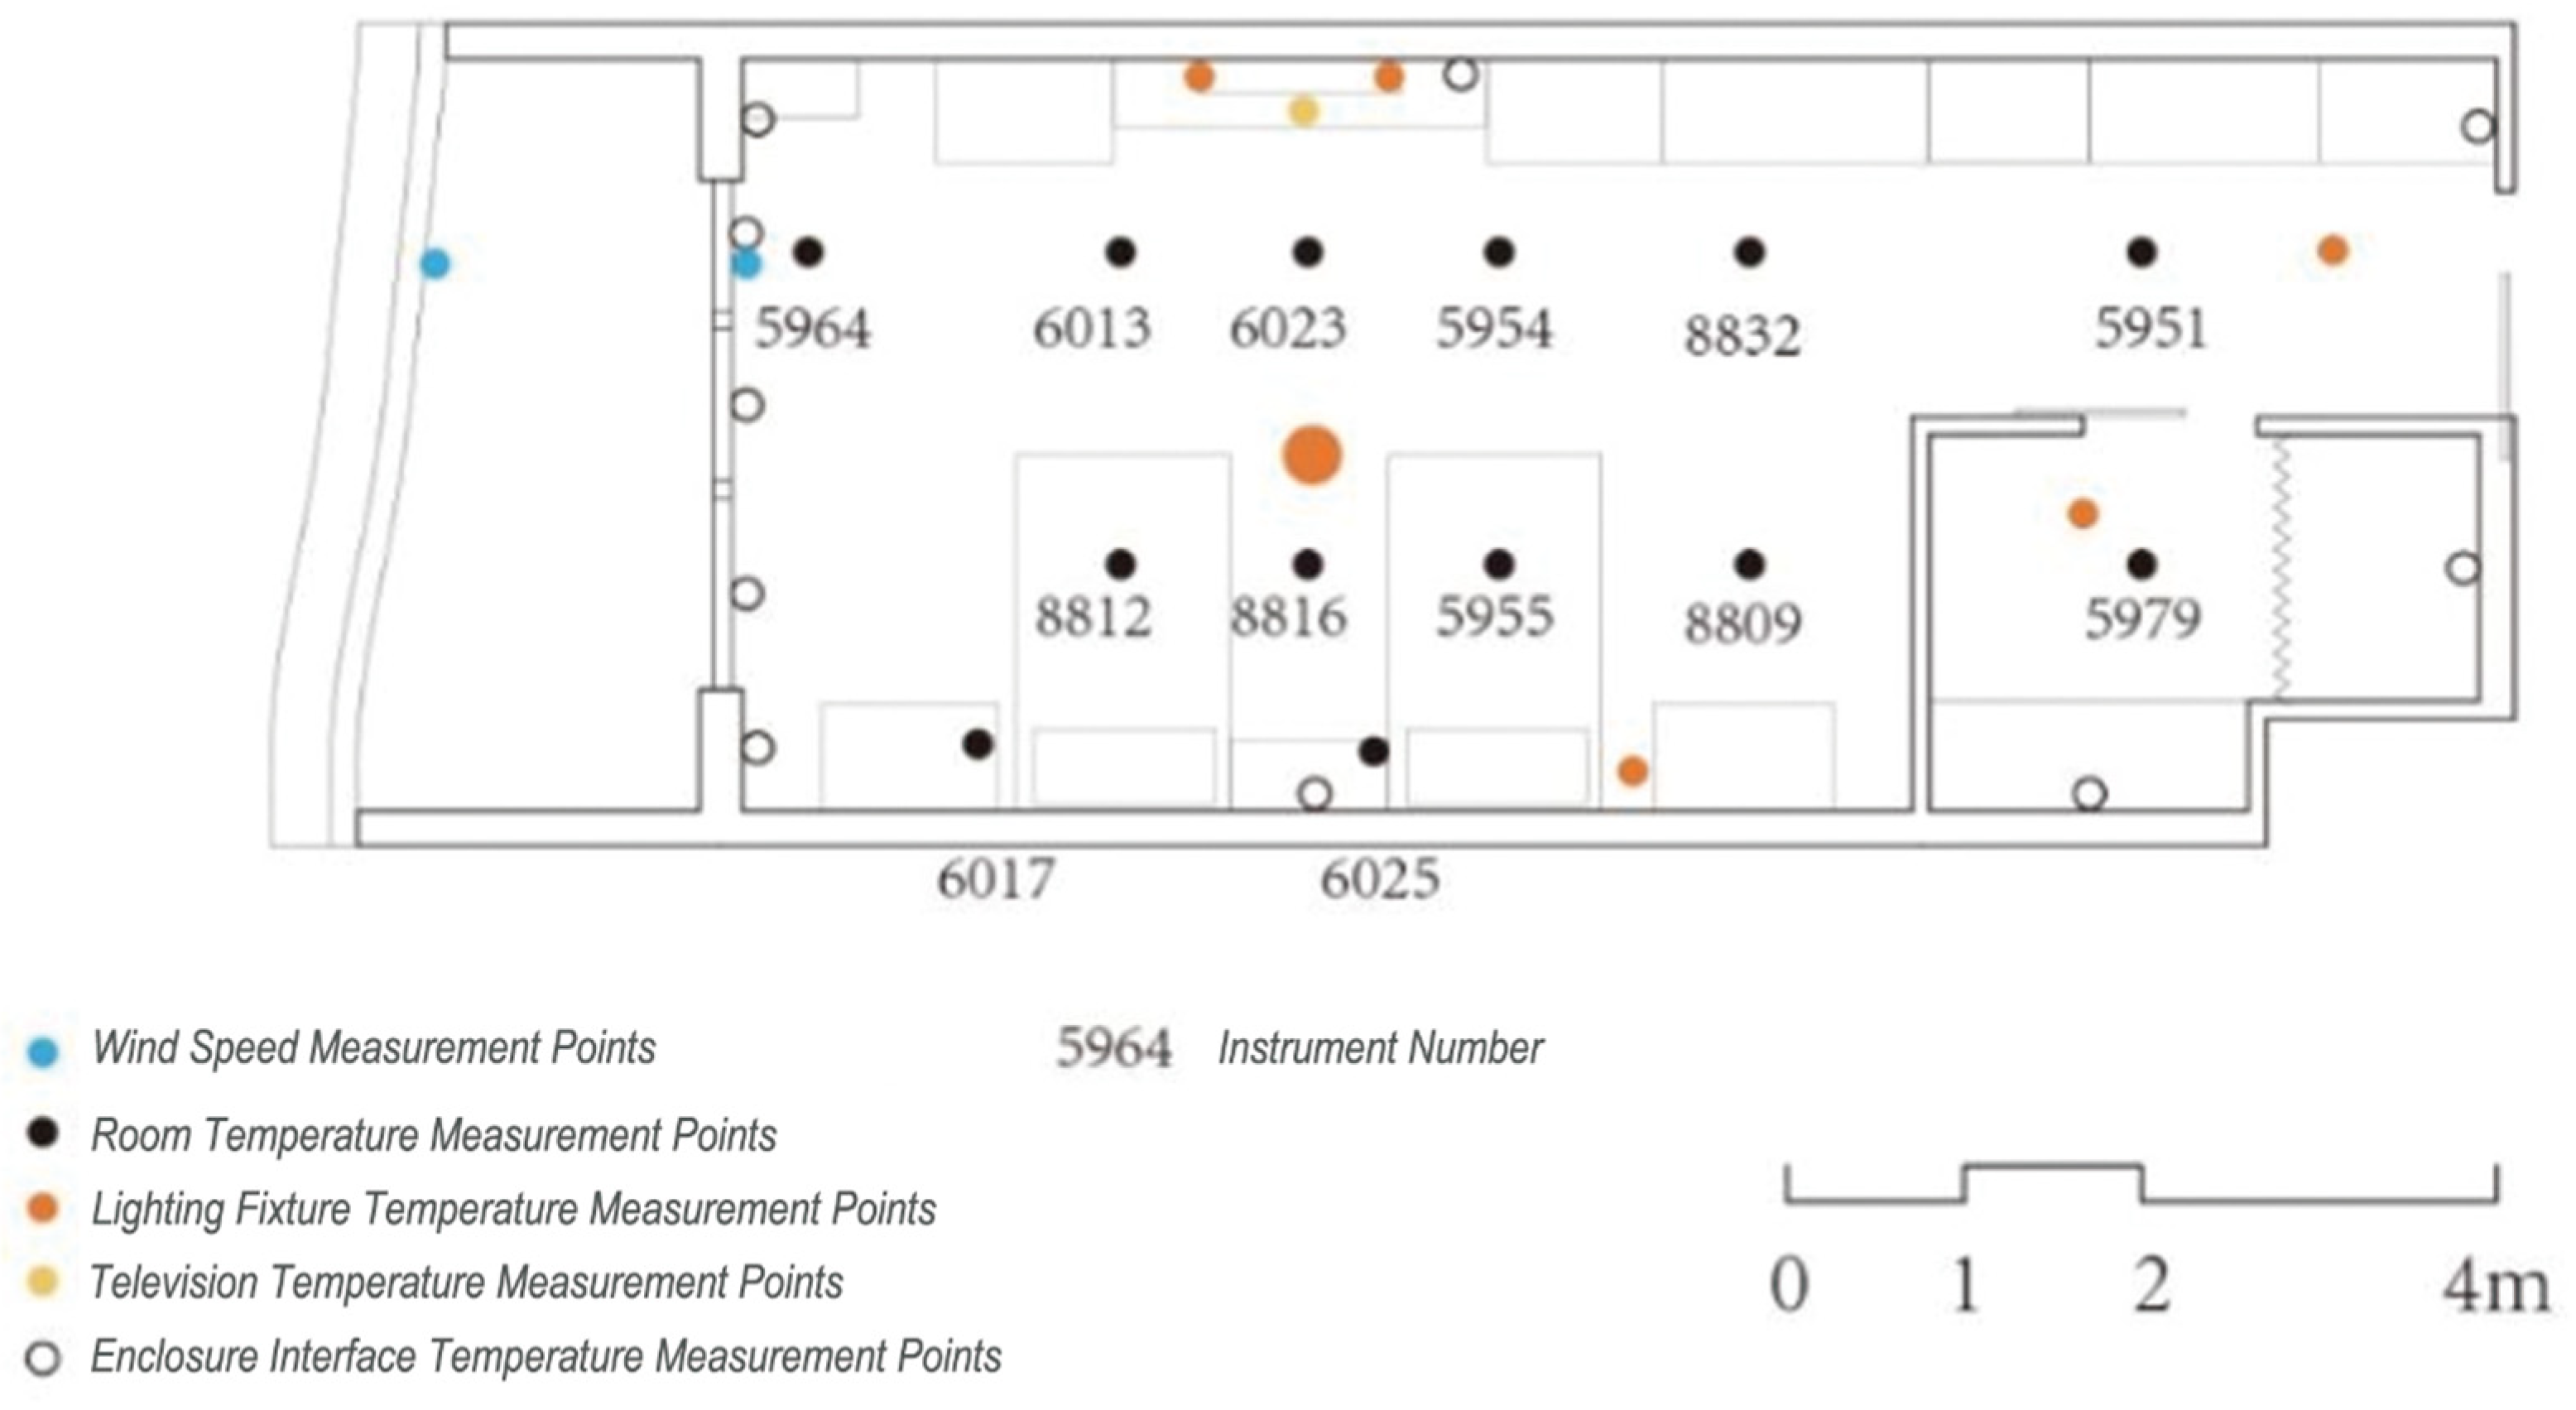
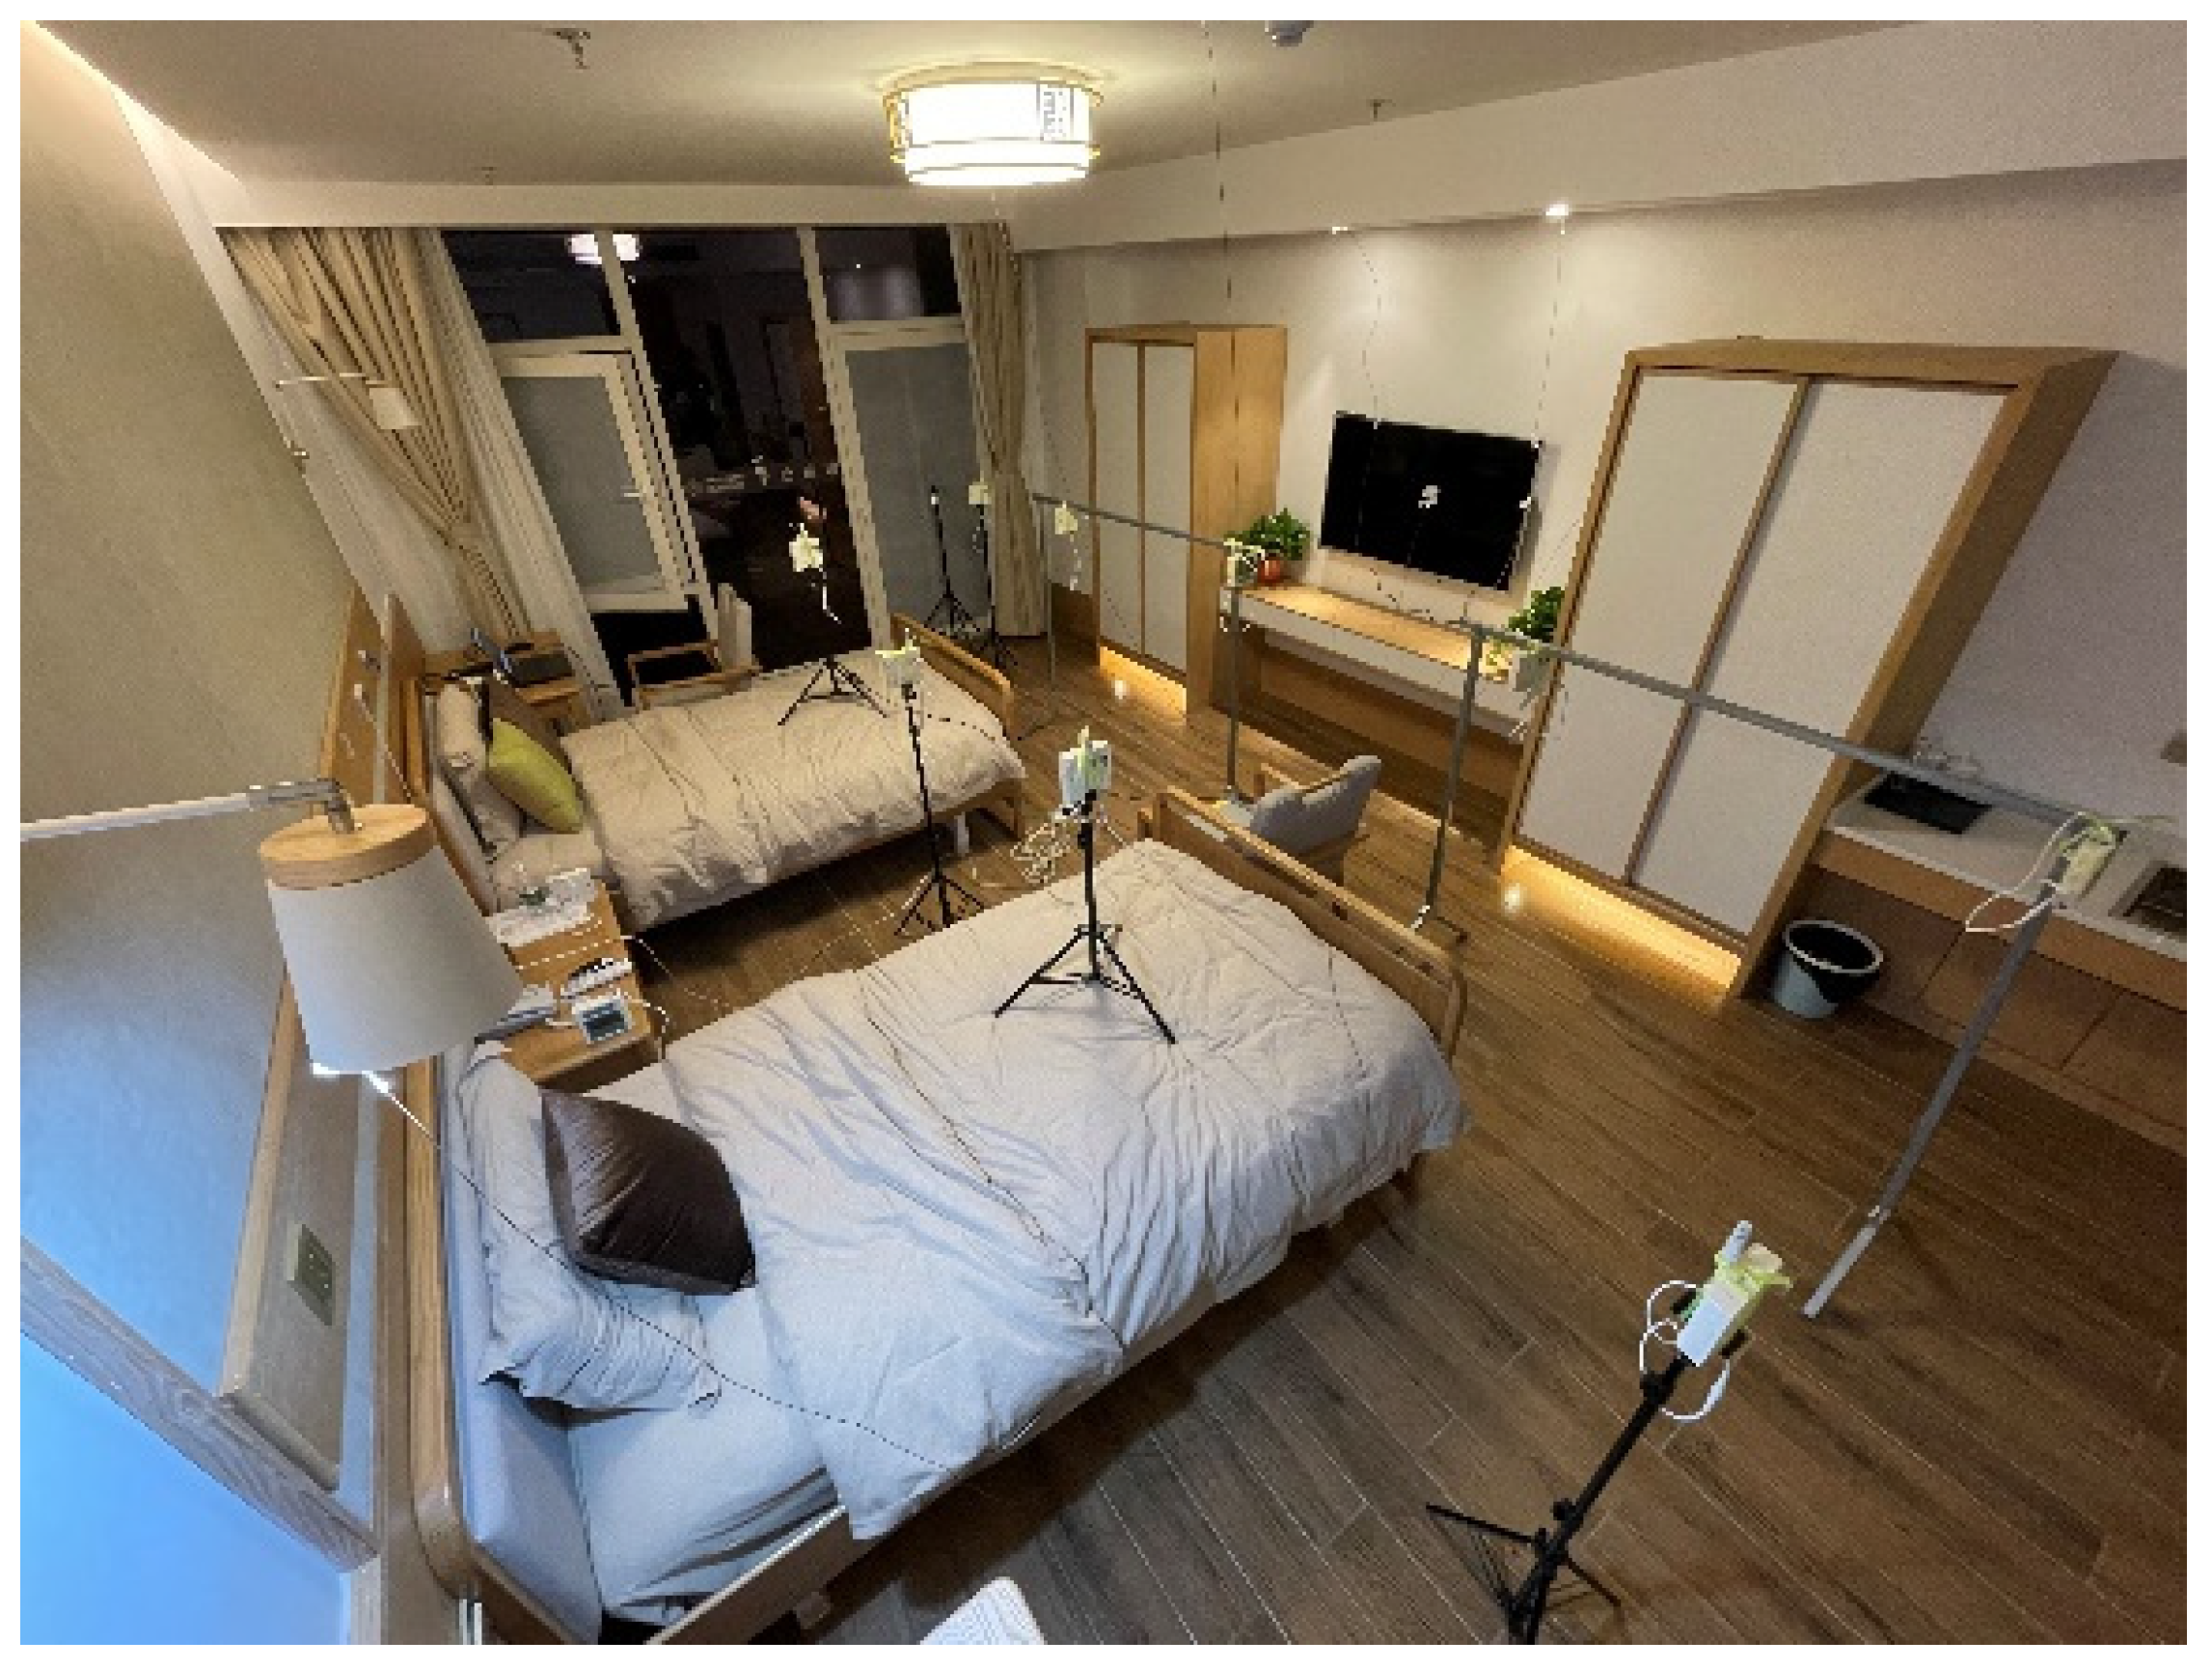
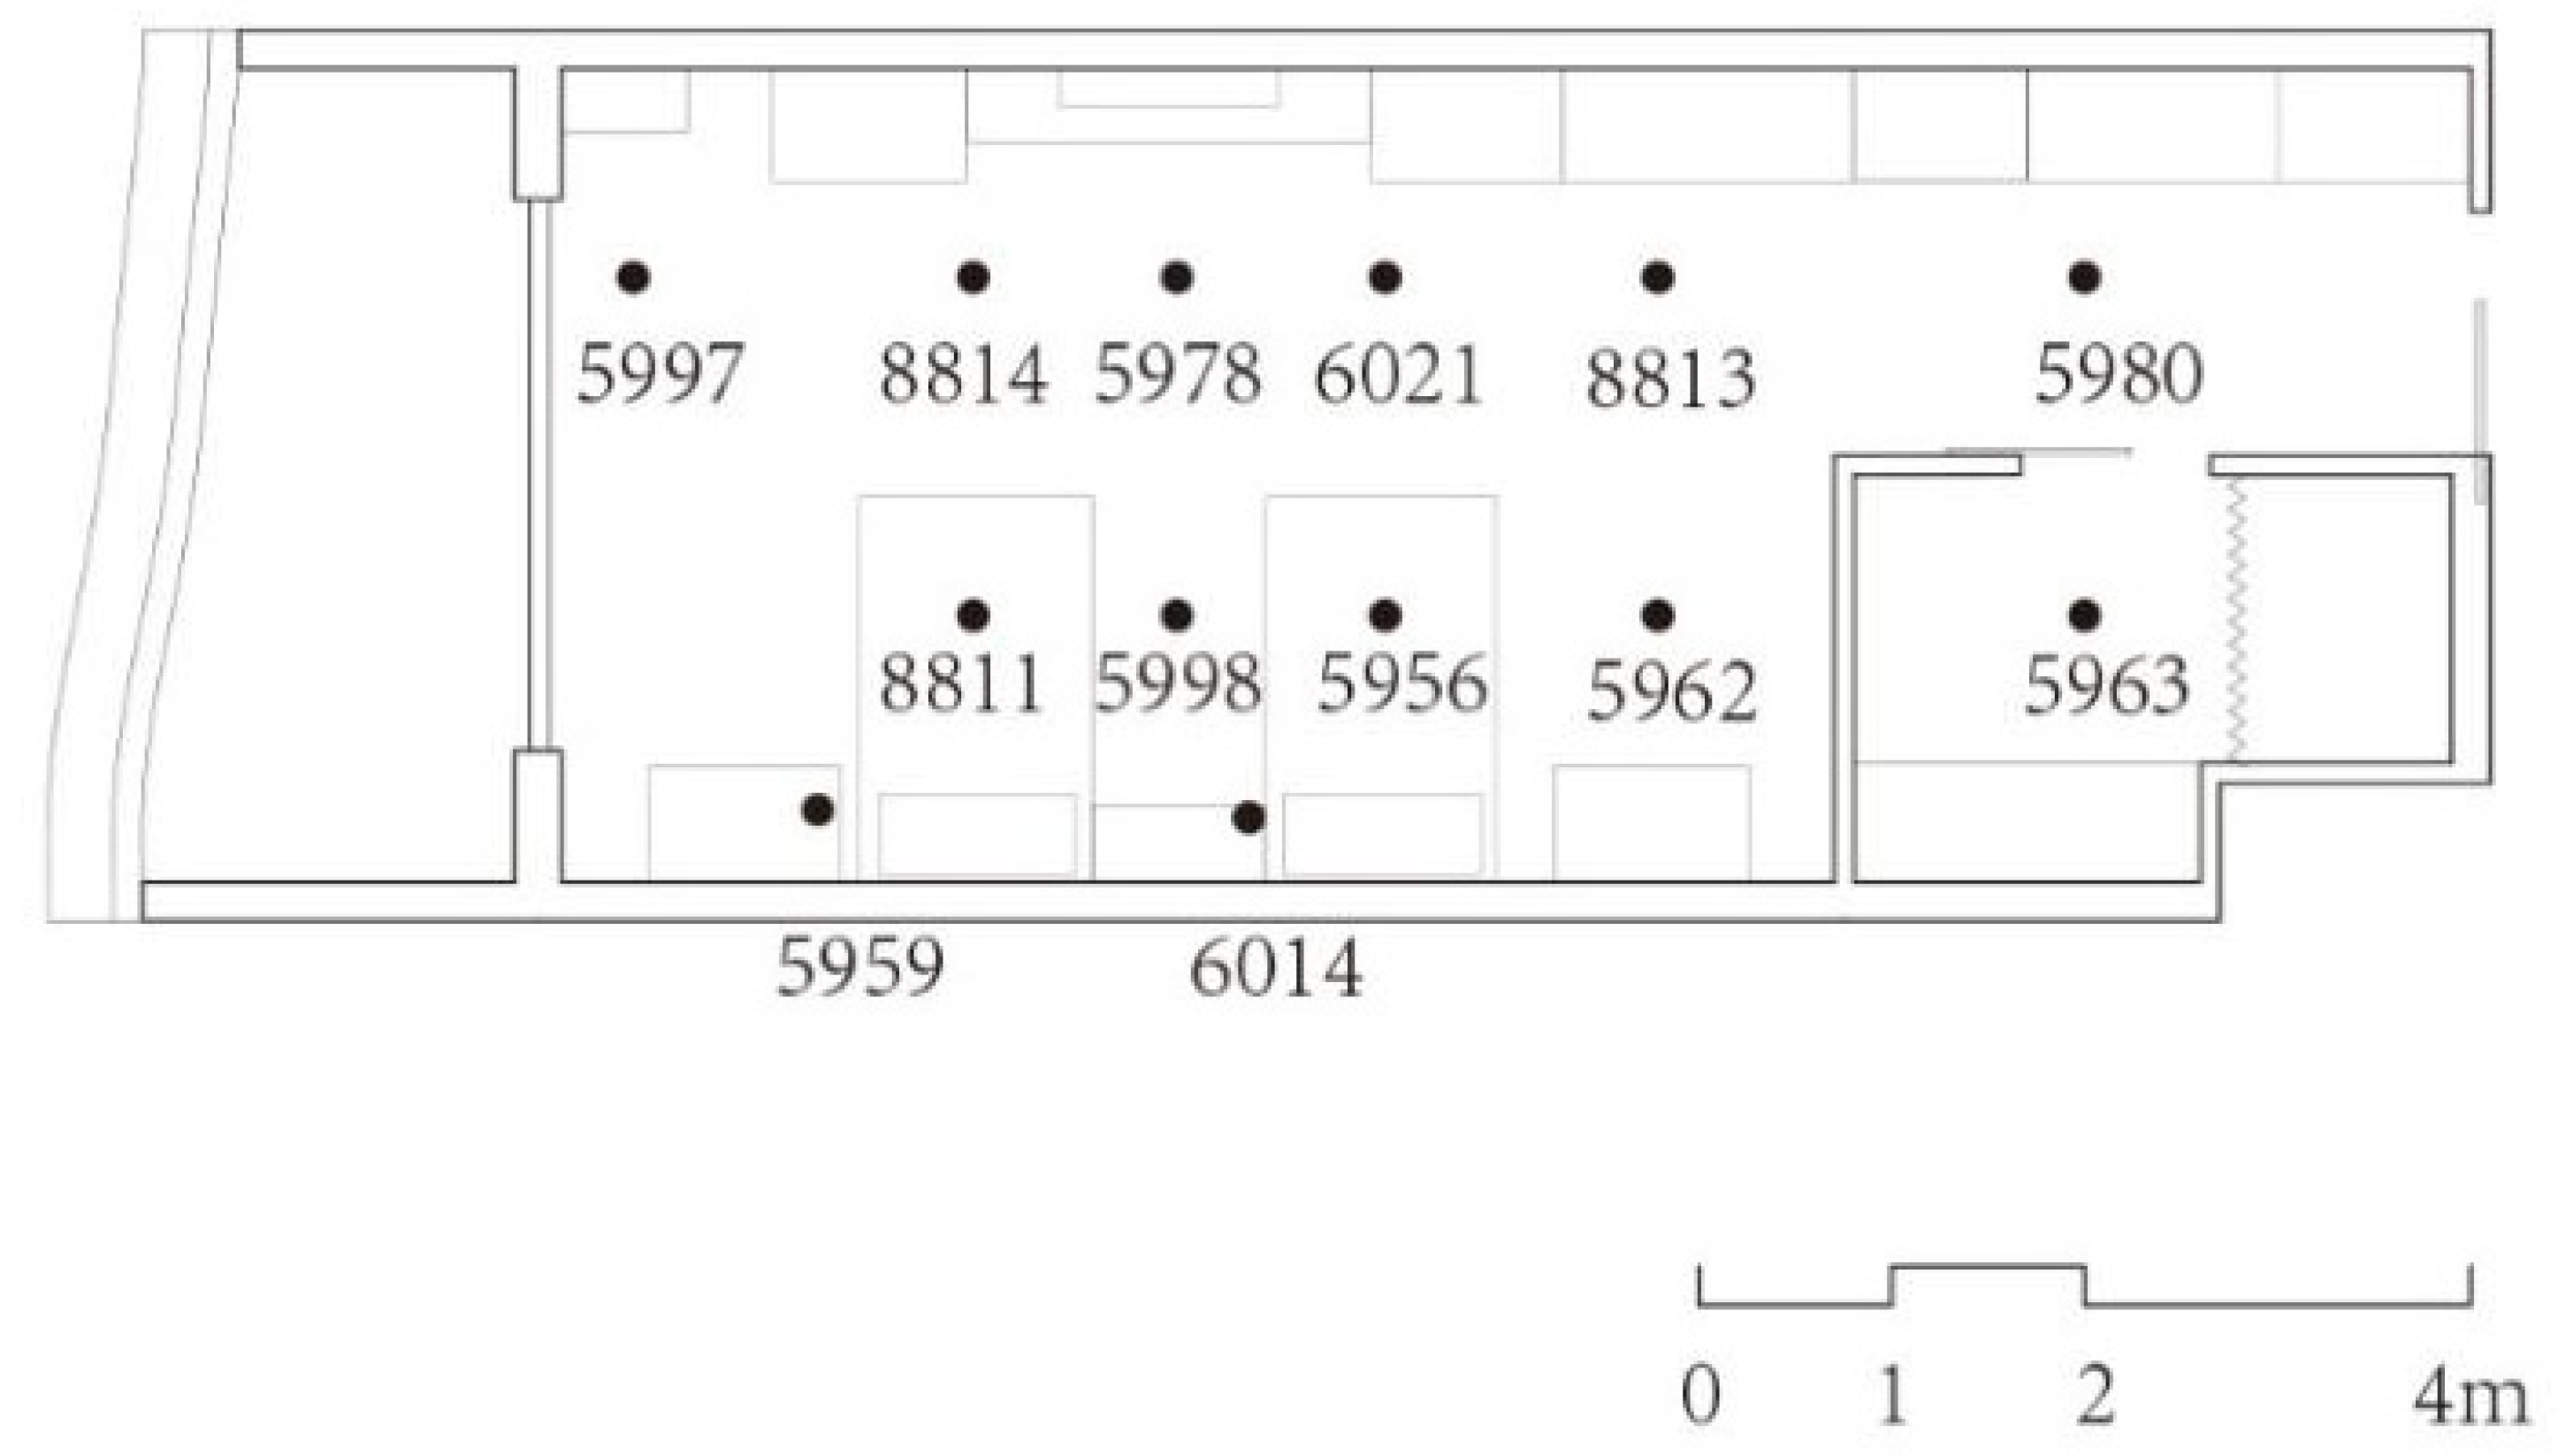
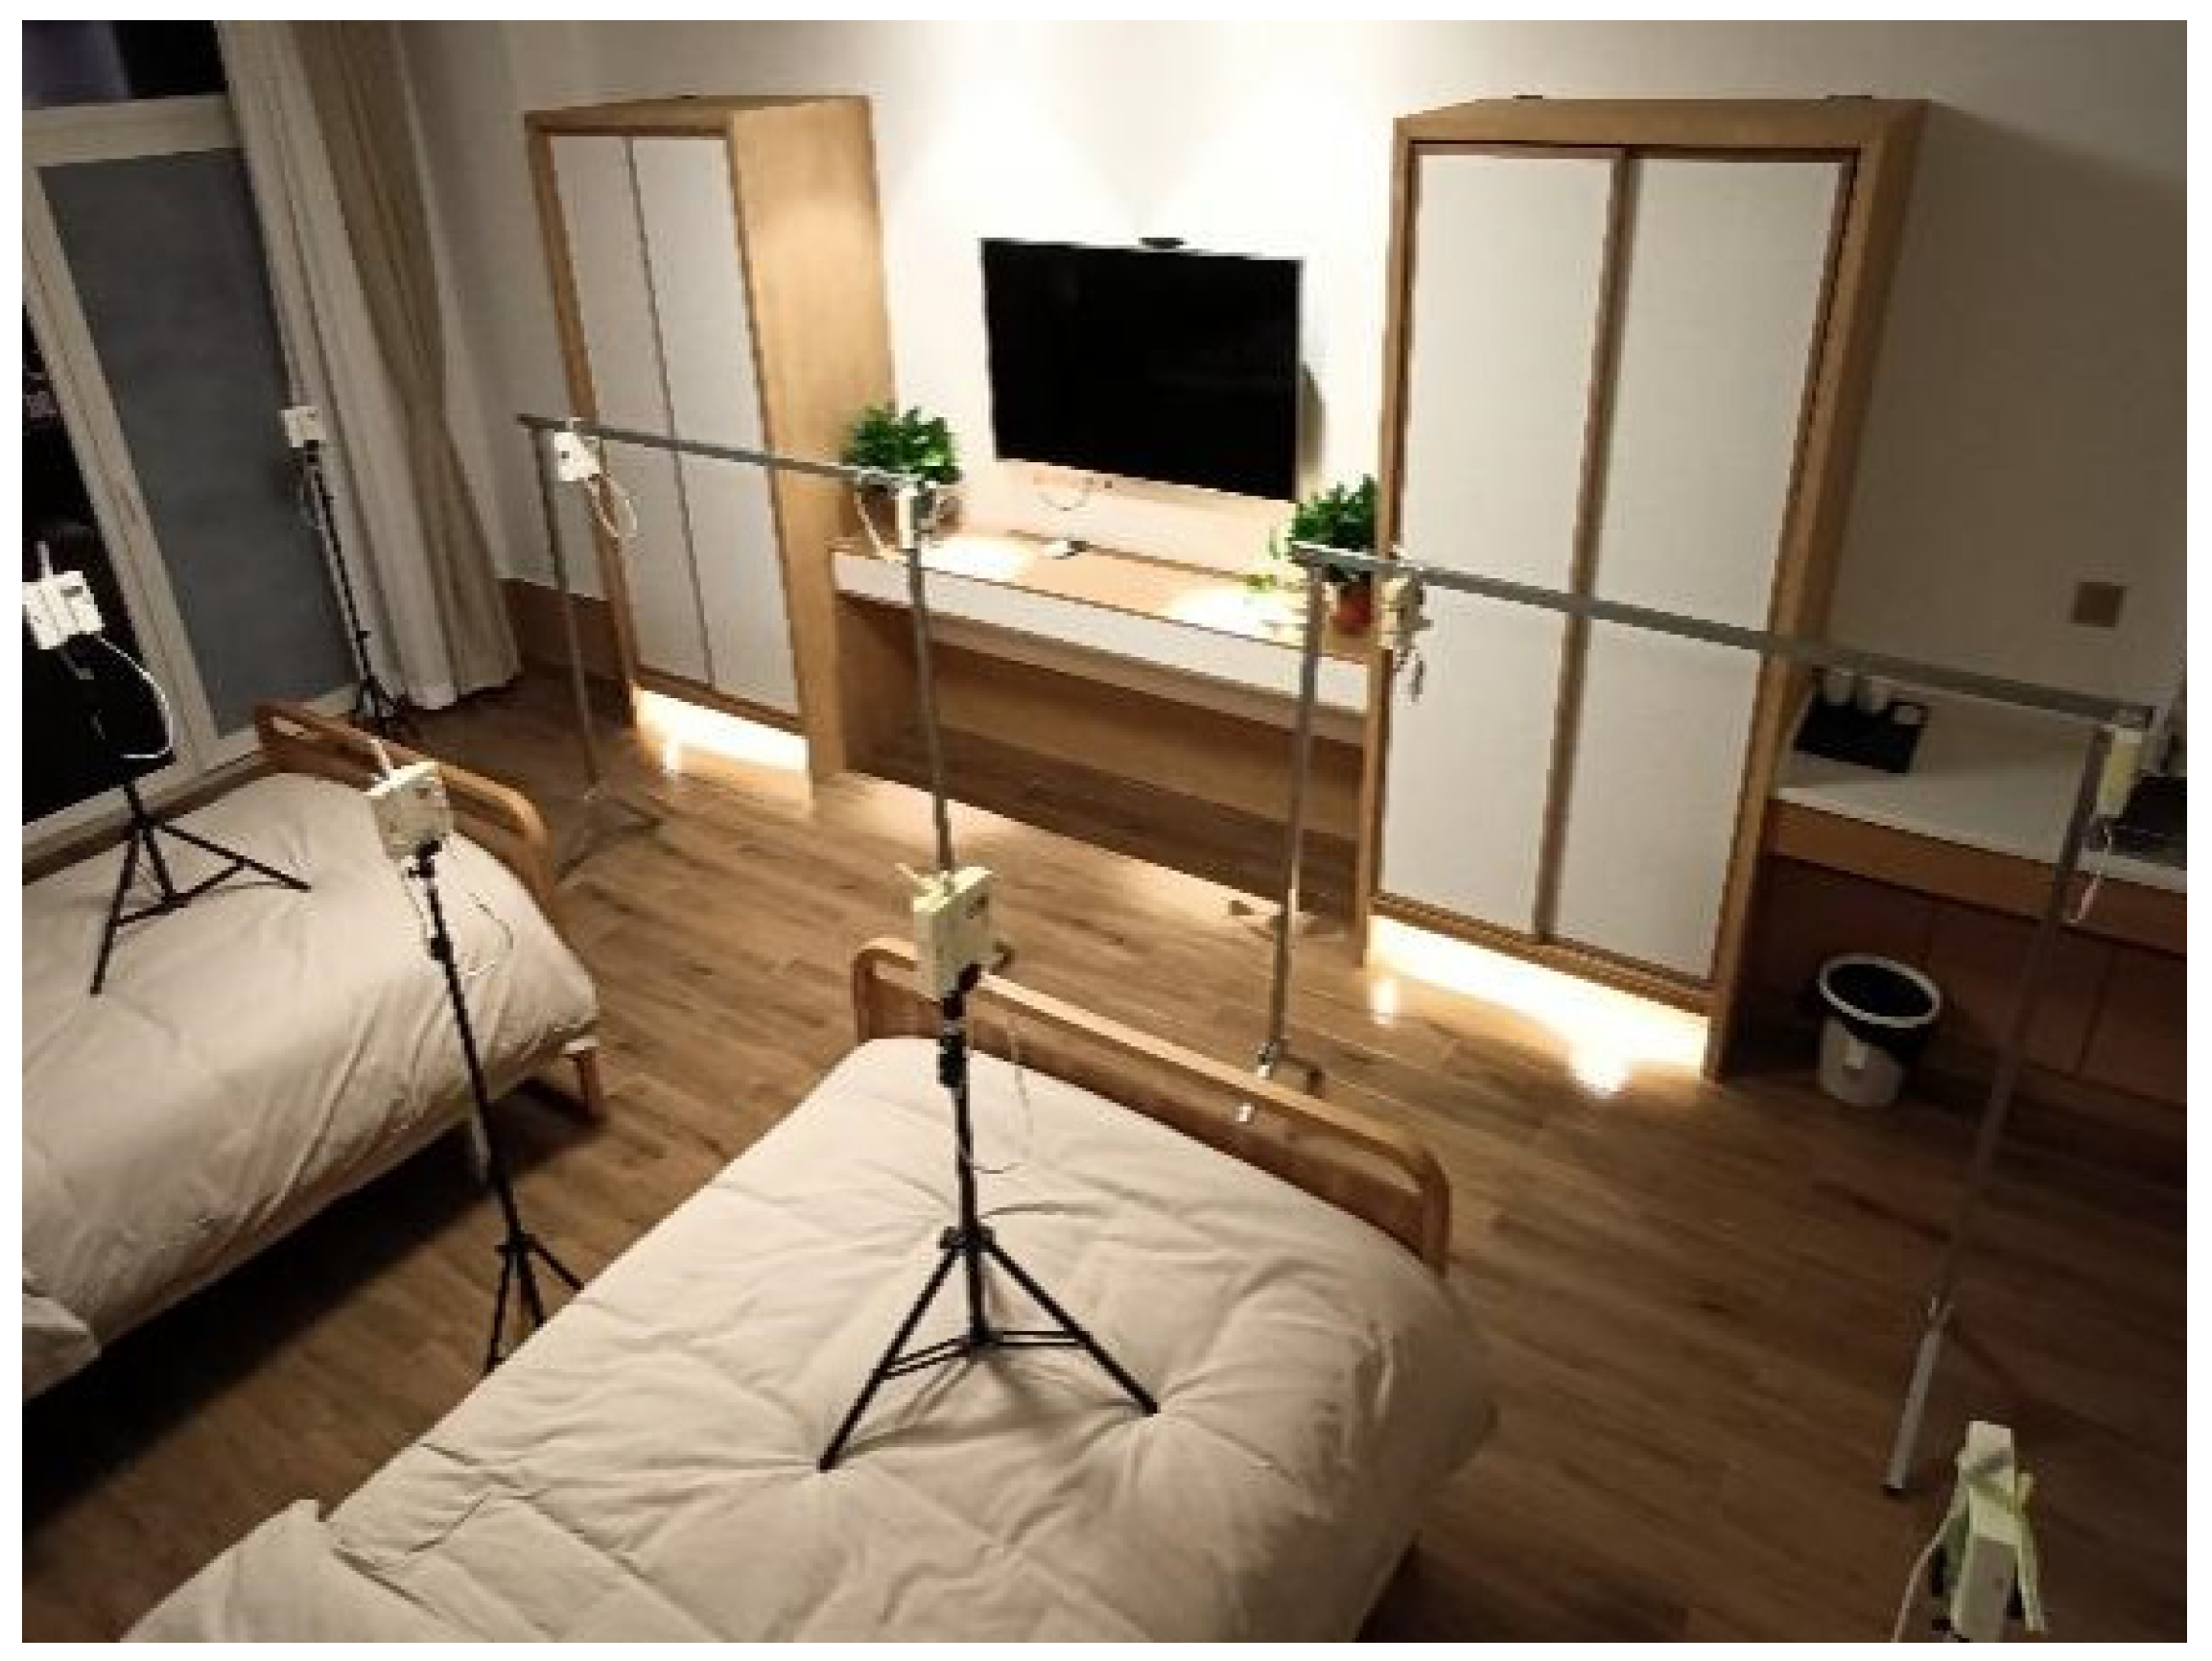
3.1. Measurement Environment and Methods
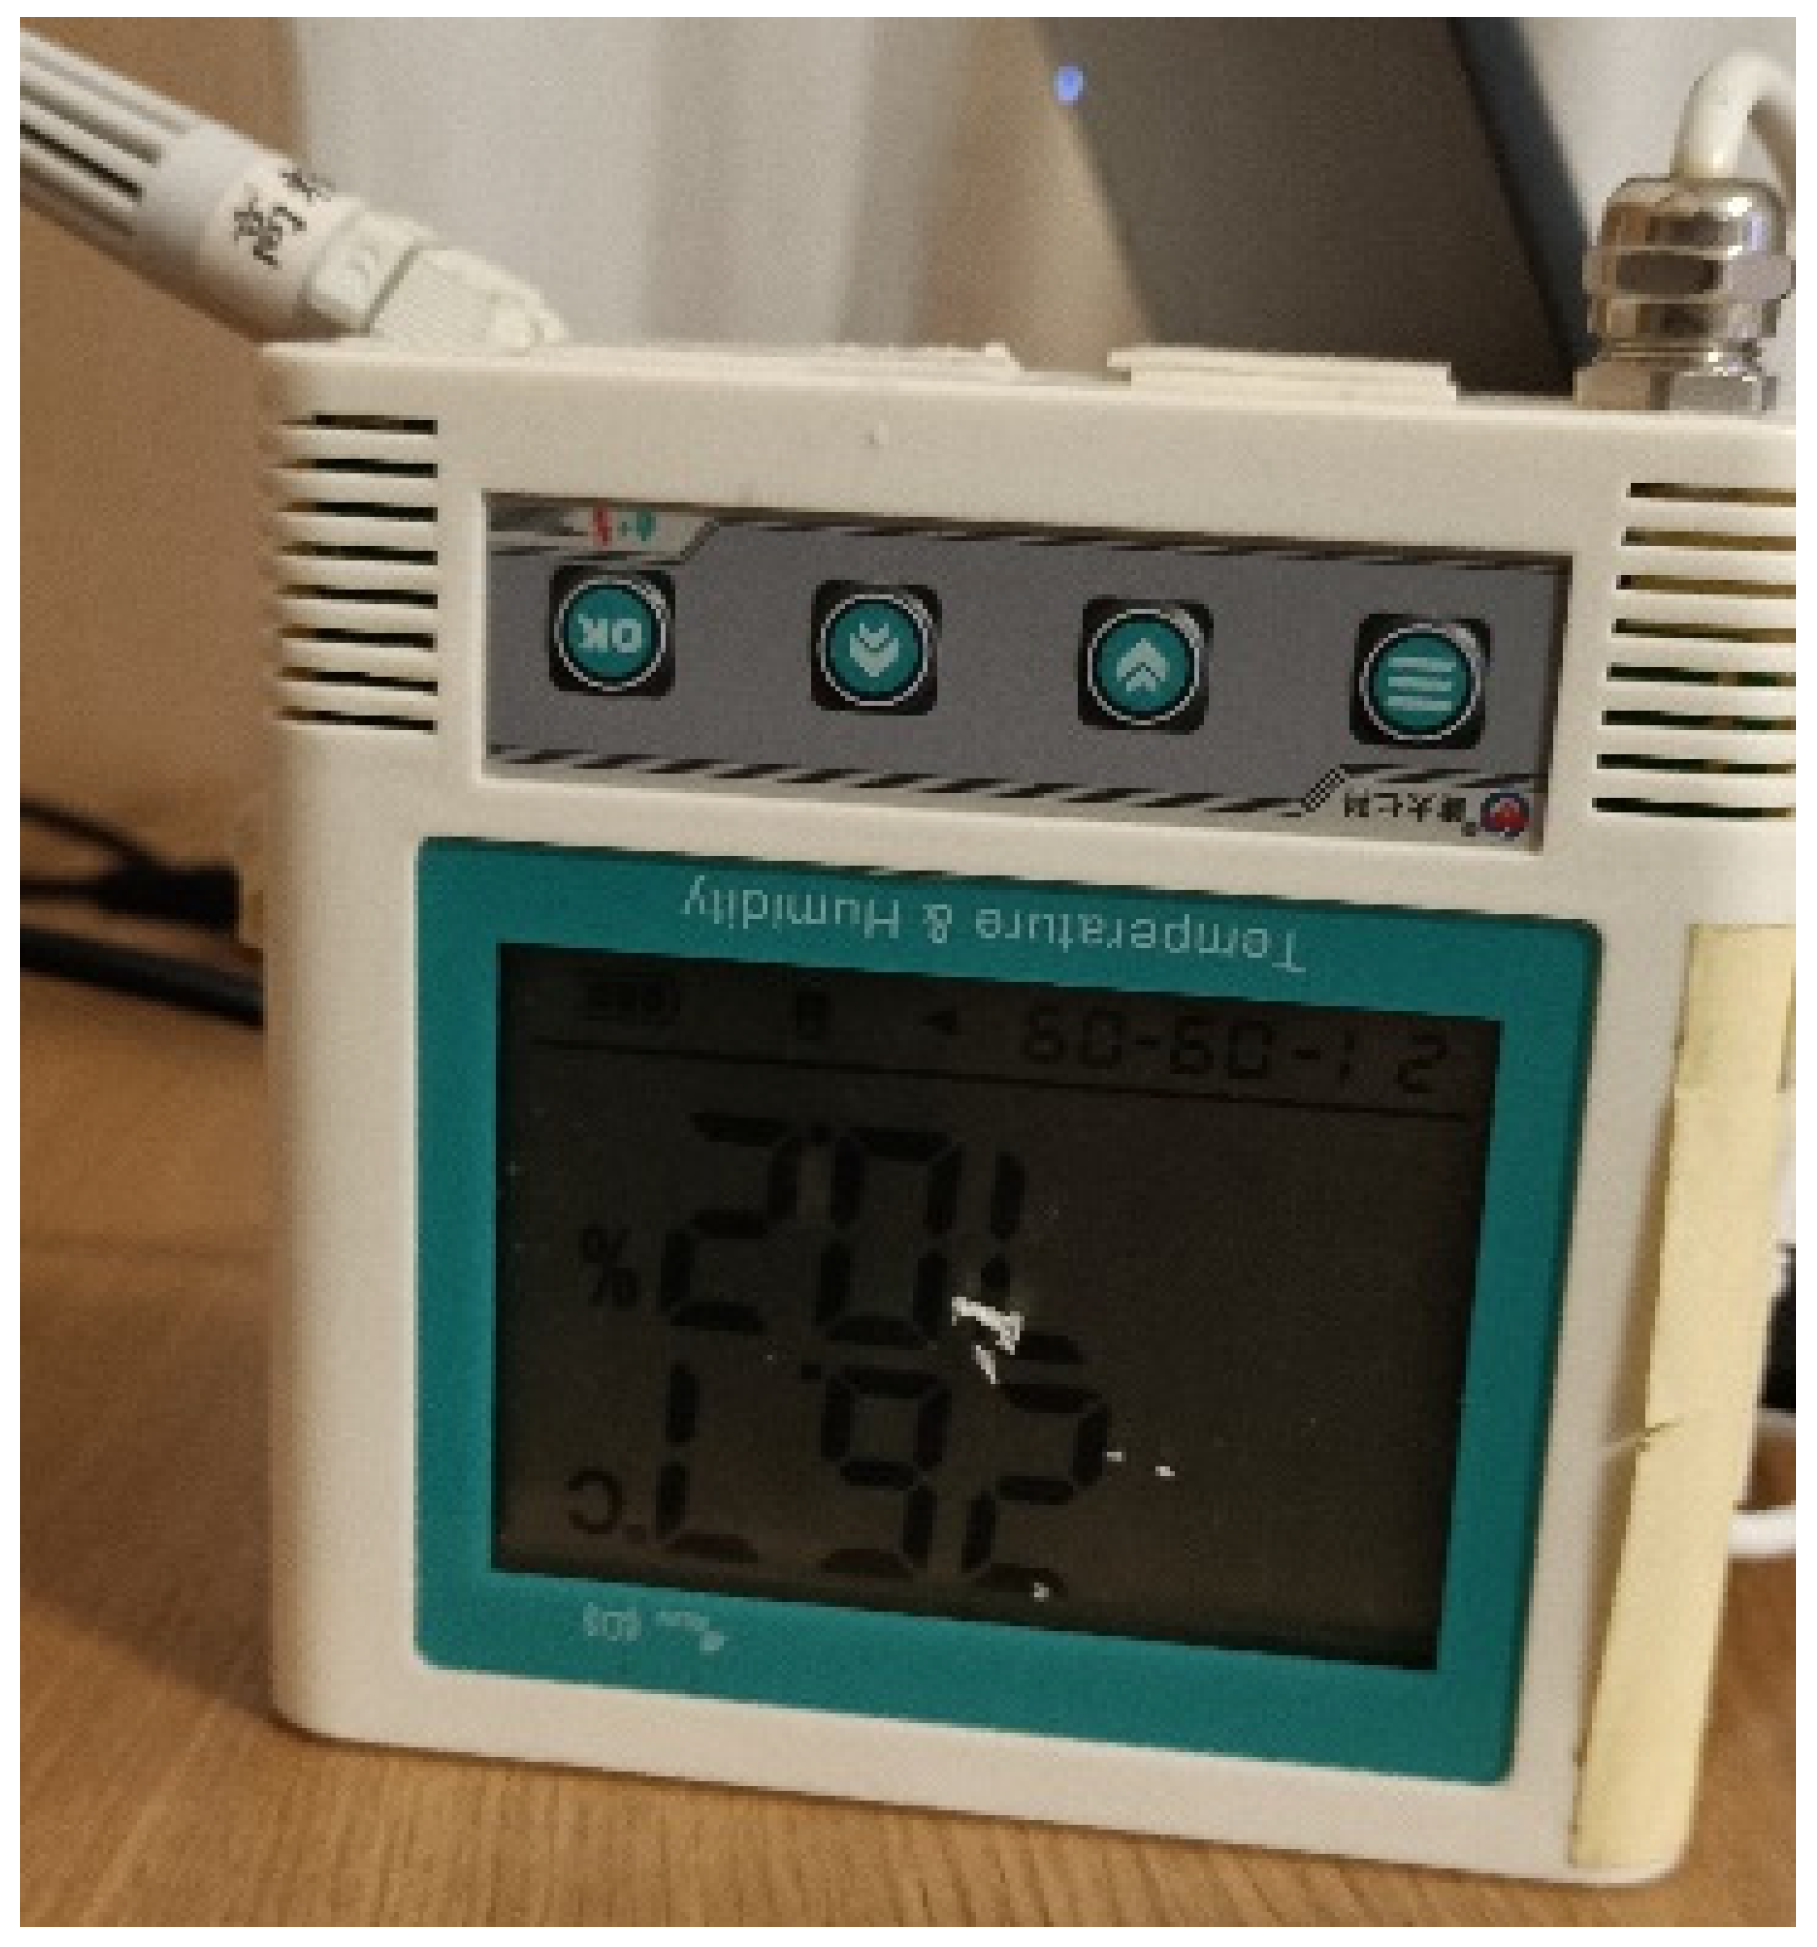
- (1)
- COS-03 extension-type temperature and humidity sensor (Figure 6) for indoor measurements at a height of 1.1 m, recording every minute;
- (2)
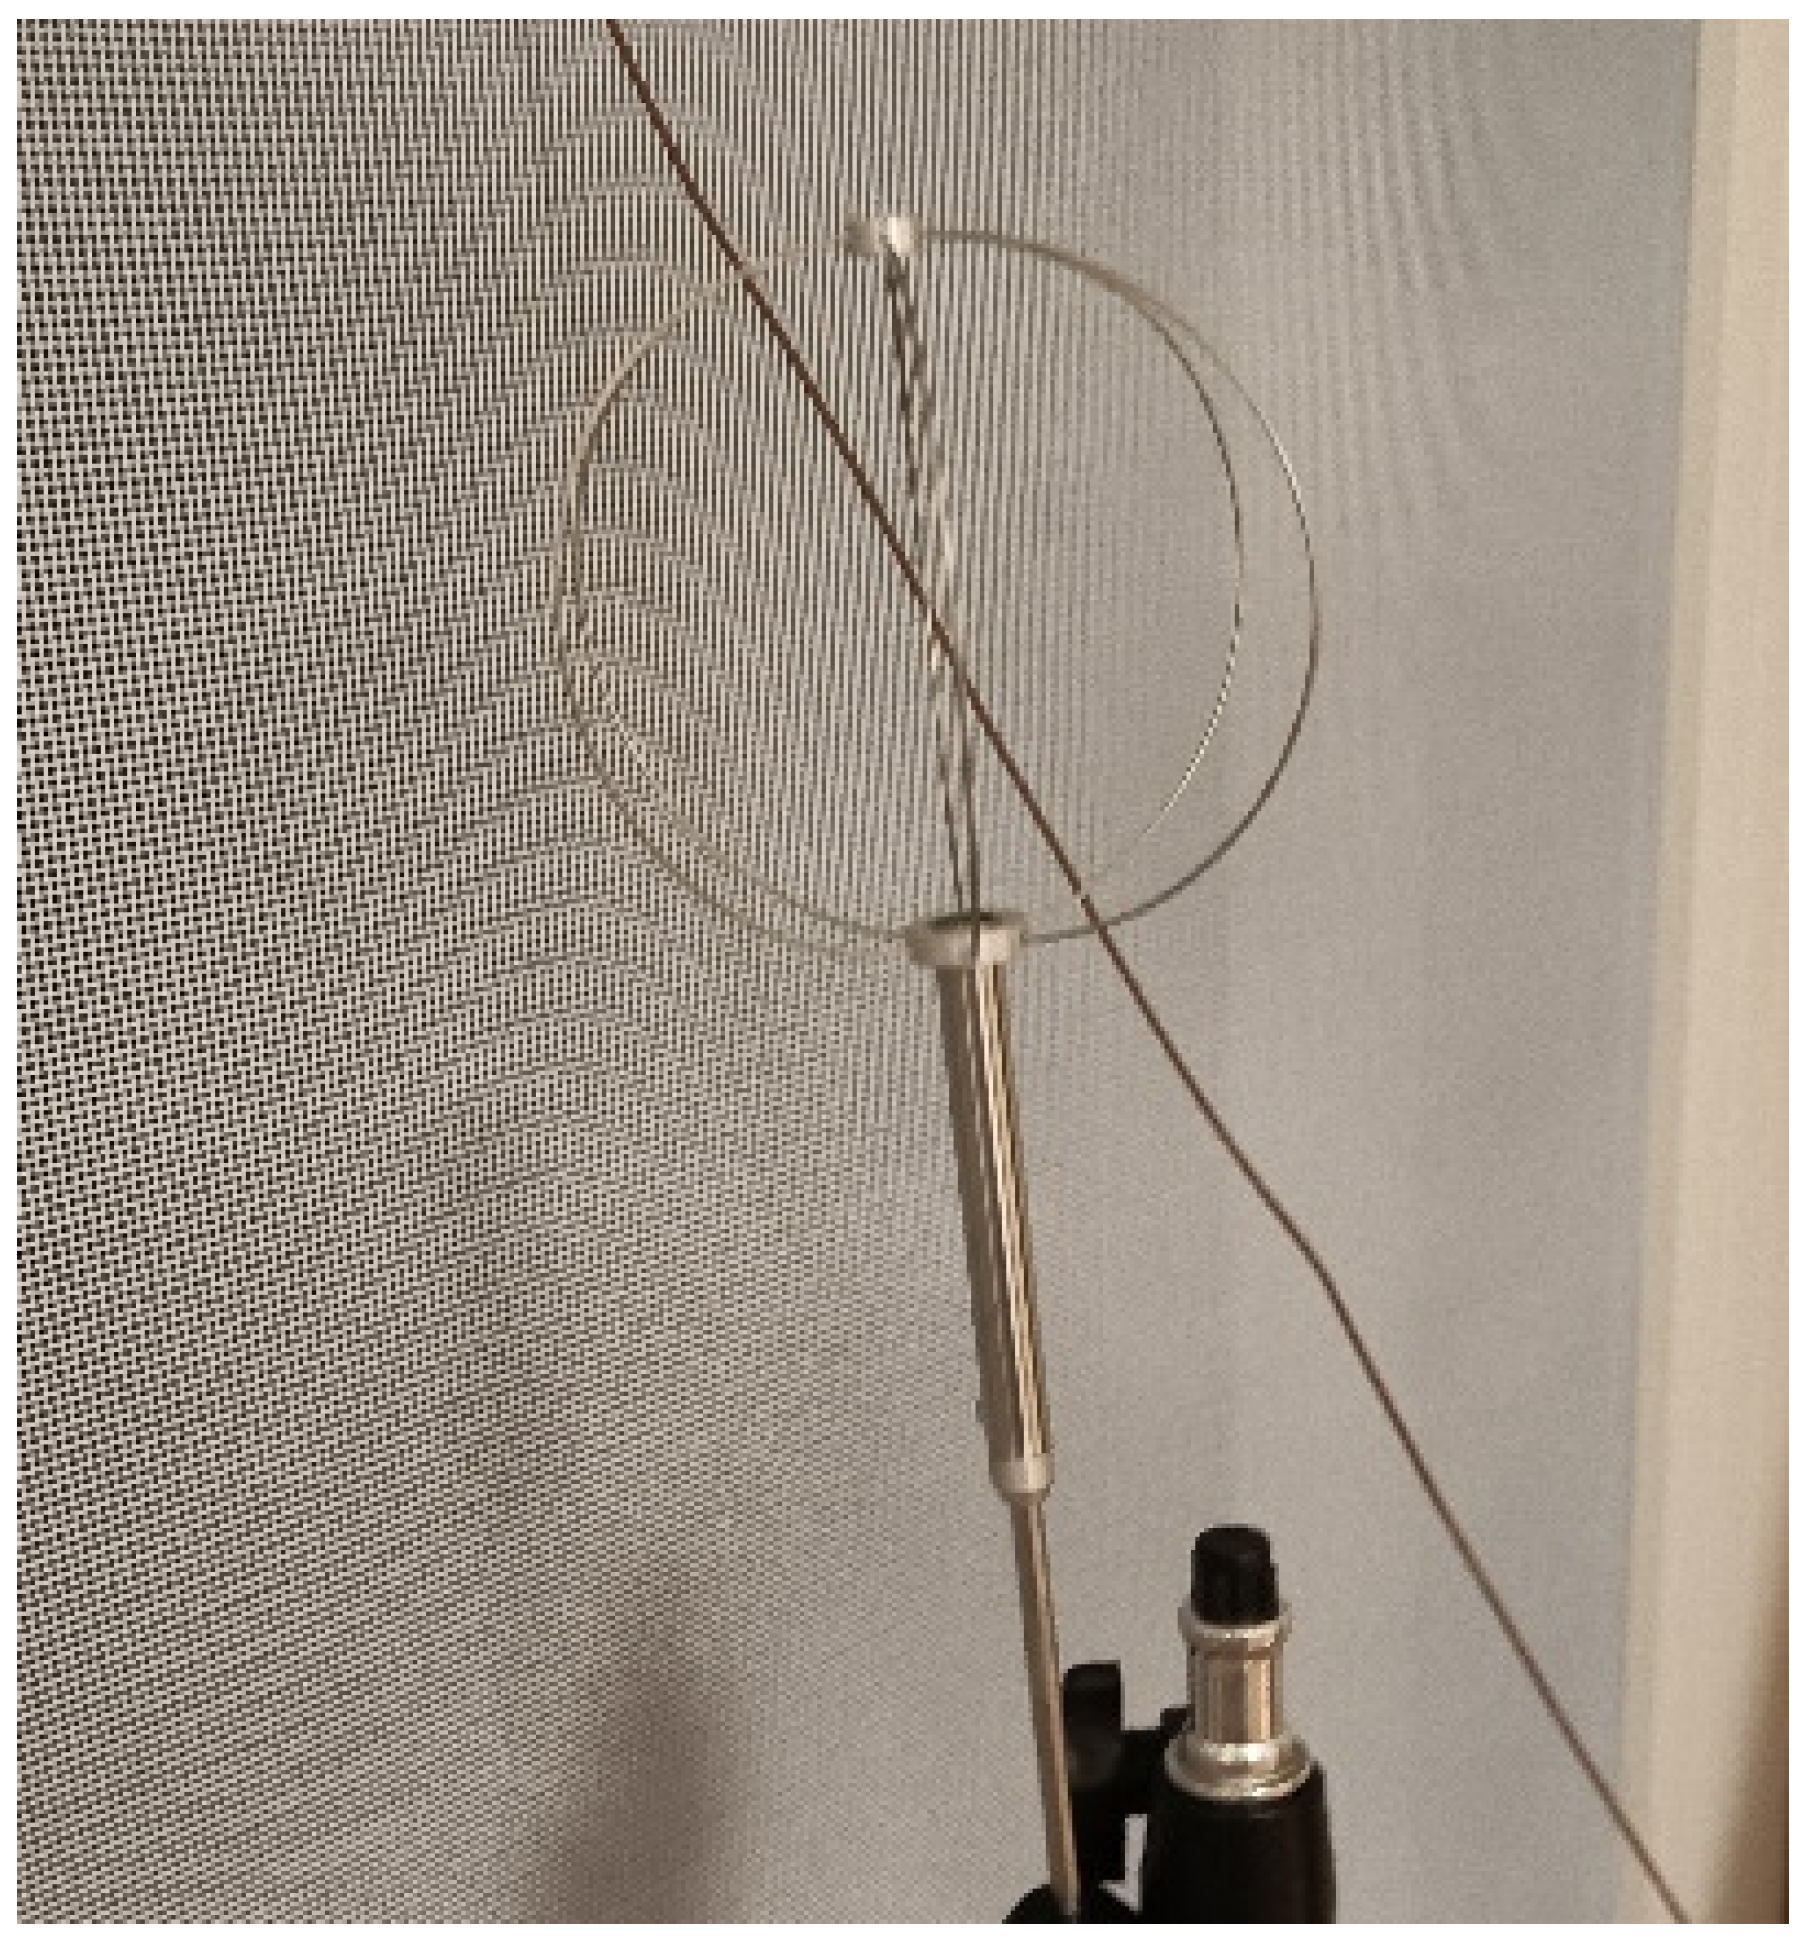
- SWEMA micro anemometer (Figure 7) for measuring ventilation inlet wind speed, recording every 30 s;
- (3)
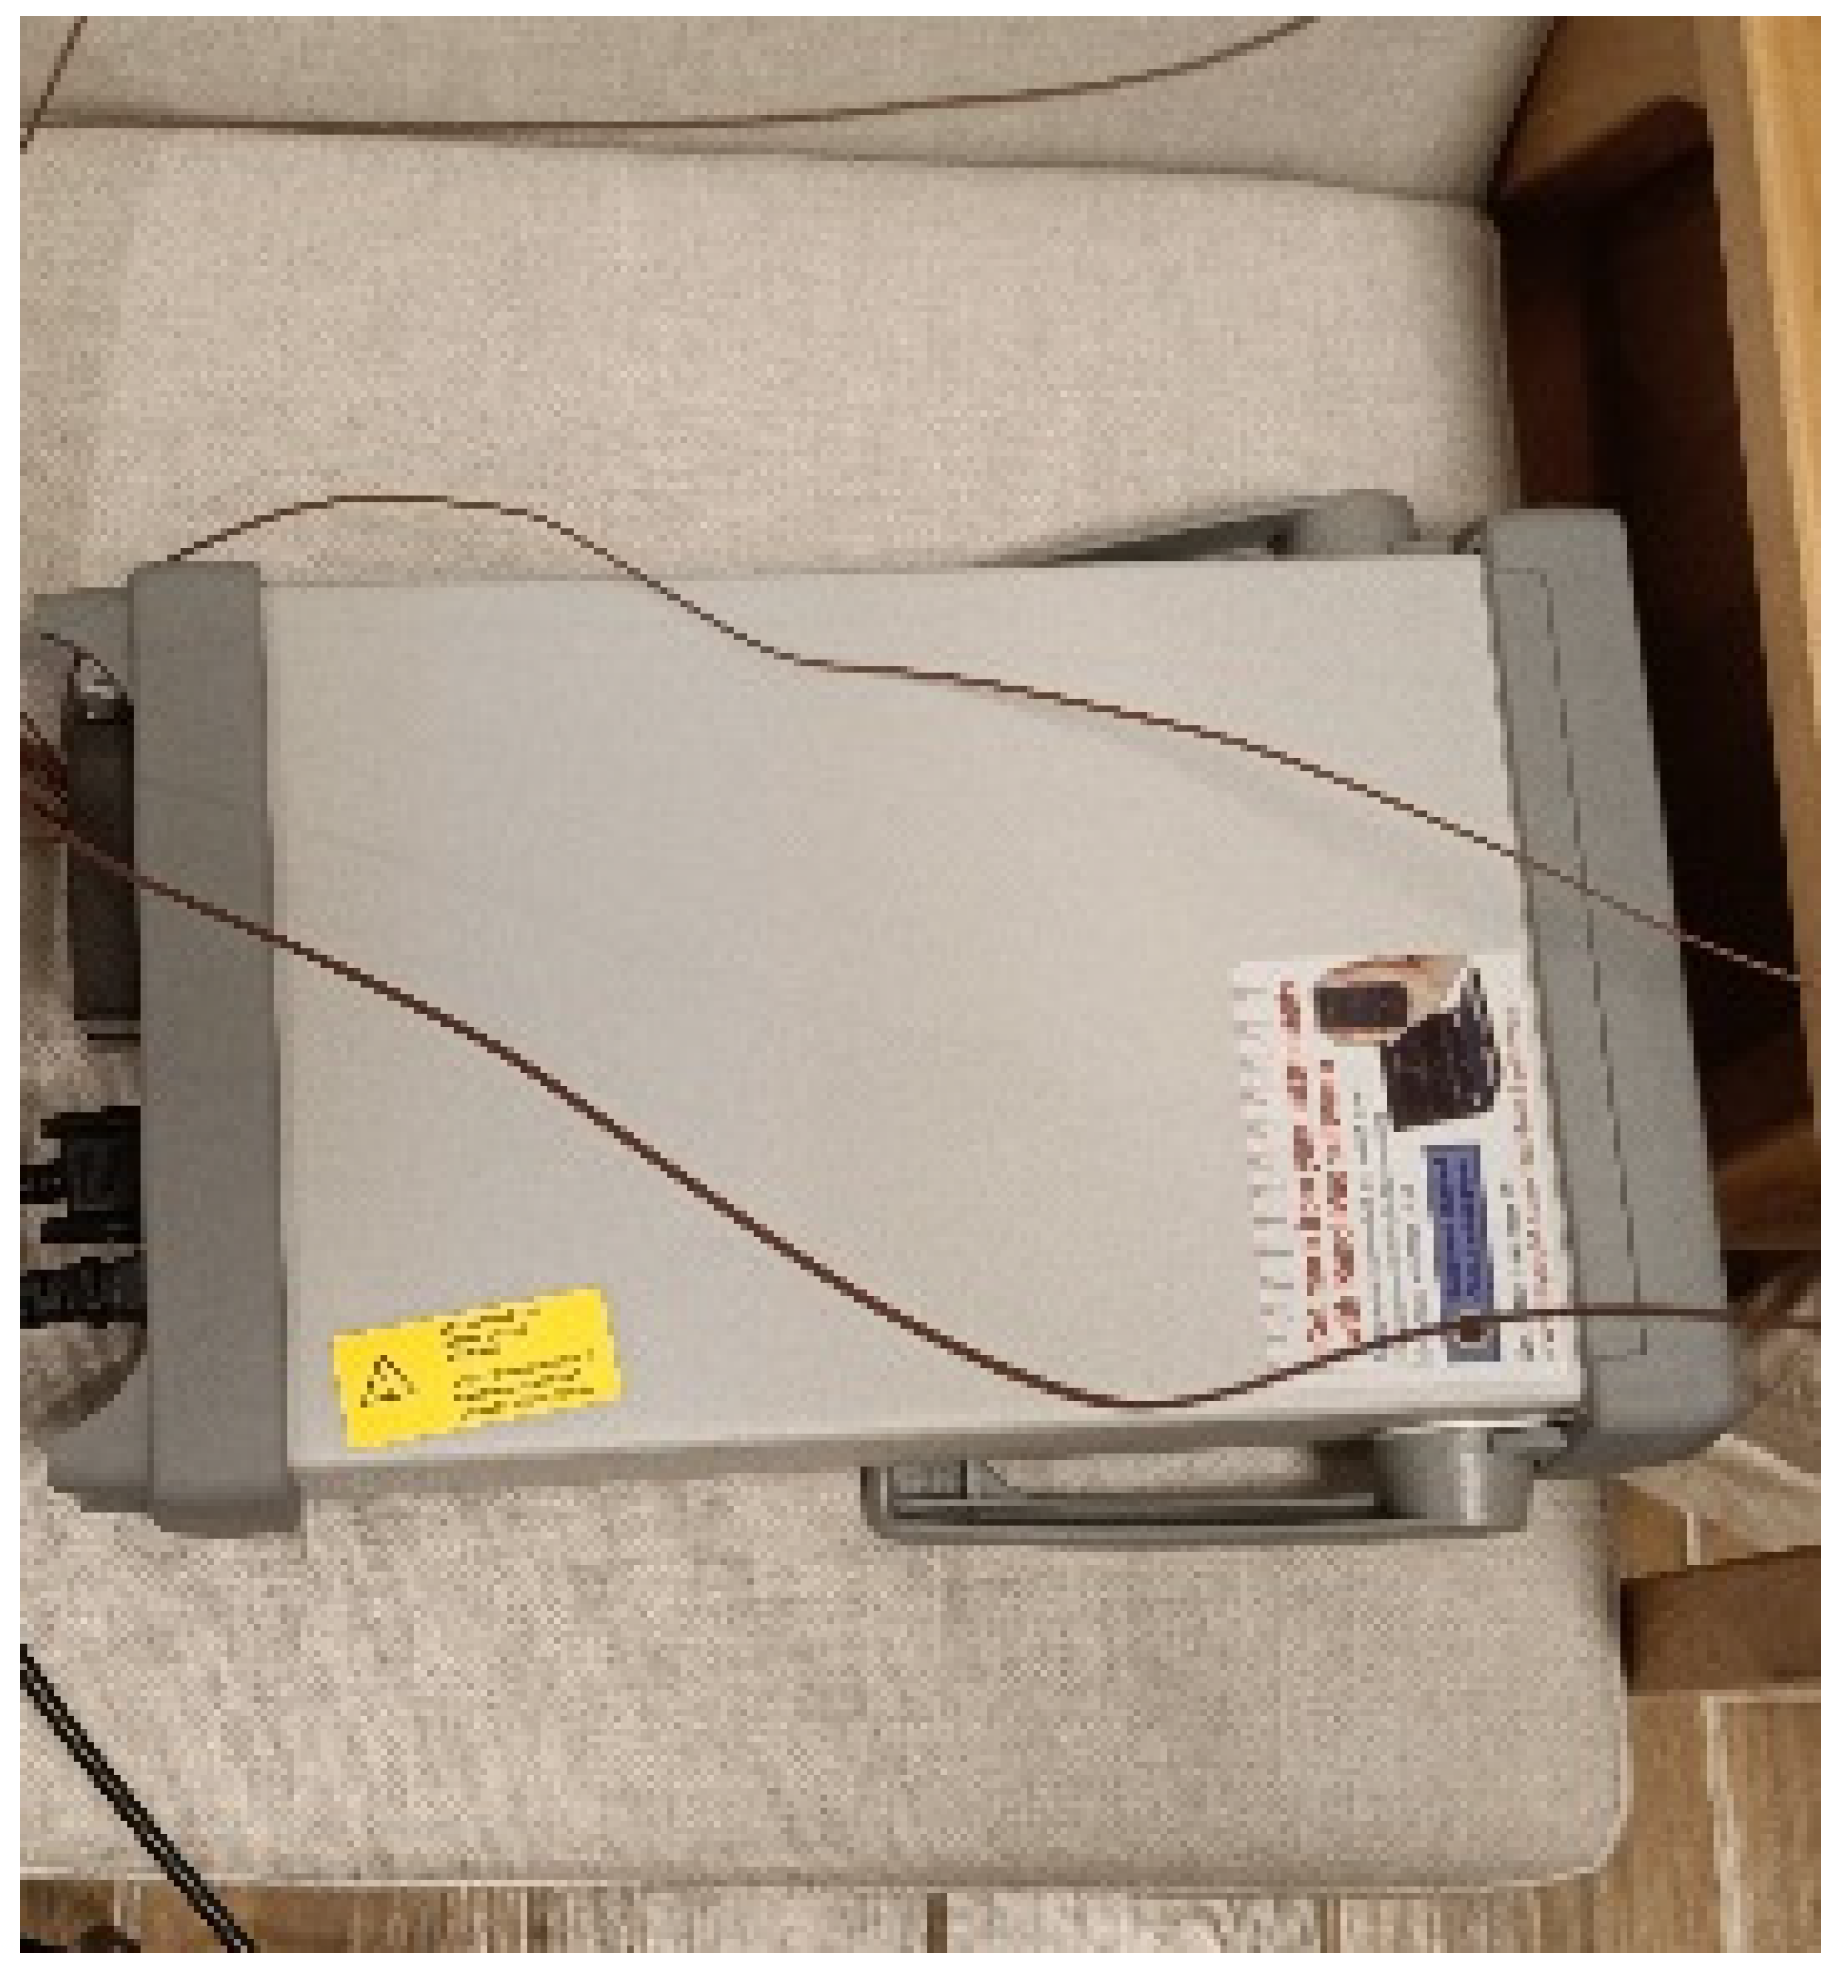
- Agilent analyzer (main unit 34970A, modules 34901A, T-type copper–copper nickel thermocouples) for measuring the temperature of the building envelope and lighting surfaces (Figure 8), recording every minute;
- (4)
- Handheld weather station (Figure 9) for measuring outdoor wind speed as a supplement.
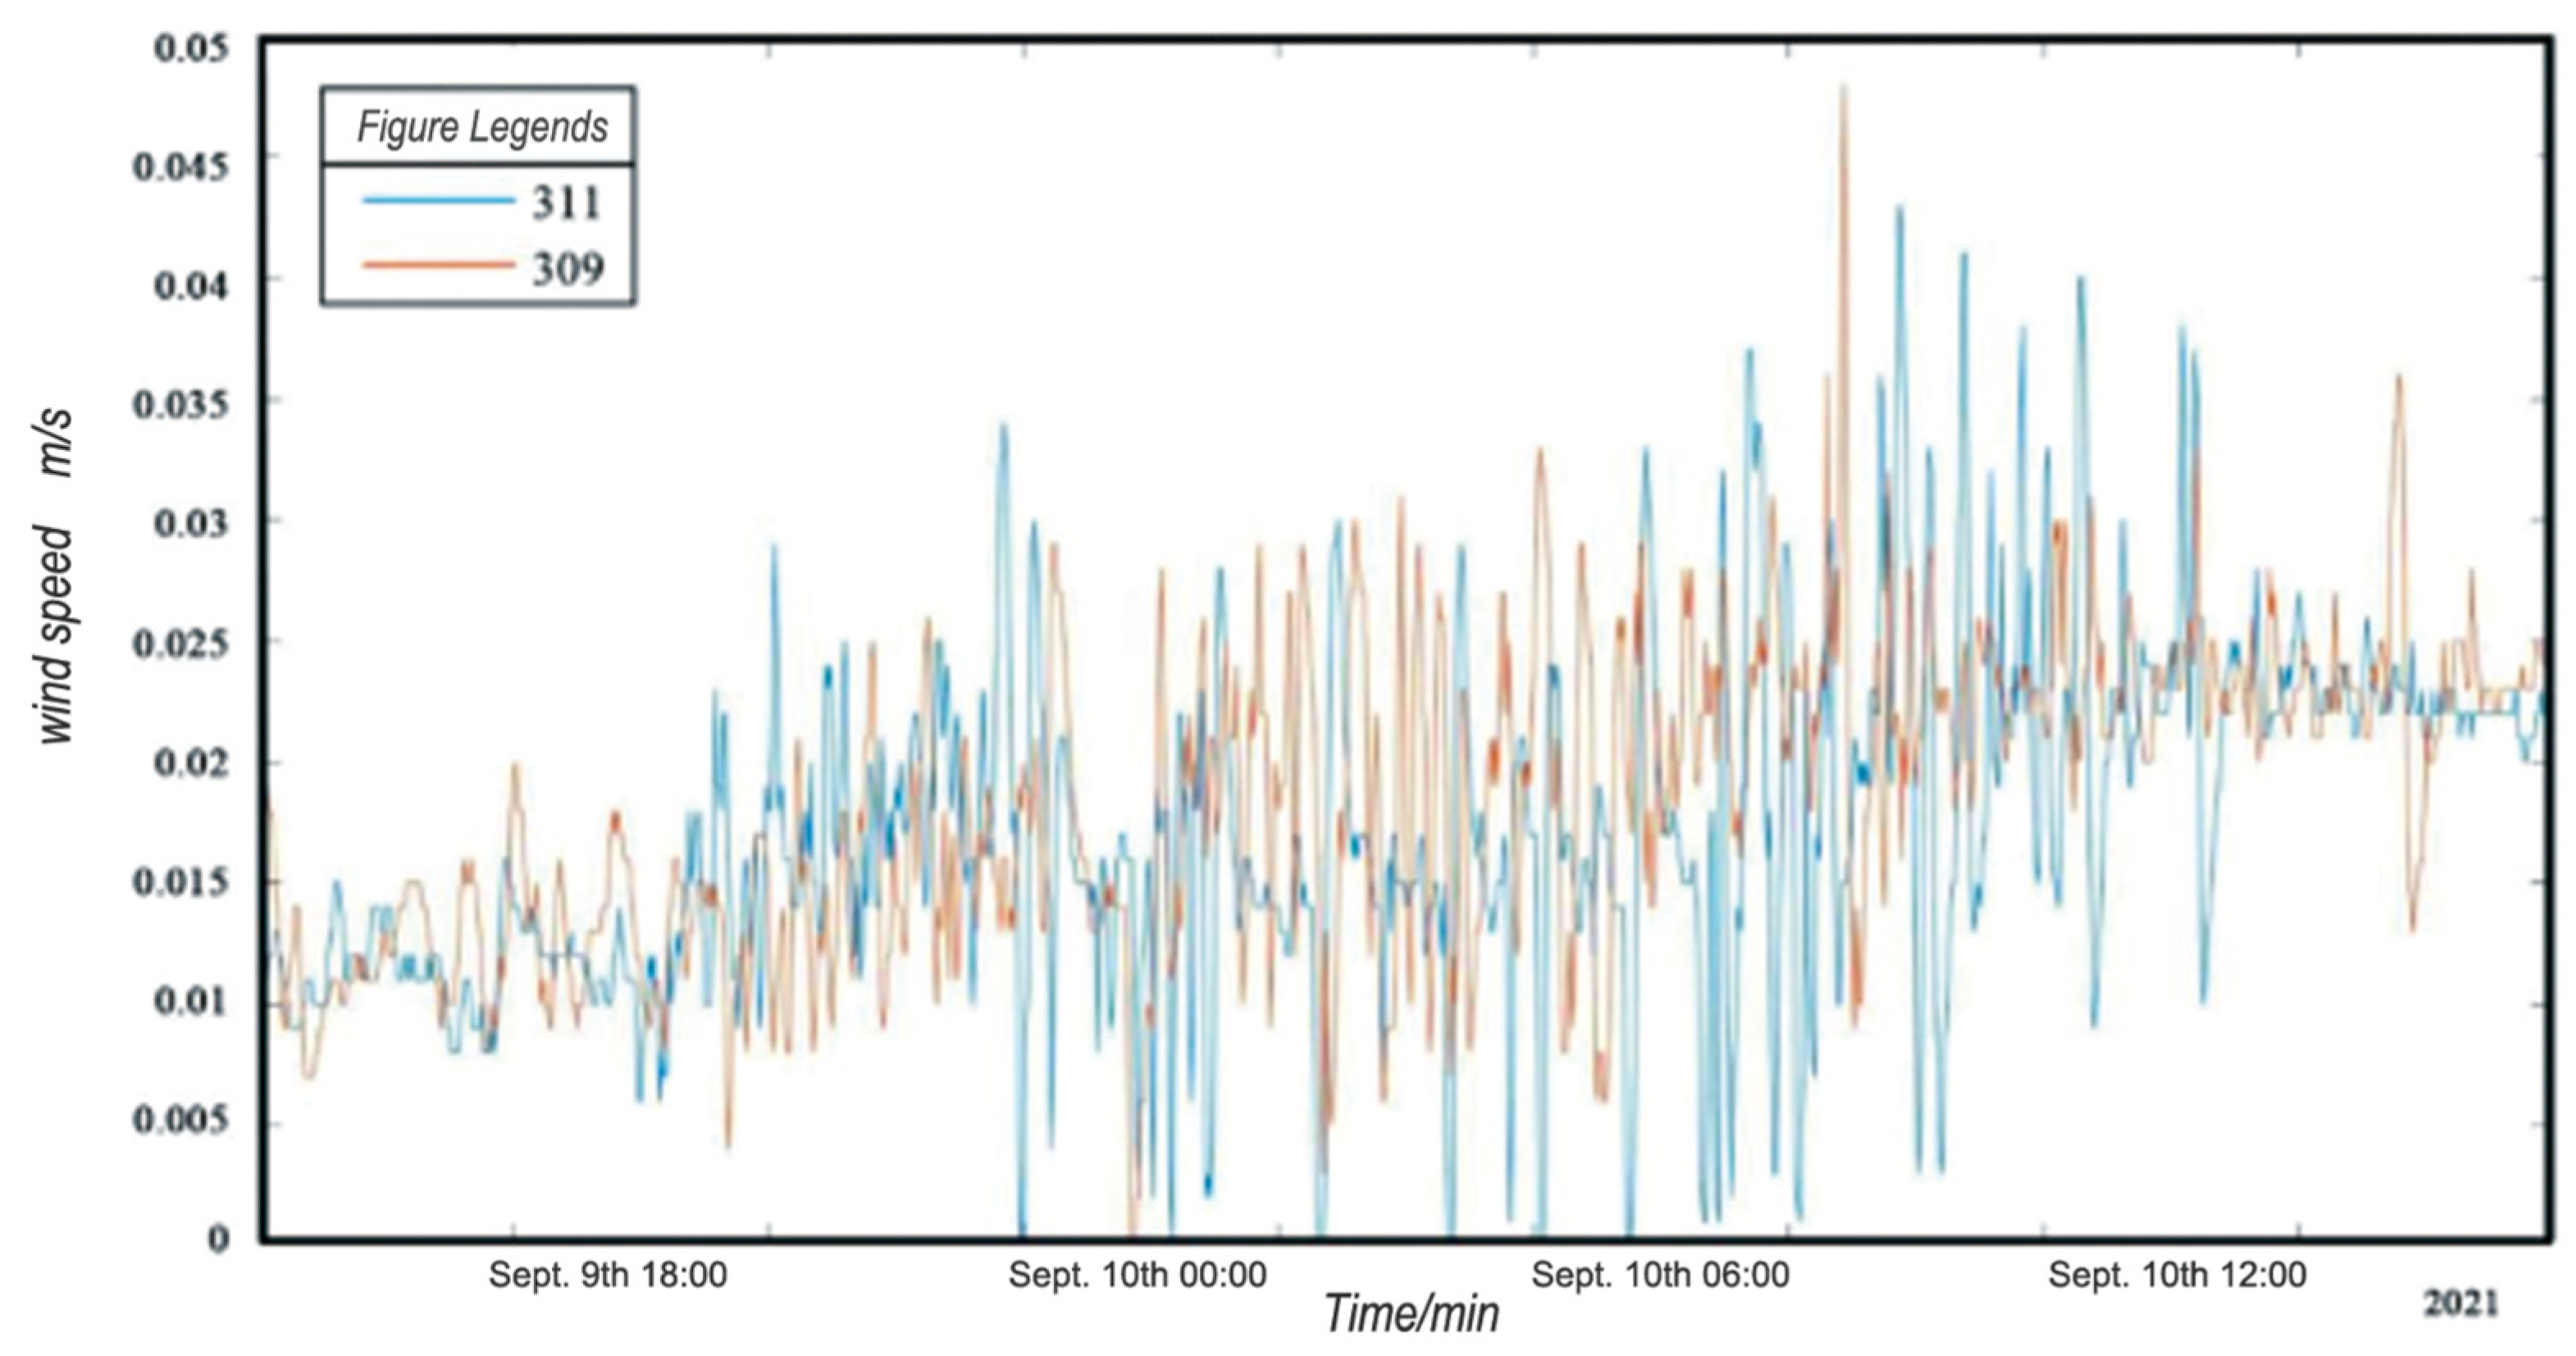
3.2. Measurement Results and Selection of Operating Conditions
3.3. Validation of Simulation Effectiveness
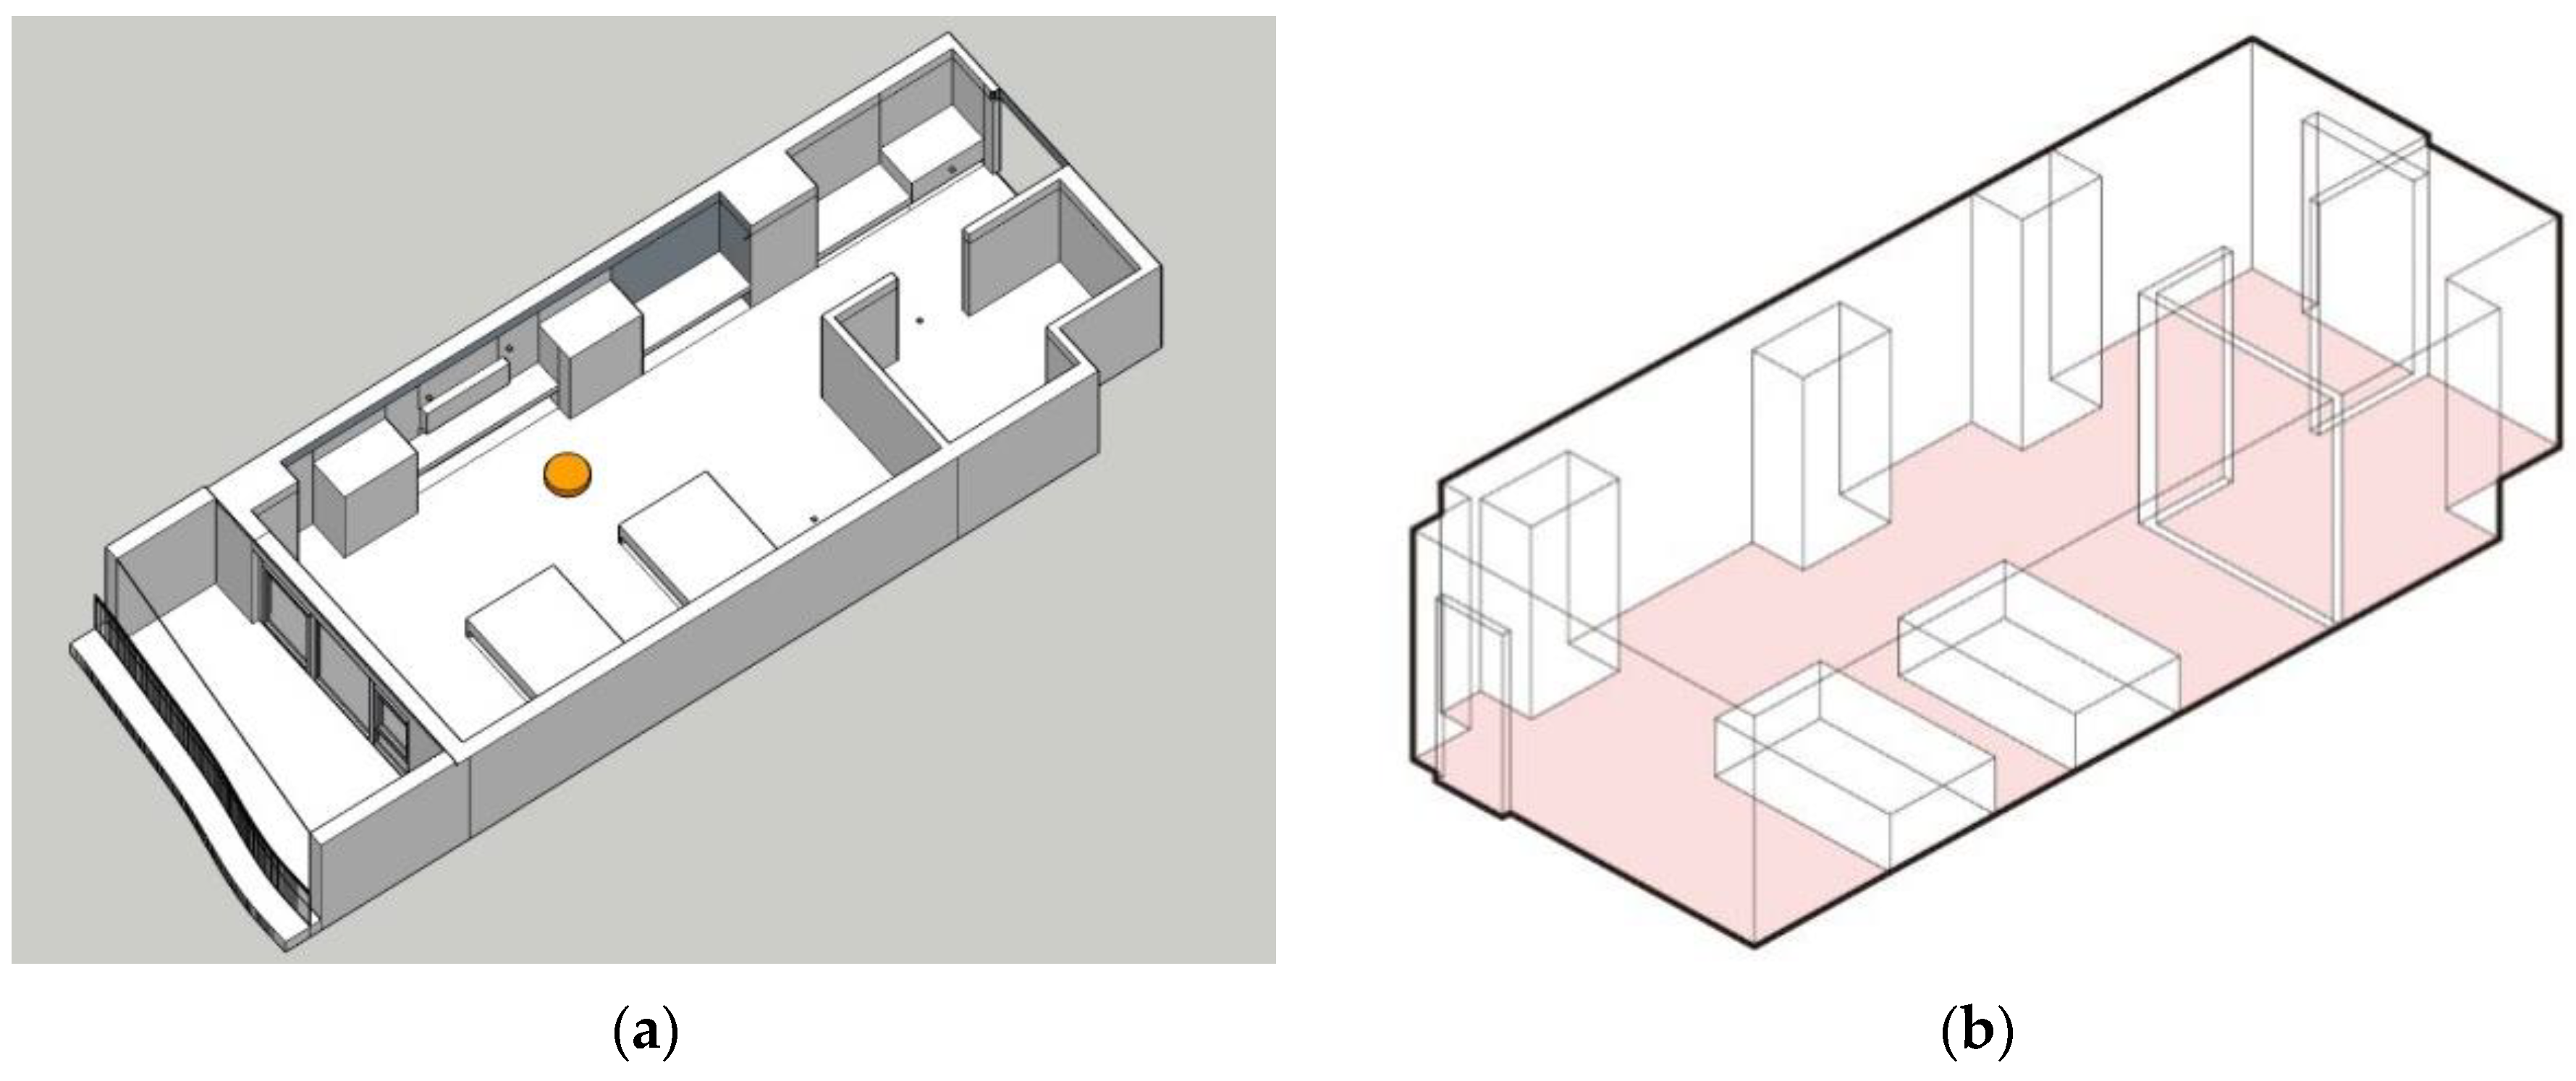
3.3.1. Room Model Construction and Simplification
3.3.2. Mesh Generation
3.3.3. Governing Equations
3.3.4. Boundary Conditions
3.3.5. Comparison of Simulation Results with Measured Data
3.4. Preset and Validation of Typical Floor Plans
3.4.1. Typical Plan Simulation Preset
3.4.2. Grid Independence Test
3.4.3. Validation of Bathroom Space Exclusion
4. Simulation Analysis of Natural Ventilation in Living Space Units
4.1. Overall Building Layout Simulation Analysis
4.2. Simulation Analysis of Three Key Elements
4.2.1. Floor Plan Organization
- (1)
- Location of Public Living Rooms
- (2)
- Openness of Public Living Rooms
4.2.2. Room Dimensions
4.2.3. External Openings
- (1)
- Symmetrical Window Configuration in Living Rooms
- (2)
- External Opening Area
4.2.4. Ventilation Methods within Living Spaces
4.3. Impact Factors and Improvement Proposals
5. Optimization and Improvement Strategies
5.1. Design Optimization Strategies
5.2. Renovation Optimization Strategies
6. Conclusions
- (1)
- South-facing living rooms improve indoor air quality while enhancing lighting.
- (2)
- Reducing the depth of windward-facing rooms facilitates the entry of fresh air.
- (3)
- Increasing the external opening area, especially horizontally, enhances natural ventilation in breathing zones.
- (4)
- Longer ventilation durations correlate with better air quality.
- (5)
- The relative positions of doors and windows strengthen natural air circulation.
- (1)
- Expanding the study of ventilation factors at different levels: Previous discussions have highlighted the significant impact of various factors on individual buildings. This includes evaluating building siting, surrounding building density, and greenery to select sites with good natural ventilation resources for elderly care facilities. Building form and layout also influence natural ventilation. Designing wind deflectors and thermal chimney ventilation can greatly aid summer ventilation.
- (2)
- Detailed study of window-opening behavior and needs in different seasons and climates: Future research should explore how opening and closing some doors and windows meet ventilation needs in seasons with lower ventilation requirements or under different climate conditions. If natural ventilation is insufficient, the possibility of supplementing with mechanical ventilation should be considered. Managing natural and mechanical ventilation to meet ventilation needs during special climate conditions, such as rain and temperature drops, is also a crucial topic for future research.
Author Contributions
Funding
Data Availability Statement
Conflicts of Interest
References
- Tan, Z.J.; Deng, X. Assessment of Natural Ventilation Potential for Residential Buildings across Different Climate Zones in Australia. Atmosphere 2017, 8, 177. [Google Scholar] [CrossRef]
- Flourentzou, F.; Pantet, S.; Ritz, K. Design and performance of controlled natural ventilation in school gymnasiums. Int. J. Vent. 2017, 16, 112–123. [Google Scholar] [CrossRef]
- De Dear, R.J.; Brager, G.S. Thermal comfort in naturally ventilation buildings: Revisions to ASHRAE Standard 55. Energy Build. 2002, 34, 549–561. [Google Scholar] [CrossRef]
- Fanger, P.O.; Toftum, J. Extension of the PMV model to non-air-conditioned buildings in warm climates. Energy Build. 2002, 34, 533–536. [Google Scholar] [CrossRef]
- Aflaki, A.; Mahyuddin, N.; Al-Cheikh Mahmoud, Z.; Baharum, M.R. A review on natural ventilation applications through building facade components and ventilation openings in tropical climates. Energy Build. 2015, 101, 153–162. [Google Scholar] [CrossRef]
- Yamamoto, Y.; Murakami, S.; Ishino, H.; Kohri, K. Energy Saving Performance of Buoyancy-Driven Natural and Hybrid Ventilation. In Proceedings of the ASHRAE Winter Conference, Chicago, IL, USA, 20–24 January 2018. [Google Scholar]
- Song, Y.; Wang, J.; Zhu, N. Reflections on Passive Design Strategies for Indigenous Green Buildings in China. J. Archit. 2013, 7, 94–99. [Google Scholar]
- Guo, P.; Yi, M.; Lv, T.; Wang, Y.; Liu, T.F. Study on Optimization Strategies for Natural Ventilation Opening Modes in Residential Buildings Based on CFD Simulation. Build. Sci. 2021, 37, 120–125. [Google Scholar]
- Shi, Z.N. Study on the Impact of Natural Ventilation in Hospital Wards on the Transmission of Respiratory Infectious Diseases. Master’s Thesis, Southeast University, Nanjing, China, 2018. [Google Scholar]
- Gao, X. Empirical Study on the Impact of Natural Ventilation in University Classrooms on Indoor CO2 Concentration. Master’s Thesis, Chongqing University, Chongqing, China, 2016. [Google Scholar]
- Sun, R.; Lei, Y.; Song, Z.; Jing, S. Natural Ventilation Performance of Louvered Combination Solar Chimneys in Buildings. Sol. Energy J. 2021, 42, 452–457. [Google Scholar]
- Ayata, T.; Çam, E.; Yıldız, O. Adaptive neuro-fuzzy inference systems (ANFIS) application to investigate potential use of natural ventilation in new building designs in Turkey. Energy Build. 2007, 48, 1472–1479. [Google Scholar] [CrossRef]
- Cheng, J.; Qi, D.; Katal, A.; Wang, L.; Stathopoulos, T. Evaluating wind-driven natural ventilation potential for early building design. J. Wind. Eng. Ind. Aerodyn. 2018, 182, 160–169. [Google Scholar] [CrossRef]
- Fedyushkin, A.I. Numerical simulation and analysis of the efficiency of natural ventilation in industrial buildings. J. Appl. Mech. Tech. Phys. 2020, 61, 936–944. [Google Scholar] [CrossRef]
- Yang, D.; Jiang, L.H. Simulation Study on the Natural Ventilation of College Student’ Dormitory. In Proceedings of the 10th International Symposium on Heating, Ventilation and Air Conditioning, Jinan, China, 19–22 October 2017; pp. 1279–1285. [Google Scholar]
- Cui, Y.; Zhang, C. Study on the Natural Ventilation Design Strategy of University Dormitory Buildings in Summer Based on CFD: A Case Study of a Dormitory Building in Jinan. Energy Conserv. Build. 2022, 50, 86–92. [Google Scholar]
- Xuan, Z. Study on Natural Ventilation Measurement and Calculation of Typical Residential Buildings and Related Influencing Factors. Master’s Thesis, Southeast University, Nanjing, China, 2019. [Google Scholar]
- Liu, M. Study on Xi’an Urban Residential Design Based on Natural Ventilation and Indoor Wind Environment Simulation. Master’s Thesis, Xi’an University of Architecture and Technology, Xi’an, China, 2020. [Google Scholar]
- Zhang, S.; Cheng, M.; Fu, W.; Dai, F.; Song, Y. Practical Application of CFD Technology in the Ventilation System Design of the Negative Pressure Wards at Leishenshan Hospital. Cent. China Archit. 2020, 38, 78–81. [Google Scholar]
- Abhinav, R.; Sunder, P.S.; Gowrishankar, A.; Vignesh, S.; Vivek, M.; Kishore, V.R. Numerical study on effect of vent locations on natural convection in an enclosure with an internal heat source. Int. Commun. Heat Mass Transf. 2013, 49, 69–77. [Google Scholar] [CrossRef]
- Ajmera, S.K.; Mathur, A.N. Experimental investigation of mixed convection in multiple ventilated enclosure with discrete heat sources. Exp. Therm. Fluid Sci. 2015, 68, 402–411. [Google Scholar] [CrossRef]
- Jing, W.; Willis, R.; Feng, Z. Factors Associated Quality of Life of Elderly in Non-paid or Paid Assisted Living Facilities. Korean J. Adult Nurs. 2012, 24, 99–108. [Google Scholar]
- Yang, K.-S. A Study on the Changes of Living Activities and the Use of Spaces of the Recuperating Elderly with Dementia in Skilled Nursing Facilities in Rural Area. J. Korean Inst. Rural. Archit. 2012, 14, 19–26. [Google Scholar]
- Bodur, S.; Cingil, D.D. Using WHOQOL-BREF to evaluate quality of life among Turkish elders in different residential environments. J. Nutr. Health Aging 2009, 13, 652–656. [Google Scholar] [CrossRef]
- Lee, H.; Kwon, S.; Kang, J. Standards of Living Space in Elderly Care Facilities Response to Infectious Diseases. J. Archit. Inst. Korea 2021, 37, 19–29. [Google Scholar]
- Li, H. Study on the Design of Living Spaces in Elderly Care Institutions under the AIP Model. Master’s Thesis, Southwest Jiaotong University, Chengdu, China, 2019. [Google Scholar]
- Ye, Q.; Liu, S.J.; Zhao, X.H.; Gong, Y.B. Exploration of Design of Living Spaces in Elderly Care Institutions Based on Harbin. Furnit. Inter. Decor. 2019, 1, 114–115. [Google Scholar]
- Ran, J. Study on the Design of Indoor Social Interaction Spaces in Nursing Homes Based on Behavioral Characteristics. Master’s Thesis, Chongqing University, Chongqing, China, 2017. [Google Scholar]
- Xiao, Y.; Wu, M.L.Y.; Zeng, T.Y.; Yang, Y. Analysis of the Needs of the Elderly in Urban Nursing Institutions in China and the Current Situation of Need Satisfaction. Gen. Nurs. 2021, 19, 4155–4158. [Google Scholar]
- Liu, H.; Wu, Y.; Zhang, H.; Du, X.Y. Study on the Adaptive Thermal Comfort Evaluation of the Elderly in Naturally Ventilated Residences during Summer. HVAC R Res. 2015, 45, 50–58. [Google Scholar]
- Qin, L.; Zhou, Y. Research on Medical Space Allocation in Elderly Care Institutions under the “Medical-Nursing Combined” Context. J. Archit. 2021, S1, 74–79. [Google Scholar]
- Zhao, Y. Research on the Design of Elderly Care Institutions in the Medical-Nursing Combined Model Based on a Survey in Nanjing. Master’s Thesis, Southeast University, Nanjing, China, 2017. [Google Scholar]
- GB50867-2013; Design Code for Elderly Facilities Buildings. Ministry of Housing and Urban-Rural Development of the People’s Republic of China: Beijing, China; General Administration of Quality Supervision, Inspection and Quarantine of the People’s Republic of China: Beijing, China; China Architecture & Building Press: Beijing, China, 2014.
- Versteeg, H.K.; Malalasekera, W. An Introduction to Computational Fluid Dynamics: The Finite Volume Method; Pearson Education: London, UK, 2007. [Google Scholar]
- Awbi, H.B. Ventilation of Buildings; Routledge: London, UK, 2013. [Google Scholar]
- Launder, B.E.; Spalding, D.B. The Numerical Computation of Turbulent Flows. Comput. Methods Appl. Mech. Eng. 1974, 3, 269–289. [Google Scholar] [CrossRef]
- Zhang, X.; Chen, Q.; Lin, Z. Numerical Simulation of Natural Ventilation in Residential Buildings with Enhanced Turbulence Models. Energy Build. 2020, 212, 109829. [Google Scholar]
- Smith, T.; Jones, A.; Wang, Y. Advanced Turbulence Modeling for Indoor Airflow Simulation. Build. Environ. 2018, 143, 77–89. [Google Scholar]
- JGJ 450-2018; Building Design Standards for Elderly Care Facilities. Ministry of Housing and Urban-Rural Development of the People’s Republic of China: Beijing, China; China Architecture & Building Press: Beijing, China, 2018.
- GB 50352-2019; Unified Standard for Civil Building Design. Ministry of Housing and Urban-Rural Development of the People’s Republic of China: Beijing, China; China Architecture & Building Press: Beijing, China, 2019.


| Category | Element | Quantity (%) | Typical Form | |
|---|---|---|---|---|
| Floor Plan Combinations | Traffic Flow Organization | Indoor Corridor | 42 (84%) | 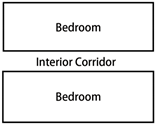 |
| Outdoor Corridor | 8 (16%) | |||
| Functional Layout | North-side Bedrooms | 36 (72%) | ||
| North-side Non-Bedrooms | 14 (28%) | |||
| Non-Balcony | 32 (64%) | 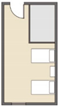 | ||
| Balcony | 18 (36%) | |||
| Room Organization | Direct Entry | 42 (84%) | 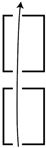 | |
| Staggered Entry | 8 (16%) | |||
| Room Layout | Room Type | Double Room | 50 (100%) | 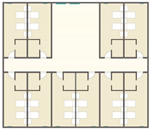 |
| Common Living Room (Activity Room) | 50 (100%) | |||
| Suite | 6 (12%) | |||
| External Openings | Single Window | 43 (86%) |  | |
| Double Window | 7 (14%) | |||
| Bathroom Location | Inside | 42 (84%) | ||
| Middle Side | 1 (2%) | |||
| Outside | 7 (14%) |
| Item | Regulation | Typical Floor Plan Dimensions |
|---|---|---|
| Inner Corridor Width | At least 1800 mm | 2450 mm |
| Bedroom Entrance | At least 1200 mm | 1200 mm |
| Living Space Area | At least 14 m2/bed | 20.7 m2/bed |
| Room Ceiling Height | At least 2600 mm | 2700 mm |
| Activity Area per Person | At least 1.2 m2 | 2.1 m2 |
| Window-to-Floor Area Ratio | 1:6 | 1:6 |
| Category | Variable Element | Details |
|---|---|---|
| Common Living Room (Activity Room) | Openness, Opening Configuration | Open/Semi-Open/Closed |
| Plan Convection Form | Entrance | Directly Facing/Staggered |
| Bathroom | Location | Outside |
| Room Dimensions | Depth, Room Type | Double Room/Single Room, |
| External Openings | Size, Arrangement | Area, Height, Combination |
| Additional Features | High Windows, Louvered Windows | Windows above interior doors |
| Instrument Name | Measurement Range | Measurement Accuracy |
|---|---|---|
| COS-03 | −40~80 °C, 0~100%RH | ±0.1 °C (25 °C) ±1.5%RH(60%RH, 25 °C) |
| SWEMA Micro Anemometer | 0~10 m/s | 0.05–2.0 m/s: ±(0.05 m/s ± 2% of reading) >2.0 m/s: ±(0.1 m/s ± 2% of reading) |
| T-type Thermocouple | −100 °C~400 °C | ±1 °C, Temperature Coefficient 0.03 °C |
| Time | Average Entrance Wind Speed/m·s−1 | Average Surface Temperature of Enclosure Structures/K |
|---|---|---|
| 8:45–9:00 | 0.010 | 297.3 |
| 10:15–10:30 | 0.017 | 298.1 |
| 12:35–12:50 | 0.015 | 298.5 |
| 15:50–16:05 | 0.023 | 299.4 |
| 16:45–17:00 | 0.022 | 298.6 |
| Time | Temperature | Wind Speed |
|---|---|---|
| 8:45–9:00 |  |  |
| 10:15–10:30 |  |  |
| 12:35–12:50 |  |  |
| 15:50–16:05 |  |  |
| 16:45–17:00 |  |  |
| Time | Average Euclidean Distance | Average Similarity | Processed Euclidean Distance | Processed Similarity |
|---|---|---|---|---|
| 8:45–9:00 | 0.26 | 0.733 | 0.27 | 0.790 |
| 10:15–10:30 | 0.48 | 0.633 | 0.22 | 0.821 |
| 12:35–12:50 | 0.42 | 0.658 | 0.31 | 0.761 |
| 15:50–16:05 | 0.46 | 0.643 | 0.37 | 0.729 |
| 16:45–17:00 | 0.51 | 0.621 | 0.25 | 0.799 |
| Grid Size | Wind Speed | Air Age |
|---|---|---|
| 0.08 m |  |  |
| 0.1 m |  |  |
| 0.125 m |  |  |
| 0.15 m |  |  |
| Simulation Status | Wind Speed | Air Age |
|---|---|---|
| Including |  |  |
| Excluding |  |  |
| Per Capita Living Area ) | Hourly Ventilation Rate |
|---|---|
| 10 m2 | 0.7 |
| 10 20 m2 | 0.6 |
| 20 50 m2 | 0.5 |
| 50 m2 | 0.45 |
| Room Type | Air Age (T) | Evaluation |
|---|---|---|
| Activity Room (20 People) | T 3600 s | Qualified |
| 3600 s < T | Not Qualified | |
| Elderly Resident Room | T 1800 s | Excellent |
| 1800 s < T 7200 s | Qualified | |
| 7200 s T | Not Qualified |
| Space Type | Data Type | 1.1 m Height | 1.5 m Height | A-A Cross-Section |
|---|---|---|---|---|
| South-Side Public Living Room | Wind Speed |  |  |  |
| Air Age |  |  |  | |
| North-Side Public Living Room | Wind Speed |  |  |  |
| Air Age |  |  |  |
| Space Type | Data Type | 1.1 m Height | 1.5 m Height | Not Meeting Standards (Grey) |
|---|---|---|---|---|
| South-Side Public Living Room | Wind Speed |  |  | |
| Air Age |  |  |  | |
| North-Side Public Living Room | Wind Speed |  |  | |
| Air Age |  |  |  |
| Space Type | Data Type | 1.1 m Height | 1.5 m Height | Not Meeting Standards (Grey) |
|---|---|---|---|---|
| South-Side Public Living Room | Wind Speed |  |  | |
| Air Age |  |  |  | |
| North-Side Public Living Room | Wind Speed |  |  | |
| Air Age |  |  |  |
| Space Type | Data Type | 1.1 m Height | 1.5 m Height | Not Meeting Standards (Grey) |
|---|---|---|---|---|
| South-Side Public Living Room | Wind Speed |  |  | |
| Air Age |  |  |  | |
| North-Side Public Living Room | Wind Speed |  |  | |
| Air Age |  |  |  |
| Space Type | Data Type | 1.1 m Height | 1.5 m Height | Not Meeting Standards (Grey) |
|---|---|---|---|---|
| South-Side Public Living Room | Wind Speed |  |  | |
| Air Age |  |  |  | |
| North-Side Public Living Room | Wind Speed |  |  | |
| Air Age |  |  |  |
| Space Type | Data Type | 1.1 m Height | 1.5 m Height | Not Meeting Standards (Grey) |
|---|---|---|---|---|
| South-Side Public Living Room | Wind Speed |  |  | |
| Air Age |  |  |  | |
| North-Side Public Living Room | Wind Speed |  |  | |
| Air Age |  |  |  |
| Space Type | Data Type | 1.1 m Height | 1.5 m Height | Not Meeting Standards (Grey) |
|---|---|---|---|---|
| South-Side Public Living Room | Wind Speed |  |  | |
| Air Age |  |  |  | |
| North-Side Public Living Room | Wind Speed |  |  | |
| Air Age |  |  |  |
| Data Type | Height | High Windows | Louvered Windows |
|---|---|---|---|
| Wind Speed | 1.1 m |  |  |
| 1.5 m |  |  | |
| Air Age | 1.1 m |  |  |
| 1.5 m |  |  |
| Data Type | Height | High Windows | Louvered Windows |
|---|---|---|---|
| Wind Speed | 1.1 m |  |  |
| 1.5 m |  |  | |
| Air Age | 1.1 m |  |  |
| 1.5 m |  |  |
| Factor | Adjustment | Impact on Ventilation |
|---|---|---|
| Living Activity Room | Enclosed | Slight decrease |
| Semi-open | Improvement in central north-side room | |
| Plan Convection Form | Staggered | Significant decrease on both sides |
| Room Settings | Room Depth | Improvement in south-side rooms and corridors, decrease in north-side rooms |
| External Opening Adjustments | Increase Area | Overall significant improvement |
| Additional Measures | Internal Openings | High windows superior to louvered windows |
| Space Type | Data Type | Design Scheme | Not Meeting Standards (Grey) |
|---|---|---|---|
| South-Side Public Living Room | Open | 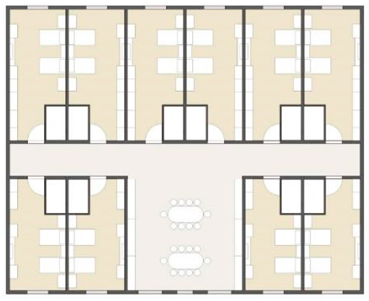 | 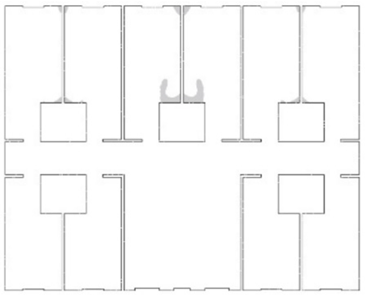 |
| Semi-Open |  | 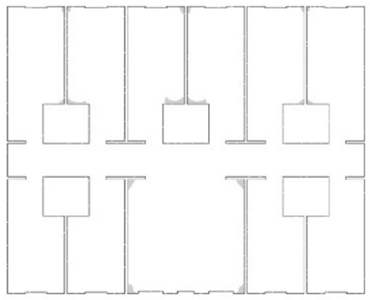 | |
| North-Side Public Living Room | Open | 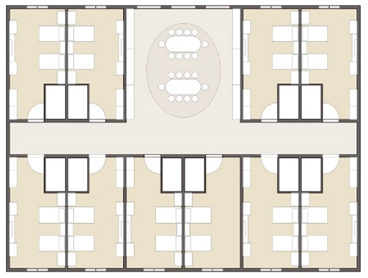 |  |
| Space Type | Data Type | Design Scheme | Not Meeting Standards (Grey) |
|---|---|---|---|
| South-Side Public Living Room | Open |  |  |
| Semi-Open | 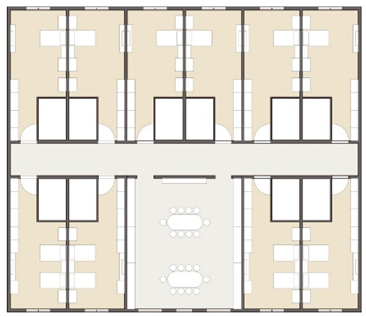 | 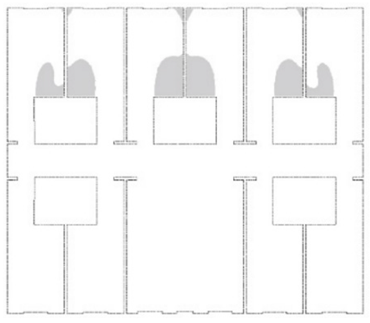 | |
| North-Side Public Living Room | Open |  |  |
Disclaimer/Publisher’s Note: The statements, opinions and data contained in all publications are solely those of the individual author(s) and contributor(s) and not of MDPI and/or the editor(s). MDPI and/or the editor(s) disclaim responsibility for any injury to people or property resulting from any ideas, methods, instructions or products referred to in the content. |
© 2024 by the authors. Licensee MDPI, Basel, Switzerland. This article is an open access article distributed under the terms and conditions of the Creative Commons Attribution (CC BY) license (https://creativecommons.org/licenses/by/4.0/).
Share and Cite
Liu, T.; Wang, J.; Zhou, D.; Meng, X.; Luo, X.; Wang, Y. Research on Optimization Design Strategies for Natural Ventilation in Living Units of Institutional Elderly Care Facilities Based on Computational Fluid Dynamics Simulation. Buildings 2024, 14, 1648. https://doi.org/10.3390/buildings14061648
Liu T, Wang J, Zhou D, Meng X, Luo X, Wang Y. Research on Optimization Design Strategies for Natural Ventilation in Living Units of Institutional Elderly Care Facilities Based on Computational Fluid Dynamics Simulation. Buildings. 2024; 14(6):1648. https://doi.org/10.3390/buildings14061648
Chicago/Turabian StyleLiu, Tianye, Jingxian Wang, Dian Zhou, Xiangzhao Meng, Xilian Luo, and Yupeng Wang. 2024. "Research on Optimization Design Strategies for Natural Ventilation in Living Units of Institutional Elderly Care Facilities Based on Computational Fluid Dynamics Simulation" Buildings 14, no. 6: 1648. https://doi.org/10.3390/buildings14061648
APA StyleLiu, T., Wang, J., Zhou, D., Meng, X., Luo, X., & Wang, Y. (2024). Research on Optimization Design Strategies for Natural Ventilation in Living Units of Institutional Elderly Care Facilities Based on Computational Fluid Dynamics Simulation. Buildings, 14(6), 1648. https://doi.org/10.3390/buildings14061648