Abstract
The crack detection method based on image processing has been a new achievement in the field of civil engineering inspection in recent years. Column piers are generally used in bridge structures. When a digital camera collects cracks on the pier surface, the loss of crack dimension information leads to errors in crack detection results. In this paper, an image stitching method based on Speed-Up Robust Features (SURFs) is adopted to stitch the surface crack images captured from different angles into a complete crack image to improve the accuracy of the crack detection method based on image processing in curved structures. Based on the proposed method, simulated crack tests of vertical, inclined, and transverse cracks on five different structural surfaces were conducted. The results showed that the influence of structural curvature on the measurement results of vertical cracks is very small and can be ignored. Nevertheless, the loss of depth information at both ends of curved cracks will lead to errors in crack measurement outcomes, and the factors that affect the precision of crack detection include the curvature of the surface and the length of the crack. Compared with inclined cracks, the structural curvature significantly influences the measurement results of transverse cracks, especially the length measurement results of transverse cracks. The image stitching method can effectively reduce the errors caused by the structural curved surface, and the stitching effect of three images is better than that of two images.
1. Introduction
Large bridges serve as vital components of national and regional transportation networks, and their safety is of paramount importance. During the construction of large bridges, cracks are a common defect and an early manifestation of most diseases. Accurate detection of the crack length and width of the structure surface is crucial for the life assessment and maintenance of bridges [1]. At present, the detection of the length and width of structural surface cracks is basically a manual contact measurement. However, this manual approach is time-consuming, laborious [2], and heavily dependent on the subjective judgment of the personnel involved, resulting in inconsistent detection outcomes and poor repeatability [3]. Furthermore, this method has great limitations. Sometimes, it needs to set up supports or use detection vehicles, which will also cause inconvenience to the normal traffic of vehicles and pedestrians. With the large-scale construction of bridge facilities, this traditional method has proven increasingly inadequate to meet the inspection and maintenance demands of large-scale bridge facilities.
The crack detection method based on image processing is a new achievement made in recent years by applying image analysis technology to the field of civil engineering detection. This method collects the crack images of the structure surface through a digital camera or other electronic devices, then uses the crack detection algorithm to detect and analyze the collected crack images, obtaining the detection results of concrete cracks. The technology is simple in principle and easy to operate, which can solve the shortcomings of the traditional manual detection method and provide an efficient and practical solution for the safety detection and condition evaluation of bridge structures. This approach has made great progress in recent years. Fujita et al. [4] proposed the concept of crack image preprocessing, which uses median filtering to smooth the original crack image and subtract the smoothed image from the original image to remove the influence of irregular lighting and shadows on crack detection. This technique can effectively detect cracks in noisy concrete images. Yamaguchi et al. [5] proposed an image percolation model based on the assumption that cracks are composed of thin connected textures and the length criterion of scalable local image processing technology, which can effectively extract continuous textures from cracks. Jahanshahi et al. [6] captured crack images from different perspectives and solved the SFM (structure from motion) problem to determine the sparse structure of the scene, as well as the camera position, direction, and internal parameters of each view. Then, the scene depth perception was obtained by scaling the reconstructed scene to a sparse 3D model. The morphological crack segmentation operators were introduced to extract crack patterns, and a multi-scale crack map was obtained to represent the detected cracks. Subsequently, a fully autonomous non-contact crack quantification method was proposed, which is very suitable for combining with autonomous or semi-autonomous mobile detection systems [7]. Zhang et al. [8] proposed an automatic crack detection and classification method for subway tunnel safety monitoring. This method uses morphological image processing technology and threshold operation to segment local dark areas with potential crack defects from the original gray image. Adhikari et al. [9] proposed an integrated model based on digital image processing to enhance traditional bridge detection tasks. This integrated model can be combined with bridge management systems to improve the reliability of the decision-making process for concrete bridge state assessment.
In recent years, the integration of machine learning, particularly deep learning, with computer vision and image processing methods has found increased application in structural health monitoring and damage identification. Li et al. [10] developed an algorithm for extracting cracks from concrete bridge images using automatic machine learning. A crack width calculation method integrating binary image and corresponding gray image information is used to detect bridge cracks. Li et al. [11] proposed a multiple damage detection method for concrete structures based on a full convolution network (FCN), which realized pixel-level detection of multiple damages such as cracks, spalling, efflorescence, and holes in concrete structures. Dung [12] evaluated the performance of three different pre-trained network architectures as the backbone of FCN encoders and proposed an autonomous detection method for concrete cracks based on a deep, fully convolutional neural network. Liu et al. [13] used the U-Net network structure to construct a deep-learning model for concrete crack detection. The trained U-Net can identify the crack location from the input original image under different conditions, with high effectiveness and robustness.
The crack detection method based on image processing has been widely used in engineering fields, but it also has some limitations: image quality and resolution will affect the accuracy and reliability of crack detection algorithms. Uneven illumination or background noise can be incorrectly recognized as cracks, leading to missed or undetected cracks. Most crack detection methods are designed based on specific types or shapes of cracks, which makes them potentially less flexible or accurate at detecting cracks of other types or shapes. Training a machine learning-based crack detection model usually requires a large amount of labeled data, and collecting and labeling this data may require significant time and resources. Some advanced image processing algorithms may involve complex mathematical models and computational processes, resulting in high implementation and operational costs for the algorithms.
In the process of crack image acquisition, a 3D scene or object is projected onto a 2D plane by a digital camera. The dimensionality reduction process will inevitably result in the loss of crack information. Column piers are generally used in bridge structures. The surface of the pier is curved and has high curvature. The crack shape on the surface of the column pier is curved, and the crack image captured by the digital camera is planar. If the crack image is directly processed to obtain the width, length, and other characteristic information of the crack, there will be a large error between the measured value and the true value, resulting in low accuracy in the detection results. To address this challenge and enhance the accuracy of crack detection in curved structures, this paper introduces an image stitching algorithm based on Speed-Up Robust Features (SURFs). This approach stitches together curved crack images taken from different angles to form a comprehensive crack image. By quantifying the stitched crack images, the geometric characteristic parameters of the cracks are obtained. The proposed method, based on image stitching, effectively improves the accuracy of the crack detection results on curved structure surfaces.
2. Fundamentals of Image Processing Technology Theory
2.1. Image Stitching Technology
Image stitching technology plays a pivotal role in seamlessly combining a series of spatially related images with overlapping areas to create a cohesive, high-resolution image. The roots of this technology are traced back to key developments by pioneering researchers. In 1992, Brown [14] proposed that image stitching technology should include four parts: extracting image features, selecting search strategies, determining transformation methods, and measuring registration results. These basic steps had a profound impact on the development of image stitching. In 2002, Scharstein and Szeliski [15] proposed to use the transformation matrix model to transform the image and unify it on the same plane, thus obtaining a better stitching effect. Lowe [16] published the Scale Invariant Feature Transform (SIFT) extraction technology in 2004. The stability and accuracy of image stitching are improved by using the feature-based image stitching algorithm. Since then, on the basis of Lowe, image stitching technology has been constantly innovating. Scholars have successively proposed SURF [17], ASIFT [18], CSIFT [19], and other feature algorithms. These advancements have propelled the rapid growth of image stitching technology.
When choosing a good image stitching algorithm, the following criteria usually need to be considered. (1) Stitching quality: Image stitching should correctly handle viewing angle differences and distortion to ensure that the stitched image has the correct geometric shape. In addition, the stitched image should retain the details and texture information of the original image, and there should be no loss of detail. (2) Robustness: The algorithm should be able to accurately align images under different shooting angles, lighting conditions, and scene complexity. In the presence of noise or poor image quality, good stitching effects can still be generated. (3) Efficiency: the algorithm should have high calculation speed, which is especially important when a large number of images need to be processed. (4) Ease of use: The algorithm should have reasonable default parameter settings to reduce the user’s burden of adjusting parameters. Automated splicing should be implemented as much as possible to reduce manual intervention. (5) Consistency: images from the same batch should be able to ensure the consistency of the stitching results and avoid randomness and instability of the stitching results.
The feature-based image stitching algorithm calculates the key feature information of the image, judges whether the overlapping areas match according to the extracted feature points, avoids the calculation of the whole space of the image and reduces the time of image stitching. The flow diagram of feature-based crack image stitching is shown in Figure 1.
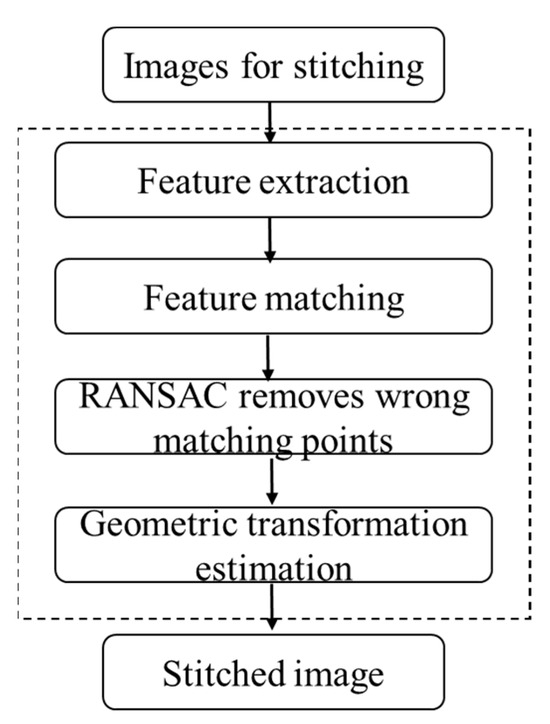
Figure 1.
Flow diagram of feature-based crack image stitching.
2.1.1. Feature Extraction
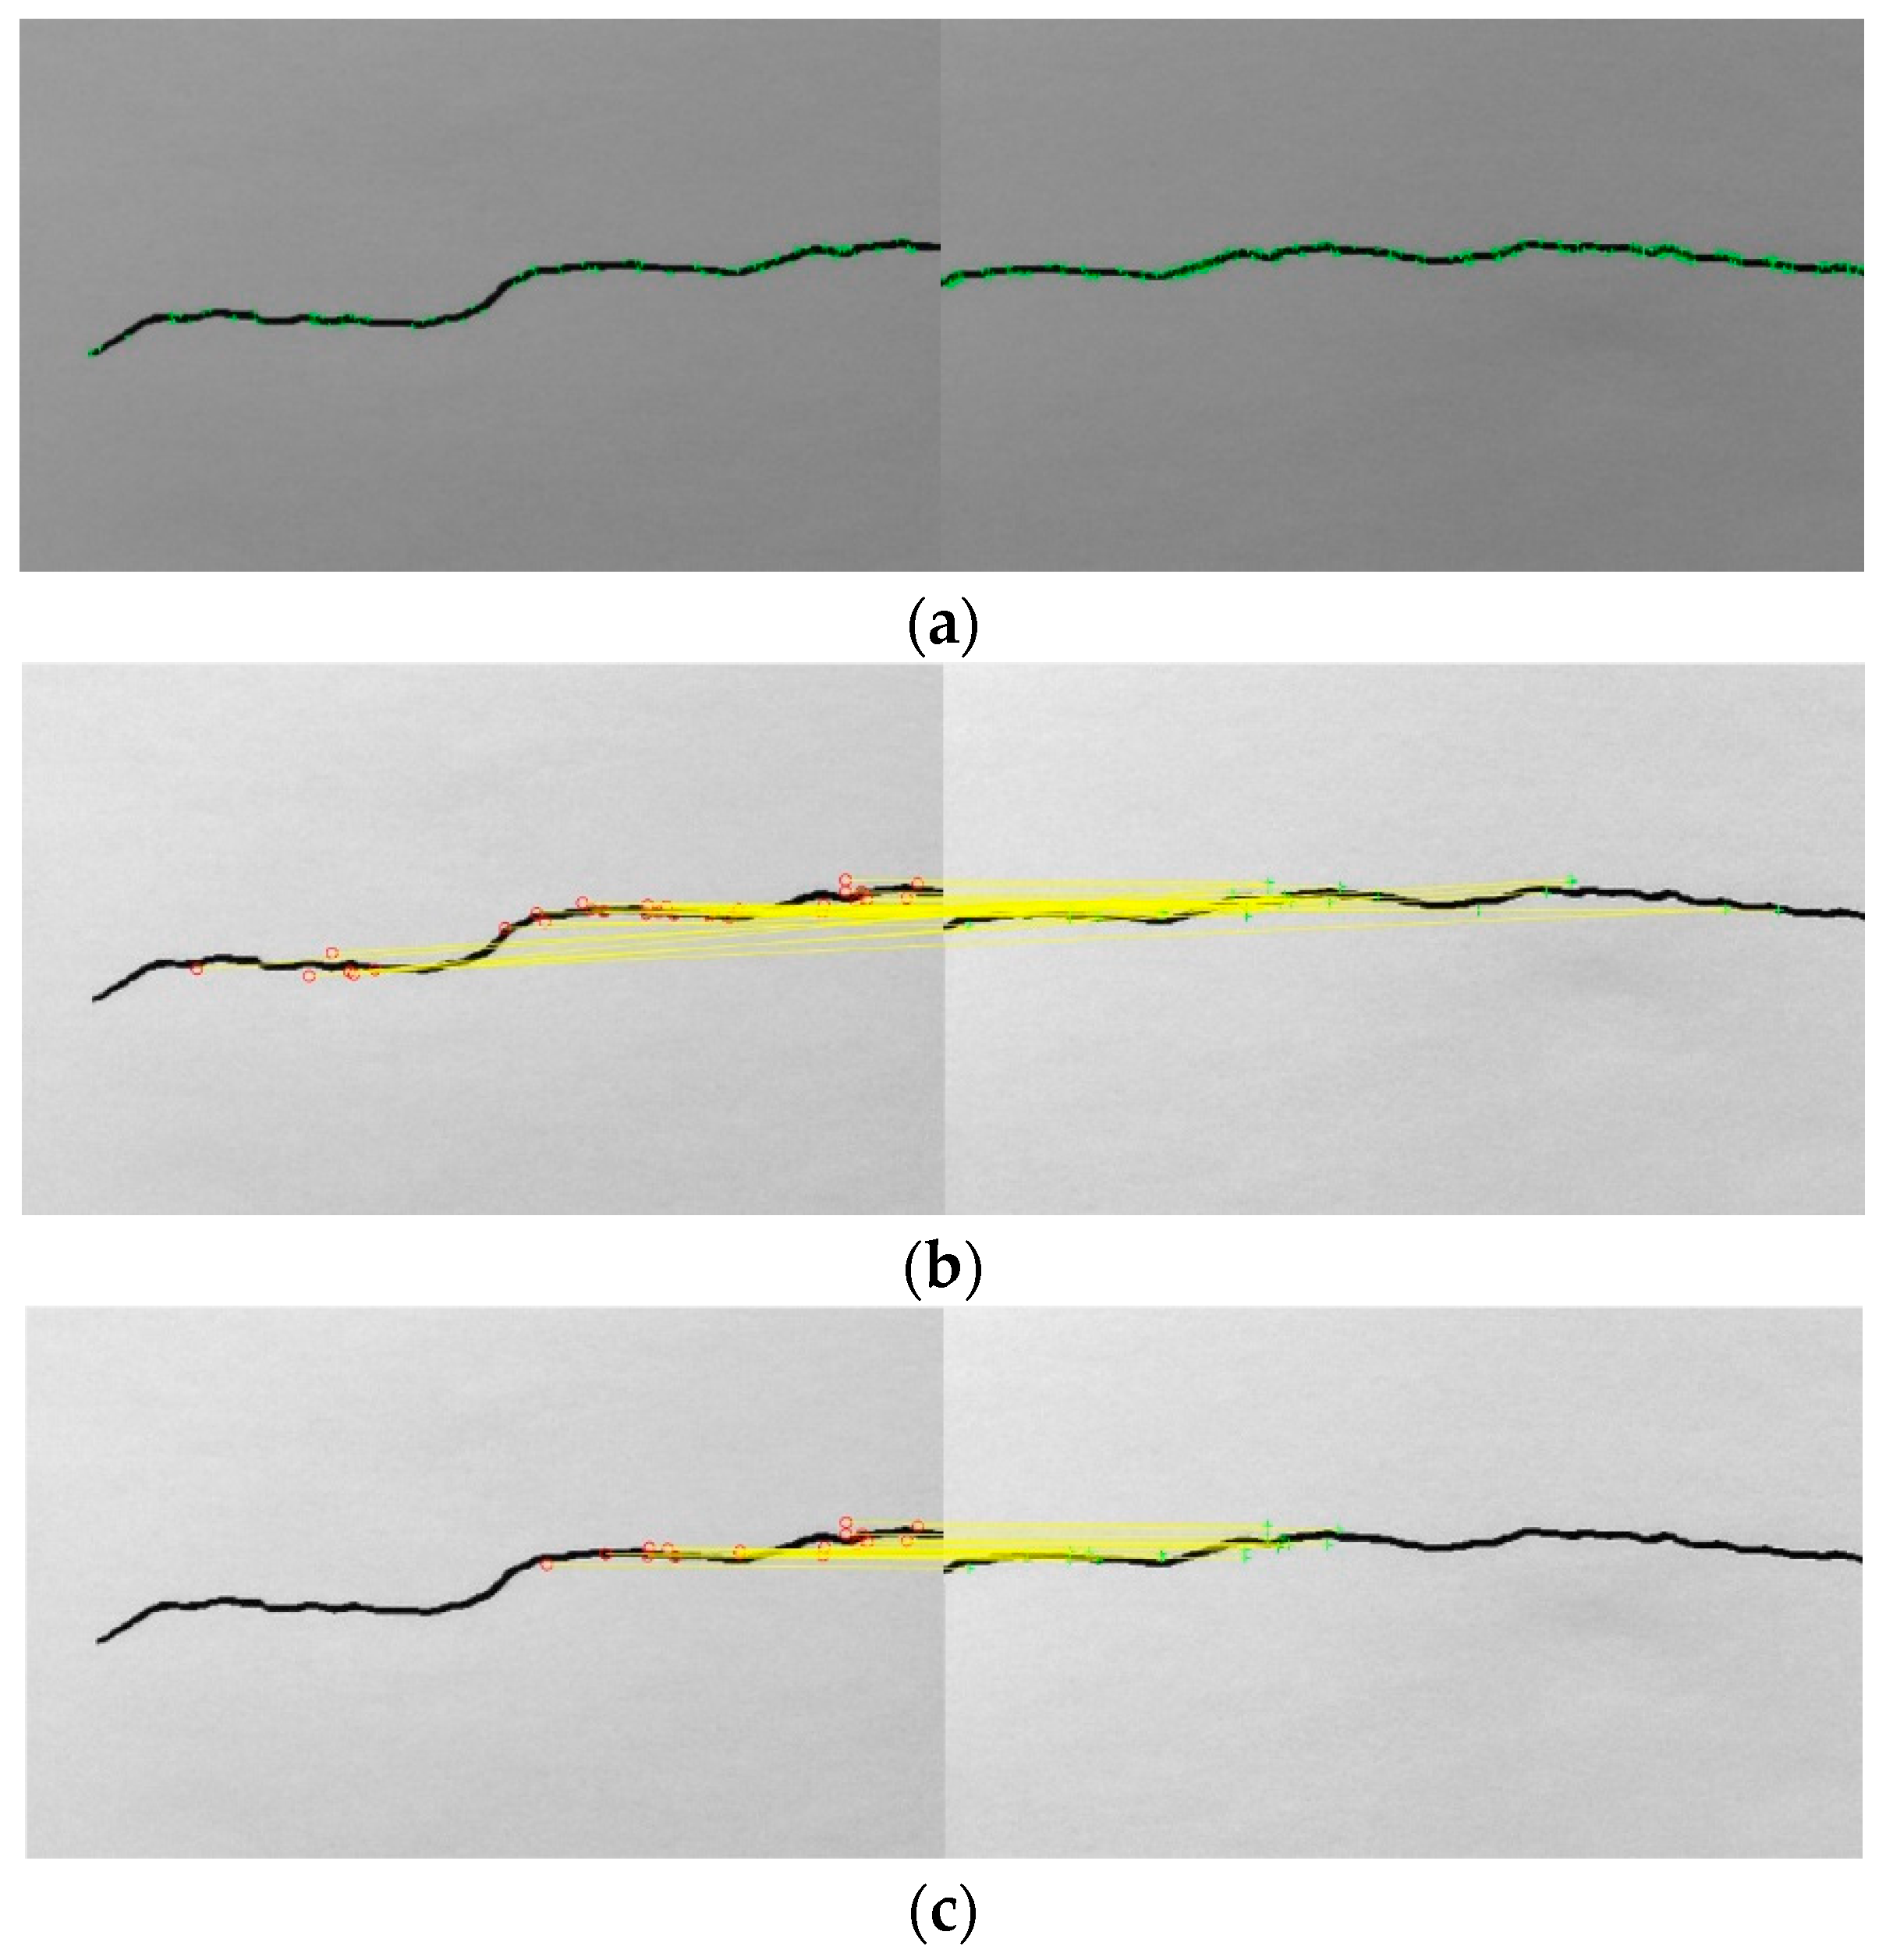
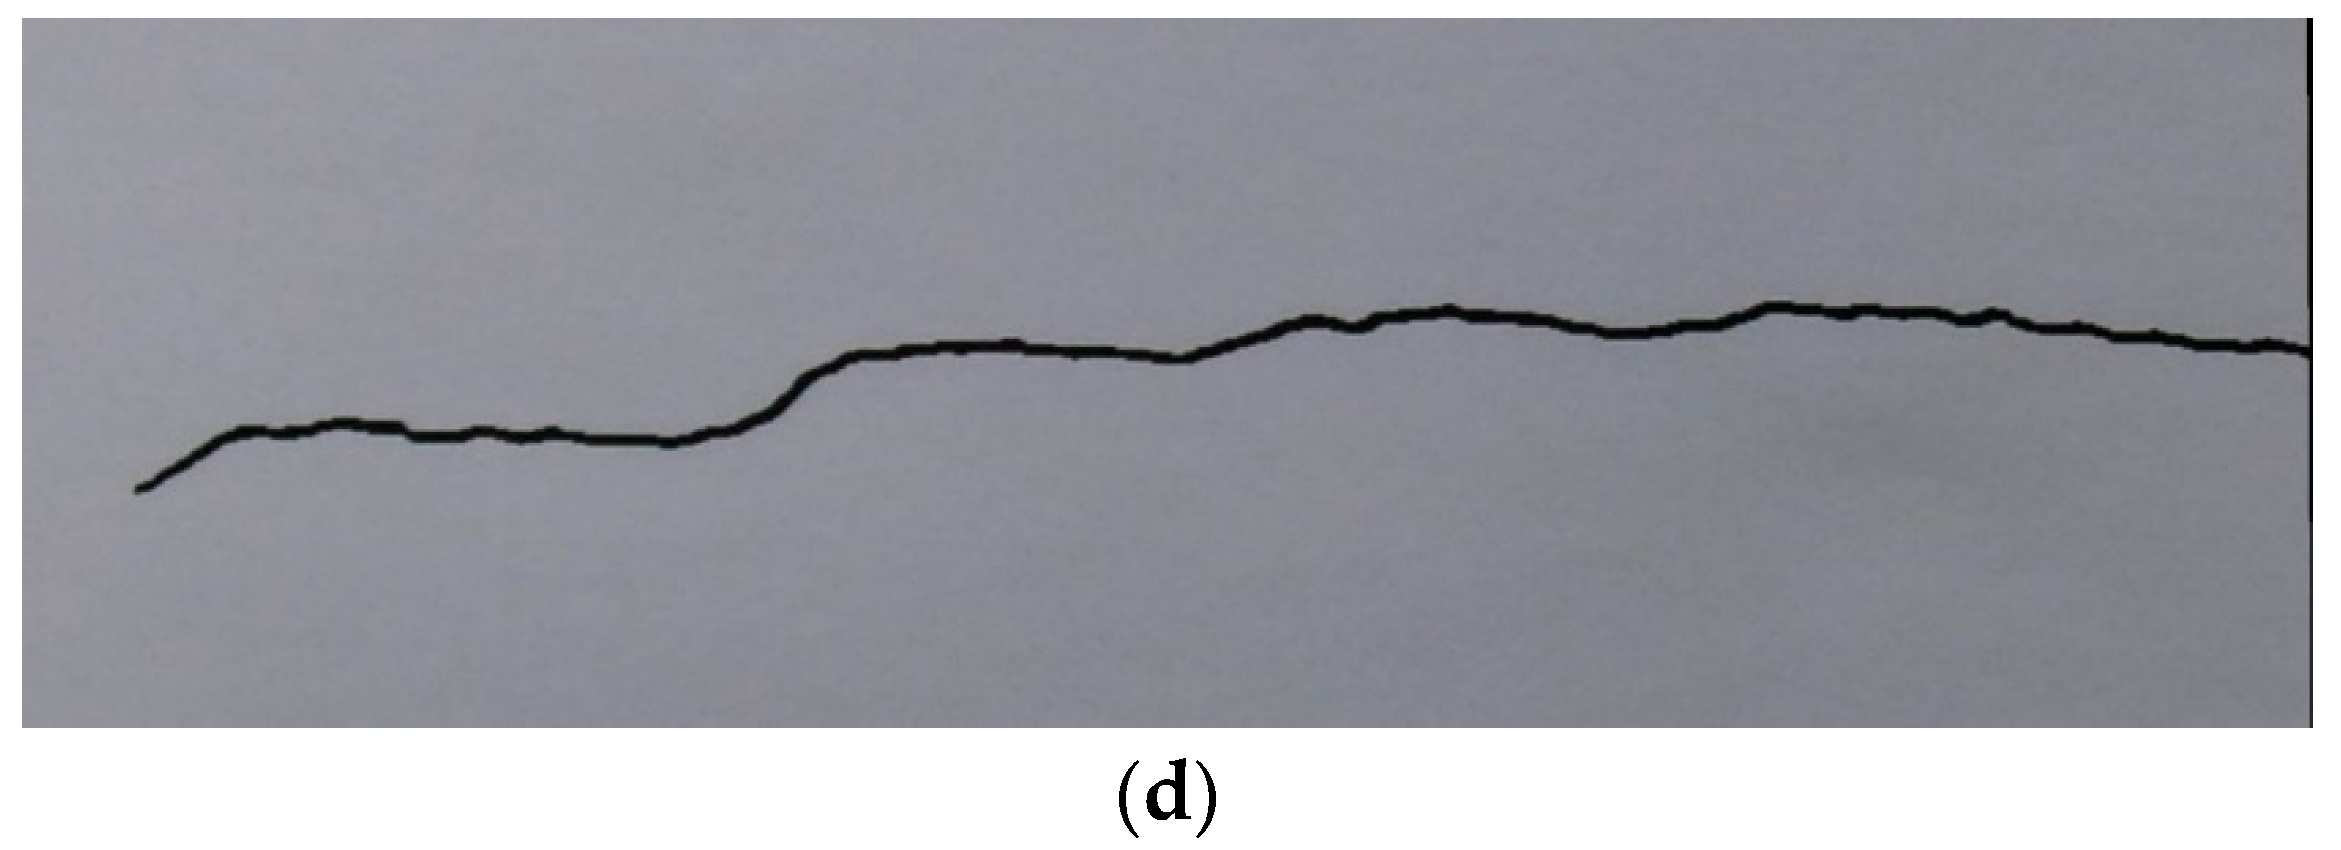
Compared with traditional feature detection algorithms such as the SIFT (Scale-Invariant Feature Transform) algorithm, the SURFs (Speed-up Robust Features) algorithm can quickly detect and describe key feature points in images. In addition, the SURF algorithm has good robustness to common transformations such as image rotation, scale scaling, and brightness changes, which can improve the stability and accuracy of image stitching. In order to stitch images more quickly and accurately, the SURF algorithm is used for image feature extraction. Keypoints are identified by finding local extremes in the scale-space representation of the image. For each keypoint, a 128-element descriptor vector of feature descriptors is generated by computing a histogram of the gradient direction over the region near the point, and the feature extraction results are shown in Figure 2a.
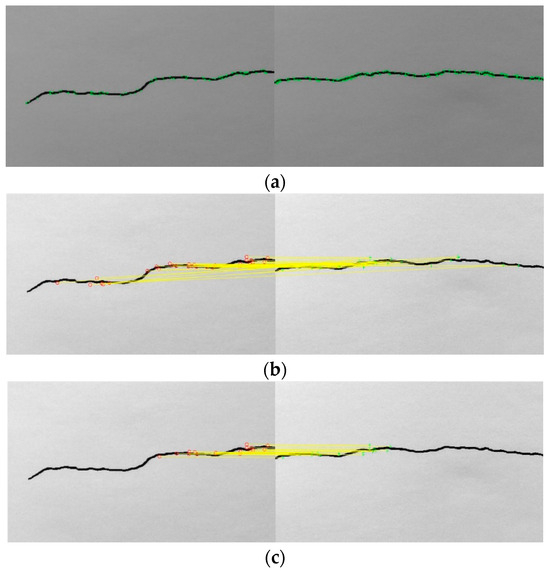
Figure 2.
Crack image stitching process: (a) feature points are extracted by SURF algorithm; (b) feature points matching; (c) removing mismatched points using RANSAC algorithm; and (d) image fusion.
2.1.2. Feature Matching
A keypoint in the reference image is taken, and the Euclidean distance between it and any keypoint in the image to be registered is computed as the similarity determination metric between the keypoints in the two images. In this study, by comparing the distance between the nearest neighbor and the second nearest neighbor, all matches with a distance ratio greater than 0.6 were eliminated, as shown in Figure 2b. The RANSAC (Random Sample Consensus) algorithm can be used to eliminate the mismatched points, as shown in Figure 2c.
2.1.3. Geometric Transformation Estimation
The geometric transformation relationship between images is estimated by matching pairs of feature points. Geometric transformations commonly employed include translation, rotation, scaling, affine transformation, and perspective transformation.
2.1.4. Image Registration
According to the estimated geometric transformation relationship, the images to be registered are registered. Affine transformation or perspective transformation is performed on the image by using the transformation matrix so that the two images are registered in space. The stitched crack image is shown in Figure 2d.
During the image stitching process, various errors may occur, such as inaccurate stitching and image deformation. The following methods are usually needed to deal with these errors. (1) Adjust parameters: adjust the parameters of the image stitching algorithm, such as the threshold of feature point detection and the matching distance of the matching algorithm, to obtain better stitching effects. (2) Optimize images: preprocessing the images to be stitched, including adjusting the contrast, brightness, color balance, etc. of the images to reduce the differences between images and help stitching more accurately. (3) Increase the overlapping area: increase the overlapping area between images and add more feature points in the stitched image to improve the accuracy and stability of feature point matching, thereby improving the stitching effect. (4) Feedback and adjustment: provide feedback and adjustment based on error conditions, continuously optimize the process and algorithm of image stitching, and improve the accuracy and stability of stitching to obtain better stitching effects. Through the above methods, errors that occur during the image stitching process can be effectively handled, and the quality and efficiency of image stitching can be improved.
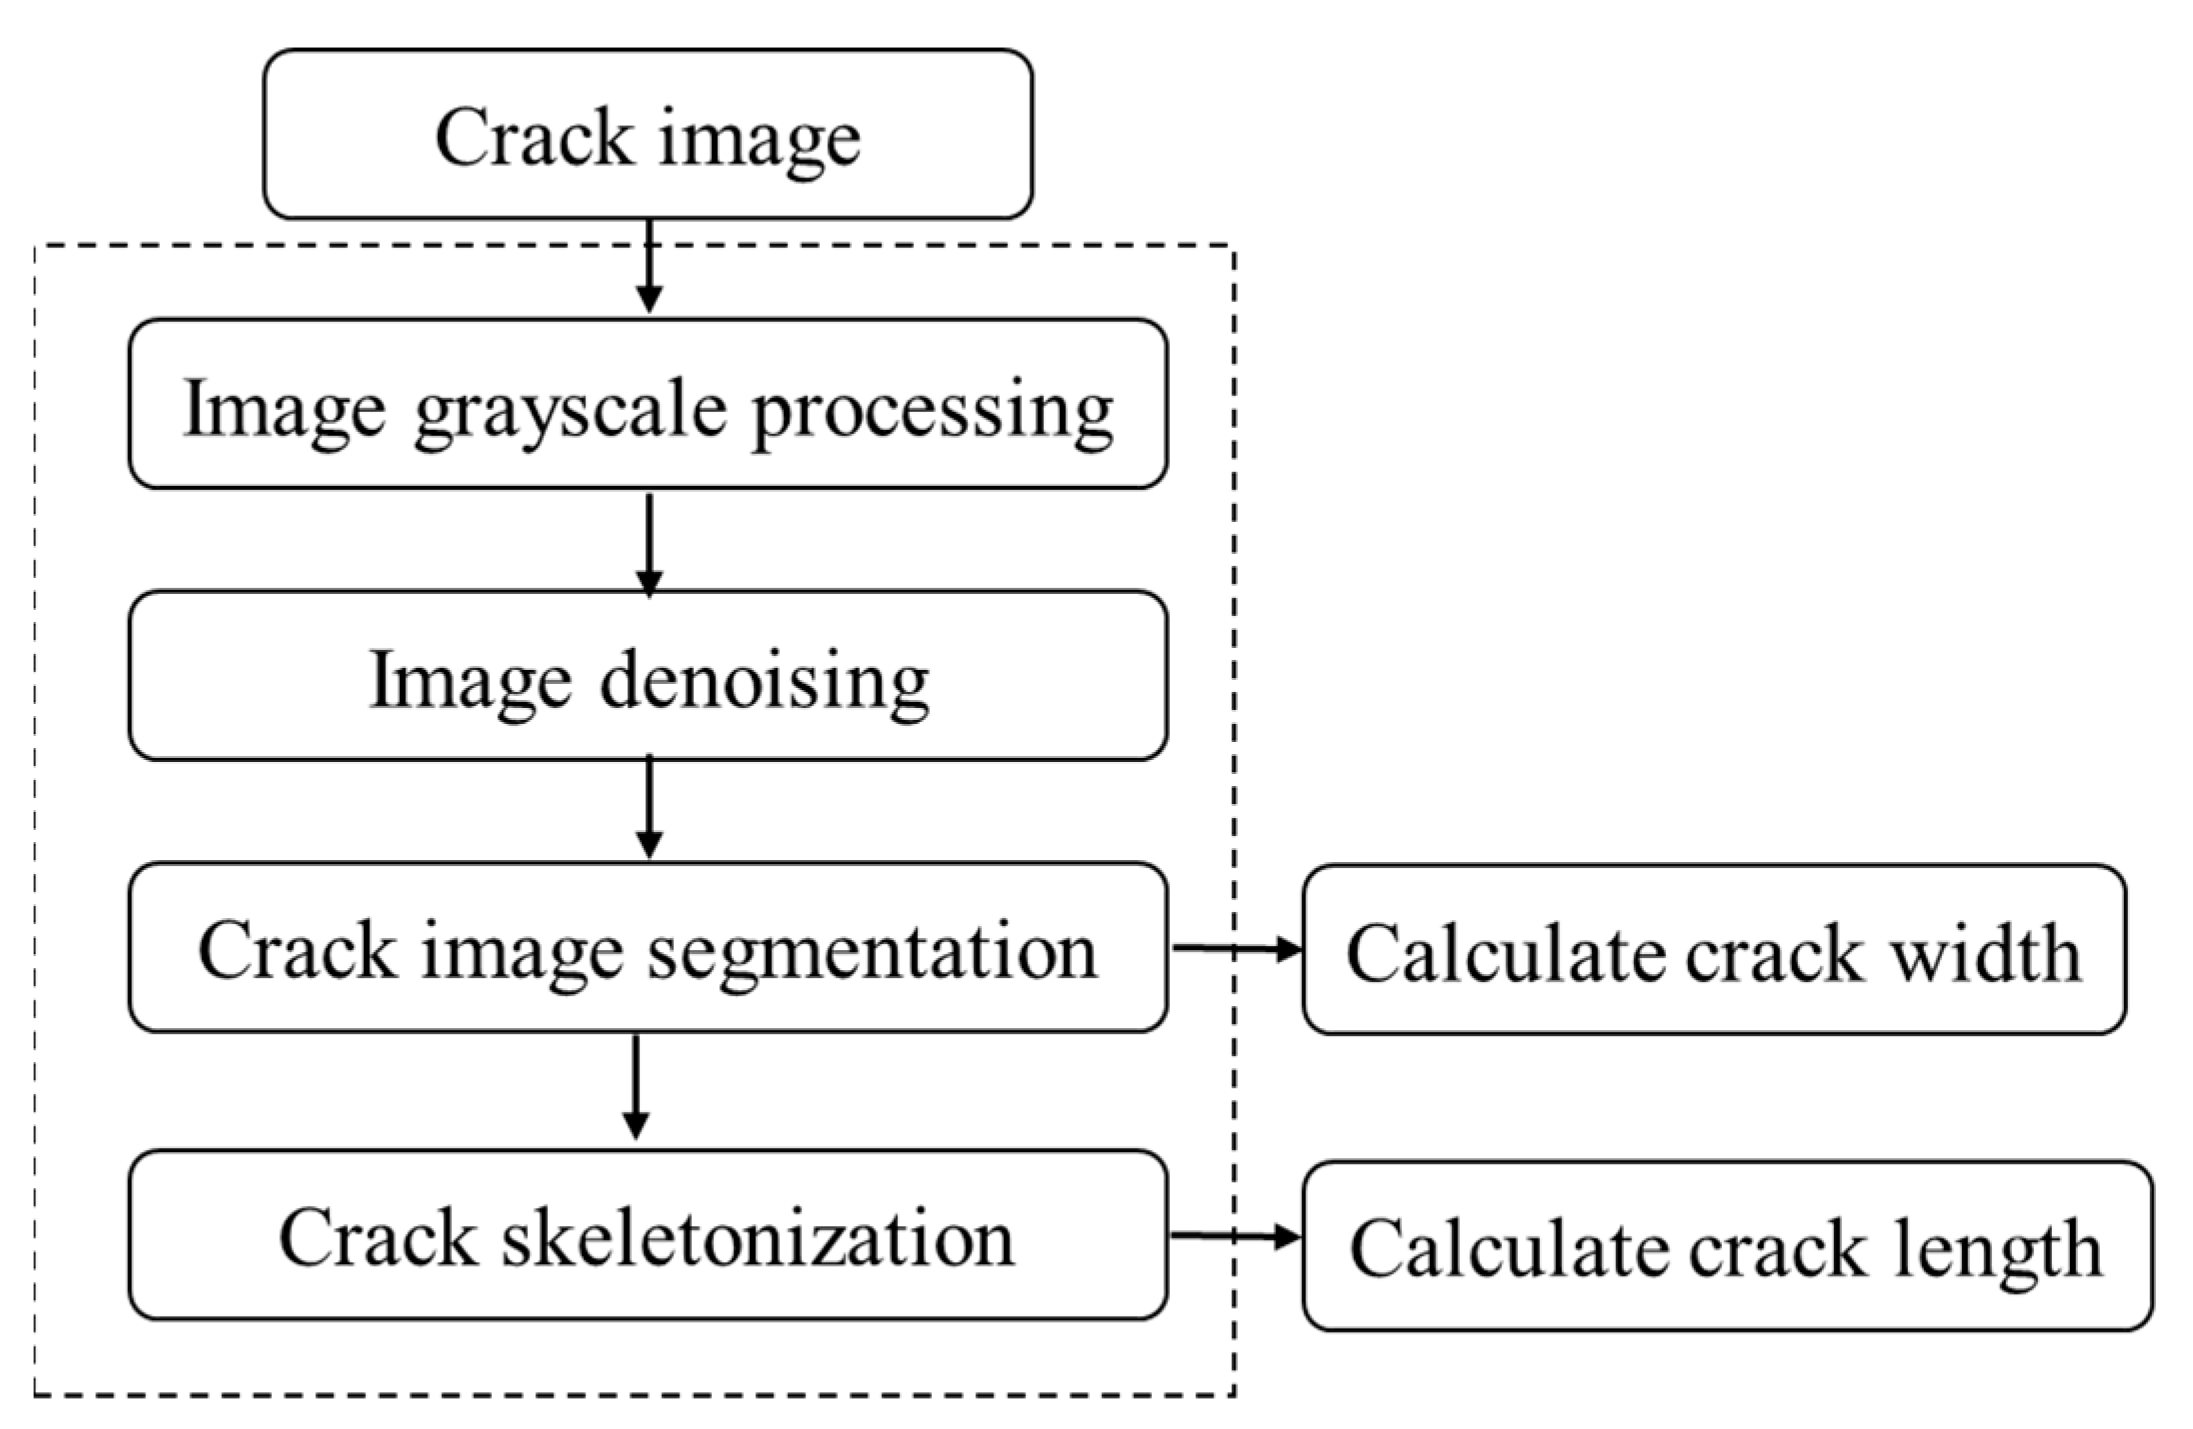
2.2. Crack Image Analysis Method
The crack detection method based on image processing has been widely used in concrete crack detection, pavement detection, bridge detection, tunnel detection, pipeline crack detection, and other civil engineering fields. This method primarily comprises four key steps: crack image acquisition, crack image preprocessing, crack image segmentation, and the calculation of crack geometric characteristic parameters. The criteria for choosing a good crack detection algorithm include the following aspects: (1) Detection accuracy: it should be able to detect as many real cracks as possible, avoid leakage and misdetection, and ensure the reliability of the detection results. (2) Robustness: it should be able to deal with cracks of various shapes, sizes, and directions and still be able to accurately detect cracks in the presence of noise in the image. (3) Efficiency: for a large number of crack detection applications, the algorithm needs to be processed quickly with high computational speed. (4) Applicability: it should be able to work in different application scenarios, such as crack detection in different fields such as construction, bridges, and roads. (5) Interpretive: the inspection results should be easy to interpret, convenient for users to understand the inspection process, and convenient for users to view and analyze the inspection results. The flow diagram of the crack detection is shown in Figure 3.

Figure 3.
Flow diagram of the crack detection.
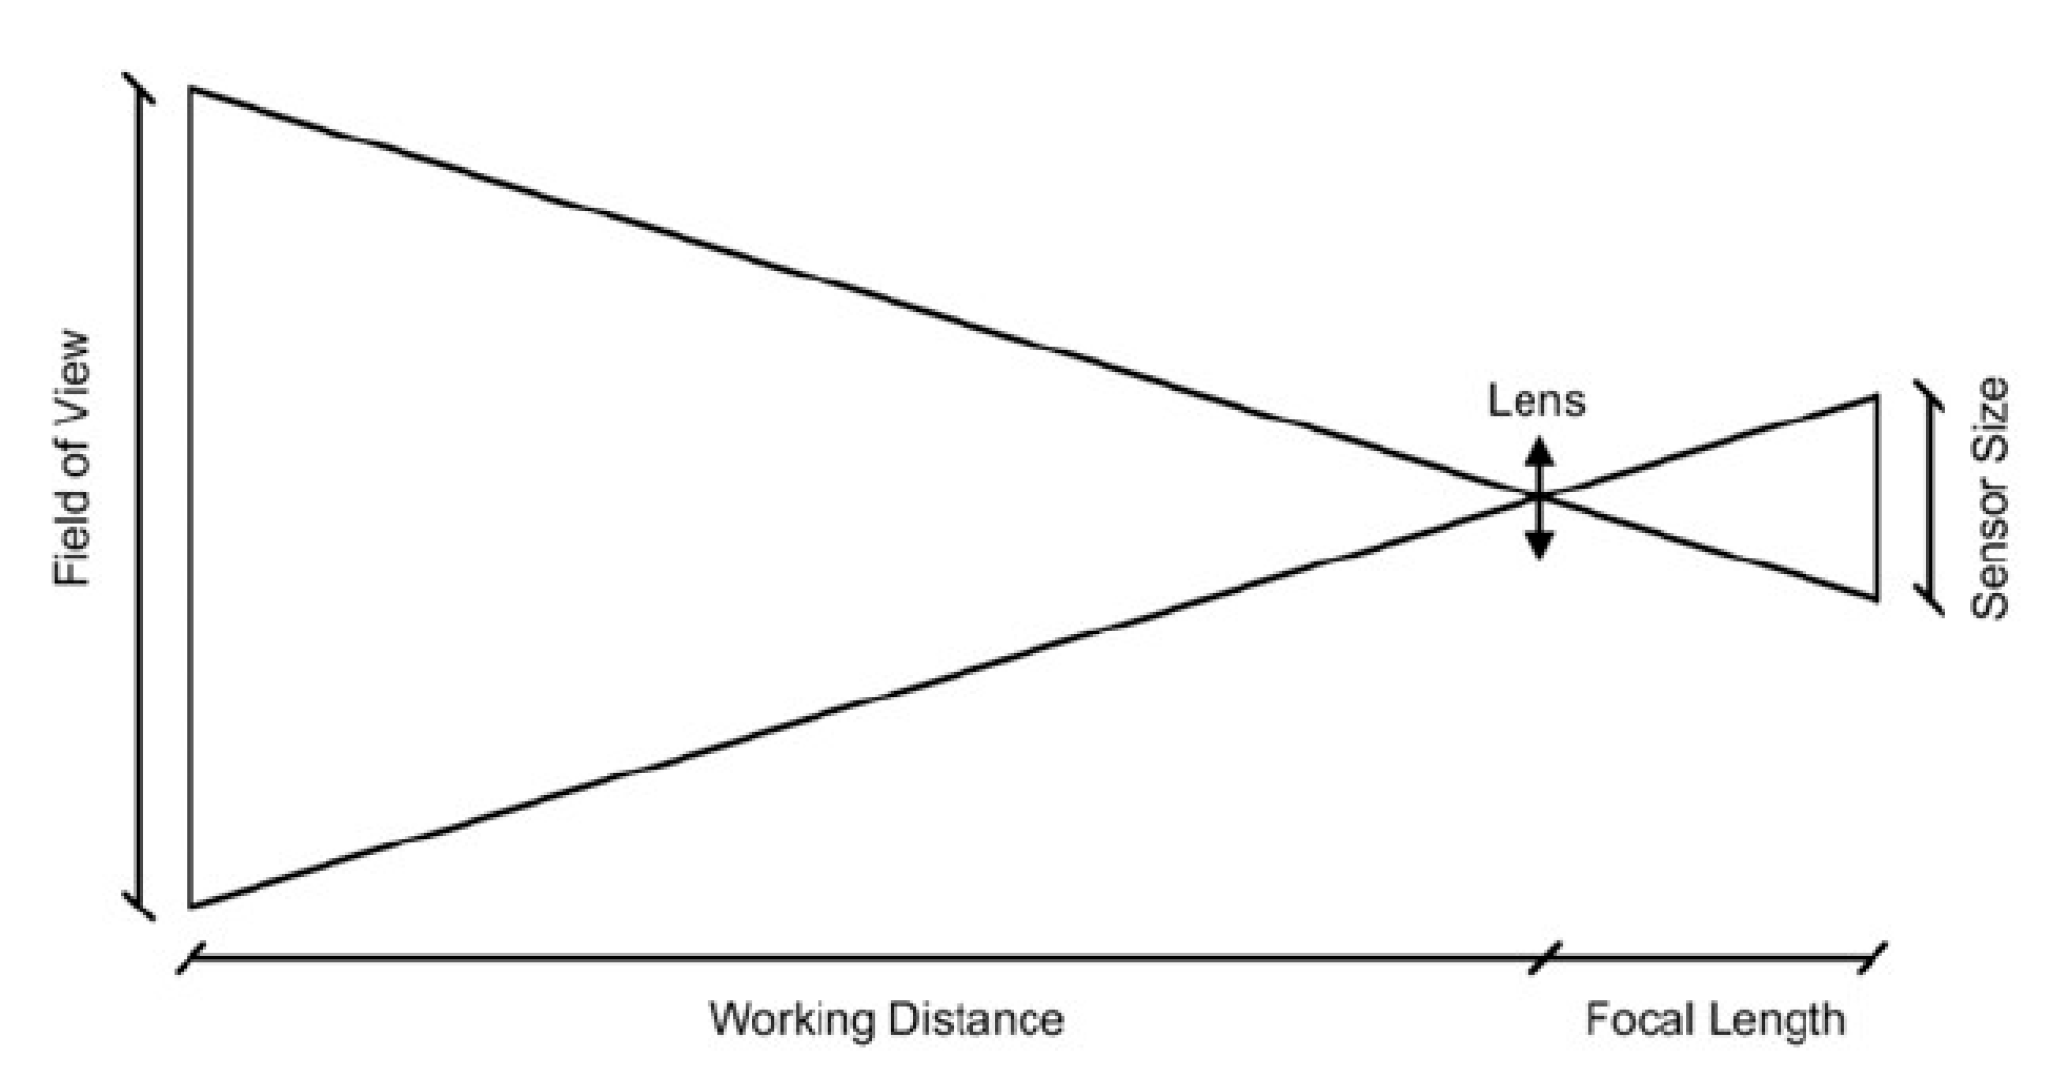
2.2.1. Crack Image Pixel Resolution
Crack image acquisition involves the use of digital cameras or other electronic equipment to capture images of cracks on the surface of a given structure. The pixel resolution of the crack image represents the actual size reflected by a single pixel. According to the pinhole imaging model, as shown in Figure 4. The relationship between pixel resolution, image resolution, camera focus, and shooting distance is as follows:
where is the pixel resolution (mm/pixel), is the distance from the crack plane to the camera (mm), is the camera focal length (mm), is the size of the camera sensor (mm2), and is the resolution of the camera sensor (pixels2).

Figure 4.
The geometric relation between the image acquisition parameters of pinhole imaging model.
2.2.2. Crack Image Preprocessing
The preprocessing of crack images mainly includes image grayscale and image denoising. The main purpose of this is to improve the crack image, remove the useless information in the crack image, remove background noise, and enhance the crack characteristics.
Image graying, a key component of preprocessing, involves the transformation of color crack images into grayscale images. The gray image only contains brightness information, not color information, which can effectively reduce the amount of information in the crack image and improve the efficiency of image post-processing. The weighted average method is commonly employed to calculate the gray value of each pixel. This approach is advantageous for both human visual perception and computer-based processing. The calculation formula is as follows:
where is the gray level of the output gray image, and , , and represent the red, green, and blue color components of the input crack image, respectively.
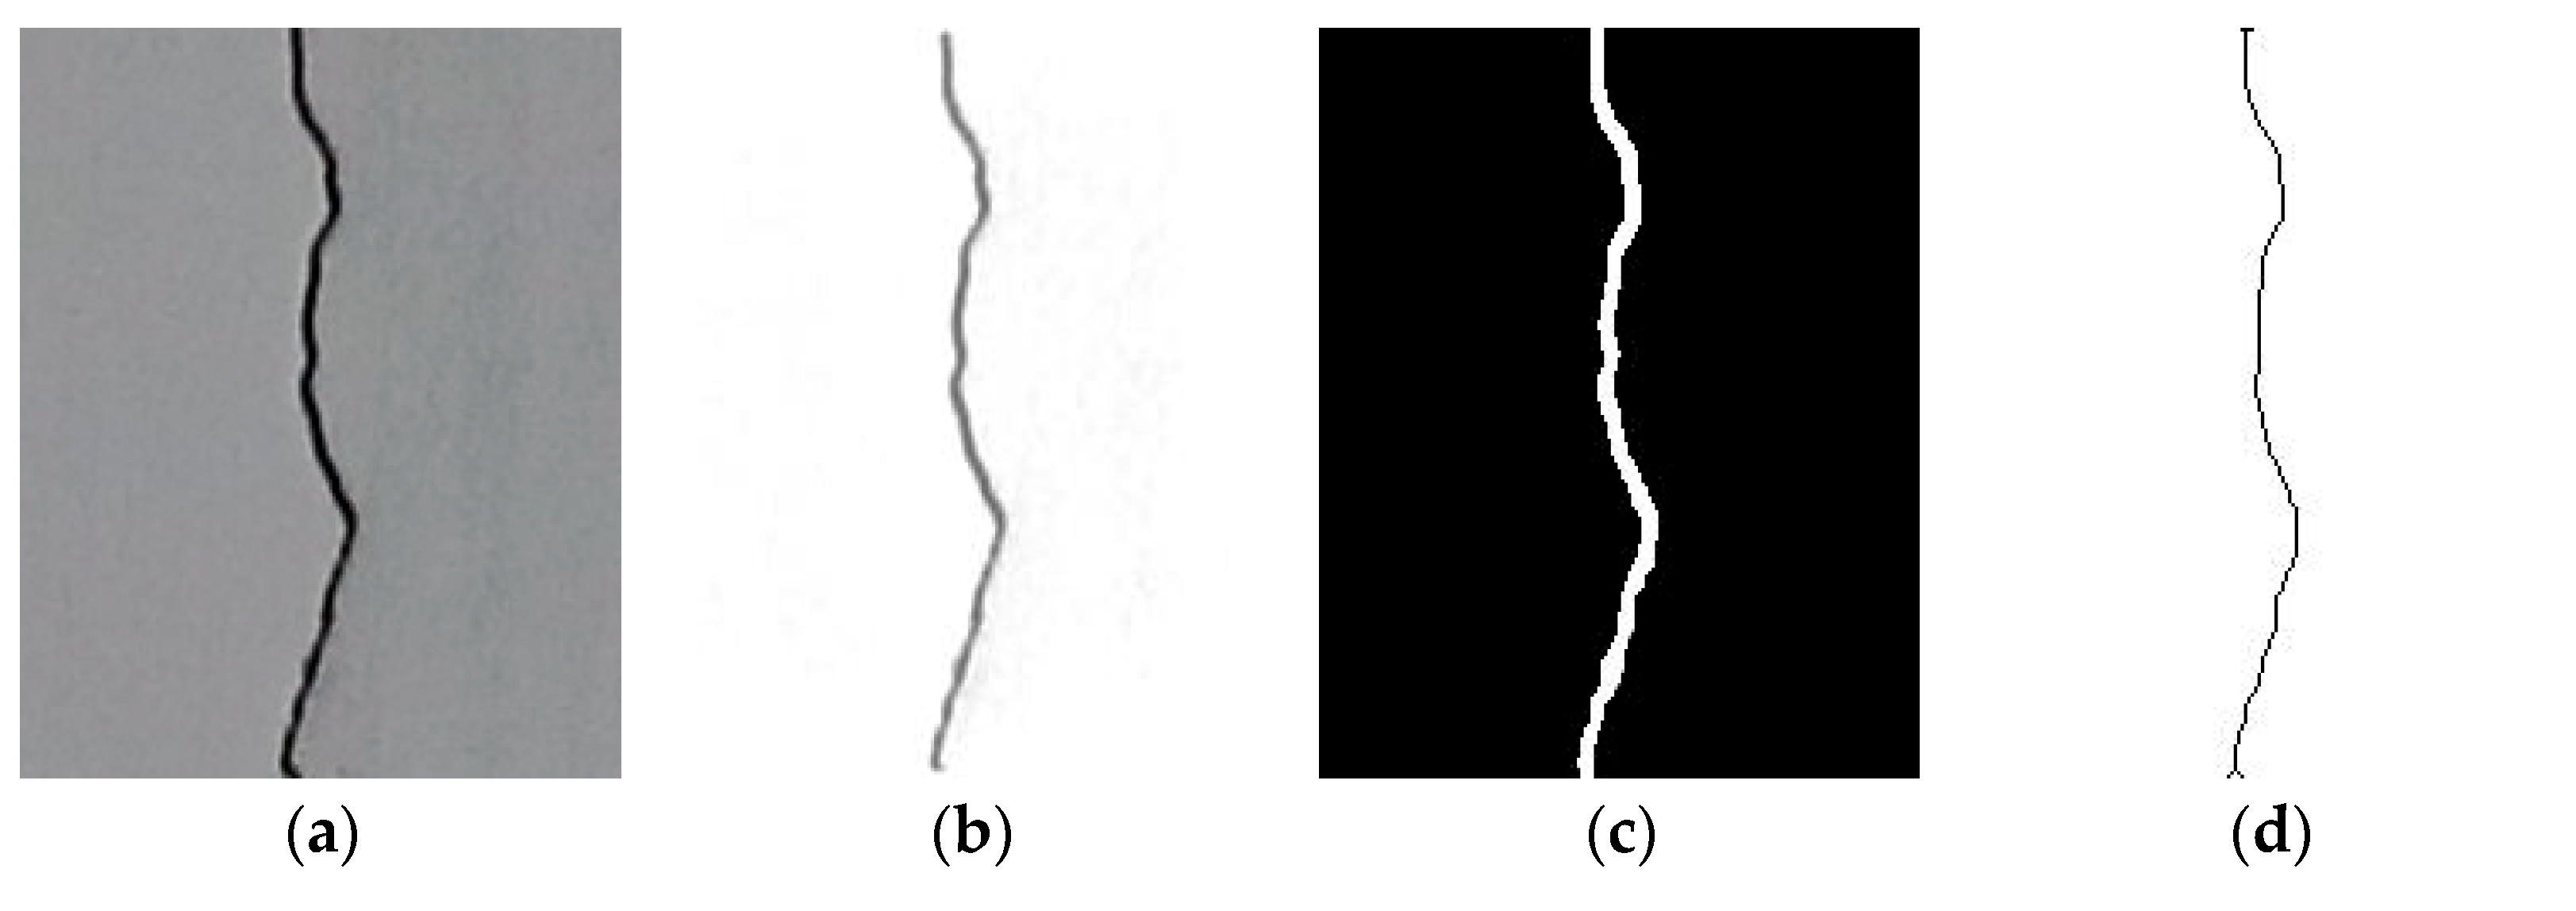
In the denoising phase of crack image preprocessing, a median filter is a commonly employed technique. This filter is utilized to smooth the original crack image and subtract the smoothed version from the original image. This approach is highly effective in eliminating the impact of various noise sources, including irregular lighting conditions and shadows, on crack detection. By applying the median filter and performing this subtraction, unwanted noise elements are efficiently suppressed, resulting in a cleaner and more accurate representation of the cracks in the image, as shown in Figure 5b.
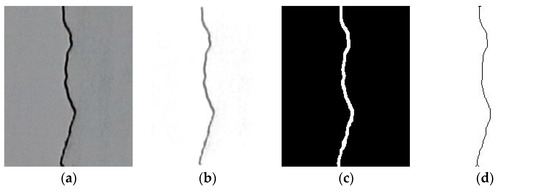
Figure 5.
Crack image processing: (a) original image of crack; (b) image preprocessing; (c) image segmentation; and (d) skeletonization.
2.2.3. Crack Image Segmentation
Crack image segmentation is to segment the crack from the original image so that the crack image can be divided into two parts: the target and the background. Essentially, it is a process of classifying the pixels in the crack image. The basis of classification includes gray values, spatial characteristics, and texture characteristics. Image segmentation methods can be divided into threshold-based image segmentation, edge-detection-based segmentation, and region-growth-based image segmentation. In this paper, the Otsu [20] method is used to segment the crack image. This method is an adaptive image threshold segmentation method that can automatically calculate the optimal threshold of the image without manually setting the threshold parameters. The algorithm is simple and computationally efficient, which is applicable to the segmentation tasks of different images. The crack image segmentation is shown in Figure 5c.
2.2.4. Calculation of Crack Geometric Characteristic Parameters
The calculation of crack geometric characteristic parameters includes crack width and crack length. Through the calculation of crack geometric parameters, structural crack damage can be detected from a qualitative to a quantitative level, providing detailed data for structural detection, monitoring, and subsequent maintenance. Figure 6 shows the calculation method of crack width.
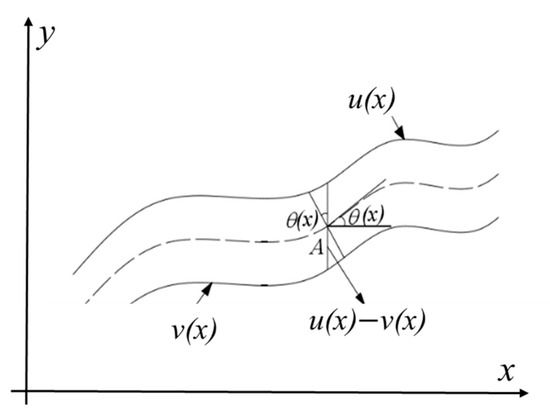
Figure 6.
Calculation method of crack width.
In the calculation of crack width, “” and “” are two continuous functions to represent the upper and lower boundaries of the crack. The center point of the crack can be expressed as . Substitute the coordinates of point A into the crack center point equation and solve the derivative. represents the dip angle of the midpoint of the crack. The slope of the curve at point A can be expressed as follows:
The crack width at point A is shown in the formula:
where is the crack width at point A.
Two continuous functions are used to represent the upper and lower boundaries of the crack, and then the crack width is determined by calculating the distance between these two boundaries. The use of continuous functions can accurately describe the boundary morphology of the cracks, capture the subtle changes and complex shapes of the cracks, and adapt to the boundary changes of various irregular cracks, thus improving the accuracy of crack width calculation.
The skeletonization method is used to calculate the crack length. Skeletonization is to remove the edge pixels of the segmented crack one by one and finally keep the center line, which is only one pixel wide, as shown in Figure 5d. The length of the crack can be obtained by counting the number of pixels after the skeletonization of the crack and multiplying it by the pixel resolution. This method can remove the redundant information in the crack image and only retain the main crack structure. It has a certain anti-interference ability to noise and makes the calculation of crack length more concise and accurate.
Errors that occur during crack detection based on image processing usually need to be considered in the following ways. (1) Image quality check: check the quality of the input image to ensure image clarity and usability. (2) Image preprocessing: image preprocessing, including grayscale conversion, smoothing, edge enhancement, etc., to reduce interference and highlight the characteristics of cracks. (3) Parameter adjustment: Adjust the parameters of the selected algorithm to obtain the best crack detection effect. Adjustment parameters include threshold value, parameters of the filter size, etc. (4) Crack filtering and optimization: post-process the detected cracks to remove small-sized cracks, connect broken crack segments, fill interruptions, etc., to improve the accuracy and continuity of the detection results. (5) Feedback and optimization: collect and analyze the types and causes of detection errors to provide feedback and guidance for further optimization of the algorithm. Continuously adjust and improve the crack detection algorithm according to the feedback results to improve its performance and robustness. Through the above steps, the errors occurring in the crack detection process based on image processing can be effectively dealt with, and the accuracy and robustness of the crack detection algorithm can be improved (Table 1).

Table 1.
Notation list.
3. Curved Structure Crack Detection Test
3.1. Experiment Design
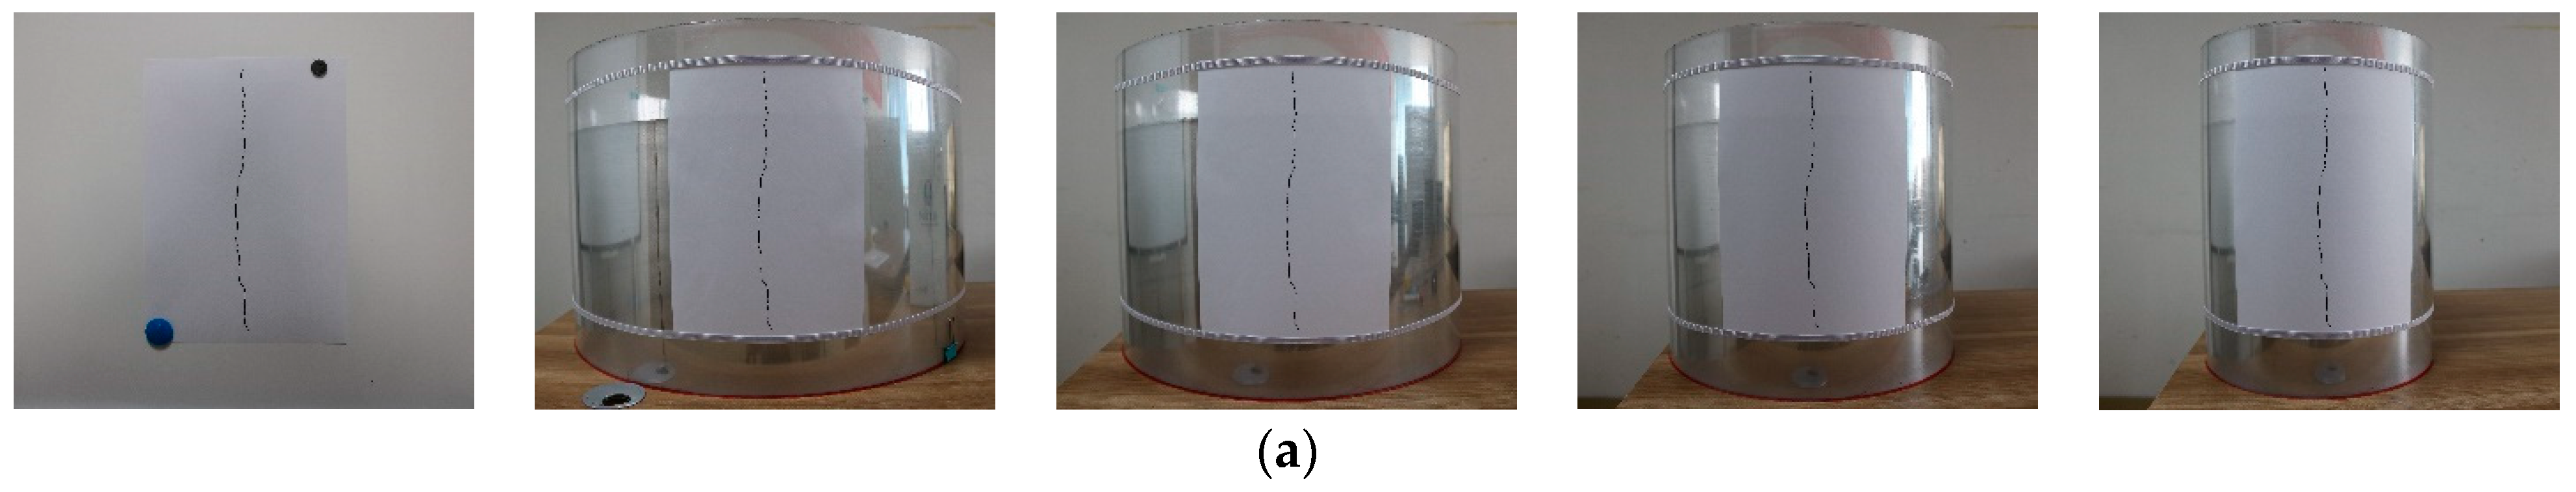
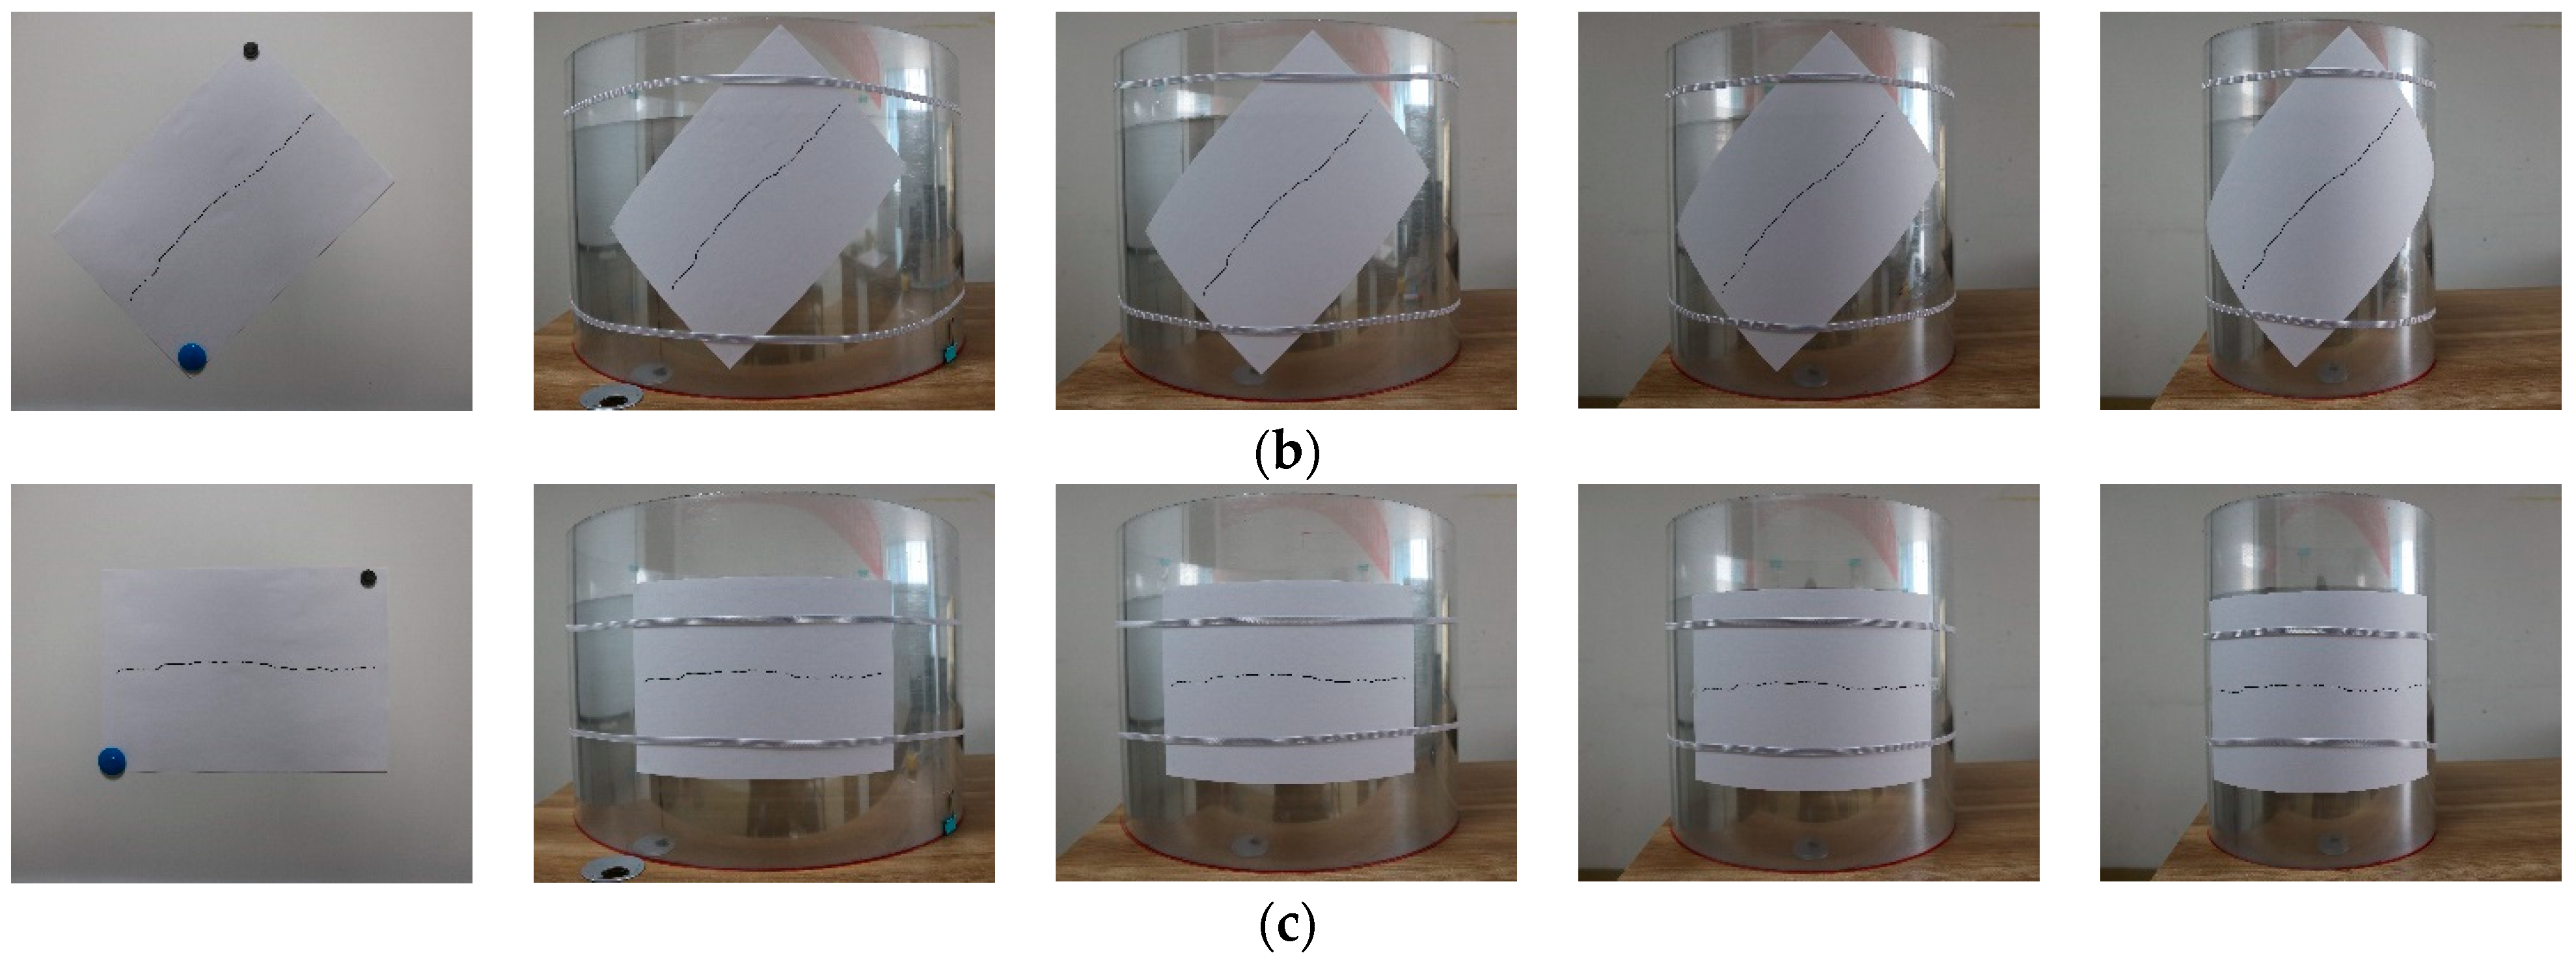
In order to better verify the application of the crack detection method based on image processing in curved surface structures, a CanonEOS 760D camera (Canon, Tokyo, Japan) was used to collect photos of real cracks on the surface of concrete structures, and the photos of cracks were printed on A4 paper as simulated cracks. The simulated cracks are pasted on the plane and the cylinder surface (Ocan Polymer Material Co., Ltd., Suzhou, China). Different curved structures are simulated by changing the cylinder diameter. The cylinder diameter is 600 mm, 500 mm, 400 mm, and 300 mm. The simulated cracks include vertical cracks (90° cracks), inclined cracks (45° cracks), and transverse cracks (0° cracks). The camera parameters used in the experiment are shown in Table 2. When collecting crack images, the imaging plane of the camera is parallel to the crack plane, the shooting distance is 500 mm, and the lens focal length is 18 mm. At this time, the pixel resolution of the crack image is 0.103 mm/pixel. Crack image acquisition is shown in Figure 7.
Table 2.
Parameters of the camera.
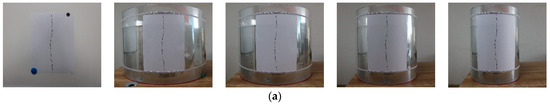
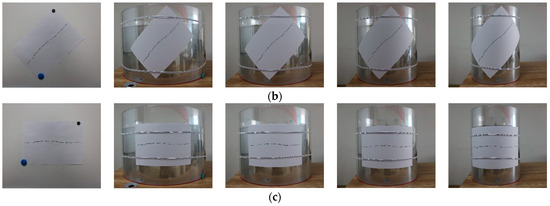
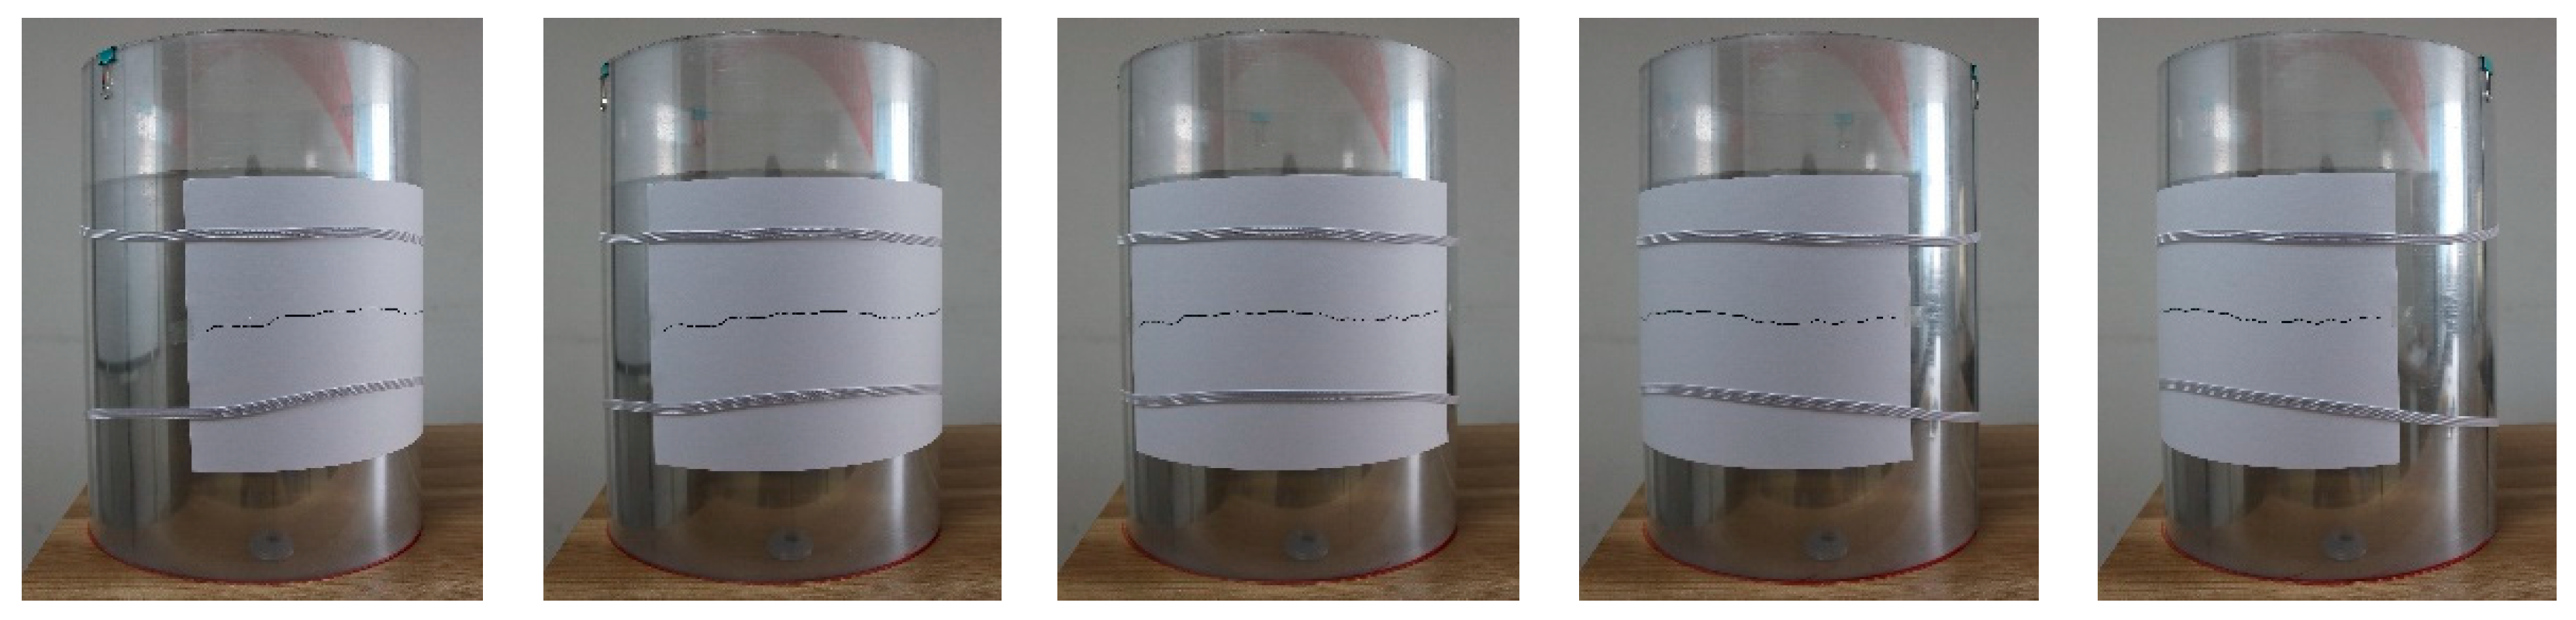
Figure 7.
Crack image acquisition on plane, 600 mm, 500 mm, 400 mm, and 300 mm diameter cylinder surfaces: (a) images of vertical cracks; (b) images of inclined cracks; and (c) images of transverse cracks.
3.2. Manual Measurement of Crack Parameters
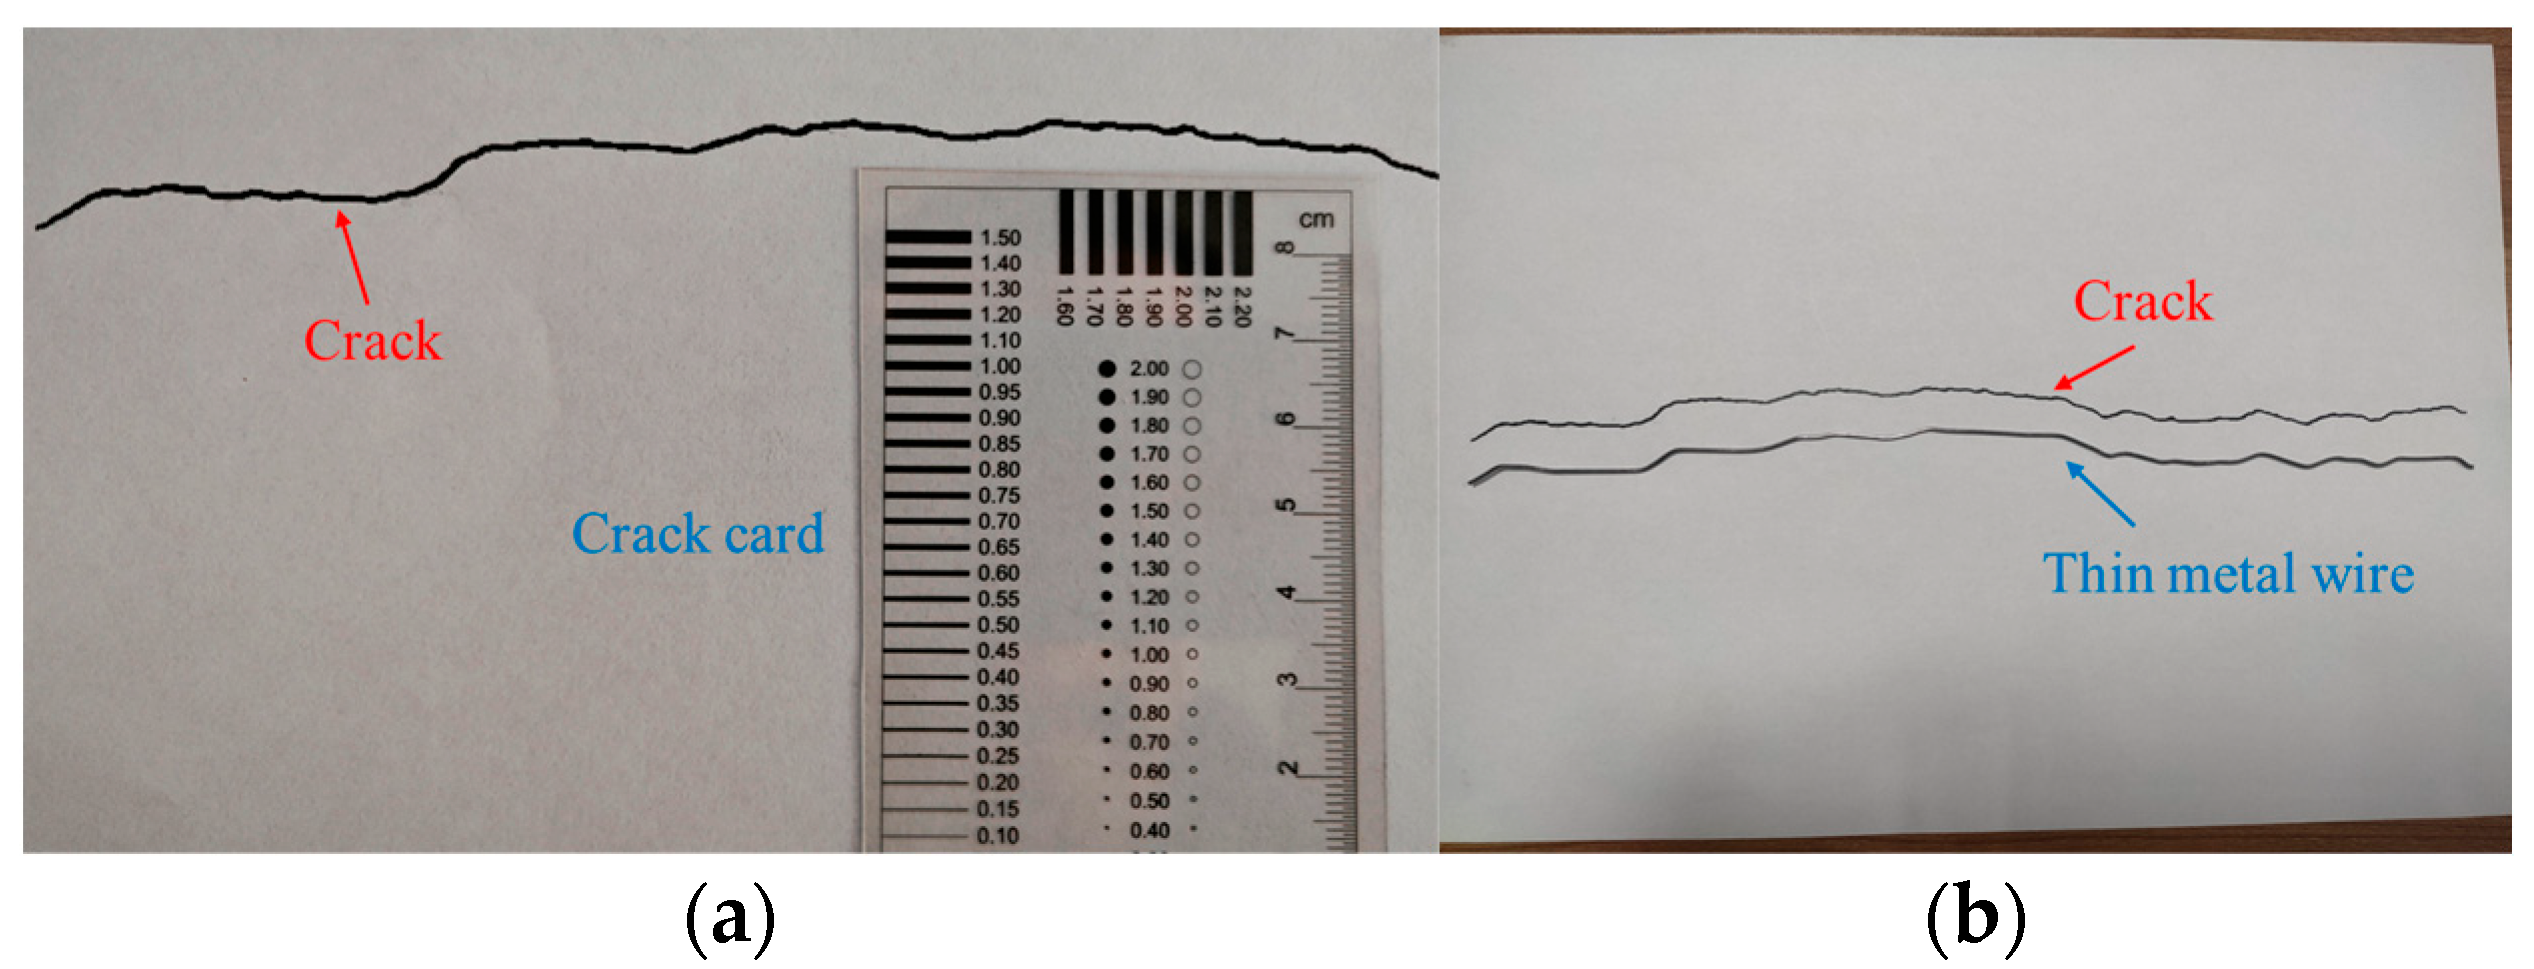
The manual measurement of crack parameters is shown in Figure 8. In manual crack width measurement, only a single point of the crack’s width can be assessed at a time, resulting in a labor-intensive process when measuring multiple points along the crack. To streamline this effort, we adopt the approach of using the plane crack width based on image processing as a representative value of the crack width in this experiment. This method allows for a more efficient and practical assessment.
Figure 8.
Manual measurement of crack parameters: (a) measuring crack width; (b) measuring crack length.
Given the curved nature of the crack, direct measurement of its length using a ruler would introduce significant errors. In the actual measurement, a thin metal wire is used to simulate the crack shape according to the crack trend and ensure that both ends of the thin metal wire coincide with the two ends of the crack. Finally, a ruler is used to measure the length of the straightened thin metal wire as the measured length of the crack.
3.3. Measurement Results for Different Types of Cracks
The crack detection method based on image processing was employed to process the crack images and calculate the width and length of the cracks. The experimental results are presented in Table 3 and Table 4.
Table 3.
Measurement results of crack width.
Table 4.
Comparison between crack length measurement results and manual measurement results.
From the experimental results of crack width and length, it can be seen that the measurement errors of vertical cracks, inclined cracks, and transverse cracks in plane structures are very small, indicating that the crack detection method based on image processing has very good accuracy in detecting plane cracks.
For cylindrical surfaces with diameters of 600 mm, 500 mm, 400 mm, and 300 mm, the measurement errors of inclined crack width are −3.61%, −3.61%, −4.82%, and −8.43%, respectively, and the measurement errors of transverse crack width are −6.02%, −7.23%, −8.43%, and −10.84%, respectively. The measurement error of inclined crack length on planar surfaces is only −0.76%. However, on cylindrical surfaces with diameters of 600 mm, 500 mm, 400 mm, and 300 mm, the measurement errors are significantly larger, at −3.46%, −3.90%, −6.21%, and −7.77%, respectively. The measurement error of transverse crack length on planar surfaces is only −0.87%. On cylindrical surfaces with diameters of 600 mm, 500 mm, 400 mm, and 300 mm, the measurement errors are significantly larger, at −8.64%, −10.81%, −14.45%, and −20.34%, respectively. As the curvature of the structural surface increases, the measurement errors of the inclined cracks and the transverse cracks gradually increase. Compared with the inclined crack, the curved structure has a greater influence on the measurement results of the transverse cracks, especially on the measurement value of the transverse crack length.
The measurement errors gradually increase as the curvature of the surface increases. The reason is that when using a digital camera to collect transverse crack images, the digital camera projects the three-dimensional surface structure crack onto a two-dimensional plane, and a large amount of dimensional information at both ends of the curved structure crack is lost, resulting in significant errors in the measurement of the length of the transverse crack. When the curvature of the surface structure is larger, the more dimensional information of the surface cracks collected by the digital camera is lost, which leads to an increase in the error of the crack detection results. Therefore, it is necessary to consider the impact of structural curvature on crack measurement.
The influence of curved structures on the measurement results of vertical cracks is very small and can be ignored. This is due to the narrow width of vertical cracks, which is significantly smaller than the surface width of cylindrical structures. Consequently, changes in the structural surface have negligible effects on the measurement outcomes of vertical cracks.
4. Crack Image Stitching Detection
4.1. Crack Image Stitching
The curved structure surface has a great influence on the measurement results of transverse cracks, and this study focuses on transverse cracks as the primary research subject. The image stitching method is used to stitch the crack images collected from different angles into a complete crack image, and image processing is performed on the transverse cracks after stitching to calculate the crack width and length information. By analyzing the manual measurement results, image processing measurement results, and image stitching measurement results of transverse cracks, we can verify the feasibility and effectiveness of the application of image stitching technology in the crack detection of curved structures.
During image acquisition, the camera takes the transverse crack on the surface of the cylinder as the center starts from the left endpoint of the crack and shoots the crack images sequentially from left to right. Each of these images has at least 50% overlap with its neighboring images to ensure that all the information about the crack is captured. All images were taken by a Canon EOS 760D digital camera with a shooting distance of 500 mm and a lens focal length of 18 mm. At this time, the pixel resolution of the crack image is 0.103 mm/pixel. The image acquisition of the transverse crack under the cylindrical surface with a diameter of 300 mm is shown in Figure 9.
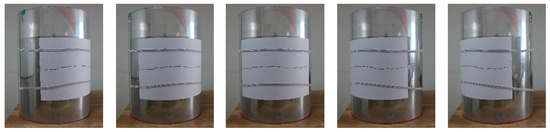
Figure 9.
Transverse cracks are collected from multiple angles.
In this study, two image stitching methods are employed. The first method combines two crack images captured from different angles into a single image, while the second method stitches three crack images from varying angles into one image. In order to reduce the workload in the process of image stitching, the original crack images are appropriately cut while retaining the crack information. In this paper, the feature-based image stitching algorithm is used to complete the stitching of the crack images through MATLAB 2016a software (The MathWorks Inc., Natick, MA, USA). The images of crack stitching are shown in Figure 10.
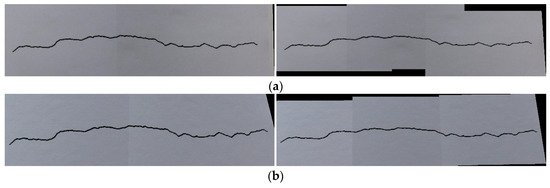
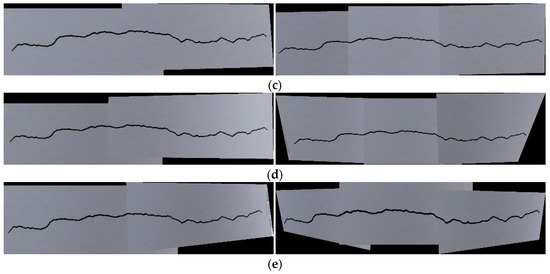
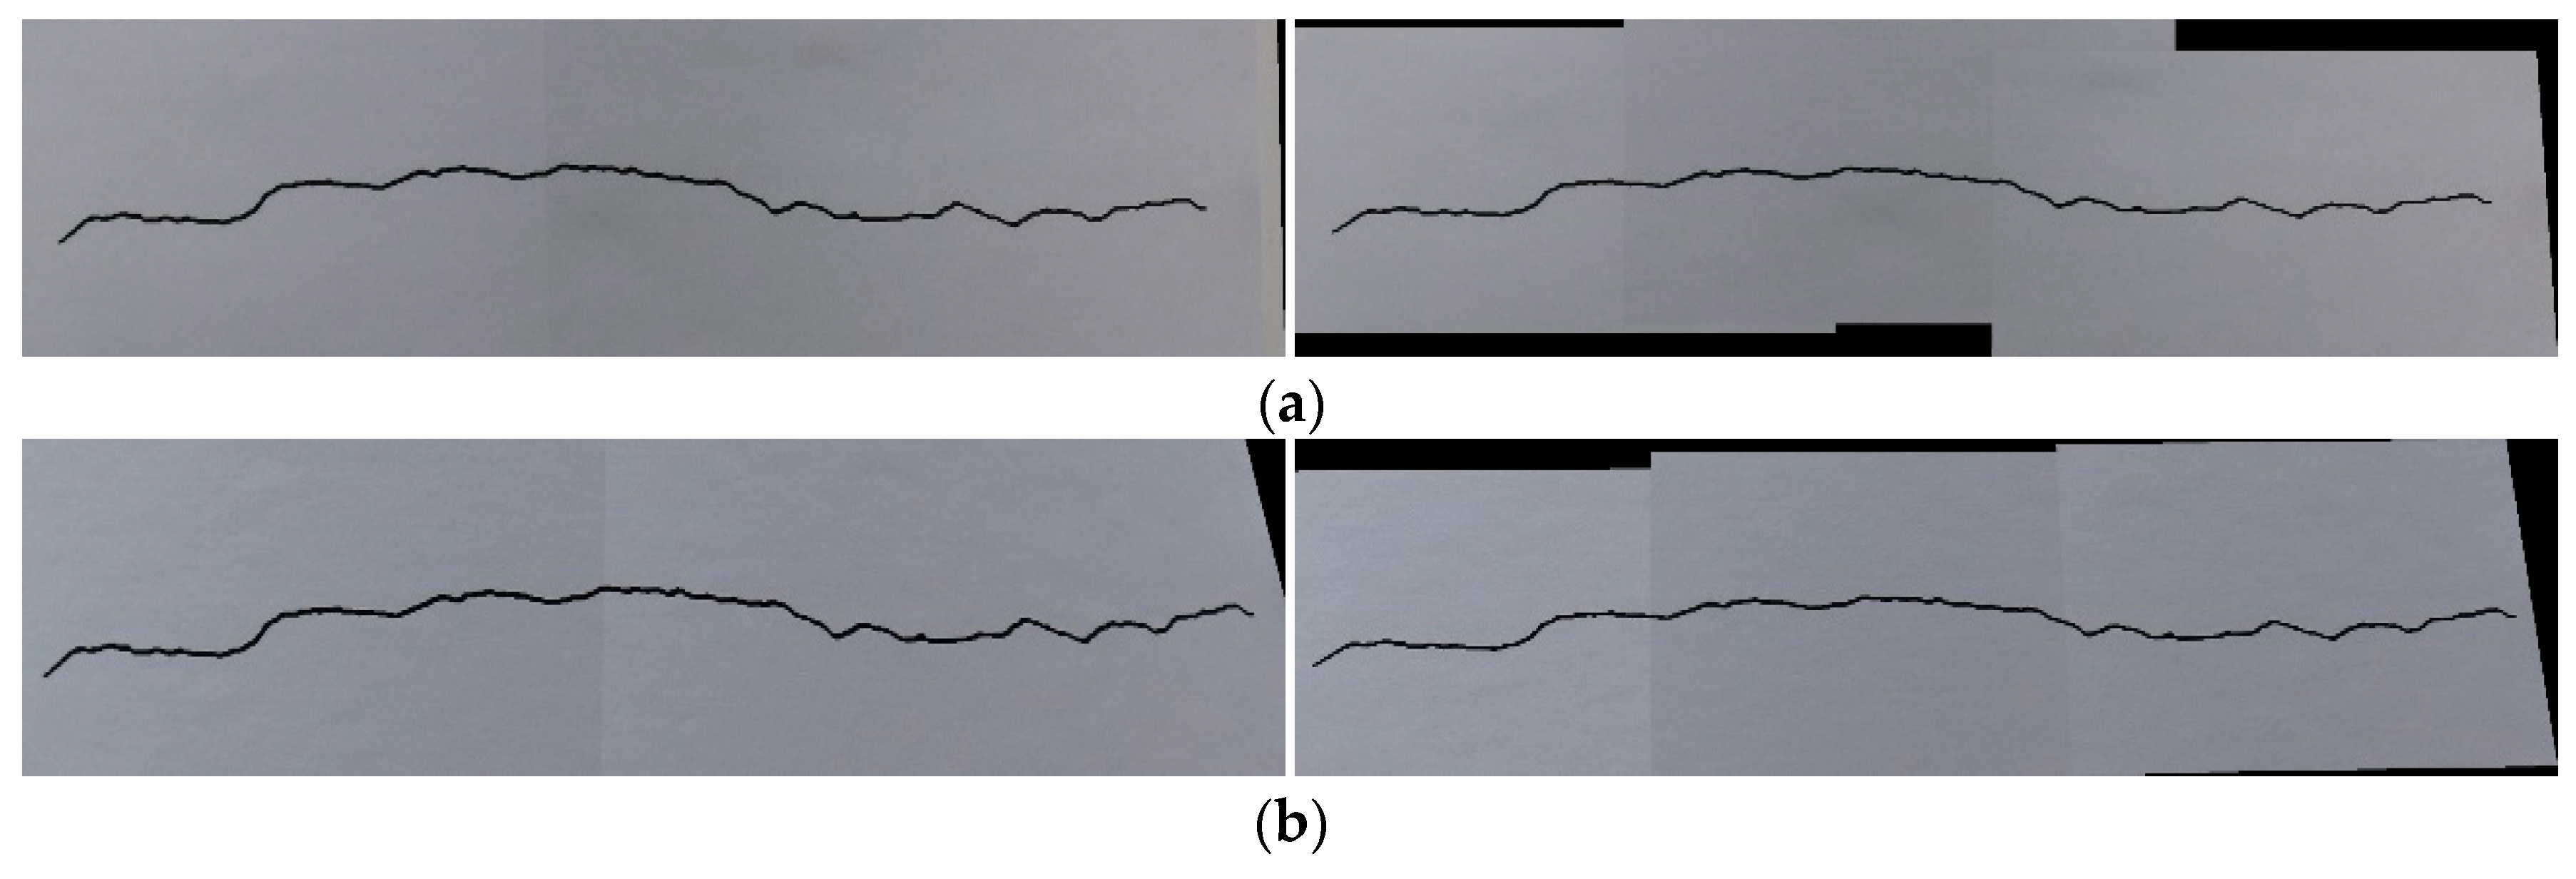
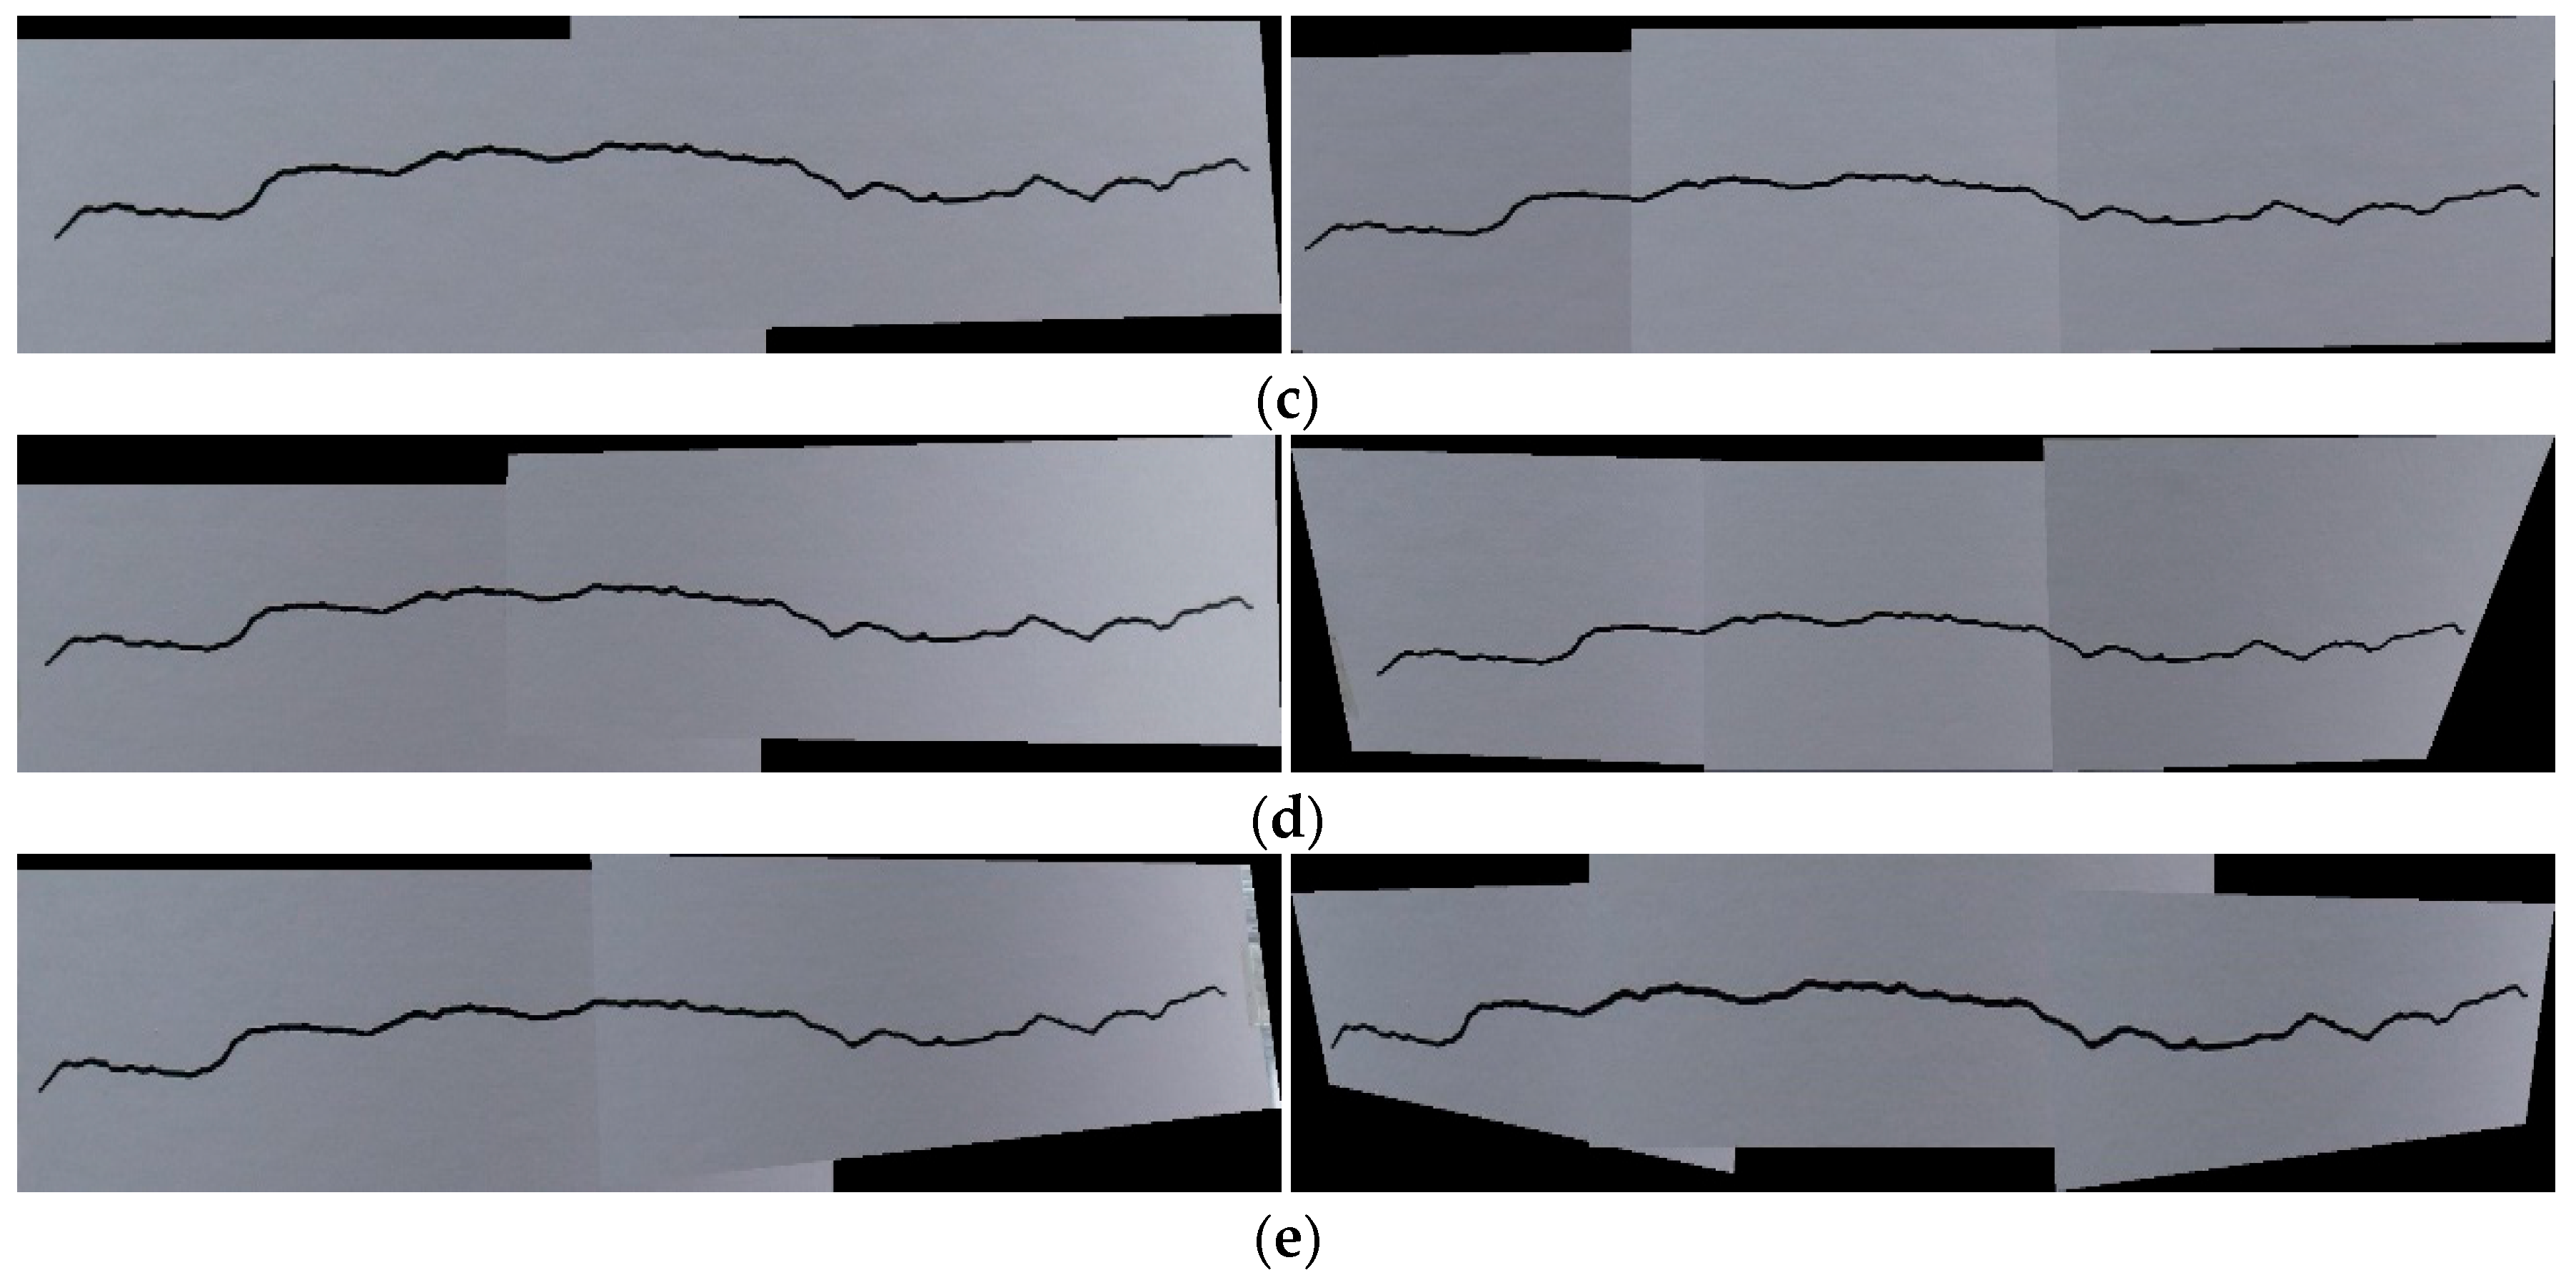
Figure 10.
Stitching of two pictures and three pictures on different surface structures. (a) Plane; (b) 600 mm diameter cylindrical surface; (c) 500 mm diameter cylindrical surface; (d) 400 mm diameter cylindrical surface; and (e) 300 mm diameter cylindrical surface.
4.2. Analysis of Stitched Cracks
The measurement results for the width and length of stitched cracks are presented in Table 5 and Table 6. In the plane structure, the difference in width measurement between stitched cracks and front-shot cracks is only 0.02 mm, and the difference in length measurement is 1.22 mm. These findings demonstrate that the image stitching algorithm employed in this study effectively stitches crack images without introducing measurement errors, ensuring high accuracy.
Table 5.
Measurement results of transverse stitched crack width.
Table 6.
Measurement results of transverse stitched crack length.
In different curved surface structures, the measurement results of stitched cracks are closer to the true value and have higher accuracy than those of front-shot cracks. This shows that the image stitching method can effectively reduce the errors of crack measurement in the crack detection of curved surface structures, and it is feasible to improve the accuracy of crack detection results on curved surface structures. In addition, the measurement results of the three pictures’ stitching cracks have fewer errors than those of the two pictures’ stitching cracks, which indicates that the stitching effect of the three pictures is better than that of the two pictures’ stitching.
4.3. Segmental Analysis of Stitched Cracks
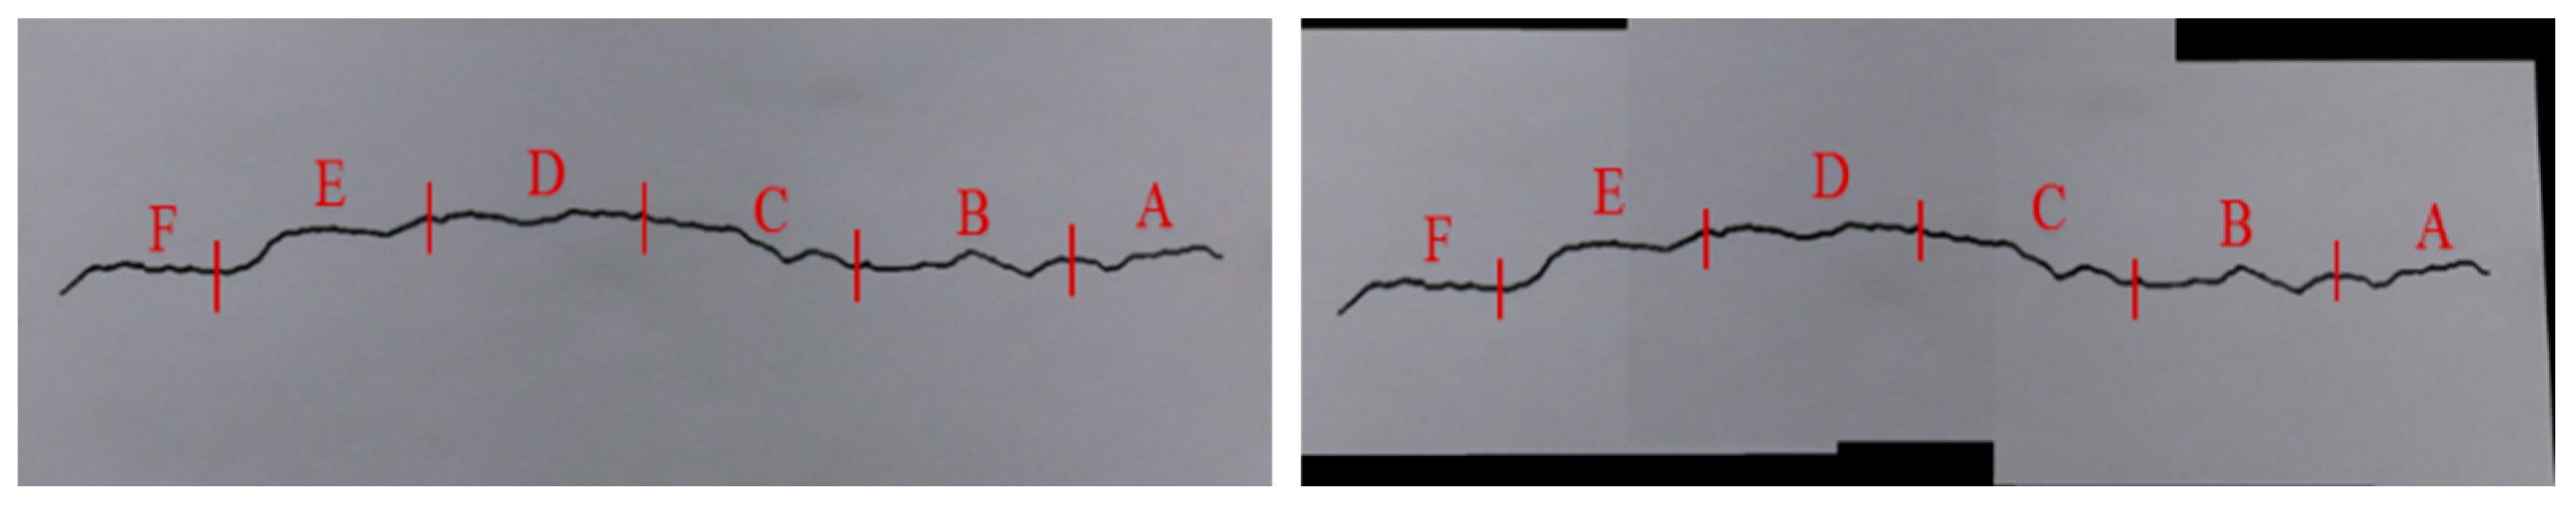
To further elucidate the impact and rationale of the image stitching method in enhancing the accuracy of surface crack detection results, a comparison was conducted between front-shot crack images and crack images stitched from three pictures. The crack is divided into six parts: A, B, C, D, E, and F, as shown in Figure 11.
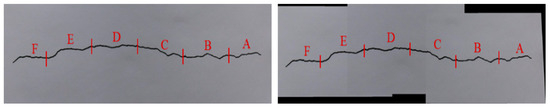
Figure 11.
The crack is divided into 6 parts: A, B, C, D, E, and F.
Calculating the width and length of each part of the cracks and the measurement results are shown in Table 7 and Table 8. In the plane structure, the measurement results of each part of the front-shot cracks and the stitched cracks are similar, reaffirming the high accuracy of the image stitching method employed in the experiment.
Table 7.
Comparison of width measurement results of front-shot cracks and stitched cracks.
Table 8.
Comparison of length measurement results of front-shot cracks and stitched cracks.
In the context of curved structures, as structural curvature increases, the length measurement results for parts C and D, located at the center of the transverse crack, show minimal differences. This suggests that the variation in structural curved surfaces has a limited impact on the crack measurement results for parts C and D. However, the length measurement errors for parts A, B, E, and F progressively increase. This phenomenon arises from the use of a camera to capture curved cracks, whereby as the crack length extends, an increasing amount of information is lost at both ends of the crack, adversely affecting the measurement results. Consequently, it is evident that the factors influencing the accuracy of crack detection on curved surface structures encompass the degree of curvature of the surface and the crack’s length.
The length measurement results of the four parts A, B, E, and F of the stitched cracks show a smaller error compared to the measurement results of the front-shot cracks. This indicates that the image stitching method can reduce the information loss at both ends of the curved surface cracks, thereby diminishing the influence of the structural curved surface on the crack measurement results.
5. Conclusions
This study proposes a new method to improve the accuracy of curved surface crack detection using a SURF-based image stitching algorithm. This study reveals the influence of surface curvature on the accuracy of crack detection, proves the effectiveness of the image stitching method in mitigating surface crack measurement errors, and solves the challenges faced when measuring cracks on curved surfaces. The following conclusions are obtained:
- (1)
- The influence of the structural curvature on the measurement results of vertical cracks is very small and can be ignored. Compared with inclined cracks, the curvature of the structure significantly affects the measurement of transverse cracks, especially the length measurement results of transverse cracks. The results of crack segmentation measurements indicate that the factors that affect the accuracy of crack detection include the size of the surface curvature and the length of the crack.
- (2)
- In the plane structure, the measurement results of the width and length of stitched cracks are very close to those of front-shot cracks. The image stitching algorithm used in this paper can well stitch the crack images and has good accuracy.
- (3)
- When using a digital camera to capture crack images on the surface of curved structures, the loss of dimensional information of the cracks will lead to errors in the crack measurement results. The use of SURF-based image stitching significantly improves the accuracy of crack measurement on curved structures by preserving dimensional information and reducing errors due to curvature.
Author Contributions
Methodology, D.C. and C.Z.; software, D.C.; funding acquisition, C.Z.; writing—original draft preparation, D.C.; writing—review and editing, C.Z. All authors have read and agreed to the published version of the manuscript.
Funding
This work is supported by the National Key Research and Development Program (2019YFE0112400) and the Key Research and Development Program of Shandong Province (2021CXGC011204).
Data Availability Statement
The data presented in this study are available upon request from the corresponding author.
Conflicts of Interest
The authors declare no conflicts of interest.
References
- Xie, R.; Yao, J.; Liu, K.; Lu, X.; Liu, Y.; Xia, M.; Zeng, Q. Automatic multi-image stitching for concrete bridge inspection by combining point and line features. Autom. Constr. 2018, 90, 265–280. [Google Scholar] [CrossRef]
- Dabous, S.A.; Feroz, S. Condition monitoring of bridges with non-contact testing technologies. Autom. Constr. 2020, 116, 103224. [Google Scholar] [CrossRef]
- Jahanshahi, M.R.; Masri, S.F.; Sukhatme, G.S. Multi-image stitching and scene reconstruction for evaluating defect evolution in structures. Struct. Health Monit. 2011, 10, 643–657. [Google Scholar] [CrossRef]
- Fujita, Y.; Mitani, Y.; Hamamoto, Y. A method for crack detection on a concrete structure. In Proceedings of the 18th International Conference on Pattern Recognition (ICPR’06), Hong Kong, China, 20–24 August 2006. [Google Scholar]
- Yamaguchi, T.; Nakamura, S.; Saegusa, R.; Hashimoto, S. Image-based crack detection for real concrete surfaces. IEEJ Trans. Electr. Electron. Eng. 2008, 3, 128–135. [Google Scholar] [CrossRef]
- Jahanshahi, M.R.; Masri, S.F. Adaptive vision-based crack detection using 3D scene reconstruction for condition assessment of structures. Autom. Constr. 2012, 22, 567–576. [Google Scholar] [CrossRef]
- Jahanshahi, M.R.; Masri, S.F. A new methodology for non-contact accurate crack width measurement through photogrammetry for automated structural safety evaluation. Smart Mater. Struct. 2013, 22, 035019. [Google Scholar] [CrossRef]
- Zhang, W.; Zhang, Z.; Qi, D.; Liu, Y. Automatic crack detection and classification method for subway tunnel safety monitoring. Sensors 2014, 14, 19307–19328. [Google Scholar] [CrossRef] [PubMed]
- Adhikari, R.; Moselhi, O.; Bagchi, A. Image-based retrieval of concrete crack properties for bridge inspection. Autom. Constr. 2014, 39, 180–194. [Google Scholar] [CrossRef]
- Li, G.; Zhao, X.; Du, K.; Ru, F.; Zhang, Y. Recognition and evaluation of bridge cracks with modified active contour model and greedy search-based support vector machine. Autom. Constr. 2017, 78, 51–61. [Google Scholar] [CrossRef]
- Li, S.; Zhao, X.; Zhou, G. Automatic pixel-level multiple damage detection of concrete structure using fully convolutional network. Comput.-Aided Civ. Infrastruct. Eng. 2019, 34, 616–634. [Google Scholar] [CrossRef]
- Dung, C.V. Autonomous concrete crack detection using deep fully convolutional neural network. Autom. Constr. 2019, 99, 52–58. [Google Scholar] [CrossRef]
- Liu, Z.; Cao, Y.; Wang, Y.; Wang, W. Computer vision-based concrete crack detection using U-net fully convolutional networks. Autom. Constr. 2019, 104, 129–139. [Google Scholar] [CrossRef]
- Brown, L.G. A survey of image registration techniques. ACM Comput. Surv. (CSUR) 1992, 24, 325–376. [Google Scholar] [CrossRef]
- Scharstein, D.; Szeliski, R. A Taxonomy and Evaluation of Dense Two-Frame Stereo Correspondence Algorithms. Int. J. Comput. Vis. 2002, 47, 7–42. [Google Scholar] [CrossRef]
- Lowe, D.G. Distinctive Image Features from Scale-Invariant Keypoints. Int. J. Comput. Vis. 2004, 60, 91–110. [Google Scholar] [CrossRef]
- Bay, H.; Tuytelaars, T.; Van Gool, L. SURF: Speeded Up Robust Features. In Proceedings of the Computer Vision—ECCV 2006, Graz, Austria, 7–13 May 2006. [Google Scholar]
- Morel, J.-M.; Yu, G. ASIFT: A New Framework for Fully Affine Invariant Image Comparison. SIAM J. Imaging Sci. 2009, 2, 438–469. [Google Scholar] [CrossRef]
- Chen, J.; Li, Q.; Peng, Q.; Wong, K.H. CSIFT based locality-constrained linear coding for image classification. Pattern Anal. Appl. 2015, 18, 441–450. [Google Scholar] [CrossRef]
- Ostu, N. A threshold selection method from gray-level histograms. IEEE Trans. SMC 1979, 9, 62. [Google Scholar]


Disclaimer/Publisher’s Note: The statements, opinions and data contained in all publications are solely those of the individual author(s) and contributor(s) and not of MDPI and/or the editor(s). MDPI and/or the editor(s) disclaim responsibility for any injury to people or property resulting from any ideas, methods, instructions or products referred to in the content. |
© 2024 by the authors. Licensee MDPI, Basel, Switzerland. This article is an open access article distributed under the terms and conditions of the Creative Commons Attribution (CC BY) license (https://creativecommons.org/licenses/by/4.0/).