
The Risk of Alkali–Carbonate Reaction and the Freeze–Thaw Resistance of Waste Dolomite Slag-Based Concrete

Abstract
:1. Introduction
2. Materials and Methods
2.1. Materials
2.2. Test Method
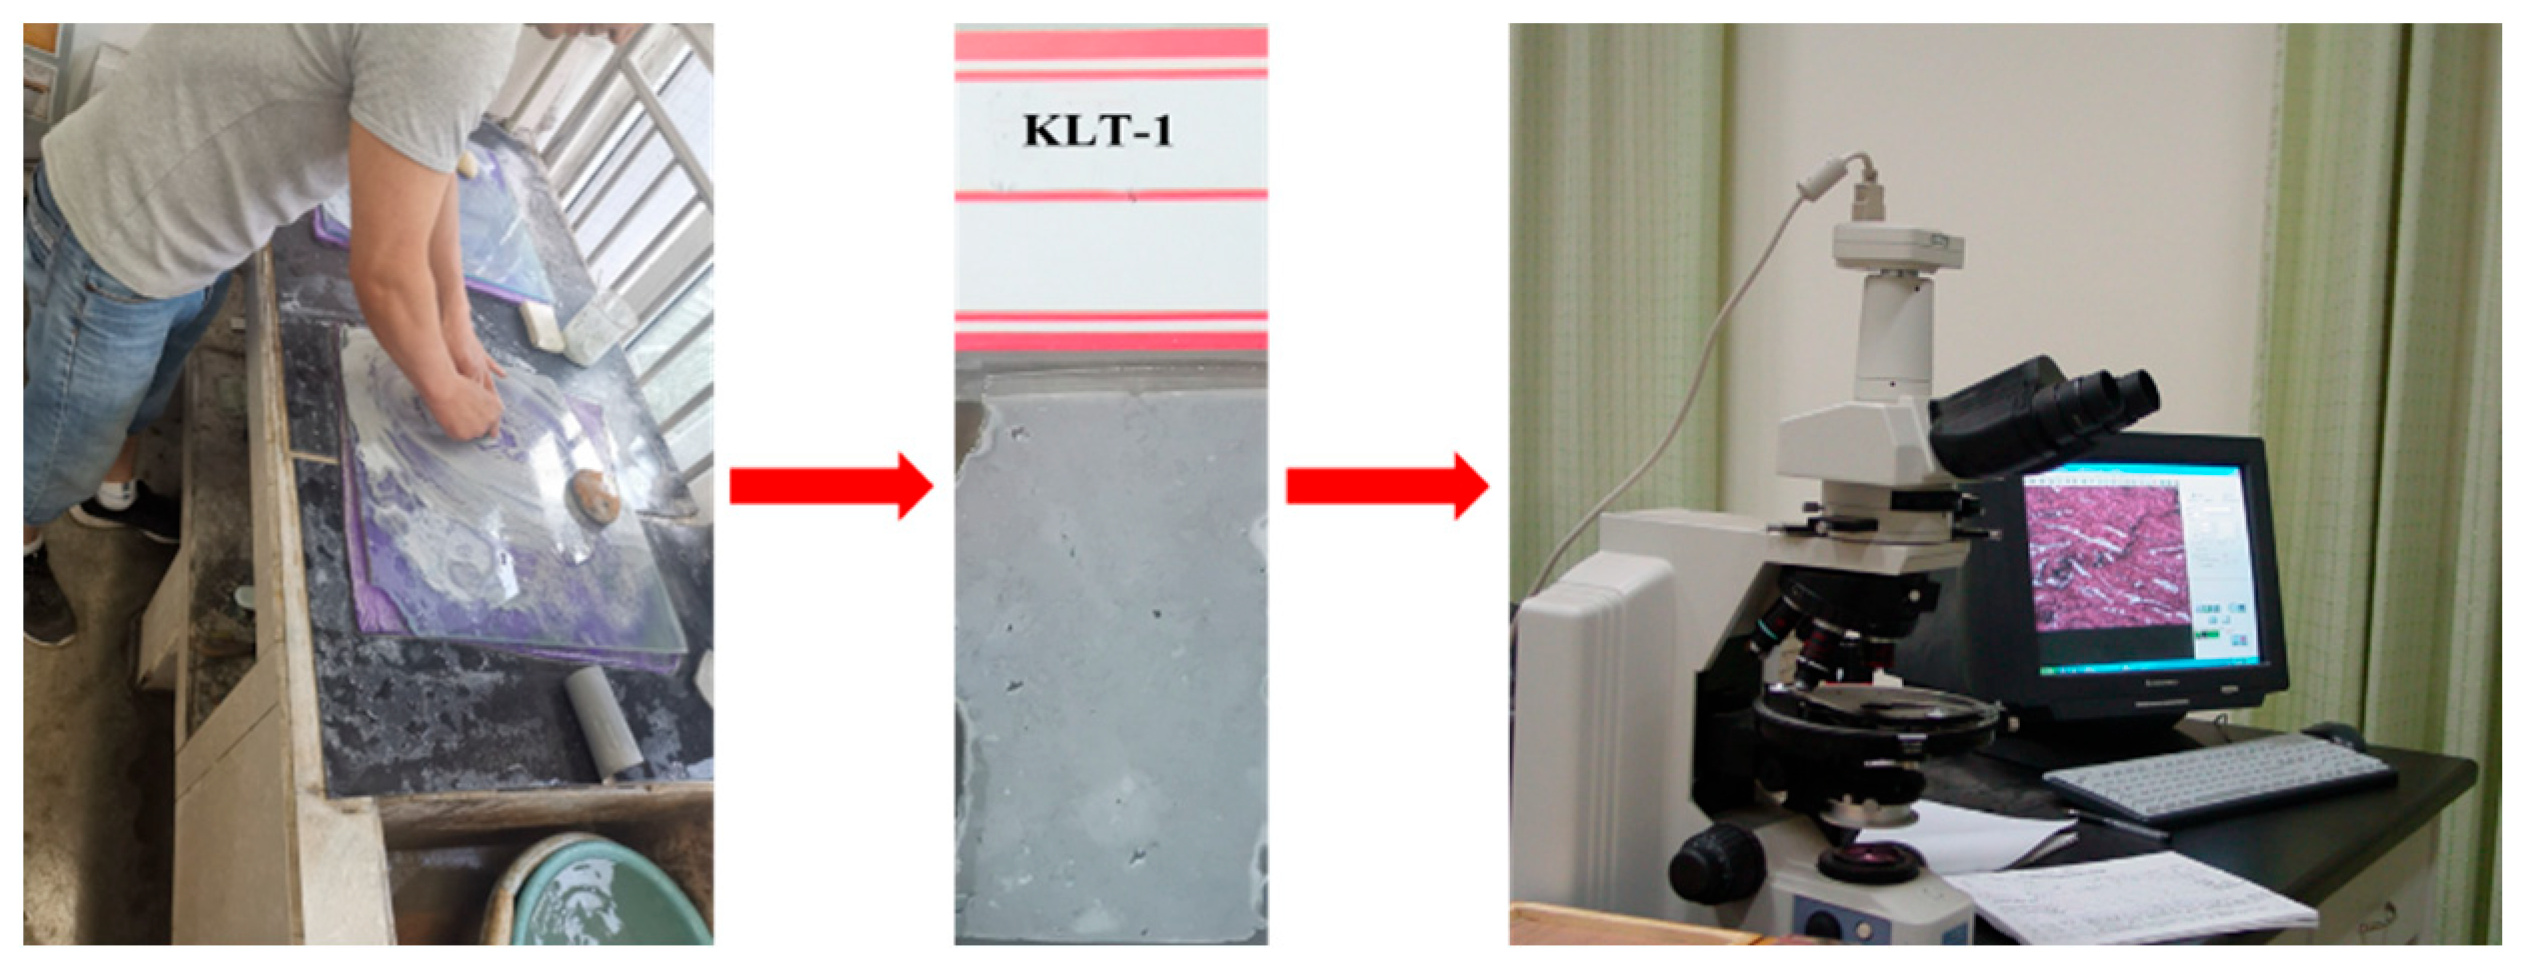
2.2.1. The Lithofacies Method
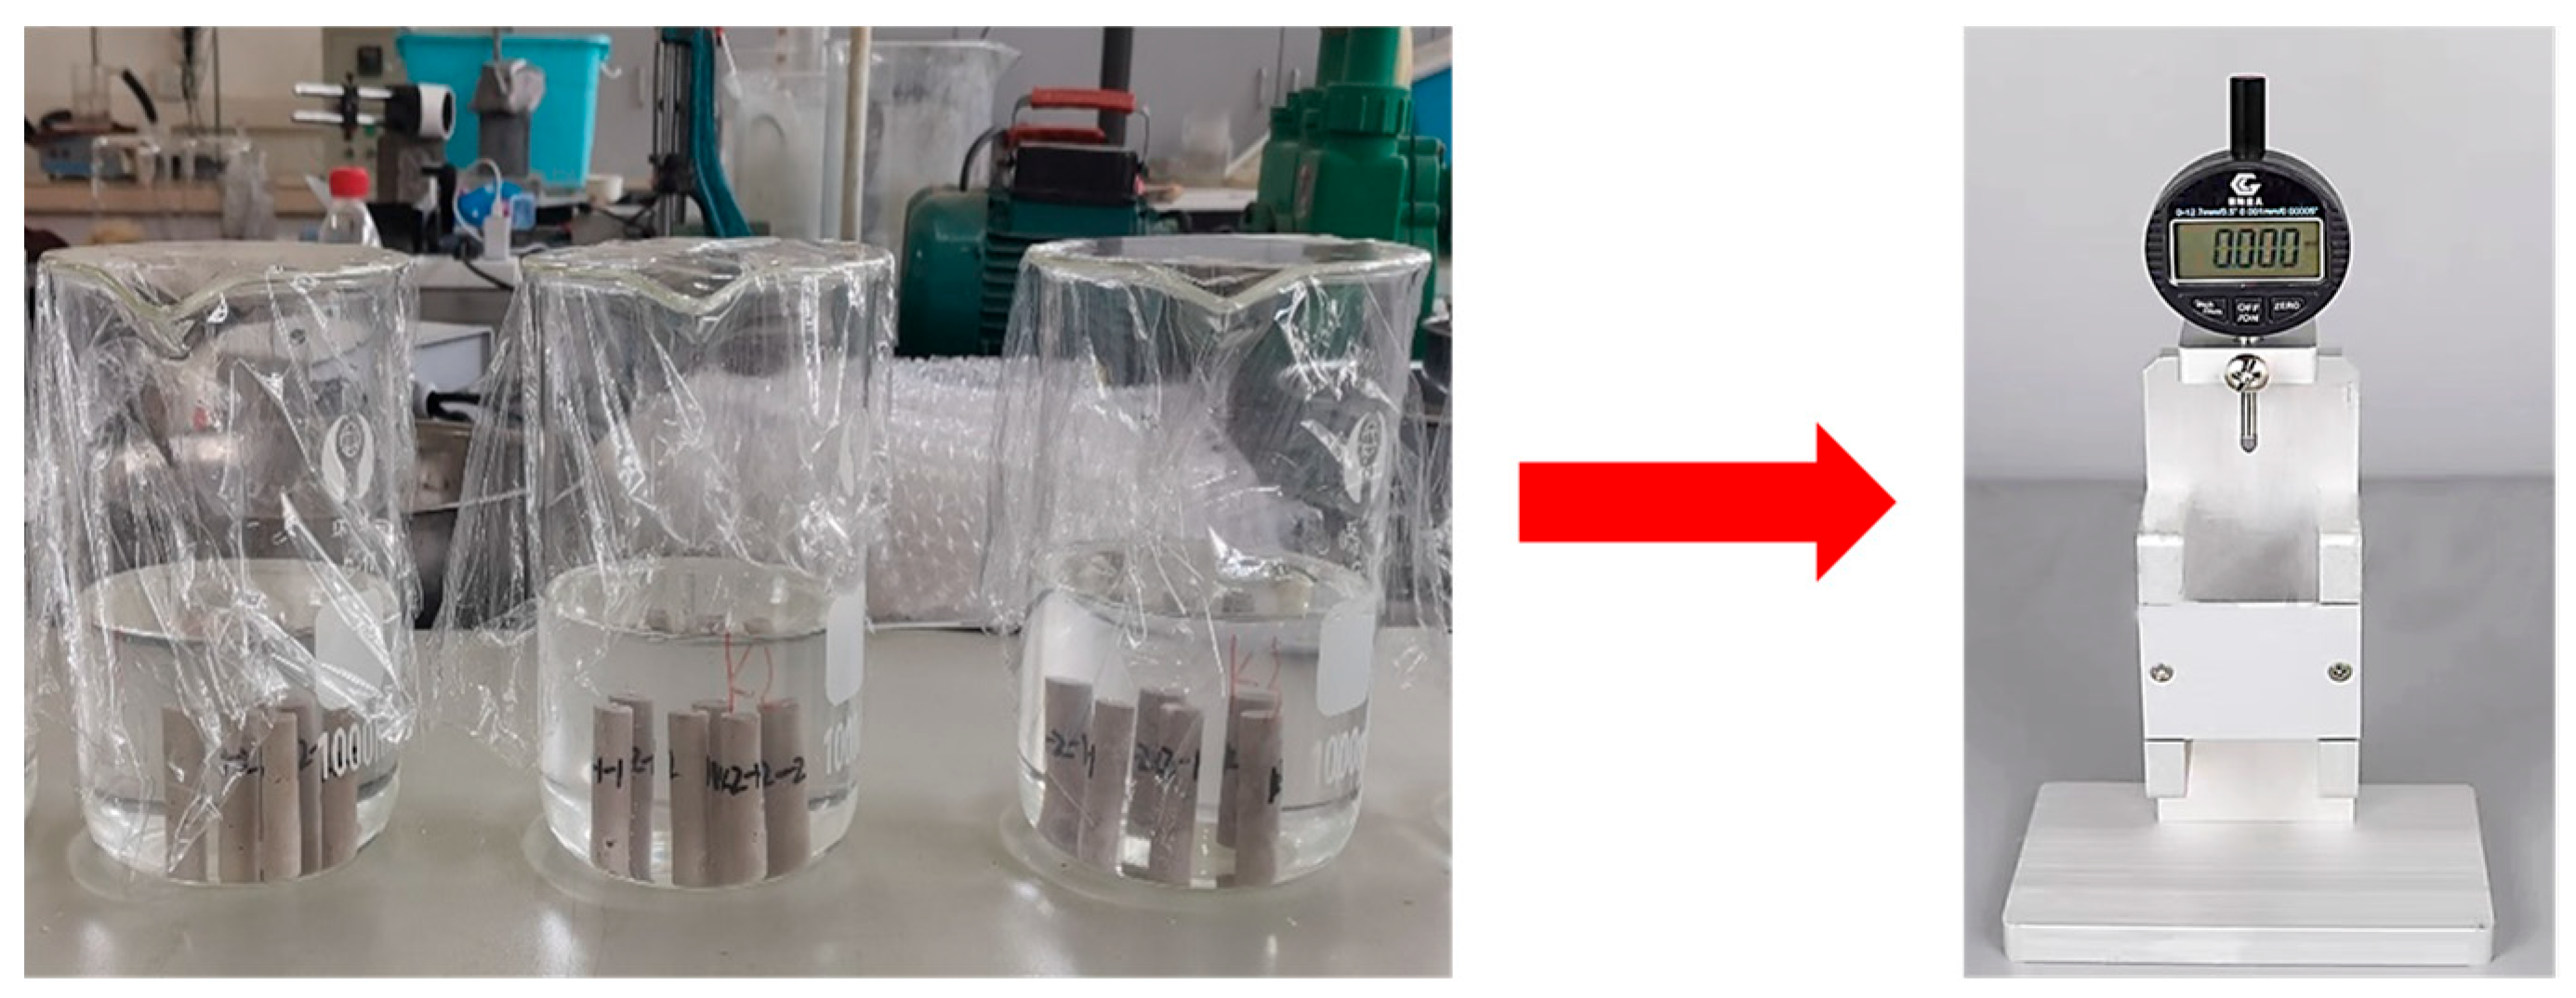
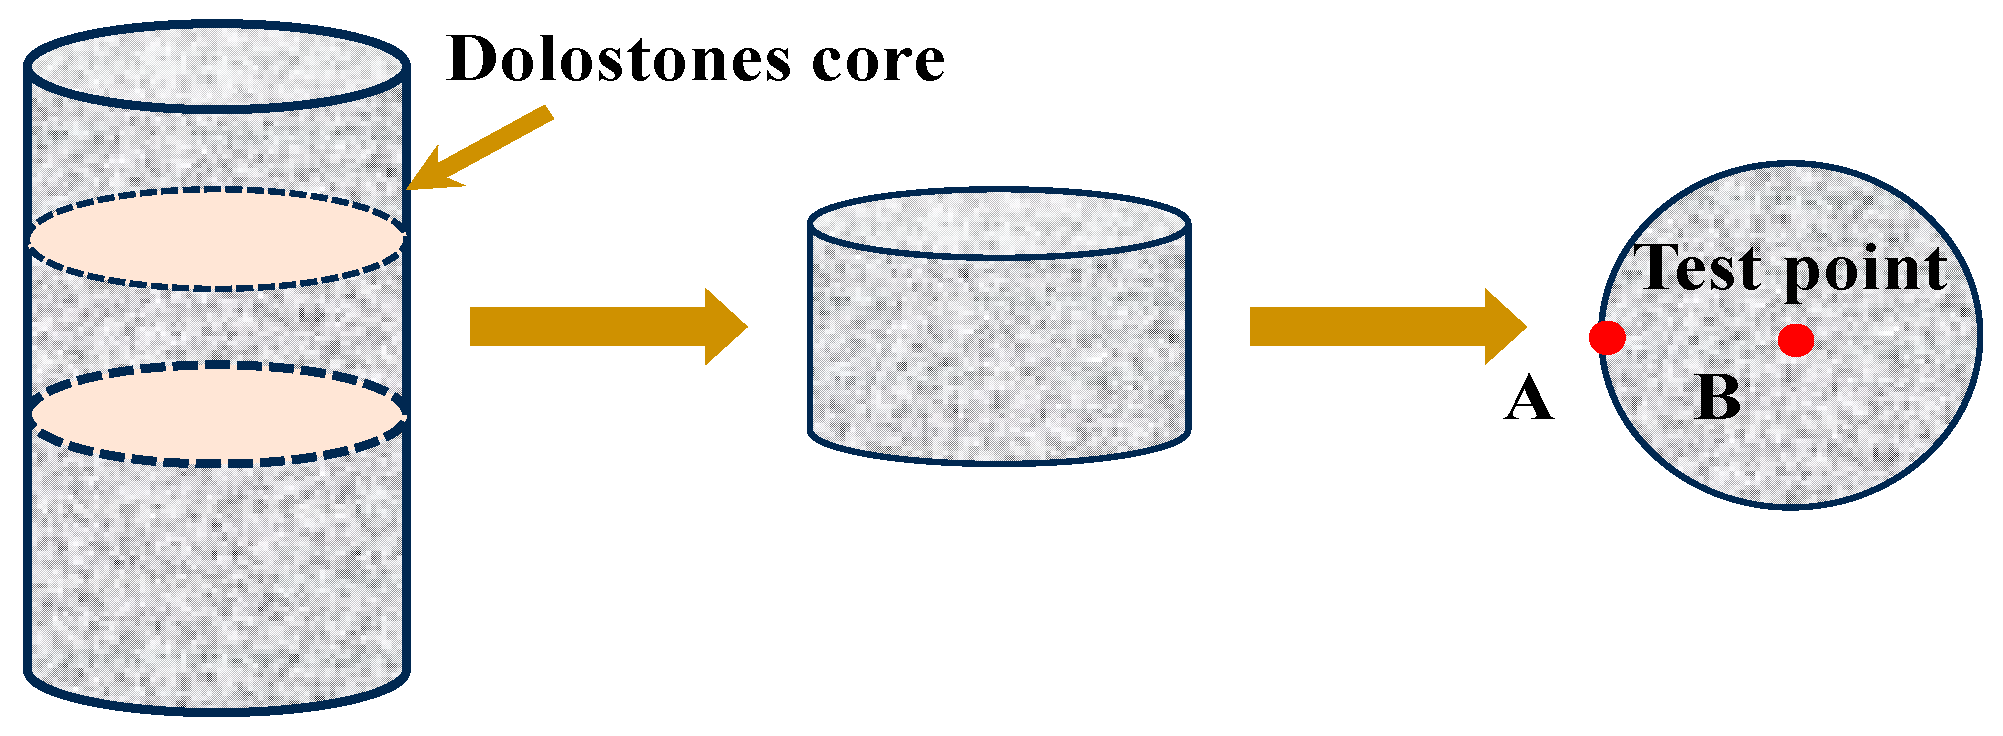
2.2.2. The Rock Cylinder Method
2.2.3. The AAR-5 Method
2.2.4. The Method and Mix Design of Freeze–Thaw
3. Results and Discussion
3.1. The Analysis of Alkali Activity of PWDS
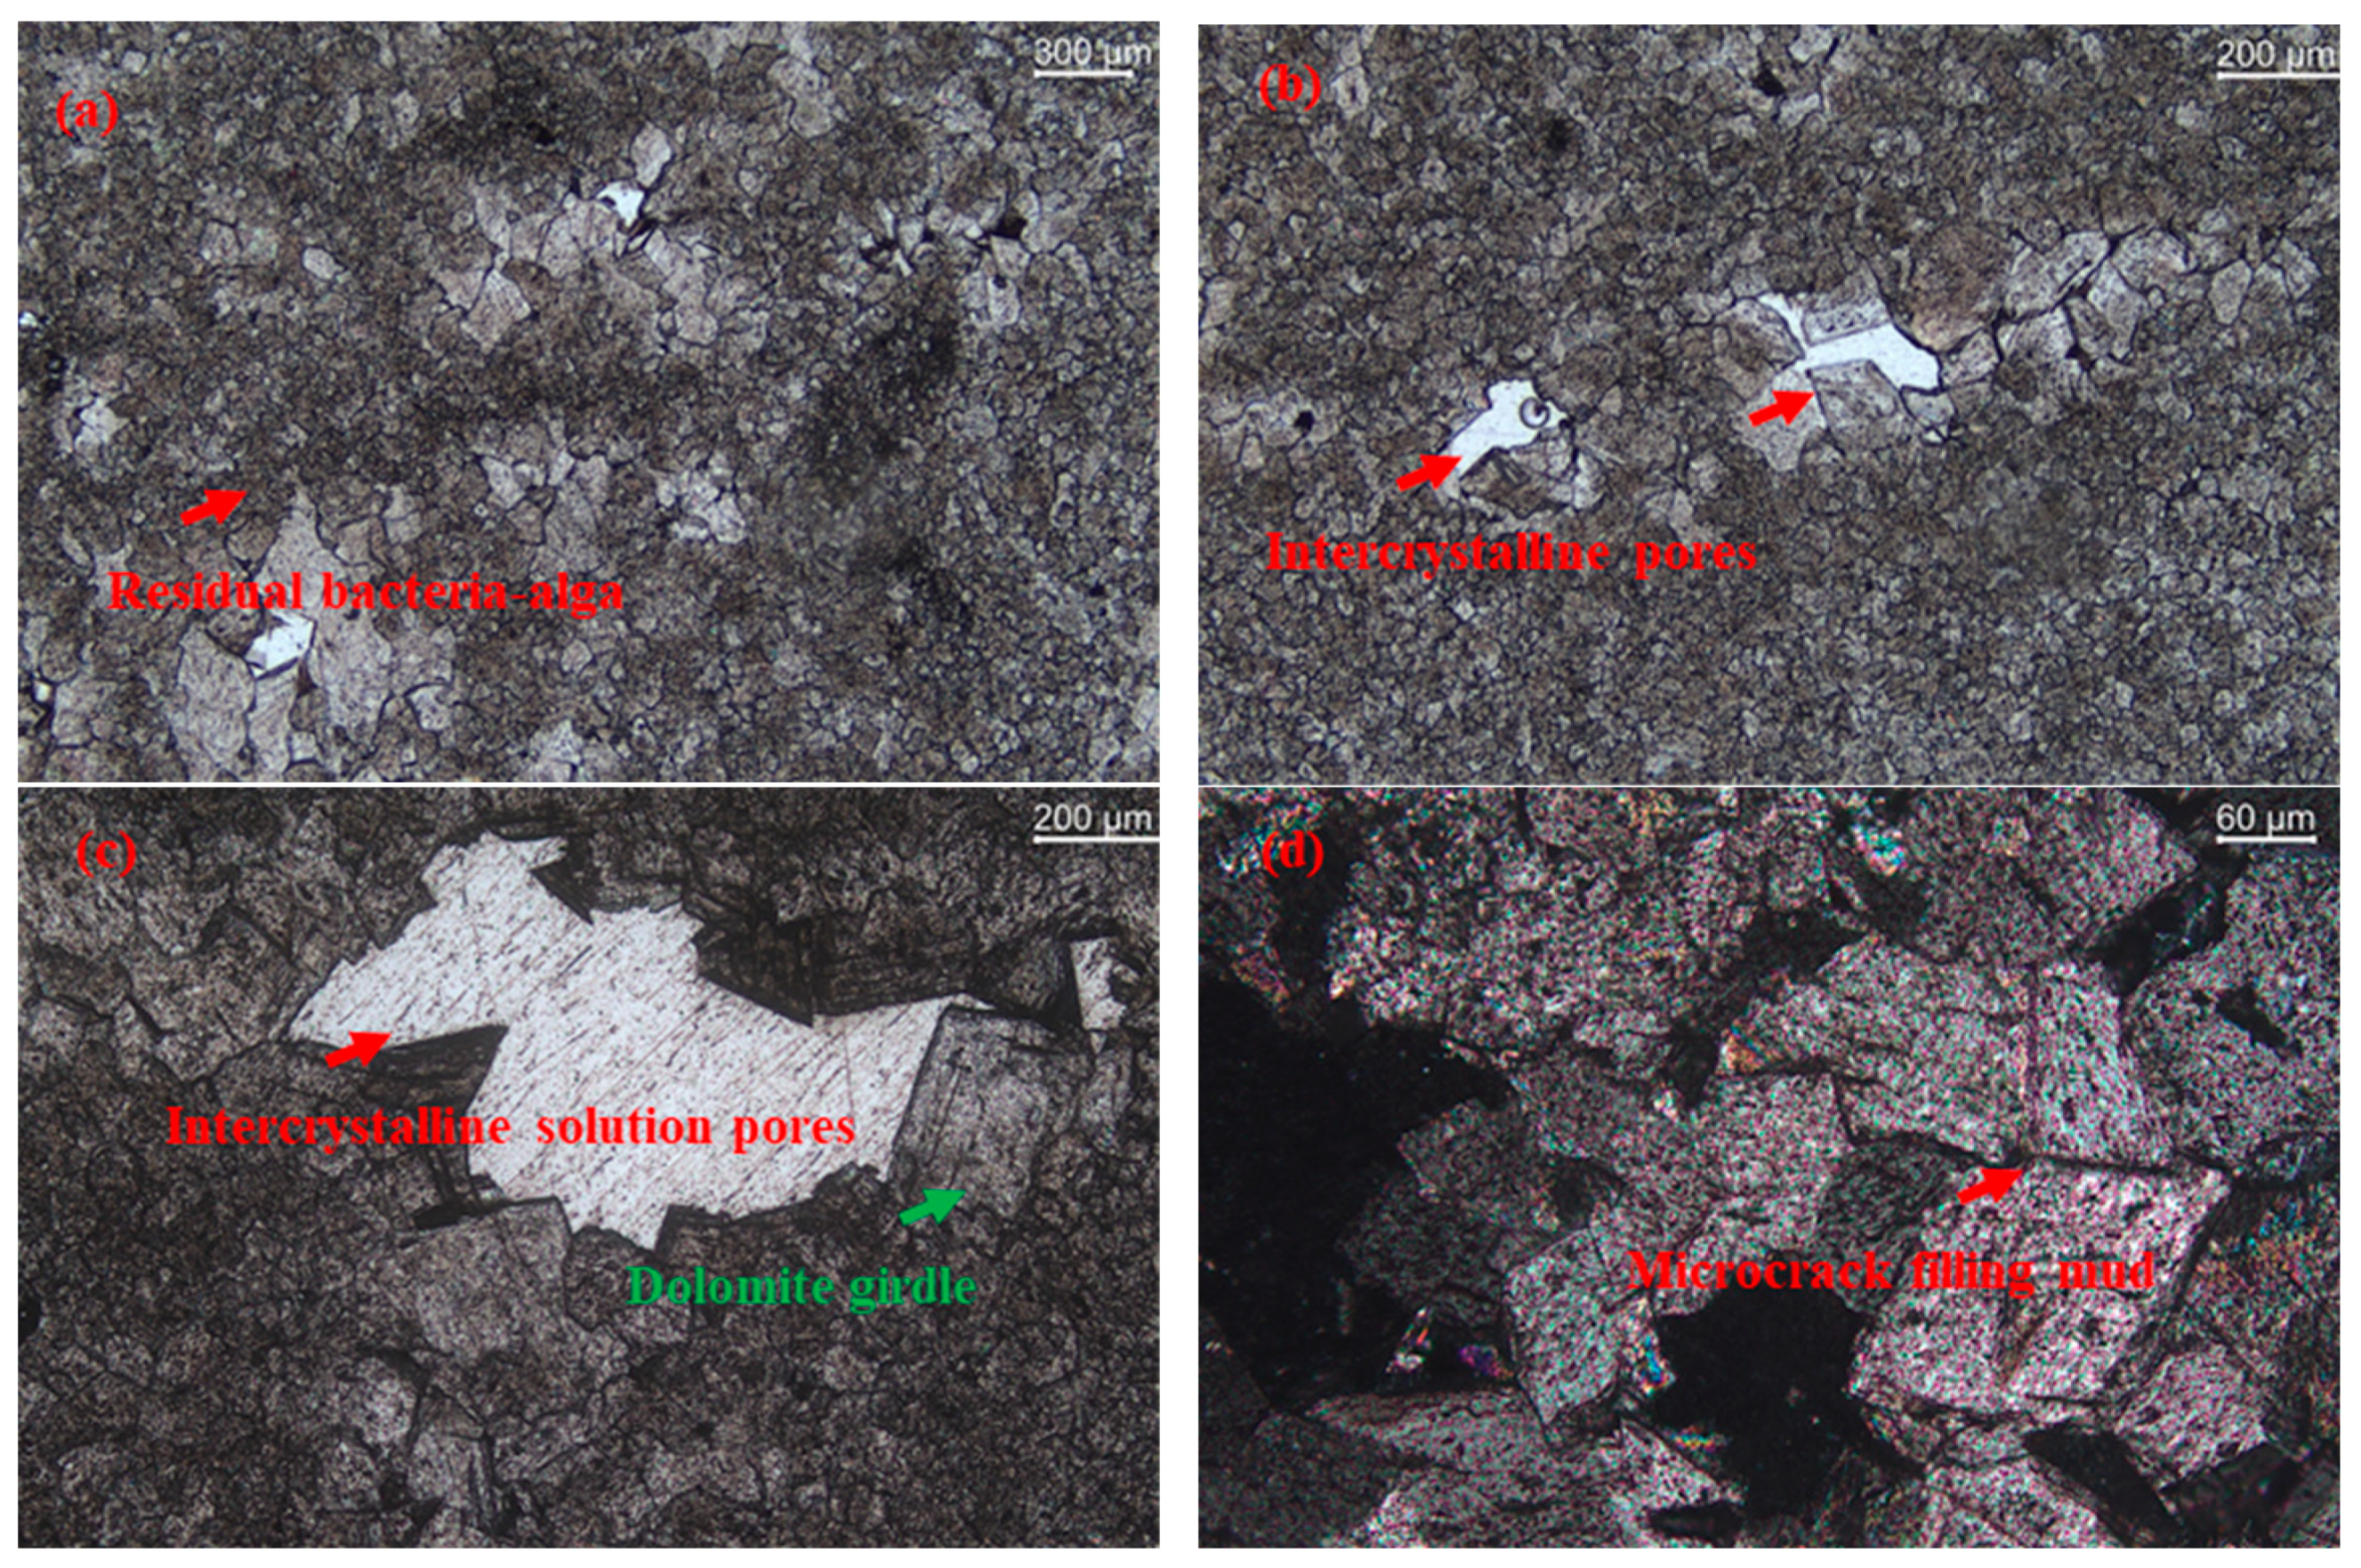
3.1.1. Analysis Using the LM
3.1.2. Analysis Using the RCM
3.1.3. The Analysis of AAR-5
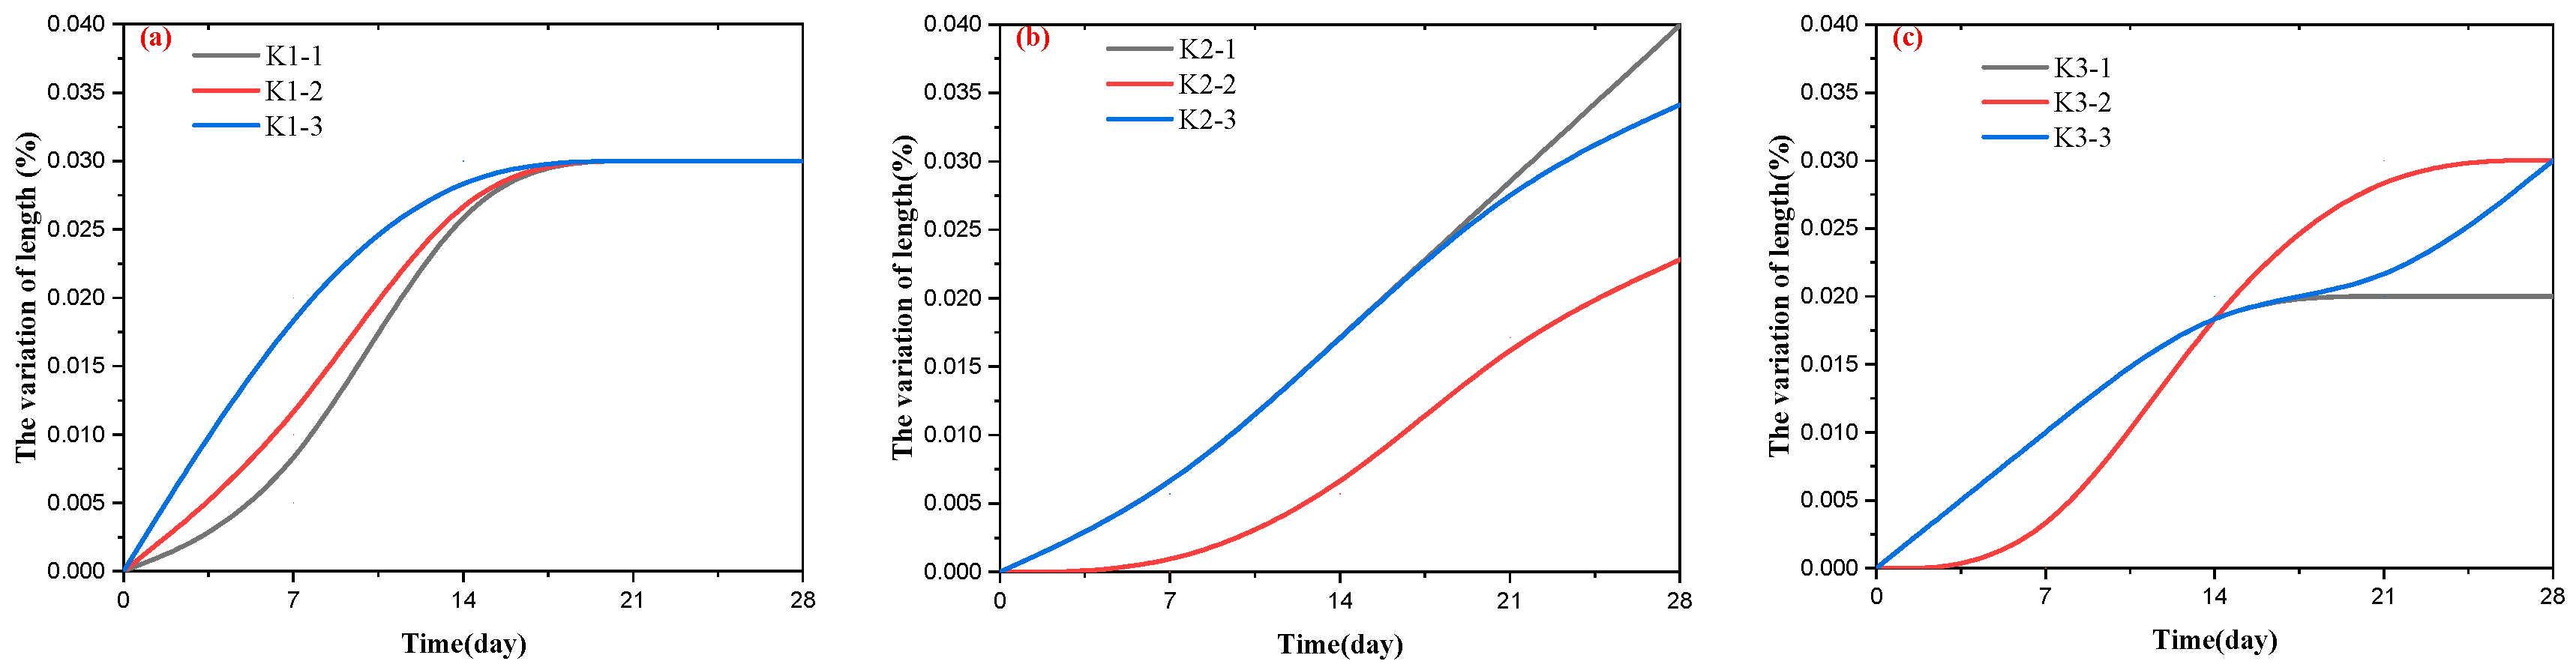
- The length variation of the samples
- 2.
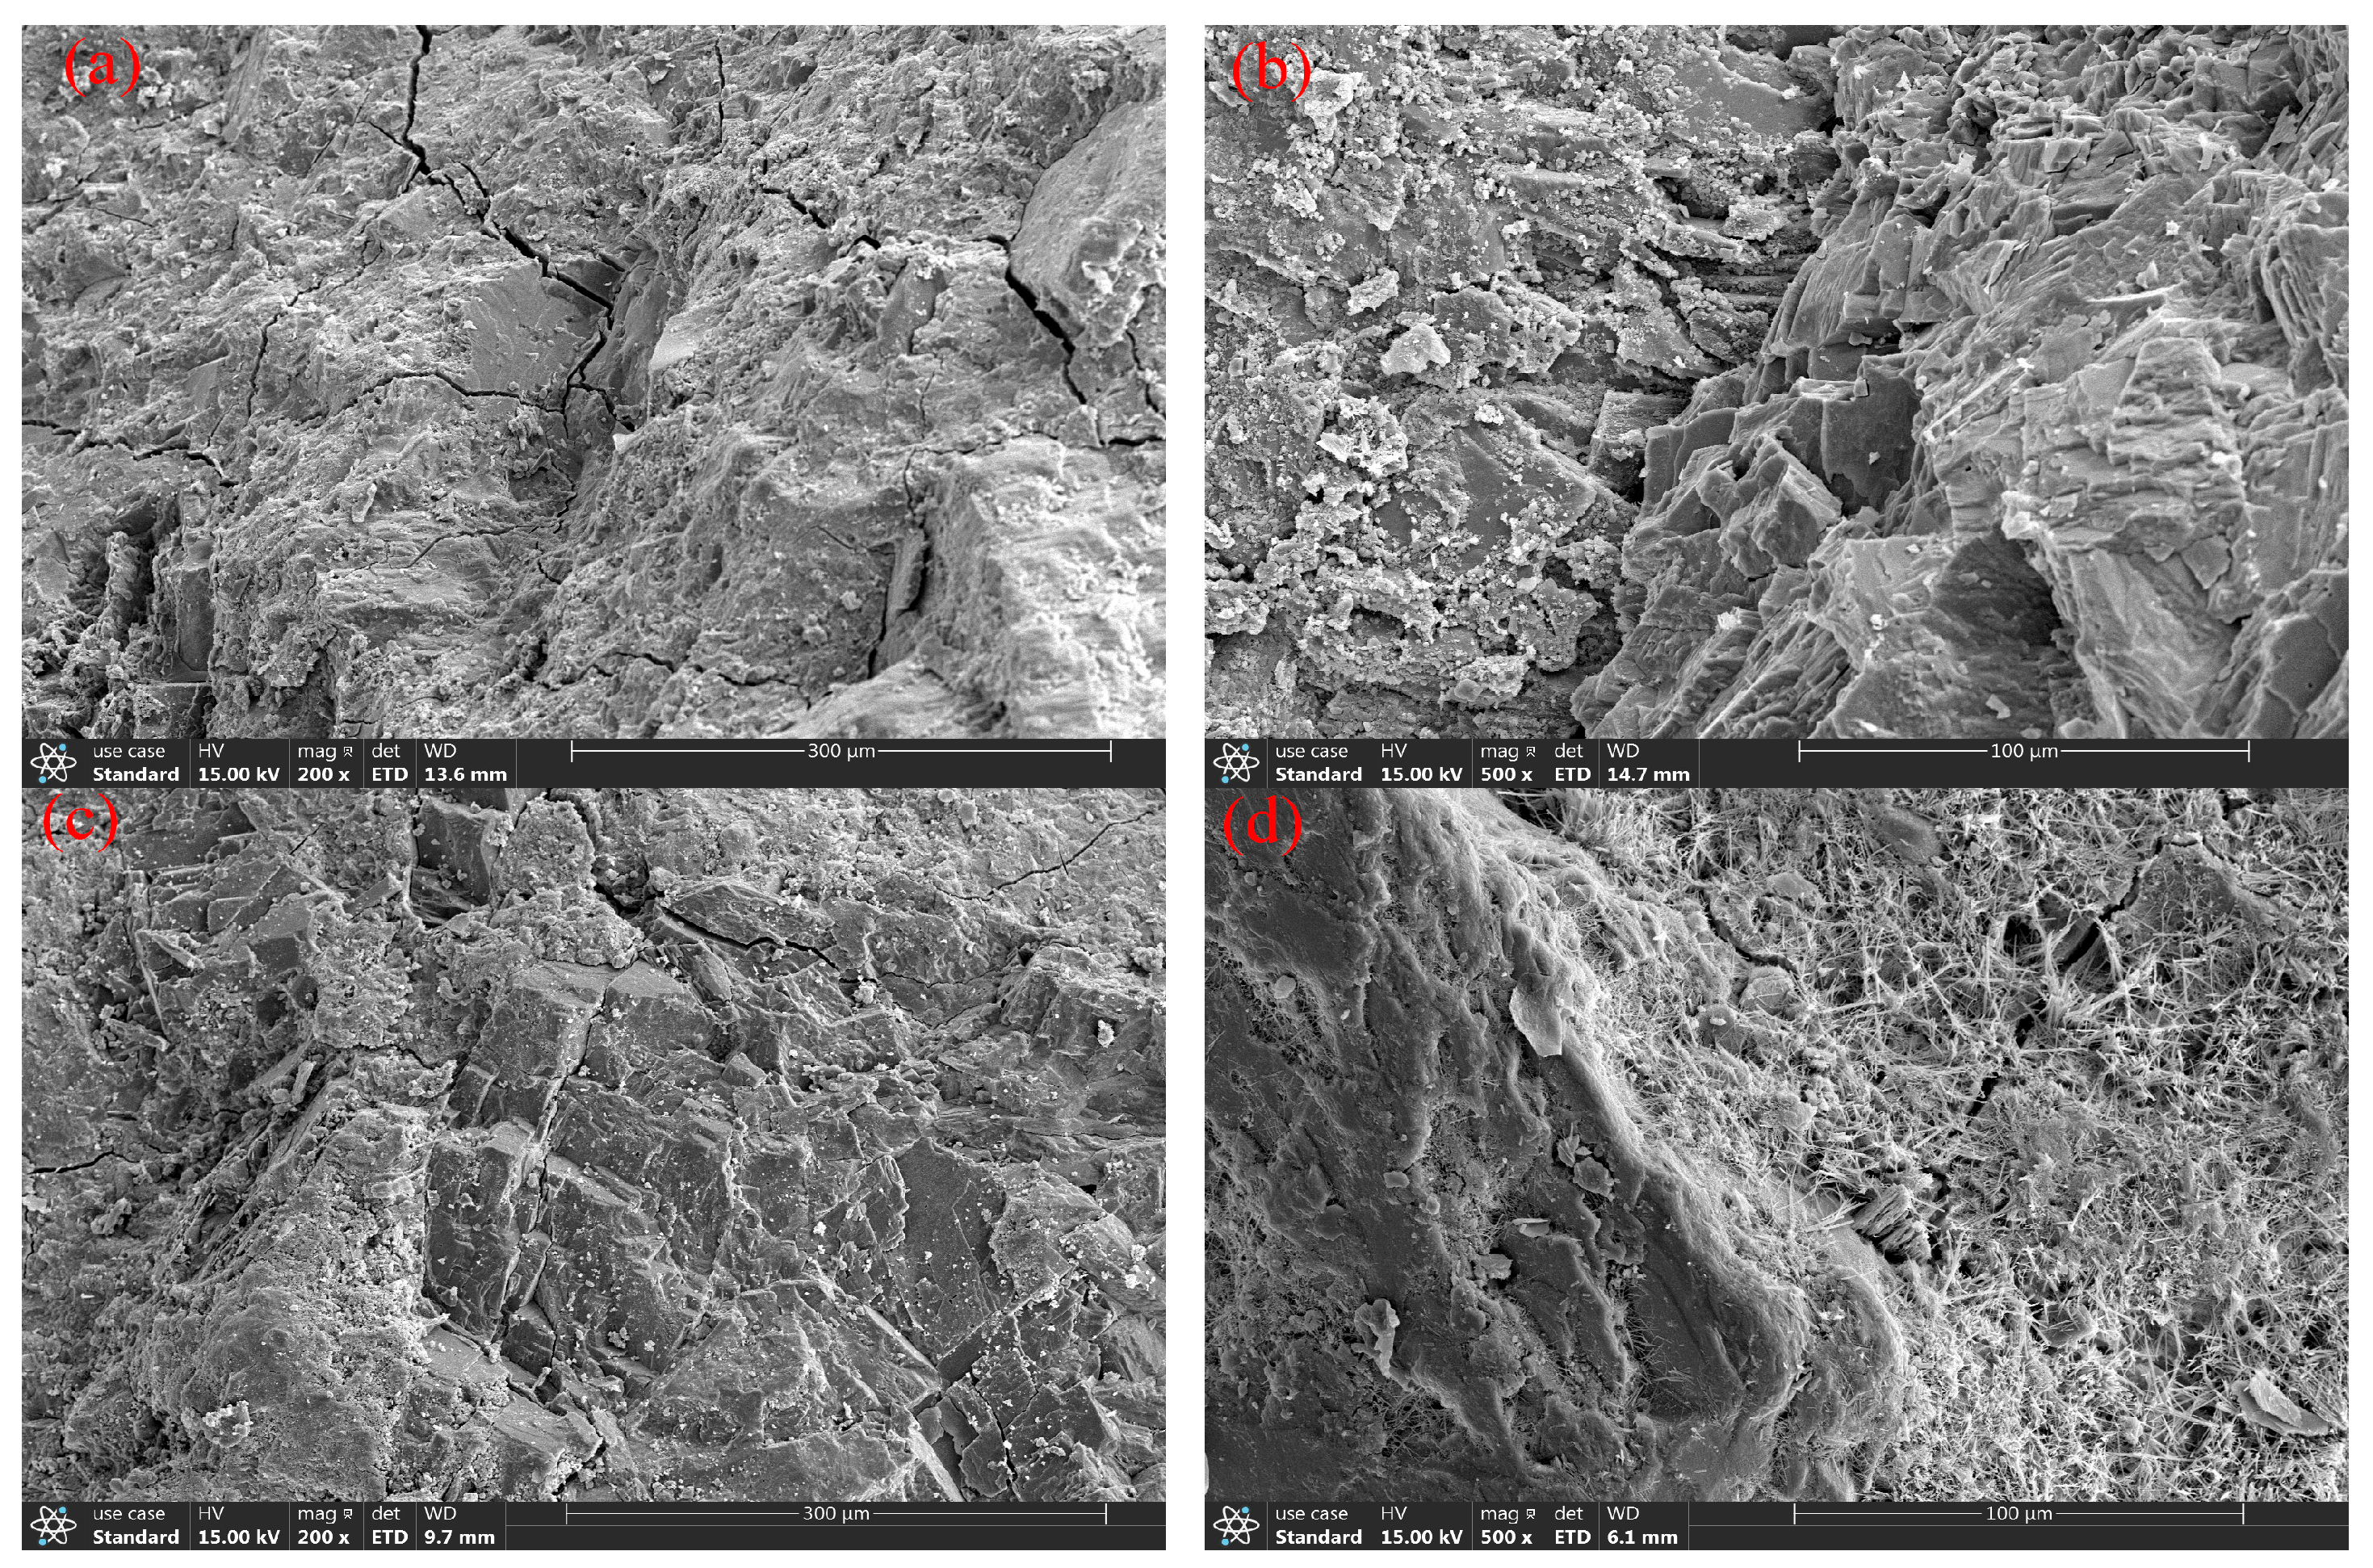
- The micro-structure of the samples
3.2. The Freeze–Thaw Resistance of PWDSC
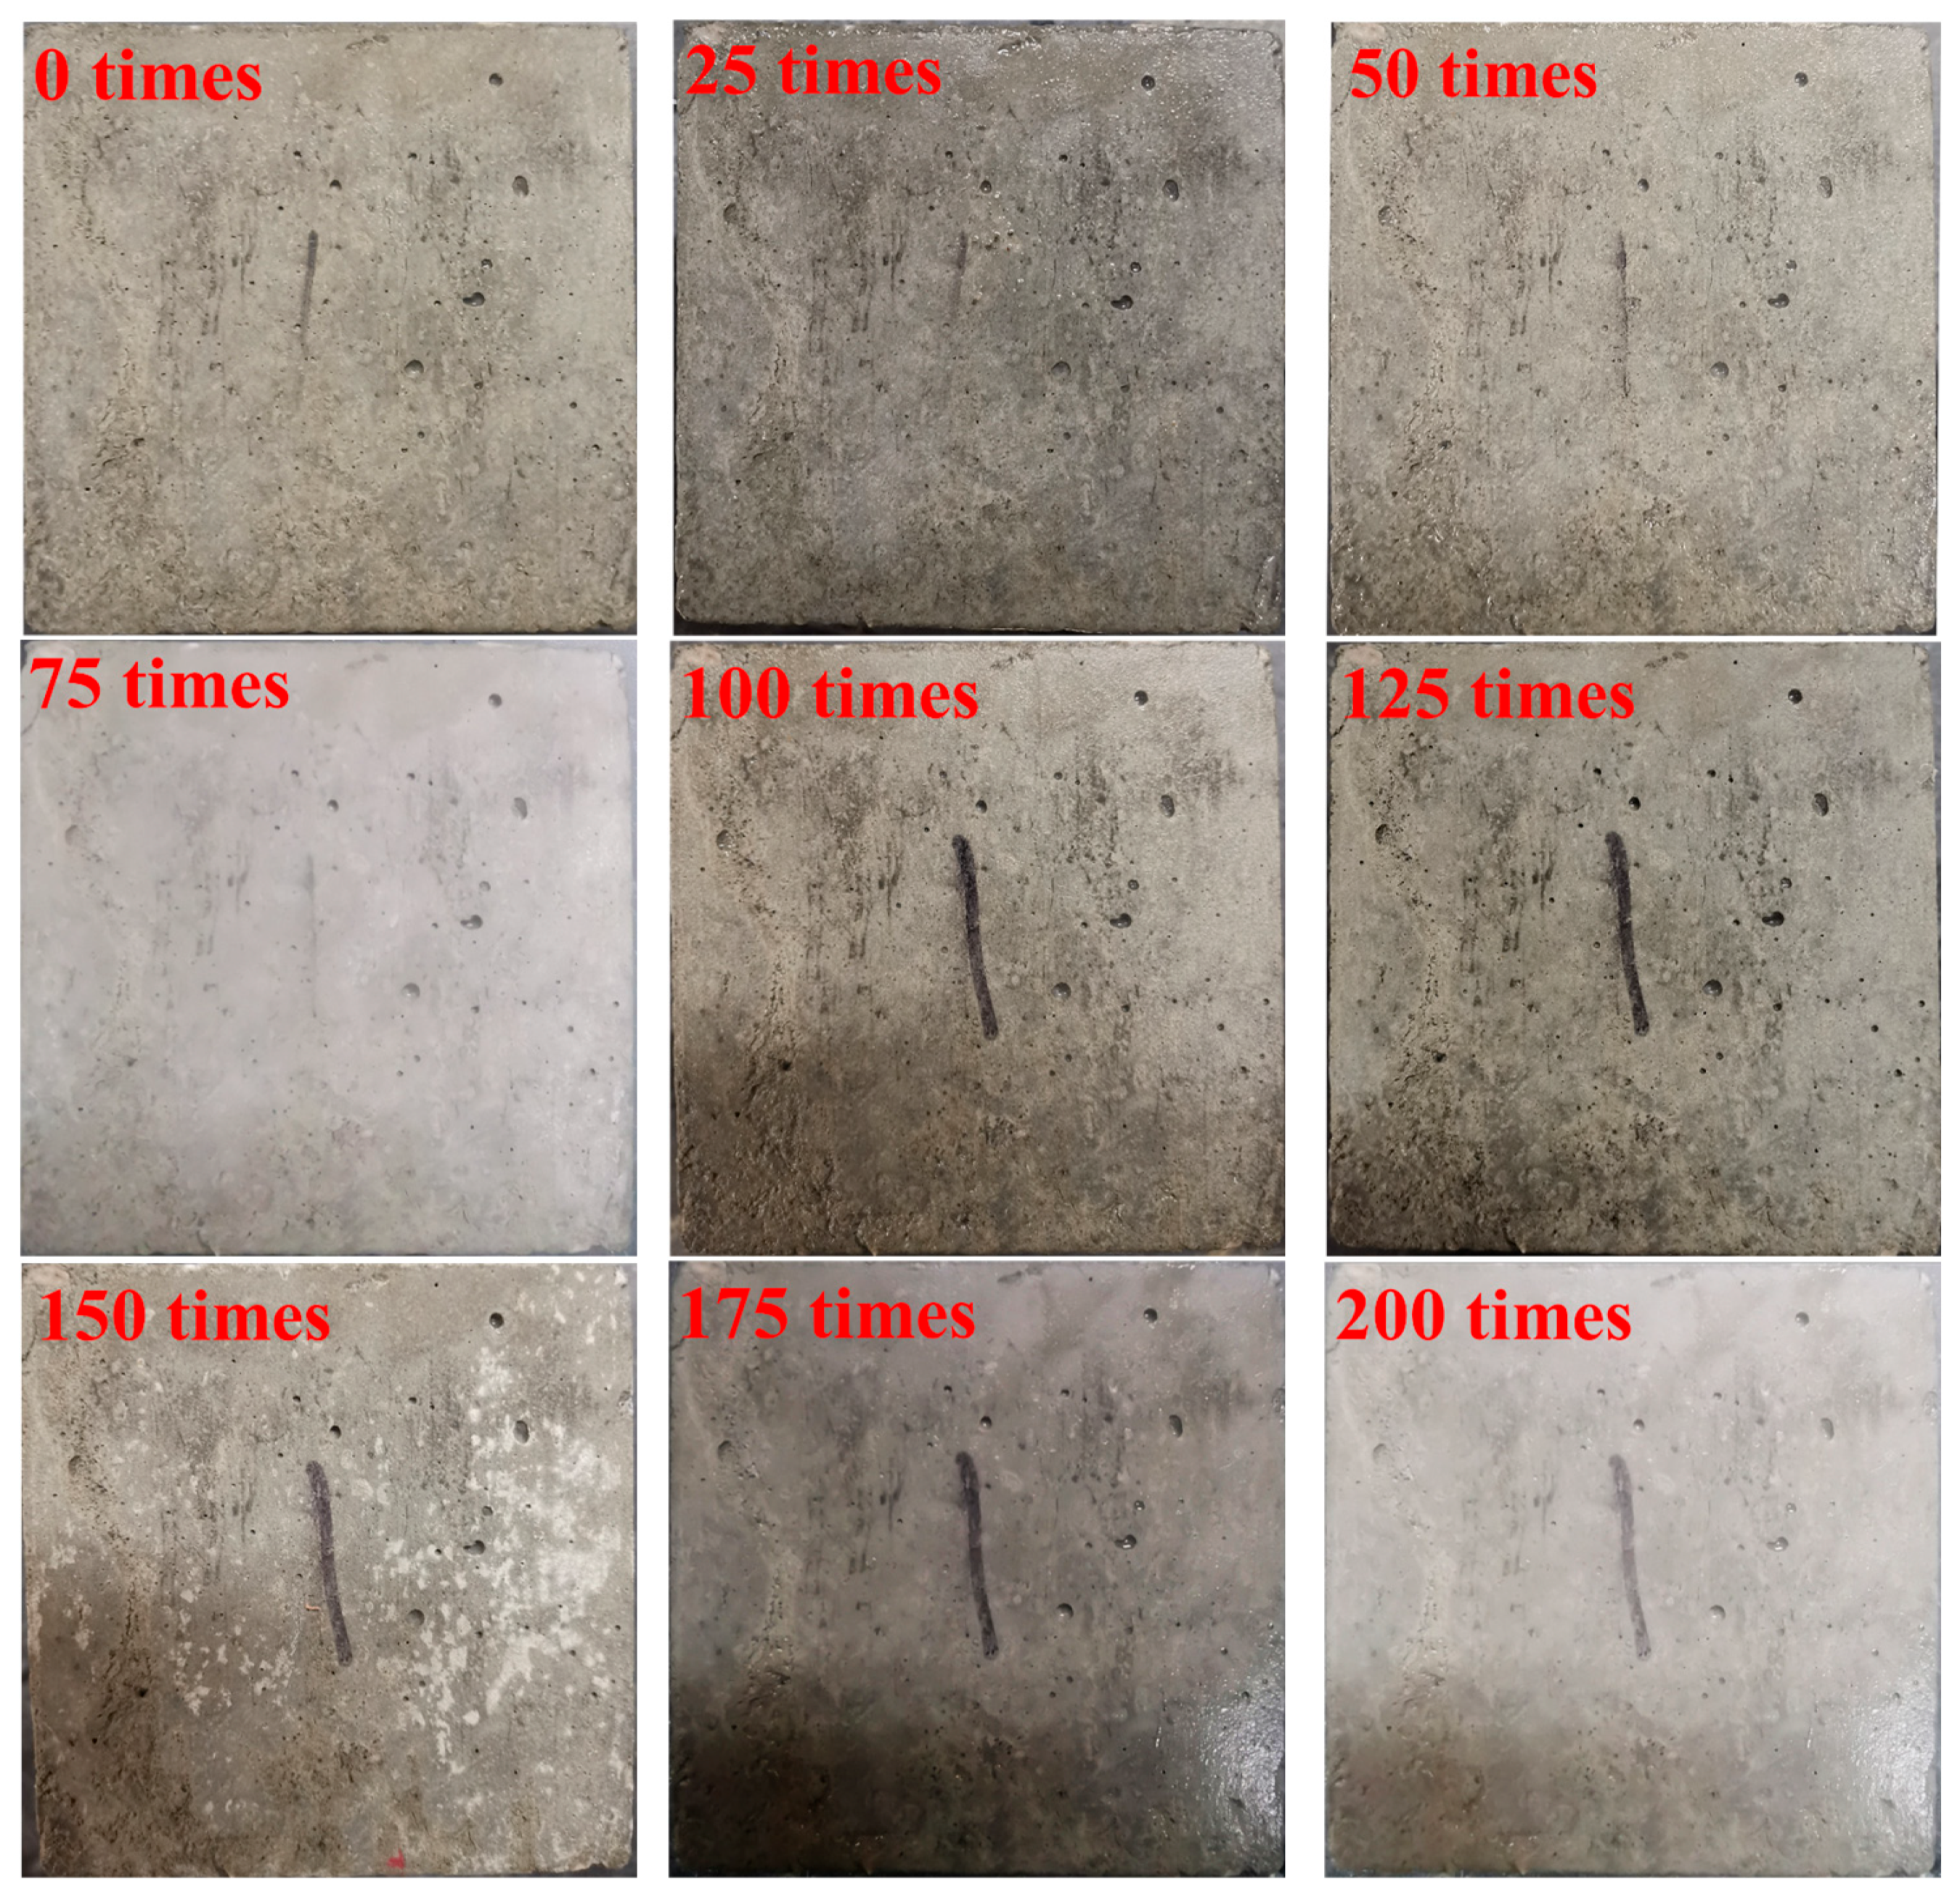
3.2.1. The Surface Characteristics of the PWDSC
3.2.2. The Variation in the PWDSC Mass
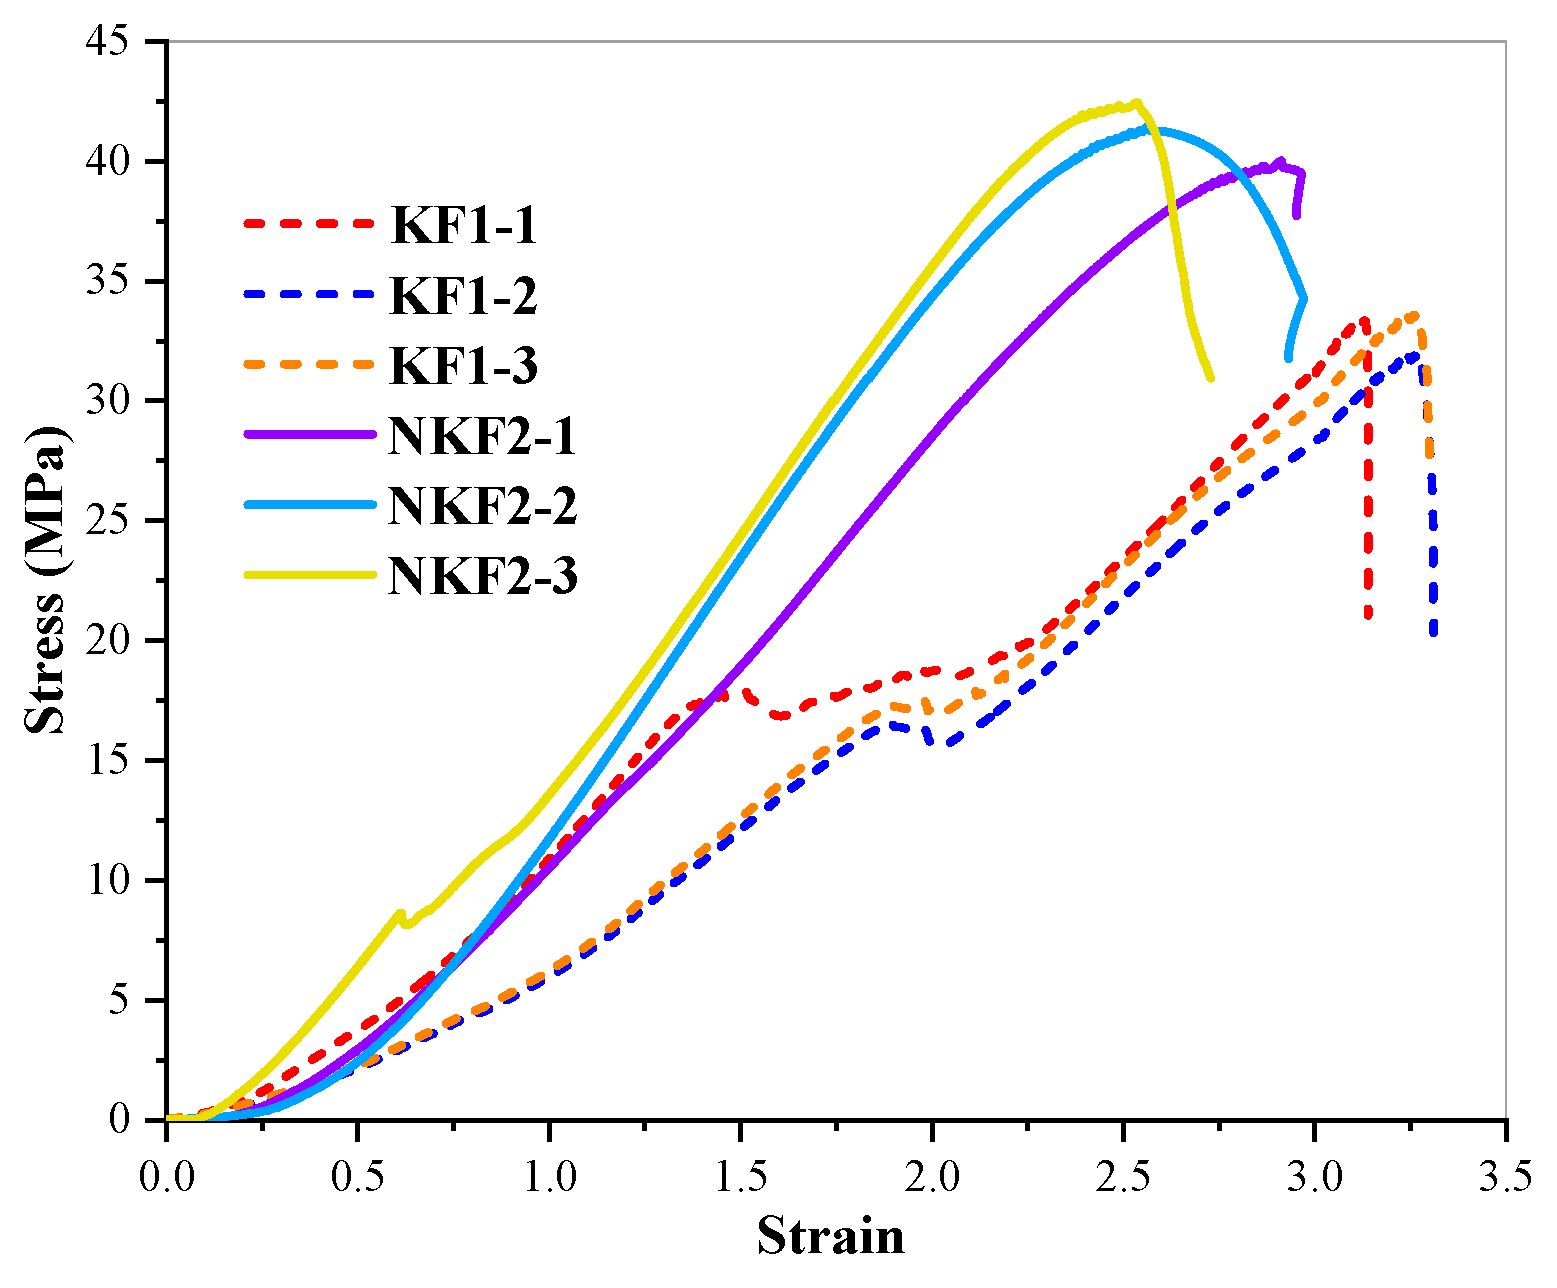
3.2.3. The UCS of the PWDSC
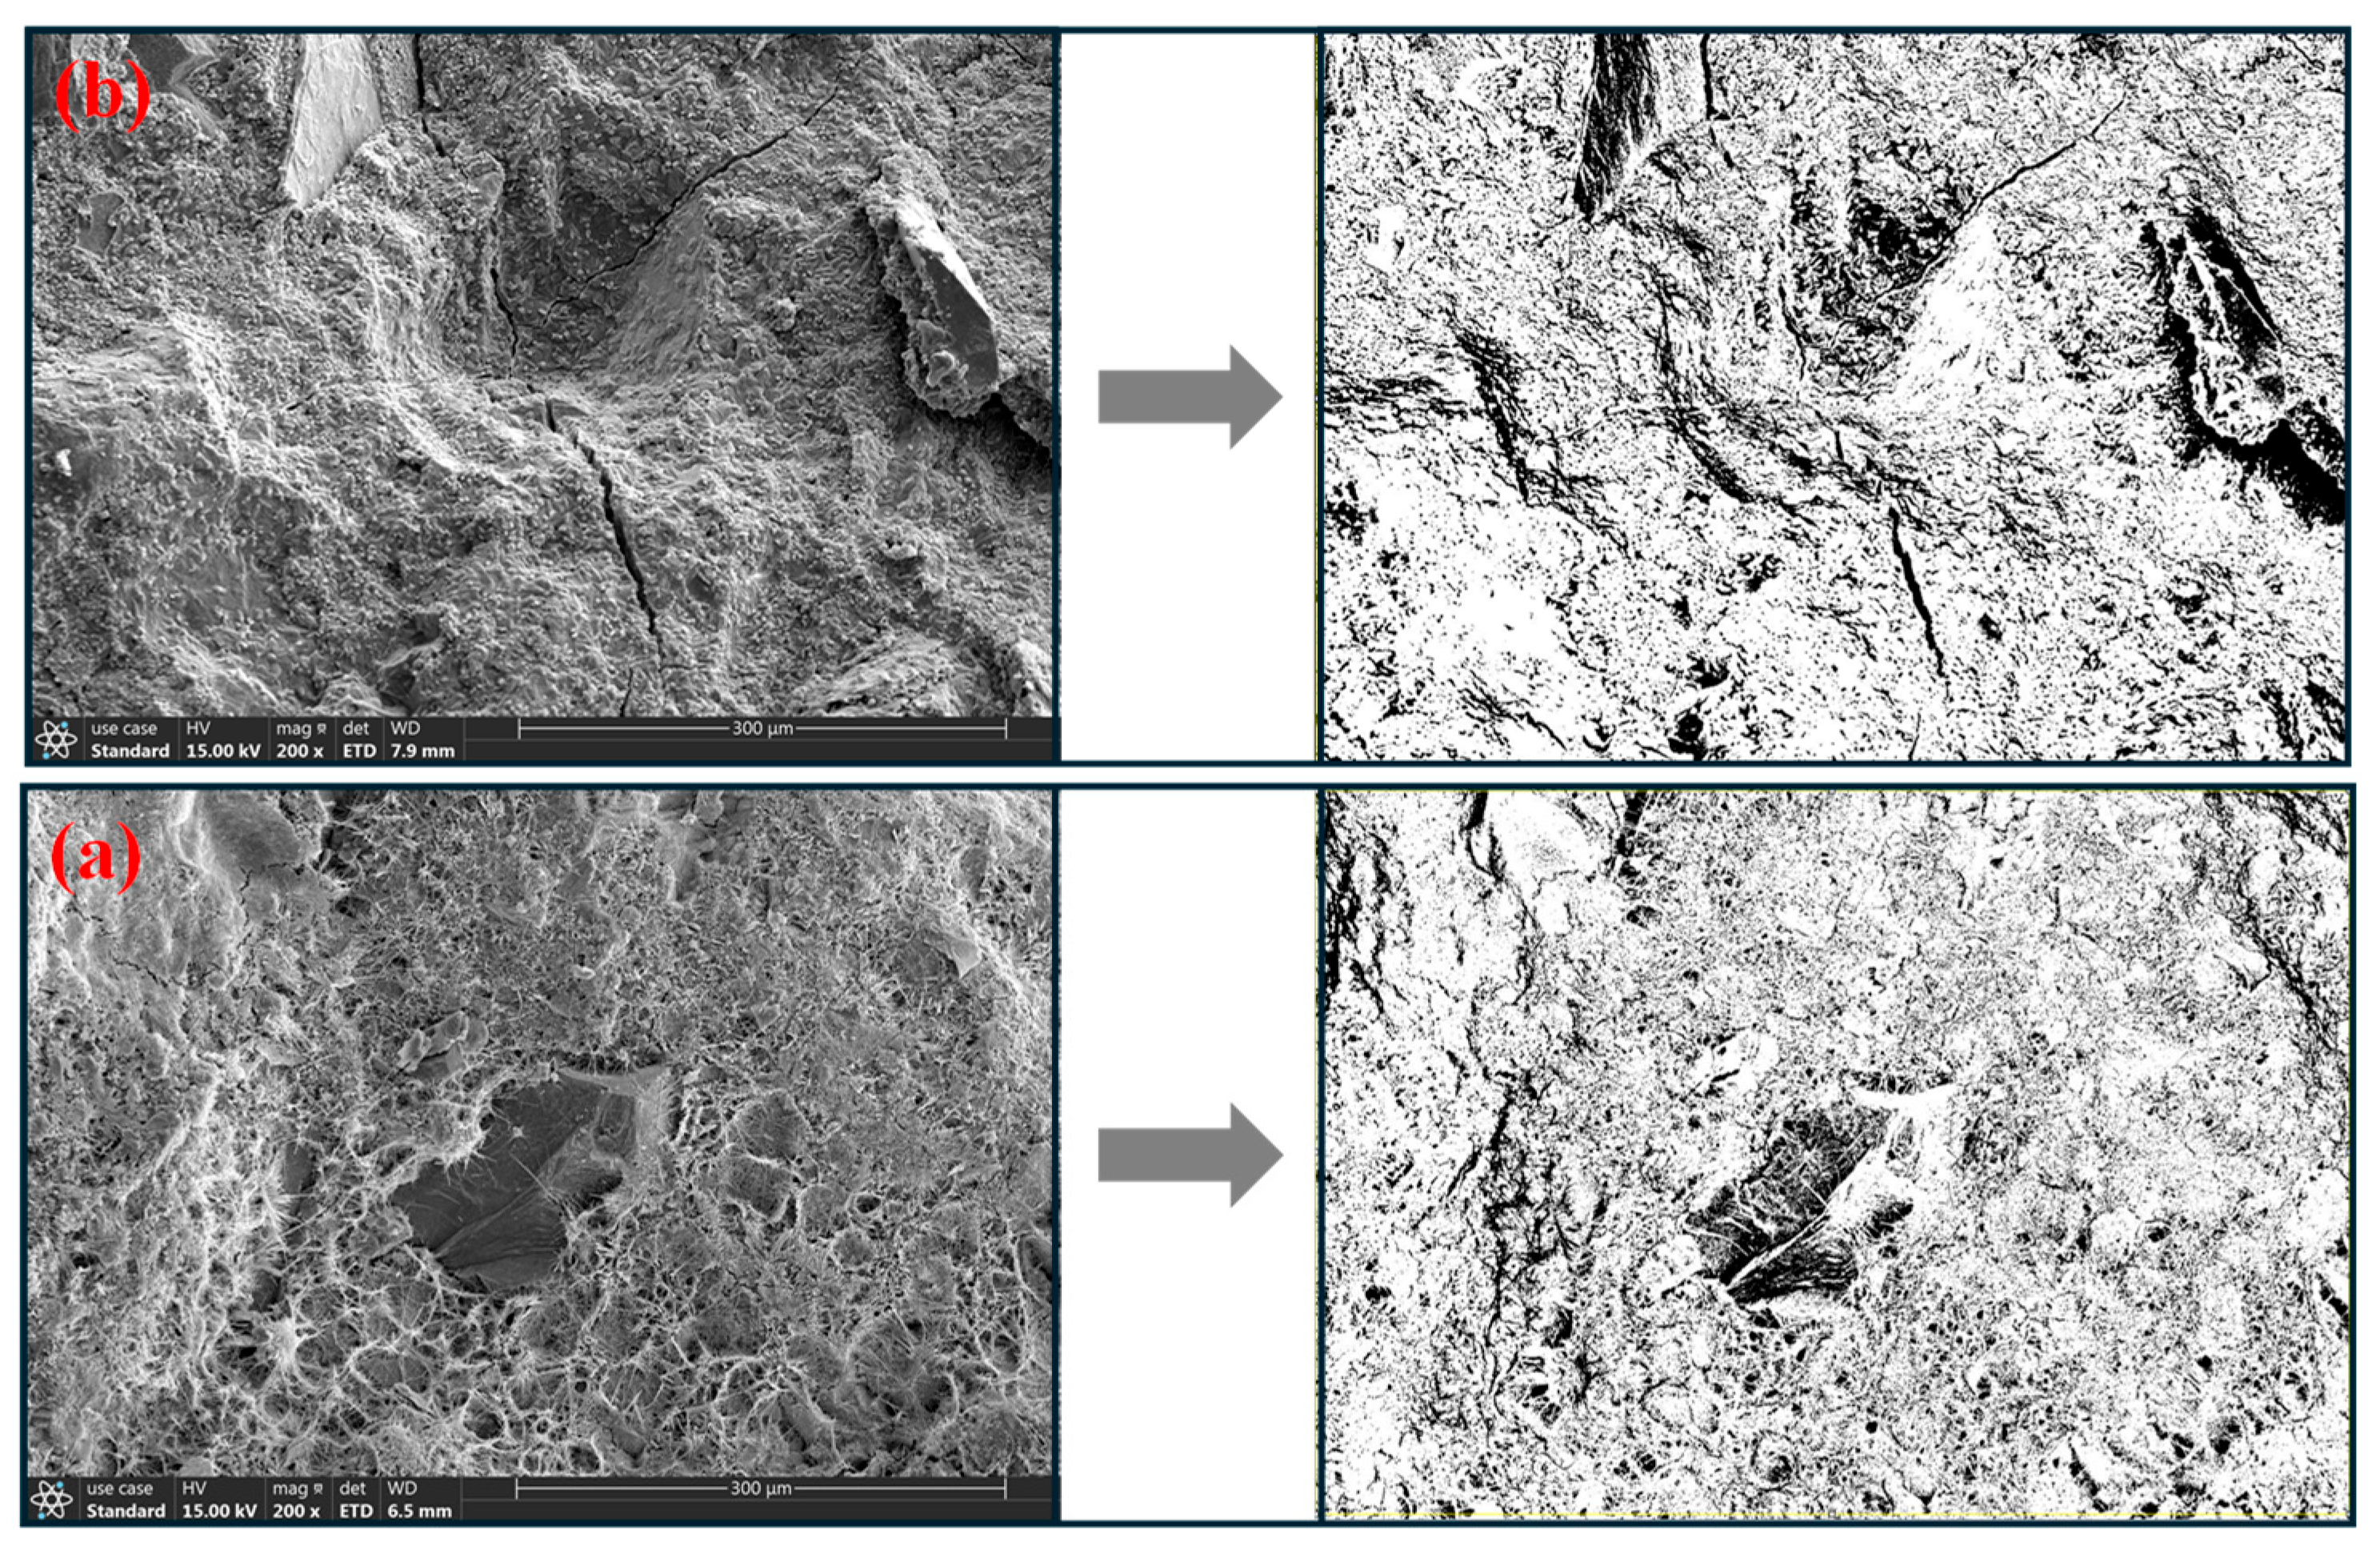
3.2.4. The Characteristics of the Micro-Structure
4. Conclusions
- (1)
- The results of the XRD and LM showed that the dolomite slag consisted of 99% dolomite, which suggested that the dolomite samples were pure dolomite and ruled out the risk of an ASR. Meanwhile, due to the existence of euhedral granular sparry dolomite, the samples could have alkali activity; hence, further methods were used to assess the risk of an ACR.
- (2)
- To confirm the risk of the ACR for PWDS, RCM and AAR-5 were employed. The results of the RCM showed a reduction in the length of the cylinders and did not show expansion after the test subjects were soaked in a 1M/L NaOH solution for 84 days. The length of all the dolomite rock cylinders ultimately decreased by 0.1%, with an average expansion rate of −0.09%. From a microscopic perspective, SEM analysis revealed that the dolomite cylinders carried out a significant dedolomitization reaction. Furthermore, the decrease in the volume change rate of the dolomite cylinders provided additional evidence supporting the reduction in the molar volume associated with the dedolomitization reaction. Additionally, the RCM results corroborated that pure dolomite lacked the necessary conditions for the ACR; the result of the AAR-5 method showed a length expansion rate significantly lower than 0.1%. This observation supported the assertion that PWDS does not possess alkali activity. Additionally, the results provided evidence that the alkali–carbonate reaction was not primarily caused by the reaction between CaMg(CO3)2 and alkalis. Simultaneously, a subtle expansion took place in the mortar bars because the saturation effect during the test led to a minor expansion of the mortar bars. SEM revealed the presence of a limited number of micro-cracks and micro-pores within the mortar bars.
- (3)
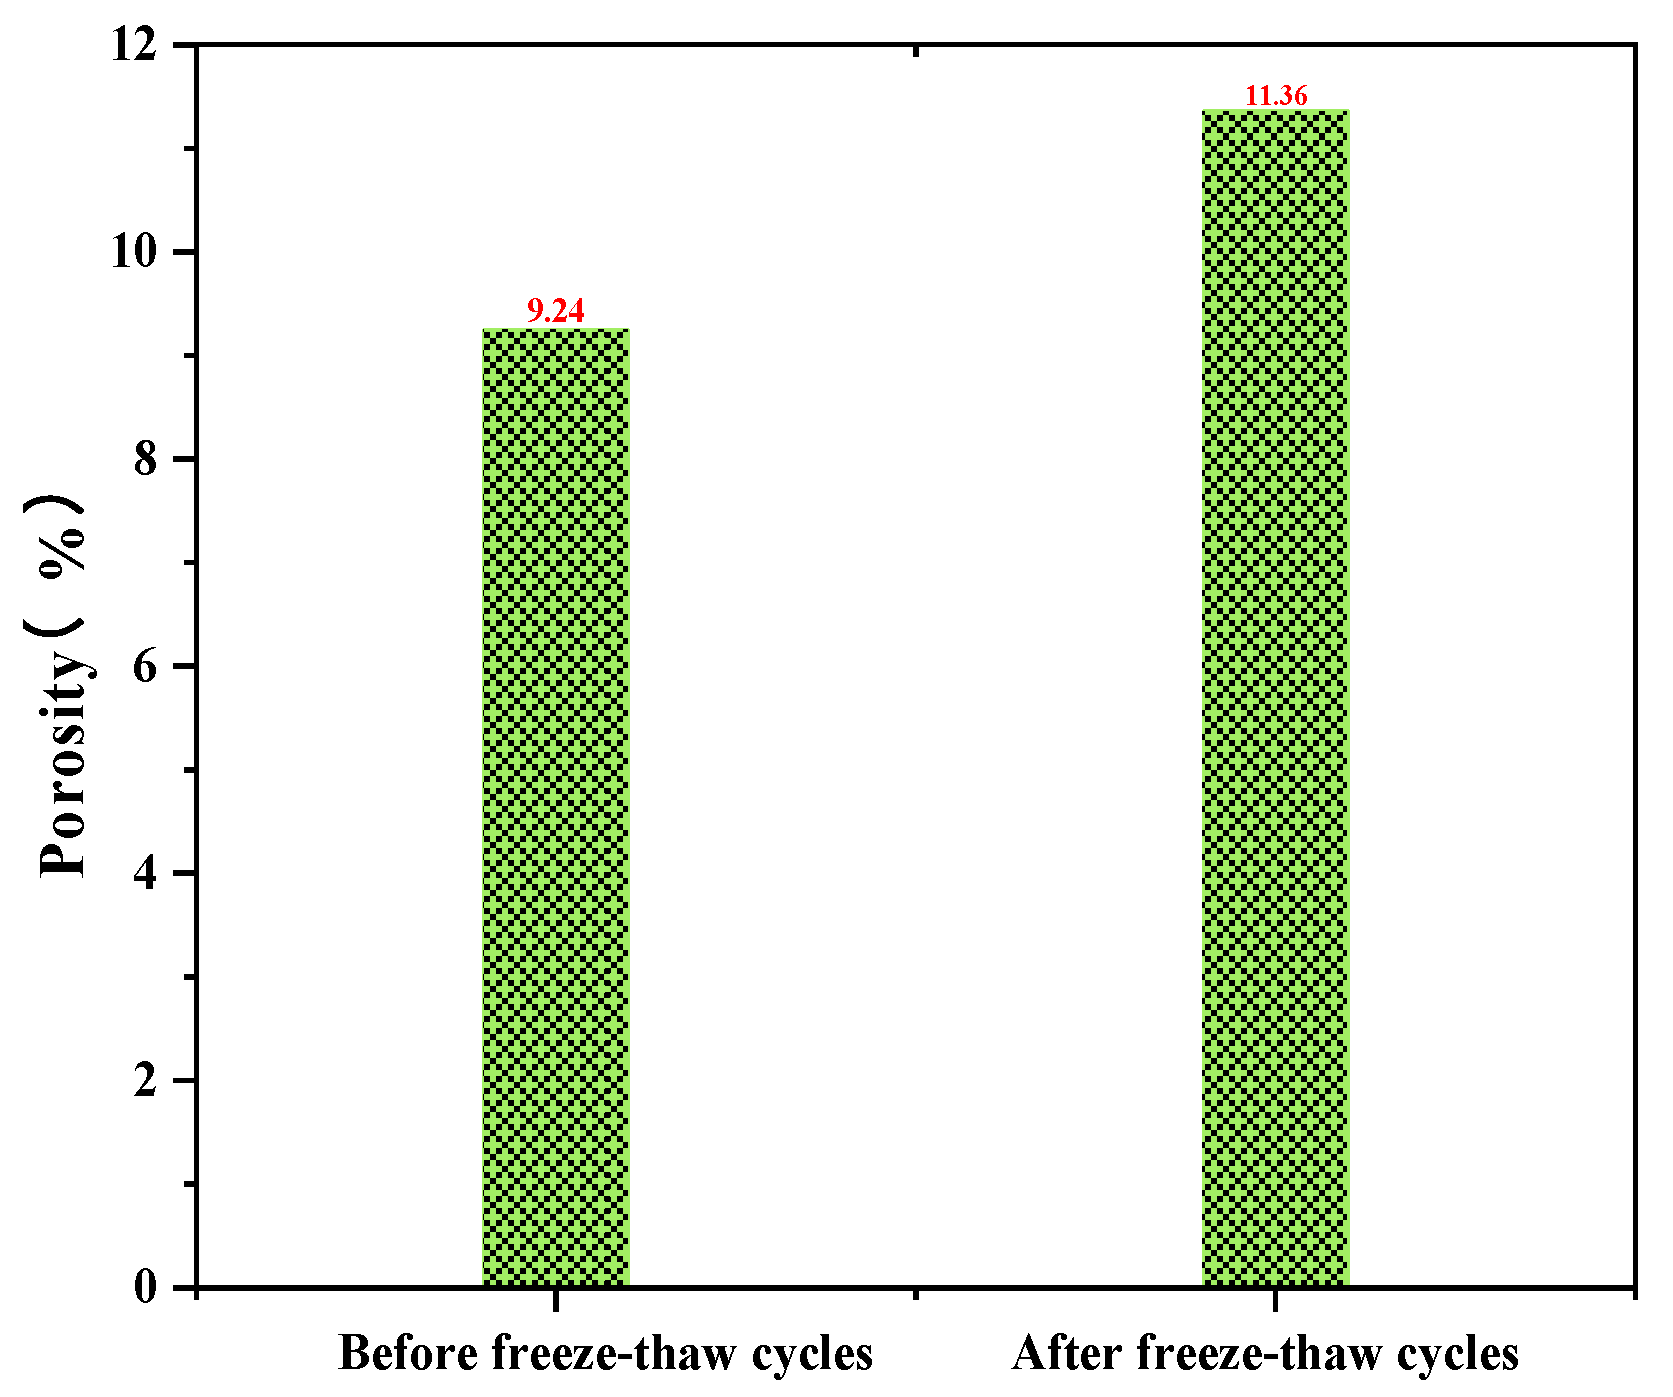
- After 200 freeze–thaw cycles, there was no obvious spalling on the surface of the pure dolomite coarse aggregate concrete; however, the UCS decreased by 20%. The porosity of the PWDSC before the freeze–thaw cycles was 9.24%, and it increased to 11.36% after 200 freeze–thaw cycles, which shows that the porosity of the PWDSC increased during the freeze–thaw process, explaining why the UCS declined. Because the concrete strength was in accordance with C30 grade concrete, the strength was still higher than 30 MPa after freeze–thaw treatment, indicating that PWDSC can effectively resist freeze–thaw damage.
Author Contributions
Funding
Data Availability Statement
Acknowledgments
Conflicts of Interest
References
- Fanijo, E.O.; Kolawole, J.T.; Almakrab, A. Alkali-silica reaction (ASR) in concrete structures: Mechanisms, effects and evaluation test methods adopted in the United States. Case Stud. Constr. Mater. 2021, 15, e00563. [Google Scholar] [CrossRef]
- Prakash, R.; Divyah, N.; Srividhya, S.; Avudaiappan, S.; Amran, M.; Naidu Raman, S.; Guindos, P.; Vatin, N.I.; Fediuk, R. Effect of steel fiber on the strength and flexural characteristics of coconut shell concrete partially blended with fly ash. Materials 2022, 15, 4272. [Google Scholar] [CrossRef] [PubMed]
- Prakash, R.; Thenmozhi, R.; Raman, S. Mechanical characterisation and flexural performance of eco-friendly concrete produced with fly ash as cement replacement and coconut shell coarse aggregate. Int. J. Environ. Sustain. Dev. 2019, 18, 131–148. [Google Scholar] [CrossRef]
- Singh, N.; Singh, A.; Ankur, N.; Kumar, P.; Kumar, M.; Singh, T. Reviewing the properties of recycled concrete aggregates and iron slag in concrete. J. Build. Eng. 2022, 60, 105150. [Google Scholar] [CrossRef]
- Alnuaim, A.; Abbas, Y.M.; Khan, M.I. Sustainable application of processed TBM excavated rock material as green structural concrete aggregate. Constr. Build. Mater. 2021, 274, 121245. [Google Scholar] [CrossRef]
- Samimi, K.; Pakan, M.; Eslami, J. Investigating the compressive strength and microstructural analysis of mortar containing synthesized graphene and natural pozzolan in the face of alkali-silica reactions. J. Build. Eng. 2023, 68, 106126. [Google Scholar] [CrossRef]
- Abbas, S. Preventive Measures of Alkali–Silica Reaction in Concrete Buildings: Use of Hybrid Waste Coal Ash and Steel Wire Cut Fibers. Buildings 2023, 13, 710. [Google Scholar] [CrossRef]
- Demir Şahin, D. Evaluation of Cherts in Gumushane Province in Terms of Alkali Silica Reaction. Buildings 2024, 14, 873. [Google Scholar] [CrossRef]
- Doğruyol, M. Determination of ASR in Concrete Using Characterization Methods. Buildings 2024, 14, 657. [Google Scholar] [CrossRef]
- Venyite, P.; Nemaleu, J.G.D.; Kaze, R.C.; Tchamba, A.B.; Kamseu, E.; Melo, U.C.; Leonelli, C. Alkali-silica reactions in granite-based aggregates: The role of biotite and pyrite. Constr. Build. Mater. 2022, 320, 126259. [Google Scholar] [CrossRef]
- Vo, D.; Multon, S.; Morenon, P.; Sellier, A.; Grimal, E.; Masson, B.; Kolmayer, P. Evaluation of structures affected by Alkali-Silica reaction (ASR) using homogenized modelling of reinforced concrete. Eng. Struct. 2021, 246, 112845. [Google Scholar] [CrossRef]
- Aslani, F.; Yu, J.; Zhang, Y.; Valizadeh, A. Development of prediction models for evaluation of alkali-silica reaction in concrete. Case Stud. Constr. Mater. 2023, 19, e02465. [Google Scholar] [CrossRef]
- Fiset, M.; Sanchez, L.; Bilodeau, S.; Mitchell, D.; Bastien, J. Influence of Alkali-Silica reaction (ASR) on aggregate interlock and shear-friction behavior of reinforced concrete members. Eng. Struct. 2021, 233, 111890. [Google Scholar] [CrossRef]
- Gao, P.; Wang, Y.; Wang, Y.; Zhou, H.; Xue, G. Influence of waste tire rubber powder, polypropylene fiber and their binary blends on mitigating alkali-silica reaction. J. Build. Eng. 2023, 67, 105951. [Google Scholar] [CrossRef]
- Kobayashi, K.; Takagi, Y. Penetration of pressure-injected lithium nitrite in concrete and ASR mitigating effect. Cem. Concr. Compos. 2020, 114, 103709. [Google Scholar] [CrossRef]
- Santos, M.B.; De Brito, J.; Silva, A.S.; Hawreen, A. Effect of the source concrete with ASR degradation on the mechanical and physical properties of coarse recycled aggregate. Cem. Concr. Compos. 2020, 111, 103621. [Google Scholar] [CrossRef]
- Li, W.; Deng, M.; Mo, L.; Panesar, D.K.; Mao, Z. Alkali carbonate reaction (ACR): Investigations on mechanism of dedolomitization of dolomite in dolostones. Constr. Build. Mater. 2022, 351, 128942. [Google Scholar] [CrossRef]
- Swenson, E.G. A Canadian Reactive Aggregate Undetected by ASTM Tests; Division of Building Research, National Research Council. 1957. Available online: https://www.researchgate.net/publication/44087155_A_Reactive_aggregate_undetected_by_ASTM_tests (accessed on 12 March 2024).
- Gillott, J.E. Petrology of Dolomitic Limestones, Kingston, Ontario, Canada. Geol. Soc. Am. Bull. 1963, 74, 759–778. [Google Scholar] [CrossRef]
- Fernandes, I.; Noronha, F.; Teles, M. Microscopic analysis of alkali–aggregate reaction products in a 50-year-old concrete. Mater. Charact. 2004, 53, 295–306. [Google Scholar] [CrossRef]
- Katayama, T. How to identify carbonate rock reactions in concrete. Mater. Charact. 2004, 53, 85–104. [Google Scholar] [CrossRef]
- Katayama, T.; Tagami, M.; Sarai, Y.; Izumi, S.; Hira, T. Alkali-aggregate reaction under the influence of deicing salts in the Hokuriku district, Japan. Mater. Charact. 2004, 53, 105–122. [Google Scholar] [CrossRef]
- Swenson, E.G.; Gillott, J.E. Characteristics of Kingston carbonate rock reaction. In Proceedings of the 39th Annual Meeting of the Highway Research Board, Washington, DC, USA, 11–15 January 1960. [Google Scholar]
- Deng, M.; Tang, M. Mechanism of dedolomitization and expansion of dolomitic rocks. Cem. Concr. Res. 1993, 23, 1397. [Google Scholar]
- Grattan-BelRew, P.; Gillott, J. Three decades of studying the alkali reactivity of Canadian aggregates. Spec. Publ. 1987, 100, 1365–1384. [Google Scholar]
- China Earthquake Admisistration. Crustal Evolution and Mineral Distribution Atlas of China; Geology Press: Beijing, China, 1996. [Google Scholar]
- Shuini, B. Exploitation and comprehensive utilization of dolomite ore. Min. Eng. 2010, 8, 4–6. [Google Scholar]
- Wenwen, Y. The Expansibility of Aggregate with Rock-Prism Method; Nanjing Tech University: Nanjing, China, 2016. [Google Scholar]
- Mei, L.; Tan, M. Advanced study on alkali-carbonate reactions in concrete. J. Nanjing Univ. Technol. 2002, 24, 104–111. [Google Scholar]
- Buck, A.D. Control of Reactive Carbonate Rocks in Concrete; Waterways Experiment Station: Vicksburg, MI, USA, 1975; Volume 75. [Google Scholar]
- Gillott, J.E.; Swenson, E.G. Mechanism of the alkali-carbonate rock reaction. Q. J. Eng. Geol. 1969, 2, 7–23. [Google Scholar] [CrossRef]
- Cam, A.; Sam, B.; Fl, C. Expansive behavior of an alkali-carbonate reactive dolostone from Argentina: Proposal of an osmotic theory-based model to explain the expansion caused by the alkali attack. Cem. Concr. Res. 2020, 138, 106239. [Google Scholar]
- Qi, Y. Study on the Reaction Mechanism of Concrete Alkali Aggregate and the Detection Technology of Aggregate Alkali Activity; South China University of Technology: Guangzhou, China, 2001. [Google Scholar]
- Qian, G.; Deng, M.; Lan, X.; Xu, Z.; Tang, M. Alkali carbonate reaction expansion of dolomitic limestone aggregates with porphyrotopic texture. Eng. Geol. 2002, 63, 17–29. [Google Scholar] [CrossRef]
- Mullick, A.K.; Sinha, R.C.W.S.K.; Rao, L.H. Evaluation of quartzite and granite aggregates containing strained quartz. In Proceedings of the 7th International Conference on Concrete Alkali-Aggregate Reactions, Ottawa, ON, Canada, 22–24 August 1986; pp. 428–433. [Google Scholar]
- Gillott, J.E. Mechanism and kinetics of expansion in the alkali-carbonate rock reaction. Can. J. Earth Sci. 1964, 1, 121–145. [Google Scholar] [CrossRef]
- Zhang, W.; Pi, Y.; Kong, W.; Zhang, Y.; Yang, F. Influence of damage degree on the degradation of concrete under freezing-thawing cycles. Constr. Build. Mater. 2020, 260, 119903. [Google Scholar] [CrossRef]
- GB175-2007; Common Portland Cement. Ministry of Industry and Information Technology of the People’s Republic of China: Beijing, China, 2007.
- JGJ52-2006; Standard for Technical Requirements and Tes Test Method of Sand and Crushed Stone (or Gravel) for Ordinary Concrete. Ministry of Housing and Urban-Rural Development of the People’s of China: Beijing, China, 2006.
- Liu, S.L.G. Analysis of alkali-active lithofacies characteristics of common igneous rock aggregates. Eng. Technol. Res. 2021, 5, 071. [Google Scholar]
- Sommer, H.; Nixon, P.; Sims, I. AAR-5: Rapid preliminary screening test for carbonate aggregates. Mater. Struct. 2005, 38, 787–792. [Google Scholar] [CrossRef]
- GB/T 50082-2009; Standard for Test Methods of Long-Term Performance and Durability of Ordinary Concrete. Ministry of Housing and Urban-Rural Development of the People’s Republic of China: Beijing, China, 2009.
- Leng, F.; Rong, J.; Ding, W.; Tin, G.F.; Zhou, Y.X.; Ji, X.K.; He, G.X.; Wei, Q.D.; Wang, J.; Bao, K.M.; et al. Introduction of Revised Standard for Test Methods of Long-term Performance and Durability of Ordinary Concrete GB/T 50082-2009. Constr. Technol. 2010, 39, 2. [Google Scholar]
- Feo, L.; Ascione, F.; Penna, R.; Lau, D.; Lamberti, M. An experimental investigation on freezing and thawing durability of high performance fiber reinforced concrete (HPFRC). Compos. Struct. 2020, 234, 111673. [Google Scholar] [CrossRef]
- Wang, Y.; Hu, Z.; Liu, J. Freeze-thaw resistance of concrete containing azodicarbonamide expansive agent. Constr. Build. Mater. 2023, 367, 130335. [Google Scholar] [CrossRef]
- ASTM C666/C666M-03; Standard Test Method for Resistance of Concrete to Rapid Freezing and Thawing. ASTM: West Conshohocken, PA, USA, 2008.
- Chang, S. Microstructure and Alkalinity Activity Lithofacies Analysis of Limestone in Liaoyang Area. China Non-Met. Miner. Ind. 2022, 57, 66–68. [Google Scholar]
- Chen, G.R.; Xie, F.K. Geological Features of Nanjing Anhydrite Deposit and Its Genetic Analysis. China Non-Met. Miner. Ind. 2011, 1, 48–51. [Google Scholar]
- Milanesi, C.A.; Marfil, S.A.; Locati, F.; Benito, D. Effects of different alkaline solutions on the expansivity of rock prisms of an alkali-reactive dolostone from Valcheta (Río Negro, Argentina). Cem. Concr. Res. 2020, 134, 106092. [Google Scholar] [CrossRef]
- Qian, G. The Rock Textural Characteristics and Alkali Carbonate Reaction; Nanjing Tech University: Nanjing, China, 1999. [Google Scholar]
- Kang, S. Mechanism of Inhibiting Alkali-Aggregate by Waterproofing and Long-Term Performance of Waterproof Concrete; Sichuan University: Chengdu, China, 2022. [Google Scholar]
- GB/T 50081-2019; Standard for Test Method of Mechanical Properties on Ordinary Concrete. Ministry of Housing and Urban-Rural Development of the People’s Republic of China: Beijing, China, 2019.
- Abell, A.; Willis, K.; Lange, D. Mercury intrusion porosimetry and image analysis of cement-based materials. J. Colloid Interface Sci. 1999, 211, 39–44. [Google Scholar] [CrossRef] [PubMed]
- Chen, S.J.; Li, W.G.; Ruan, C.K.; Sagoe-Crentsil, K.; Duan, W.H. Pore shape analysis using centrifuge driven metal intrusion: Indication on porosimetry equations, hydration and packing. Constr. Build. Mater. 2017, 154, 95–104. [Google Scholar] [CrossRef]
- Diamond, S. The Microstructure of Cement Paste and Concrete—A Visual Primer. Cem. Concr. Compos. 2004, 26, 919–933. [Google Scholar] [CrossRef]
- Lyu, K.; She, W.; Miao, C.; Chang, H.; Gu, Y. Quantitative characterization of pore morphology in hardened cement paste via SEM-BSE image analysis. Constr. Build. Mater. 2019, 5, 589–602. [Google Scholar] [CrossRef]
- Diamond, S.; Landis, E. Microstructural features of a mortar as seen by computed microtomography. Mater. Struct. 2006, 40, 989–993. [Google Scholar] [CrossRef]
- Xu, Z.; Sun, J.; Li, R.; He, L.; Liu, C. Effects of elevated ground temperatures on properties of cement grouts for deep rock grouting. Deep. Undergr. Sci. Eng. 2023, 1–18. [Google Scholar] [CrossRef]
- Powers, T.C.; Helmuth, R. Theory of Volume Changes in Hardened Portland-Cement Paste during Freezing. Available online: https://books.google.co.kr/books/about/Theory_of_Volume_Changes_in_Hardened_Por.html?id=9GDvngEACAAJ&redir_esc=y (accessed on 12 March 2024).
- Powers, T.C.; Willis, T. The air requirement of frost-resistant concrete. Mater. Constr. 1949, 184–219. Available online: https://onlinepubs.trb.org/Onlinepubs/hrbproceedings/29/29-010.pdf (accessed on 12 March 2024).


| CaO | SiO2 | Al2O3 | Fe2O3 | TiO2 | K2O | Na2O | Other |
|---|---|---|---|---|---|---|---|
| 60.78% | 20.49% | 4.90% | 4.07% | 1.38% | 0.50% | 0.46% | 7.42% |
| Cement (kg) | Water (kg) | The Pure Dolomite Coarse Aggregate (kg) | Sand (kg) | ||
|---|---|---|---|---|---|
| 16~13.2 (mm) | 13.2~9.5 (mm) | 9.5~4.75 (mm) | 4.75~0.15 (mm) | ||
| 536.56 | 241.45 | 110.00 | 440.28 | 550.35 | 440.28 |
| Calcite | Dolomite | Clay | Pitch | Gypsum | Pyrite | Quartz | Cryptocrystalline Silicon |
|---|---|---|---|---|---|---|---|
| 0 | 99% | 1% | 0 | 0 | 0 | 0 | 0 |
| The First Group | K1-1-1 | K1-1-2 | K1-1-3 | K1-2-1 | K1-2-2 | K1-2-3 | Average Value |
|---|---|---|---|---|---|---|---|
| The initial diameter (mm) | 8.90 | 8.92 | 8.92 | 8.92 | 8.95 | 8.93 | 8.92 |
| The initial length (mm) | 35.05 | 35.11 | 35.06 | 35.06 | 35.09 | 35.08 | 35.07 |
| The final diameter (mm) | 8.89 | 8.91 | 8.91 | 8.89 | 8.94 | 8.93 | 8.91 |
| The final length (mm) | 35.02 | 35.07 | 35.04 | 35.04 | 35.05 | 35.04 | 35.04 |
| The Second Group | K2-1-1 | K2-1-2 | K2-1-3 | K2-2-1 | K2-2-2 | K2-2-3 | Average Value |
| The initial diameter (mm) | 8.93 | 8.88 | 8.96 | 8.96 | 8.88 | 8.93 | 8.93 |
| The initial length (mm) | 35.08 | 35.11 | 35.06 | 35.06 | 35.05 | 35.08 | 35.07 |
| The final diameter (mm) | 8.91 | 8.87 | 8.96 | 8.96 | 8.88 | 8.93 | 8.92 |
| The final length (mm) | 35.04 | 35.08 | 35.04 | 35.03 | 35.02 | 35.04 | 35.04 |
| The Third Group | K3-1-1 | K3-1-2 | K3-1-3 | K3-2-1 | K3-2-2 | K3-2-3 | Average Value |
| The initial diameter (mm) | 8.91 | 8.97 | 8.96 | 8.92 | 8.89 | 8.81 | 8.91 |
| The initial length (mm) | 35.07 | 35.08 | 35.08 | 35.04 | 35.06 | 35.08 | 35.07 |
| The final diameter (mm) | 8.91 | 8.96 | 8.96 | 8.91 | 8.89 | 8.81 | 8.91 |
| The final length (mm) | 35.04 | 35.05 | 35.05 | 35.02 | 35.03 | 35.04 | 35.04 |
Disclaimer/Publisher’s Note: The statements, opinions and data contained in all publications are solely those of the individual author(s) and contributor(s) and not of MDPI and/or the editor(s). MDPI and/or the editor(s) disclaim responsibility for any injury to people or property resulting from any ideas, methods, instructions or products referred to in the content. |
© 2024 by the authors. Licensee MDPI, Basel, Switzerland. This article is an open access article distributed under the terms and conditions of the Creative Commons Attribution (CC BY) license (https://creativecommons.org/licenses/by/4.0/).
Share and Cite
Chen, Y.; Xiong, X.; Wang, D.; Zhou, X.; Liu, C.; Xu, Z. The Risk of Alkali–Carbonate Reaction and the Freeze–Thaw Resistance of Waste Dolomite Slag-Based Concrete. Buildings 2024, 14, 1664. https://doi.org/10.3390/buildings14061664
Chen Y, Xiong X, Wang D, Zhou X, Liu C, Xu Z. The Risk of Alkali–Carbonate Reaction and the Freeze–Thaw Resistance of Waste Dolomite Slag-Based Concrete. Buildings. 2024; 14(6):1664. https://doi.org/10.3390/buildings14061664
Chicago/Turabian StyleChen, Yulin, Xuefei Xiong, Ding Wang, Xianliang Zhou, Changwu Liu, and Zhipeng Xu. 2024. "The Risk of Alkali–Carbonate Reaction and the Freeze–Thaw Resistance of Waste Dolomite Slag-Based Concrete" Buildings 14, no. 6: 1664. https://doi.org/10.3390/buildings14061664