Article

Compression and Splitting Tensile Strength Model of Recycled Seawater and Sea Sand Concrete after Seawater Freeze–Thaw Cycles

by
Zhenyu Tan
1 and
Deqiang Yang
2,*
1
International College, Krirk University, Bangkok 10220, Thailand
2
School of Civil Engineering and Geomatics, Shandong University of Technology, Zibo 255000, China
*
Author to whom correspondence should be addressed.
Buildings 2024, 14(6), 1671; https://doi.org/10.3390/buildings14061671
Submission received: 27 April 2024 / Revised: 20 May 2024 / Accepted: 31 May 2024 / Published: 5 June 2024
(This article belongs to the Section Building Materials, and Repair & Renovation)

Abstract

:
Using seawater, sea sand, and recycled bricks to make concrete for nearshore and marine engineering can save resources and protect the environment. Therefore, this article studies the mechanical degradation law and failure mechanism of recycled seawater and sea sand concrete (SSC) after seawater freeze–thaw (SFT) cycles. Using the replacement rate of recycled brick coarse aggregate as a variable, the mass loss rate, relative dynamic elastic modulus, compression and splitting tensile strength, and microstructure changes of specimens under different SFT cycles were tested, and a mechanical performance degradation model was established. The results indicate that the SFT failure of recycled brick coarse aggregate SSC results from the action of physical SFT and chemical crystallization. Friedel’s salts without cementitious properties and ettringite with expansive properties are generated inside the concrete due to the chloride and sulfate ions in the internal concrete and external seawater reacting with cement hydration products. The formation of harmful crystals leads to the loosening of the concrete, especially in the interface area between brick aggregates and cement. The calculated results of the mechanical model established in this article agree with the test results. The compression and splitting tensile strength decrease linearly with the increase in SFT cycles.

1. Introduction

With the continuous development of urbanization worldwide, large-scale infrastructure has consumed much river sand and fresh water. Natural river sand is mainly extracted from riverbeds and mountains. The overexploitation of river sand can lead to riverbed cutting, causing severe adverse effects on the normal function of the river and the surrounding ecological environment [1,2,3,4]. And the exploitation of river sand also comes with a huge risk of resource depletion [5]. However, many high-quality sea sand minerals in the world’s coastal areas and the most economically developed regions are mainly within a range of 300 km from the coastline [6]. If sea sand is used as a substitute for river sand to make concrete, it can reduce transportation costs and alleviate environmental damage caused by river sand mining.
Sea sand has a very similar chemical composition, geological origin, and gradation of particles to river sand; apart from its chloride ion and shell content [7], sea sand can be fully used for preparing concrete [8]. Chlorine ions in concrete can cause corrosion of steel bars, so various countries have strict regulations on the chloride ion content [9,10]. Currently, in the actual use of sea sand, the methods of cleaning, desalination, and reuse are usually adopted. There has been much research and application of this desalination sea sand in many countries [11,12]. However, this method is time-consuming and labor-intensive, significantly increasing the cost of using sea sand and wasting many freshwater resources. It is even more challenging to achieve in the construction process of offshore islands and reefs. Therefore, in future engineering construction, the direct use of concrete prepared from untreated sea sand and seawater has become the most practical choice.
The development of urban infrastructure projects has led to an increasing number of old buildings reaching their service life. Most of these construction waste disposal methods involve burying or stacking around a city. The former must come at the cost of polluting the environment and water sources. The latter can easily cause garbage to surround a town and occupy valuable land resources. Therefore, many scholars have gradually increased their research on using construction waste as coarse and fine aggregates to pre-pare recycled concrete [13,14,15,16,17,18,19,20]. Ji et al. [21] investigated recycled brick coarse aggregate concrete’s mechanical and micro-interfacial properties. Blas et al. [22] explored the thermal behavior of recycled aggregate concrete from construction and demolition waste.
Recycled concrete also faces the influence of environmental factors in practical use, and research on its durability is also worth paying attention to. Bektas et al. [23] explored the actions of replacement rates of recycled brick as fine aggregates on cement mortar’s mechanical and durability properties, including flowability, compression strength, shrinkage, and resistance to seawater freeze–thaw (SFT) cycles. They found that when the dosage was 10% and 20%, the resistance to SFT and alkali aggregate reactions was improved. Vieira et al. [24] found that recycled brick as a fine aggregate can reduce the concrete’s water absorption and chloride ion permeability, and the later compression strength loss is more severe. Boukours et al. [25] found that adding a certain amount of recycled bricks as fine aggregate can reduce the shrinkage of mortar and the flexural strength of mortar. Mo-hammed et al. [26] studied the strength and Young’s modulus of recycled bricks used as coarse aggregates in concrete at 7, 14, and 28 days. Tanvir et al. [27] found that recycled brick coarse aggregate concrete has good corrosion resistance.
Due to the diversity of sources and significant differences in properties of recycled aggregates, the establishment of a compressive strength prediction model for recycled concrete has great uncertainty. Many studies have found that recycled concrete’s compressive strength and substitution rate have a linear decreasing relationship. Therefore, many fitting relationship models have been established [28,29,30]. Existing research also indicates that recycled aggregates’ replacement rate directly affects recycled concrete’s elastic modulus, thus establishing a relationship between compressive strength and elastic modulus [31,32,33]. Some scholars have used neural network methods to develop a relationship model between the substitution rate and compressive strength of recycled concrete [34,35]. From the above research, it can be seen that the existing recycled concrete models are mostly numerical fitting models, lacking practical physical significance, and the compressive strength models of recycled concrete after superimposing the effects of concrete service environment are lacking in research.
Based on the current stacking of recycled brick and the shortage of freshwater and river sand, the rational use of these three materials to produce seawater and sea sand concrete (SSC) with recycled brick coarse aggregate has become a necessary measure for environmental protection in nearshore and marine engineering. At the same time, buildings in coastal cold regions face severe SFT tests, and cold weather also has a negative impact on the strength development during the early curing process of concrete [36]. Based on this, this article studied the mechanical properties of SSC with variable brick coarse aggregate after SFT cycles and established a compressive and splitting tensile strength model considering two factors: recycled aggregate replacement rate and SFT cycling. The aim is to provide a theoretical reference for the promotion of waste brick coarse aggregate SSC in cold coastal and marine engineering.

2. Concrete Production and Testing Process

2.1. Concrete Production

The properties of cement used in concrete production are shown in Table 1. The properties of fine aggregates used are shown in Table 2, and the fine aggregate was undisturbed sea sand from Bohai Bay in north China. The natural coarse aggregate was crushed granite, and the recycled brick came from the demolished old brick and concrete structures in the old urban area around Yantai City in north China. The recycled brick was crushed and screened by a crusher, as shown in Table 3. The mixing water used artificial seawater, as shown in Table 4, and was prepared with clean water from the laboratory and chemicals. The polycarboxylate-based water-reducing agent used had a water reduction rate of 30%. The experiment used recycled bricks as coarse aggregates to replace natural stones, with mass replacement rates of 0%, 20%, and 40%. The mix proportion of concrete is shown in Table 5.
After the test specimen was poured and left to stand in the lab for 24 h, the mold was removed and cured for 28 days. After curing, an SFT cycle and mechanical performance tests were conducted. A total of 108 specimens were made throughout the entire experimental process, including 72 cubic specimens with dimensions of 100 mm and 36 rectangular specimens with dimensions of 100 × 100 × 300 mm. The numbering rules for specimens are as follows: G40–50 represents a group of specimens with a replacement rate of 40% for brick coarse aggregates and an SFT cycle number of 50.

2.2. Testing Process

Referring to the Chinese Code [37], the specimens cured for 28 days were taken out and soaked in artificial seawater for four days. Then, they were put into an FT testing machine for rapid FT testing. The FT medium was artificial seawater, and the FT cycle temperature was −18~5 °C. One SFT cycle lasted for 4 h. After the predetermined number of SFT cycles was reached, the rectangular specimen’s relative dynamic elastic modulus and mass loss rate were measured. According to the Chinese Code [38], the compressive loading speed of the cube was 0.5 MPa/s, and the splitting tensile loading speed was 0.05 MPa/s.
After compressive failure, a sample was taken at a distance of 10 mm from the surface of the concrete, and SEM testing was used to observe the sample’s microstructure. In addition, a portion of cement mortar was ground at the exact location, and coarse aggregates were removed using a 200-mesh sieve. The sample was analyzed using XRD diffraction (BrukerAXS, Karlsruhe, Germany) and Xpert Highscore plus software (Version 3.0e) to investigate the corrosion products generated inside the concrete after SFT cycles. The XRD test conditions were Cu target, accelerated voltage of 40 kV, 40 mA current, and scanning angle of 5–70°.

3. Results

3.1. Surface of Specimens after SFT

The surface of specimens with varying rates of replacement of brick coarse aggregates is generally the same after varying SFT cycles, and the surface damage phenomenon becomes increasingly evident with the increase in SFT cycles. The surface of specimens with a brick coarse aggregate replacement rate of 20% is shown in Figure 1. When the number of SFT cycles is 0, the entire surface of the specimen is wrapped in cement slurry. Many different sizes of pores are distributed on the surface, naturally forming during manufacturing. When the SFT cycle number is 25, the outermost part of the cement slurry on the surface of the specimen falls off, and some stones and sand begin to leak out. When the SFT cycle number is 50, almost all of the cement slurry on the surface of the specimen falls off, stones and sand leak out, the edges and corners of the specimen begin to be missing, and the specimen starts to be incomplete. When the SFT cycle number is 75, the cement slurry falls off and develops towards the depth of the specimen, and the phenomenon of missing edges and corners is more severe, and the leaked brick coarse aggregate can be seen.
Figure 2 shows the surface of specimens after 75 FT cycles. The missing corners of specimens with a brick coarse aggregate replacement rate of 0% are not as severe. The specimen with a brick coarse aggregate replacement rate of 20% has severe missing edges and corners, and there is more residual sand on the specimen surface. The missing corners of the specimens with a brick coarse aggregate replacement rate of 40% are more severe, and residual sand is almost invisible on the surface of the specimens, leaving only larger stones and brick coarse aggregates. Note that as the replacement rate increases, the SFT damage of the specimen becomes increasingly severe under the same number of SFT cycles.

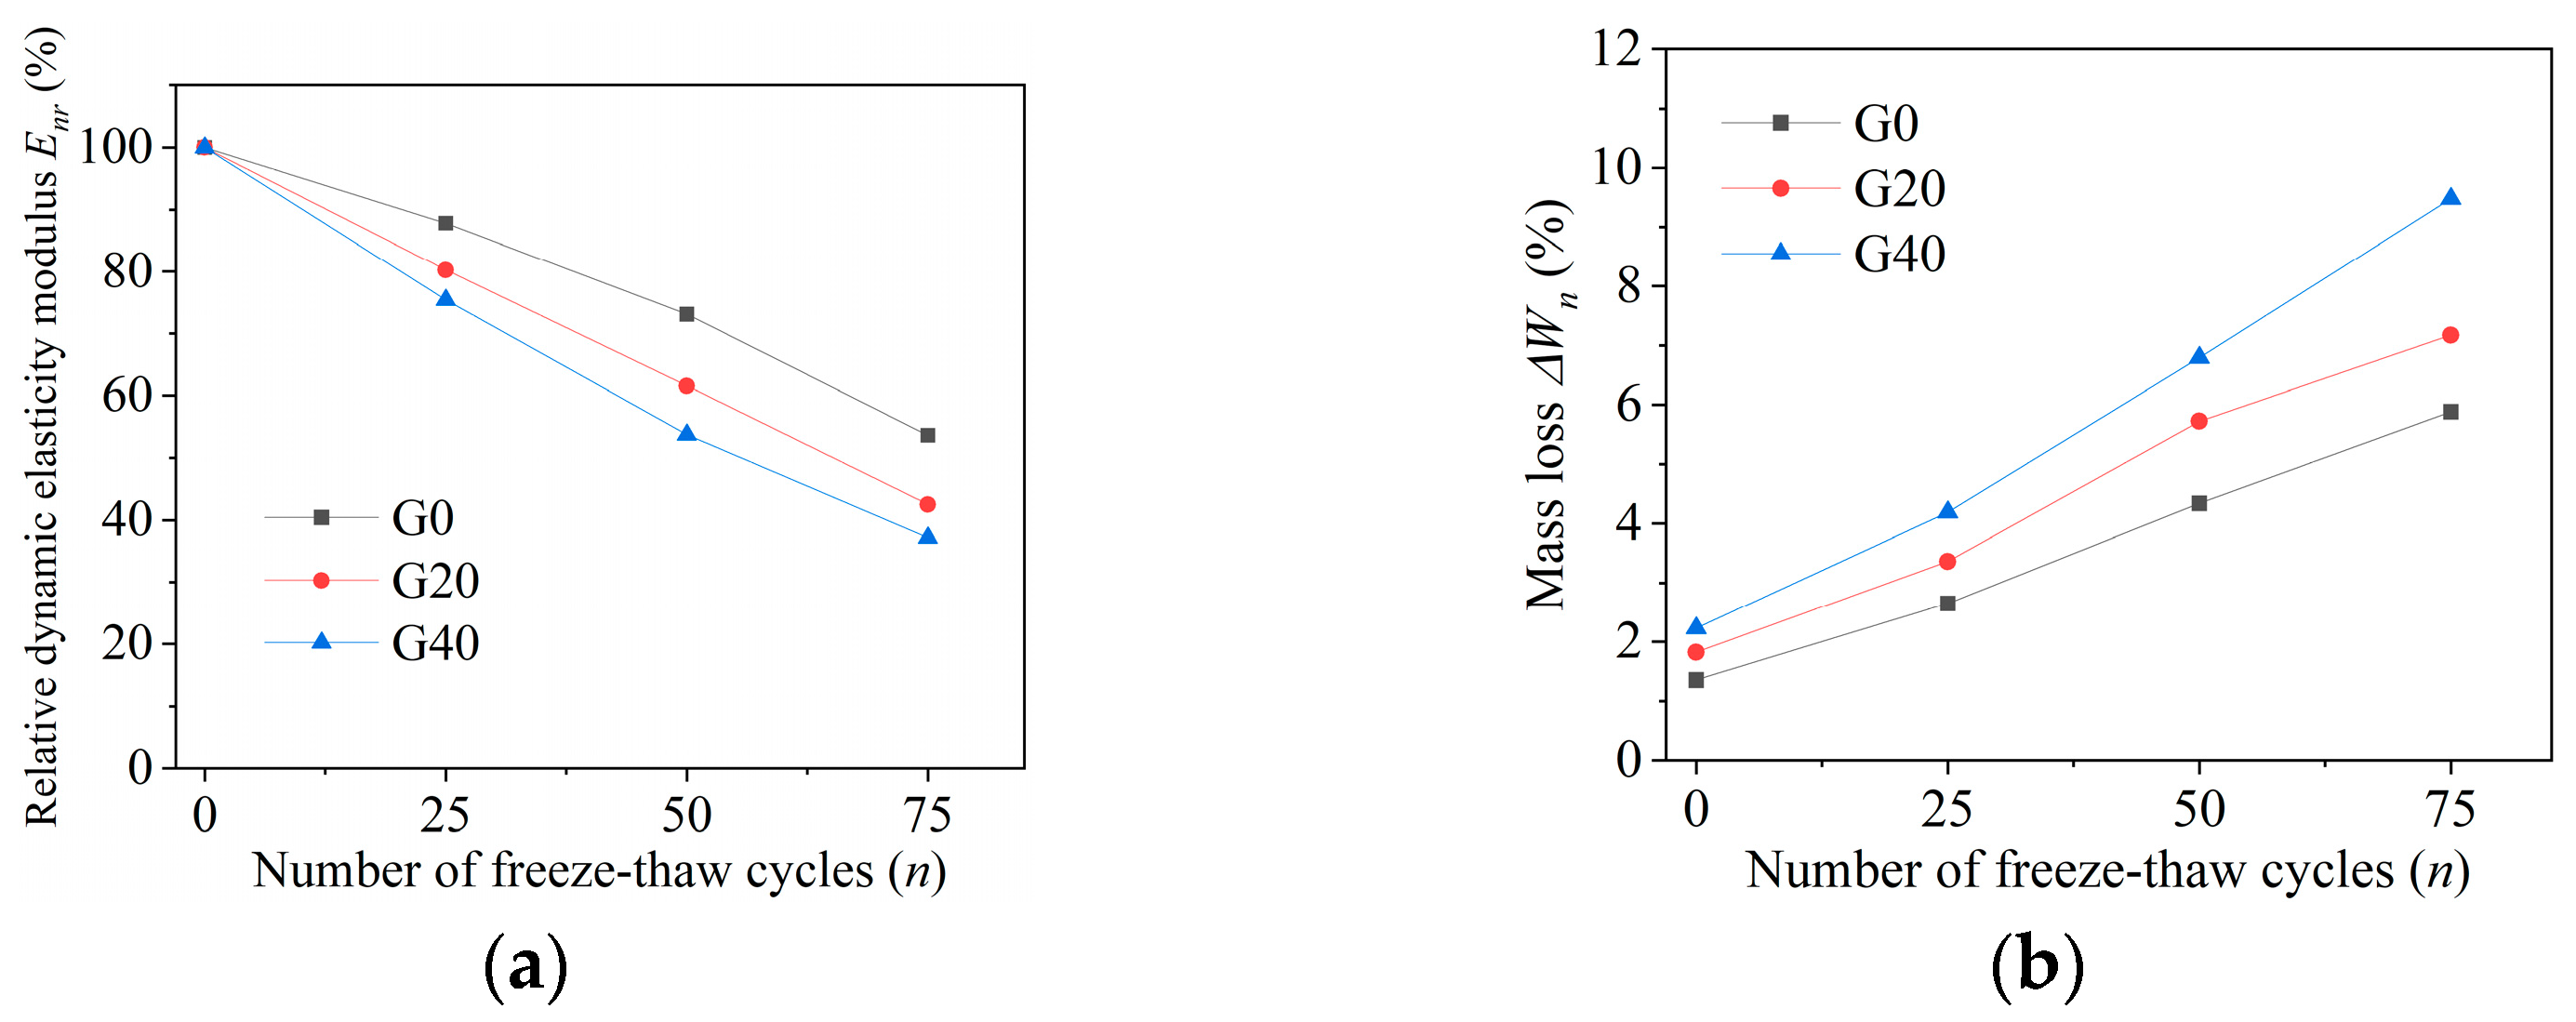
3.2. Relative Dynamic Modulus of Elasticity and Mass Loss Rate

Figure 3 shows the specimens’ relative dynamic modulus of elasticity and mass loss rate. Figure 3a shows that as the SFT cycles increase, the relative dynamic elastic modulus of specimens with different brick coarse aggregate replacement rates shows a linear decreasing trend. Moreover, under the same number of SFT cycles, the specimens’ relative dynamic elastic modulus gradually decreases as the brick coarse aggregate replacement rate increases. When the SFT cycle number is 75, the relative dynamic elastic modulus of the specimen with a brick coarse aggregate replacement rate of 0% is about 60%; the relative dynamic elastic modulus of the specimen with a brick coarse aggregate replacement rate of 40% is about 40%, which is 1.5 times that of the specimen with a replacement rate of 0%; and the relative dynamic elastic modulus of the specimen with a replacement rate of 20% is about 45%. This indicates that compared to the specimen with a brick coarse aggregate replacement rate of 0%, the relative dynamic elastic modulus of the specimen with added brick coarse aggregate decreases more significantly, and the presence of brick coarse aggregate has a more significant impact on the relative dynamic elastic modulus than the replacement rate of brick coarse aggregate.
Figure 3b shows that as the SFT cycles increase, the mass loss rate of specimens shows a linear upward trend. Moreover, under the same number of SFT cycles, the mass loss rate gradually decreases as the brick coarse aggregate replacement rate increases. When the SFT cycle number is 75, the mass loss rate with a brick coarse aggregate replacement rate of 0% is about 5%. The mass loss rate with a brick coarse aggregate replacement rate of 40% is about 10%, which is twice that of the specimen with a replacement rate of 0%. The specimen with a replacement rate of 20% is between the two, consistent with the surface of the previous specimen after SFT cycles. This indicates that the influence of the presence of brick coarse aggregates and the influence of the replacement rate of brick coarse aggregates on the mass loss rate are the same.

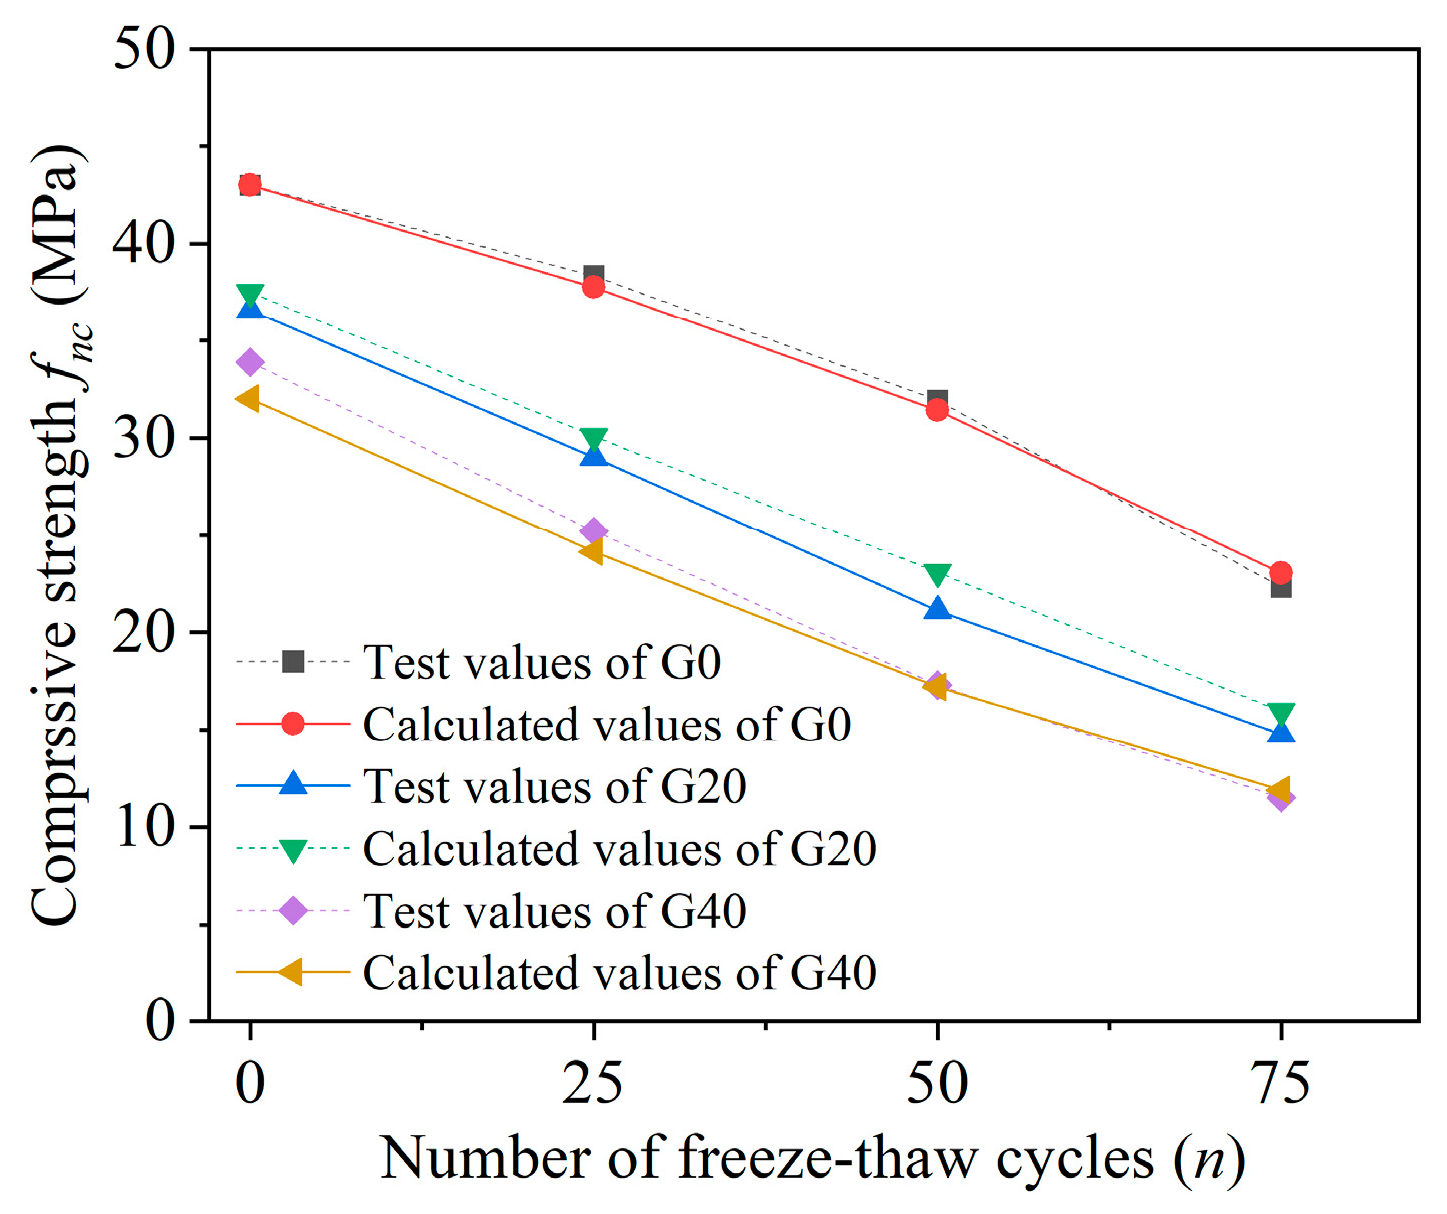
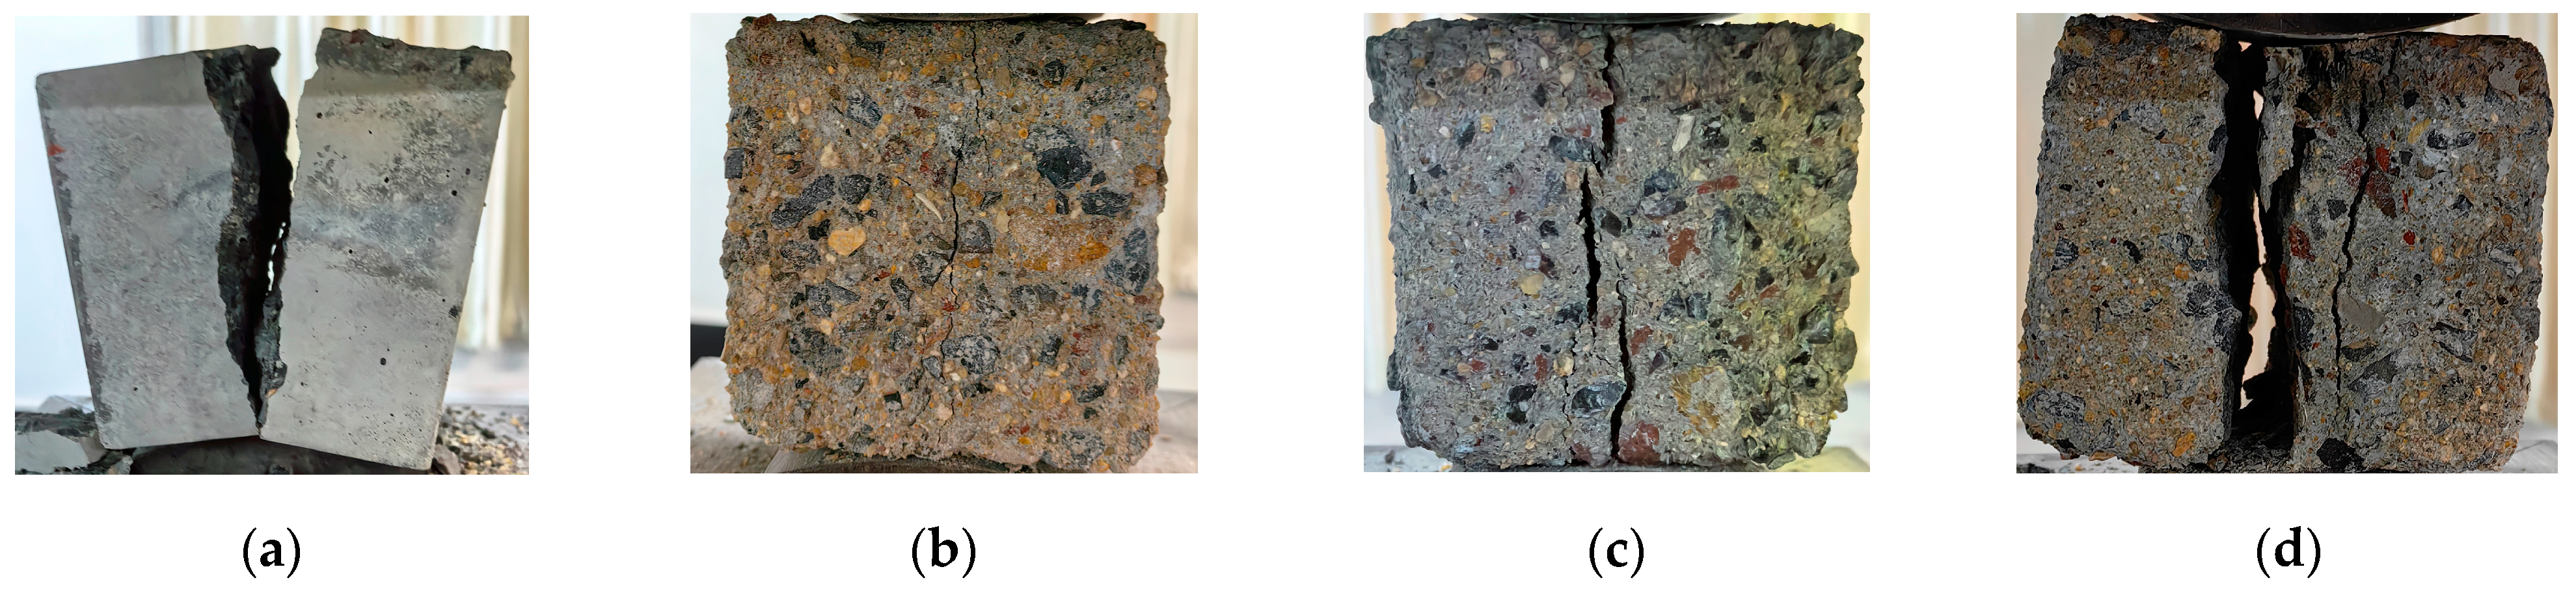
3.3. Compression Destructive State and Strength

The compression destructive state of specimens with different replacement rates of brick coarse aggregates after varying SFT cycles is generally the same, and the compression failure phenomenon becomes more evident with the increase in SFT cycles. Taking the specimen with a brick coarse aggregate replacement rate of 20% as an example, the compression destructive state under varying SFT cycles is shown in Figure 4. When the SFT cycle number is 0, the specimen fails relatively intact, with only some blocks falling off. When the SFT cycle number is 25, the specimen is also relatively intact when it fails, with some blocks falling off and the detached blocks being relatively small. When the SFT cycle number is 50, the specimen is divided into three parallel parts with wide and relatively loose cracks. When the SFT cycle number is 75, the specimen is parallel, and the detached blocks are loose and disordered. The SFT cycles make the specimen structure more porous and exhibit more brittleness during failure.
Figure 5 shows the compression destructive state of specimens under 75 SFT cycles. When the specimen with a brick coarse aggregate replacement rate of 0% fails, it is divided into multiple parallel blocks, which are larger and complete. When the replacement rate of brick coarse aggregate is 20%, the specimen fails more severely at the edges and corners, resulting in smaller and looser blocks. When a specimen with a brick coarse aggregate replacement rate of 40% fails, the entire specimen becomes incomplete, and almost half of the specimens split into more loose small pieces, becoming even looser. Smaller fragments scattered around. Note that under the same number of SFT cycles, as the replacement rate increases, the compression destructive state of the specimen exhibits more brittleness. The reason is that the discarded brick coarse aggregate, due to its inherent micro-cracks and microdamage, has a weaker binding force with cement than natural aggregate. In addition, the discarded brick coarse aggregate contains residual hardened cement slurry, which cannot bond with new cement during the pouring process. Instead, it exists in the interface transition zone, causing a severe decrease in bonding force.
Figure 6 shows the calculation results of the compressive strength model. Only the variation in the compressive strength experimental values in the figure with the replacement rate of brick aggregates is analyzed. As the SFT cycles increase, the compression strength with varying brick coarse aggregate replacement rates shows a linear decreasing trend. Moreover, under the same number of SFT cycles, the compression strength gradually decreases as the brick coarse aggregate replacement rate increases. When the SFT cycle number is 75, the compression strength with a brick coarse aggregate replacement rate of 0% decreases to about 25 MPa. The compression strength with a brick coarse aggregate replacement rate of 40% is about 10 MPa, and the compression strength with a replacement rate of 20% is about 15 MPa. This indicates that compared to the specimen with a brick coarse aggregate replacement rate of 0%, the compression strength of the specimen with added brick coarse aggregate decreases significantly. The addition of waste brick coarse aggregate in concrete has a more significant impact on the compression strength after SFT cycles than the replacement rate of brick coarse aggregate. The analysis indicates that brick coarse aggregate has a greater water absorption rate than natural aggregate, and water can enter deeper into the specimen’s interior with a faster replacement rate during SFT cycles.

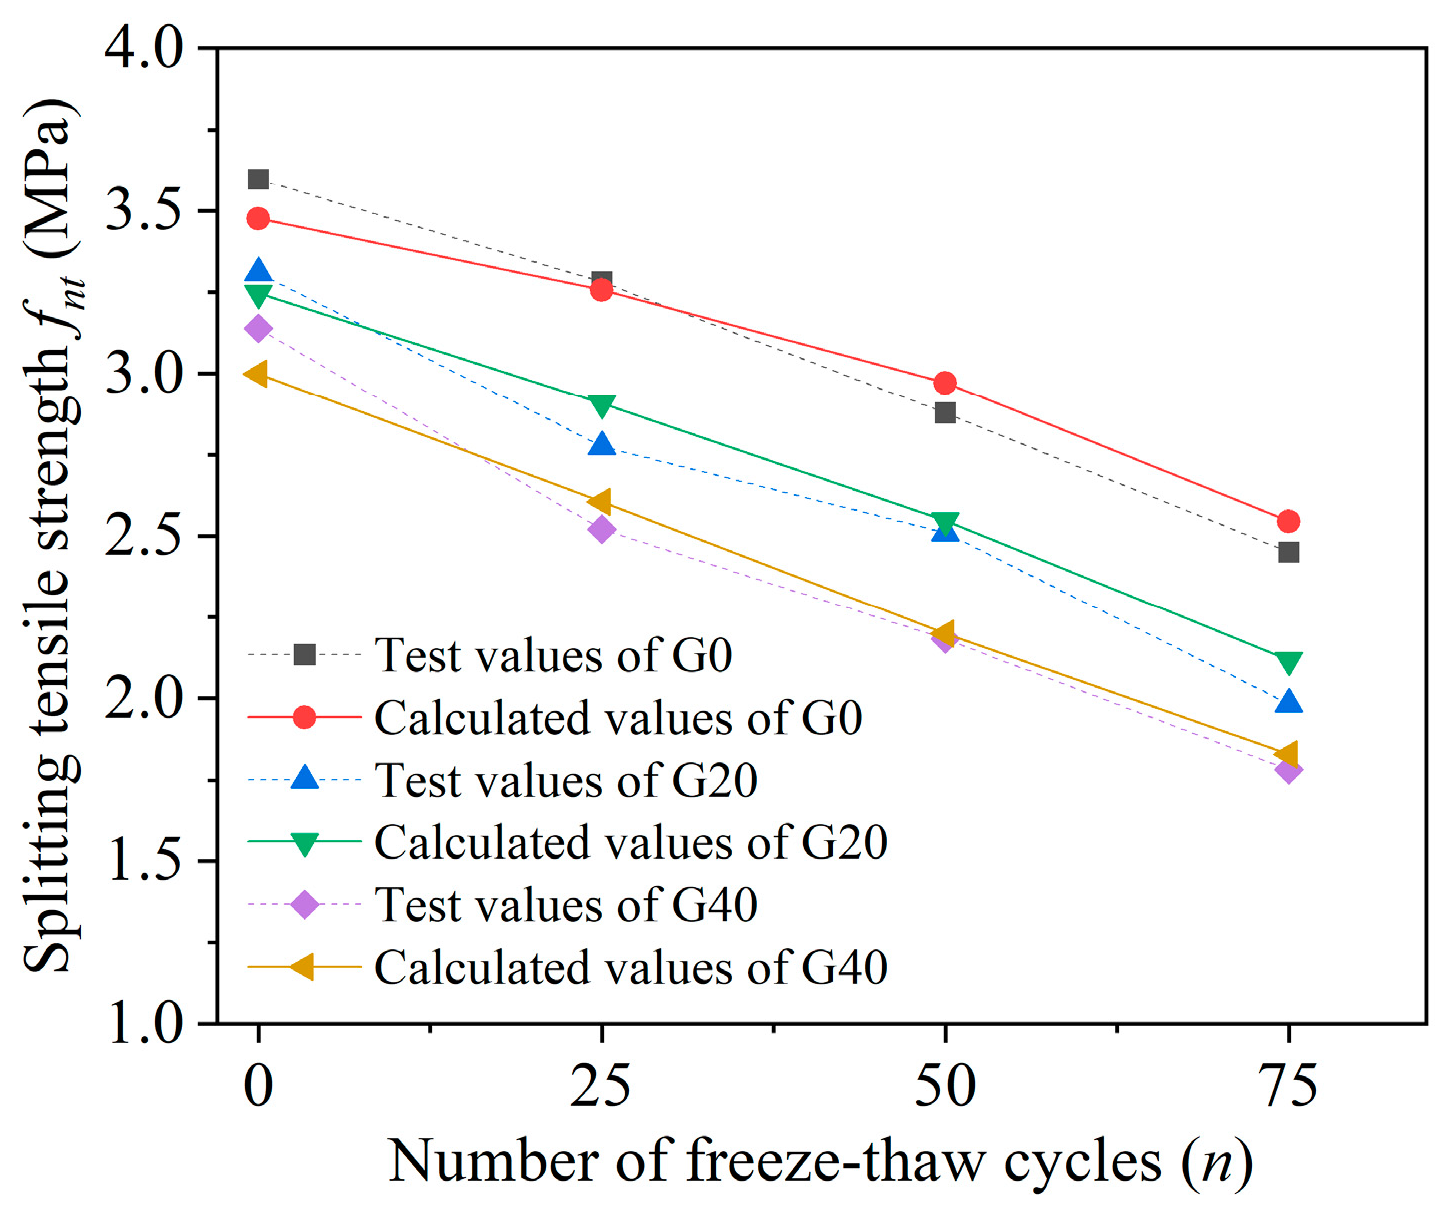
3.4. Splitting Tensile Destructive State and Strength

The splitting tensile destructive state with varying replacement rates of brick coarse aggregates is generally the same, and the splitting tensile failure phenomenon becomes more evident with the increase in SFT cycles. Taking the specimen with a brick coarse aggregate replacement rate of 20% as an example, the splitting tensile failure mode under varying SFT cycles is shown in Figure 7. When the SFT cycle number is 0, the specimen fails into two complete half blocks. When the SFT cycle number is 25, the specimen is broken into two complete halves, with only minor cracks forming around the vertical main crack. When the SFT cycle number is 50, the specimen is broken into two complete half pieces, and the cracks formed by small pieces around the vertical main crack are more prominent. When the SFT cycle number is 75, the specimen failure occurs in two larger half blocks and a smaller block around the vertical main crack. The SFT cycles make the specimen structure more porous and exhibit more brittleness during splitting tensile failure.
Figure 8 shows the splitting tensile destructive state of specimens under 75 SFT cycles. When the specimen with a brick coarse aggregate replacement rate of 0% fails, the specimen is divided into multiple parallel blocks, which are relatively large and complete. When the specimen with a brick coarse aggregate replacement rate of 20% fails, it is divided into two larger half blocks and a smaller block around the vertical main crack. When the specimen with a brick coarse aggregate replacement rate of 40% fails, it is also divided into two relatively large halves, with only one half split into two small pieces on top and bottom. Note that under the same number of SFT cycles, as the replacement rate increases, the splitting tensile failure of the specimen exhibits more brittleness. The reason is related to insufficient bonding force in the interface transition zone [39].
Figure 9 shows the calculation results of the splitting tensile strength model. Only the variation in the splitting tensile strength experimental values in the figure with the replacement rate of brick aggregates is analyzed. As the SFT cycle increases, the splitting tensile strength with varying brick coarse aggregate replacement rates shows a linear decreasing trend. Moreover, specimens’ splitting tensile strength decreases under the same number of SFT cycles as the brick coarse aggregate replacement rate increases. When the SFT cycle number is 75, the splitting tensile strength with a brick coarse aggregate replacement rate of 0% decreases to about 2.6 MPa, the splitting tensile strength with a brick coarse aggregate replacement rate of 40% is about 1.6 MPa, and the splitting tensile strength with a replacement rate of 20% is about 2.0 MPa. This indicates that compared to the specimen with a brick coarse aggregate replacement rate of 0%, the splitting tensile strength of the specimen with added brick coarse aggregate decreases significantly. The addition of waste brick coarse aggregate in concrete has a more significant impact on the splitting tensile strength after SFT cycles than the replacement rate of brick coarse aggregate. The reason is closely related to the high water absorption rate of brick coarse aggregate.

4. Microstructure Analysis

4.1. SEM Observation Results

Figure 10 shows the microstructure of the specimens. From Figure 10a, it can be seen that when the SFT cycle number is 0, the microstructure of the specimen without the addition of brick aggregate is generally dense, mainly composed of hexagonal flaky Ca(OH)2 crystals and amorphous flocculent C-S-H gel of cement hydration products. Since there is a small amount of Cl- and SO42− ions in seawater and sea sand, a small amount of flocculent Friedel’s salt and rod-shaped ettringite crystals can be observed in the microstructure. Chlorine ions entering the interior of concrete will react chemically with Ca(OH)2, generating the soluble and non-cementitious substance CaCl2, which then reacts with C3A to form Friedel’s salt [40]. The formation of Friedel’s salt destroys the cementitious property of C-S-H, making the concrete loose. Some studies have shown that the gel properties of C-S-H come from its viscoelastic stress relaxation characteristics [41,42,43,44]. Ettringite is generated by the reaction of SO42- ions with Ca(OH)2 and sulfoaluminate. The solubility of ettringite is extremely low, and its solid volume significantly increases when generated [45]. It can cause significant expansion stress on the internal pore structure of concrete, leading to expansion cracking and a decrease in mechanical properties [46].
From Figure 10b, it can be seen that when the SFT cycle number is 75, the density of the microstructure of the specimen without the addition of brick aggregate decreases significantly, more cavities appear, C-S-H gel and Ca(OH)2 crystals decrease significantly, and Friedel’s salt and ettringite crystals are generated in large quantities [40]. It is explained that SFT cycles seriously affect the microstructure of concrete. SFT cycles cause the internal pores of concrete to connect and cracks to form, providing convenience for seawater entry. The entry of seawater also increases the number of harmful crystals generated, exacerbating the generation of cracks and damage to concrete, making it easier for seawater to enter, thereby promoting the harm of SFT cycles. This indicates that the SFT failure of SSC is the combined effect of physical SFT cycles and chemically harmful crystals. This is consistent with the research findings of Yan et al. [47] and Xin et al. [48].
From Figure 10c, it can be seen that after 75 SFT cycles, many Friedel’s salt and ettringite crystals are generated on the brick aggregate. This is because of the porosity of the brick aggregate, which allows seawater to enter these pores and react with C-S-H gel and Ca(OH)2 on the interface between the brick aggregate and the cement paste, thus damaging the bonding strength of the interface. There is a clear boundary between the brick aggregate and cement, many corrosive products, and apparent cracks on the boundary line.
Figure 10d shows that after 75 SFT cycles, the interface distinction between the stone aggregate and the cement is not as obvious. Due to the dense and smooth surface of the stone aggregate, only a small amount of seawater can come into contact with the stone, resulting in only a tiny amount of Friedel’s salt being generated on the stone without apparent cracks.
Combining Figure 10c,d, adding brick aggregates provides convenience for the entry of corrosive ions and their attachment to the surface of the aggregate due to the porosity and water absorption of brick aggregates. As a result, many of Friedel’s salts and ettringite crystals, which are harmful to the strength of concrete, are generated in the interface area between brick aggregate and cement. The increase in the replacement rate of brick aggregates also increases the content of harmful crystals. However, these harmful crystals are all reactions from the hydration products of cement. When the water–cement ratio is constant, the content of cement hydration products is fixed. Therefore, the increase in the replacement rate of brick aggregates has limited damage to the strength of concrete. This is also why, in the previous changes in compression strength and splitting tensile strength, the addition of brick aggregates had a more significant effect on reducing the strength of concrete than the replacement rate of brick aggregates.

4.2. XRD Results

Since the aggregate does not participate in the chemical reaction of seawater and sea sand, the XRD diagrams of specimens with different replacement rates are roughly the same. The XRD diagram of the G40–75 specimen in Figure 11 is taken as an example to illustrate the influence of the internal SSC and external freezing and thawing media of seawater on the internal substances of concrete. In addition to SiO2 crystals, the main components of stone and sand, there are also Ca(OH)2 crystals, C-S-H gel, and C3S, the hydration products of cement in the concrete. Due to chloride and sulfate ions in seawater and sand, the resulting products include Friedel’s salts, ettringite crystals, and gypsum crystals [49]. Gypsum crystals also have a high volume expansion rate, which can easily cause the formation of internal pores and cracks in concrete. This is consistent with the analysis results of SEM results earlier.

5. Mechanical Model of Compression Strength and Splitting Tensile Strength

5.1. Compression Strength Model

The compression strength of brick coarse aggregate SSC specimens gradually decreases with the increase in brick coarse aggregate replacement rate. It is lower than the strength of natural stone SSC. Therefore, brick coarse aggregate SSC can be regarded as a composite material, with natural stone SSC as the base phase and brick coarse aggregate as the negative reinforcement phase. The strength influence factor α g of brick coarse aggregate can be introduced to reflect the influence of brick coarse aggregate on SSC. The formula for the compression strength of recycled concrete is as follows [50]:
f r g = f 0 1 α g λ g
where f 0 is the compression strength of SSC, MPa; α g is the influencing factor of brick coarse aggregate; λ g is the replacement rate of brick coarse aggregates.
When λ g = 20 % and λ g = 40 % , for brick coarse aggregate SSC under 0 SFT cycles, the values obtained are 0.746 and 0.529, respectively. The average value α g = 0.638 can be obtained.
The formula for SFT damage of ordinary concrete is as follows [51]:
D = 1 E n E 0
where D represents SFT damage; En is the relative dynamic elastic modulus after n SFT cycles; E0 is the relative dynamic modulus of elasticity subjected to 0 SFT cycles.
Therefore, the compression strength model of brick coarse aggregates SSC after SFT cycles considering the replacement rate of brick coarse aggregates is as follows:
f n c = f r g 1 D = f 0 1 α g λ g E n E 0
where fnc is the compression strength of brick coarse aggregate SSC with n SFT cycles
Figure 6 shows the calculation results of the compressive strength model. The compression strength model proposed in this paper agrees well with the test values.

5.2. Splitting Tensile Strength Model

The American Code (ACI 318-11) [52] provides the following relationship between concrete’s tensile strength and compression strength:
f t = 0.53 f c 0.5
where ft is the splitting tensile strength of concrete; fc is the compression strength of concrete.
When Equations (3) and (4) are combined, the splitting tensile strength model of brick coarse aggregates SSC after SFT cycles considering the replacement rate of brick coarse aggregates is as follows:
f n t = 0.53 f 0 1 α g λ g E n E 0
where fnt is the splitting tensile strength of seawater and sand concrete with brick coarse aggregate with n SFT cycles.
Figure 9 shows the calculation results of the splitting tensile strength model. The splitting tensile strength model proposed in this paper agrees well with the test values. The addition of brick aggregates weakens the compressive strength of ordinary concrete. This model takes into account the influence of brick aggregate substitution rate and superimposed SFT cycles, under the premise of clear physical significance. It provides a theoretical reference for estimating the compressive strength and splitting tensile strength of seawater and sand concrete with recycled brick aggregate in coastal and coastal engineering in cold regions. The influencing factors of brick aggregates in the model are obtained through fitting. According to previous research, the influencing factors of brick aggregates are closely related to the crushing index, water absorption rate, and mud content of brick aggregates. However, this model does not further clarify the impact of these indicators on the influencing factors of brick aggregates.

6. Conclusions

This article investigates the performance of SSC with different replacement rates of discarded bricks and coarse aggregates after SFT cycles. The influence of SFT cycles and brick aggregate substitution rate on the performance of recycled concrete was analyzed from the aspects of apparent morphology, mass loss rate, relative dynamic modulus of elasticity, compressive and splitting tensile failure modes, and compressive and splitting tensile strength. The influence mechanism of SFT cycles and brick aggregate was analyzed by combining SEM and XRD. Finally, a compressive and splitting tensile strength model was established based on the influence coefficient of the waste brick coarse aggregate substitution rate and SFT damage. The main conclusions are as follows:
(1)
As the SFT cycles increase, the surface, compression destructive state, and splitting tensile destructive state of SSC specimens with varying brick coarse aggregate replacement rates show an increasingly brittle trend, which is related to the high water absorption rate of brick coarse aggregates and insufficient bonding force in the interface transition zone between old and new mortar.
(2)
As the SFT cycles increase, the relative dynamic modulus of elasticity, compression strength, and splitting tensile strength of SSC specimens with varying brick coarse aggregate replacement rates show a linear decrease trend. In contrast, the mass loss rate shows a linear increase trend. Moreover, the changing pattern of specimens with added brick coarse aggregates is more evident than that of specimens with natural aggregates. Adding brick coarse aggregates to concrete significantly impacts mechanical performance after SFT cycles compared to the replacement rate of brick coarse aggregates.
(3)
The chloride and sulfate ions in the internal SSC and external FT media of seawater react with cement to form Friedel’s salts without cementitious properties, as well as expansive ettringite and gypsum crystals. The formation of these harmful crystals causes the microstructure to loosen, especially in the interface area between brick aggregate and cement. FT also connects the internal pores of concrete, generating cracks, which provides convenience for the entry of seawater. The entry of seawater also increases the amount of harmful crystals generated, exacerbating the cracks and damage to concrete, making it easier for seawater to enter, thereby promoting the harm of FT. The SFT failure of SSC is the combined effect of physical FT and harmful chemical crystals.
(4)
The calculation results of the compression strength and splitting tensile strength models of SSC with different brick replacement rates established in this article are in good agreement with the test results, which can provide a theoretical reference for the performance of SSC with brick coarse aggregates in cold areas.

Author Contributions

Writing—original draft preparation, Z.T. Writing—review and editing, D.Y. All authors have read and agreed to the published version of the manuscript.

Funding

This research was funded by the Doctoral Initiation Fund of Shandong University of Technology, grant number 4041/421041.

Institutional Review Board Statement

Not applicable.

Informed Consent Statement

Not applicable.

Data Availability Statement

All data generated or analyzed during this study are included in this published article.

Acknowledgments

This study was performed at the International College in Krirk University, at the School of Civil Engineering and Geomatics in Shandong University of Technology.

Conflicts of Interest

The authors declare no conflicts of interest.

References

  1. Colangelo, F.; Petrillo, A.; Cioffi, R.; Borrelli, C.; Forcina, A. Life cycle assessment of recycled concretes: A case study in southern Italy. Sci. Total Environ. 2018, 615, 1506–1517. [Google Scholar] [CrossRef]
  2. Engelsen, C.J.; Van der Sloot, H.A.; Petkovic, G. Long-term leaching from recycled concrete aggregates applied as sub-base material in road construction. Sci. Total Environ. 2017, 587, 94–101. [Google Scholar] [CrossRef]
  3. Wijayasundara, M.; Mendis, P.; Crawford, R.H. Integrated assessment of the use of recycled concrete aggregate replacing natural aggregate in structural concrete. J. Clean. Prod. 2018, 174, 591–604. [Google Scholar] [CrossRef]
  4. Priyadharshini, P.; Ramamurthy, K.; Robinson, R.G. Sustainable reuse of excavation soil in cementitious composites. J. Clean. Prod. 2018, 176, 999–1011. [Google Scholar] [CrossRef]
  5. Jonny, N. Smart materials and technologies for sustainable concrete construction. Dev. Build. Environ. 2023, 15, 100177. [Google Scholar]
  6. Liu, J.; Fan, X.; Liu, J.; Jin, H.; Zhu, J.; Liu, W. Investigation on mechanical and micro properties of concrete incorporating seawater and sea sand in a carbonized environment. Constr. Build. Mater. 2021, 307, 124986. [Google Scholar] [CrossRef]
  7. Dong, Z.; Wu, G.; Zhao, X.-L.; Zhu, H.; Lian, J.-L. Durability test on the flexural performance of seawater sea-sand concrete beams completely reinforced with FRP bars. Constr. Build. Mater. 2018, 192, 671–682. [Google Scholar] [CrossRef]
  8. Hasdemir, S.; Tuğrul, A.; Yılmaz, M. The effect of natural sand composition on concrete strength. Constr. Build. Mater. 2016, 112, 940–948. [Google Scholar] [CrossRef]
  9. ACI Committee 222. ACI 222R-01. In Protection of Metals in Concrete against Corrosion; ACI: Farmington Hills, MI, USA, 2001; 11p.
  10. JGJ 52-2006; Standard for Technical Requirements and Test Method of Sand and Crushed Stone (or Gravel) for Ordinary Concrete. Ministry of Housing and Urban-Rural Construction of the People’s Republic of China: Beijing, China, 2007; p. 7.
  11. Liu, W.; Cui, H.; Dong, Z.; Xing, F.; Zhang, H.; Tommy, Y.L. Carbonation of concrete made with dredged marine sand and its effect on chloride binding. Constr. Build. Mater. 2016, 120, 1–9. [Google Scholar] [CrossRef]
  12. Xiao, J.; Qiang, C.; Antonio, N.; Zhang, K. Use of sea sand seawater in concrete construction: Current status and future opportunities. Constr. Build. Mater. 2017, 155, 1101–1111. [Google Scholar] [CrossRef]
  13. Lv, D.; Liu, H.; He, F.; Wang, W.; Miao, Q.; Li, H.; Wang, F.; Zhao, J.; Shi, C. Freeze-Thaw Damage Characteristics of Concrete Based on Compression Mechanical Properties and Acoustic Parameters. Materials 2024, 17, 1010. [Google Scholar] [CrossRef]
  14. Zhou, J.; Wang, G.; Liu, P.; Guo, X.; Xu, J. Concrete Durability after Load Damage and Salt Freeze-Thaw Cycles. Materials 2022, 15, 4380. [Google Scholar] [CrossRef]
  15. Chen, S.; Ren, J.; Li, Y.; Ren, X.; Song, Y.; Sun, J. Macroscopic and Mesoscopic Deterioration Behaviors of Concrete under the Coupling Effect of Chlorine Salt Erosion and Freezing-Thawing Cycle. Materials 2021, 14, 6471. [Google Scholar] [CrossRef]
  16. Cui, S.; Wang, T.; Zhang, Z.; Sun, X.; Li, J.; Li, B.; Zhang, W.; Su, T.; Cao, F. Frost resistance and life prediction of recycled brick aggregate concrete with waste polypropylene fiber. Rev. Adv. Mater. Sci. 2023, 62, 20230154. [Google Scholar] [CrossRef]
  17. Ji, Y.; Wang, D. Durability of recycled aggregate concrete in cold regions. Case Stud. Constr. Mater. 2022, 17, e01475. [Google Scholar] [CrossRef]
  18. Ji, Y.; Pei, Z.; Xu, W.; Li, Z.; Li, Y.; Jia, Y. Deterioration performance analysis of recycled brick concrete subjected to freezing and thawing effect. Case Stud. Constr. Mater. 2024, 20, e02722. [Google Scholar] [CrossRef]
  19. Qi, L.; Yu, B.; Yu, M.; Zhang, M. Simulation-Based Analysis of Micro-Damage to Recycled Concrete-Containing Brick Coarse Aggregates. Buildings 2023, 13, 2297. [Google Scholar] [CrossRef]
  20. Denisiewicz, A.; Sliwa, M.; Kula, K.; Socha, T. Experimental Investigation of Concrete with Recycled Aggregates for Suitability in Concrete Structures. Appl. Sci. 2019, 9, 5010. [Google Scholar] [CrossRef]
  21. Ji, Y.; Wang, D.; Wang, L. Numerical and Experimental Investigation of Recycled Brick Coarse Aggregate Concrete. Appl. Sci. 2022, 12, 9035. [Google Scholar] [CrossRef]
  22. Cantero, B.; Bravo, M.; de Brito, J.; del Bosque, I.F.S.; Medina, C. Thermal Performance of Concrete with Recycled Concrete Powder as Partial Cement Replacement and Recycled CDW Aggregate. Appl. Sci. 2020, 10, 4540. [Google Scholar] [CrossRef]
  23. Bektas, F.; Wang, K.; Ceylan, H. Effects of crushed clay brick aggregate on mortar durability. Constr. Build. Mater. 2009, 23, 1909–1914. [Google Scholar] [CrossRef]
  24. Vieira, T.; Alves, A.; de Brito, J.; Correia, J.R.; Silva, R.V. Durability-related performance of concrete containing fine recycled aggregates from crushed bricks and sanitary ware. Mater. Des. 2015, 90, 767–776. [Google Scholar] [CrossRef]
  25. Boukour, S.; Benmalek, M.L. Performance evaluation of a resinous cement mortar modified with crushed clay brick and tire rubber aggregate. Constr. Build. Mater. 2016, 120, 473–481. [Google Scholar] [CrossRef]
  26. Uddin, M.T.; Hasnat, A.; Awal, M.A.; Bosunia, S.Z. Recycling of Brick Aggregate Concrete as Coarse Aggregate. J. Mater. Civil. Eng. 2015, 27, B4014005. [Google Scholar]
  27. Manzur, T.; Baten, B.; Hasan, M.J.; Akter, H.; Tahsin, A.; Hossain, K.M.A. Corrosion behavior of concrete mixes with masonry chips as coarse aggregate. Constr. Build. Mater. 2018, 185, 20–29. [Google Scholar] [CrossRef]
  28. Bhasya, V.; Bharatkumar, B.H. Mechanical and durability properties of concrete produced with treated recycled concrete aggregate. ACI Mater. J. 2018, 115, 209–217. [Google Scholar] [CrossRef]
  29. Kou, S.C.; Poon, C.S.; Etxeberria, M. Influence of recycled aggregates on long-term mechanical properties and pore size distribution of concrete. Cem. Concr. Compos. 2011, 33, 286–291. [Google Scholar] [CrossRef]
  30. Bravo, M.J.; de Brito, J.; Pontes, L.E. Mechanical performance of concrete made with aggregates from construction and demolition waste recycling plants. J. Cleaner Prod. 2015, 99, 59–74. [Google Scholar] [CrossRef]
  31. Bui, N.K.; Satomi, T.; Takahashi, H. Improvement of mechanical properties of recycled aggregate concrete basing on a new combination method between recycled aggregate and natural aggregate. Constr. Build. Mater. 2017, 148, 376–385. [Google Scholar] [CrossRef]
  32. Dimitriou, G.; Savva, P.; Petrou, M.F. Enhancing mechanical and durability properties of recycled aggregate concrete. Constr. Build. Mater. 2018, 158, 228–235. [Google Scholar] [CrossRef]
  33. Majhi, R.K.; Nayak, A.N.; Mukharjee, B.B. Development of sustainable concrete using recycled coarse aggregate and ground granulated blast furnace slag. Constr. Build. Mater. 2018, 159, 417–430. [Google Scholar] [CrossRef]
  34. Deng, F.; He, Y.; Zhou, S.; Yu, Y.; Cheng, H.; Wu, X. Compressive strength prediction of recycled concrete based on deep learning. Constr. Build. Mater. 2018, 175, 562–569. [Google Scholar] [CrossRef]
  35. Duan, Z.H.; Kou, S.C.; Poon, C.S. Prediction of compressive strength of recycled aggregate concrete using artificial neural network and cuckoo search method. Mater. Today Proc. 2021, 46, 8480–8488. [Google Scholar]
  36. Nilimaa, J.; Zhaka, V. An Overview of Smart Materials and Technologies for Concrete Construction in Cold Weather. Eng 2023, 4, 1550–1580. [Google Scholar] [CrossRef]
  37. SL352-2006; Test Code for Hydraulic Concrete. Ministry of Water Resources of the People’s Republic of China: Beijing, China, 2006; pp. 22–23, 182–184.
  38. GB/T 50081-2016; Standard for Test Method of Mechanical Properties on Ordinary Concrete. Ministry of Housing and Urban-Rural Construction of the People’s Republic of China: Beijing, China, 2016.
  39. Zhang, H.; Zhao, Y. Integrated interface parameters of recycled aggregate concrete. Constr. Build. Mater. 2015, 101, 861–877. [Google Scholar] [CrossRef]
  40. Yang, D.; Yan, C.; Liu, S.; Jia, Z.; Wang, C. Prediction of Concrete Compressive Strength in Saline Soil Environments. Materials 2022, 15, 4663. [Google Scholar] [CrossRef]
  41. Geng, Z.; Tang, S.; Wang, Y.; A, H.; He, Z.; Wu, K.; Wang, L. Stress relaxation properties of calcium silicate hydrate: A molecular dynamics study. J. Zhejiang Univ.-Sci. A 2024, 25, 97–115. [Google Scholar] [CrossRef]
  42. Tang, S.; Wang, Y.; Geng, Z.; Xu, X.; Yu, W.; A, H.; Chen, J. Structure, Fractality, Mechanics and Durability of Calcium Silicate Hydrates. Fractal Fract. 2021, 5, 47. [Google Scholar] [CrossRef]
  43. Wang, L.; Guo, F.; Lin, Y.; Yang, H.; Tang, S.W. Comparison between the effects of phosphorous slag and fly ash on the C-S-H structure, long-term hydration heat and volume deformation of cement-based materials. Constr. Build. Mater. 2020, 250, 118807. [Google Scholar] [CrossRef]
  44. Wang, L.; Jin, M.; Zhou, S.; Tang, S.; Lu, X. Investigation of microstructure of C-S-H and micro-mechanics of cement pastes under NH4NO3 dissolution by 29Si MAS NMR and microhardness. Measurement 2021, 185, 110019. [Google Scholar] [CrossRef]
  45. Mathias, M.; Nele, D.B. Influence of chlorides on magnesium sulfate attack for mortars with Portland cement and slag based binders. Constr. Build. Mater. 2017, 155, 630–642. [Google Scholar]
  46. Liao, Y.; Yao, J.; Deng, F.; Li, H.; Wang, K.; Tang, S. Hydration behavior and strength development of supersulfated cement prepared by calcined phosphogypsum and slaked lime. J. Build. Eng. 2023, 80, 108075. [Google Scholar] [CrossRef]
  47. Li, Y.; Zhang, L.; Ma, C.; Li, B.; Zhu, J. Damage Mechanism of Mineral Admixture Concrete under Marine Corrosion and Freezing-Thawing Environment. Adv. Civ. Eng. 2020, 2020, 8817113. [Google Scholar] [CrossRef]
  48. Huang, X.; Wang, T.; Pang, J.; Song, F. Experimental Study on the Effect of Freeze–Thaw Cycles on the Apparent and Mechanical Properties of Rubber Concrete Under Chloride Environment. Arab. J. Sci. Eng. 2021, 47, 4133–4153. [Google Scholar] [CrossRef]
  49. Liao, Y.; Wang, S.; Wang, K.; Al Qunaynah, S.; Wan, S.; Yuan, Z.; Xu, P.; Tang, S. A study on the hydration of calcium aluminate cement pastes containing silica fume using non-contact electrical resistivity measurement. J. Mater. Res. Technol. 2023, 24, 8135–8149. [Google Scholar] [CrossRef]
  50. Guo, Y. Research on Mix Proportion Design Method of Recycled Concrete Based on Recycled Aggregate Quality and Replacement Rate. Ph.D. Thesis, Qingdao University of Technology, Qingdao, China, 2018; p. 116. [Google Scholar]
  51. Lemaitre, J. How to use damage mechanics. Nucl. Eng. Des. 1984, 80, 233–245. [Google Scholar] [CrossRef]
  52. ACI Committee 318. ACI 318-11. In Building Code Requirements for Structural Concrete; ACI: Farmington Hills, MI, USA, 2011; 111p.
Figure 1. The surface of specimens with a brick coarse aggregate replacement rate of 20%: (a) 0 cycles; (b) 25 cycles; (c) 50 cycles; (d) 75 cycles.
Buildings 14 01671 g001
Figure 2. The surface of specimens under 75 cycles: (a) 0% substitution rate; (b) 20% substitution rate; (c) 40% substitution rate.
Buildings 14 01671 g002
Figure 3. The relative dynamic modulus of elasticity and mass loss rate: (a) the relative dynamic modulus of elasticity; (b) the mass loss rate.
Buildings 14 01671 g003
Figure 4. The compression destructive state of specimens with a 20% replacement rate of brick coarse aggregate: (a) 0 cycles; (b) 25 cycles; (c) 50 cycles; (d) 75 cycles.
Buildings 14 01671 g004
Figure 5. The compression destructive state of specimens under 75 SFT cycles: (a) 0% substitution rate; (b) 20% substitution rate; (c) 40% substitution rate.
Buildings 14 01671 g005
Figure 6. Calculation results of compressive strength model.
Buildings 14 01671 g006
Figure 7. The splitting tensile destructive state with a 20% replacement rate of brick coarse aggregate: (a) 0 cycles; (b) 25 cycles; (c) 50 cycles; (d) 75 cycles.
Buildings 14 01671 g007
Figure 8. The splitting tensile destructive state under 75 SFT cycles: (a) 0% substitution rate; (b) 20% substitution rate; (c) 40% substitution rate.
Buildings 14 01671 g008
Figure 9. Calculation results of splitting tensile strength model.
Buildings 14 01671 g009
Figure 10. The microstructure of the specimens: (a) G0–0; (b) G0–75; (c) interface area between brick aggregate and cement; (d) interface area between stone aggregate and cement.
Buildings 14 01671 g010
Figure 11. XRD diagram of the G40–75 specimen.
Buildings 14 01671 g011
Table 1. Properties of cement.
Apparent Density (kg/m3)Setting Time (min)Soundness28d-Compression Strength (MPa)Bending Strength (MPa)
InitialFinal
3184195320fine52.410.3
Table 2. Properties of fine aggregates.
Apparent Density (g/cm3)Bulk Density (g/cm3)Fineness ModulusClay (%)Chloride (%)Shell
(%)
2.681.632.60.640.2271.95
Table 3. Properties of coarse aggregates.
Coarse AggregatesParticle Size Range (mm)Apparent Density (g/cm3)Bulk Density (g/cm3)Water Absorption Rate (%)Clay (%)Crushing
Stones5~252.871.750.810.534.2
Brick5~252.341.1414.321.4423.6
Table 4. Composition content of artificial seawater (g/L).
CompositionNaClMgCl2Na2SO4CaCl2
Concrete (g)24.535.204.091.16
Table 5. Concrete mix proportion (kg/m3).
W/CBrick Coarse Aggregate Substitution Rate (%)SeawaterCementSea SandNatural StonesBrick Coarse AggregateSuperplasticizer Content (%)
0.560210375762105300.5%
0.5620210375762842.4210.60.5%
0.5640210375762631.8421.20.5%
Disclaimer/Publisher’s Note: The statements, opinions and data contained in all publications are solely those of the individual author(s) and contributor(s) and not of MDPI and/or the editor(s). MDPI and/or the editor(s) disclaim responsibility for any injury to people or property resulting from any ideas, methods, instructions or products referred to in the content.

