Article

Seismic Performance of Steel-Reinforced High Strength Concrete Joints Considering Bond Slip Effect

1
College of Ocean and Civil Engineering, Dalian Ocean University, Dalian 116086, China
2
School of Water Conservancy and Transportation, Zhengzhou University, Zhengzhou 450001, China
*
Author to whom correspondence should be addressed.
Buildings 2024, 14(6), 1747; https://doi.org/10.3390/buildings14061747
Submission received: 7 May 2024 / Revised: 31 May 2024 / Accepted: 6 June 2024 / Published: 10 June 2024
(This article belongs to the Section Building Structures)

Abstract

:
This study presents a solution for push-out failure for the staged bond-slip constitutive relationship between the structural steel and high strength concrete, taking into account the concrete strength grade, anchoring length, and stirrup ratio. The critical point coordinates for different stages are determined by the tests of 14 steel-reinforced high strength concrete (SRHSC) specimens. It is observed that with the increase in the concrete strength grade and anchorage length, the ultimate load of the specimens increased significantly, but the influence on the residual bond strength was not significant. The effect of the stirring ratio was mainly manifested in a slight increase in the initial bond strength. The formula for calculating SRHSC characteristic bond strength and characteristic slip value is established, and the bond-slip constitutive relation of SRHSC is proposed based on the tests. The material constitutive model considering the effect of bond-slip is implanted into the software in the case of the ABAQUS finite element platform. The material is applied to the numerical simulation analysis of the SRHSC exterior joints. The rationality and accuracy of the new material are verified by comparing the simulation results with the test results.

1. Introduction

Steel-Reinforced High Strength Concrete structure (SRHSC) refers to a combination structure in which the structural steel is built into the high strength concrete [1]. The longitudinal reinforcement and stirrup are configured to restrain the structural steel. The structure makes the steel and high strength concrete become the whole of the common force and makes full use of the respective performance advantages of steel and high strength concrete. The excellent properties of SRHSC enhance the stiffness, lightweight design, convenient construction process, excellent mechanical performance, and superior crack resistance. It has been found abroad application to major ocean projects such as cross-sea bridges and offshore platforms.
Unlike deformed steel bars, structural steel lacks ribs to generate mechanical interlocking after initial bond failure, resulting in a smaller bond effect between the structural steel and the concrete [2,3,4,5]. Consequently, adhesive slip directly impacts the mechanical performance, failure mode, load-bearing capacity, deformation calculation, and crack analysis of steel-reinforced concrete components. Based on extensive testing of bonding and sliding characteristics of specimens, Zheng et al. [6] established a constitutive relationship for bonding and sliding in steel-reinforced concrete structures. They also proposed a rational element representing the bond behavior between steel-reinforced concrete and regular concrete as a foundation for finite element analysis. Jing [7] proposed a novel steel-bearing square RC column connection joint with adhesive bonding and self-locking and investigated seven half-scale connection joints with variable joint configurations under vertical loads. The results demonstrated that the presence of adhesive bonding substantially improved the slip stiffness of the connection joint specimen relative to specimens with only self-locking. Zhang [8] investigated the distribution of bond stress along the anchorage length of steel bars by embedding strain gauges inside the bars. An improved bond-slip constitutive model was proposed to reflect the influence of the position function of bond stress distribution. Zhang [9] studied the bond-slip with the steel tubes and coal gangue concrete. The effects of the coal gangue coarse aggregate replacement rate, the strength grade of coal gangue concrete, and the bond length were investigated. A bond-slip constitutive model for steel tube-coal gangue concrete was established. Sun et al. [10] studied the bond performance between FRP bars and sea sand coral concrete (SSCC). The results show that the bond strength between carbon fiber-reinforced polymer (CFRP) bars and SSCC was higher than that of basalt fiber-reinforced polymer (BFRP) bars and glass fiber-reinforced polymer (GFRP) bars. The splitting damage pattern occurred in most of the specimens; the bond strength between FRP bars and SSCC decreased with increasing diameter and bond length of FRP bars but increased with increasing SSCC strength grade. In addition, hybrid joints are generally believed to be critical regions in the whole hybrid system for structures under severe seismic effects [11]. The regions of composite sections at which the forces and moments should be transferred adequately represent D-regions where the contour lines of stresses are highly disturbed and concentrated [11,12]. Yu F. et al. [13] proposed a method of strengthening polyvinyl chloride (PVC)-carbon fiber reinforced polymer (CFRP) confined concrete (PCCC) column-reinforced concrete (RC) beam exterior joint with core steel tube (CST). Yang et al. [14] propose a displacement-amplified mild steel bar joint damper, which can amplify the small displacement of beam-column nodes through the lever principle. Nicoletti V. et al. [15] provided a simple and fast-to-use graphical tool to support the design of beam-column joints satisfying Eurocode 8 verification expressions.
Numerous studies [3,6,7,8,9,10,11,12,13,14,15,16,17,18,19,20,21,22,23,24,25,26,27,28,29,30,31,32,33,34,35,36,37] have explored the bond performance between steel and concrete, yet a solution to the bond-slip relationship of the SRHSC component level remains elusive. In this paper, 14 sets of SRHSC push-out specimens were designed according to an orthogonal test method (a mathematical statistical method for arranging and analyzing multi-factor experiments using orthogonal tables) under normal temperature conditions while considering mechanical factors such as concrete strength grade, steel anchorage length, and volume stirrups ratio. Furthermore, a theoretical formula for the bond strength was proposed based on the failure modes of the specimens, and its accuracy was validated by experimental results. An improved bond-slip constitutive model was proposed to reflect the influence of the position function of bond stress distribution and was applied to the SRHSC exterior joints. The bond-slip constitutive model serves as the basis for validating the results of finite element analysis. The bond-slip model accurately characterizes the interaction between structural steels and concrete, providing a basis for the numerical analysis of the SRHSC exterior. Its accuracy was validated by the experimental results.

2. Experimental Overview

2.1. Specimen Design

In order to investigate the bond performance between structural steels and concrete, the push-out tests were conducted on 14 specimens. This study investigated the distribution of bond stress along the anchorage length of structural steels by embedding strain gauges inside the steels. The effects of four types of anchorage length (200, 300, 400), three types of concrete strength (C30, C60, C80), and two types of stirrup space (6@120, 6@80) on the bond-slip behavior were investigated.
The design of all specimens is based on the current standard of concrete structure design in our country. (GB50010-2010) [38] (as shown in Table 1).

2.2. Material Properties

The concrete strength utilized in this paper encompasses grades C30, C60, and C80. The primary constituents comprise Onoda 52.5 R cement, silica sand, silica powder, premium-grade fly ash, stone, water, and admixture. Silica sand and silica powder are included as well. Among them, premium-grade fly ash is chosen with a screening margin of no more than 12% on a 45 μm square hole screen. The mesh number of the silica sand ranges from 50 to 80 as indicated in Table 2 and Table 3.
The structural steel is constructed using I10 I-beams, with dimensions of 100 mm × 68 mm × 4.5 mm (height × width × thickness). The longitudinal bars consist of HRB400 steel bars with a diameter of 12 mm, while the stirrups are made from HPB300 steel bars with a diameter of 6 mm (Dalian Hefeng Zhongcheng Trading Co., Ltd., Dalian, China).

2.3. Loading Scheme

The experimental specimens were conducted on a 2000 kN electro-hydraulic servo universal testing machine at the key laboratory of coastal engineering in Liaoning Province, Dalian Ocean University. The specimen was positioned on the mechanical testing machine and secured to a special hollow “work”-shaped steel plate auxiliary that served as the base for the displacement meter. Under pressure, relative displacement occurred between the specimen and the steel plate, causing the structural steel to be pushed out from within the “work”-shaped hollow gap in the middle of this special plate. Embedded steel-concrete electronic slip sensors were placed on both the outer and inner edges of both flanges and web sections of each structural steel to directly measure the relative slip between them and ultra-high-strength concrete. Dial gauges were installed at both ends of each specimen to measure slip amounts at loading and free ends, respectively, for ultra-high-strength concrete sections connected to these bones. Additionally, resistance strain gauges were affixed onto grooved areas on both sides of each web section as well as upper and lower flange plates (as depicted in Figure 1). During the loading process, downward force was applied by means of a loading instrument which caused load-bearing action primarily by the structural steel of the upper end in contact with the concrete surface below it; subsequently transferring load downwards through bonding between said bone and surrounding concrete material (as depicted in Figure 2). Structural steel within the concrete test block initially experienced slippage starting from the loading section before gradually spreading towards the free end until eventually being fully pushed out—indicating completion/end point for this test. The load was controlled by displacement, the loading speed was 0.3 mm/min. The loading device is shown in Figure 3. The test specimen was damaged until the displacement of the free end reached a maximum slip value of 10 mm.

3. Test Results and Discussion

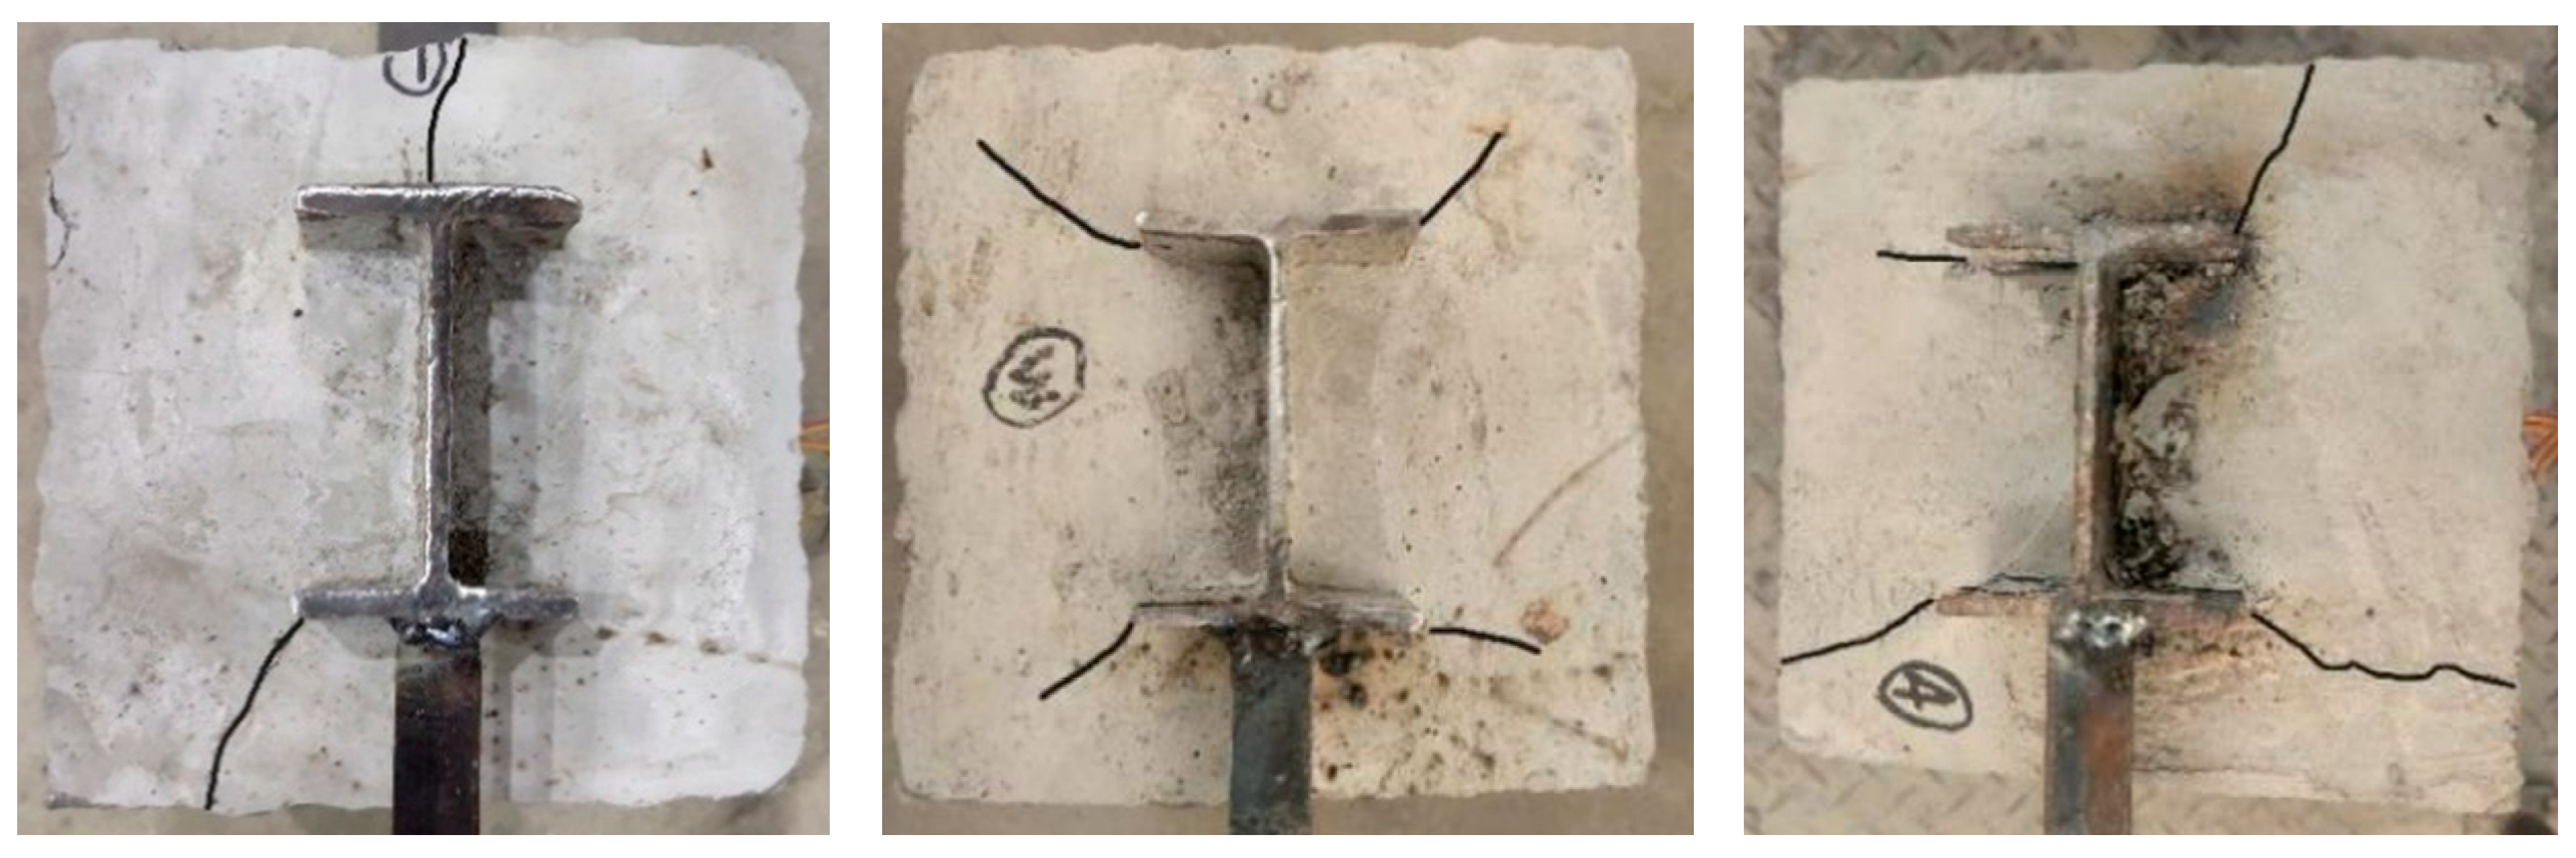
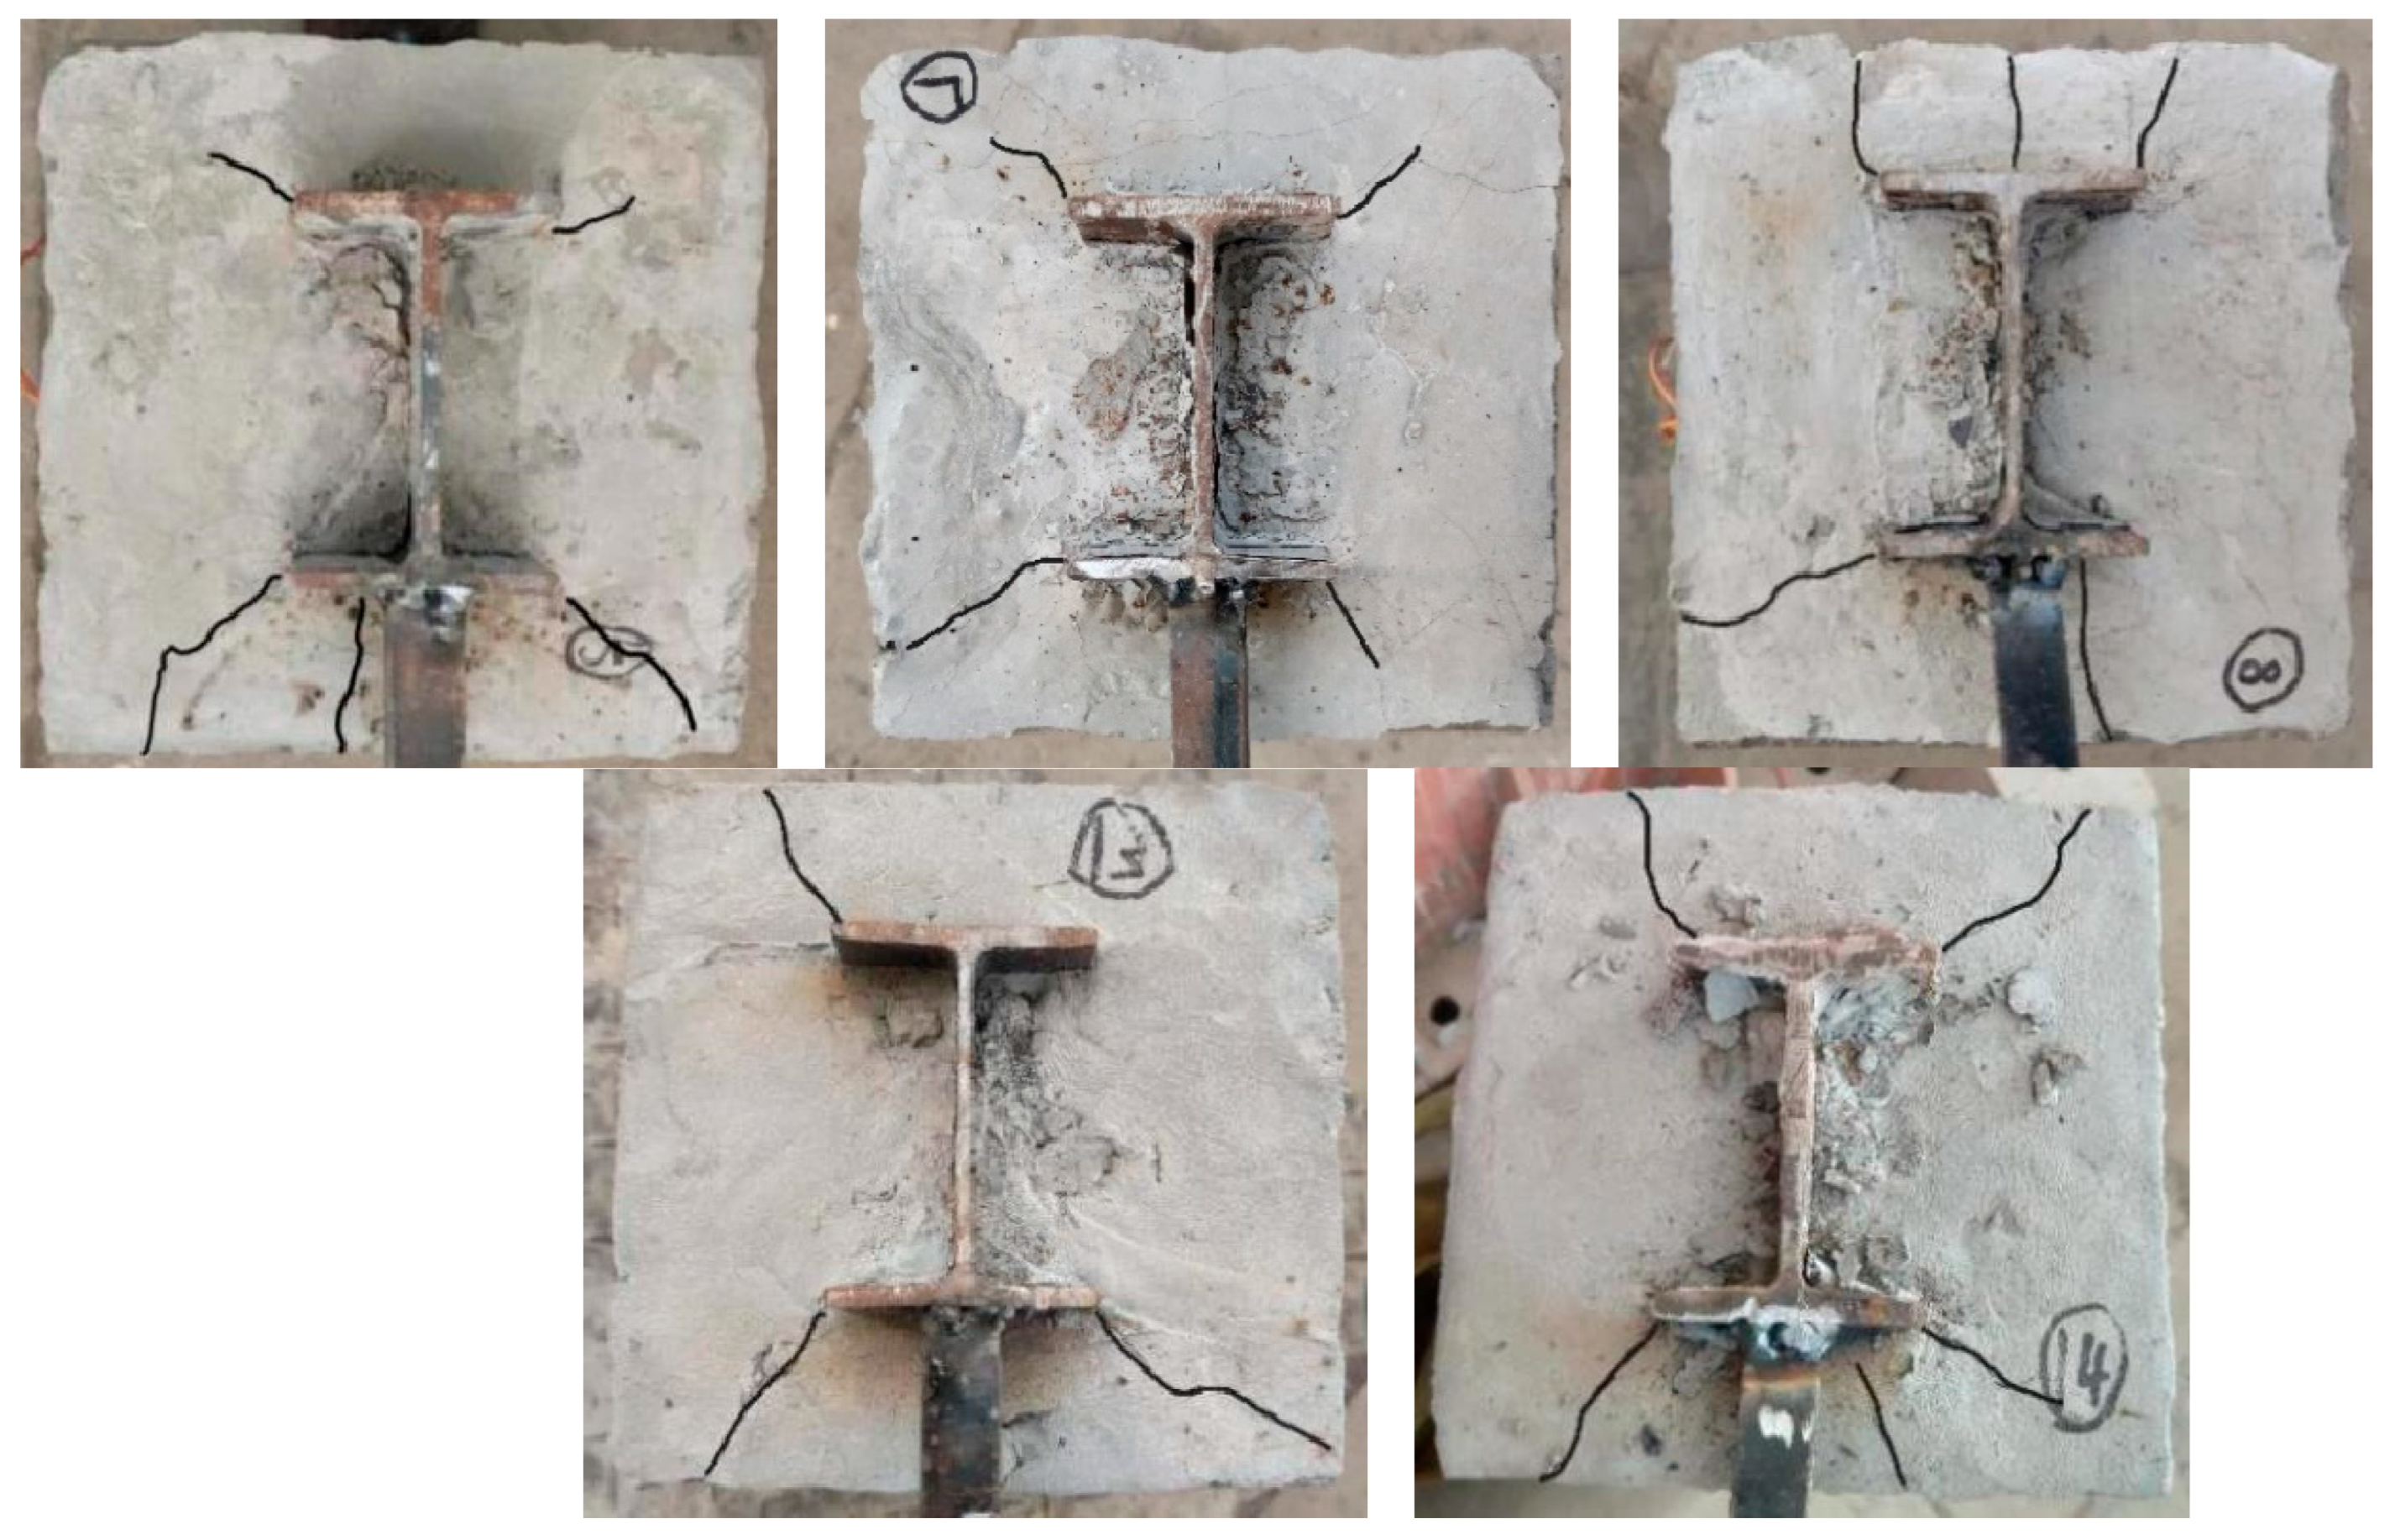
3.1. Test Behavior and Failure Modes

In the initial phase of loading, no slip was observed at the end of the SRUSC specimens. Minor displacement began to appear at the force-bearing end of the specimens when the load increased to 40~60% of the ultimate capacity. As loading continued, the specimens occasionally made a “click” sound and began to slip at the free end. As the load continued to increase, the displacements at both the loading end and the free end grew. When the load was close to the ultimate load, accompanied by a loud noise, both ends of the rapid slip occurred at the same time, reaching the peak load. The displacement of the loading end and the free end of the specimens continued to increase, and a rhythmic “thumping” sound was emitted until the end of the experiment. During the unloading stage, when the load reached 40~50% of ultimate capacity, it stabilized with constant speed change in displacement. When structural steel protruded up to 10 mm from the concrete surface crack width remained stable with maximum width reaching about 2 mm~3 mm. Upon removal from the test machine visible extension along the 45° direction can be seen for cracks originating from free-end towards the sides of the specimen as shown in Figure 4; however, not only do they extend along four corners but they also occur across web/flange directions with similar widths observed for both ends.

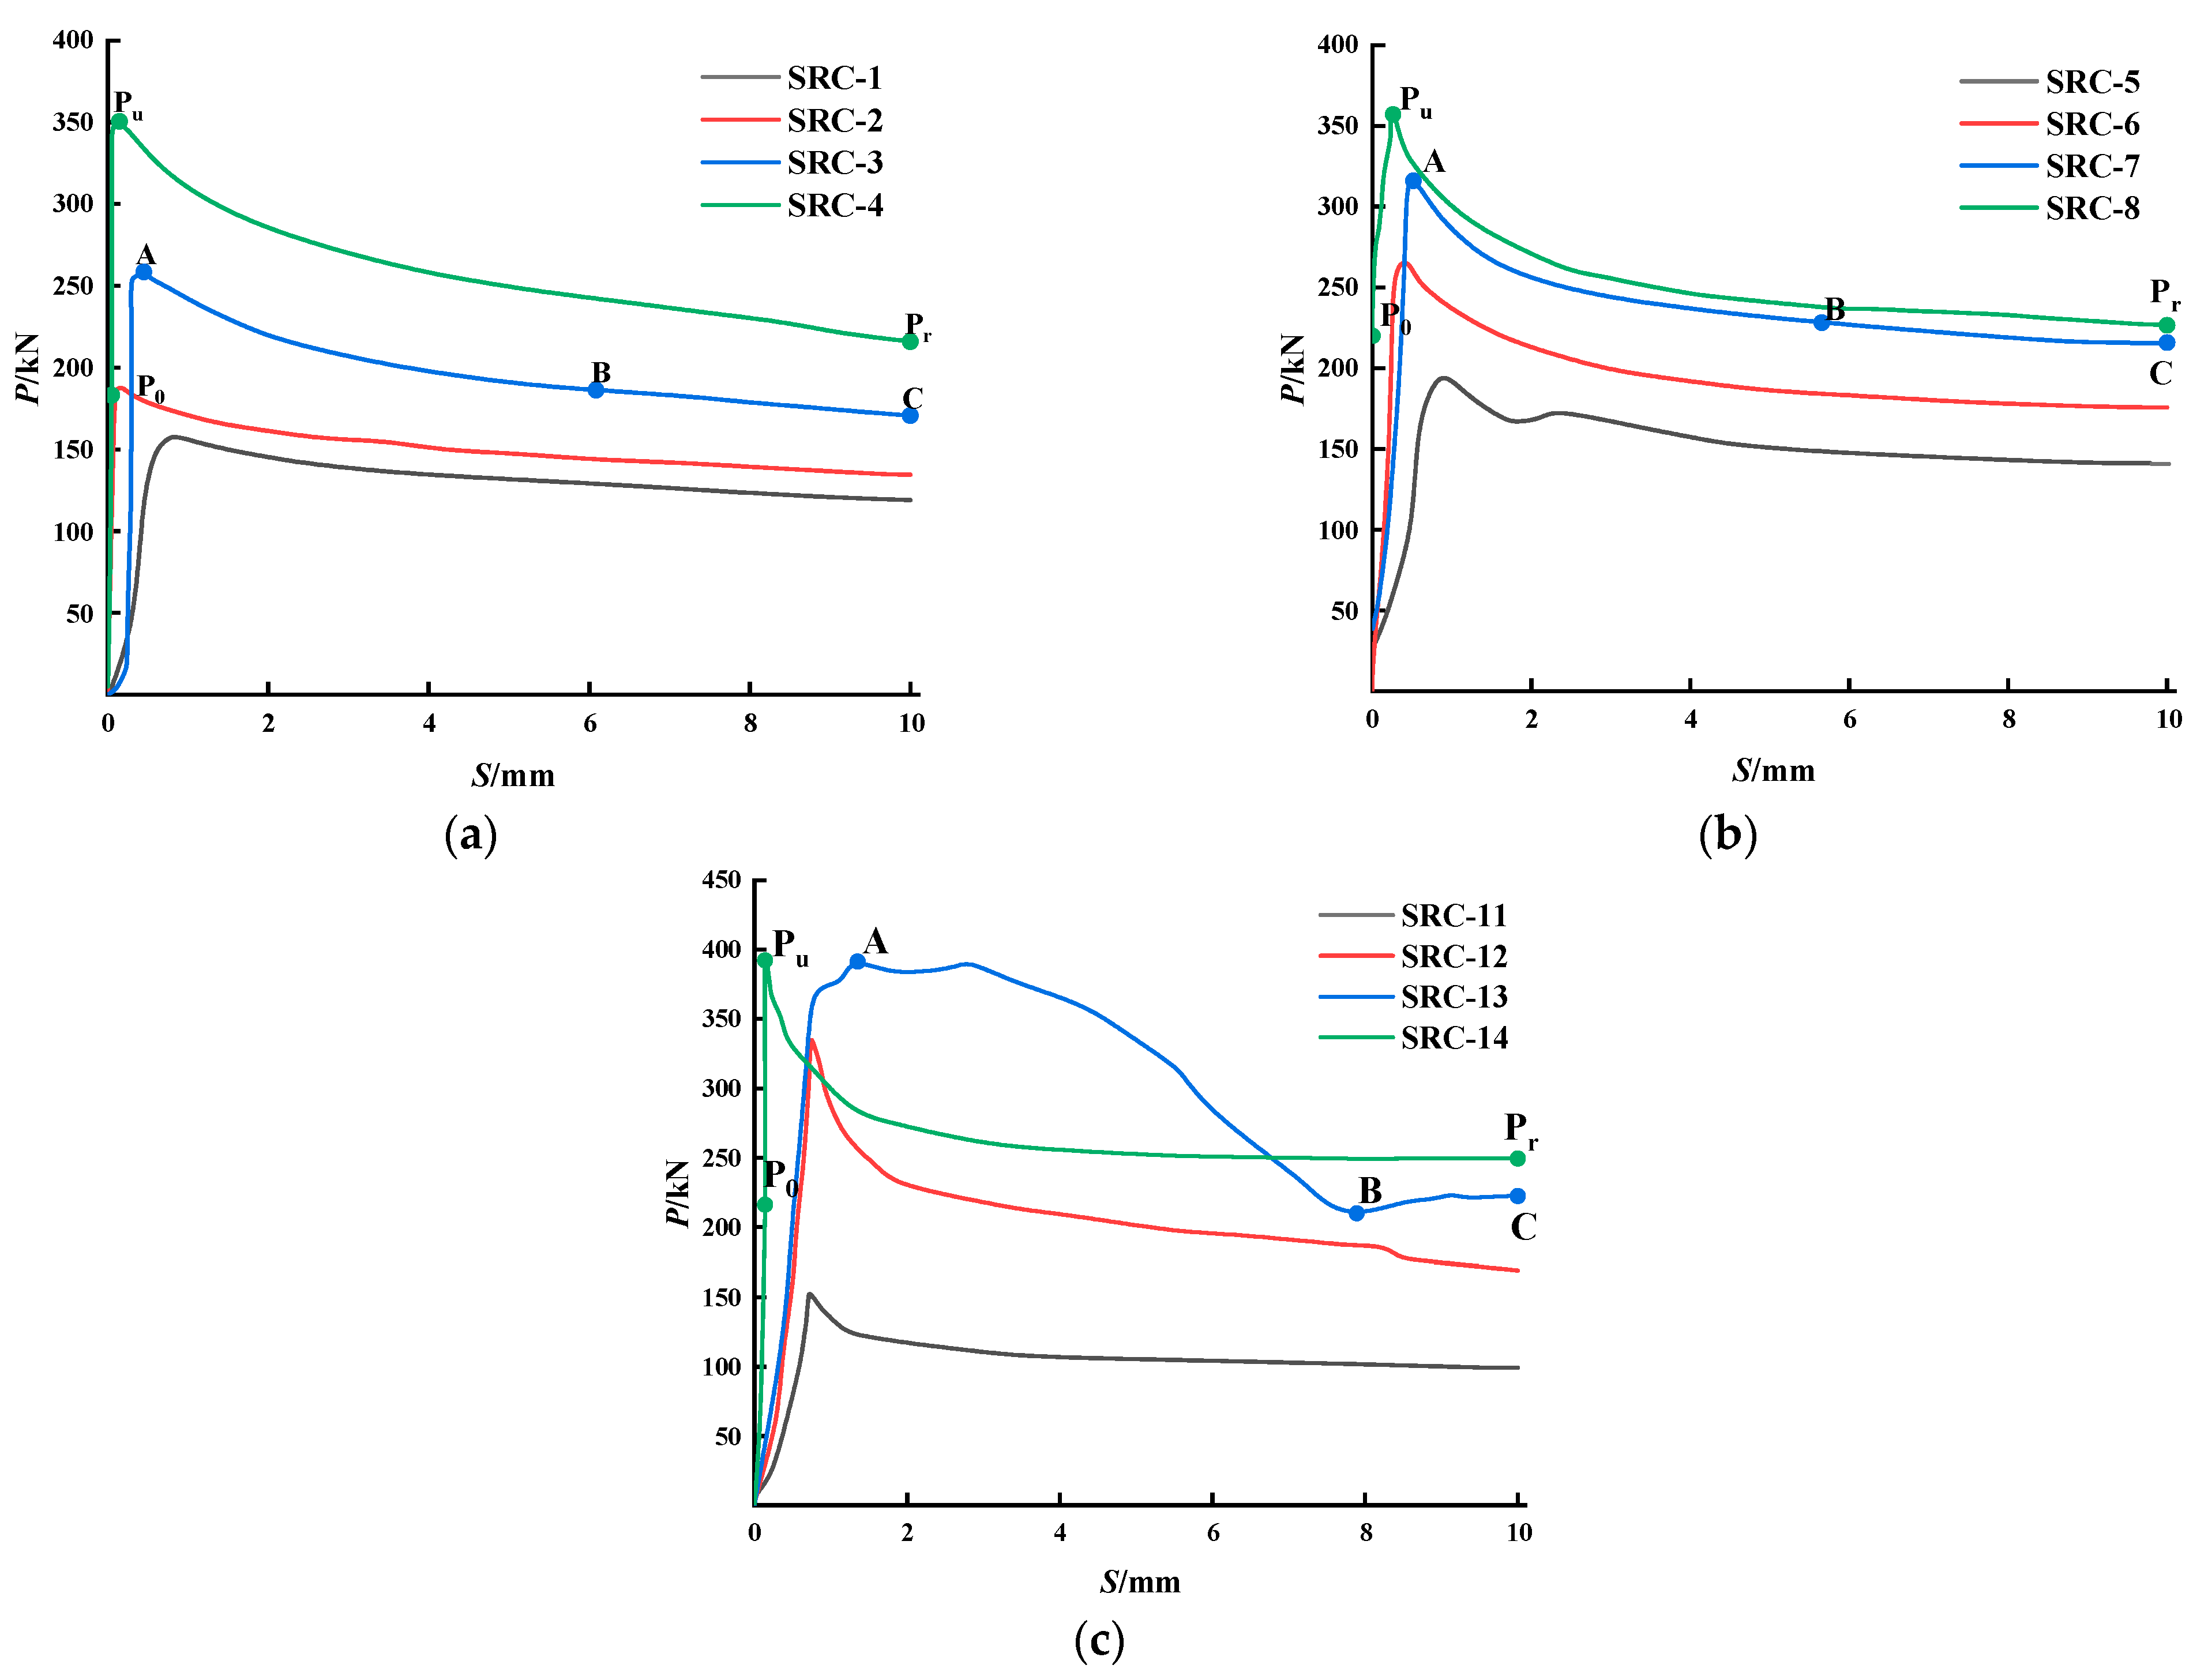
3.2. Load-Slip Curve

3.2.1. Different Anchoring Lengths

The load-slip curves at the free ends of the specimens are shown in Figure 5. It is observed in Figure 5 that the load-slip curve of the specimen at the free end is broadly categorized into three stages: ascent stage, descent stage, and residual deformation stage. Ascent Stage (OA): At the initial stage of loading, there is no relative slip between the structural steel and the high strength concrete. The bond stress at the interface is mainly composed of chemical adhesive power. The relative slip between the structural steel and the high strength concrete occurs with the increase in load. It is mainly caused by the shear deformation of the interface layer. The load grows linearly with the increase in the shear deformation of the interface layer. The load-slip curve is on the rise at this stage. As the slip occurs, the adhesive bond breaks, and the interface bond stress is borne by mechanical interaction force. The adhesive force only remains on the intermediate interface that has not yet slipped. As the adhesive force and mechanical interaction force reach the maximum, the load reaches the cohesion failure load (A point). Descent Stage (AB): As the load reaches the ultimate value, the adhesive bond between the structural steel and the high strength concrete is damaged with a maximum slip value of 10 mm. Simultaneously, the mechanical interaction force also fails in the area with a larger relative slip. The interfacial bond stress is then borne by the friction between the structural steel and the high strength concrete, along with the residual mechanical interaction force. As the increase in slip, the mechanical interaction force fails, and the interface bonding stress is completely borne by friction. The frictional force caused by the Poisson effect of concrete and the confinement of structural steel tends to grow with the increase in the axial pressure, resulting in a continuous increase in the bond stress. The load-displacement curve has an obvious peak value and then a decent stage occurs when the load reaches the bond failure load. The lowest point of the load is point B.
Residual deformation stage (BC): At this stage, there are only minor mechanical interaction forces and frictional resistance. As a result, the load curve entered a stable phase in the BC segment. It can be observed that the ultimate load grows with the increase in the anchorage length. This is mainly because the increase in the contact area between the structural steel and the concrete improves the interface friction.

3.2.2. Different Concrete Grades

As can be seen from Figure 6, the ultimate load value P u grew with the increase in the strength grade of concrete. The primary reason is that the chemical bonding force is the main component of the chemical bonding force. The chemical bonding force depends on the composition of the concrete material and the tensile strength. Hence, the strength of the transition layer between the steel and concrete interface can be improved with the increase in the tensile strength and crack toughness of concrete. Thus, the bond strength between the steel and high-performance concrete can be improved.

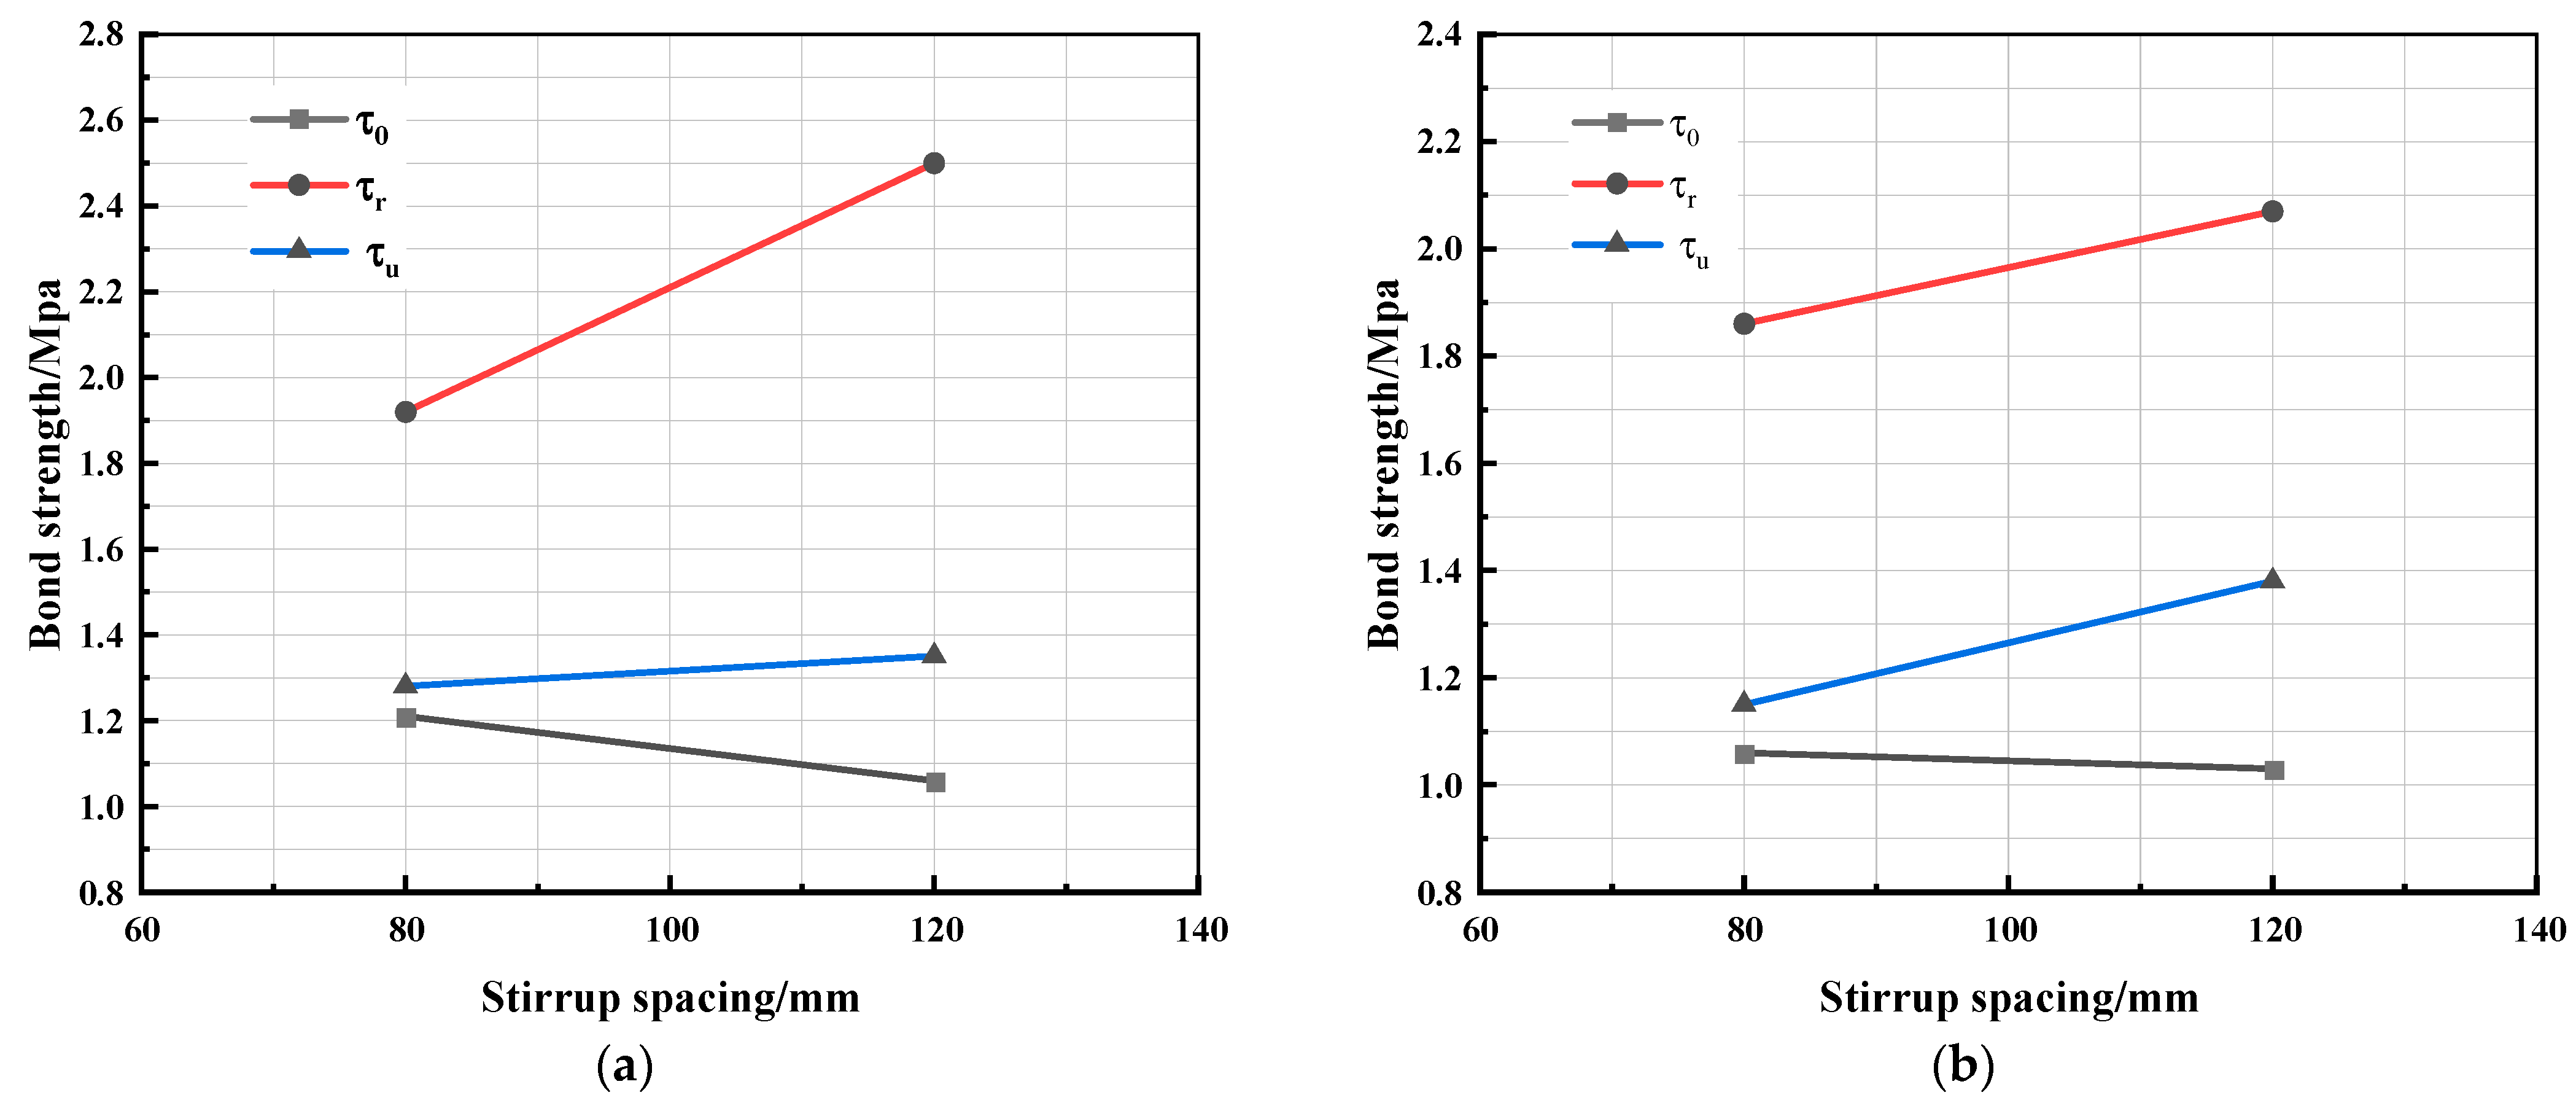
3.2.3. Different Stirrup Spacing

It is observed in Figure 7 that the load value achieved by specimens SRC-12 and SRC-13 under the same slip value was about 20% higher than that achieved by SRC-9 and SRC-10 before reaching the ultimate load, and the rate of load value increase was also faster. After reaching the ultimate load, the load decline rate of specimens SRC-9 and SRC-10 was faster, and the influence on the residual load value was not significant.
On the one hand, the stirrup delays the extension of radial internal cracks to the specimen surface. With the development of cracks, the ultimate bond strength is also increased accordingly, and brittle fracture failure is avoided. In addition, the non-uniform stress of the specimen can be improved for the specimens with a higher stirrup ratio. The bond performance of the specimen is more stable, and the specimen also has better bond ductility.

4. Characteristic Bond Strength

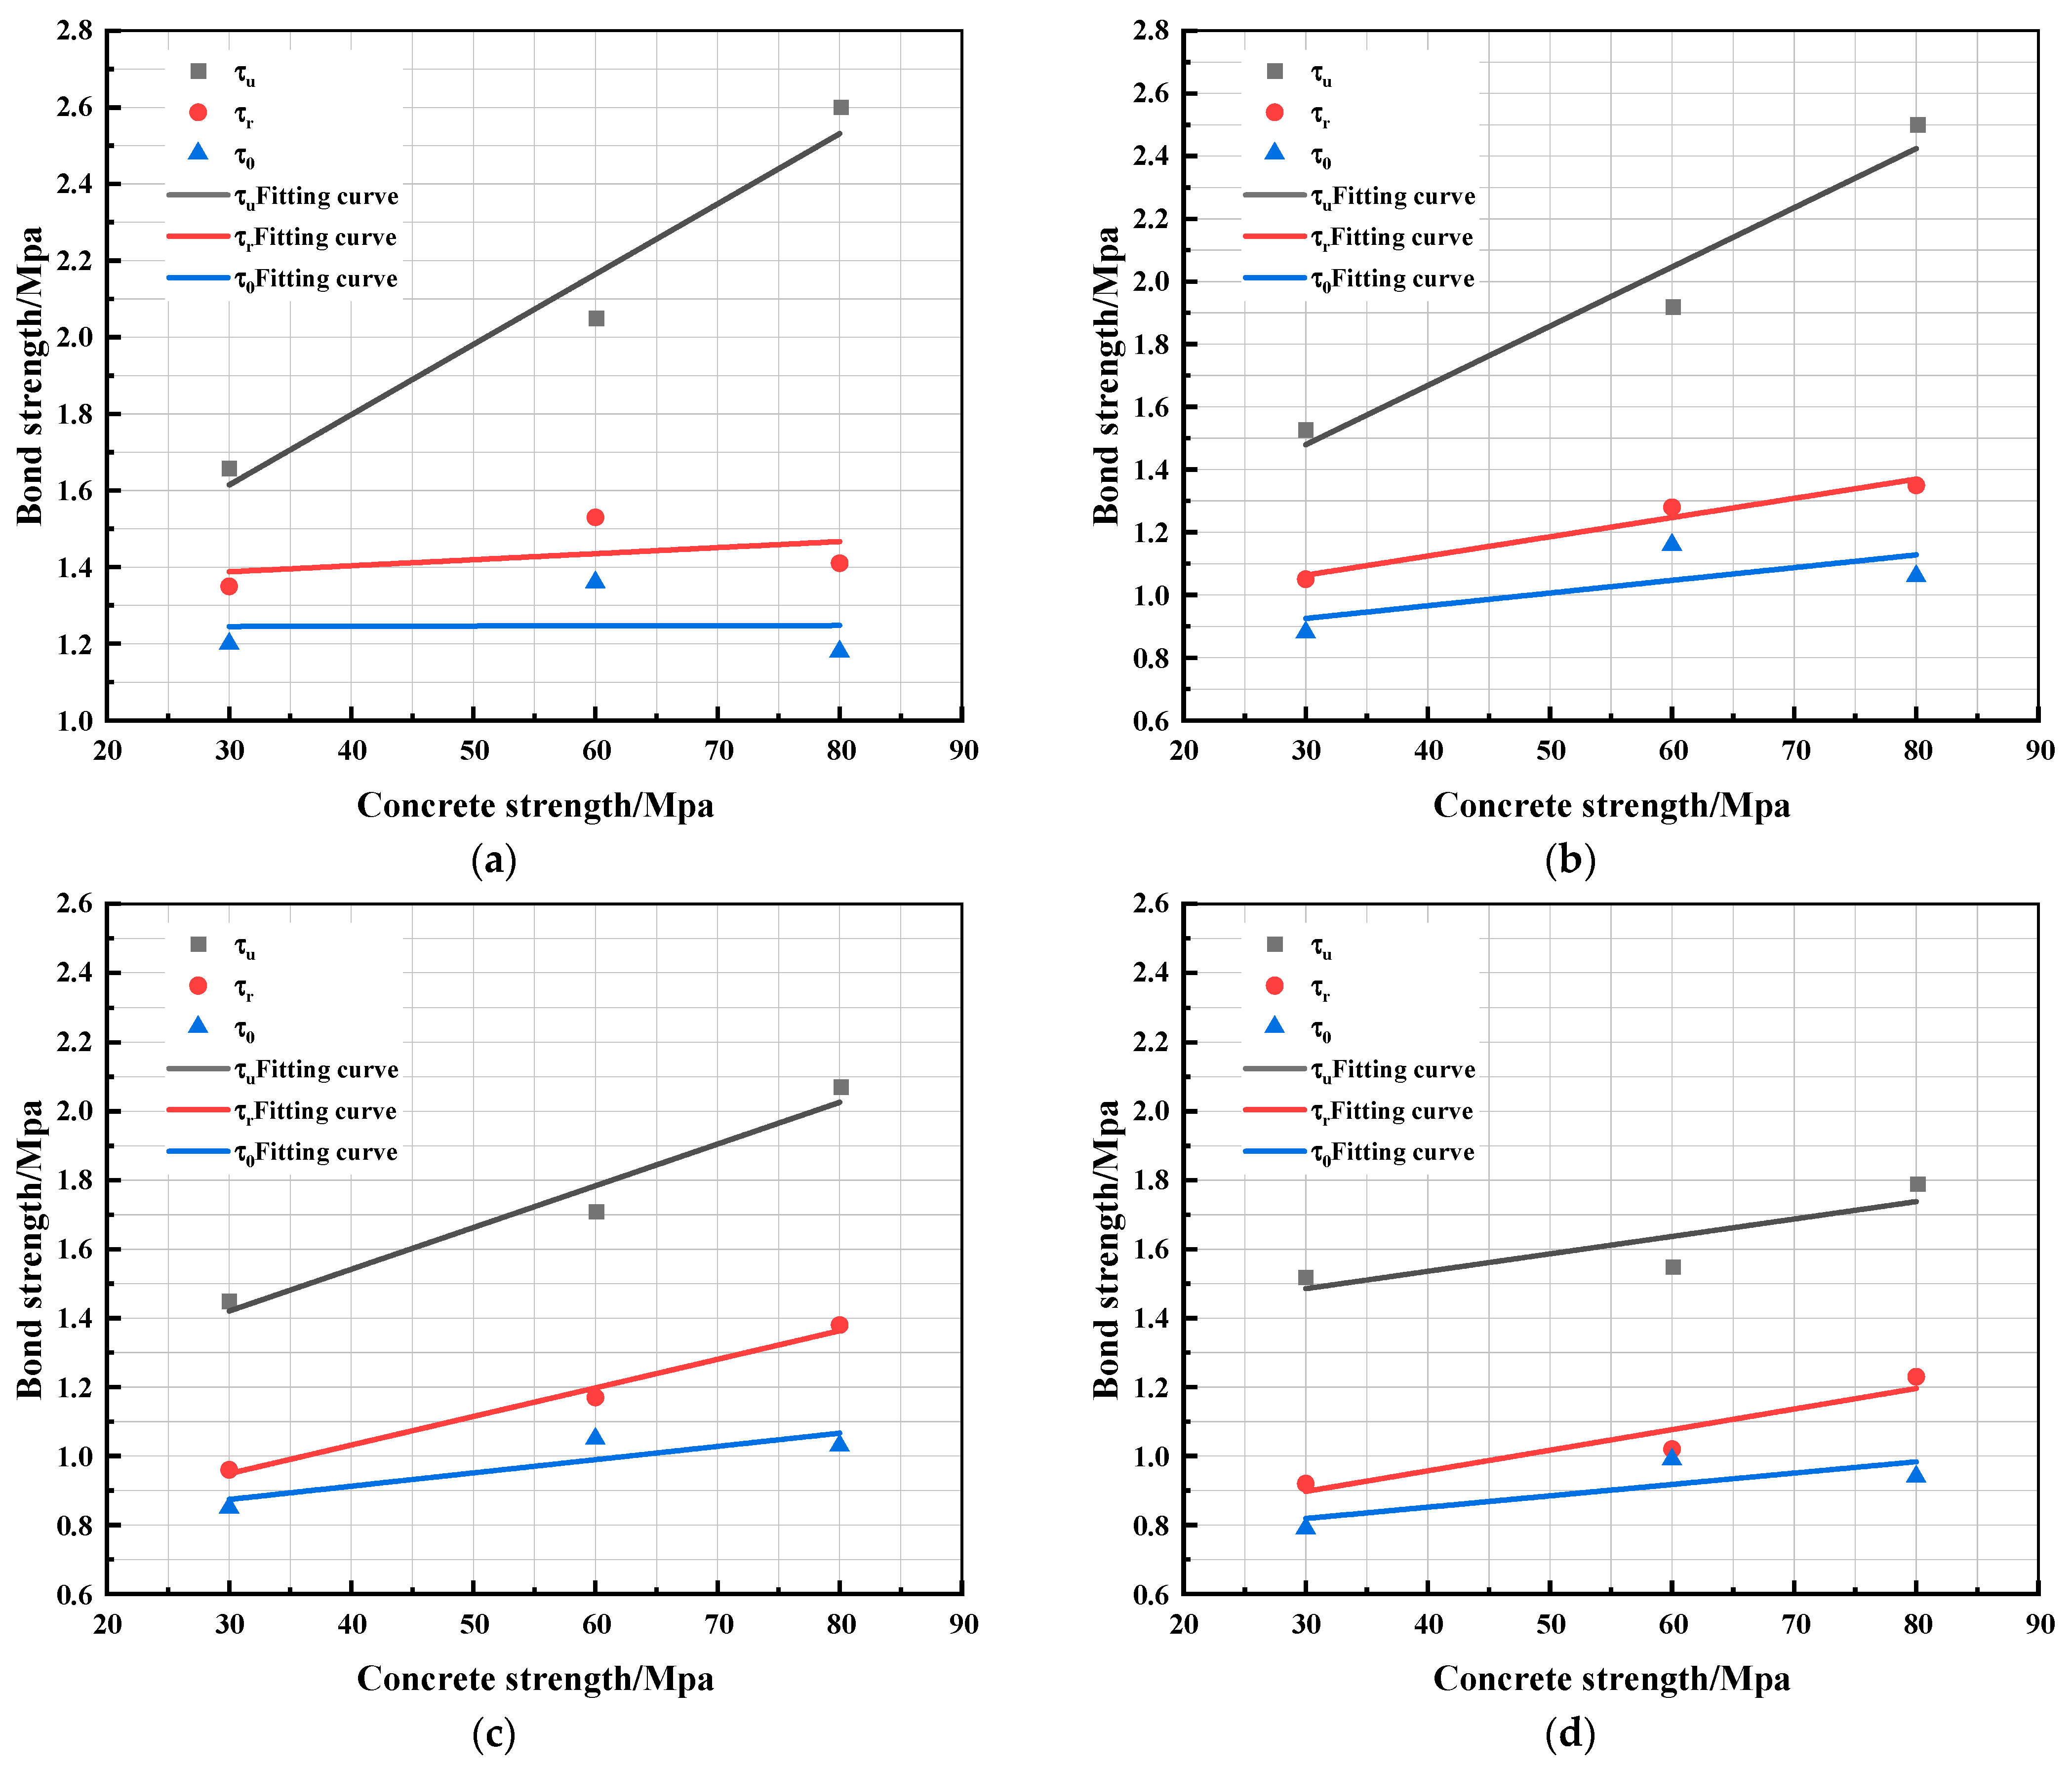
4.1. Analysis of Characteristic Bond Strength and Influencing Factors

The average bond stress is utilized to characterize the distribution pattern of interface bond stress during the loading process of steel-reinforced concrete:
τ = P L a C a
where
  • P represents the external load applied during the test, the unit kN.
  • C a represents the girth length of the steel section, in mm; The test structural steel size is I10, so the circumference length is 460 mm.
  • L a represents the anchoring length between the structural steel of the specimen and the concrete, in mm.
The characteristic bond strength values of each specimen are shown in Table 4. The initial bond strength τ ¯ 0 , ultimate bond strength τ ¯ u , and residual bond strength τ ¯ r correspond to the bond stress of P 0 , P u   and P r , respectively.

4.1.1. Concrete Strength

The correlation between characteristic bond strength and concrete strength at each fixed anchorage length is illustrated in Figure 8. It is observed that the characteristic bond strength grows with the increase in the concrete strength.
The ultimate bond strength accelerated with the increase in the concrete grade. The improvement of bond strength is most significant when the anchorage length is 200 mm and 300 mm. This is because the adhesion between steel bars and high strength concrete mainly comes from the chemical bonding force, and the size of the chemical bonding force depends on the composition of materials and the tensile strength of the concrete. When the anchorage length is short, chemical bonding forces dominate; as the anchorage length increases, the influence of concrete grade on ultimate characteristic adhesion strength weakens, resulting in a slower increase in adhesion strength. Residual adhesion strength is provided by interface friction and mechanical interlocking force after the adhesion interface is damaged, with little change in the influence of concrete grade on residual adhesion strength.

4.1.2. Stirrup Ratio

In this study, two groups of specimens were selected with volume stirrup rate parameters of 80 mm and 120 mm, concrete strength grade of C80, and anchoring lengths of 300 mm and 400 mm. The characteristic bond strength was calculated based on the test data, and the curves for initial bond strength, ultimate bond strength, and residual bond strength were obtained under different volume stirrup ratios as depicted in Figure 9.
It is observed in Figure 9 that the initial bond strength grew with the increase in the transverse stirrup ratio, while the ultimate bond strength and the residual bond strength decreased. This is attributed to the high brittleness of high strength concrete, which results in greater brittle failure when the reinforcing bars are densely packed at the bond interface. Consequently, denser reinforcing bars exhibit lower bond strength. The experiment also demonstrates that the confinement ratio of reinforcing bars significantly influences both the bond strength and failure mode of steel-reinforced high strength concrete specimens.

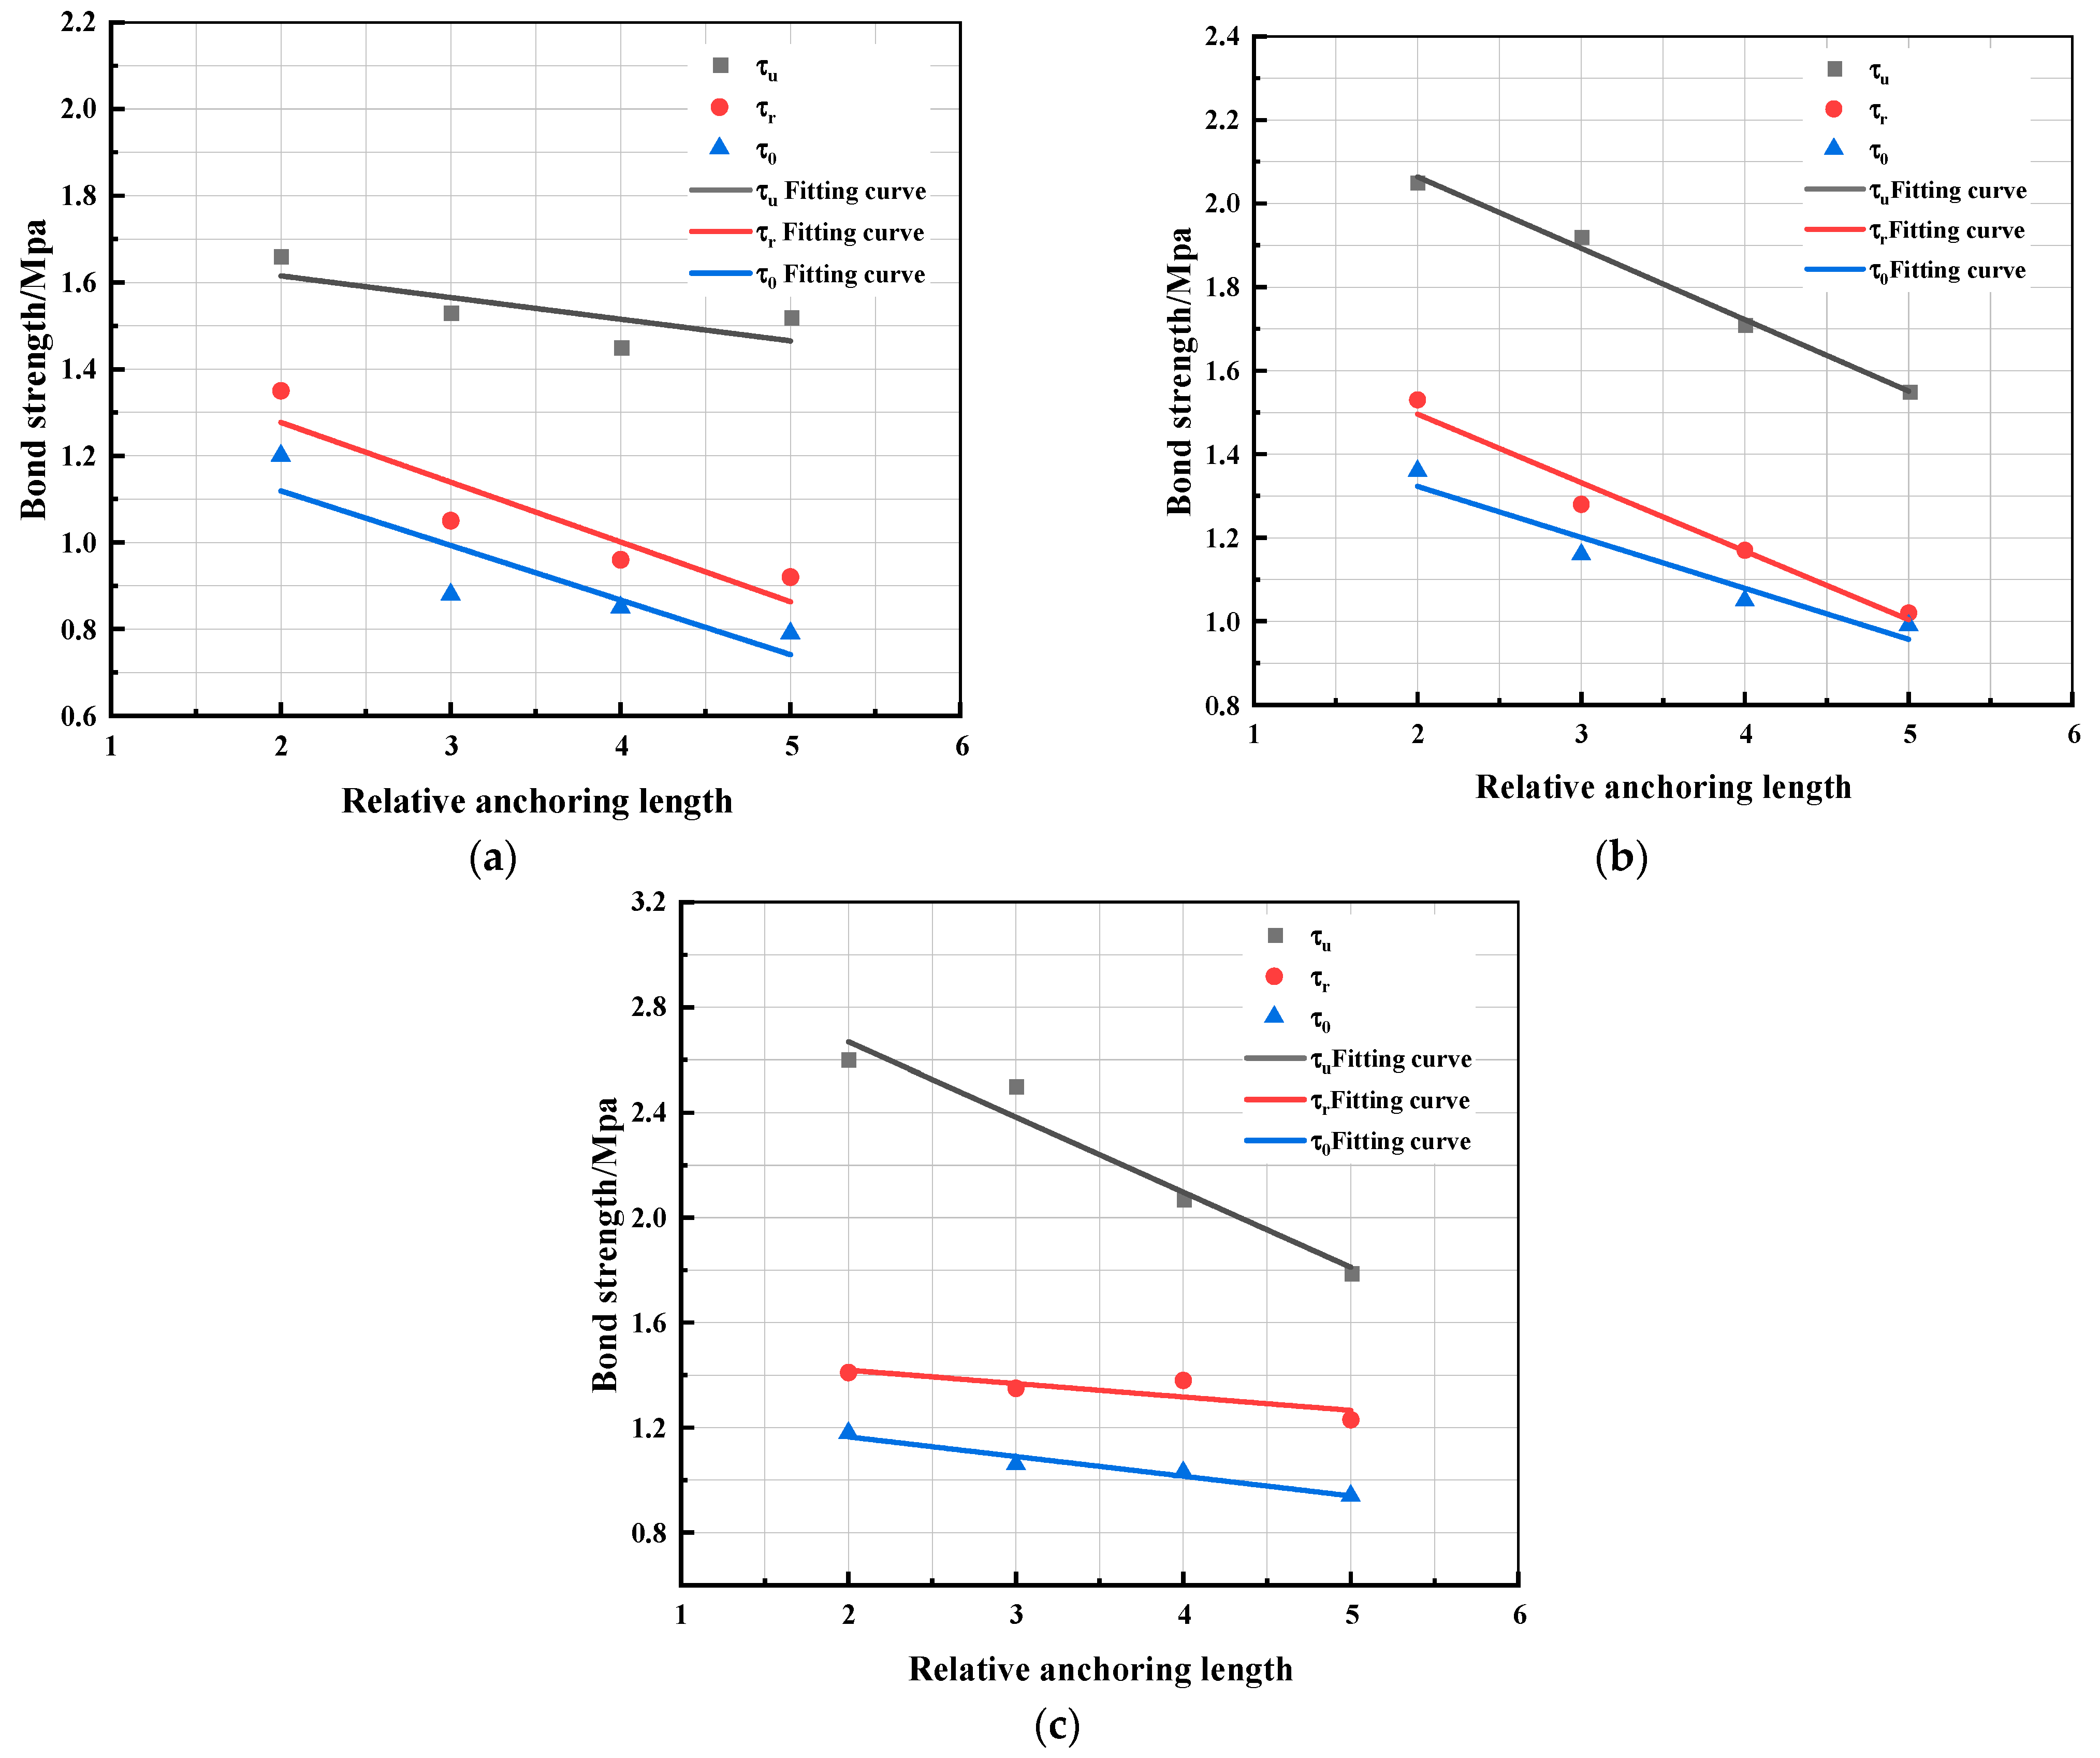
4.1.3. Anchoring Length

The relationship between the characteristic bond strength τ of different concrete grades and the relative anchorage length l a / h a is illustrated in Figure 10. Where l a /mm represents the anchorage length between steel bar and concrete, while h a /mm represents the web height of the I10 steel bar. It is evident that with the increase in bond length, the ultimate load value P u increased. However, the ultimate bond stress of the specimens gradually decreases. The primary reason is that the relative distribution length of the high stress region on the junction stress diffusion length grows with the increase in the anchorage length. The distribution of the high stress region on the diffusion length of the bond stress is relatively reduced, while the resistance load is increased. There is no significant change in the effective area of bond strength, so there will be an increase in anchorage length and characteristic adhesion.
The decline rate of the ultimate bond strength of specimen SRC-1 was observed to be slower than that of specimen SRC-4, while the trend in residual bond strength exhibited a moderate decline. Additionally, the initial bond strength showed a faster decline compared to specimen SRC-2. The ultimate bond strength, residual bond strength, and initial bond strength of the C60 specimen exhibited a similar decreasing trend. With the increase in anchorage length, the ultimate bond strength of the C80 specimen exhibited the most significant decrease, while the initial bond strength showed a slower decline. This can be attributed to the chemical bonding force between steel bars and concrete. As the anchorage length increases, there is a relatively reduced distribution of high stress zones along the bond stress diffusion length, while the effective area of bond strength against load remains largely unchanged, resulting in a gradual decrease in initial bond strength.
The rapid decline in ultimate bond strength of high strength concrete is attributed to the heightened chemical bonding force and inherent brittleness of the material. Damage to the bond between steel and concrete leads to accelerated diffusion, resulting in a faster overall decline rate. However, the initial bond strength represents the load at which concrete first slips. Greater anchorage length corresponds to higher bond strength, thus leading to a slower rate of decline. The residual bond strength is sustained by frictional resistance and mechanical bite force after complete damage occurs at the contact surface between steel and concrete, making it less influenced by anchorage length.

4.2. The Calculation Formula of the Characteristic Bond Strength

Figure 11 and Figure 12 depict the scatter plots and fitting results for each characteristic bond strength, concrete strength, and relative anchorage length. The change in each characteristic bond strength under different influencing factors follows a linear trend, as shown in Figure 11 and Figure 12. Based on the test data, multiple linear regression was conducted to analyze the relationship between each characteristic bond strength, concrete strength, and relative anchorage length. The test data of two groups of specimens was randomly reserved for verification during the multiple linear regression process, leading to the establishment of calculation formulas for each characteristic bond strength:
Initial bond strength:
τ 0 = 0.003 f c u 0.10903 l a h a + 1.2559
Ultimate bond strength:
τ u = 0.01167 f c u 0.16548 l a h a + 1.74562
Residual bond strength:
τ r = 0.0046 f c u 0.11806 l a h a + 1.35723
where f c u /MPa is the standard compressive strength of concrete cub; h a /mm is the cross-section height of the structural steel; l a /mm indicates the anchoring length of the structural steel.
The comparison results between the calculated and tested values of the characteristic bond strength of the reserved specimens are presented in Table 6. The average ratios of the initial bond stress, ultimate bond stress, and residual bond stress between test values and calculated values are 1.015, 1, and 1.045, respectively, with corresponding coefficients of variation of 0.03, 0.02, and 0.04, respectively. Therefore, it can be concluded that the regression formula based on concrete strength and anchorage length satisfactorily meets the calculation requirements for characteristic bond strength between structural steel and concrete.

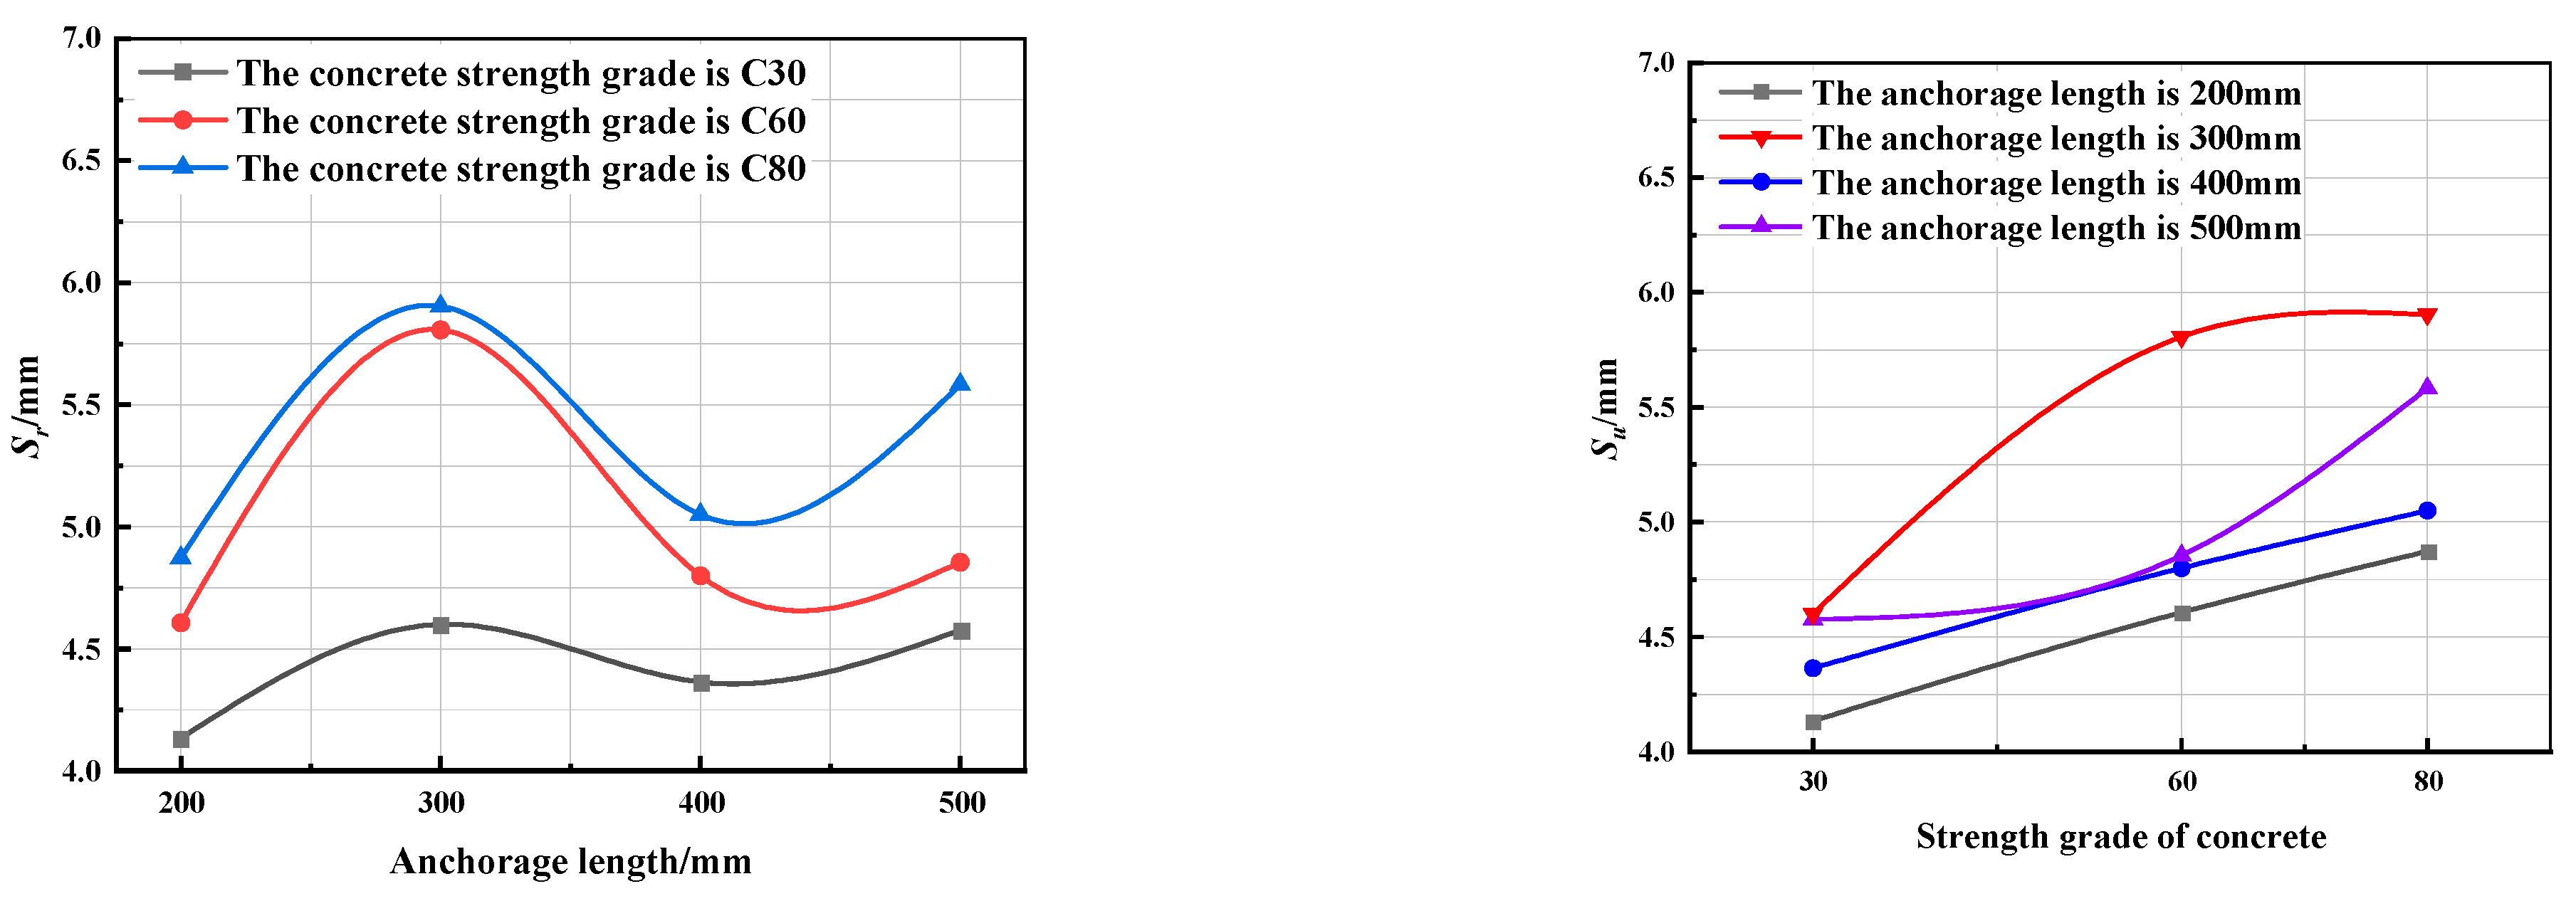
4.3. Characteristic Slip Value

Four characteristic slip points are defined according to the bond strength-slip curve:
(1)
Initial slip S 0 :
At this time, the specimen did not slip.
(2)
Control point slip S s u :
Slip values corresponding to control points ( S s u , τ s ). Where τ s = 0.5   τ 0 + τ u
(3)
Limit state slip S u ;
It is illustrated in Figure 11 that the correlation between S u and anchorage length, as well as concrete grade for each specimen. The trend of S u with anchorage length remained consistent across specimens with varying concrete strength, exhibiting a pattern of initial decrease, followed by an increase and then another decrease. The reason is that bond-splitting failure occurred in the specimens of SRC-1, SRC-5, and SRC-11 with short anchorage lengths. The slip value increased with the applied load. Upon reaching the ultimate bonding load, cracks propagated along the entire length of the specimen. The slip value showed minimal sensitivity to changes in concrete grade. Specimens with anchorage lengths of 300 mm and 400 mm exhibited push-out failure, with an increase in S u observed as concrete strength increases. For the specimens of SRC-4, SRC-8, and SRC-14 with longer anchorage lengths steel bond yielded is observed. The relative slip at the steel-concrete interface decreased when the steel bond yielded. Furthermore, there is a further limitation on S u increase for the specimens of C80. The increase in the anchorage length of the structural steel can effectively limit the slip development of the structural steel and the high strength concrete. In terms of the relationship between S u and concrete, specimens with 200 mm and 500 mm anchorage lengths demonstrate a similar trend of initial increase followed by a decrease. Similarly, specimens with 300 mm and 400 mm anchorage lengths exhibit an increasing trend.
(4)
Initial slip S r in the residual stage:
It is illustrated in Figure 12 that the correlation between S r and anchorage length, as well as concrete grade for each specimen. As depicted in Figure 11, the trend of S r with anchorage length remained consistent across specimens with varying concrete strengths, displaying an initial increase followed by a decrease and subsequent increase. Similarly, the S r values for specimens with different anchorage lengths exhibited a similar pattern based on concrete grade, demonstrating an overall upward trend.
The calculation formula of each characteristic slip value is established as follows:
S 0 = 0
S u = 0.00677 f c u 0.00165 l a + 0.72374
S r = 0.01877 f c u 0.0007 l a + 3.62054
S s u = 0.65582 S u + 0.00856

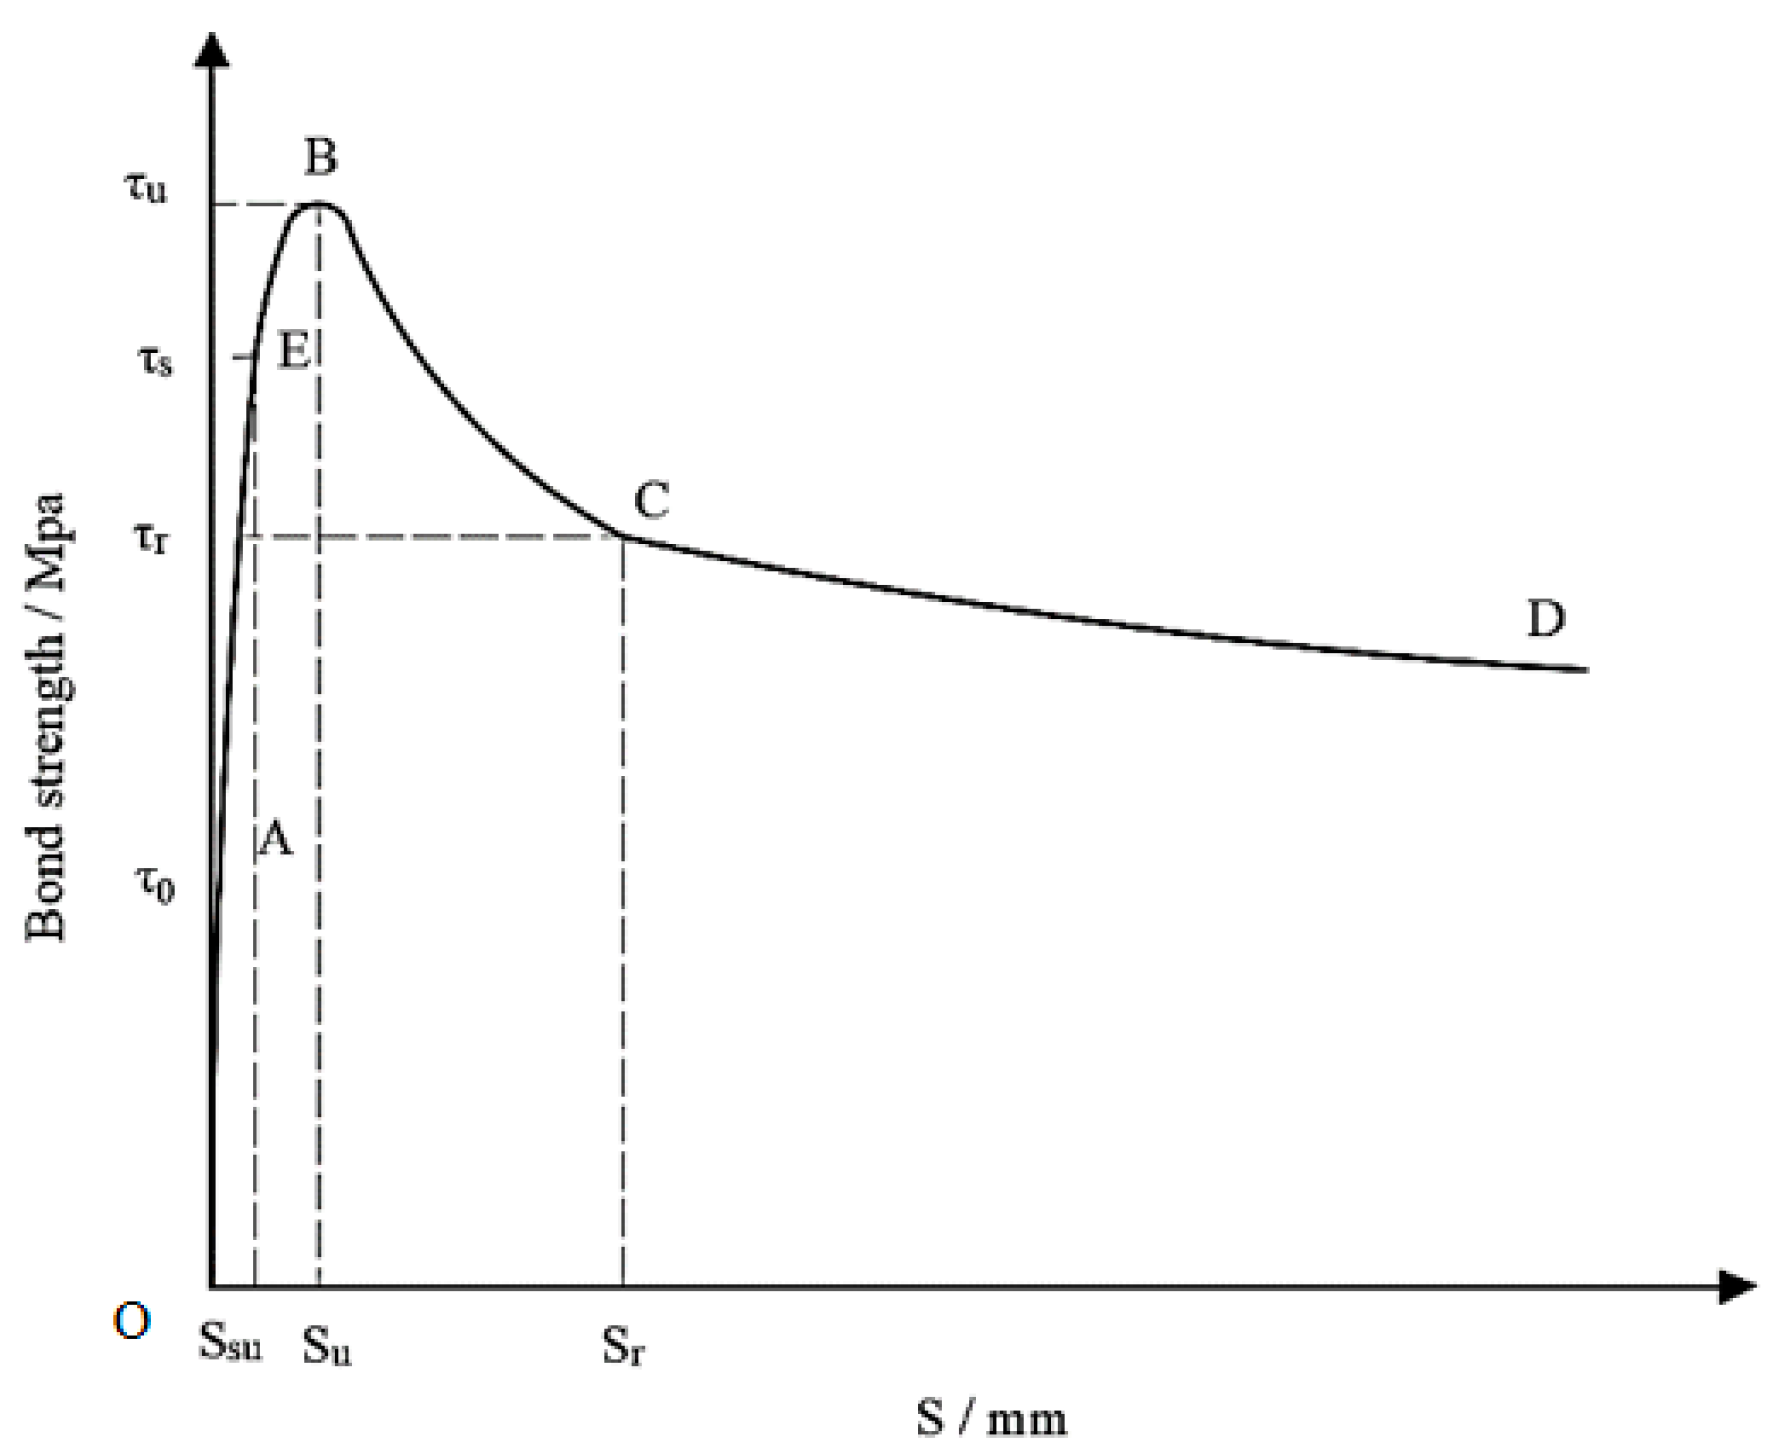
5. Bond Slip Constitutive Relation

According to the characteristic points determined above, the curve equation of τ S can be defined piecewise. Based on the observation and analysis of the τ S curves of the 14 specimens, the constitutive relationship between the average bond strength and the free-end slip τ S can be described by the model in Figure 13.
(1)
OA section: The free end does not slip, but the bond stress continues to increase until the free end of τ = τ 0 begins to slip. At this stage, the mathematical expression is:
S = 0
(2)
AB segment: AB segment is described by parabola, and the mathematical expression is as follows:
τ = a S 2 + b S + c
where a = τ 0 τ u S u S s u ,   b = S u + S s u τ u τ 0 S u S s u , c = τ 0
(3)
BCD segment: The BCD segment is described by hyperbola, and the mathematical expression is as follows:
τ = S p S q
where p = S u τ r S r τ u τ r τ u S u S r , q = S u S r τ r τ u τ r τ u S u S r .
It is shown in Figure 14 that the test curves are in good agreement with the fitted curves, The whole process of bond-slip can be described accurately in the τ S constitutive model.

6. Finite Element Analysis

Based on the experimental study, the bond-slip constitutive relationship obtained at the material level is applied to the member level. ABAQUS 2020 finite element analysis software [39] is utilized to incorporate a spring element with zero length between the steel reinforcement and concrete, while the proposed bond-slip constitutive relationship is employed to simulate their interaction. A finite element model of SRHSC exterior joints considering bond-slip effects is developed. The 3D finite element model is shown in Figure 15. The suitability of the proposed bond-slip constitutive relationship is assessed based on the results from finite element simulations.

6.1. Material Characteristics and Constitutive Models

The selected test parameters of the SRHSC exterior joints are detailed [1]. The concrete adopts the concrete plastic damage (CDP) model as shown in Table 7. The constitutive relationship of the steel adopts the ideal elastoplastic model. The CDP model is suitable for the analysis of a variety of concrete load conditions, including monotonic strain, cyclic load and dynamic load. The model covers tensile cracking and compression breakage and can simulate the hardness degradation mechanism in the mechanical properties of concrete and the stiffness recovery after repeated loading.
The stress–strain relationship of concrete under uniaxial compression [2] is as follows:
y = A 1 x x 2 1 + A 1 2 x   x 1 x α 1 x 1 2 + x   x > 1
where y = σ / f c , x = ε / ε 0 . A 1 is the parameter of the ascending section, α 1 is the parameter of the descending section, σ is the compressive stress of concrete, f c is the compressive strength of concrete axis, ε is the compressive strain of concrete, and ε 0 is the peak compressive strain of concrete. Rising period of parameters A 1 = 9.1 f c u 4 / 9 , the decline period of parameter α 1 = 2.5 × 10 5 f c u 3 , the peak compressive strain of concrete epsilon ε 0 = 700 + 172 f c × 10 6 .
The stress–strain relationship of concrete under uniaxial tension is as follows:
y = A 2 x x 2 1 + A 2 2 x         x 1 x α 2 x 1 1.7 + x   x > 1
where y = σ / f t , x = ε / ε t p . A 2 is the ascending stage parameter, α 2 is the descending stage parameter, σ is the tensile stress of concrete, f t is the axial tensile strength of concrete, ε is the tensile strain of concrete, ε t p is the peak tensile strain of concrete.
Rising period of parameter A 2 take 1.306, falling segment parameters for alpha α 1 = 1 + 3.4 f c u 2 × 10 4 , the peak tensile strain of concrete for epsilon ε t p = 65 f t 0.54 × 10 6 .
Damage factor value:
d k = 1 β ε i n E 0 σ k + 1 β ε i n E 0
where k = t , c , t , c represent tensile and compressive concrete, respectively, β is the ratio of plastic and inelastic strain, 0.5~0.95 under tension, 0.35~0.7 under pressure, ε i n   in is the corresponding strain in the inelastic stage of concrete under tension and pressure.

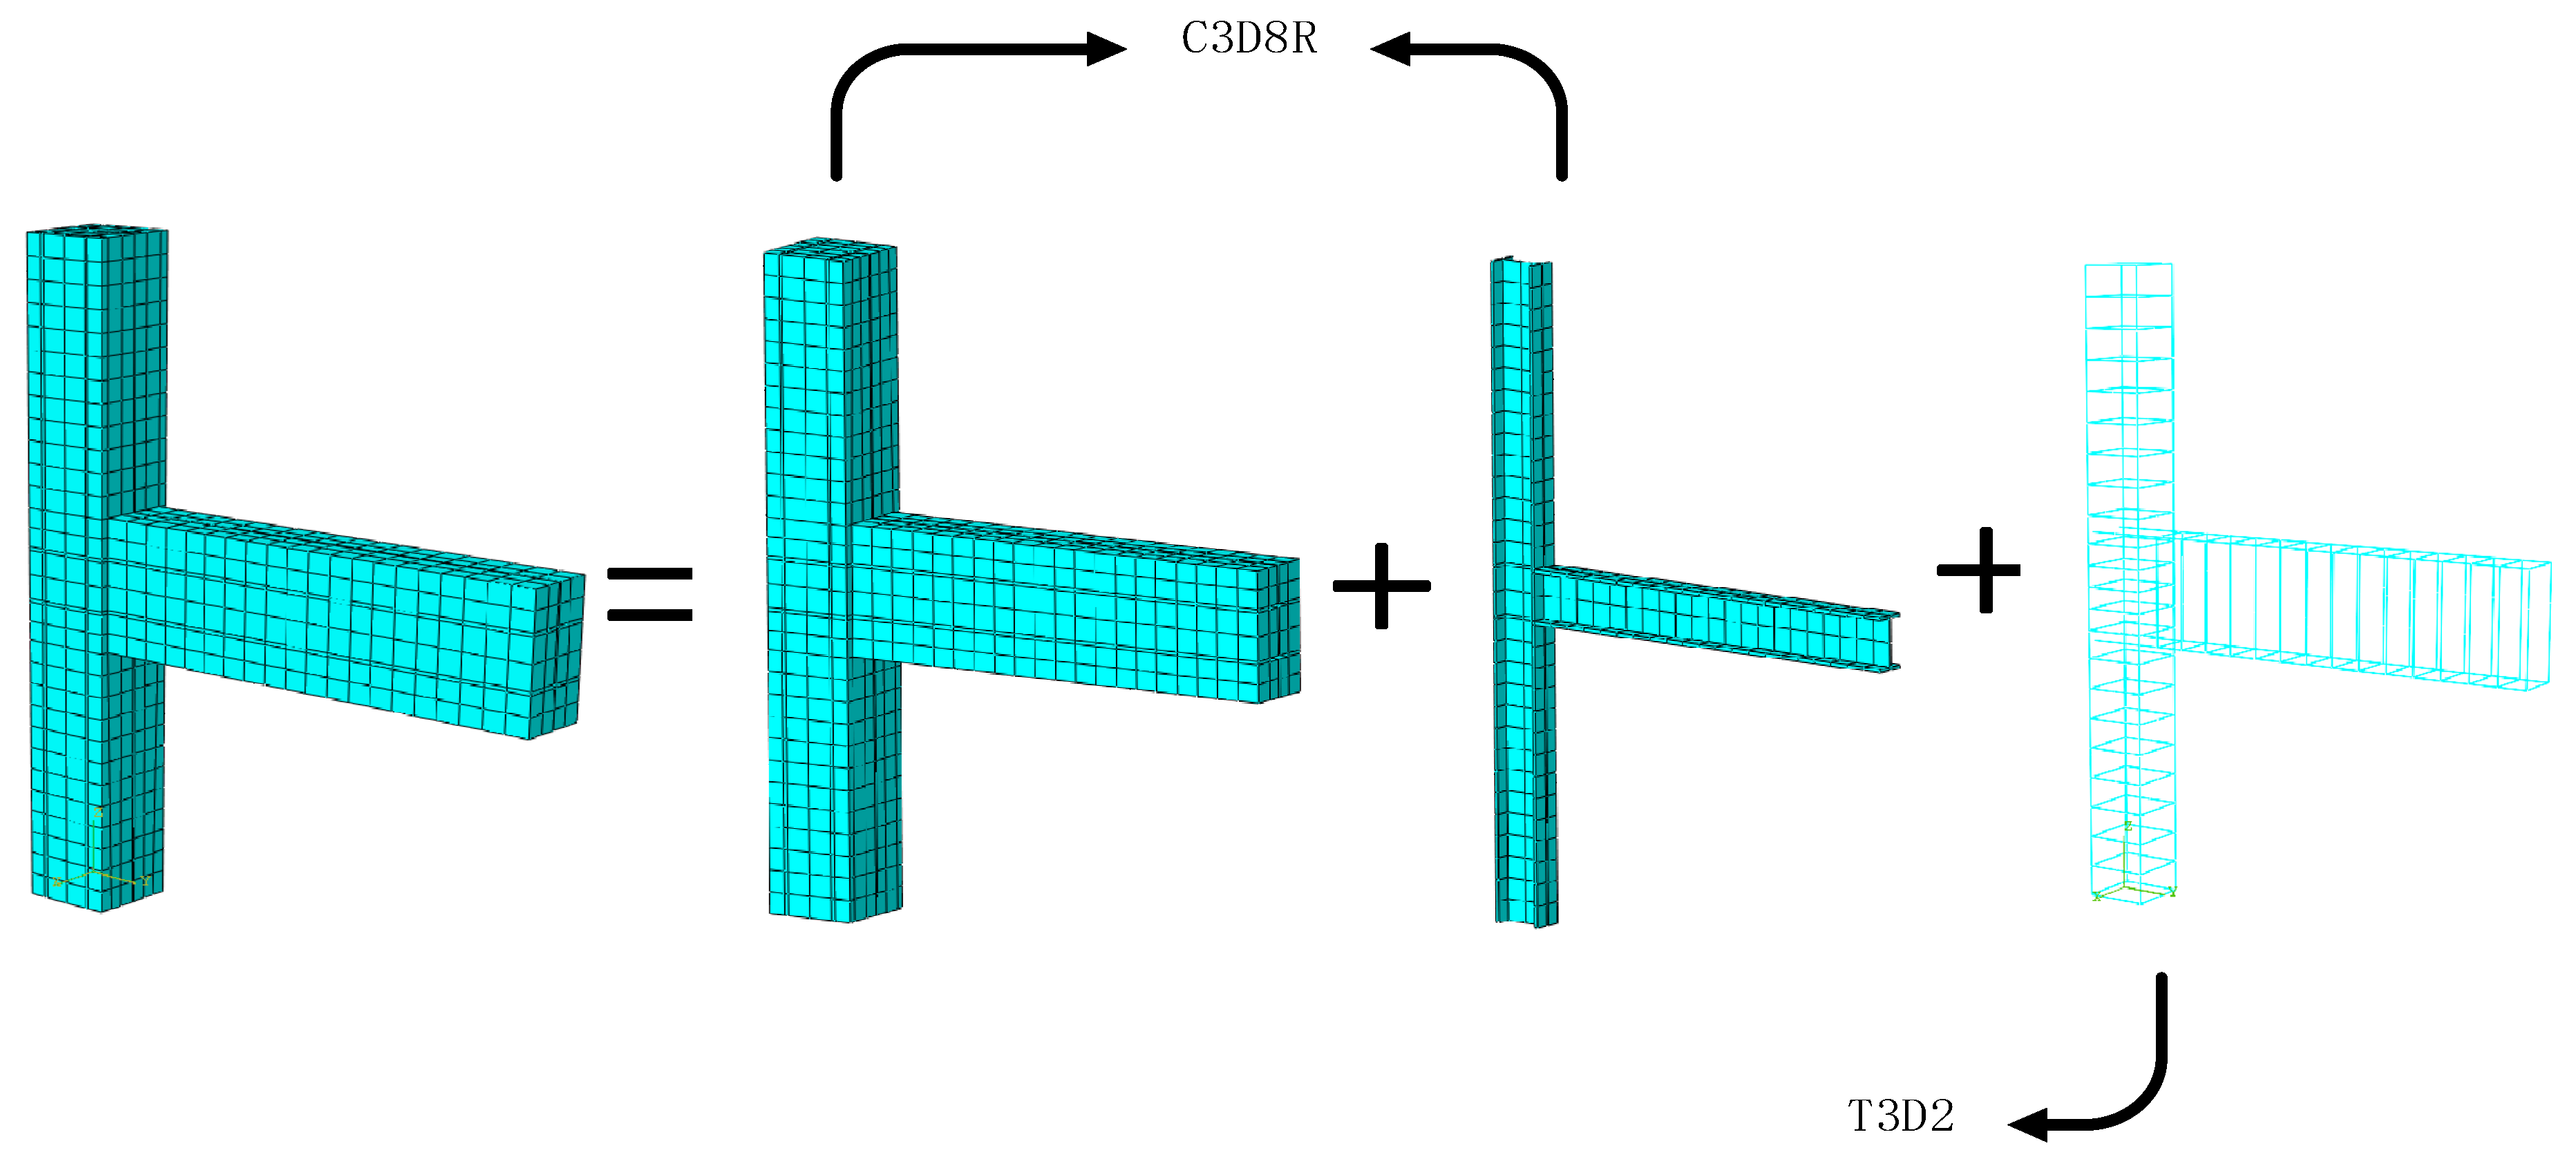
6.2. Mesh Discretization and Boundary Conditions

In order to accurately simulate the test, C3D8R solid element was used for concrete and steel, T3D2 truss element was used for longitudinal and stirrup. The steel bars were integrated into the concrete using the “embedded region” operation. Considering the bond and slip between the steel bar and concrete, a “hard contact” was established in the normal direction of their interface. Contact in this direction can be disregarded. The non-linear springs (Spring2) were used in both longitudinal and tangential directions to simulate bond slip between steel bars and concrete. Mesh division significantly impacts the accuracy and computational efficiency of simulation results. After several trial calculations, it was determined that a mesh size of 50 mm for cross-sectional and vertical sections not only meets accuracy requirements but also greatly enhances computational efficiency.

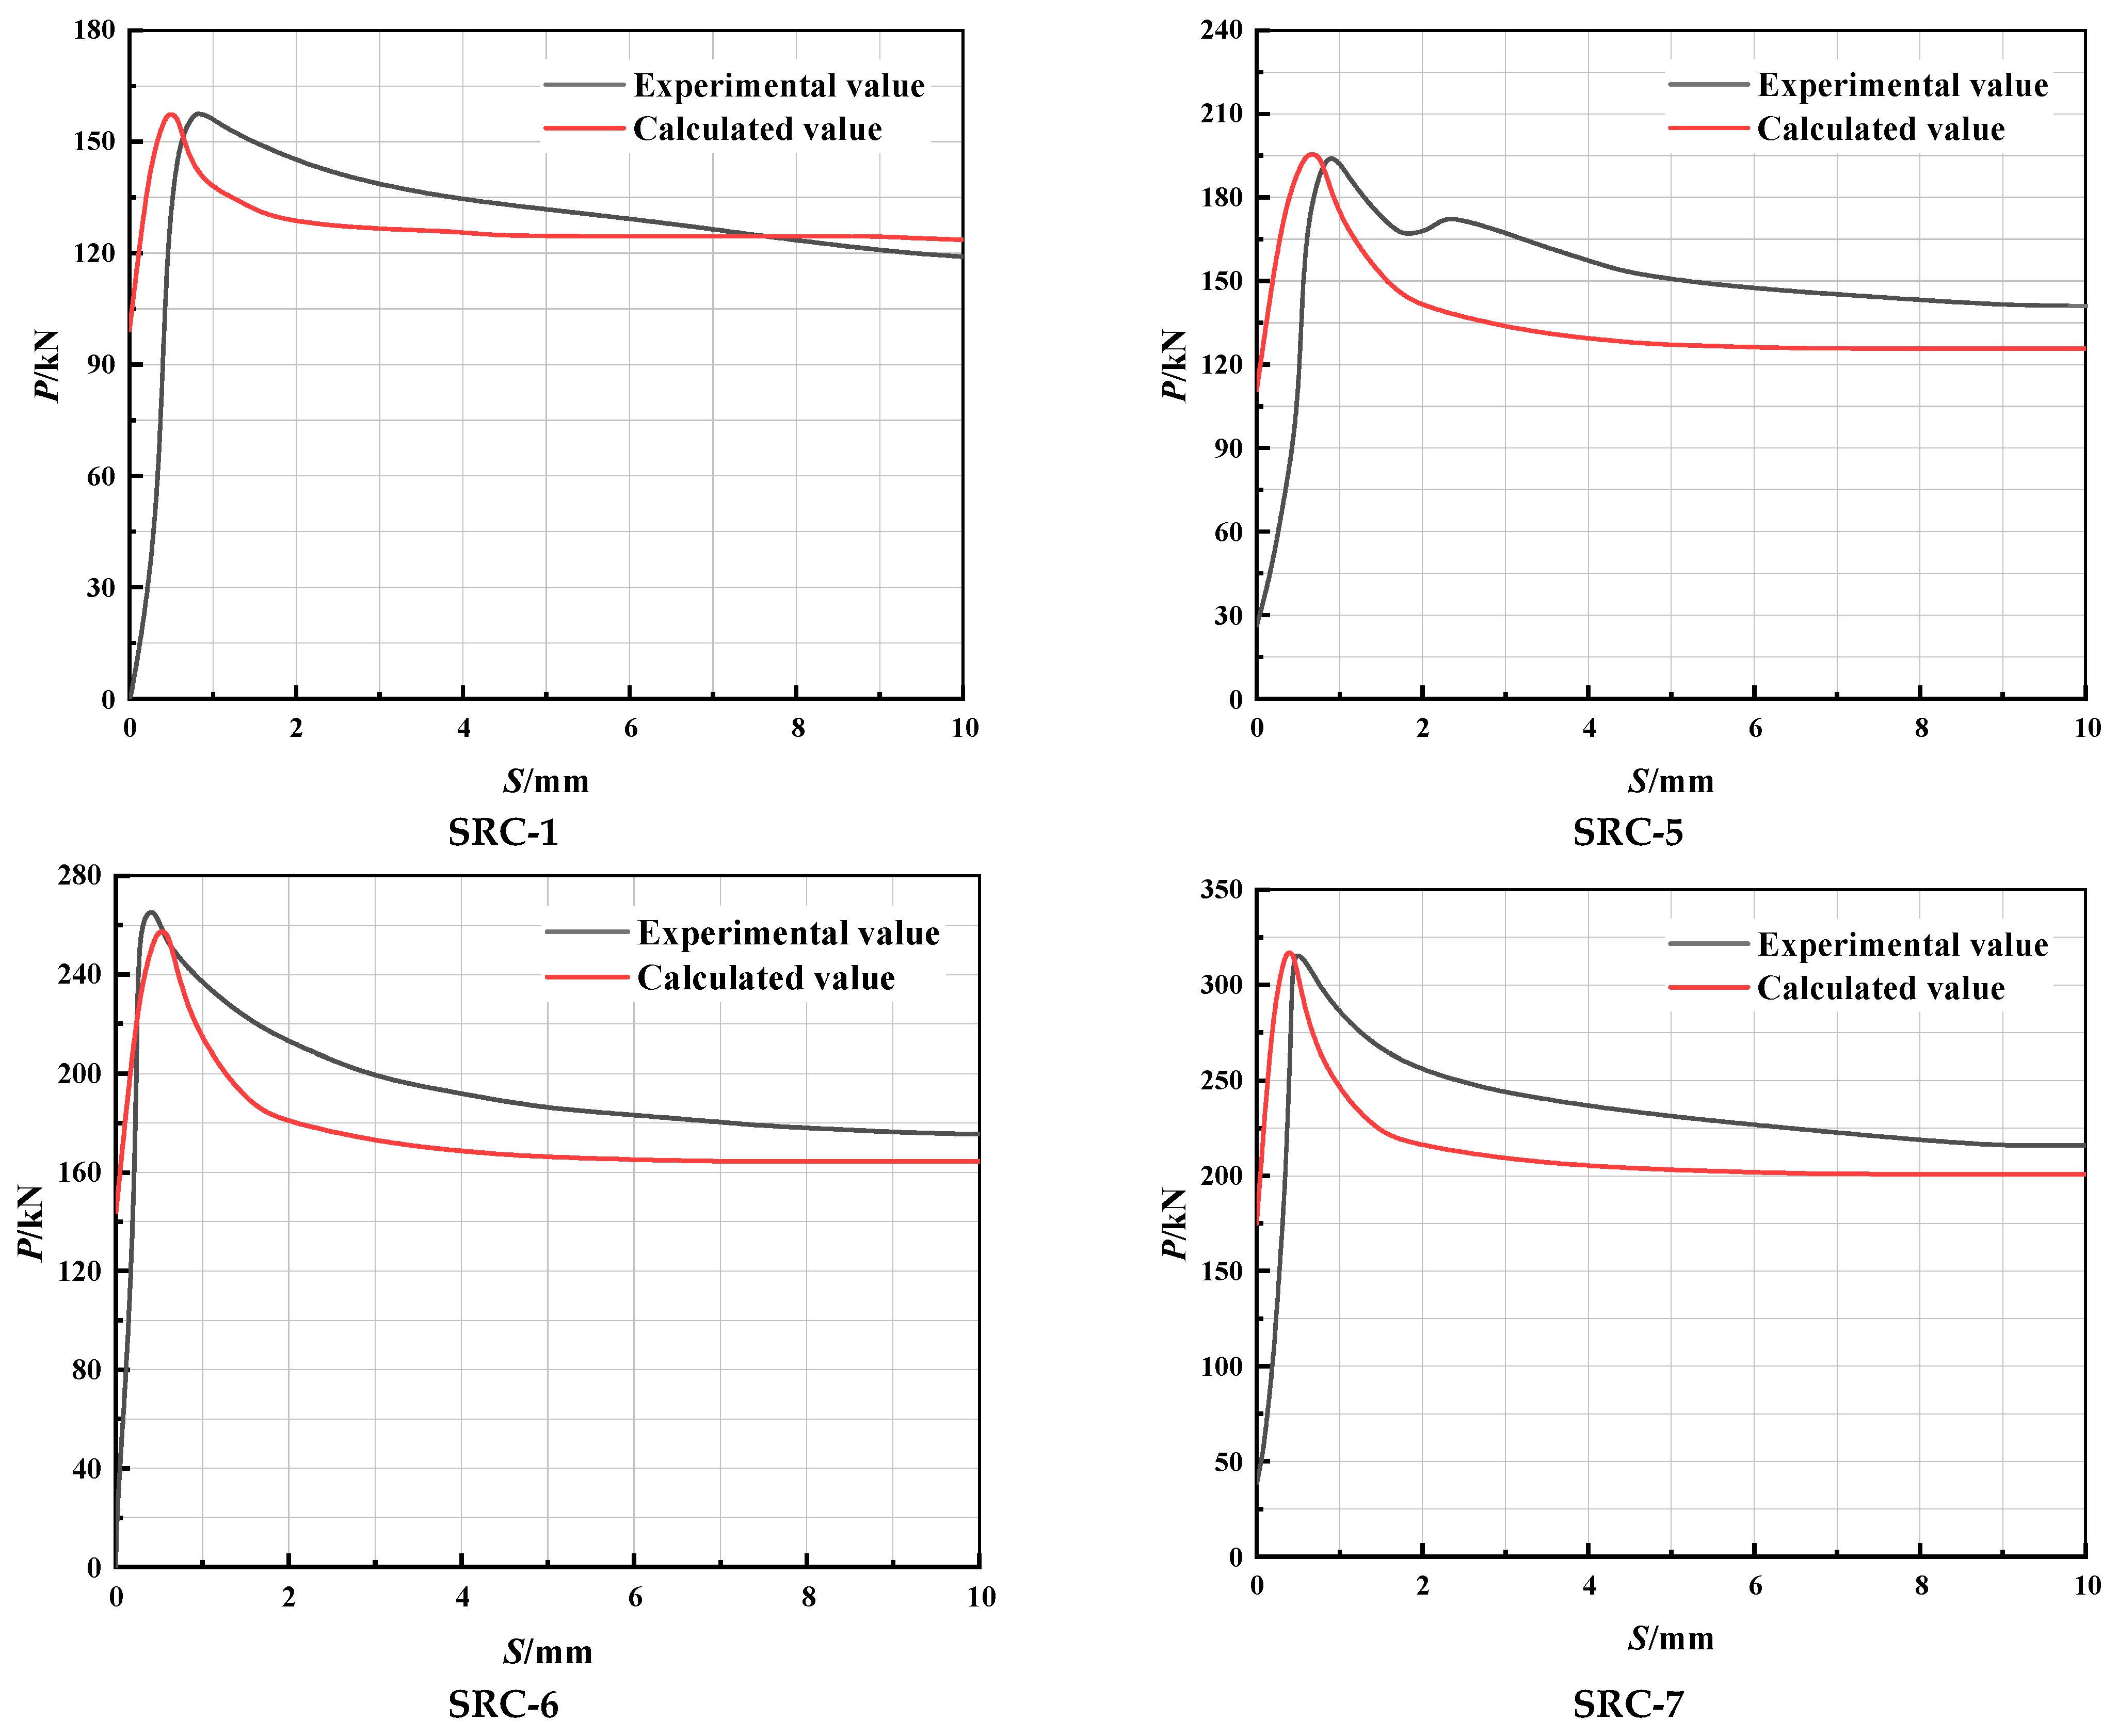
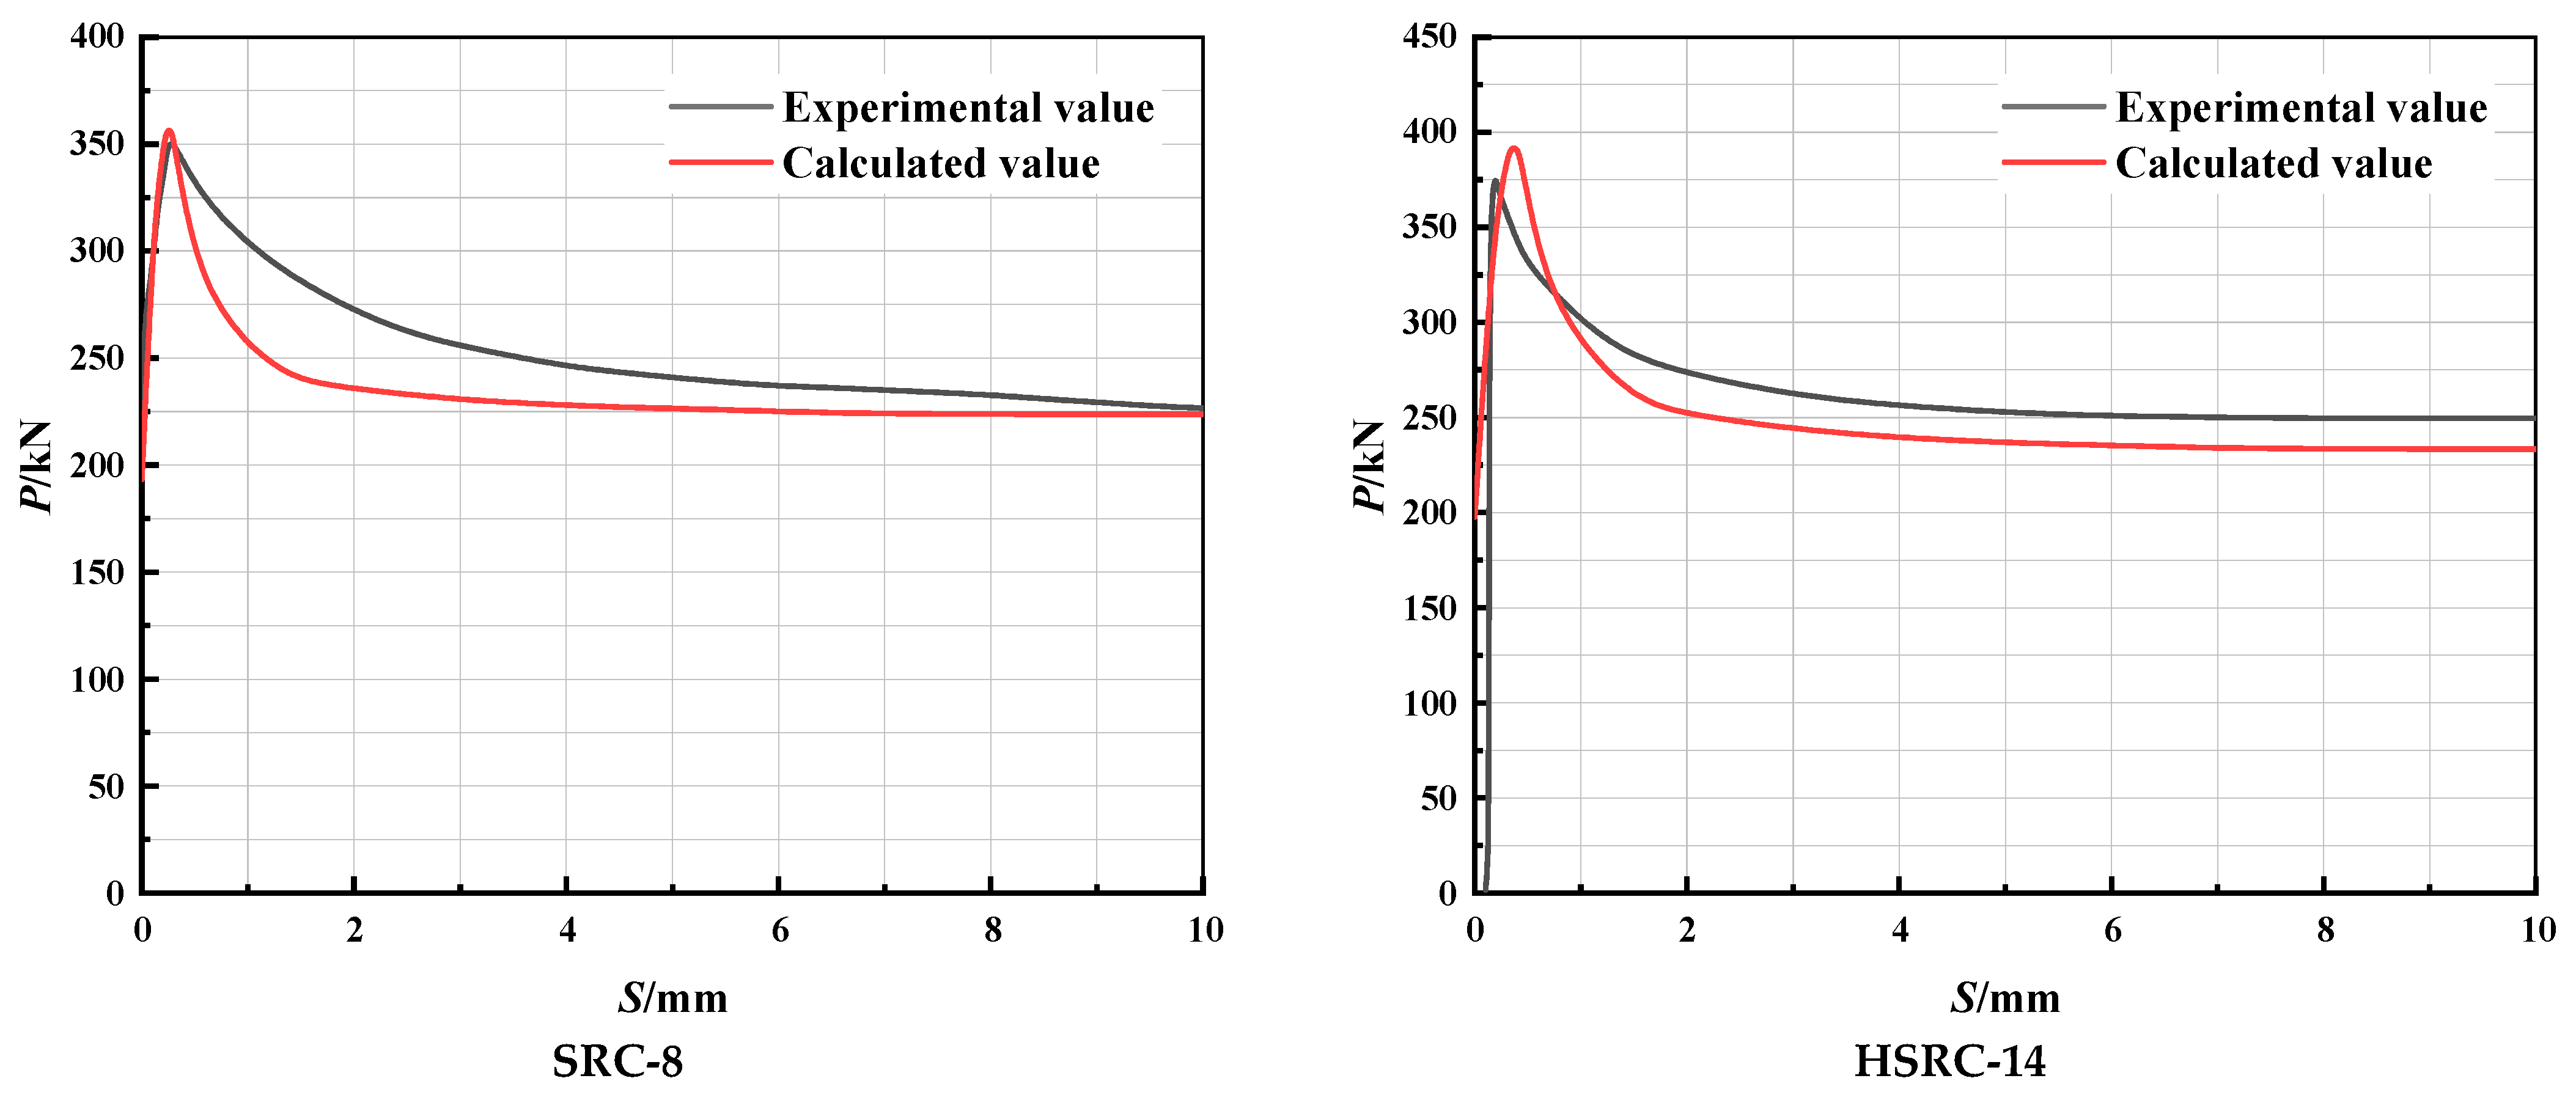
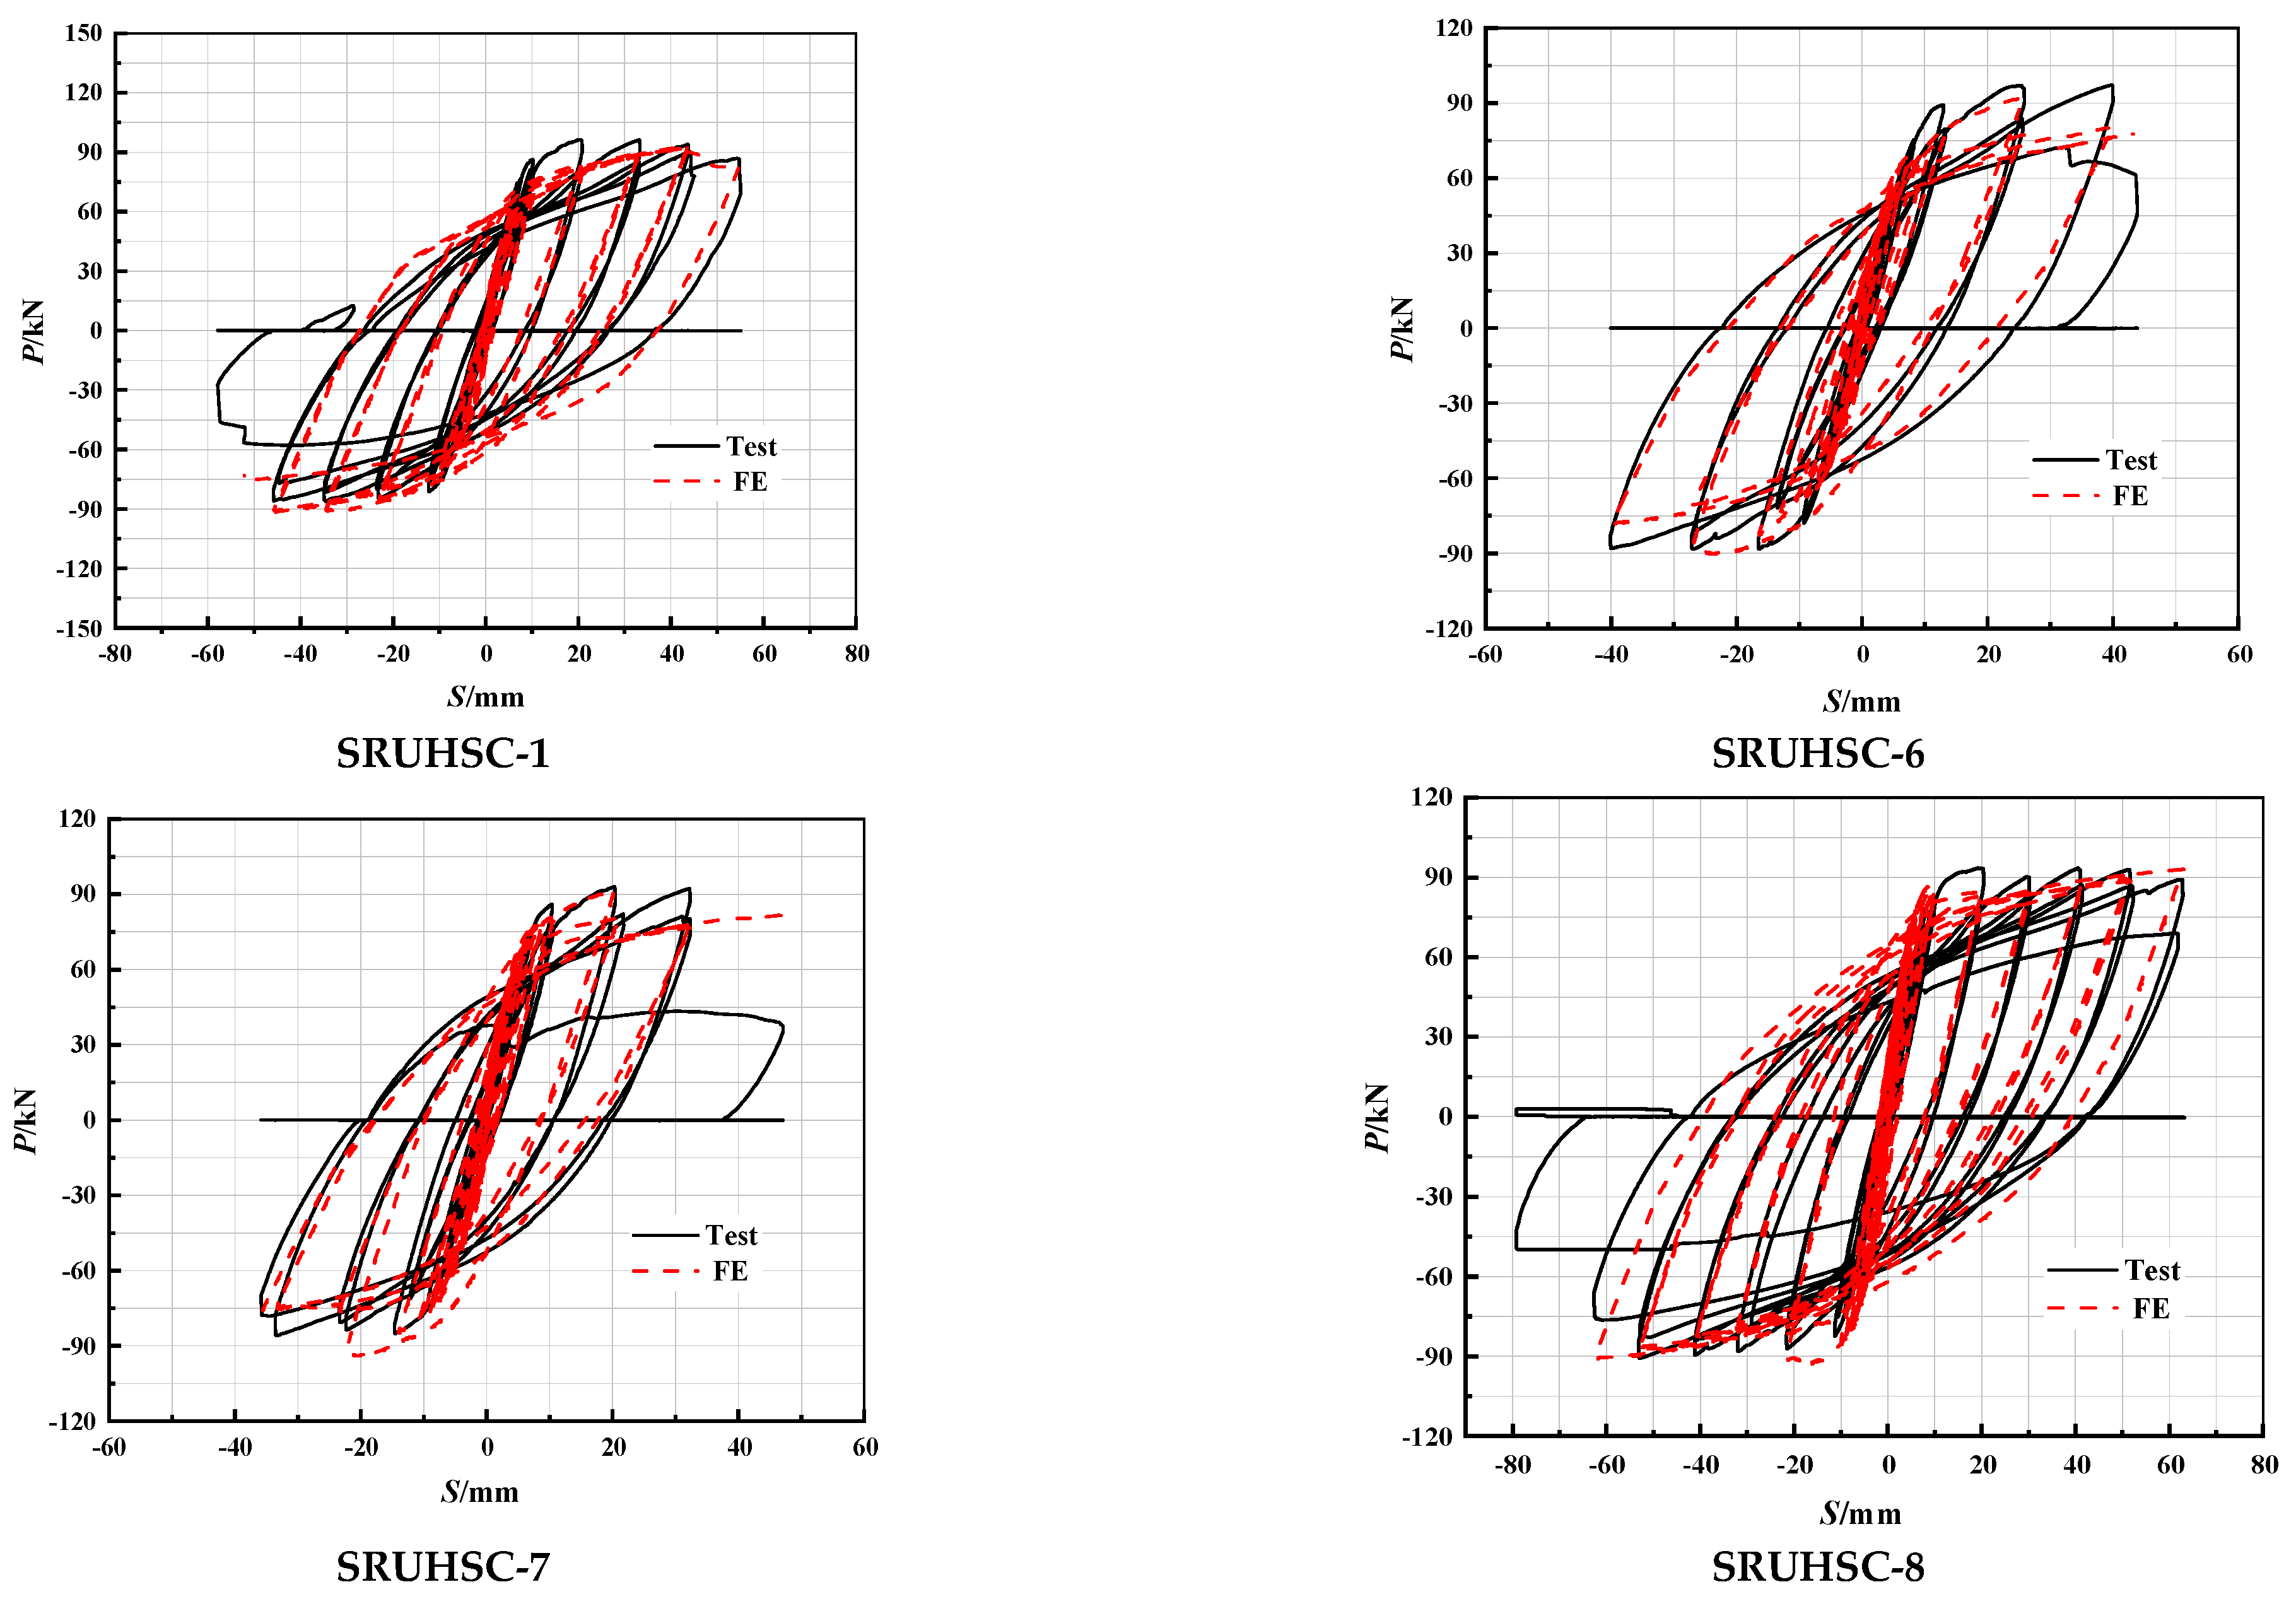
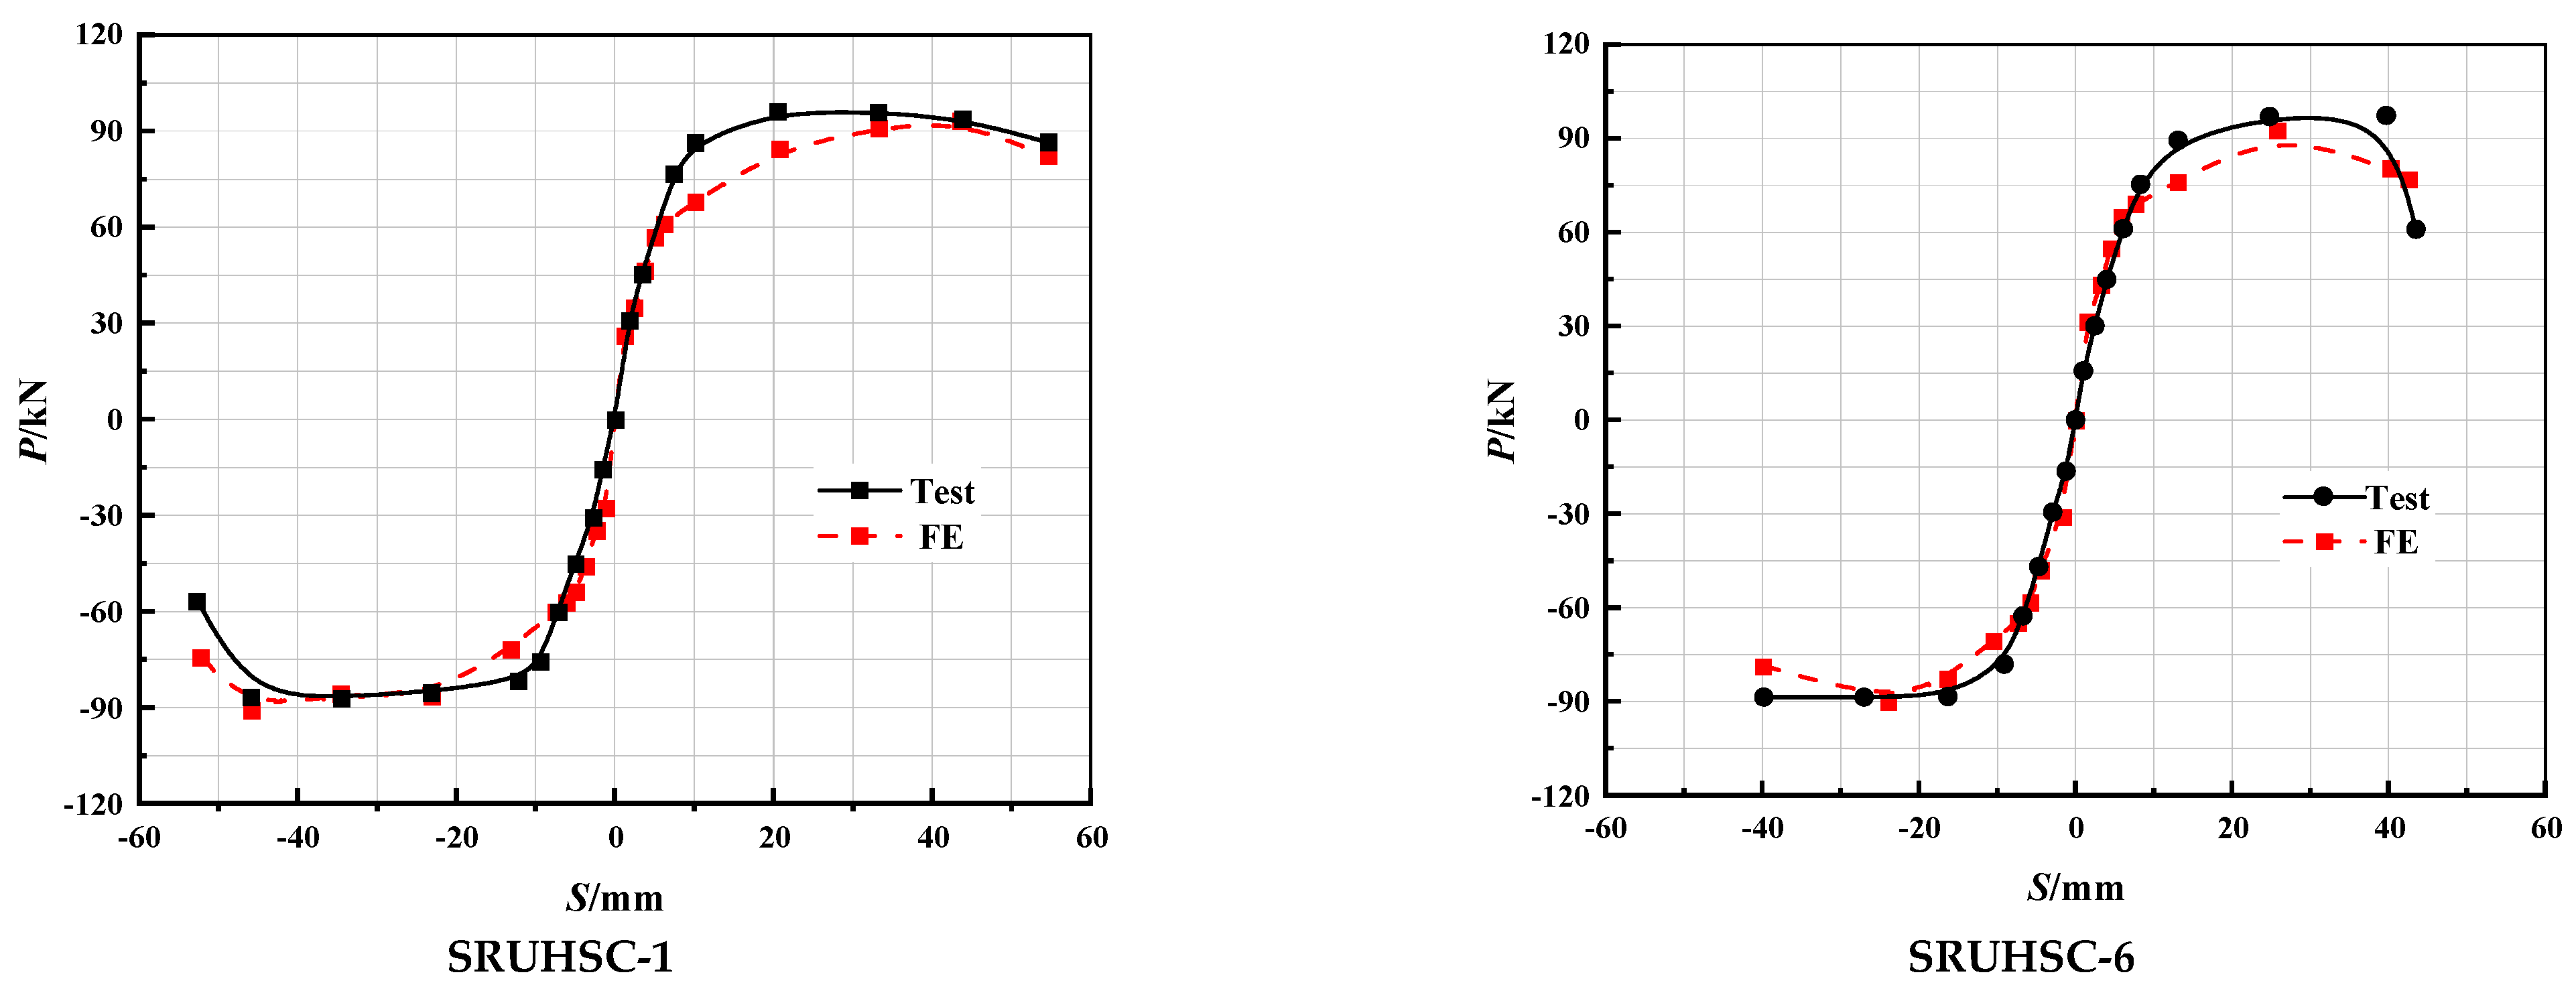
6.3. Finite Element Results

The finite element calculation results were compared with the test results. The load-displacement hysteresis curves obtained by the test and simulation of each specimen are shown in Figure 16.
The stiffness of the hysteresis curve obtained by finite element calculation is slightly less than the experimental results, which may be due to the idealized boundary conditions in finite element calculation.
The load-displacement skeleton curves obtained by test and simulation of each specimen are shown in Figure 17.
It is presented in Table 8 that the comparison results of the yield point, ultimate point, and failure point characteristics in the load-displacement skeleton curve between test and simulation results. The symbols P y , P m a x , and P u represent yield load, ultimate load, and failure load, respectively; while Δ y , Δ m a x and Δ u represent yield displacement, ultimate displacement, and failure displacement, respectively. As shown in Table 8, the finite element outcomes exhibit strong agreement with the experimental findings. Although there is a slightly larger error in the yield point load for specimen SRHSC-1, it remains within an acceptable range of engineering tolerance at less than 15%.

7. Conclusions

Through 14 groups of SRC specimens, this paper explored the impact of factors such as the strength grade of the concrete, the anchorage length, and the stirrup ratio on the bonding performance of high strength concrete. The conclusions were as follows.
(1)
The load-slip curves at the free end can be roughly divided into three stages: ascent stage, descent stage, and residual deformation stage.
(2)
The influence of the strength grade of the concrete on the bond strength between structural steels and concrete was significant. The ultimate bond strength accelerated with the increase in the concrete grade, and this effect was more pronounced in specimens with anchorage lengths of 200 mm and 300 mm.
(3)
The ultimate load grew with the increase in the anchorage length, while the ultimate bond stress decreased. The primary reason is that the relative distribution length of the high stress region on the junction stress diffusion length grows with the increase in the anchorage length. The distribution of the high stress region on the diffusion length of the bond stress is relatively reduced, while the resistance load is increased. There is no significant change in the effective area of bond strength, so there will be an increase in anchorage length and characteristic adhesion.
(4)
The bond-slip constitutive model fitted by the three-segment relationship can well describe the variation of the τ S curve of the structural steel and the high strength concrete.
(5)
The material constitutive model considering the effect of bond-slip is implanted into the software in the case of the ABAQUS finite element platform. The material is applied to the numerical simulation analysis of the SRHSC exterior joints. The rationality and accuracy of the new material are verified by comparing the simulation results with the test results.

Author Contributions

Conceptualization and methodology, W.L.; Software, J.G. All authors have read and agreed to the published version of the manuscript.

Funding

This research was funded by the National Natural Science Foundation of China (Grant: 51178078), the Natural Science Foundation of Science department of Liaoning Province (Grant: 2023-MSLH-002), Scientific Research Program of Education Department of Liaoning Province (Grant: LJKZ0721), Applied Research Project of Education Department of Liaoning Province. (Grant: QL202012), Basic Research Projects of Education Department of Liaoning Province. (Grant: LJKZ0718), Natural Science Foundation of LiaoNing Province (Grant: 2022-BS-276).

Data Availability Statement

Data supporting reported results can be found in publicly archived datasets analyzed during the study.

Conflicts of Interest

The authors declare no conflicts of interest.

Abbreviations

SymbolRepresentative MeaningUnit
τ ¯ 0 Initial bond strengthMPa
τ ¯ u Ultimate bond strengthMPa
τ ¯ r Residual bond strengthMPa
P 0 Initial loadkN
P u   Ultimate loadkN
P r Residual loadkN
l a Anchorage lengthmm
h a Web height of the I10 shaped steelmm
P External load appliedkN
C a Girth length of the shaped steel sectionmm
f c u Standard compressive strength of concrete cubMPa
h a Cross-section height of the shaped steelmm
S 0 Initial slipmm
S s u Control point slipmm
S u Limit state slipmm
S r Initial slipmm
A 1 Parameter of the ascending section-
α 1 Parameter of the descending section-
σ Compressive stress of concreteMPa
f c Compressive strength of concrete axisMPa
ε c Compressive strain of concrete-
ε 0 Peak compressive strain of concrete-
A 2 Ascending stage parameter-
α 2 Descending stage parameter-
f t Axial tensile strength of concreteMPa
ε t Tensile strain of concrete-
ε t p Peak tensile strain of concrete-
t , c Represent tensile and compressive concrete, respectively-
β Ratio of plastic and inelastic strain0.5~0.95 under tension, 0.35~0.7 under pressure
ε i n corresponding strain in the inelastic stage of concrete under tension and pressure-

References

  1. Liu, W. Study on Seismic Performance of Side Joints of Steel-Reinforced Ultra-High Strength Concrete Frame. Ph.D. Thesis, Dalian University of Technology, Dalian, China, 2017. [Google Scholar]
  2. Ding, F.X. Study on Mechanical Performance and Design Method of Circular Steel Tubular Concrete Structure; Central South University: Changsha, China, 2006. [Google Scholar]
  3. Fan, G.; Song, Y.; Wang, L. Experimental study on the seismic behavior of reinforced concrete beam-column joints under various strain rates. J. Reinf. Plast. Compos. 2014, 33, 601–618. [Google Scholar] [CrossRef]
  4. Asprone, D.; Frascadore, R.; Di Ludovico, M.; Prota, A.; Manfredi, G. Influence of strain rate on the seismic response of RC structures. Eng. Struct. 2012, 35, 29–36. [Google Scholar] [CrossRef]
  5. Bischoff, P.H.; Perry, S.H. Compressive behaviour of concrete at high strain rates. Mater. Struct. 1991, 24, 425–450. [Google Scholar] [CrossRef]
  6. Zheng, S.; Deng, G.; Tian, W.; Che, S.; Wang, Z. Study on the bond slip constitutive Relationship of steel reinforced concrete Structures. J. Harbin Inst. Technol. 2005, 37, 524–527. [Google Scholar]
  7. Jing, D.H.; Sun, X.C.; Krevaikas, T.; Shen, J.C. Load–slip behavior of steel bearing–square reinforced concrete column connection joints with adhesive bonding and self-locking. Eng. Struct. 2024, 311, 118181. [Google Scholar] [CrossRef]
  8. Zhang, L.; Zhou, T.; Zhang, Z.; Tao, H.; Tan, W.; Liang, Z. Study on the bond-slip behavior between steel bar and rammed earth. J. Build. Eng. 2024, 90, 109441. [Google Scholar] [CrossRef]
  9. Zhang, N.; Ju, T.F.; Qiu, R. Experimental study on the bond-slip behavior of steel tube-coal gangue concrete. Int. J. Press. Vessel. Pip. 2024, 209, 105209. [Google Scholar] [CrossRef]
  10. Sun, L.; Wang, C.; Zhang, C.W.; Yang, Z.Y.; Li, C.; Qiao, P.Z. Experimental investigation on the bond performance of sea sand coral concrete with FRP bar reinforcement for marine environments. Adv. Struct. Eng. 2023, 26, 533–546. [Google Scholar] [CrossRef]
  11. Shakir, Q.M.; Hanoon, H.K. New models for reinforced concrete precast hybrid deep beams under static loads with curved hybridization. Structures 2023, 54, 1007–1025. [Google Scholar] [CrossRef]
  12. Shakir, Q.M.; Hannon, H.K. Innovative Model of Precast RC Curved Hybrid Deep Beams Composed Partially with High-Performance Concrete. Arab. J. Sci. Eng. 2024, 49, 6045–6060. [Google Scholar] [CrossRef]
  13. Yu, F.; Wu, C.; Xu, B.; Guan, Y.; Zhu, X.; Fang, Y. Study on shear bearing capacity of PVC-CFRP confined concrete column-RC beam exterior joint with core steel tube. Constr. Build. Mater. 2024, 410, 134197. [Google Scholar] [CrossRef]
  14. Yang, L.; Ye, M.; Huang, Y.; Dong, J. Study on Mechanical Properties of Displacement-Amplified Mild Steel Bar Joint Damper. Iran. J. Sci. Technol.-Trans. Civ. Eng. 2023, 1–14. [Google Scholar] [CrossRef]
  15. Nicoletti, V.; Quarchioni, S.; Tentella, L.; Martini, R.; Gara, F. Experimental Tests and Numerical Analyses for the Dynamic Characterization of a Steel and Wooden Cable-Stayed Footbridge. Infrastructures 2023, 8, 100. [Google Scholar] [CrossRef]
  16. Luo, Y.; Liu, X.; Chen, F.; Zhang, H.; Xiao, X. Numerical Simulation on Crack-Inclusion Interaction for Rib-to-Deck Welded Joints in Orthotropic Steel Deck. Metals 2023, 13, 1402. [Google Scholar] [CrossRef]
  17. Aghabagloo, M.; Carreras, L.; Barahona, M.; Barris, C.; Baena, M. Experimental study and numerical prediction of the bond-slip law for concrete elements strengthened with FRP using metaheuristic algorithm. Constr. Build. Mater. 2024, 411, 134712. [Google Scholar] [CrossRef]
  18. Wang, W.; Mi, J.; Zhu, B.; Chen, Y.; Xu, J.; Jia, Y. Study on bond-slip mechanism and interface shear transfer of corrugated web PEC columns with studs. Constr. Build. Mater. 2024, 413, 134899. [Google Scholar] [CrossRef]
  19. Zhang, J.; Meng, X.; Song, J.; Cao, X.; Ma, K. Push-out tests of interfacial bond slip between H-shaped steel and ultra-high performance concrete. Structures 2023, 57, 105268. [Google Scholar] [CrossRef]
  20. Saikali, R.E.; Pantazopoulou, S.J.; Palermo, D. Local Bond-Slip Behavior of Reinforcing Bars in High- Performance Steel Fiber-Reinforced Concrete Beams. ACI Struct. J. 2022, 119. [Google Scholar] [CrossRef]
  21. Zhang, G.; Han, Q.; Xu, K.; Du, X.; He, W. Quasi-static tests of CFST embedded RC column-to-precast cap beam with socket connection. Eng. Struct. 2021, 241, 112443. [Google Scholar] [CrossRef]
  22. Zhang, G.; Han, Q.; Xu, K.; Song, Y.; Li, Z.; Du, X. Parameter analysis and design on socket CFST column-cap beam joint with UHPC grouted connection. Eng. Struct. 2023, 292, 116528. [Google Scholar] [CrossRef]
  23. Chen, S.; Zhang, R.; Jia, L.J.; Wang, J.Y.; Gu, P. Structural behavior of UHPC filled steel tube columns under axial loading. Thin Walled Struct. 2018, 130, 550–563. [Google Scholar] [CrossRef]
  24. Gan, D.; Zhou, Z.; Zhou, X. Experimental Behavior of Square Tubed-Reinforced-Concrete Column to RC Beam Joints with Internal Diaphragms under Cyclic Loading. Key Eng. Mater. 2018, 763, 779–786. [Google Scholar] [CrossRef]
  25. Yang, D.; Wu, Z.; Zuo, R.; Li, J.; Xie, H.; Zhang, Y. Quasi-static testing of UHPC cupped socket piers-footing connection and its seismic fragility analysis under near-fault ground motions. Sci. Rep. 2024, 14, 10903. [Google Scholar] [CrossRef] [PubMed]
  26. Chen, L.; Wang, S.; Yin, C.; Li, S. Experimental study on constitutive relationship between checkered steel and concrete. Constr. Build. Mater. 2019, 210, 483–498. [Google Scholar] [CrossRef]
  27. Bai, G.; Ma, J.; Liu, B.; Chen, X. Study on the interfacial bond slip constitutive relation of I-section steel and fully recycled aggregate concrete. Constr. Build. Mater. 2020, 238, 117688. [Google Scholar] [CrossRef]
  28. Mahin, S.A.; Bertero, V.V. Rate of Loading Effects on Uncracked and Repaired Reinforced Concrete Members, Report No. EERC 72-9; Earthquake Engineering Research Center, University of California at Berkeley: Berkeley, CA, USA, 1972. [Google Scholar]
  29. Chung, L.; Shah, S.P. Effect of loading rate on anchorage bond and beam-column joints. ACI Struct. J. 1989, 86, 132–142. [Google Scholar]
  30. Kitajima, K.; Koizumi, T.; Akiyama, H.; Kanda, M.; Nakanishi, M.; Adachi, H. Response characteristics of reinforced concrete columns under bi-directional earthquake motions. In Proceedings of the 10th World Conference on Earthquake Engineering, Madrid, Spain, 19–24 July 1992. [Google Scholar]
  31. Inoue, N.; Wenliuhan, H.; Kanno, H.; Hori, N.; Ogawa, J. Shaking table tests of reinforced concrete columns subjected to simulated input motions with different time durations. J. Struct. Eng. 2000, 45, 313–320. [Google Scholar]
  32. Lee, W.; Lin, C.; Liu, T. Impact and fracture response of sintered 316L stainless steel subjected to high strain rate loading. Mater. Charact. 2007, 58, 363–370. [Google Scholar] [CrossRef]
  33. Li, J.H.; Xue, J.Y.; Wang, X.T. Experimental study on bond slip performance of steel reinforced concrete column under repeated load. Eng. Mech. 2009, 26, 98–104. [Google Scholar]
  34. Sun, Y.J.; Wu, T.; Liu, X. Calculation method of crack width of steel fiber light aggregate concrete beams with FRP bars based on bonding and sliding. Eng. Mech. 2022, 39, 34–44. [Google Scholar]
  35. Rodríguez-Martínez, J.A.; Rusinek, A.; Klepaczko, J.R. Constitutive relation for steels approximating quasi-static and intermediate strain rates at large deformations. Mech. Res. Commun. 2009, 36, 419–427. [Google Scholar] [CrossRef]
  36. Fan, G.; Song, Y. Effect of axial compression ratio on dynamic mechanical properties of RC beam–column joints. Mag. Concr. Res. 2014, 66, 1219–1236. [Google Scholar] [CrossRef]
  37. Yang, Y. Research on Basic Theory and Application of Bond Slip of Shaped Steel Concrete. Ph.D. Tthesis, Xi’an University of Architecture and Technology, Xi’an, China, 2003. [Google Scholar]
  38. GB50010-2010; Code for Design of Concrete Structures. PRC National Standard: Beijing, China, 2010.
  39. CAE Application Alliance; Zhang, J. ABAQUS 6.12 Finite Element Analysis from Beginners to Proficient; China Machine Press: Beijing, China, 2014. [Google Scholar]
Figure 1. Technical route.
Buildings 14 01747 g001
Figure 2. Layout of strain gauges.
Buildings 14 01747 g002
Figure 3. Loading device.
Buildings 14 01747 g003
Figure 4. Specimen failure modes.
Buildings 14 01747 g004aBuildings 14 01747 g004b
Figure 5. Load-slip curves of specimens under different anchoring lengths: (a) the concrete strength grade is C30; (b) the concrete strength grade is C60; (c) the concrete strength grade is C80.
Buildings 14 01747 g005
Figure 6. Load-slip curve of concrete with different strengths at 300 mm anchorage length.
Buildings 14 01747 g006
Figure 7. Load-slip curves of specimens with different stirrup spacing.
Buildings 14 01747 g007
Figure 8. Effect of concrete strength on characteristic bond strength: (a) The anchorage length is 200 mm; (b) The anchorage length is 300 mm; (c) The anchorage length is 400 mm; (d) The anchorage length is 500 mm.
Buildings 14 01747 g008
Figure 9. Effect of stirrup ratio on characteristic bond strength: (a) The anchorage length is 300 mm; (b) The anchorage length is 400 mm.
Buildings 14 01747 g009
Figure 10. Effect of anchorage length on characteristic bond strength: (a) The concrete strength grade is C30; (b) The concrete strength grade is C60; (c) The concrete strength grade is C80.
Buildings 14 01747 g010
Figure 11. Relation between S u   and anchorage length and concrete grade.
Buildings 14 01747 g011
Figure 12. Relation between S r   and anchorage length and concrete grade.
Buildings 14 01747 g012
Figure 13. Mathematic model of the constitutive relation of τ S .
Buildings 14 01747 g013
Figure 14. Comparison between test curve and calculated curve.
Buildings 14 01747 g014aBuildings 14 01747 g014b
Figure 15. The 3D finite element model.
Buildings 14 01747 g015
Figure 16. Hysteresis curve of each specimen.
Buildings 14 01747 g016
Figure 17. Skeleton curves of each specimen.
Buildings 14 01747 g017aBuildings 14 01747 g017b
Table 1. Design parameters.
Specimen NumberConcrete Grade/MPaStirrup Spacing/mmb × h/mmAnchorage Length/mm
SRC-1C306@120200 × 200200
SRC-2C306@120200 × 200300
SRC-3C306@120200 × 200400
SRC-4C306@120200 × 200500
SRC-5C606@120200 × 200200
SRC-6C606@120200 × 200300
SRC-7C606@120200 × 200400
SRC-8C606@120200 × 200500
SRC-9C806@80200 × 200300
SRC-10C806@80200 × 200400
SRC-11C806@120200 × 200200
SRC-12C806@120200 × 200300
SRC-13C806@120200 × 200400
SRC-14C806@120200 × 200500
Table 2. Mix proportion of C30 and C60.
CementSlag PowderFly AshArtificial SandRiver SandCobbleAdmixtureWater
C301.000.280.282.351.564.240.0440.78
C601.000.160.161.360.482.210.0330.41
Table 3. Mix proportion of C80.
CementSilica PowderFly AshWaterWater Reducing AgentCobbleSilica Sand
C8010.140.280.330.022.751.18
Table 4. Characteristic value of test piece.
Specimen ID P 0 /KN P u /KN P r /KN τ ¯ 0 /MPa τ ¯ u /MPa τ ¯ r /MPa
SRC-1109.98152.67123.941.201.661.35
SRC-2121.48211.71144.460.881.531.05
SRC-3155.80266.63177.290.851.450.96
SRC-4183.18349.66211.600.791.520.92
SRC-5125.58189.35141.181.362.051.53
SRC-6159.60264.30177.291.161.921.28
SRC-7193.71315.19215.871.051.711.17
SRC-8227.36357.05233.930.991.551.02
SRC-9167.44264.30177.291.211.921.28
SRC-10194.75343.10212.591.061.861.15
SRC-11109.31239.20128.801.182.601.41
SRC-12146.92338.63186.321.062.501.35
SRC-13190.60381.52254.451.032.071.38
SRC-14216.20412.70283.630.941.791.23
Note: P represents the external load applied during the test, the unit kN. The test structural steel size is I10, so the circumference length is 460 mm. The characteristic bond strength values of each specimen are shown in Table 5. The initial bond strength τ ¯ 0 , ultimate bond strength τ ¯ u , and residual bond strength τ ¯ r correspond to the bond stress of P 0 , P u   and P r , respectively.
Table 5. Calculated and tested characteristic bond strength.
Test PieceCharacteristic Bond StrengthTest Value/MPaCalculated Value/MPaTest Value/Calculated Value
SRC-1 τ 0 1.201.131.06
τ u 1.661.760.94
τ r 1.351.261.07
SRC-2 τ 0 0.881.010.87
τ u 1.531.600.96
τ r 1.051.140.92
SRC-3 τ 0 0.850.910.93
τ u 1.451.431.01
τ r 0.961.020.94
SRC-4 τ 0 0.790.800.99
τ u 1.521.271.19
τ r 0.920.911.01
SRC-5 τ 0 1.361.221.11
τ u 2.052.110.97
τ r 1.531.391.10
SRC-6 τ 0 1.161.101.05
τ u 1.921.950.98
τ r 1.281.281.00
SRC-7 τ 0 1.051.001.05
τ u 1.711.780.96
τ r 1.171.161.00
SRC-8 τ 0 0.990.891.11
τ u 1.551.610.96
τ r 1.021.040.98
SRC-9 τ 0 1.211.161.04
τ u 1.922.180.88
τ r 1.281.370.93
SRC-10 τ 0 1.061.051.01
τ u 1.862.020.92
τ r 1.151.270.91
SRC-11 τ 0 1.181.270.93
τ u 2.602.341.11
τ r 1.411.490.95
SRC-12 τ 0 1.061.160.91
τ u 2.502.181.14
τ r 1.351.370.98
SRC-13 τ 0 1.031.050.98
τ u 2.072.021.02
τ r 1.381.271.09
SRC-14 τ 0 0.940.950.99
τ u 1.711.850.92
τ r 1.231.141.08
Table 6. Verification u with previous studies (calculated from Yang [37]).
Test PieceCharacteristic Bond StrengthTest Value/MPaCalculated Value/MPaTest Value/Calculated Value
SRC-5 τ 0 0.840.681.23
τ u 1.321.231.07
τ r 0.970.811.19
SRC-9 τ 0 0.700.461.52
τ u 1.080.821.32
τ r 0.580.551.05
SRC-11 τ 0 1.300.851.53
τ u 1.431.411.01
τ r 0.850.970.88
Table 7. CDP model parameter table.
Expansion Angle ρEccentricity f b 0 / f c 0 k Coefficient of Viscosity
300.11.160.6670.0005
Table 8. Comparison of characteristic points between test and simulation.
Test PieceTypeYield PointLimiting PointFailure Point
P y / k N Δ y / m m P m a x / k N Δ m a x / m m P u / k N Δ u / m m
SRUHSC-1Test86.2910.9896.3620.2886.9255.5
FE75.8810.4285.6420.4182.4754.6
SRUHSC-6Test86.0210.8597.0524.8882.4942.00
FE76.6111.6892.0025.6580.5539.98
SRUHSC-7Test79.4111.692.9920.379.0438.00
FE78.7810.1391.9120.2677.9232.25
SRUHSC-8Test86.6111.493.2620.3479.2762.37
FE85.129.8785.6219.9792.0662.72
Disclaimer/Publisher’s Note: The statements, opinions and data contained in all publications are solely those of the individual author(s) and contributor(s) and not of MDPI and/or the editor(s). MDPI and/or the editor(s) disclaim responsibility for any injury to people or property resulting from any ideas, methods, instructions or products referred to in the content.

