Article

Correlation Study of Commercial Street Morphology and Pedestrian Activity in Cold Region Summers under Thermal Comfort Guidance: A Case Study of Sanlitun, Beijing

1
School of Architecture and Design, Hebei University of Engineering, Handan 056038, China
2
School of Architecture, Tianjin University, Tianjin 300072, China
*
Author to whom correspondence should be addressed.
Buildings 2024, 14(6), 1751; https://doi.org/10.3390/buildings14061751
Submission received: 4 May 2024 / Revised: 31 May 2024 / Accepted: 3 June 2024 / Published: 11 June 2024
(This article belongs to the Section Architectural Design, Urban Science, and Real Estate)

Abstract

:
Pedestrian vitality in commercial streets is influenced by various factors, among which the spatial form of the street and the resulting thermal environment have a significant impact. This study, from the perspective of thermal comfort, combines thermal comfort simulation with pedestrian simulation to establish an optimization model based on pedestrian vitality. The model aims to analyze and quantify the impact of street spatial form on thermal comfort and pedestrian vitality, providing a comprehensive evaluation of optimization schemes for commercial street spaces. Firstly, the study identifies the levels of spatial design parameters for commercial streets and generates optimized design scenarios for commercial street spaces. Using the simulation platforms Rhino 7 Grasshopper and MATLAB R2023a, a pedestrian simulation model guided by thermal comfort is constructed and validated against empirical data. Next, the influence of commercial street spatial design parameters on store visitations is assessed, identifying the most critical design parameters. Finally, design strategies for commercial streets are proposed based on vitality-oriented layouts. The results indicate that the spatial form of the street significantly affects store visitations, with the street width-to-height ratio being the most influential factor, followed by street orientation and interface form. NW-SE-oriented streets show a 47.2% higher Total Store Visitations (TSV) value compared to E-W-oriented streets, while E-W streets exhibit a Differential Store Visitation (DSV) value 4.47 times that of NW-SE streets. Streets with a W/H ratio of 0.25 have a 54.9% higher Total Store Visitations value than those with a W/H ratio of 0.9, and streets with a W/H ratio of 0.65 exhibit a Differential Store Visitations value 1.21 times that of streets with a W/H ratio of 0.25. Considering overall street vitality, the study recommends NW-SE- and NE-SW-oriented streets, with a width-to-height ratio between 0.25 and 0.4. The study also proposes strategies for the modification and expansion of streets in different orientations, providing the scientific basis and optimization recommendations for the planning and renovation of commercial streets in cold regions during summer.

1. Introduction

Rapid urbanization has exacerbated the urban heat island (UHI) effect, significantly altering the thermal environment within cities and profoundly impacting human behavior and health [1]. Increasing evidence suggests that extreme high temperatures during summer are becoming more frequent globally, even under moderate climate scenarios [2]. The UHI effect decreases the utilization of urban public spaces, reducing pedestrian activity and willingness to linger [3], and can lead to heat-related illnesses such as heatstroke and respiratory and cardiovascular diseases. In severe cases, this can result in fatalities; for instance, the summer heatwaves in Europe have caused over 70,000 deaths due to stroke or acute hypertension and other heat-related conditions [4], increasing urban residents’ vulnerability [5]. Additionally, when heat waves last longer than four days, the risk of death rises by 11% [6]. Projections indicate that 90% of this increase will occur in tropical and subtropical climates in regions such as Africa and Asia [7], underscoring the urgent need to address urban thermal environment issues. In cities like Athens, temperature differences between urban areas and surrounding rural regions can reach up to 15 °C during extreme weather events [8]. In China, urban building thermal design must align with regional climates. The “Thermal Design Code for Civil Buildings” (GB 50176-2016) classifies the country into five thermal design climate regions: severe cold regions, cold regions, hot summer and cold winter regions, hot summer and warm winter regions, and mild regions. Cold regions cover the second-largest area after severe cold regions [9]. In recent years, the frequency and intensity of extreme hot weather in summer have increased year by year, especially in areas with rapid urbanization such as Beijing, where the heat island effect is obvious. By 2020, the number of high-temperature days greater than or equal to 35 °C in Beijing showed an extremely significant increase (p ≤ 0.01), ranging from 1 to 26 days, with an annual average of 8.7 days. The annual end time of high-temperature days has been significantly delayed and the timespan has been significantly extended, and the overall end time of high temperature has been delayed by 36 days in the past 40 years [10]. However, current building designs in cold regions predominantly focus on winter insulation and wind protection, with insufficient attention to the summer outdoor thermal environment. This has resulted in relatively few shading measures in outdoor spaces, leading to a poor pedestrian experience [11].
Thermal comfort in outdoor spaces is more susceptible to impact due to exposure to sunlight, making cooling challenging. Currently, outdoor thermal comfort is commonly assessed using indices such as Physiologically Equivalent Temperature (PET) and the Universal Thermal Comfort Index (UTCI). These indices evaluate how the outdoor thermal environment affects pedestrians’ comfort perception, which directly influences their participation, satisfaction, and route choices during outdoor activities. This is closely related to the intensity and distribution of pedestrian vitality on streets [12], with extensive research indicating that PET is more widely applied in evaluating thermal environments [13]. When outdoor conditions are unfavorable or harmful to pedestrians and workers, various measures can be implemented to improve thermal comfort. Adjusting neighborhood spatial layouts [14], street space forms, interface forms [15], and plant configurations [16] can block excessive solar radiation, reduce human thermal stress, enhance the attractiveness of public spaces, and increase the willingness of people to stay, thus invigorating the street atmosphere [17].
Recent advancements in computer technology have facilitated the development of thermal environment and pedestrian simulation techniques. These allow for the rapid construction of pedestrian movement models across different scales and scenarios, enabling the analysis of the relationship between the layout of commercial street elements and consumer behavior patterns. This provides a unique perspective for the redesign of commercial streets, making designs more rational and user-friendly. The integration of Wi-Fi probe technology for pedestrian flow measurement [18] and MATLAB pedestrian simulation techniques [19] allows for the analysis and verification of existing issues in commercial streets. This helps explore the relationship between human internal needs, behavioral demands, and the physical environment, providing entry points and technical support for commercial street updates.
This study proposes a pedestrian vitality simulation model based on thermal comfort needs, utilizing the Grasshopper and MATLAB platforms. The model’s validity is verified through comparative analysis with empirical data from Beijing’s Sanlitun area. The study analyzes and evaluates the impact of different spatial forms of commercial streets on pedestrian vitality, aiming to improve outdoor thermal comfort and pedestrian vitality simulation research. This is intended to enhance visitor experience and satisfaction, providing designers and urban planners with a tool to evaluate outdoor thermal comfort and spatial vitality. The findings offer scientific basis and optimization suggestions for the planning and renovation of commercial streets in cold regions, with significant theoretical and practical implications for enhancing the commercial value of these streets.

2. Literature Review

2.1. Street Spatial Form and Vitality

Research on the relationship between the spatial form and pedestrian behavior of existing commercial streets often starts from the recognizability, accessibility, and linger ability of the streets. By employing methods such as questionnaire surveys and on-site measurements, scholars analyze the impact of various aspects of commercial street morphology, such as the ground-floor commercial interface [20], street facade [21], and shading forms [22], on pedestrians’ dwell time and vitality distribution. Additionally, researchers have conducted longitudinal studies on changes in consumer behavior on commercial streets in Beijing, Shanghai, and Nanjing, summarizing the relationship between consumer behavior changes and background changes on commercial streets. They have also established pedestrian discrete choice models to study factors influencing pedestrian behavior choices [23]. However, the impact of commercial street space on pedestrian behavior extends beyond the physical space itself to include the thermal environment it generates and the consequent effects on human physiology, psychology, and resulting behavior choices. Thermal comfort, based on the human heat balance equation and considering meteorological parameters and human parameters (such as height, weight, age, activity level, clothing thermal resistance, etc.), comprehensively evaluates the human perception of the environment’s thermal conditions by considering the thermal conduction process between the human body and the outdoor environment. Reasonable street space configuration can not only increase summer shading effects and reduce solar radiation entry, but also improve the thermal environment, enhance pedestrian vitality and dwell time, increase purchasing desire, and improve pedestrian comfort in the environment. Studies have shown that changing the size and angle of shading devices can alter the street’s thermal environment and enhance street thermal comfort [24]. There is a strong correlation between outdoor attendance, temperature, average radiation temperature, and thermal comfort. Adjustments to spatial form significantly affect the street’s thermal environment, thus playing a crucial role in pedestrian vitality and layout. Studies by Kim [25], Martinelli [26], and their colleagues have indicated that microclimate parameters affect residents’ thermal perception, thereby significantly influencing attendance in public spaces. The study evaluated the relationship between daily shading patterns, attendance, and thermal comfort during the summer at San Silvestro Square in Rome. At 6:00 PM, the square’s attendance is approximately 10.8 times that at noon, with a difference of 98 people. The number of pedestrians in shaded areas with significantly lower PET values is 3–8 times higher than in non-shaded areas. There is also a correlation between thermal comfort and pedestrian behavior, emphasizing the importance of adjusting spatial forms to improve the thermal environment. These research findings provide a theoretical basis for studying the relationship between commercial street space and pedestrians and offer valuable background and support for the spatial vitality layout focused on in this study. Incorporating these discoveries into a literature review helps underscore the importance of existing research and its insights for current studies.

2.2. Pedestrian Vitality Simulation

In pedestrian thermal comfort simulation, current research primarily focuses on public activity areas such as parks, plazas, and residential areas, utilizing platforms such as computational fluid dynamics (CFD), ENVI-met, Fluent, and Grasshopper for simulation optimization. Rhino 7 Grasshopper software is widely chosen due to its integration of parametric modeling and physical environment simulation. Hsing-Yu’s verification of Grasshopper’s simulation of computational fluid dynamics (PET) reliability through simulating the impact of shading structure orientation and size on thermal comfort supports the selection of this software for thermal environment simulation in this study [27]. From the consumer perspective, pedestrian simulation of commercial buildings has become a current research hotspot in studying street spatial vitality. The theoretical research on pedestrian simulation models in academia is mainly divided into two aspects: models based on Gustave Le Bon’s crowd psychology theory and fluid mechanics, and models based on stochastic utility theory, social forces, and rules. Among these, the research on pedestrian simulation models in commercial streets often adopts the latter theory, investigating the influence of commercial street spatial morphology and store attractiveness on pedestrian trajectories. For instance, Wang et al. analyze the regularities of consumer path selection behavior in commercial complexes using mathematical statistical models and construct pedestrian models to estimate the impact of environmental changes on consumer behavior [21]. Based on visual attention theory, Lian et al. employ pedestrian simulation technology to study the joint effects of spatial structure [28] and environmental visual stimuli on pedestrian movement [29]. Xu proposes a pedestrian simulation method combining traditional local collision methods with reinforcement learning methods to imbue pedestrians with adaptive capabilities to cope with more complex scenarios [30]. Li utilizes field research data and builds a pedestrian simulation platform based on store attractiveness to optimize commercial street spatial layout [31].

2.3. Current Gaps and Our Study

In urban spatial studies, spatial behavior emphasizes behaviors related to the actual use of urban facilities and public spaces. The emergence of new multisource urban data has brought new research potentials for measuring vitality itself, extracting key morphological and functional features of streets, and identifying human-scale elements of streetscape perception. New computer simulation technologies provide technical support for studying the physical environment at the human scale. However, current research still has the following shortcomings. Firstly, rapid urbanization and the intensification of urban heat islands, along with an increase in extreme high-temperature weather, have led to discrepancies between existing planning and design strategies and current climatic conditions, particularly in the summer in colder regions, which urgently need updating and supplementation. Secondly, current research on street space morphology mostly focuses on studying the mechanisms of its impact on the thermal environment and human behavior, lacking a universal framework that integrates architectural space morphology, thermal environment, and human behavior, forming a good feedback mechanism from space designers to users and back to designers. Finally, in terms of simulating street space vitality, current research mostly starts from visual and psychological perspectives, focusing on transportation spaces such as stations and indoor shopping spaces, with insufficient research on outdoor spaces that are greatly affected by the thermal environment.
This paper describes a simulation platform for outdoor street pedestrian vitality in commercial spaces. Building upon the existing model, a pedestrian heat adaptation model is introduced to construct and calibrate the pedestrian simulation model. Typical morphological elements of commercial streets are summarized and analyzed, and relevant design strategies are proposed.
The structure of this paper is as follows: Section 2 reviews the current research status of spatial morphology and pedestrian vitality, as well as current research on street space morphology, vitality, and pedestrian simulation; Section 3 describes the establishment and calibration of the model; Section 4 presents the simulation results; Section 5 discusses the reasons for these results and corresponding planning and design strategies; and Section 6 concludes the paper.

3. Methodology

3.1. Research Design

The research process is depicted in Figure 1:
  • Data Collection: Four typical street space samples in Sanlitun, Beijing, are selected for data collection. This includes gathering data on street space morphology, climate variables, and Wi-Fi pedestrian flow trajectory data. Summaries and conclusions of the collected data are presented in the analysis.
  • Model Establishment: Pedestrian simulation models are built using Grasshopper and MATLAB platforms. These models are compared with actual strategy data to validate their reliability. Detailed modeling information and validation are provided in Section 3.5 and Section 4.1.
  • Data Analysis: The relationship between spatial morphology elements and pedestrian vitality is analyzed based on the model. Pearson correlation analysis and multiple regression equations are employed using Statistical Package for the Social Sciences (SPSS) to analyze the correlation between factors and vitality data and to construct mathematical models.
  • Strategy Proposal: Based on the site characteristics, rational planning of street direction (SD) and width-to-height ratio (W/H) is conducted. Suitable Street Interface Form (SIF) design strategies are proposed for streets with different SDs and W/H ratios.

3.2. Study Area

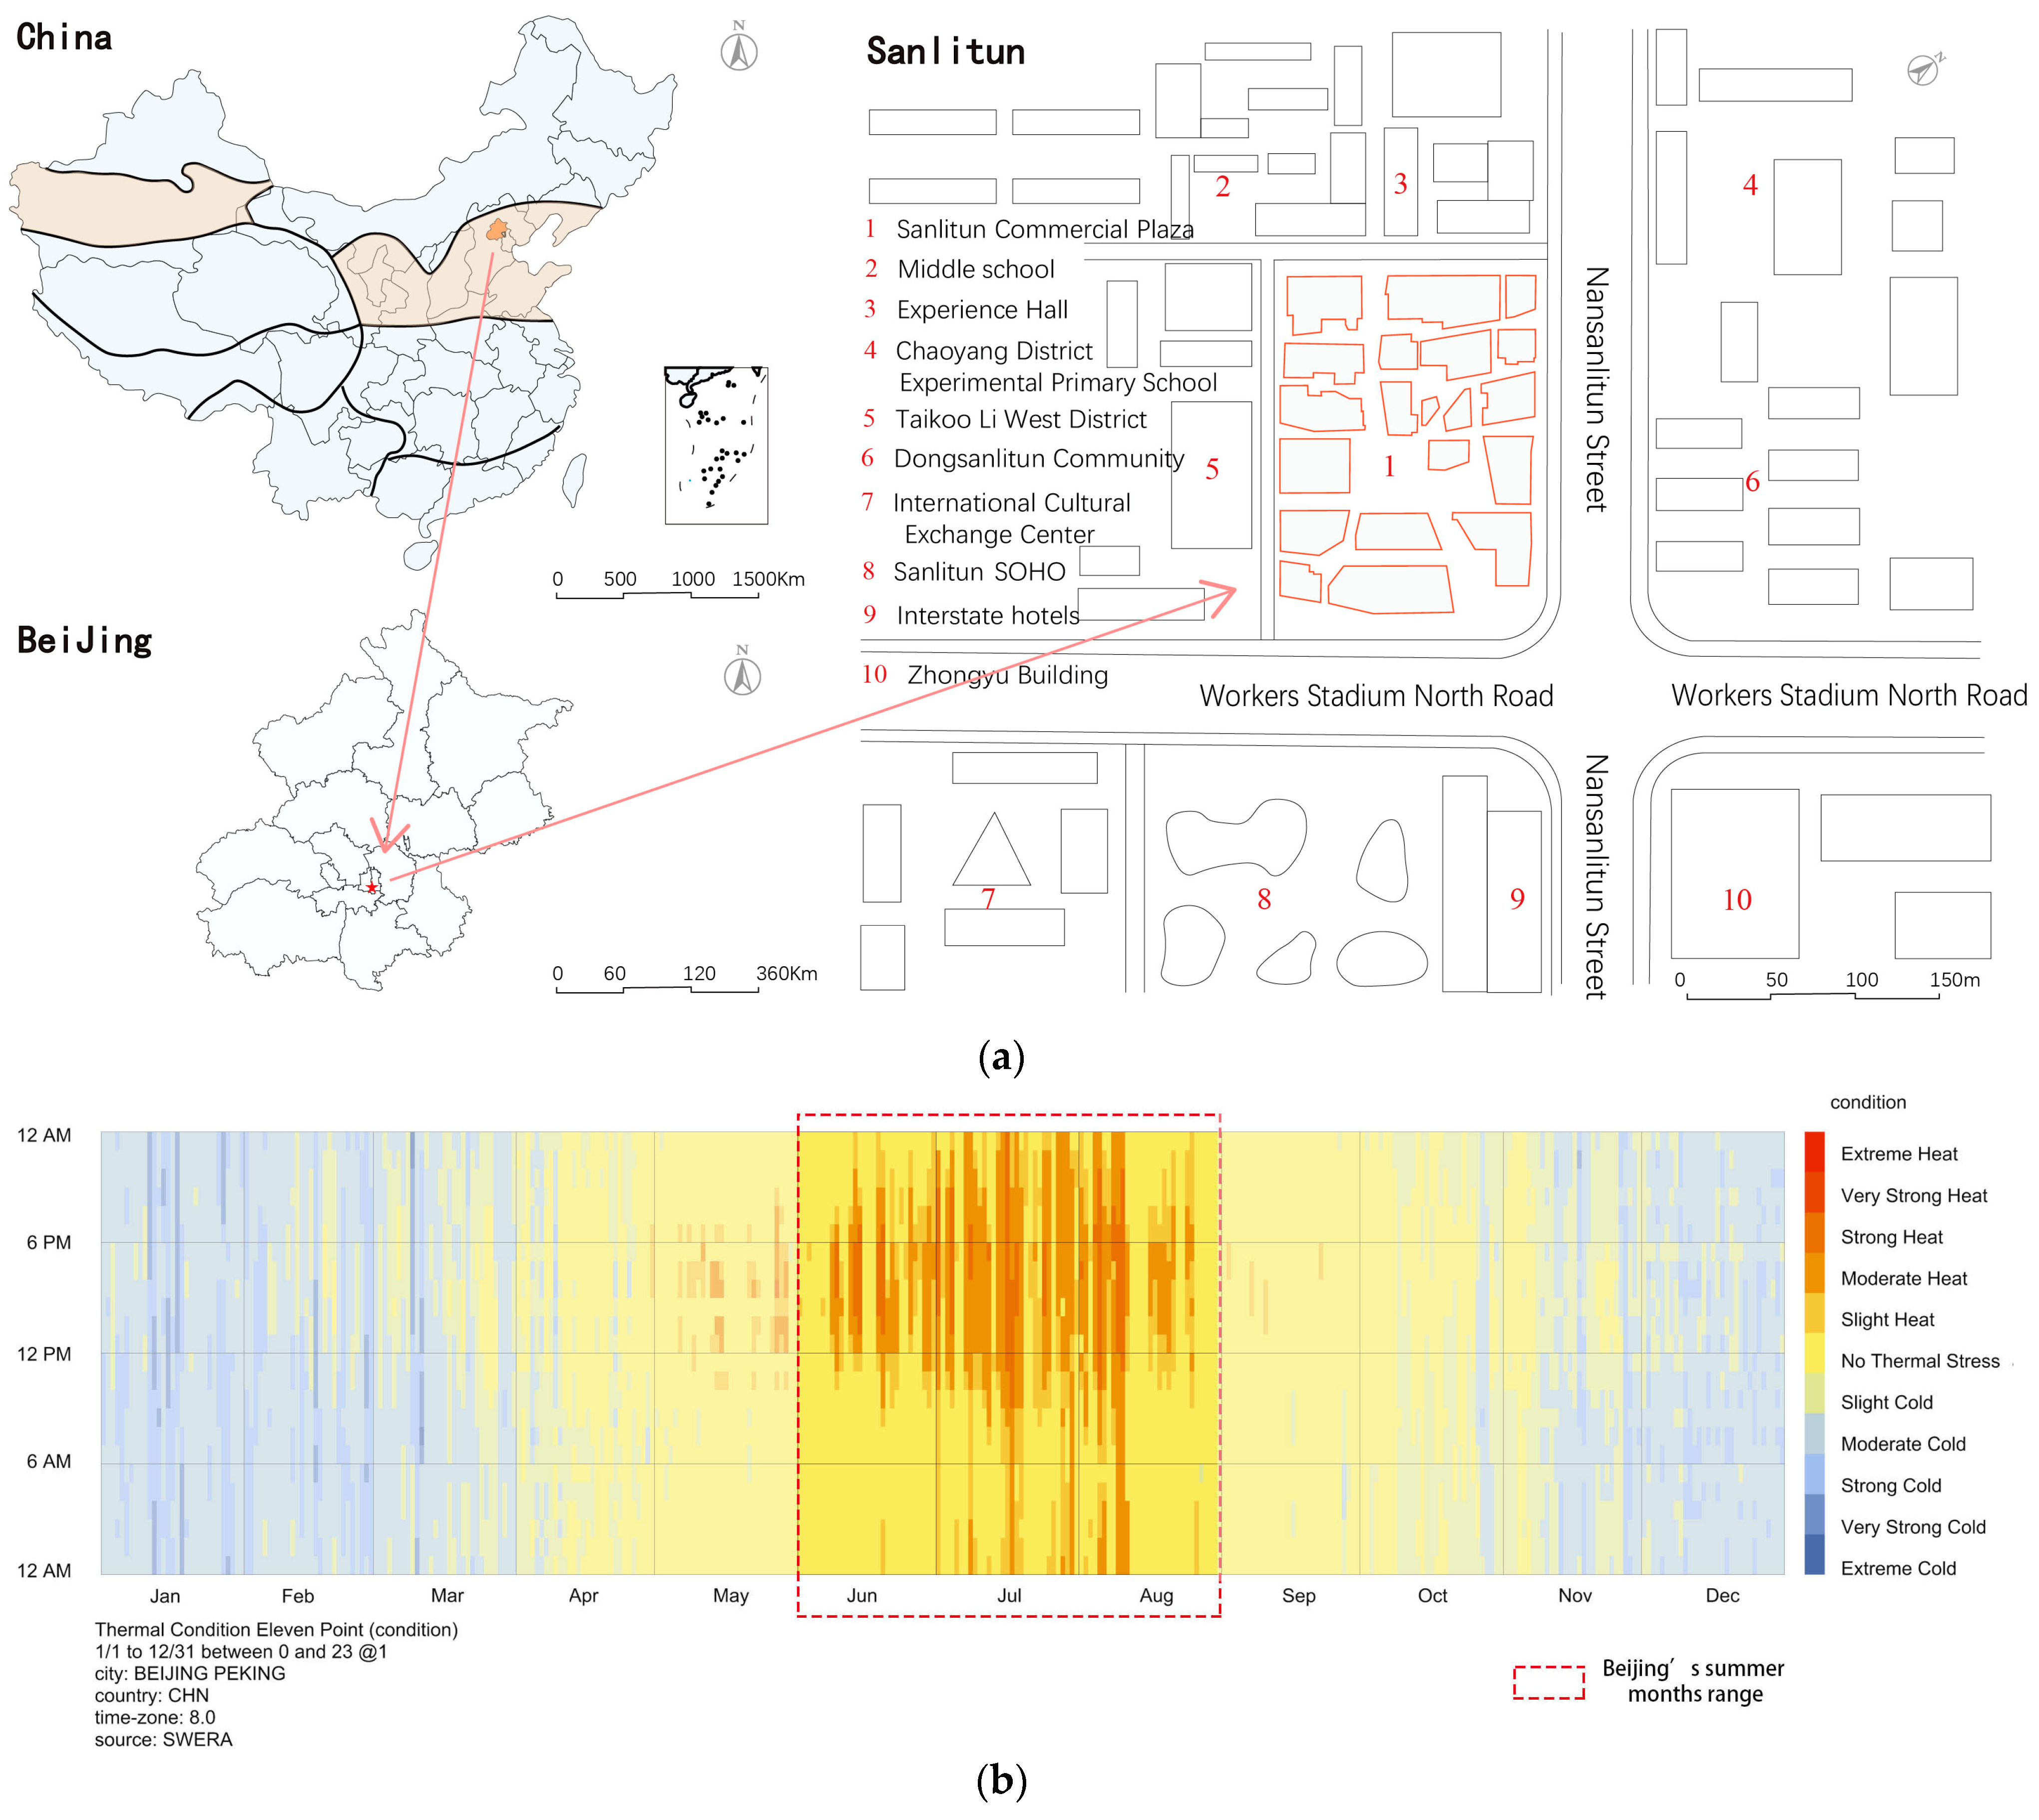
To ensure the representativeness of the selected area, the study conducted extensive literature and meteorological data analysis. the study found that with the accelerated urbanization process in Beijing, the urban heat island effect is significant, and there is an increasing trend in average summer temperatures with frequent occurrences of extreme high-temperature weather. Beijing has an annual average temperature of 10–12 °C, with hot and rainy summers, intense solar radiation, short transitional seasons, and cold and dry winters. January is the coldest month, with an average temperature of −4.7 °C, and the number of days with temperatures below −10 °C reaches 28.6 days, exhibiting typical characteristics of a cold region climate. According to news released by the Beijing Municipal Government website, in June 2023, the temperature reached a historical high of 41.1 °C, the highest temperature recorded in Beijing’s observation history. This region is notable for its typical summer high-temperature weather in cold regions and its unique political and economic status, making it highly representative of research [32] (Figure 2).
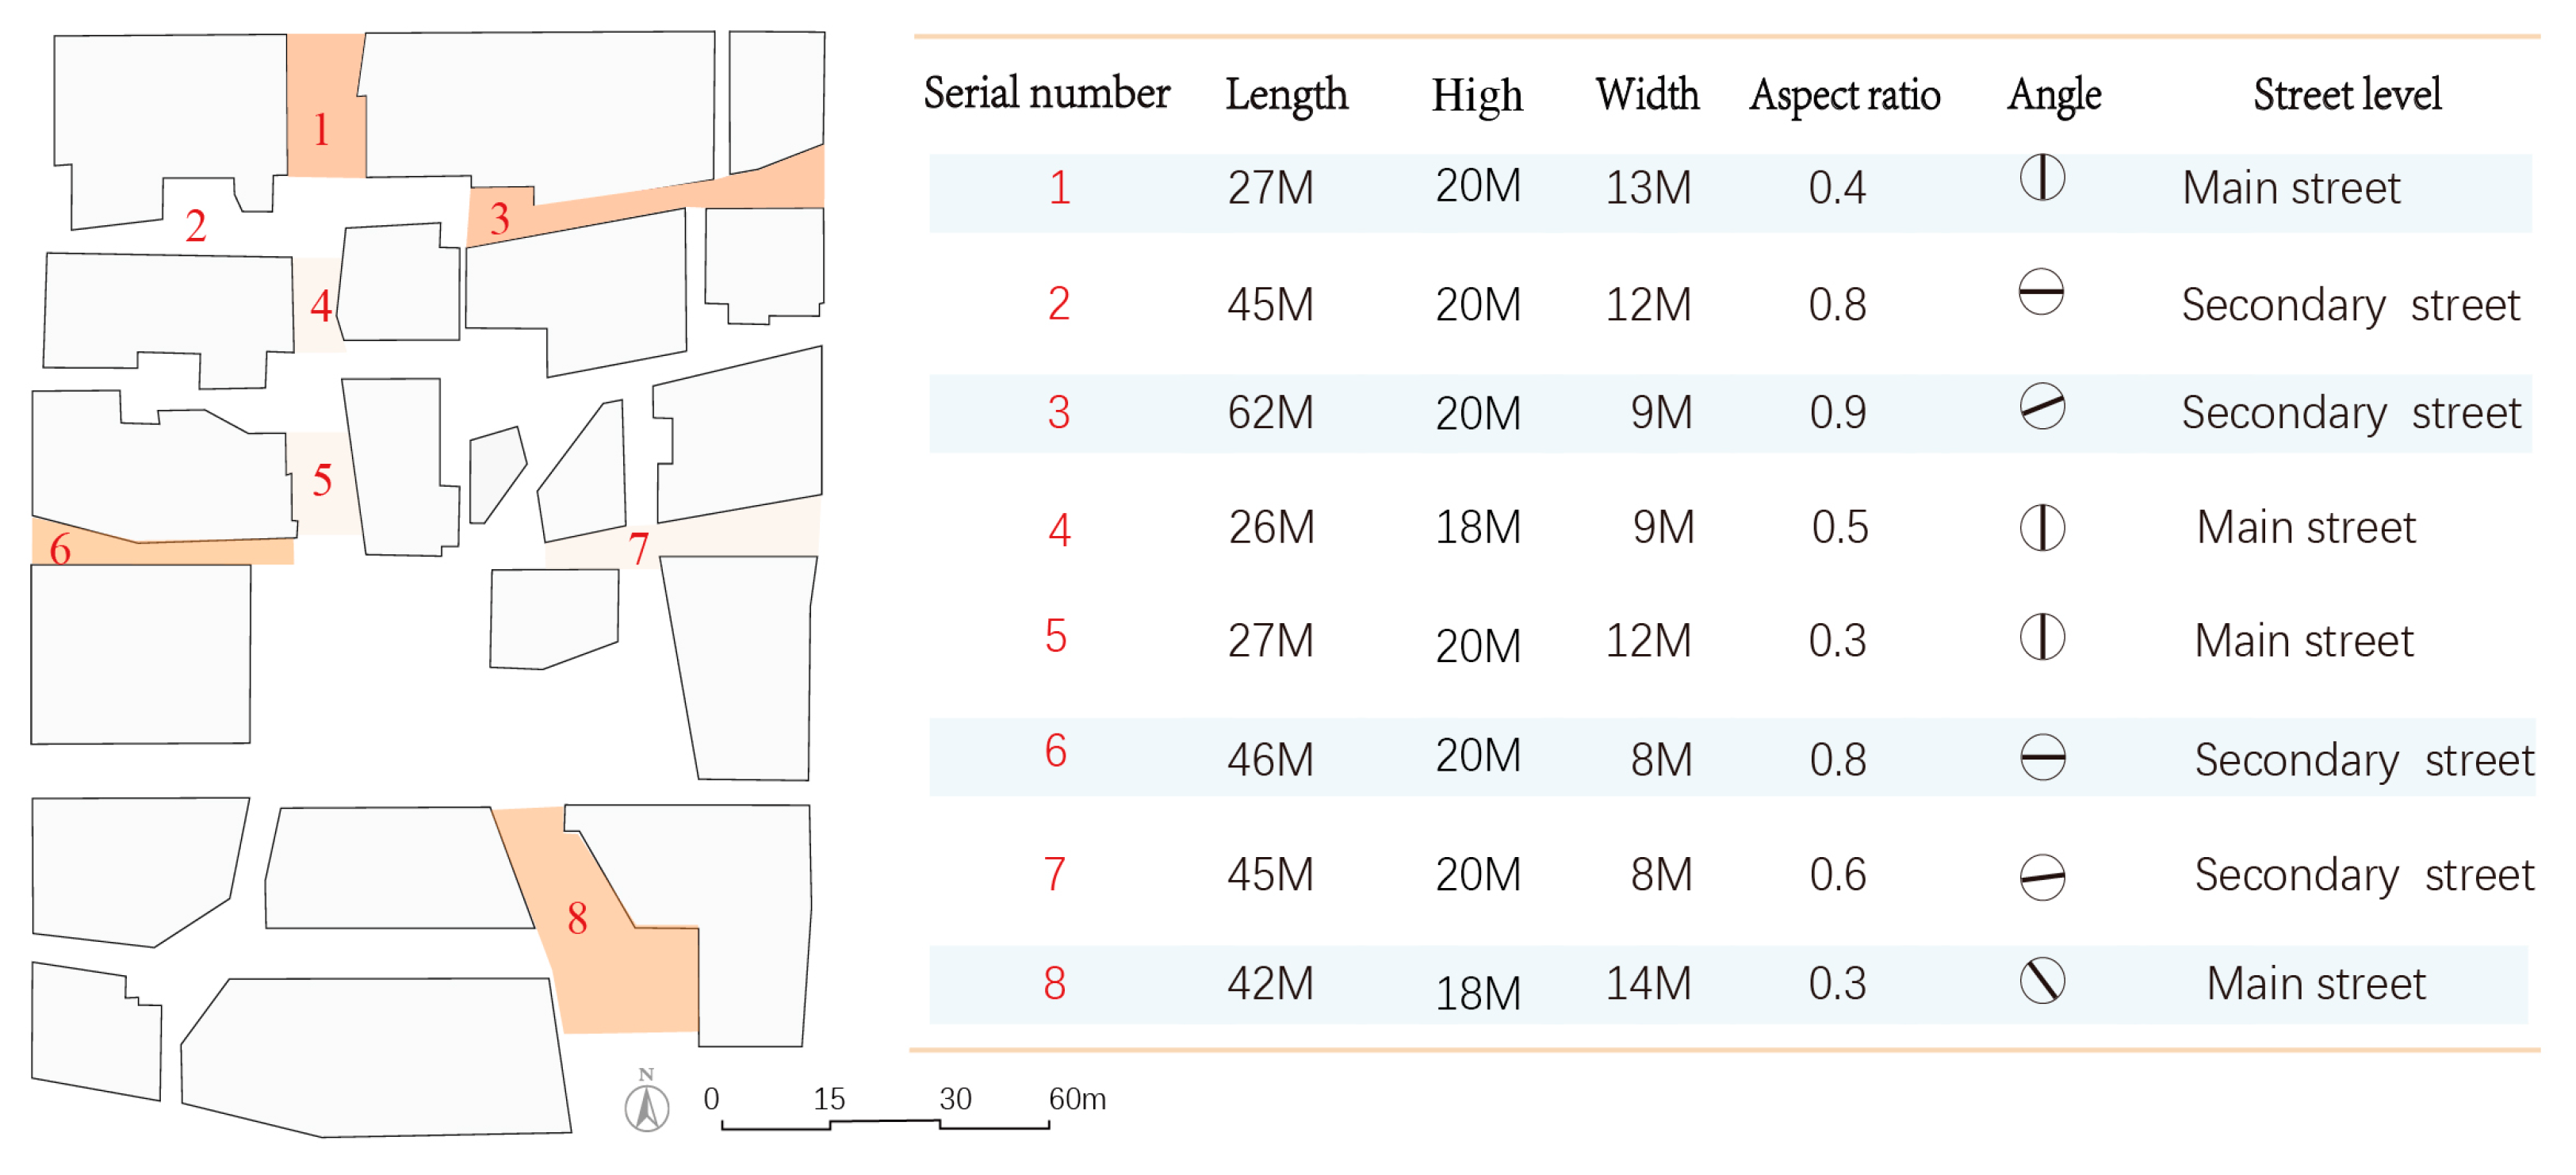
Upon reviewing commercial street areas in Beijing, the study found that Sanlitun, located in the central urban area, exhibits significant urban heat island effects and is a typical experiential commercial pedestrian street with important cultural and economic status in Beijing. It features numerous outdoor commercial streets, abundant outdoor pedestrian activity spaces, and a large pedestrian flow [23]. The spatial morphological characteristics of streets are diverse, encompassing four typical street orientations: north-south (N-S), east-west (E-W), northeast-southwest (NE-SW), and northwest-southeast (NW-SE). The width-to-height ratio of streets varies widely, including the standard street canyon and deep street canyon as proposed by Ahmad, reflecting the tight urban land use and the diverse interface forms [33]. Therefore, Sanlitun is chosen as the research site due to its representativeness and research significance. This study conducts preliminary investigations on selected streets in Sanlitun, analyzing and summarizing their spatial morphological characteristics (Figure 3), and ultimately selects four typical streets for research. These four streets span four orientations, with width-to-height ratios ranging from 0.25 to 0.9 and featuring arcade, vertical, overhang, and setback interface forms. The streets exhibit diverse spatial morphologies, including entrances and exits, thus possessing typical research value.
After examining Beijing’s urban fabric and status, Sanlitun was selected as the research area. As one of the most bustling modern open commercial districts in central Beijing, it boasts rich architectural forms and textures, representing a typical block-style commercial architecture. Drawing inspiration from local culture, architects incorporated hutong elements and divided the entire district into internal spaces through multiple streets, offering visitors diverse outdoor walking experiences with intersecting building layouts. Moreover, with comprehensive surrounding facilities and convenient transportation, Sanlitun attracts a large flow of people, making it significant for research purposes.

3.3. Variables and Date

3.3.1. Dependent Variable

Thermal comfort refers to the relationship between the perceived temperature and individuals’ comfort level, encompassing factors beyond ambient temperature such as wind speed, humidity, radiant temperature, and personal preferences. Currently, outdoor thermal comfort is commonly evaluated using indices like PET (Predicted Mean Vote) and UTCI (Universal Thermal Climate Index) to assess pedestrians’ perception of comfort in outdoor environments. Among these indices, PET has a broader applicability across different regions [13]. Hence, this study employs PET values as an evaluation metric to assess outdoor comfort conditions.
Pedestrian vitality in streets refers to the volume and activity level of pedestrians in those areas. When considering pedestrian vitality on commercial streets, there is often a stronger emphasis on the relationship between the built environment of the street and the spatial layout of shops in relation to consumer behavior. Specifically, it pertains to pedestrians exhibiting persistent and rational distribution patterns along the commercial street and their ability to access the shops along it. In previous studies, the foot traffic or visitation rates to shops have been widely used as indicators to assess the vitality of commercial streets, elucidating the activity levels of pedestrians within these street environments [13]. Therefore, this study selects street store visitation total as a representation of street vitality intensity, and the difference in store visitation volume between both sides of the street as an indicator of street vitality uniformity, considering these two variables as dependent variables in this research.

3.3.2. Independent Variable

The influence of street spatial morphology on pedestrians includes visual, psychological [34] and thermal environmental effects. Ren and Wang’s research indicates that street aspect ratio and interface form significantly affect pedestrians’ visual impact; although overhanging eaves and arcades have minimal impact on the street’s thermal environment, they possess visual appeal to pedestrians [20], altering their original trajectories [22]. Street direction, scale [15], and interface form greatly affect the street’s thermal environment [23]. Based on this, the study selects street aspect ratio, street direction, and interface form as three spatial morphology variables and independent variables.

3.4. Date Collection

3.4.1. Extraction of Spatial Morphological Elements

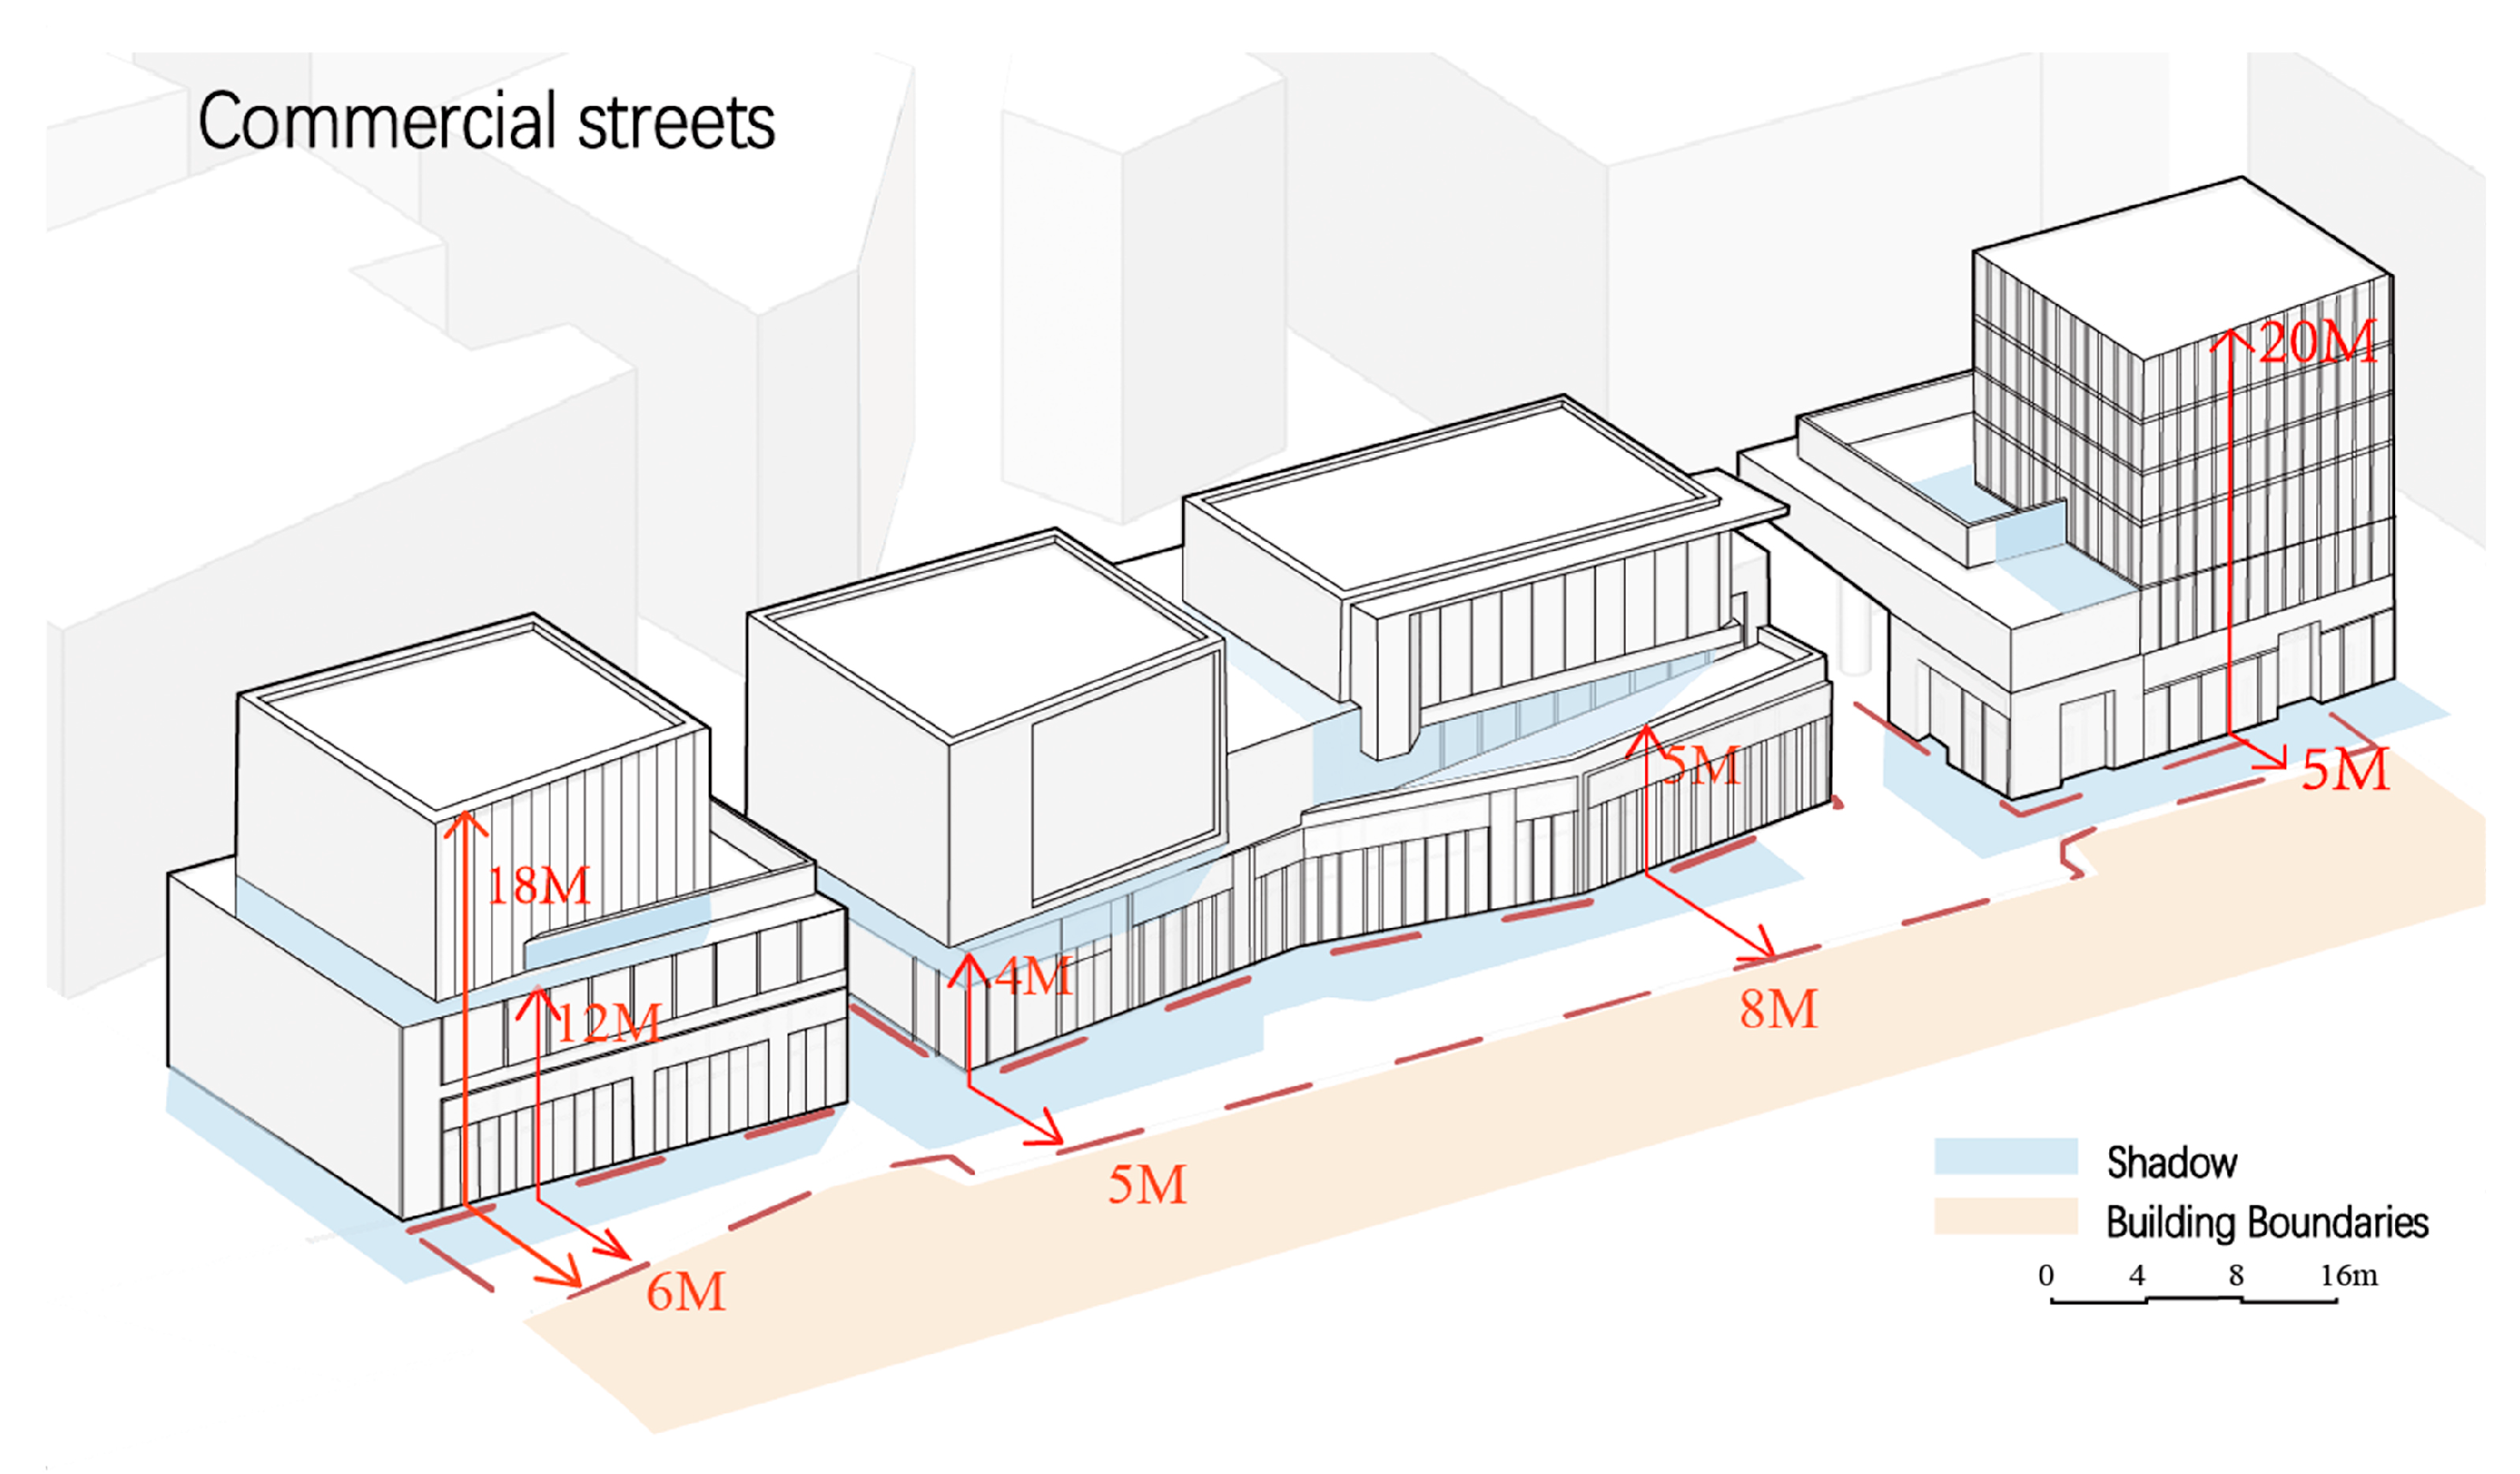
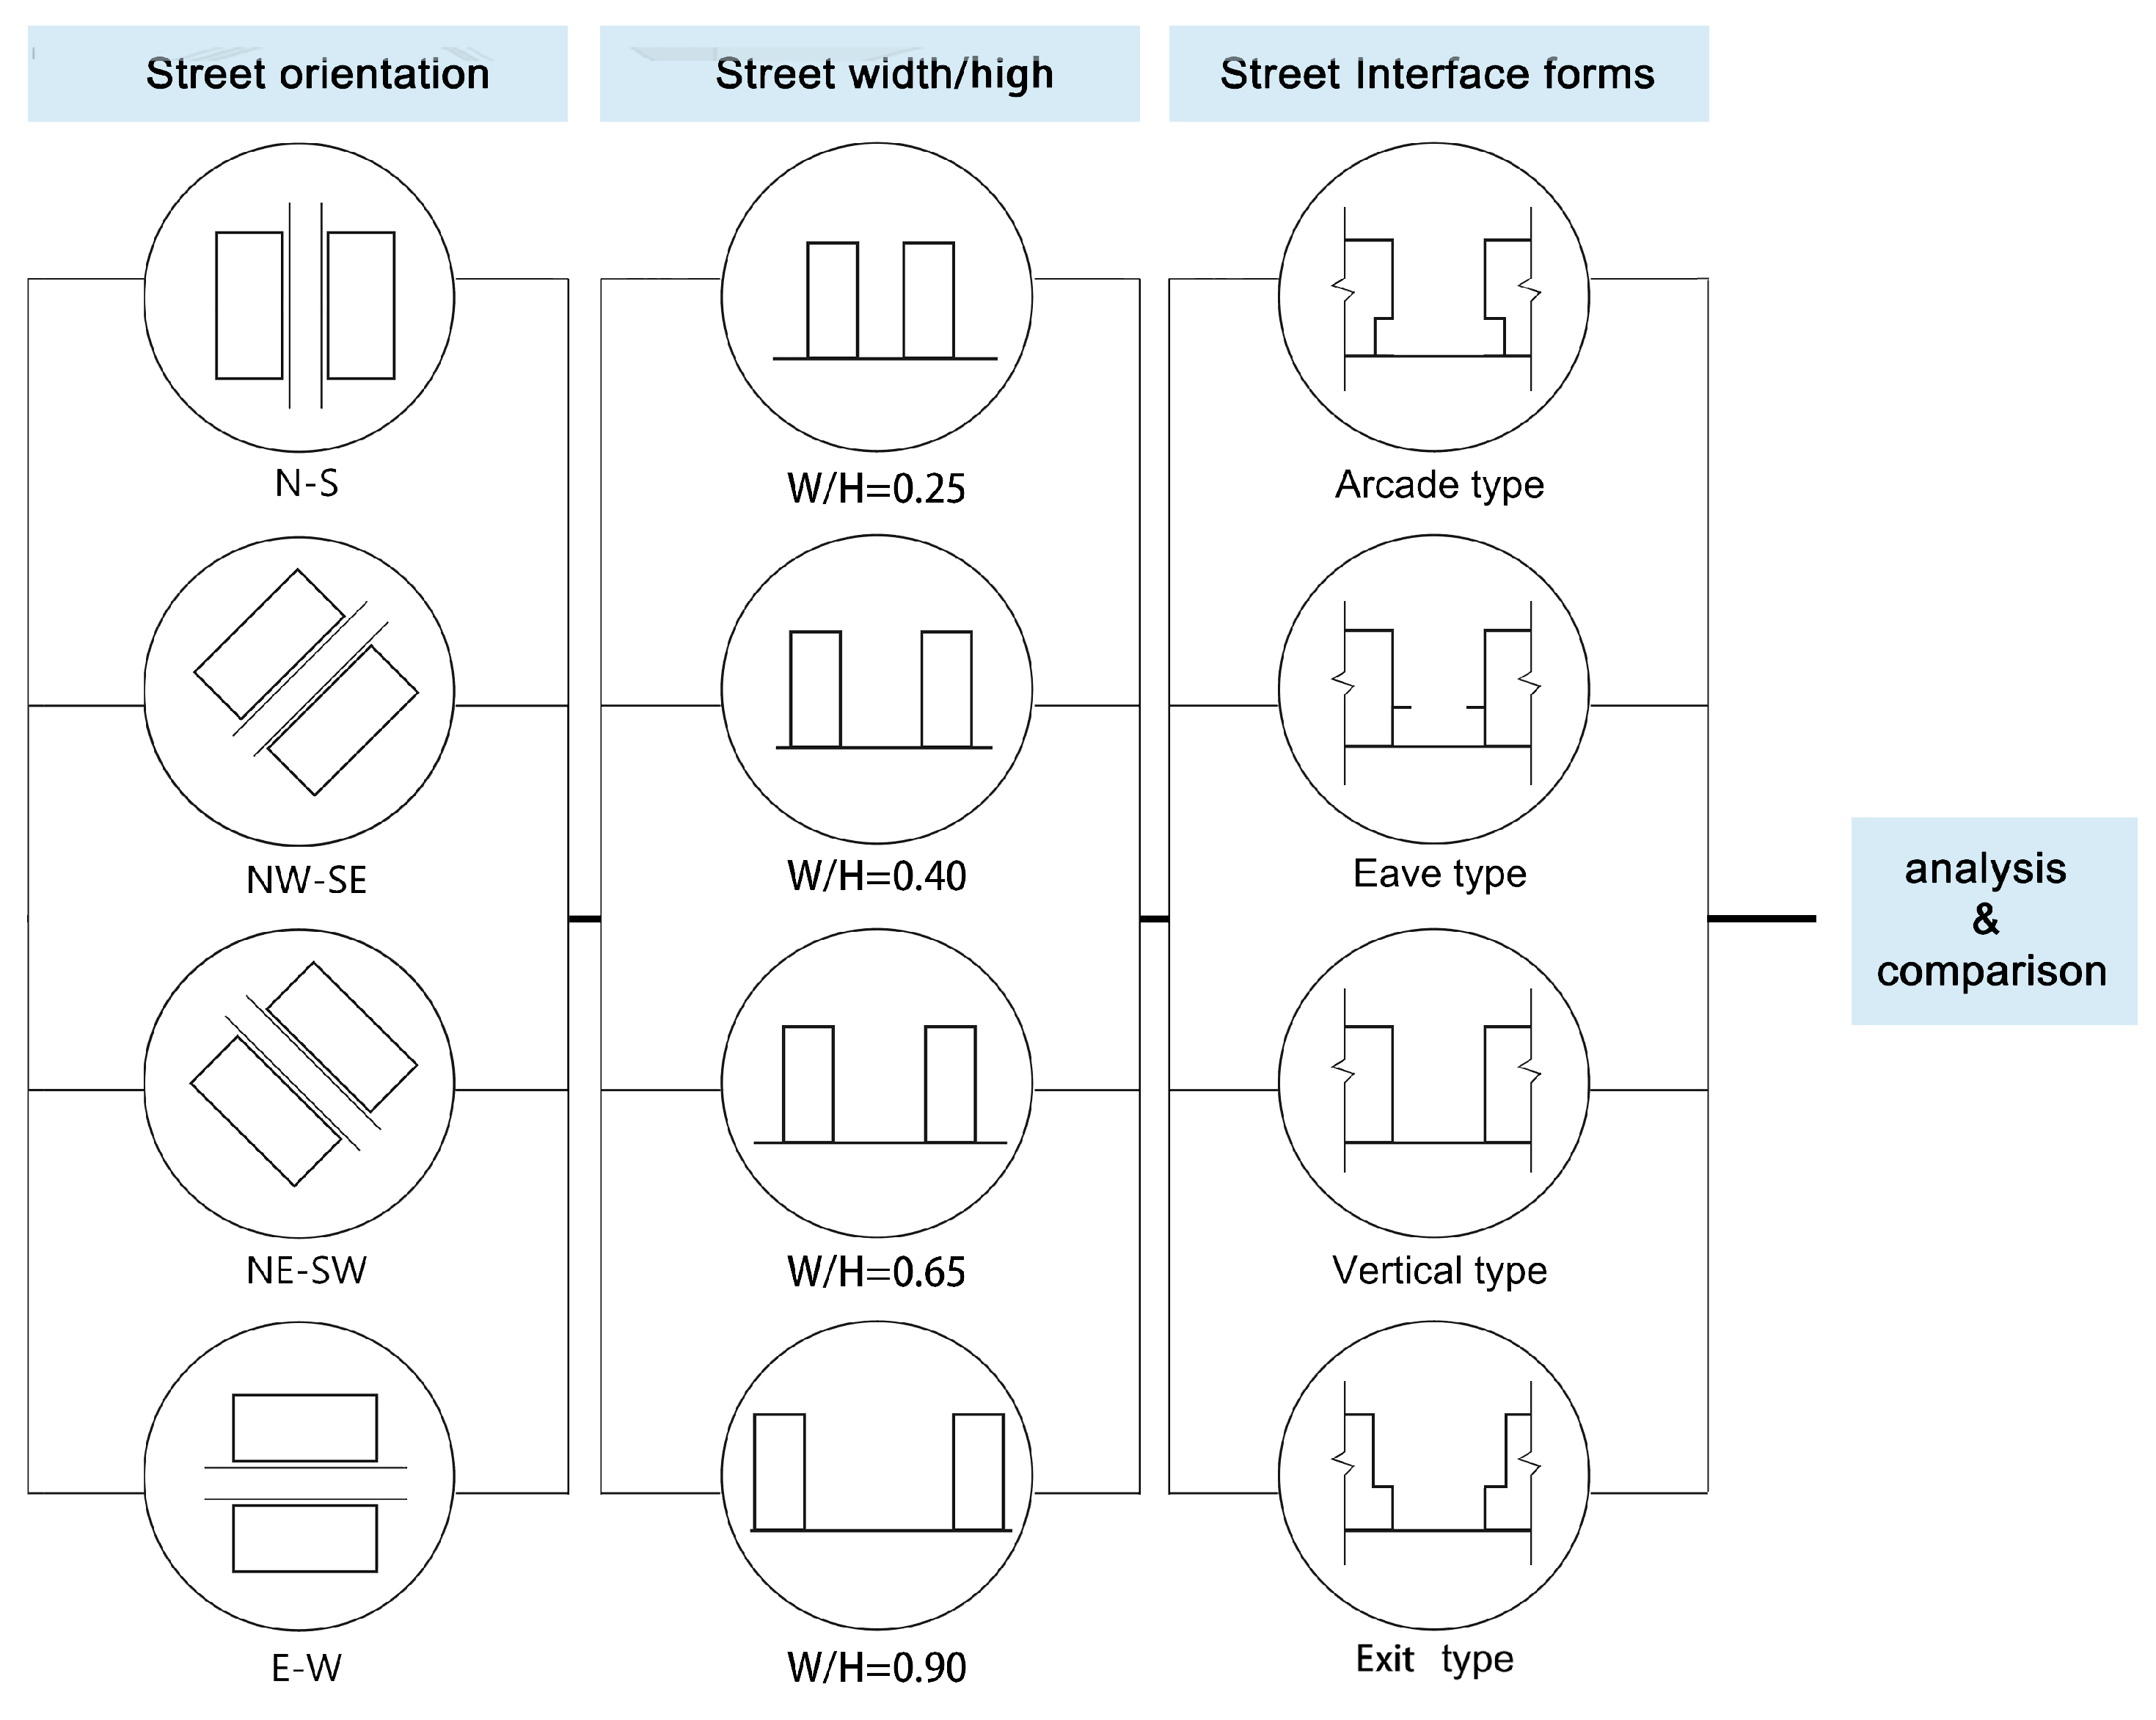
Combining field data analysis and research, this paper establishes the parameter ranges for ideal street canyon models. Firstly, all ideal street canyon models have a fixed length of 50 m, with side building depths set at 10 m. The independent variables are categorized into three groups: street orientation, street width, and street interface forms. Street orientation is classified into four directions: north-south (N-S), east-west (E-W), northeast-southwest (NE-SW), and northwest-southeast (NW-SE). Drawing from Ahmad’s street canyon classification and research findings, the street width-to-height ratio is defined within the range of 0.25 to 0.9, with a fixed building height of 20 m. Street width varies in increments of 5 m, resulting in four width-to-height ratios: 0.25, 0.4, 0.65, and 0.9. Street interface forms (SIF) are categorized as arcade, overhang, vertical, and setback. By combining these three groups of variables, a total of 64 street canyon models are generated as experimental cases for this study. The translation aims to ensure clarity, professionalism, and coherence, suitable for an English scholarly audience (Figure 4).

3.4.2. Collection of Physical Environment Data

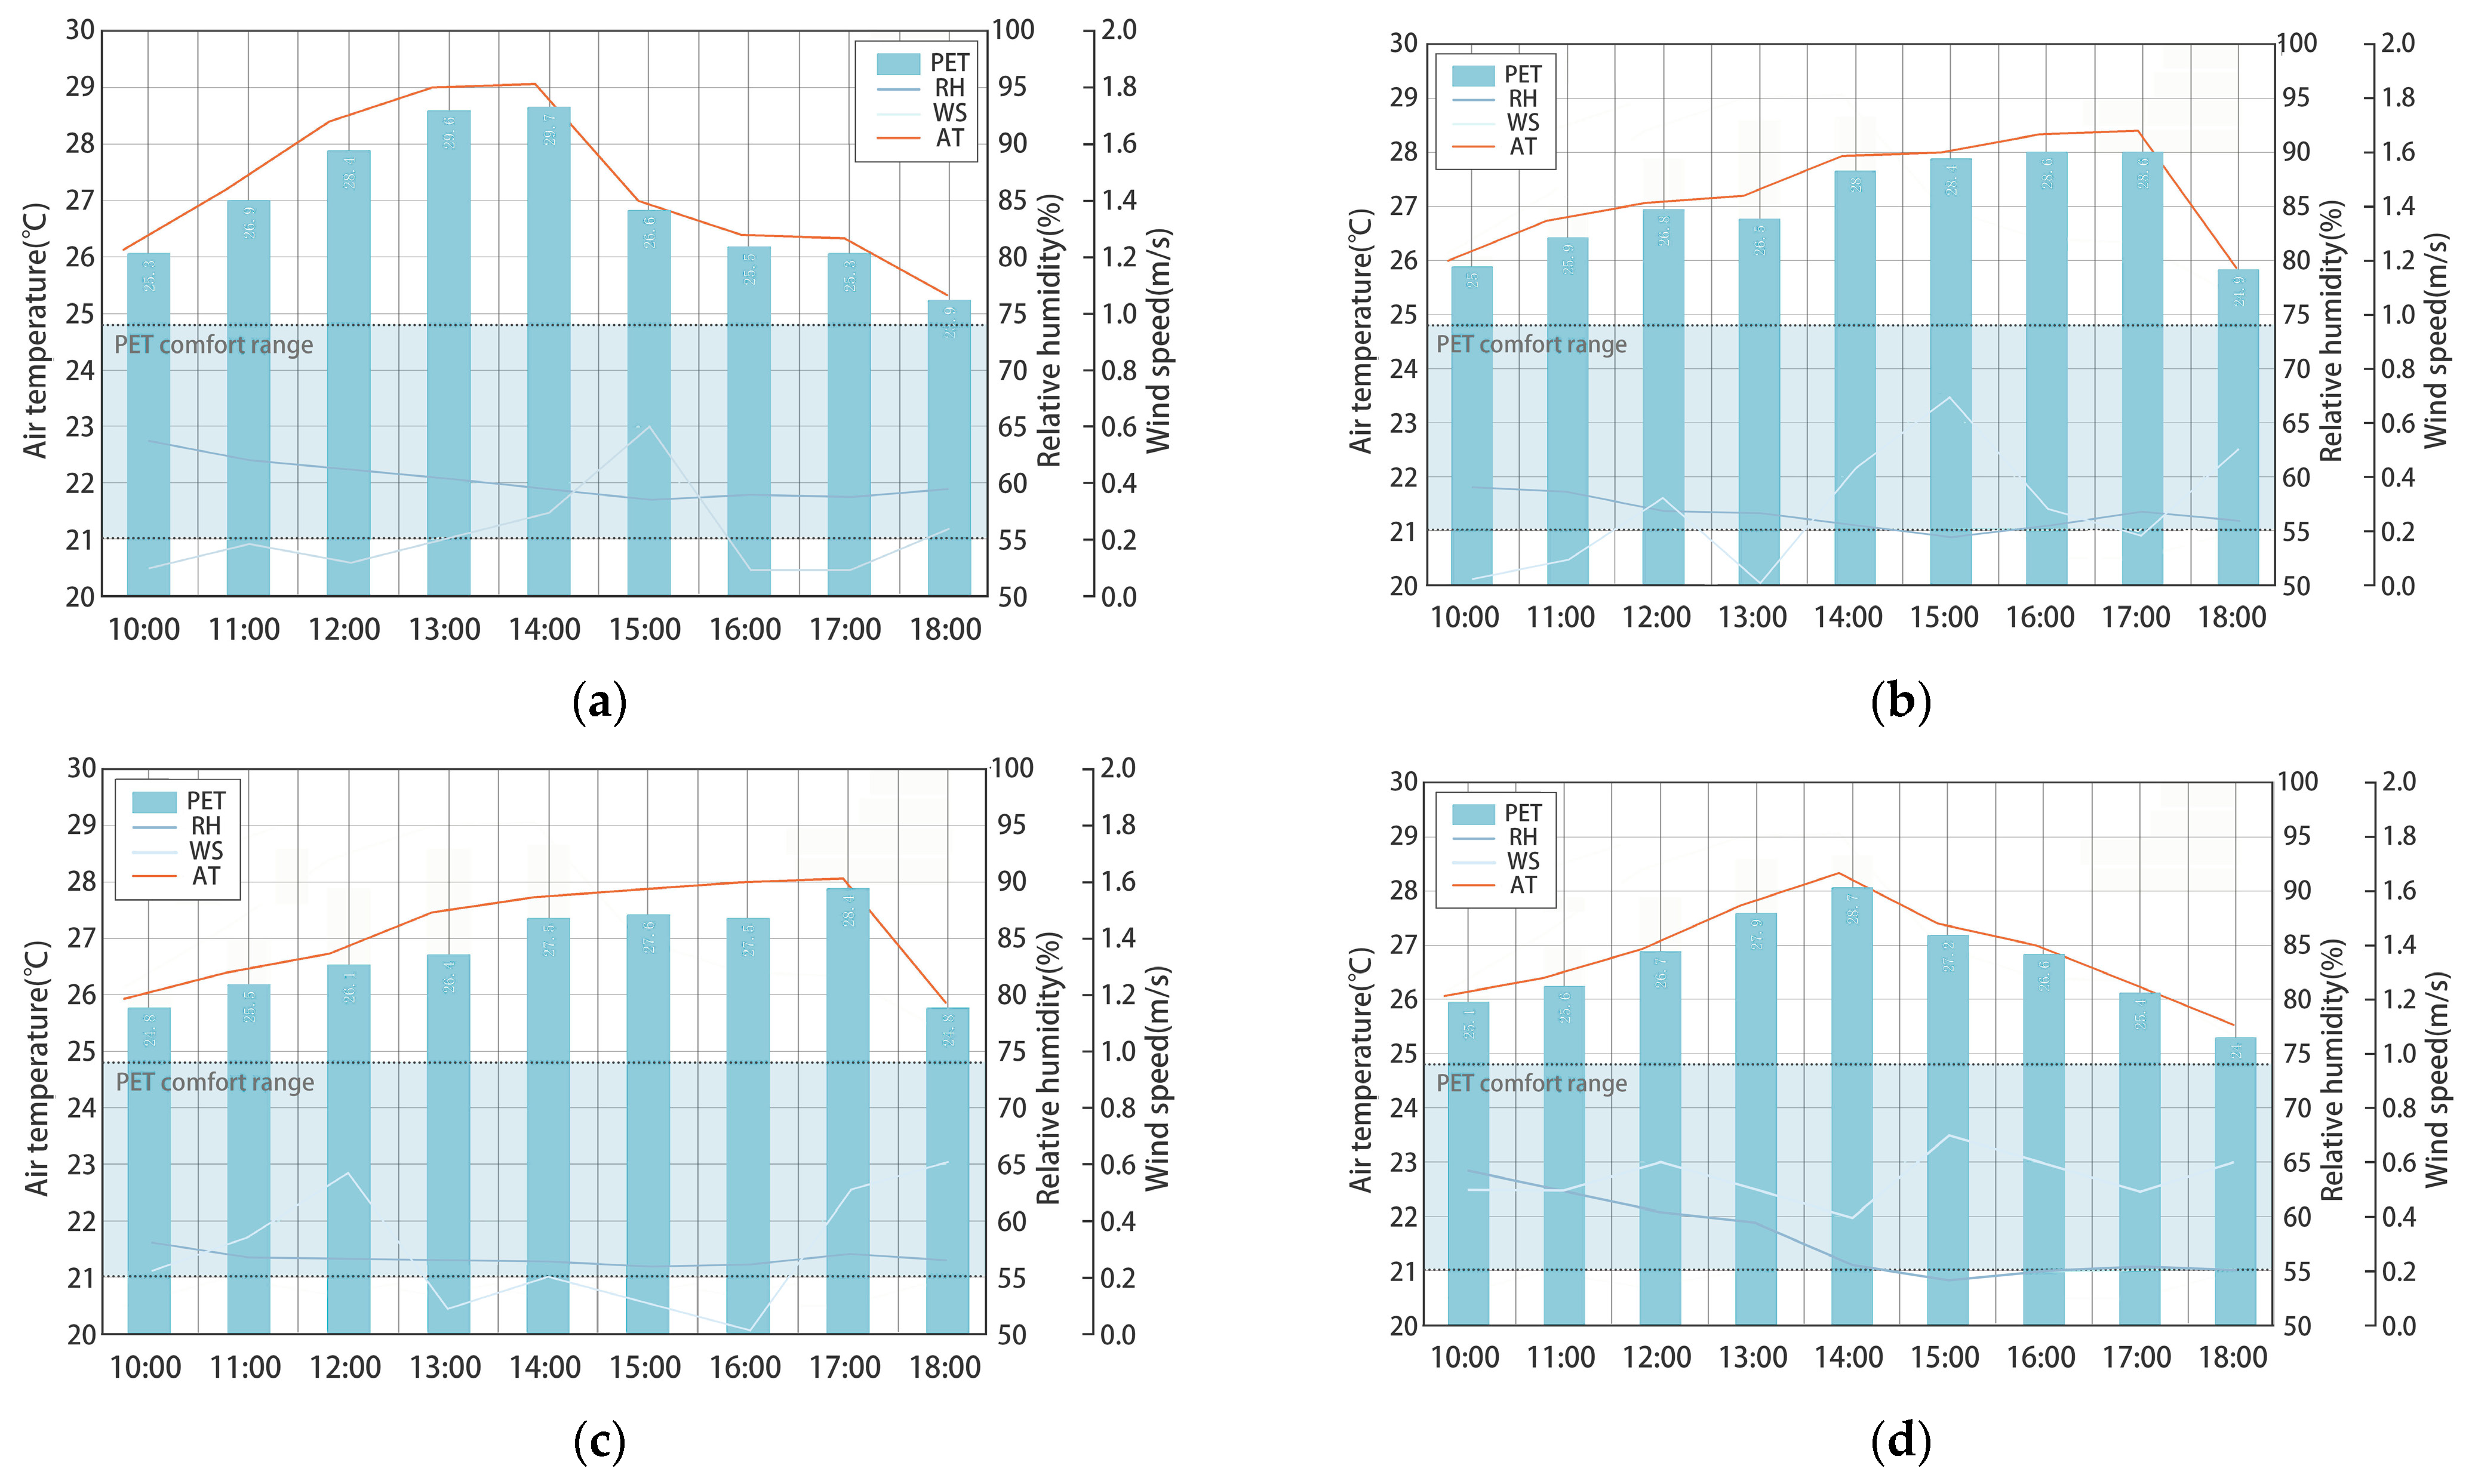
This study selected four typical streets in Sanlitun for continuous microclimate meteorological data collection and calculation over three consecutive days. The experimental period was from 20 August to 22 August 2023, between 10:00 AM and 6:00 PM, which aligns with the sun’s trajectory and the peak usage times of urban public spaces. All equipment recorded data at 5 min intervals. Each hour, twelve sets of microclimate data were collected at the observation points. The measuring instruments included relative humidity sensors, air velocity sensors, globe thermometers, and temperature-humidity data loggers for continuous environmental monitoring (Table 1). Given that the average human center height is 1.1 m, the sensor probes were set at a height of 1.1 m above ground, by ISO 7730 testing requirements. Fixed-point walking records were taken at the center points of different streets to obtain meteorological parameters, including air temperature (Ta), relative humidity (RH), air velocity (Va), and globe temperature (Tg) [35] (Figure 5).
A detailed survey was conducted to gather information about the clothing of the participants, including upper and lower garments, footwear, and external shading items. Based on ISO 9920 standards [36], the clothing data were converted into Clo values, with the average summer clothing insulation value in the area determined to be 0.5 Clo. The experimental and survey data were organized and analyzed using the thermal comfort calculation software RayMan 12 compute the average measured Physiologically Equivalent Temperature (PET) values for each street.
The data indicated that Streets 1 and 2 had higher temperature peaks and reached these peaks earlier compared to Streets 3 and 4. Specifically, Street 1 exhibited the largest temperature difference at 5.6 °C, while Street 3 showed the smallest temperature difference at 3.2 °C. The wind speeds across all four streets were below 0.5 m/s, classifying them as light breezes.

3.4.3. Pedestrian Activity Data Collection

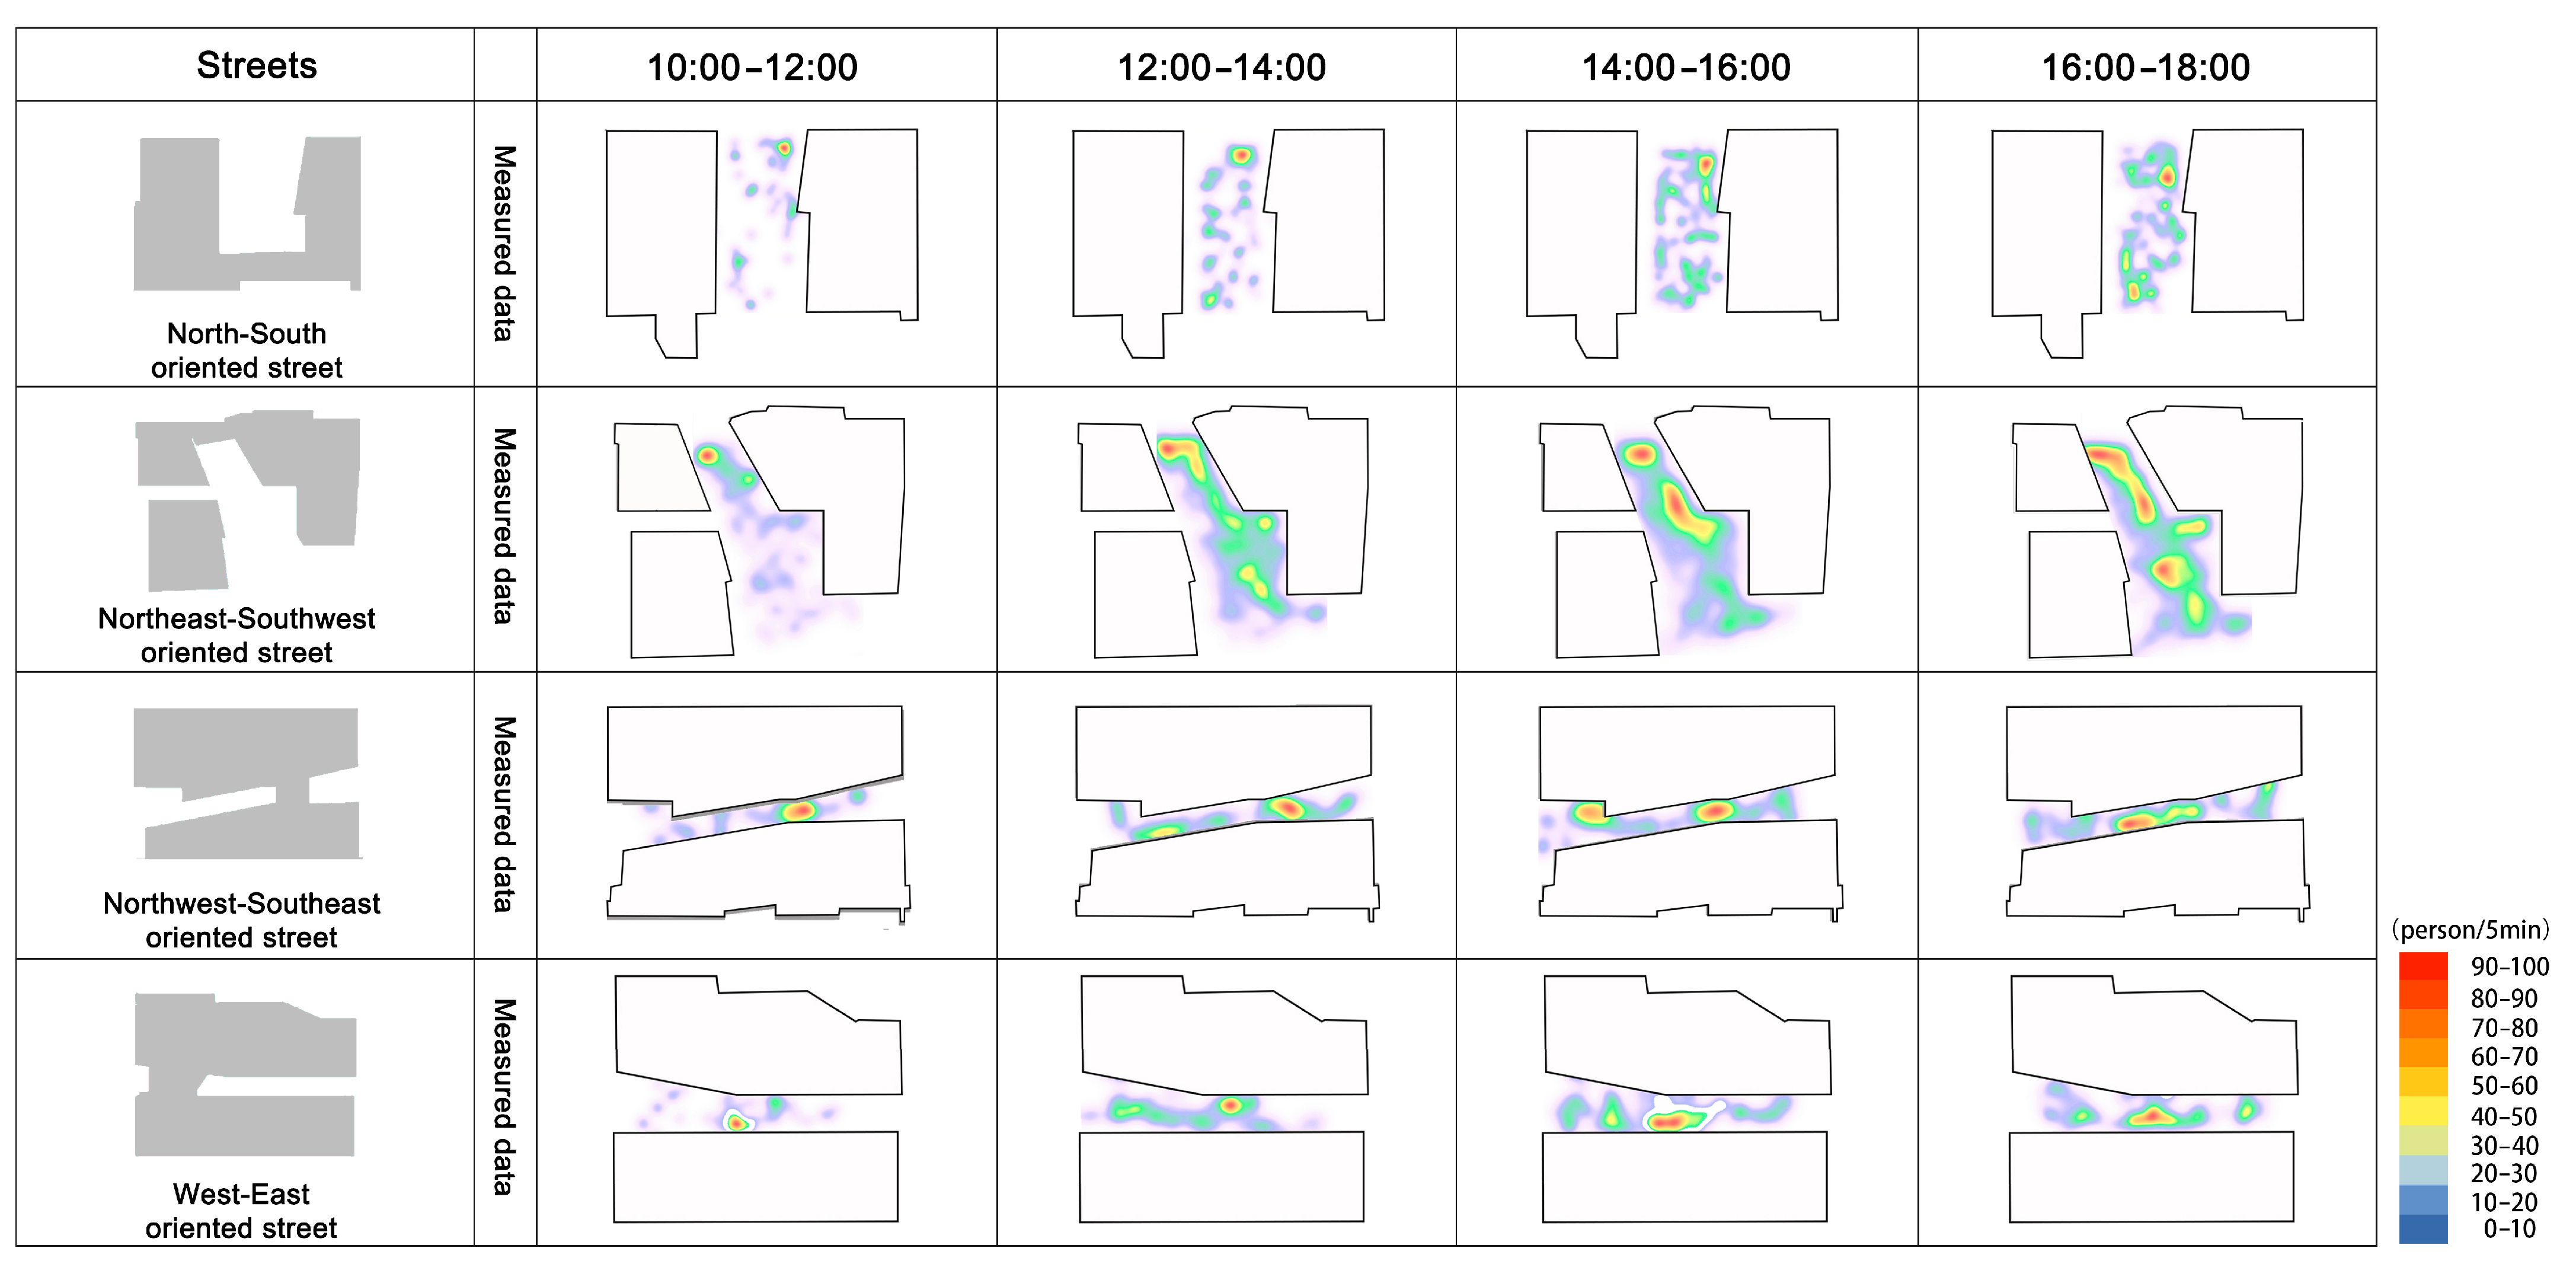
The introduced Wi-Fi probe technology is utilized to collect pedestrian flow data on typical streets. The Wi-Fi probe module can scan and capture wireless signals emitted by nearby mobile devices, recording their MAC addresses, real-time locations, trajectories, and speeds. As the Wi-Fi probe is a device based on the RSSI triangulation algorithm with an optimal collection radius within 30 m [18], the entire pedestrian dataset within the typical street can be collected by ensuring the entire area is covered by Wi-Fi probe signals. The measurement points within the four streets are arranged as shown in Figure 6, resulting in the heat distribution of pedestrians on typical streets as shown in Figure 7.
Streets 1 and 2, serving as the main streets of Sanlitun, have the highest number of pedestrians, peaking between 4 PM and 6 PM, with significant fluctuations in total pedestrian flow. The pedestrian distribution from 2 PM to 6 PM is more balanced compared to the distribution from 10 AM to 2 PM. Street 4 has the fewest pedestrians throughout the day, while Street 3 has relatively more pedestrians, with the total pedestrian flow and distribution being generally balanced.

3.5. Thermal Comfort-Based Pedestrian Simulation Model

3.5.1. Pedestrian Thermal Adaptation Model

Current pedestrian simulation models in the architectural field primarily focus on building evacuation and traffic engineering, with limited research on leisure and shopping behaviors. Existing simulation platforms mainly consider pedestrians’ self-driven motivation towards destinations and their repulsion to other pedestrians and obstacles. Lian et al. added research on visual stimuli’s influence on behavior decisions in commercial environments and verified its accuracy. The specific formulas are shown in Table 2. This model can simulate pedestrian behavior within a commercial plaza, taking into account factors such as store location, store attractiveness (physical features, shortest visual distance, standard visual distance), visibility of attractions, and other influencing factors, resulting in pedestrian trajectory maps and statistics on store visits (Table 2) [37].
This study differs from Lian’s indoor research of commercial plazas by focusing on pedestrian behavior on outdoor streets. Compared to the relatively stable and suitable indoor thermal environment, the outdoor thermal environment varies significantly, especially during the summer and winter seasons when thermal conditions are less favorable. Based on the analysis above, this paper focuses on the summer season in this region. Building on the original visual model, it incorporates the influence of the thermal environment on pedestrian behavior. According to Valentin Melnikov’s three pedestrian thermal adaptation models (speed adaptation, thermal attraction/repulsion, and visually driven route alternation), the study simulates street pedestrian shop visual attraction and thermal adaptation behavior’s path planning and vitality using the MATLAB platform [38].
Research has shown that walking speed is closely related to ambient temperature, with walking speeds significantly faster at 25 °C compared to 15 °C [39]. The pedestrian self-adaptive walking speed model is an empirical PET function, where speed increases linearly from V c o m f to V m a x when PET exceeds the comfort value P E T c o m f . To avoid unrealistic high accelerations, acceleration and deceleration rates are limited to 0.1 m/s2. Based on the measured pedestrian data from Sanlitun, the study assumes the following values: V c o m f = 1.3   m/s , V m a x = 1.75   m/s , and a comfortable temperature, P E T c o m f = 28   ° C . Pedestrians can perceive a temperature difference of 0.005 °C between their left and right arms, which prompts them to turn towards cooler areas, reflecting the thermal attraction model. This is simulated by sensing PET at 0.4 m to the left and right (PET left and PET right) and comparing it to the current center point PET, adjusting the pedestrian’s trajectory according to the deviation angle (t) and sensitivity to thermal stimulus P E T t .
Additionally, the visible thermal characteristics of spaces, such as sunlight and shade, can cause shifts in pedestrian trajectories. This study assumes only two visible thermal zones, such as sunlight and shade. The study defines g as a cost function dependent on path length l, the ratio of shaded path length, and the cost multiplier sun for traveling a unit distance in sunlight compared to shade (3). The alternative path that minimizes cost is then chosen, and a new trajectory is planned. The cumulative thermal stress model evaluates the effectiveness of each adaptation using two “thermal stress” measurements: cumulative thermal stress hs and average stress over walking time tr (hs) [38]. Detailed formulas are provided in Table 3.

3.5.2. Construction Process of the Pedestrian Simulation Model

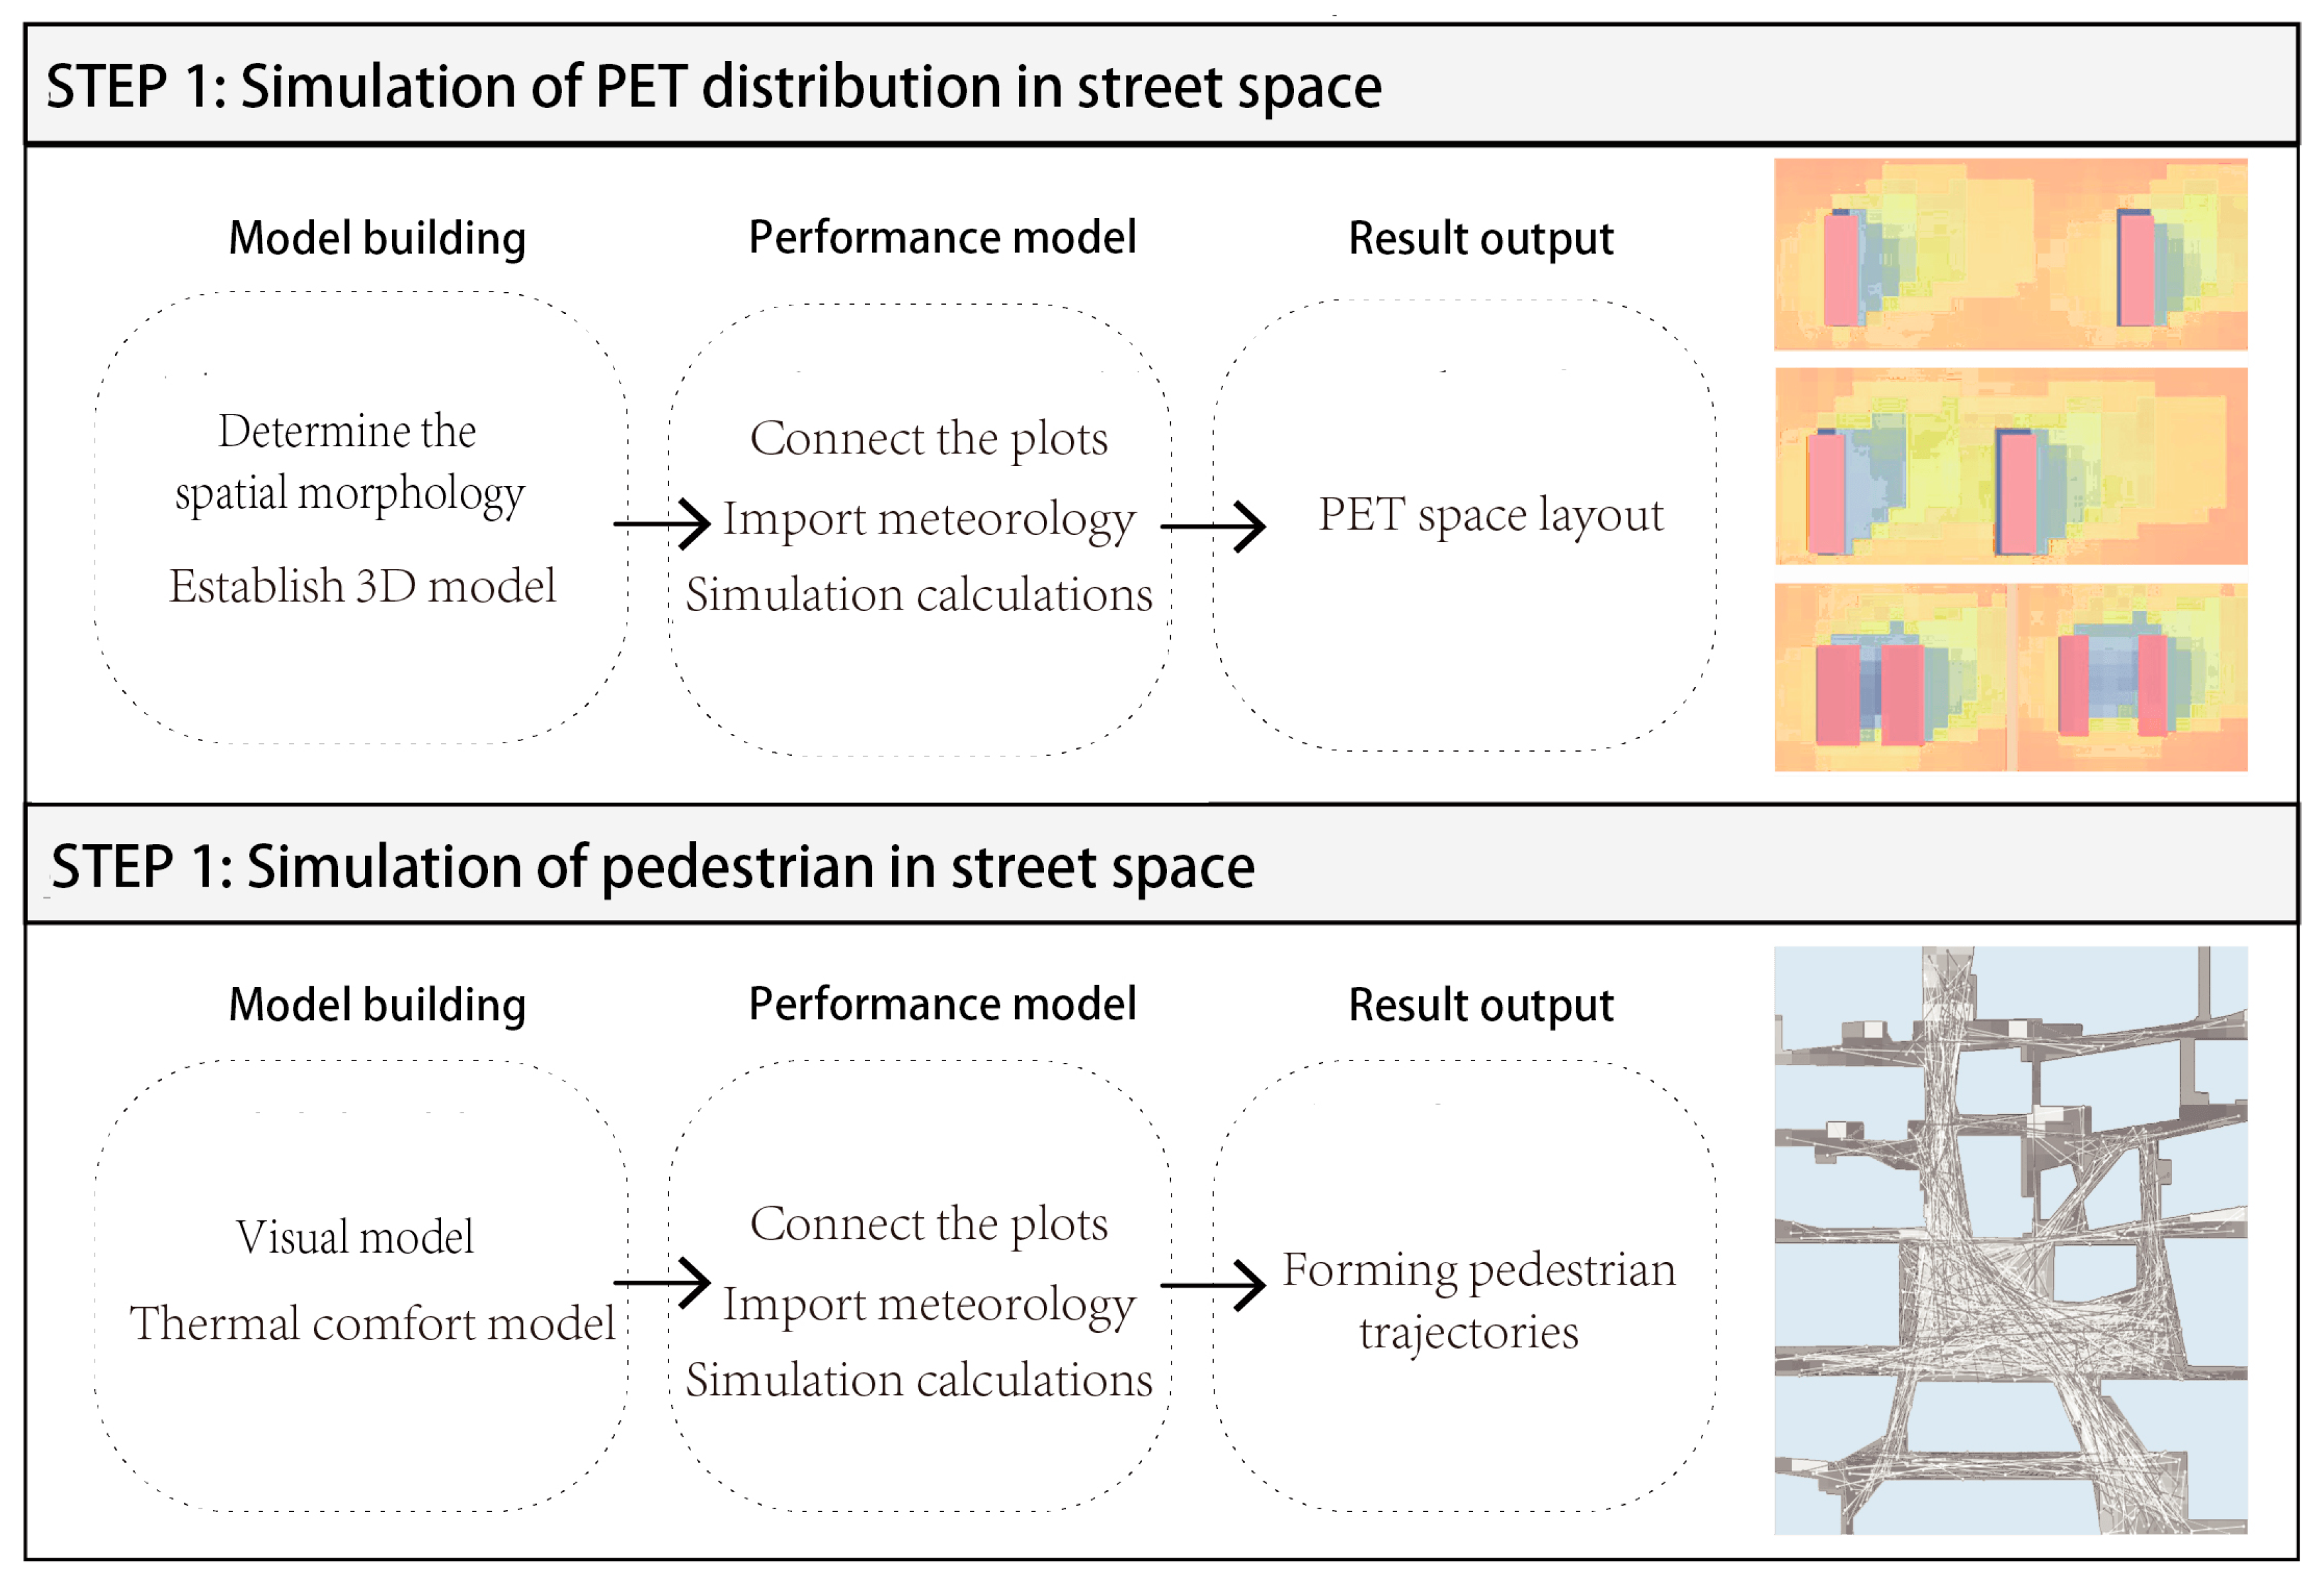
Translate the above rules, embed them into geometric models of the site, use Ladybug tools 1-6-0 to build a street environment thermal comfort simulation platform to simulate the 64 street models with PET, and obtain thermal comfort distribution maps of streets with different spatial forms. Then, using the MATLAB platform, write a program based on the updated pedestrian simulation mathematical model, input the PET spatial distribution map, generate pedestrian path maps and store visitation statistics for shops, organize the data, and obtain the TSV and DSV values for each street (Figure 8).

4. Results

4.1. Model Validation

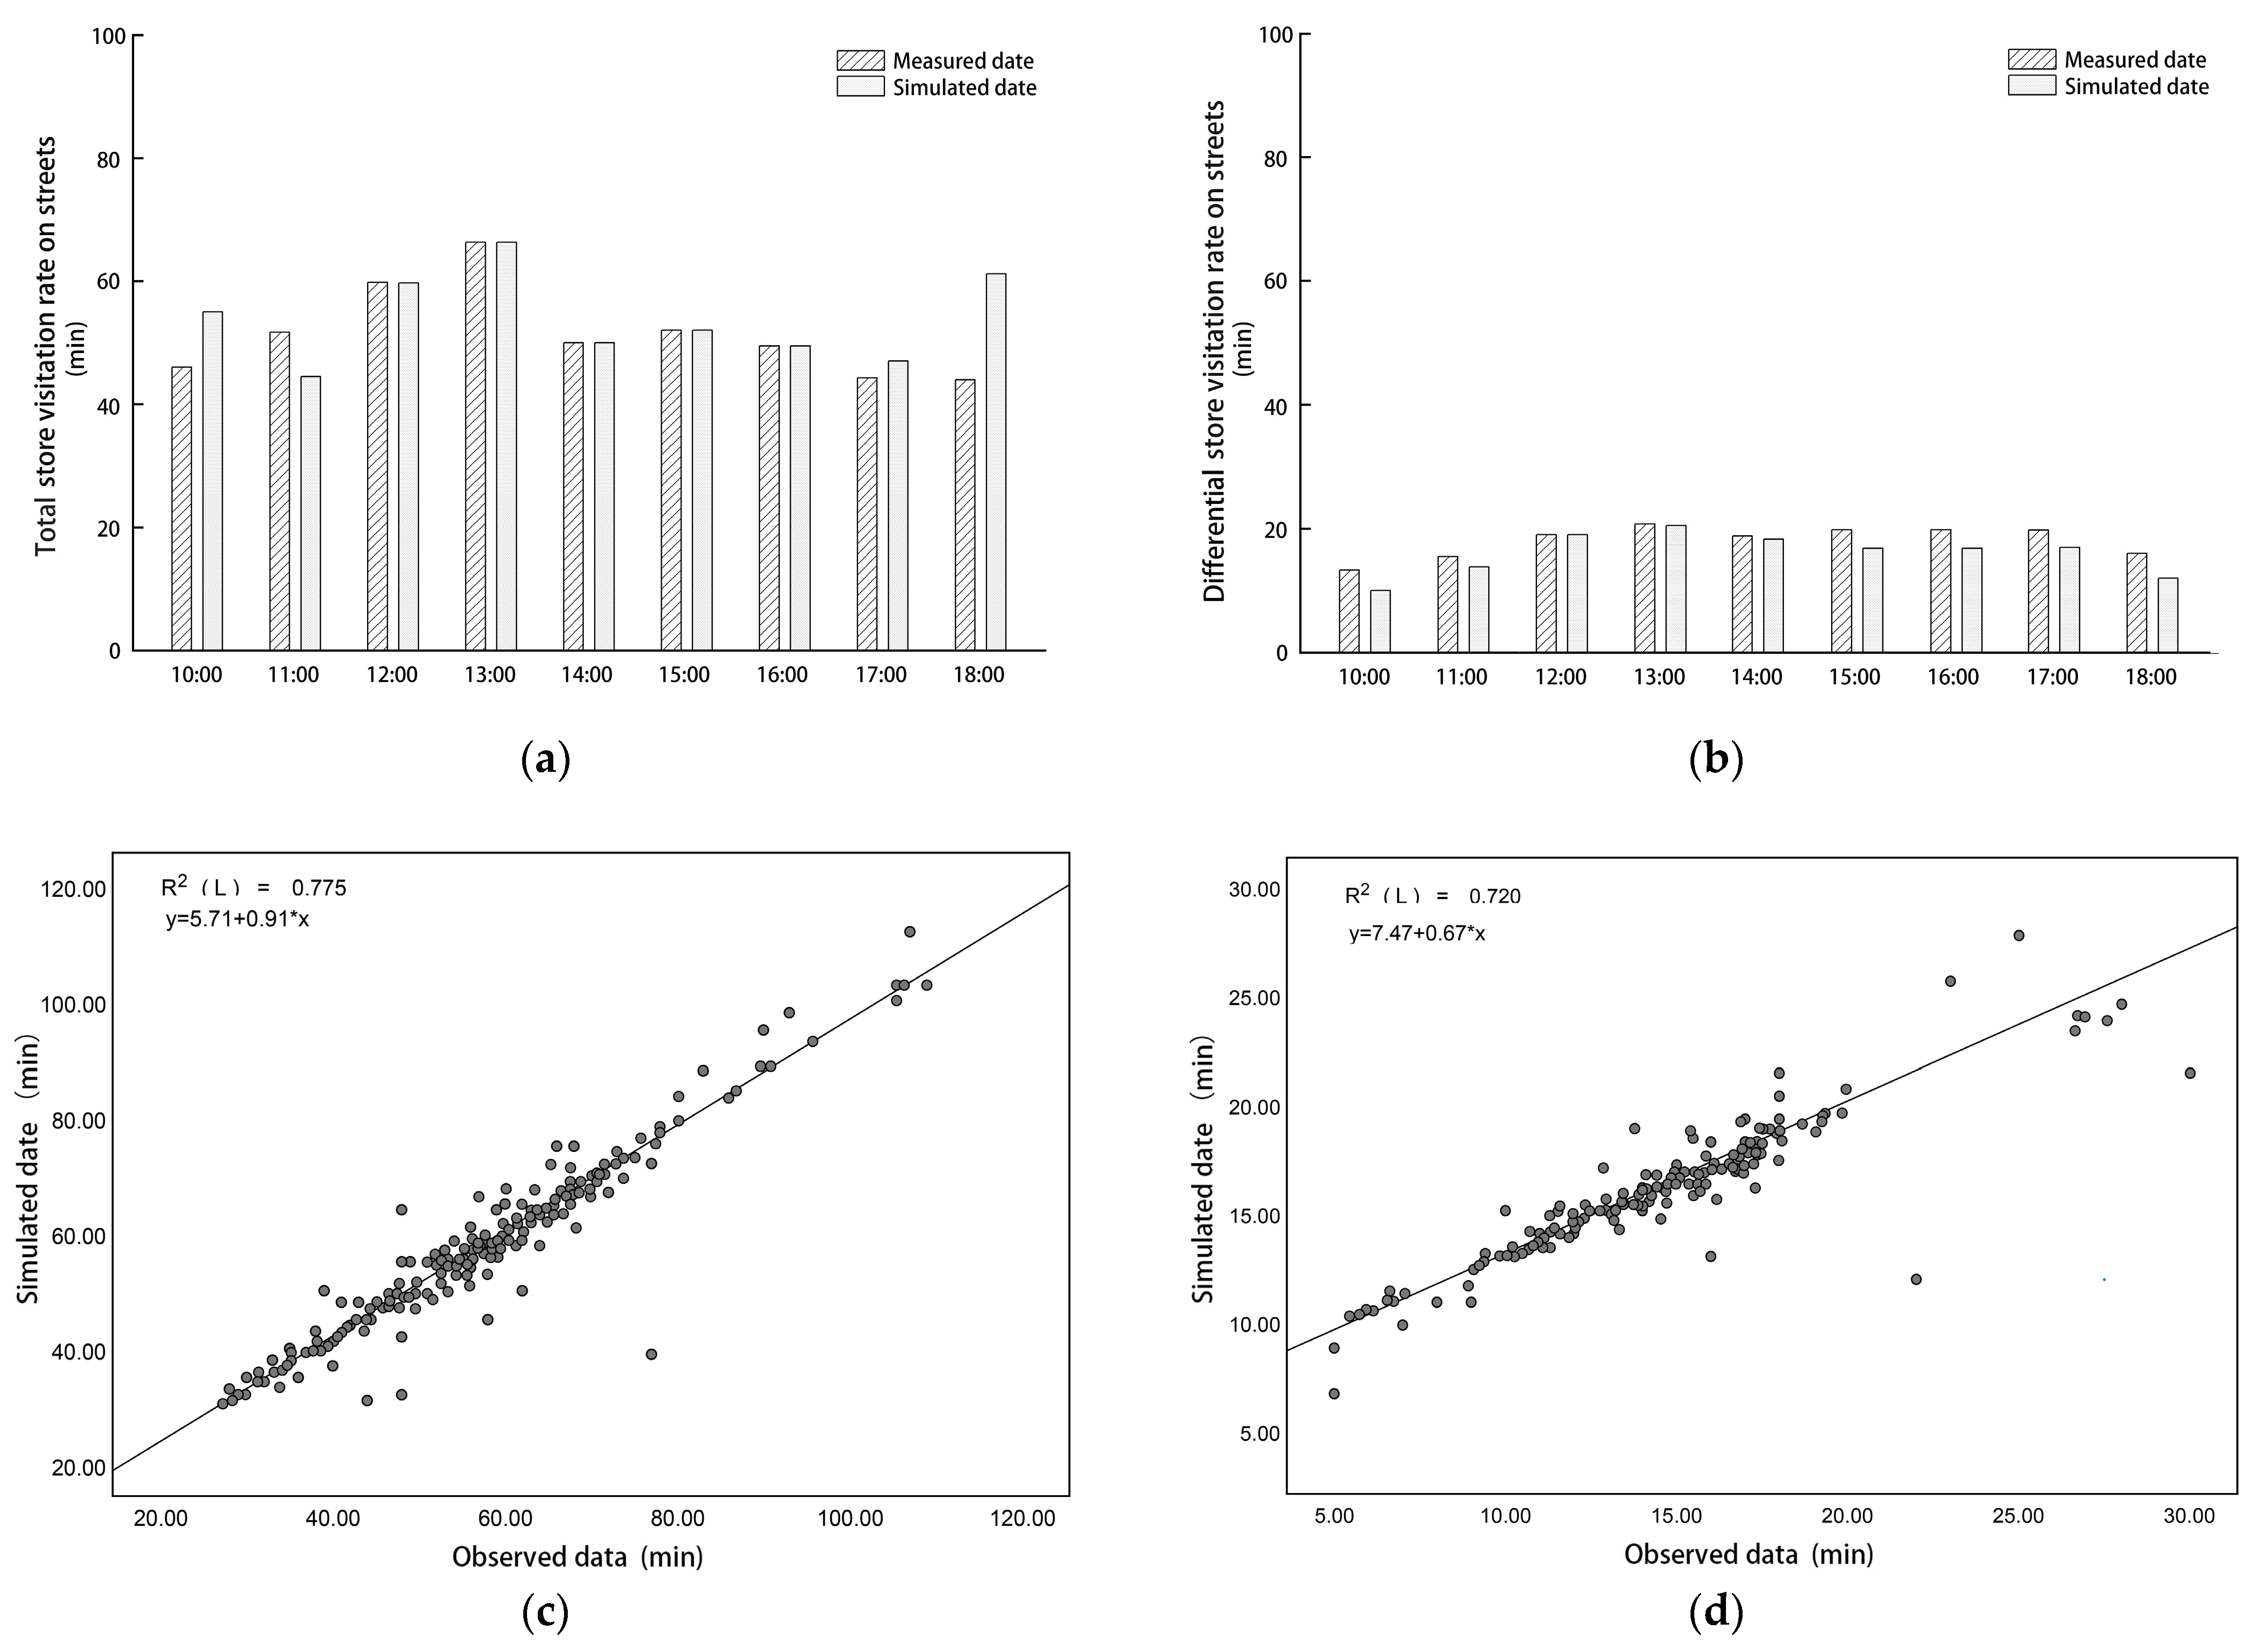
Due to limited research on the simultaneous use of Ladybug and MATLAB for pedestrian simulation, this study aims to assess the accuracy of this approach by comparing hourly simulated store visit counts with on-site measurements from 10:00 to 18:00. Initially, based on actual meteorological data, PET values for the four streets were computed using Rayman software. Subsequently, the observed pedestrian flow totals and PET distribution maps for each street were input into MATLAB to generate simulated data for store visit totals and differences at street measurement points. As shown in Figure 9, the observed and simulated values of store visit counts exhibit similar trends over time, with peak values occurring around 12:00 and 15:00. However, the simulated values are consistently lower than the corresponding observed values throughout the day, indicating a certain range of relative error between them (Figure 9a,b).
Scatter plots of observed and simulated store visit totals were generated (Figure 9c), revealing an average simulation error of approximately 7.3%, a root mean square error (RMSE) of 3.56, and a coefficient of determination (R-squared) value of 0.745. This indicates that the model can explain approximately 74.5% of the variance in the observed data, indicating a good fit; a p-value of less than 0.05 indicates that at a significance level of 5%, you reject the null hypothesis. At this given level of significance, the observed effect is statistically significant. The model’s error is smallest between 12:00 and 16:00, with a minimum error of 4.26%. However, at 18:00, the error increases significantly, reaching 25.93%. Based on the scatter plot, an equation was derived to adjust the model, yielding the following equation:
y = 5.71 + 0.91x
Similarly, scatter plots of observed and simulated store visit differences on both sides of the street were generated (Figure 9d), revealing an average simulation error of approximately 3.6%, an RMSE value of 2.18, and an R-squared value of 0.720. This indicates that the model can explain approximately 72.0% of the variance in the observed data, also indicating a good fit; a p-value of less than 0.05 indicates that at a significance level of 5%, you reject the null hypothesis. At this given level of significance, the observed effect is statistically significant. Based on the scatter plot, an equation was derived to adjust the model, yielding the following equation:
y = 7.47 + 0.67x
In conclusion, the simulation model is relatively accurate, but there is still some predictive error present.

4.2. Shop Visitation in All Experimental Scenarios

Shop visit volume serves as an important indicator of spatial vibrancy, with the total visit count providing a clear measure of the street’s vitality. The difference in visit counts between shops on opposite sides of the street can reveal the distribution of vibrancy along the street. To explore the impact of different design factors, 64 scenarios were simulated with varying street width-to-height ratios, street orientation, and facade design. Each scenario used 100 agents and was repeated 20 times to ensure consistency. The simulation results were then adjusted using Formulas (1) and (2), with Figure 10 displaying the corrected outcomes.
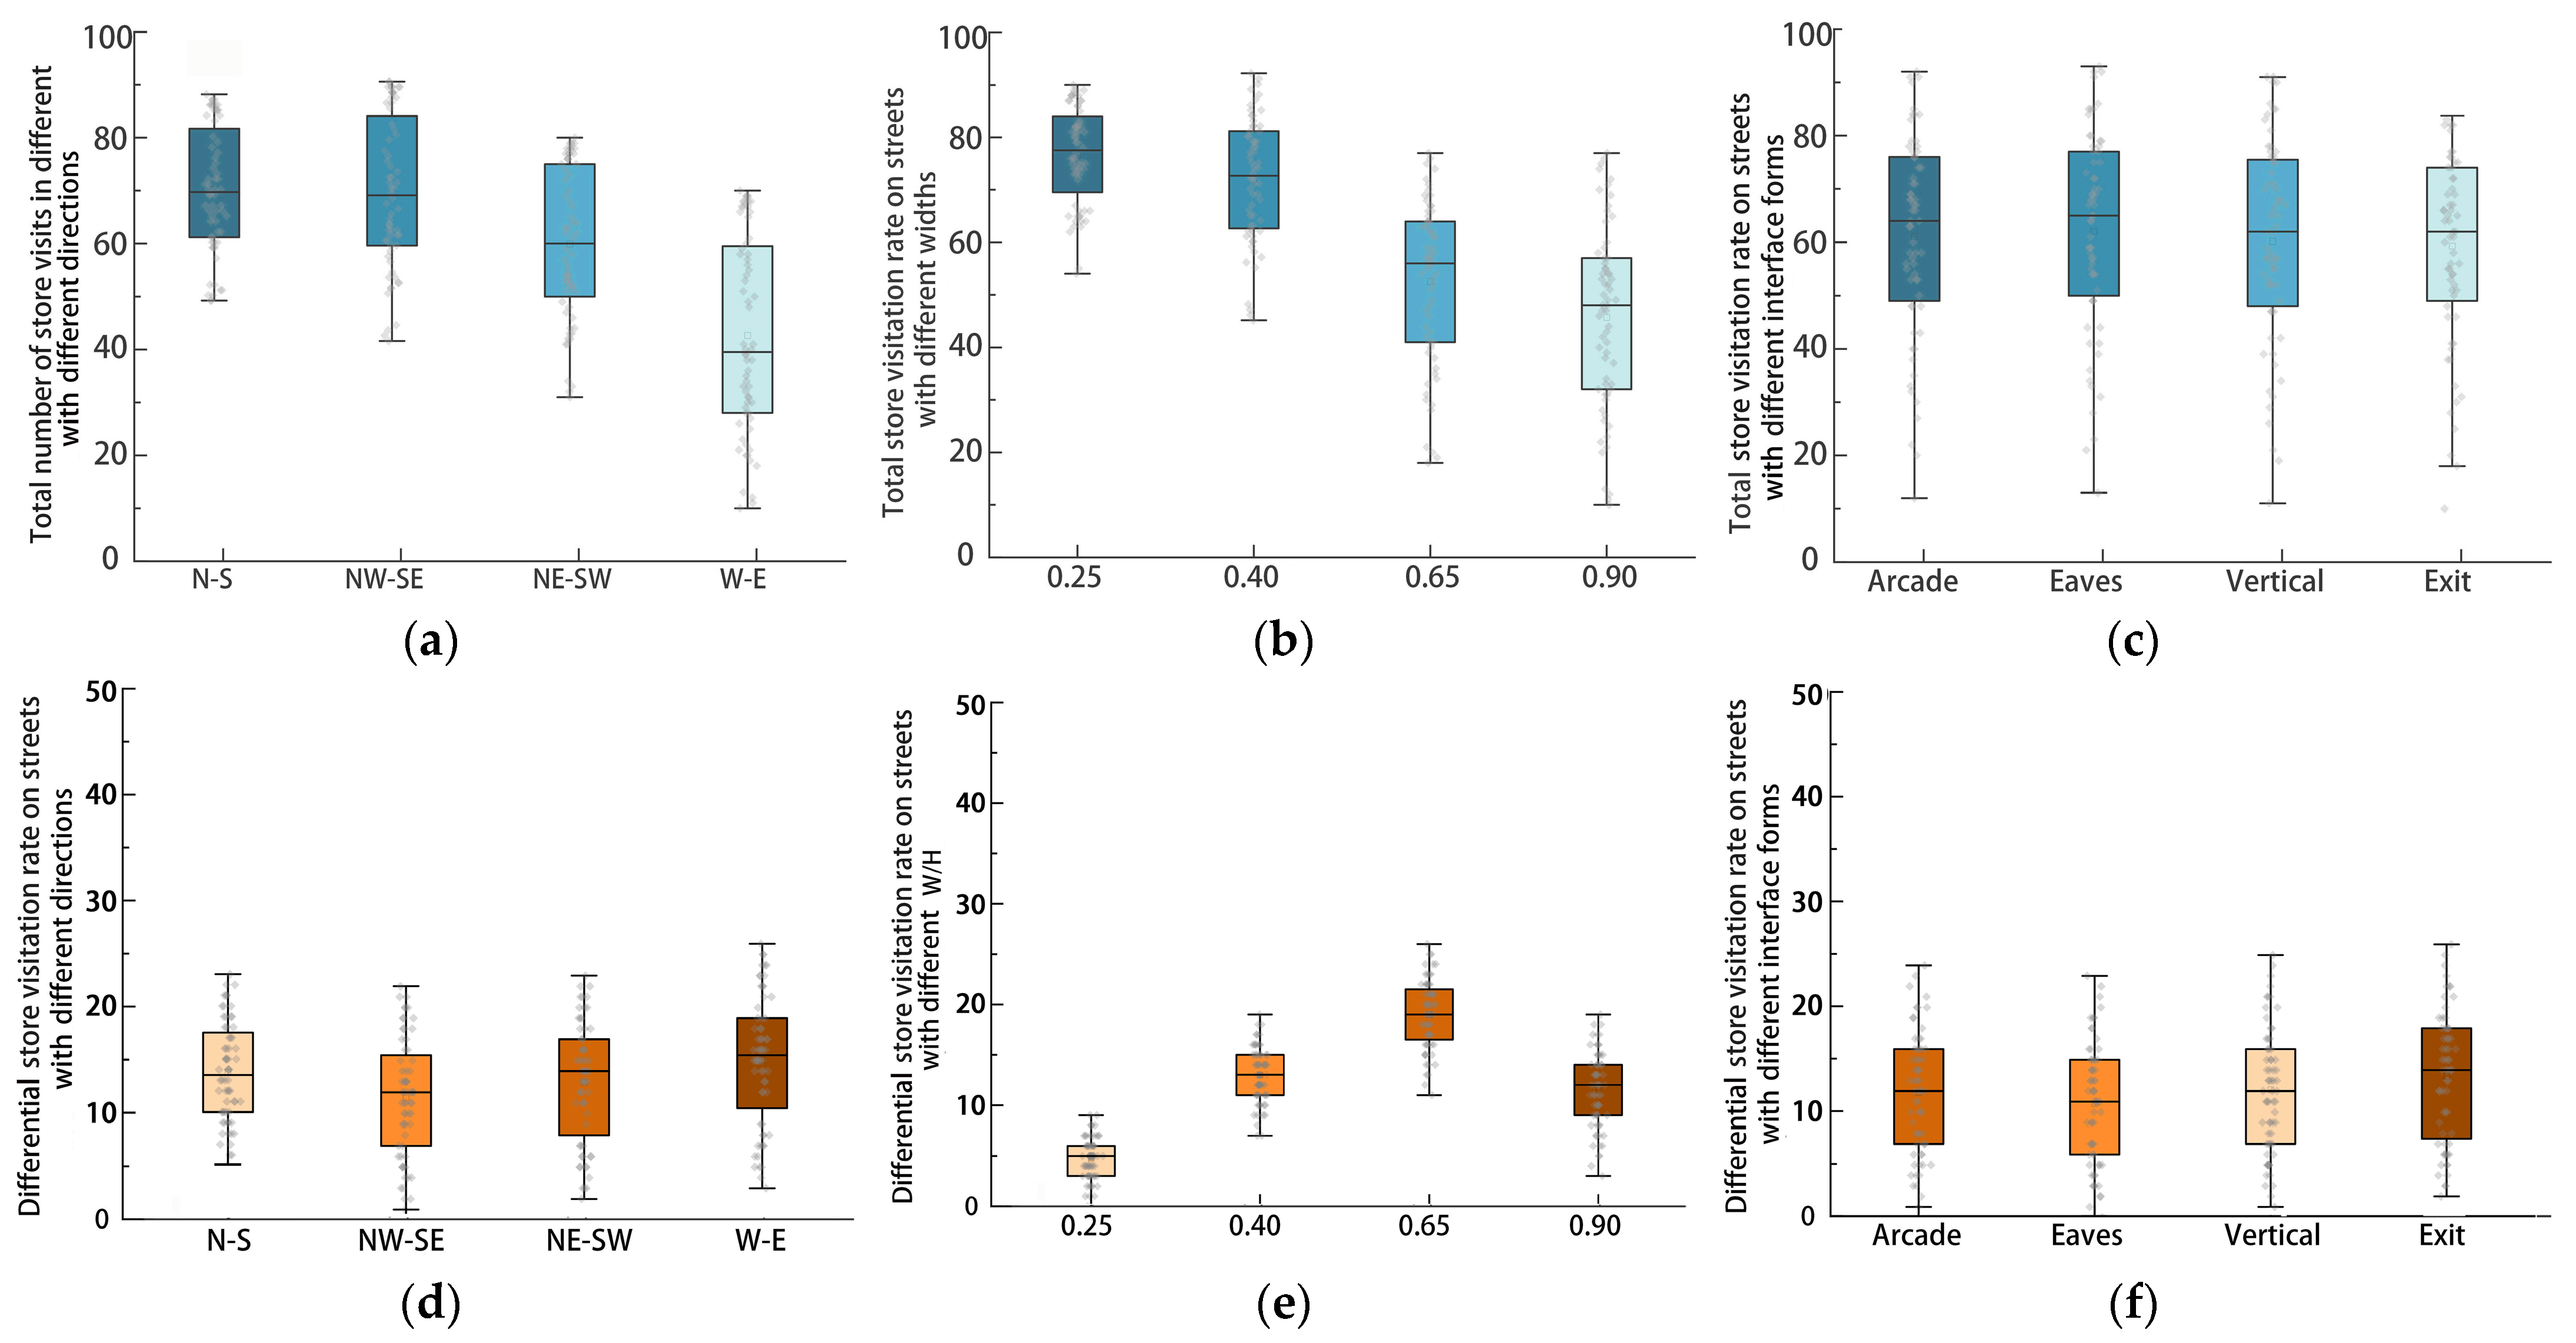
The TSV and DSV characteristics in different directions are shown in Figure 10a,d. The results show that there is a significant difference between TSV and DSV streets of streets in different directions, divided according to TSV: NW-SE > N-S > NE-SW > E-W; divided according to DSV E-W > N-S > NE-SW > NW-SE, it can be seen that streets in the direction of NW-SE have the strongest vitality, and streets in the direction of E-W have the worst homogeneity. The streets in NW-SE have 47.2% higher TSV values than those in E-W, and the streets in E-W have 47.2% higher TSV values than those in NW-SE, and the streets in E-W have 47.2% higher TSV values than those in NW-SE. TSV values are 47.2% higher, and streets in E-W have 4.47 times the DSV values of streets in NW-SE.
The TSV and DSV characteristics for different aspect ratios are shown in Figure 10b,e. The results show that TSV decreases gradually with the increase of street W/H, and DSV increases and then decreases with the increase of street W/H, and reaches the maximum at 0.65, which shows that the streets with 0.25 to 0.4 have better vigor and homogeneity, the streets with 0.65 have poorer homogeneity in terms of vigor, and the streets with 0.9 have poorer vigor. The street with a W/H of 0.25 has a higher TSV value of 54.9% than the street with a W/H of 0.9, and streets with a W/H of 0.65 have 1.21 times the DSV values of streets with a W/H of 0.25.
The TSV and DSV characteristics of different interface forms are shown in Figure 10c,f. The results show that the differences in TSV and DSV of different interface forms are small, divided according to TSV: Overhang form > Arcade form > Vertical form > Exit form; divided according to DSV: Overhang form > Exit form > Arcade form > Vertical form, it can be seen that the streets with eaves form have the strongest vitality and the best uniformity, and those with receding form have the worst. The maximum and minimum values of TSV and DSV are all within the difference of 10% or less.

4.3. Correlation Analysis between Street Geometric Parameters and TSV & DSV

Using TSV and DSV as indicators for assessing street vitality, a multiple linear regression analysis was conducted with three geometric parameters: street width-to-height ratio, street orientation, and facade form, along with TSV and DSV. A forced entry method was used to determine the impact of these geometric parameters on street vitality and to establish mathematical models that link TSV and DSV to these various parameters.
Dummy variables are artificial constructs that reflect qualitative attributes, typically with values of 0 or 1. By introducing dummy variables, problem descriptions are simplified and become more aligned with real-world conditions. When the independent variable is a categorical variable, it needs to be converted into dummy variables, which are binary (having values of “0” or “1”). The variable with a value of “0” serves as the reference category. In this study, the north-south, northwest-southeast, and northeast-southwest orientations are represented as dummy variables, with east-west orientation as the reference category. Similarly, the terrace, cantilever, and vertical facade forms are dummy variables, with the arcade form serving as the reference category.
To avoid multicollinearity among variables, SPSS 25.0 was used to check for covariance. The results showed that the covariance among the width-to-height ratio, four street orientations, and facade forms was 1.000, 1.000, 0.667, 0.667, 0.667, 0.667, 0.667, and 0.667. The tolerance values were all above 0.1, indicating no significant collinearity among these variables and suggesting no mutual influence among street width, street orientation, and facade forms.
To quantify the impact of geometric parameters on street vitality in cold-climate commercial streets during summer, Pearson regression analysis was performed using SPSS. The results are shown in Table 4. If the significance value (Sig.) is less than 0.05, it indicates a significant correlation between the independent variables and the dependent variables.
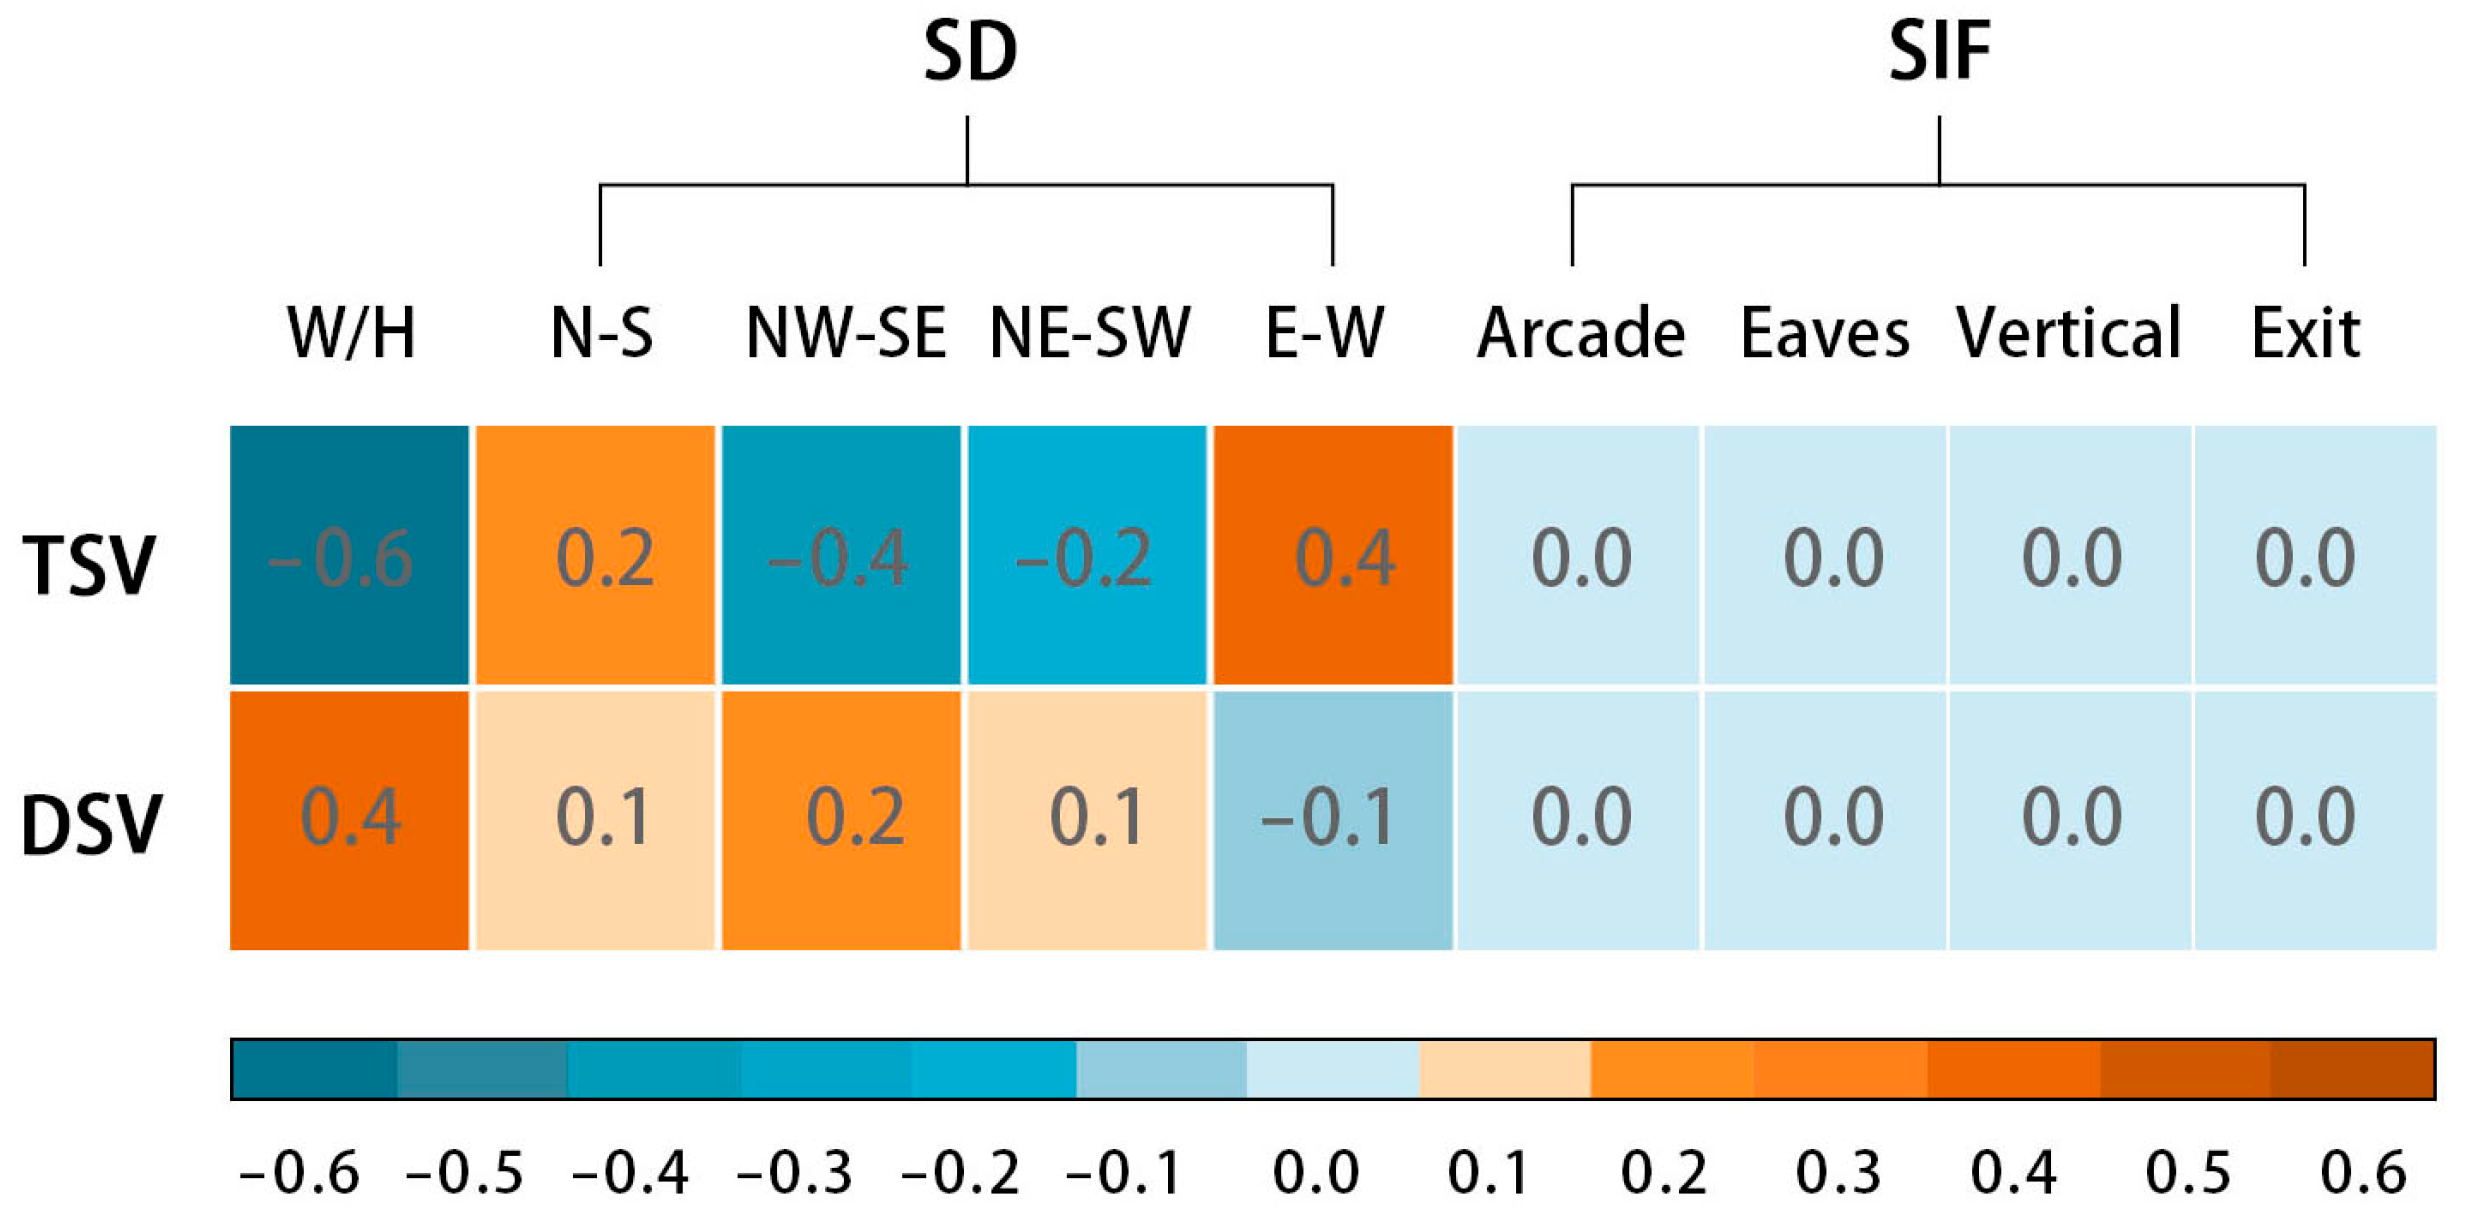
The table shows that the correlation coefficients between the summer street width-to-height ratio (W/H) and both Thermal Sensation Vote (TSV) and Distribution Sensation Vote (DSV) are −0.660 and 0.435, respectively, with significant values (Sig.) of 0.000. These results, being below the 0.001 threshold, indicate a significant negative correlation between TSV and W/H ratio, and a significant positive correlation between DSV and W/H ratio (Figure 11).
Regarding street orientation, the correlation coefficients with TSV and DSV are 0.239 and 0.191, respectively, with Sig. values of 0.026 and 0.000, showing a significant positive correlation between the north-south (N-S) orientation and both TSV and DSV at the 0.05 significance level. The northeast-southwest (NE-SW) and east-west (E-W) orientations exhibit a significant negative correlation with TSV and a significant positive correlation with DSV. Conversely, the northwest-southeast (NW-SE) orientation shows a significant positive correlation with TSV and a significant negative correlation with DSV.
For the correlation between facade forms and TSV and DSV, the coefficients are 0.017, 0.05, −0.017, 0.017, −0.018, −0.015, −0.02, and −0.018, with all Sig. values exceeding 0.05.
This suggests that facade forms do not have a significant correlation with TSV or DSV at this significance level.
Excluding facade forms, a multiple linear regression analysis was conducted with TSV and DSV as dependent variables, and street W/H ratio and street orientation as independent variables. The first analysis indicated that the TSV regression equation (F (2,63) = 512.046, p < 0.0001) had an R2 of 0.722, indicating that the model is relatively accurate and offers valuable insights. The regression formula for TSV in summer cold-climate commercial streets is as follows:
TSV = 113.868 − 2.518 ∗ W/H − 10.206 ∗ SD
The DSV regression analysis (F (2,64) = 364.553, p < 0.0001) yielded an R2 of 0.742, demonstrating that the model holds considerable reliability and provides the following formula for DSV in summer cold-climate commercial streets:
DSV = 1.244 + 0.52 ∗ W/H + 2.038 ∗ SD
These findings offer valuable guidance on how street geometric parameters impact TSV and DSV, helping inform the design of commercial streets in cold-climate regions to enhance their vitality and comfort.
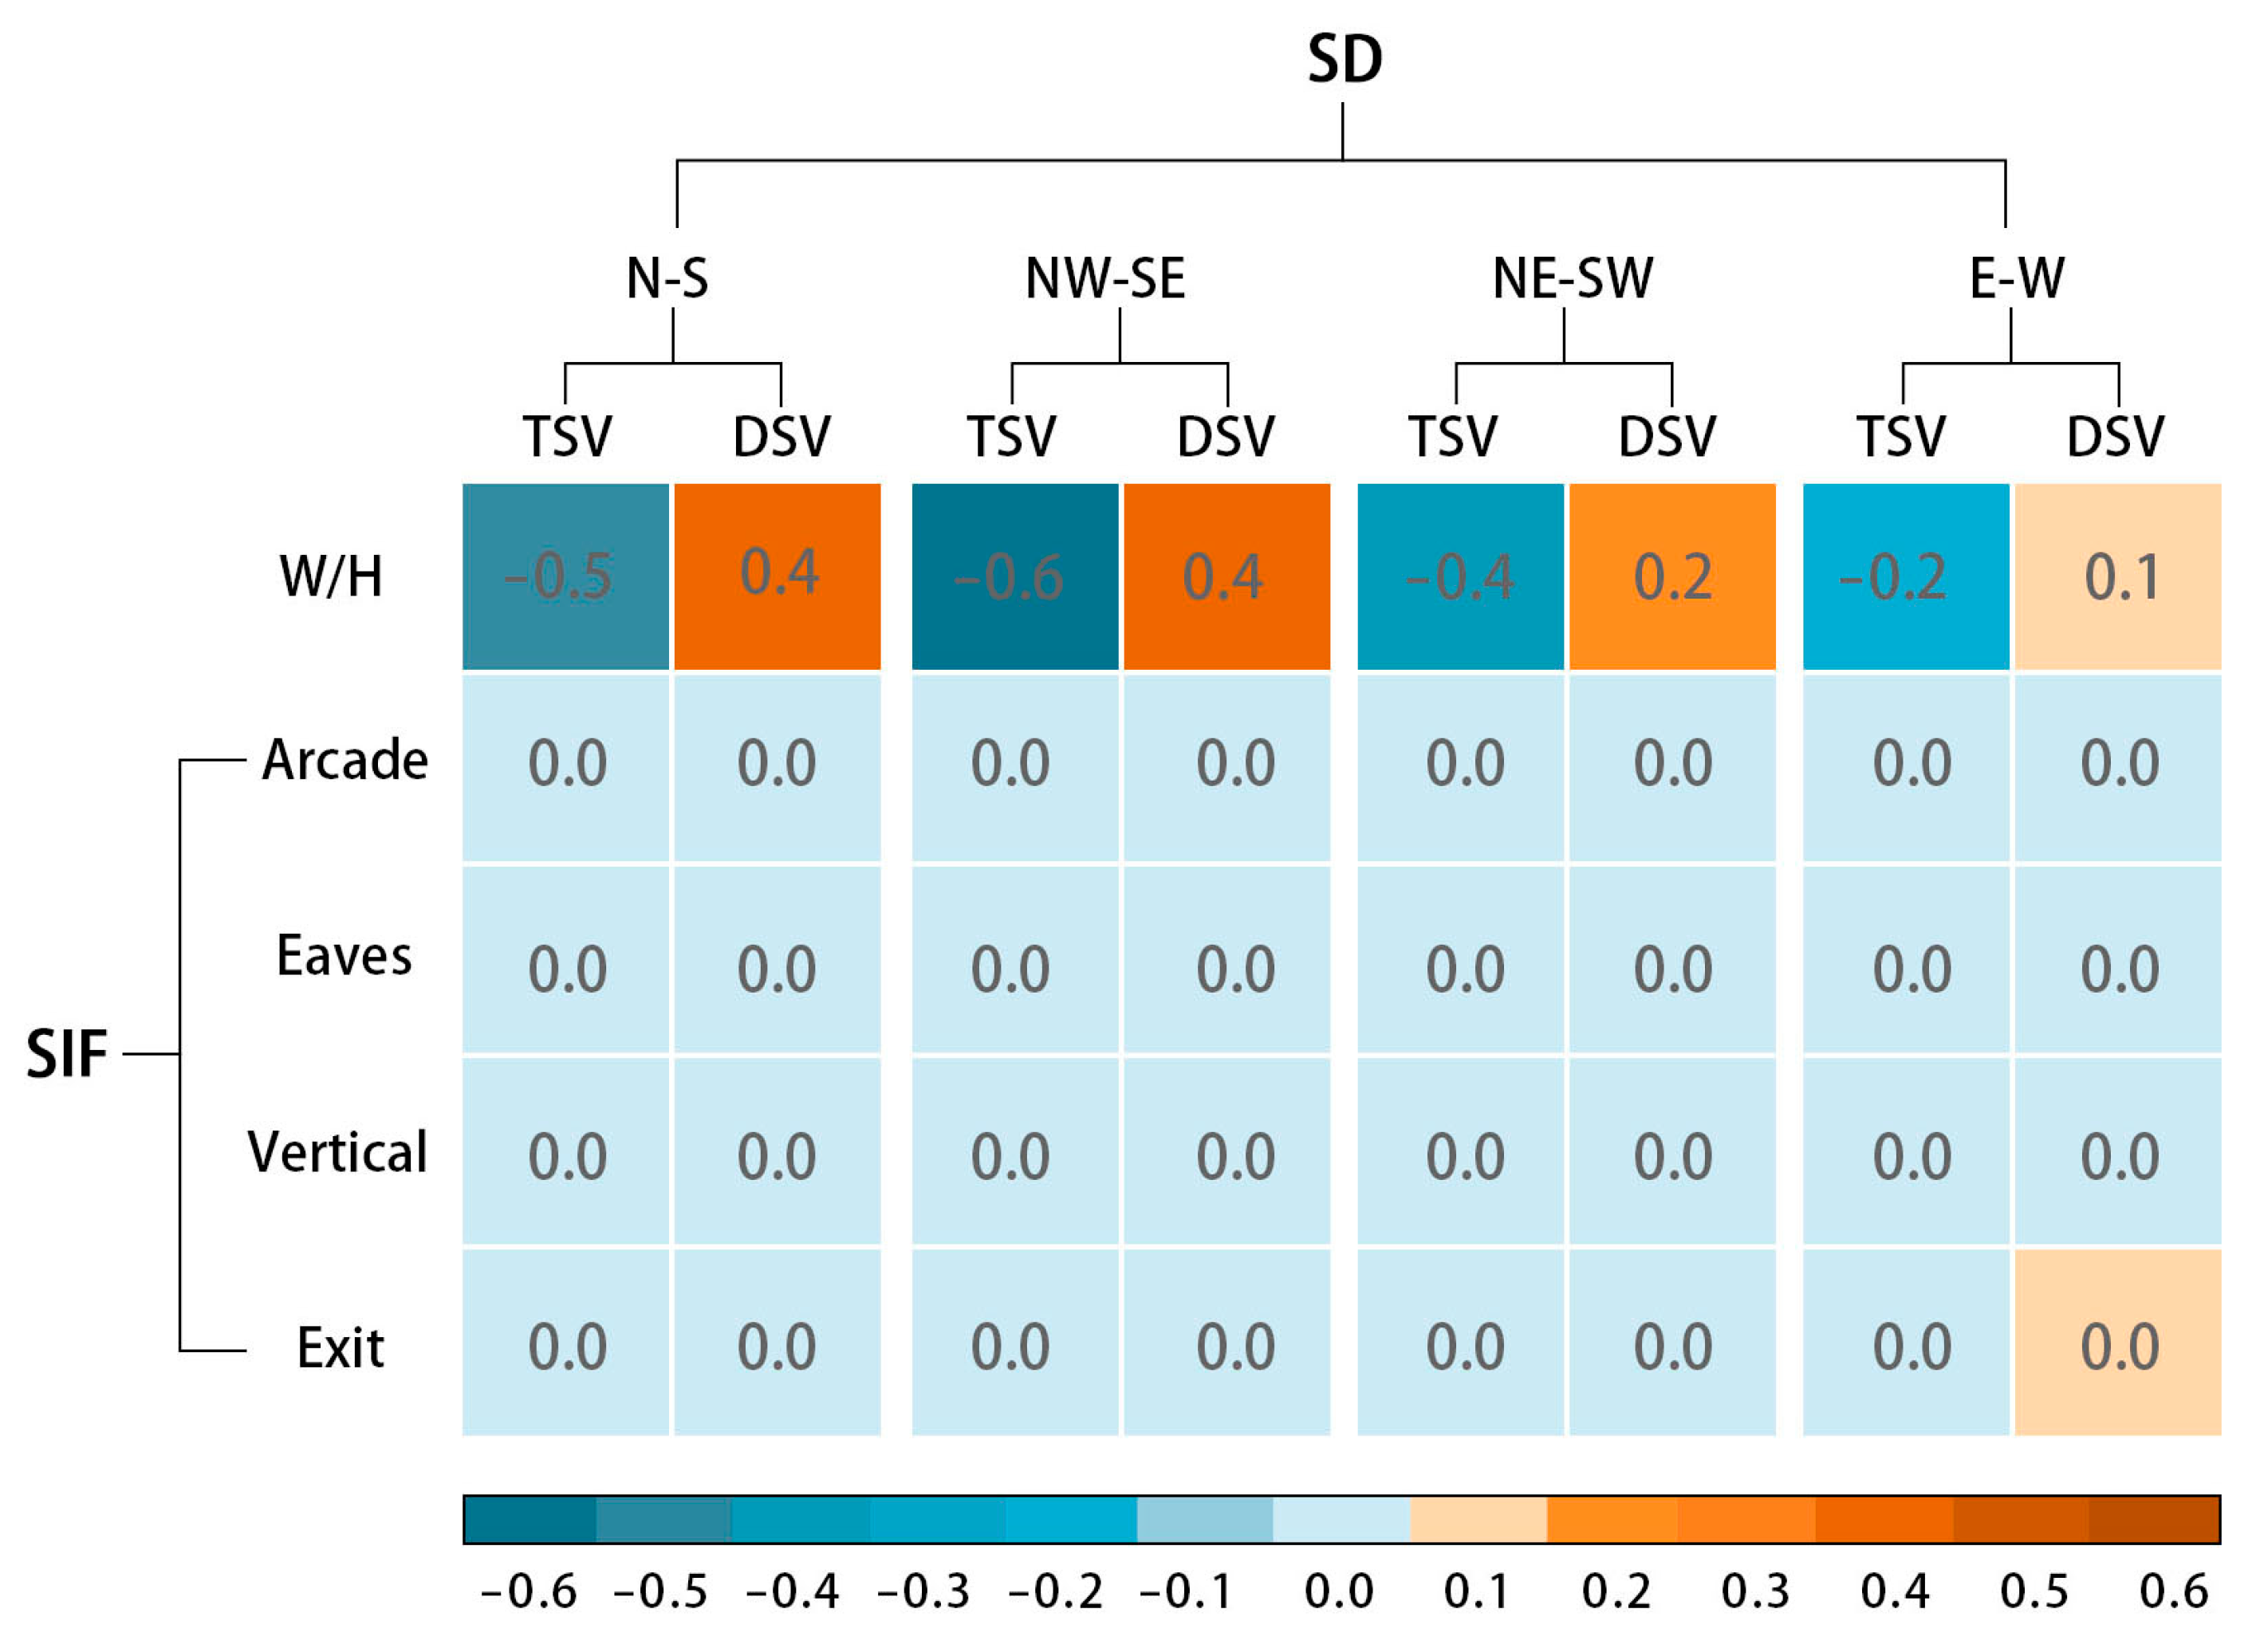
However, after controlling for street orientation, the relationship between the W/H ratio and both TSV and DSV changed. Specifically, in the N-S (north-south) direction, as the W/H ratio increases, the correlation between W/H and TSV/DSV weakens, with correlation coefficients decreasing by 0.097 and 0.018, respectively. The TSV value decreases, while the DSV value increases. The NW-SE (northwest-southeast) and NE-SW (northeast-southwest) directions exhibit similar trends, though to a lesser extent. The E-W (east-west) direction, however, shows little change in TSV and DSV values with varying W/H ratios.
Interestingly, upon further restricting the street W/H ratio, it was found that the stepped facade performed better in the E-W direction, while the eaves and gallery forms performed poorly. In other directions, the eaves and gallery forms performed best. The correlation coefficient between street interface form and TSV changed to 0.153, with a Sig. value of 0.000, indicating a significant correlation. Based on this, regression analyses were conducted to evaluate the relationship between W/H and TSV/DSV in different street orientations. The results show that 54.4% to 64.4% of TSV variations in four directions can be explained by W/H, while only 25.1% to 39.8% of DSV variations can be explained by W/H, indicating that W/H has a higher explanatory power for TSV variations than for DSV (Figure 12).
Controlling for street W/H ratio, and varying street orientation, the changes in TSV and DSV values are minimal, with correlation coefficients ranging from 0.002 to 0.128. For streets with W/H ratios of 0.25, 0.4, and 0.9 (48 scenarios in total), changes in street orientation do not lead to significant variations in TSV and DSV at the 0.01 and 0.05 significance levels. Only when the street W/H ratio is 0.65 do the E-W and NE-SW directions exhibit a significant correlation with DSV at the 0.05 level, with a correlation coefficient of −0.254 and 0.254, respectively.
Based on these findings, regression analyses were conducted to evaluate the relationship between street orientation and TSV/DSV for different W/H ratios. The results indicate that street orientation can explain only 14.5% to 26.4% of TSV variations and 8.9% to 18.3% of DSV variations, suggesting a lower explanatory power of street orientation for TSV and DSV variations.

5. Discussion

5.1. Review of the Relationship between Street Spatial Forms and TSV/DSV

The spatial morphology of streets not only impacts the PET (Physiological Equivalent Temperature) pattern but also directly affects human psychological and visual perceptions, thereby influencing behavior choices. Through the survey and analysis of commercial streets in typical cold regions, it was found that the design of commercial streets in summer has significant issues and much room for improvement. Building on existing research, this study selected spatial morphology elements that greatly impact pedestrian thermal comfort and visual experience from a human-scale perspective. It combined the influence of street spatial morphology on the thermal environment with human perception and behavior to explore suitable parameter levels for summer commercial street spatial morphology in cold regions. Using a calibrated pedestrian vitality simulation model based on thermal comfort, the study compared TSV (Thermal Sensation Vote) and DSV (Dynamic Sensation Vote) values under different spatial parameter levels of SD (Sky View Factor), W/H (width-to-height ratio), and SIF (Shadow Index Factor). Zhou’s research on the spatial morphology elements and pedestrian vitality of Beijing’s Sanlitun area found that the width of commercial streets at the same height affects pedestrian vitality, consistent with the conclusions of this study. However, Zhou did not discuss the impact of different SD and SIF on street vitality, focusing more on the effect of street business types and facilities arrangement on vitality [40]. Cao’s research found that as W/H changes, the street shading pattern changes significantly; streets with an H/W ratio of 2.6 had a summer PET temperature difference of up to 4 °C compared to streets with an H/W ratio of 7.8 [41]. Additionally, as W/H increases, the same street can accommodate more people, providing a broader field of vision and a better pedestrian experience. However, an excessively high width-to-height ratio can increase pedestrians’ sense of insecurity, reduce their desire to shop, and speed up their walking pace [42]. When pedestrians walk in the street, the street direction has little impact on their visual and psychological perception. However, different street directions significantly affect the street thermal environment and thermal comfort pattern; the comfortable temperature area ratio of E-W-oriented streets is 32.8% less than that of N-S-oriented streets. Although the street interface form provides some shading space, its overall impact on the street’s thermal comfort is not significant due to its scale. However, Yin’s study showed that increasing the gray space on both sides of the street can significantly boost pedestrian purchasing power and street vitality [43]. Therefore, SIF should not be ignored in street design. To further analyze the impact of different spatial morphology parameters on TSV and DSV values, this study conducted Pearson correlation analysis and multiple linear regression analysis on the simulation results, finding that W/H had the greatest impact on TSV and DSV variability, followed by SD, with SIF being basically unrelated.
By analyzing the correlation coefficients between SD, TSV, and DSV, it was found that NW-SE-oriented streets performed best, significantly positively correlated with TSV, and negatively correlated with DSV, indicating that NW-SE-oriented streets have the highest vitality and best uniformity. The effect of street direction on pedestrian visual perception in the same area is relatively minor [41], with more influence likely from the thermal environment’s impact on pedestrian thermal comfort, leading to changes in pedestrian trajectories. E-W-oriented streets performed the worst, with the weakest vitality and the poorest uniformity. This could be due to the high thermal pressure, prolonged sunshine duration, and intensity on E-W-oriented streets, which have been widely reported in previous studies [15,16]. Additionally, this study found that NE-SW-oriented streets performed worse in TSV and DSV values compared to N-S and NW-SE-oriented streets, possibly because NE-SW-oriented streets, like E-W-oriented streets, receive significant solar radiation time and intensity, leading to lower street vitality. However, at a street width-to-height ratio of 0.65, NE-SW-oriented streets were positively correlated with TSV values. This might be because for NW-oriented streets, at a width-to-height ratio of 0.65, buildings block 89% of solar radiation. Further research controlling the street W/H found that the explanatory power of SD and SIF on TSV and DSV value changes was below 30%, and the impact of street direction on TSV and DSV variability was below 30%, especially for DSV variability, which was only 8.9–18.3%. This might be because, with the same width-to-height ratio, the thermal environment layout within the street differs minimally due to building obstructions. However, the duration and intensity of thermal pressure received by streets of different orientations vary significantly.
Regarding the W/H variable in street spatial morphology, it was found that as the W/H value changes, W/H is negatively correlated with TSV values, with a correlation coefficient of −0.660. As shown in Figure 10b, as W/H increases, DSV values continuously decrease, and when W/H is 0.4–0.65, TSV values change rapidly. DSV values are positively correlated with W/H, with a correlation coefficient of 0.435. As shown in Figure 10e, as W/H increases, DSV values first increase and then decrease, with a turning point at W/H of 0.65. In terms of the impact of street width-to-height ratio on pedestrian visual experience, deep canyon streets may speed up pedestrian walking speed, while standard canyon streets better meet psychological needs. Additionally, pedestrian trajectory changes are influenced by changes in the street’s thermal environment. When the street W/H is low, buildings significantly block the street, potentially shading it completely. However, as the street width-to-height ratio increases, the shading area of buildings decreases, and the overall exposure of the street increases, reducing overall street vitality and TSV values [26]. Observing Figure 10b, when the W/H is 0.25–0.4, the street area changes slowly, possibly because at this parameter level, the shadows cast by buildings can entirely cover the street, resulting in minimal changes. However, at 0.4–0.65, the street changes from fully covered to partially covered, directly altering the PET spatial layout of the street. At 0.65–0.9, the impact of buildings can no longer completely shade the street, and the shading area remains constant, but the street area is larger and continues to increase. This finding is similar to Cao’s study on changes in the PET pattern with width-to-height ratio [41], but further deepens the exploration of the level of pedestrian vitality, investigating the specific impact of street W/H on TSV and DSV values. Controlling street direction in further research found that the impact of W/H parameter level changes on TSV and DSV values varied under the same direction. Except for the E-W direction, where the correlation remained unchanged, the other three directions showed varying degrees of weakening.
For spatial configurations, the impact of the four interface forms on TSV and DSV values is not significantly different, with correlations being insignificant. Martinelli’s research identified significant visual attractiveness of eaves and colonnades to pedestrians during the summer, impacting pedestrian vitality significantly [26]. However, a slight disparity exists between Martinelli’s findings and the results of this study. It was discovered that these two forms further augmented their influence on pedestrian vitality. This is attributed to their not only visually attracting pedestrians but also altering street thermal environments, thereby modifying pedestrian trajectories. Additionally, this study found that, after controlling for SD and W/H, certain interface forms were more associated with TSV in east-west street orientations, where setbacks performed better, while colonnades and eaves performed better in the other three orientations. This presents a fascinating phenomenon; although colonnades and eaves may visually attract pedestrians in east-west streets, their impact on street thermal environments is weaker. In setback forms, some rear buildings serve the function of north-south streets, increasing shaded areas, a phenomenon previously noted in the literature [44], further influencing pedestrian trajectories.

5.2. Implications for Planning Guidelines

According to reference [45], streets are the most stable elements in urban morphology. Additionally, street orientation determines the direction of city blocks. While orientation does not significantly impact street vitality, it has been shown that east-west-oriented streets experience longer and more intense heat stress, accelerating pedestrian pace and diminishing the shopping experience, leading to reduced street vitality. North-south streets, despite being shaded by buildings, have a smaller shaded area and a rapidly changing pattern, resulting in more varied thermal conditions and comparatively lower street vitality. Thus, orienting streets along NE-SW and NW-SE axes could be more effective. If necessary, diagonal cuts should typically run from north to south, while minimizing east-west street canyons (Figure 13a).
On the other hand, adjusting building height based on orientation can be beneficial. Simulation results indicate that for NS, NE-SW, and NW-SE street canyons, a lower width-to-height (W/H) ratio is preferable. For east-west-oriented streets, the relationship between urban form and TSV and DSV values is weaker. To avoid increasing the exposure of vertical surfaces to sunlight and wind resistance, east-west streets should feature low- to mid-rise buildings, with larger width-to-height ratios being more suitable. Efforts should be made to minimize street width, ideally not exceeding 8 m. Although street network orientation is crucial, the building facades within blocks can significantly influence or mitigate the impact of this orientation. For example, on north-south streets, adding awnings or adopting arcade-style facades on the west side can increase shaded spaces near buildings, improving the thermal environment around shops and potentially attracting more customers. For east-west streets, incorporating setbacks and step-back spaces could increase shaded areas, thereby enhancing street vitality.
For existing streets, vitality can be improved by increasing building height, reducing the W/H ratio, and adding structures like awnings at the street level. Additionally, adjusting facade materials to increase reflectivity can reduce solar radiation exposure [46]. Adding vegetation to create more shade and rest areas can also be effective in boosting street vitality, as numerous studies suggest [47] (Figure 13b).

6. Conclusions

Recent studies have examined the impact of street spatial morphology on pedestrian-level vitality. This study highlights the deficiencies in the design of commercial streets in cold regions during summer and offers simple, practical design strategies for future modifications and expansions. Although many previous studies analyzed the effect of street spatial morphology on the thermal environment and its impact on street vitality, few have combined these perspectives to examine street spatial morphology from the perspective of pedestrians’ thermal comfort needs.
The study drew on existing research on street orientation, width-to-height (W/H) ratios, and street interface forms, supported by field measurements. Using Grasshopper and MATLAB, the study created a pedestrian simulation model based on thermal comfort needs, with street orientation, W/H ratios, and interface forms as independent variables, and Thermal Sensation Votes (TSV) and Dynamic Sensation Votes (DSV) as dependent variables. The study employed Pearson correlation and multiple regression analyses to explore how different street spatial configurations, in terms of scale and orientation, impact street vitality. This study provides quantitative insights into the effects of street spatial morphology and orientation on pedestrian vitality. The main contributions are summarized as follows:
  • A pedestrian simulation model was developed using Grasshopper-MATLAB software, integrating thermal comfort simulation with pedestrian simulation, and calibrated with field measurement data.
  • From the perspective of pedestrian thermal comfort, the study analyzed the influence of street spatial morphology on street vitality, finding that the W/H ratio had a higher explanatory power for street vitality than street orientation, while street interface forms had a weaker impact.
  • Based on the study’s findings, it proposes design strategies for summer city streets in cold regions, suggesting that new street design should be based on orientation to determine the W/H ratio. For existing streets, the interface form can be adjusted based on street orientation.
Given that this study was conducted during the summer in Beijing, a city with a typical cold-region climate, the climate and perception of thermal comfort vary across different countries and regions [47,48]. Even within cold regions, there can be significant differences in shading performance. For example, while both Xi’an and Beijing are cold regions, people in Xi’an tend to tolerate heat stress better [49]. This indicates that different approaches should be used even within similar climate zones, considering local preferences. Additionally, translating these research findings into practical government policies and everyday applications is essential. This study showcases the most effective policy-oriented research approach in Beijing aimed at enhancing street pedestrian vitality. Future research should promote similar approaches tailored to specific climatic backgrounds and policy frameworks. This recommendation will foster meaningful dialog between researchers and policymakers, encouraging the implementation of research results to improve urban environmental comfort.

Author Contributions

Conceptualization, M.B., R.H., H.L. and W.Z.; Data curation, R.H.; Investigation, R.H.; Methodology, M.B., R.H. and H.L.; Software, R.H. and H.L.; Validation, R.H.; Visualization, W.Z.; Writing—original draft, M.B., R.H., H.L. and W.Z.; Writing—review & editing, M.B., R.H. and H.L. All authors have read and agreed to the published version of the manuscript.

Funding

This research received no external funding.

Data Availability Statement

Data is contained within the article.

Conflicts of Interest

The authors declare no conflict of interest.

References

  1. Watkins, R.; Palmer, J.; Kolokotroni, M. Increased Temperature and Intensification of the Urban Heat Island: Implications for Human Comfort and Urban Design. Built Environ. 2007, 33, 85–96. [Google Scholar] [CrossRef]
  2. Mukherjee, S.; Mishra, A.K.; Mann, M.E.; Raymond, C. Anthropogenic Warming and Population Growth May Double US Heat Stress by the Late 21st Century. Earth’s Future 2021, 9, e2020EF001886. [Google Scholar] [CrossRef]
  3. Lin, T.-P. Thermal Perception, Adaptation and Attendance in a Public Square in Hot and Humid Regions. Build. Environ. 2009, 44, 2017–2026. [Google Scholar] [CrossRef]
  4. Robine, J.-M.; Cheung, S.L.K.; Roy, S.L.; Oyen, H.V.; Griffiths, C.; Michel, J.-P.; Herrmann, F.R. Death Toll Exceeded 70,000 in Europe during the Summer of 2003. C. R. Biol. 2008, 331, 171–178. [Google Scholar] [CrossRef] [PubMed]
  5. Hong, C.; Zhang, Q.; Zhang, Y.; Davis, S.J.; Tong, D.; Zheng, Y.; Liu, Z.; Guan, D.; He, K.; Schellnhuber, H.J. Impacts of Climate Change on Future Air Quality and Human Health in China. Proc. Natl. Acad. Sci. USA 2019, 116, 17193–17200. [Google Scholar] [CrossRef]
  6. Wu, C.; Tax, W.; Huang, Z.; Wang, C.; Qiao, L.; Wu, Y. Construction and application of urban high temperature vulnerability warning system. Trop. Geogr. 2024, 44, 121–142. [Google Scholar] [CrossRef]
  7. Zacharias, J.; Stathopoulos, T.; Wu, H. Microclimate and Downtown Open Space Activity. Environ. Behav. 2001, 33, 296–315. [Google Scholar] [CrossRef]
  8. Eliasson, I.; Knez, I.; Westerberg, U.; Thorsson, S.; Lindberg, F. Climate and Behaviour in a Nordic City. Landsc. Urban Plan. 2007, 82, 72–84. [Google Scholar] [CrossRef]
  9. MOHURD. GB 50176-2016; Code for Thermal Design of Civil Building. Ministry of Housing and Urban-Rural Development: Beijing, China, 2016. [CrossRef]
  10. Huang, Q. Characteristics of Summer High Temperature Changes in Beijing and Their Impact on Urban Heat Island Intensity. Meteorol. Sci. Technol. 2023, 51, 66–74. [Google Scholar] [CrossRef]
  11. Yin, S.; Wang, F.; Xiao, Y.; Xue, S. Comparing cooling efficiency of shading strategies for pedestrian thermal comfort in street canyons of traditional shophouse neighborhoods in Guangzhou, China. Urban Clim. 2022, 43, 101165. [Google Scholar] [CrossRef]
  12. Huang, Z.; Cheng, B.; Gou, Z.; Zhang, F. Outdoor Thermal Comfort and Adaptive Behaviors in a University Campus in China’s Hot Summer-Cold Winter Climate Region. Build. Environ. 2019, 165, 106414. [Google Scholar] [CrossRef]
  13. Li, J.; Liu, N. The Perception, Optimization Strategies and Prospects of Outdoor Thermal Comfort in China: A Review. Build. Environ. 2020, 170, 106614. [Google Scholar] [CrossRef]
  14. Wang, S.; Yi, Y.K.; Liu, N. Multi-Objective Optimization (MOO) for High-Rise Residential Buildings’ Layout Centered on Daylight, Visual, and Outdoor Thermal Metrics in China. Build. Environ. 2021, 205, 108263. [Google Scholar] [CrossRef]
  15. Hwang, R.-L.; Lin, T.-P.; Matzarakis, A. Seasonal Effects of Urban Street Shading on Long-Term Outdoor Thermal Comfort. Build. Environ. 2011, 46, 863–870. [Google Scholar] [CrossRef]
  16. Xu, X.; Sun, S.; Liu, W.; García, E.H.; He, L.; Cai, Q.; Xu, S.; Wang, J.; Zhu, J. The Cooling and Energy Saving Effect of Landscape Design Parameters of Urban Park in Summer: A Case of Beijing, China. Energy Build. 2017, 149, 91–100. [Google Scholar] [CrossRef]
  17. Watanabe, S.; Ishii, J. Effect of Outdoor Thermal Environment on Pedestrians’ Behavior Selecting a Shaded Area in a Humid Subtropical Region. Build. Environ. 2016, 95, 32–41. [Google Scholar] [CrossRef]
  18. Ren, Z.; Wang, Y.; Wang, L. Design and Research on the System of Public Safety Management Based on WIFI Probe. Hans J. Data Min. 2017, 07, 77–81. [Google Scholar] [CrossRef]
  19. Zhang, X.; Chang, G.-L. A Mixed-Flow Simulation Model for Congested Intersections with High Pedestrian–Vehicle Traffic Flows. Simulation 2014, 90, 570–590. [Google Scholar] [CrossRef]
  20. Ren, X.; Wang, C.; Wang, D.; Chen, S. Spatial performance evaluation of Daning commercial complex from the perspective of consumer behavior. Planner 2018, 34, 101–107. [Google Scholar] [CrossRef]
  21. Wang, D.; Zhu, W.; Wang, C. Spatial Behavior Analysis Method; Science Press: Beijing, China, 2021; pp. 154–196. ISBN 9787030690548. [Google Scholar]
  22. Kabošová, L.; Chronis, A.; Galanos, T.; Kmeť, S.; Katunský, D. Shape Optimization during Design for Improving Outdoor Wind Comfort and Solar Radiation in Cities. Build. Environ. 2022, 226, 109668. [Google Scholar] [CrossRef]
  23. Askarizad, R.; Safari, H. The influence of social interactions on the behavioral patterns of the people in urban spaces (case study: The pedestrian zone of Rasht Municipality Square, Iran). Cities 2020, 101, 102687. [Google Scholar] [CrossRef]
  24. Lin, T.-P.; Tsai, K.-T.; Liao, C.-C.; Huang, Y.-C. Effects of Thermal Comfort and Adaptation on Park Attendance Regarding Different Shading Levels and Activity Types. Build. Environ. 2013, 59, 599–611. [Google Scholar] [CrossRef]
  25. Kim, S.W.; Brown, R.D. Pedestrians’ behavior based on outdoor thermal comfort and micro-scale thermal environments, Austin, TX. Sci. Total Environ. 2022, 808, 152143. [Google Scholar] [CrossRef] [PubMed]
  26. Martinelli, L.; Lin, T.P.; Matzarakis, A. Assessment of the influence of daily shadings pattern on human thermal comfort and attendance in Rome during summer period. Build. Environ. 2015, 92, 30–38. [Google Scholar] [CrossRef]
  27. Ou, H.-Y.; Lin, T.-P. Effects of Orientation and Dimensions of Shading Structures on Thermal Comfort. Build. Environ. 2023, 243, 110715. [Google Scholar] [CrossRef]
  28. Lian, H.; Zhang, J.; Hu, Y.; Bai, M. Frontiers of research on simulation of pedestrian walking behavior decision-making in built environments. New Archit. 2019, 6, 32–35. [Google Scholar] [CrossRef]
  29. Lian, H.; Kong, Y.; Hu, Y.; Huo, Y. Research frontiers in the field of architectural planning based on multi-agent pedestrian simulation. J. Tianjin Univ. (Soc. Sci. Ed.) 2020, 22, 52–56. [Google Scholar] [CrossRef]
  30. Xu, D. Research on Micro-Scale Pedestrian Simulation Based on Reinforcement Learning; East China Normal University: Shanghai, China, 2021. [Google Scholar] [CrossRef]
  31. Li, G. Research on Optimal Design of Commercial Street Spatial Layout Based on Pedestrian Simulation; Hebei University of Engineering: Handan, China, 2020. [Google Scholar] [CrossRef]
  32. Li, Y.; Meng, D.; Guo, X. Seasonal variation, and spatial heterogeneity of driving factors of land surface temperature in Beijing. J. Cap. Norm. Univ. (Nat. Sci. Ed.) 2023, 44, 69–79. [Google Scholar] [CrossRef]
  33. Liang, W.; Yue, X. Research on Open Space Design of Taiguli Commercial District in Sanlitun, Beijing. Huazhong Archit. Archit. 2016, 9, 131–134. [Google Scholar] [CrossRef]
  34. Ashihara, Y. The Aesthetic Townscape/Yoshinobu Ashihara; The MIT Press: Cambridge, MA, USA, 1983. [Google Scholar]
  35. ISO Standard 7730-2005; Ergonomics of the Hemal Environment. Analytical Determination and Interpretation of Thermal Comfort using Calculation of the PMV and PPD Indices and Local Thermal Comfort Criteria. ISO: Geneva, Switzerland, 2005; pp. 5–45.
  36. ISO Standard 9920-2009; Ergonomics of Thermal Environment. Estimation of the Thermal Insulation and Evaporative Resistance of a Clothing Ensemble. ISO: Geneva, Switzerland, 2009; pp. 7–9.
  37. Song, R.; Xin, S.; Lian, H.; Zhou, F. Research on pedestrian simulation of commercial square based on visual attraction algorithm. Decoration 2023, 1, 130–132. (In Chinese) [Google Scholar]
  38. Melnikov, V.; Krzhizhanovskaya, V.V.; Sloot, P.M.A. Models of Pedestrian Adaptive Behaviour in Hot Outdoor Public Spaces. Procedia Comput. Sci. 2017, 108, 185–194. [Google Scholar] [CrossRef]
  39. Gupta, A.; Li, Y.; Fernie, G. Effects of Temperature and Time of Day on Pedestrian Walking Speed. In Proceedings of the ICADI 2008: International Conference on Aging, Disability, and Independence, St. Petersburg, FL, USA, 20–23 February 2008. [Google Scholar]
  40. Wu, C.; Ye, Y.; Gao, F.; Ye, X. Using Street View Images to Examine the Association between Human Perceptions of Locale and Urban Vitality in Shenzhen, China. Sustain. Cities Soc. 2023, 88, 104291. [Google Scholar] [CrossRef]
  41. Yin, Q.; Cao, Y.; Sun, C. Research on Outdoor Thermal Comfort of High-Density Urban Center in Severe Cold Area. Build. Environ. 2021, 200, 107938. [Google Scholar] [CrossRef]
  42. Hahm, Y.; Yoon, H.; Choi, Y. The Effect of Built Environments on the Walking and Shopping Behaviors of Pedestrians; A Study with GPS Experiment in Sinchon Retail District in Seoul, South Korea. Cities 2019, 89, 1–13. [Google Scholar] [CrossRef]
  43. Yin, S.; Lang, W.; Xiao, Y.; Xu, Z. Correlative Impact of Shading Strategies and Configurations Design on Pedestrian-Level Thermal Comfort in Traditional Shophouse Neighbourhoods, Southern China. Sustainability 2019, 11, 1355. [Google Scholar] [CrossRef]
  44. Zhou, S.; Shi, T.; Li, S.; Dong, Y.; Sun, J. The Impact of Urban Morphology on Multiple Ecological Effects: Coupling Relationships and Collaborative Optimization Strategies. Build. Simul. 2023, 16, 1539–1557. [Google Scholar] [CrossRef]
  45. Conzen, M.R.G.; Alnwick, N. A Study in Town-Plan Analysis. Trans. Pap. 1960, 27, 93–122. [Google Scholar]
  46. Naboni, E.; Milella, A.; Vadalà, R.; Fiorito, F. On the Localised Climate Change Mitigation Potential of Building Facades. Energy Build. 2020, 224, 110284. [Google Scholar] [CrossRef]
  47. Potchter, O.; Cohen, P.; Lin, T.-P.; Matzarakis, A. Outdoor Human Thermal Perception in Various Climates: A Comprehensive Review of Approaches, Methods, and Quantification. Sci. Total Environ. 2018, 631–632, 390–406. [Google Scholar] [CrossRef]
  48. Makaremi, N.; Salleh, E.; Jaafar, M.Z.; GhaffarianHoseini, A. Thermal Comfort Conditions of Shaded Outdoor Spaces in Hot and Humid Climate of Malaysia. Build. Environ. 2012, 48, 7–14. [Google Scholar] [CrossRef]
  49. Zhen, M.; Dong, Q.; Chen, P.; Ding, W.; Zhou, D.; Feng, W. Urban Outdoor Thermal Comfort in Western China. J. Asian Archit. Build. Eng. 2021, 20, 222–236. [Google Scholar] [CrossRef]
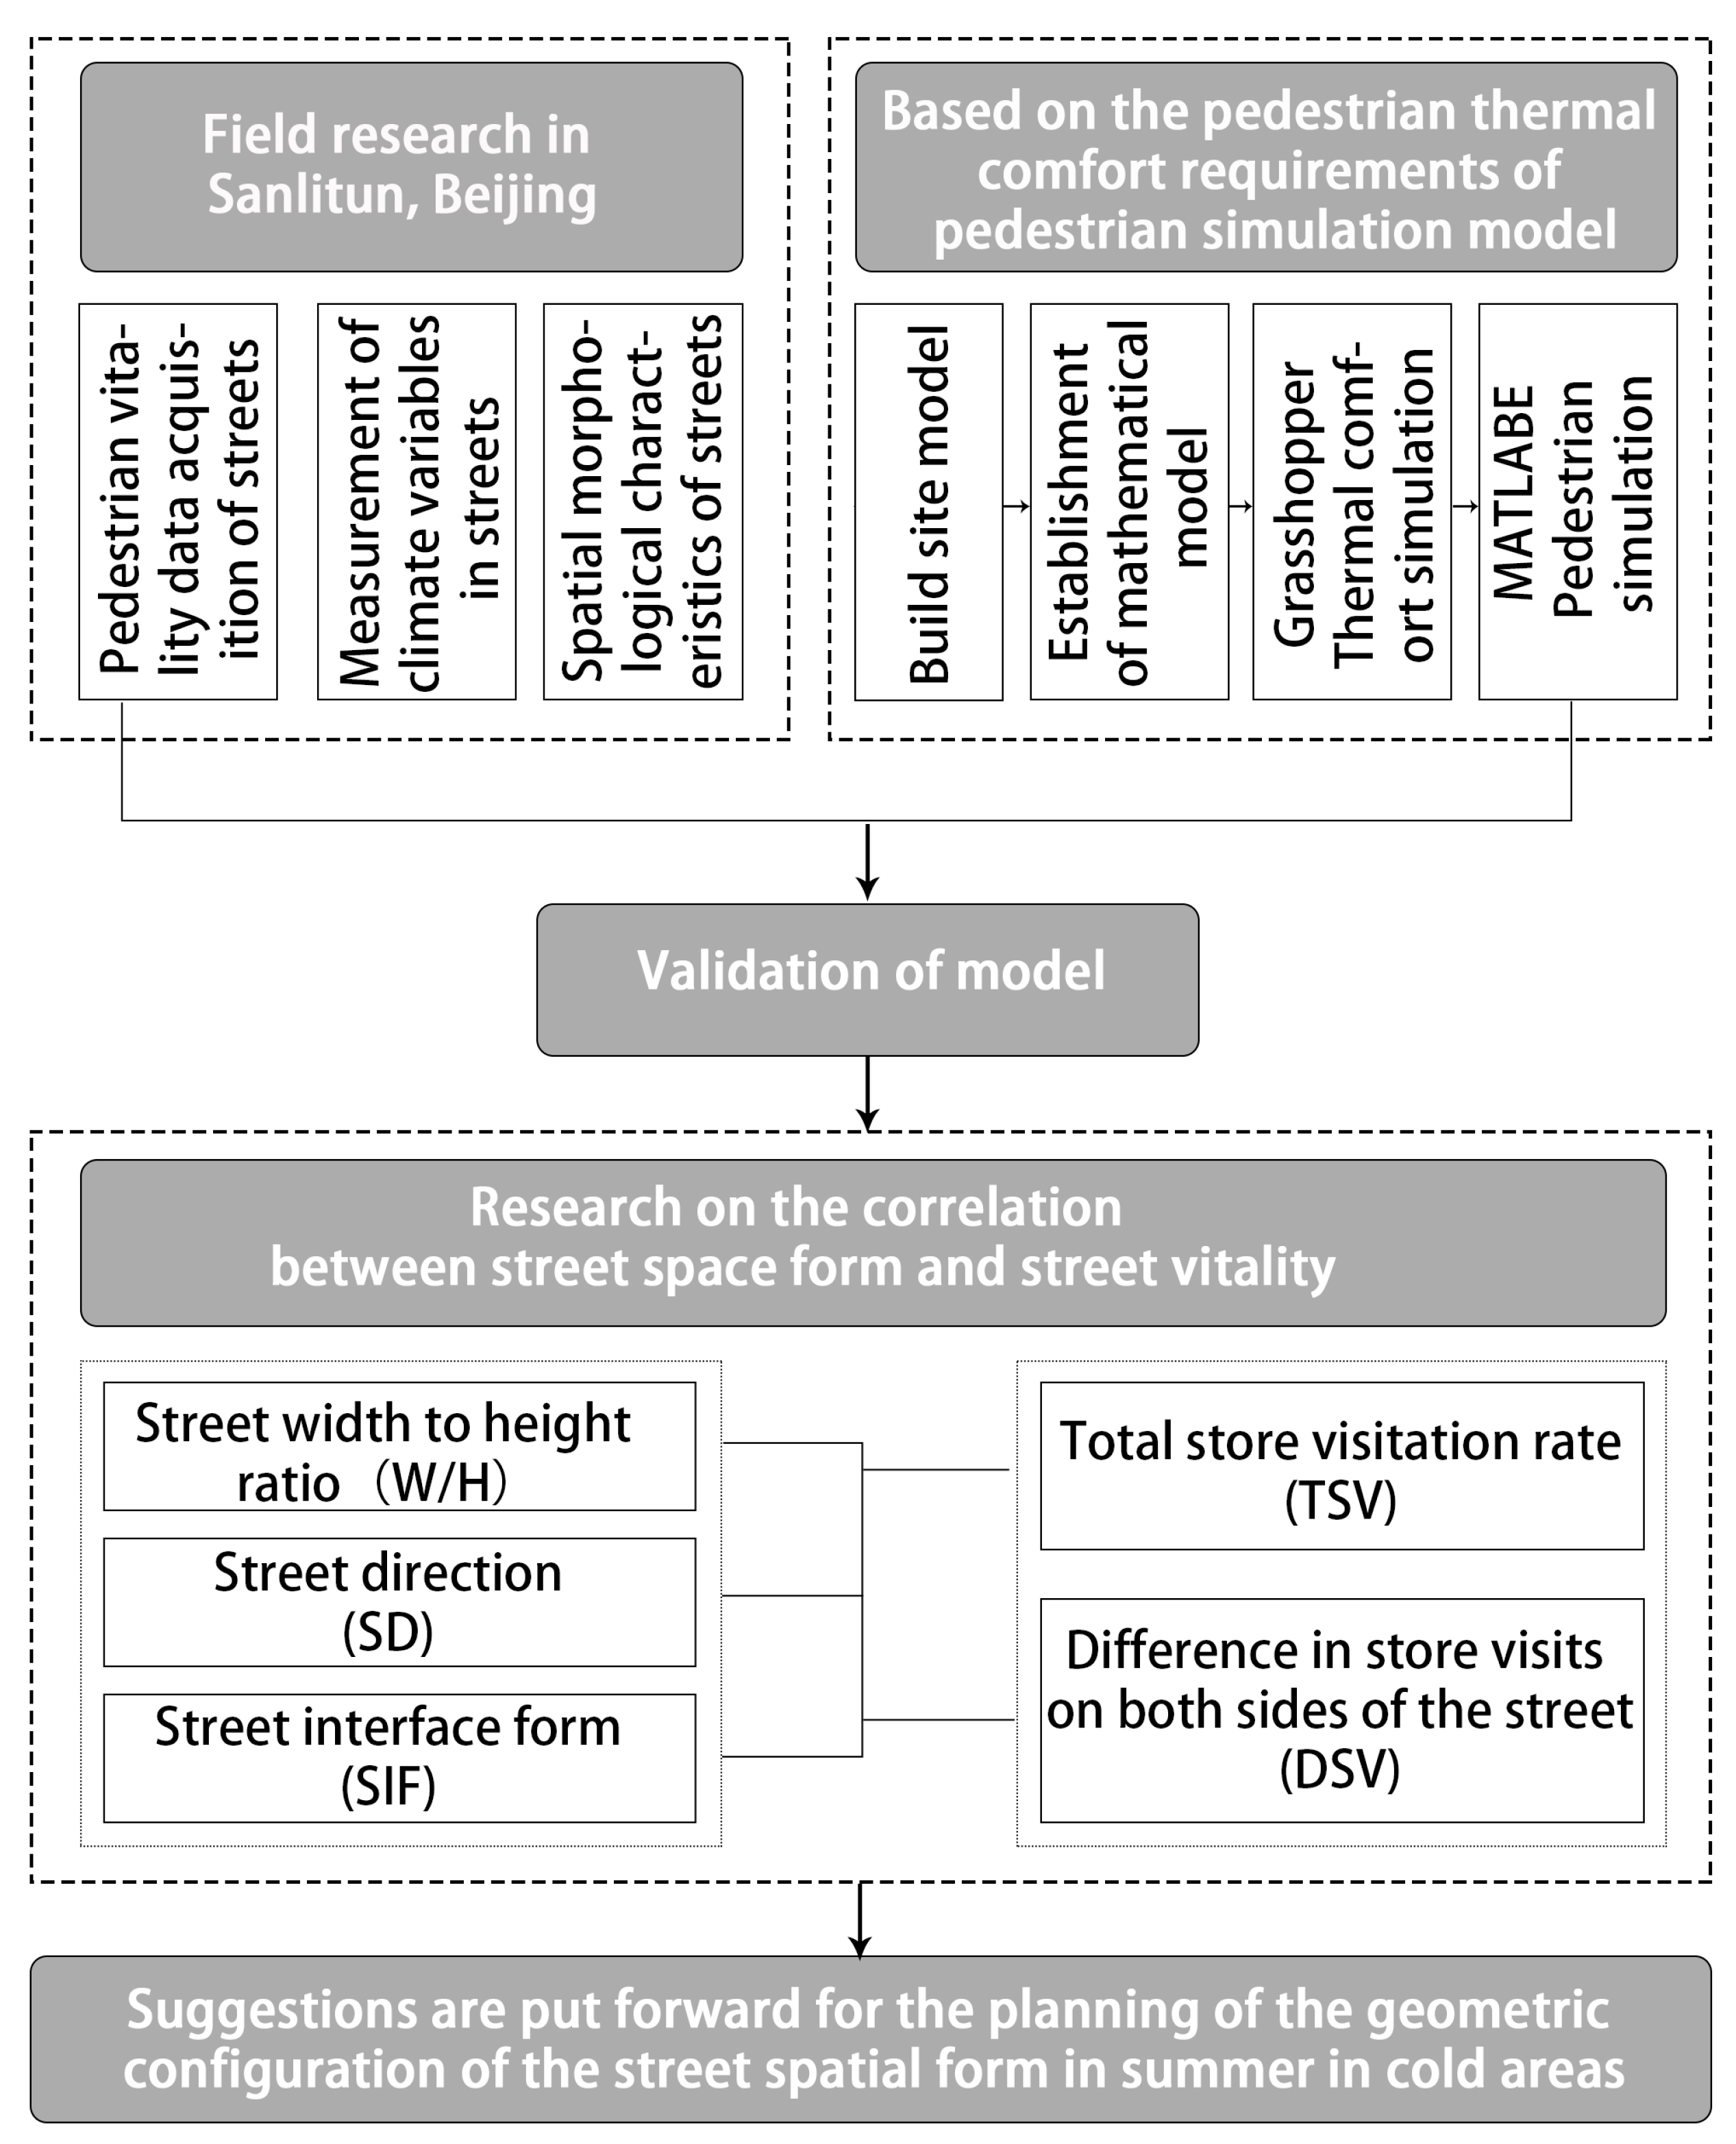
Figure 1. Workflow of the holistic approach.
Buildings 14 01751 g001
Figure 2. Location and climate analysis of Sanlitun in Beijing. (a) Location analysis of Sanlitun in Beijing. (b) Monthly distribution of discomfort temperatures in Beijing summers.
Buildings 14 01751 g002
Figure 3. Selection of typical streets in Sanlitun, Beijing.
Buildings 14 01751 g003
Figure 4. Extraction of spatial form element parameters.
Buildings 14 01751 g004aBuildings 14 01751 g004b
Figure 5. Selection of typical streets in Sanlitun.
Buildings 14 01751 g005
Figure 6. Meteorological data measurement results from typical streets in Sanlitun. (a) Meteorological data collected from Street 1. (b) Meteorological data collected from Street 2. (c) Meteorological data collected from Street 3. (d) Meteorological data collected from Street 4.
Buildings 14 01751 g006
Figure 7. Pedestrian activity measurement results of typical streets in Sanlitun.
Buildings 14 01751 g007
Figure 8. Workflow of the pedestrian simulation model based on thermal adaptation.
Buildings 14 01751 g008
Figure 9. Comparison of observed and simulated TSV and DSV. (a) Observed and simulated TSV. (b) Observed and simulated DSV. (c) Comparison of observed and simulated TSV. (d) Comparison of observed and simulated DSV.
Buildings 14 01751 g009
Figure 10. TSV and DSV simulation results in different spatial forms of streets. (a) Total store visitations with different directions. (b) Total store visitations with different W/H. (c) Differential store visitations with different directions. (d) Differential store visitations with different directions. (e) Differential store visitations with different W/H. (f) Differential store visitations with different interface forms.
Buildings 14 01751 g010
Figure 11. Correlation heat map of spatial morphological parameters with TSV and DSV.
Buildings 14 01751 g011
Figure 12. Heat map of correlation between spatial form parameters and TSV and DSV under street direction control.
Buildings 14 01751 g012
Figure 13. Design strategy of commercial street spatial form in cold regions in summer. (a) Street direction selection strategy (orange streets can lead to tense situations and blue streets can lead to relief situations). (b) Different direction street aspect W/H range and SIF selection.
Buildings 14 01751 g013
Table 1. Instruments for microclimate tests.
ParameterInstrumentRangeAccuracy
Air   temperature   ( T a )Testo 480−20–70 °C±0.5 °C (20–70 °C)
Relative humidity (RH)Testo 174H0–100% RH±3% RH (2–98% RH)
Wind   speed   ( V a )Swema 03 + ETR0.05–3.00 m/s±0.04 m/s
Black   bulb   temperature   ( T g )Swema 050–50 °C±0.1 °C
Table 2. Original pedestrian simulation model.
FormulaCalculation Formula
Motion trigger model T i The i-th the type of demand of individual pedestrians; T j The attractiveness type of store j; A j The attractiveness value of store j to pedestrians; E i The demand value of the i-th pedestrian
T i j = ω m × A i
A j The attractiveness value of store j to pedestrians
ω m = 1 , T i = T j , A j > E i   or   T j = T i , A j = E i 0 , Otherwise
Shop attraction model D i j The actual shortest sight distance of the i-th pedestrian to store j at a certain moment
P d = 1 D i f R a
Attractor visibility model N i j The intersection sector between the i-th pedestrian’s sight range and the attraction point store j Number
P v = 1 N i f N a
Visual attractiveness weighting model α i j The attractiveness of the i-th store itself; ω d   d i s t a n c e   w e i g h t   ω d ε (0,1); ω v perception weight ω v ε (0,1); C represents the influence of other factors
A j = α i j × ω d × P d + ω v × P v + C
Table 3. Thermal adaptive pedestrian simulation model.
ModelCalculation Formula
Speed adaptation model V c o m f = 1.3   m / s ; V m a x = 1.75   m / s ; P E T c o m f = 28   ° C
V a d a p t P E T = V c o m f + δ P E T V m a x V c o m f , w h e r e
δ P E T = P E T P E T c o m f P E T m a x P E T c o m f 0 , o t h e r w i s e , i f P E T > P E T c o m f
Reaction heat attraction model β P E T t a stimulus value; P E T r i g h t 4 m to the right from the agent movement direction; P E T l e f t 4 m to the left from the agent movement direction; θ sensitivity to the thermal stimulus
α t = α m a x β P E T t θ , w h e r e
β P E T t = β r i g h t , i f   β r i g h t > β l e f t   a n d   β P E T t θ β l e f t , o t h e r w i s e
β l e f t = P E T t P E T l e f t , i f   P E T t > P E T c o m f a n d   P E T t > P E T l e f t 0 , o t h e r w i s e
β r i g h t = P E T t P E T r i g h t , i f   P E T t > P E T c o m f a n d   P E T ( t ) > P E T r i g h t 0 , o t h e r w i s e
Forward-looking vision-driven route planning model α s h a d e ratio of a shady path; c s u n the cost multiplier of traveling a unit distance in the sun compared to traveling in shade
g ( α s h a d e , c s u n , l ) = l α s h a d e + c s u n ( 1 α s h a d e )
Heat stress accumulation model h s the accumulated amount of heat stress; t t r the travel time; ( h s ) the average stress
h t = P E T t P E T c o m f , i f   P E T t > P E T c o m f 0 , o t h e r w i s e
( h s ) = h s t t r
Table 4. Pearson correlation analysis of spatial morphological parameters with TSV and DSV.
Title W/HN-SNW-SENE-SWE-WArcadeOverhangVerticalExit
TSVPearson−0.660 **0.239 **0.450 *−0.258 **−0.432 *0.0170.05−0.0170.017
Sig.0.0000.0260.0030.0000.0000.7780.4220.7840.788
DSVPearson0.435 **0.191 **−0.136 *0.182 **0.216 **−0.018−0.015−0.02−0.018
Sig.0.0000.0000.0300.0000.0000.7760.8120.7460.776
** The correlation is significant at the 0.01 level (two-tailed). * The correlation is significant at the 0.05 level (two-tailed).
Disclaimer/Publisher’s Note: The statements, opinions and data contained in all publications are solely those of the individual author(s) and contributor(s) and not of MDPI and/or the editor(s). MDPI and/or the editor(s) disclaim responsibility for any injury to people or property resulting from any ideas, methods, instructions or products referred to in the content.