Article

A Study on Spatiotemporal Dynamics and Spatial Dependence of Sound Source Perception in Fuzhou Historical and Cultural Districts

1
College of Landscape Architecture and Art, Fujian Agriculture and Forestry University, Fuzhou 350108, China
2
Art & Landscape Design Research Center, Fujian Agriculture and Forestry University, Fuzhou 350108, China
*
Author to whom correspondence should be addressed.
Buildings 2024, 14(6), 1753; https://doi.org/10.3390/buildings14061753
Submission received: 21 April 2024 / Revised: 25 May 2024 / Accepted: 31 May 2024 / Published: 11 June 2024
(This article belongs to the Section Building Energy, Physics, Environment, and Systems)

Abstract

:
As a carrier of cultural characteristics of historic districts, the soundscape has unique advantages in shaping regional cultural personality, and mastering its spatiotemporal characteristics is crucial for preserving soundscape heritage with natural and humanistic environments as its kernel. Focusing on the Three Square and Seven Alleys historic and cultural district in Fuzhou, this paper analyzes the spatial and temporal patterns of the physical acoustic indicators of the soundscape, the spatial dependence of the sound source harmony, and the spatial relationship between the two. It was found that the physical acoustic indicators showed dynamic changes in spatial and temporal scales and reflect specific human activity and behavioral patterns; sound source harmony showed spatial autocorrelation in both global and local models, with prominent spatial characteristics; and the physical acoustic indicators may negatively affect soundscape perception. The study emphasizes the importance of the regional cultural connotation of soundscape in urban planning. It provides a scientific basis for the planning, designing, and managing of soundscape resources in historic and cultural districts and world heritage sites.

1. Introduction

As an important cultural heritage of the city, the historic and cultural district carries the identity and development history of a town [1], and its protection, renewal, and rational utilization have always been one of the core topics discussed by academics [2]. The Three Square and Seven Alleys in Fuzhou is one of the representative neighborhoods of China’s famous historical and cultural cities. Its intact traditional buildings and complete street texture [3] constitute a unique space and symbolize the city’s identity. As a living cultural heritage [4], soundscape is closely linked to people’s subjective emotions and collective memories [5] and is crucial to shaping the cultural personality of a region [6]. In the case of historic and cultural districts, soundscape heritage not only maps the spatial quality and historical originality [7] but also affects the production and life of residents in a specific area [8]. The unique sounds within the Three Square and Seven Alleys, such as the sounds of the Fuzhou dialect, hawking, folk activities, and crafts building [9], are part of its unique intangible cultural heritage that should be emphasized and protected. However, in the modernization process, the soundscape heritage [10] in the historic and cultural districts, which is based on the natural and humanistic environment, is facing the crisis of being replaced by industrial, traffic, and mechanical sound sources. Therefore, studying how to protect and inherit the unique soundscape of historic districts is of great significance for maintaining urban cultural heritage [5,11].
Nowadays, scholars no longer equate a good soundscape with simply reducing the noise level [12,13], but emphasize the importance of the individual’s subjective perception of the soundscape [14]. Soundscape perception studies cover sound source identification, evaluation, and characterization [15,16], and this information can be transformed into management strategies and become an entry point for cultural heritage conservation. In the realization dimension of using soundscape maps to visualize soundscape information [17], spatiotemporal dynamic distribution characterization is one of the critical research paths [18]. Wang Yaping et al. evaluated the historical neighborhood environment through audio–visual perception experiments to provide a reference for the study of improving the preference of sound elements and the satisfaction of sound environment [19]. Rui Qingxuan et al. explored the differences in sound source preferences, the interaction between sound sources and soundscape perceptions, and their effects on the evaluation of historical perceptions in the Central Avenue historic district in winter and summer, providing new ideas for highlighting the landscape features of the historic district [20]. However, most of these studies are limited to specific spatial and temporal frameworks and do not explore dynamic change characteristics in the spatial and temporal dimensions. Therefore, in-depth excavation of soundscape information at different scales and exploration of the spatiotemporal distribution characteristics of soundscape perception in historic neighborhoods are crucial for enhancing the soundscape experience.
From a spatial perspective, environmental and soundscape variables are spatially autocorrelated and interact [21,22,23]. The variable nature of soundscape perception implies that exploring the patterns of its spatial dependence is essential. Hong and Jeon pointed out that urban spaces’ functions, activities, and visual characteristics play a crucial role in soundscape perception [24], i.e., spatial dependence may affect urban soundscape. However, few studies on soundscape mapping have considered spatial dependence when exploring the relationship between soundscape variables. Liu Jiang et al. explored the spatial dependence of soundscape in the Gulangyu Island area based on the spatiotemporal dynamic characteristics of soundscape perception. They found that soundscape perception and landscape perception in the scenic area have prominent spatiotemporal dynamic characteristics [25]. Still, they mainly focused on the spatial dependence of soundscape and landscape perception and lacked research on the relationship between soundscape variables, such as acoustic or perceptual attributes [26]. Using soundscape maps to visualize soundscape information and explore the spatial dependence of soundscape can reveal the interrelationships between soundscape perception and its influencing factors. This approach helps planners and managers identify the main disturbing aspects of the soundscape environment in scenic areas and provides a basis for developing solutions and protection measures [27].
This study focuses on the Three Square and Seven Alleys historic and cultural district in Fuzhou, visualizes soundscape information through soundscape maps, breaks through a specific spatial and temporal scope, and explores the spatial and temporal dynamic distribution of sound source perception and the spatial relationship between soundscape perception and influencing variables. The study aims to address the following three questions: (1) What is the spatial and temporal pattern of physical acoustic indicators in the soundscape of historic and cultural districts? (2) What is the spatial distribution pattern of sound source harmony, and (3) What is the spatial relationship between physical acoustic indicators and sound source harmony? By analyzing spatial and temporal scales, this study expects to explore the relationship between the perceptual elements of soundscapes and provide optimization suggestions for the planning and design of soundscapes in historical and cultural neighborhoods.

2. Data Sources and Processing

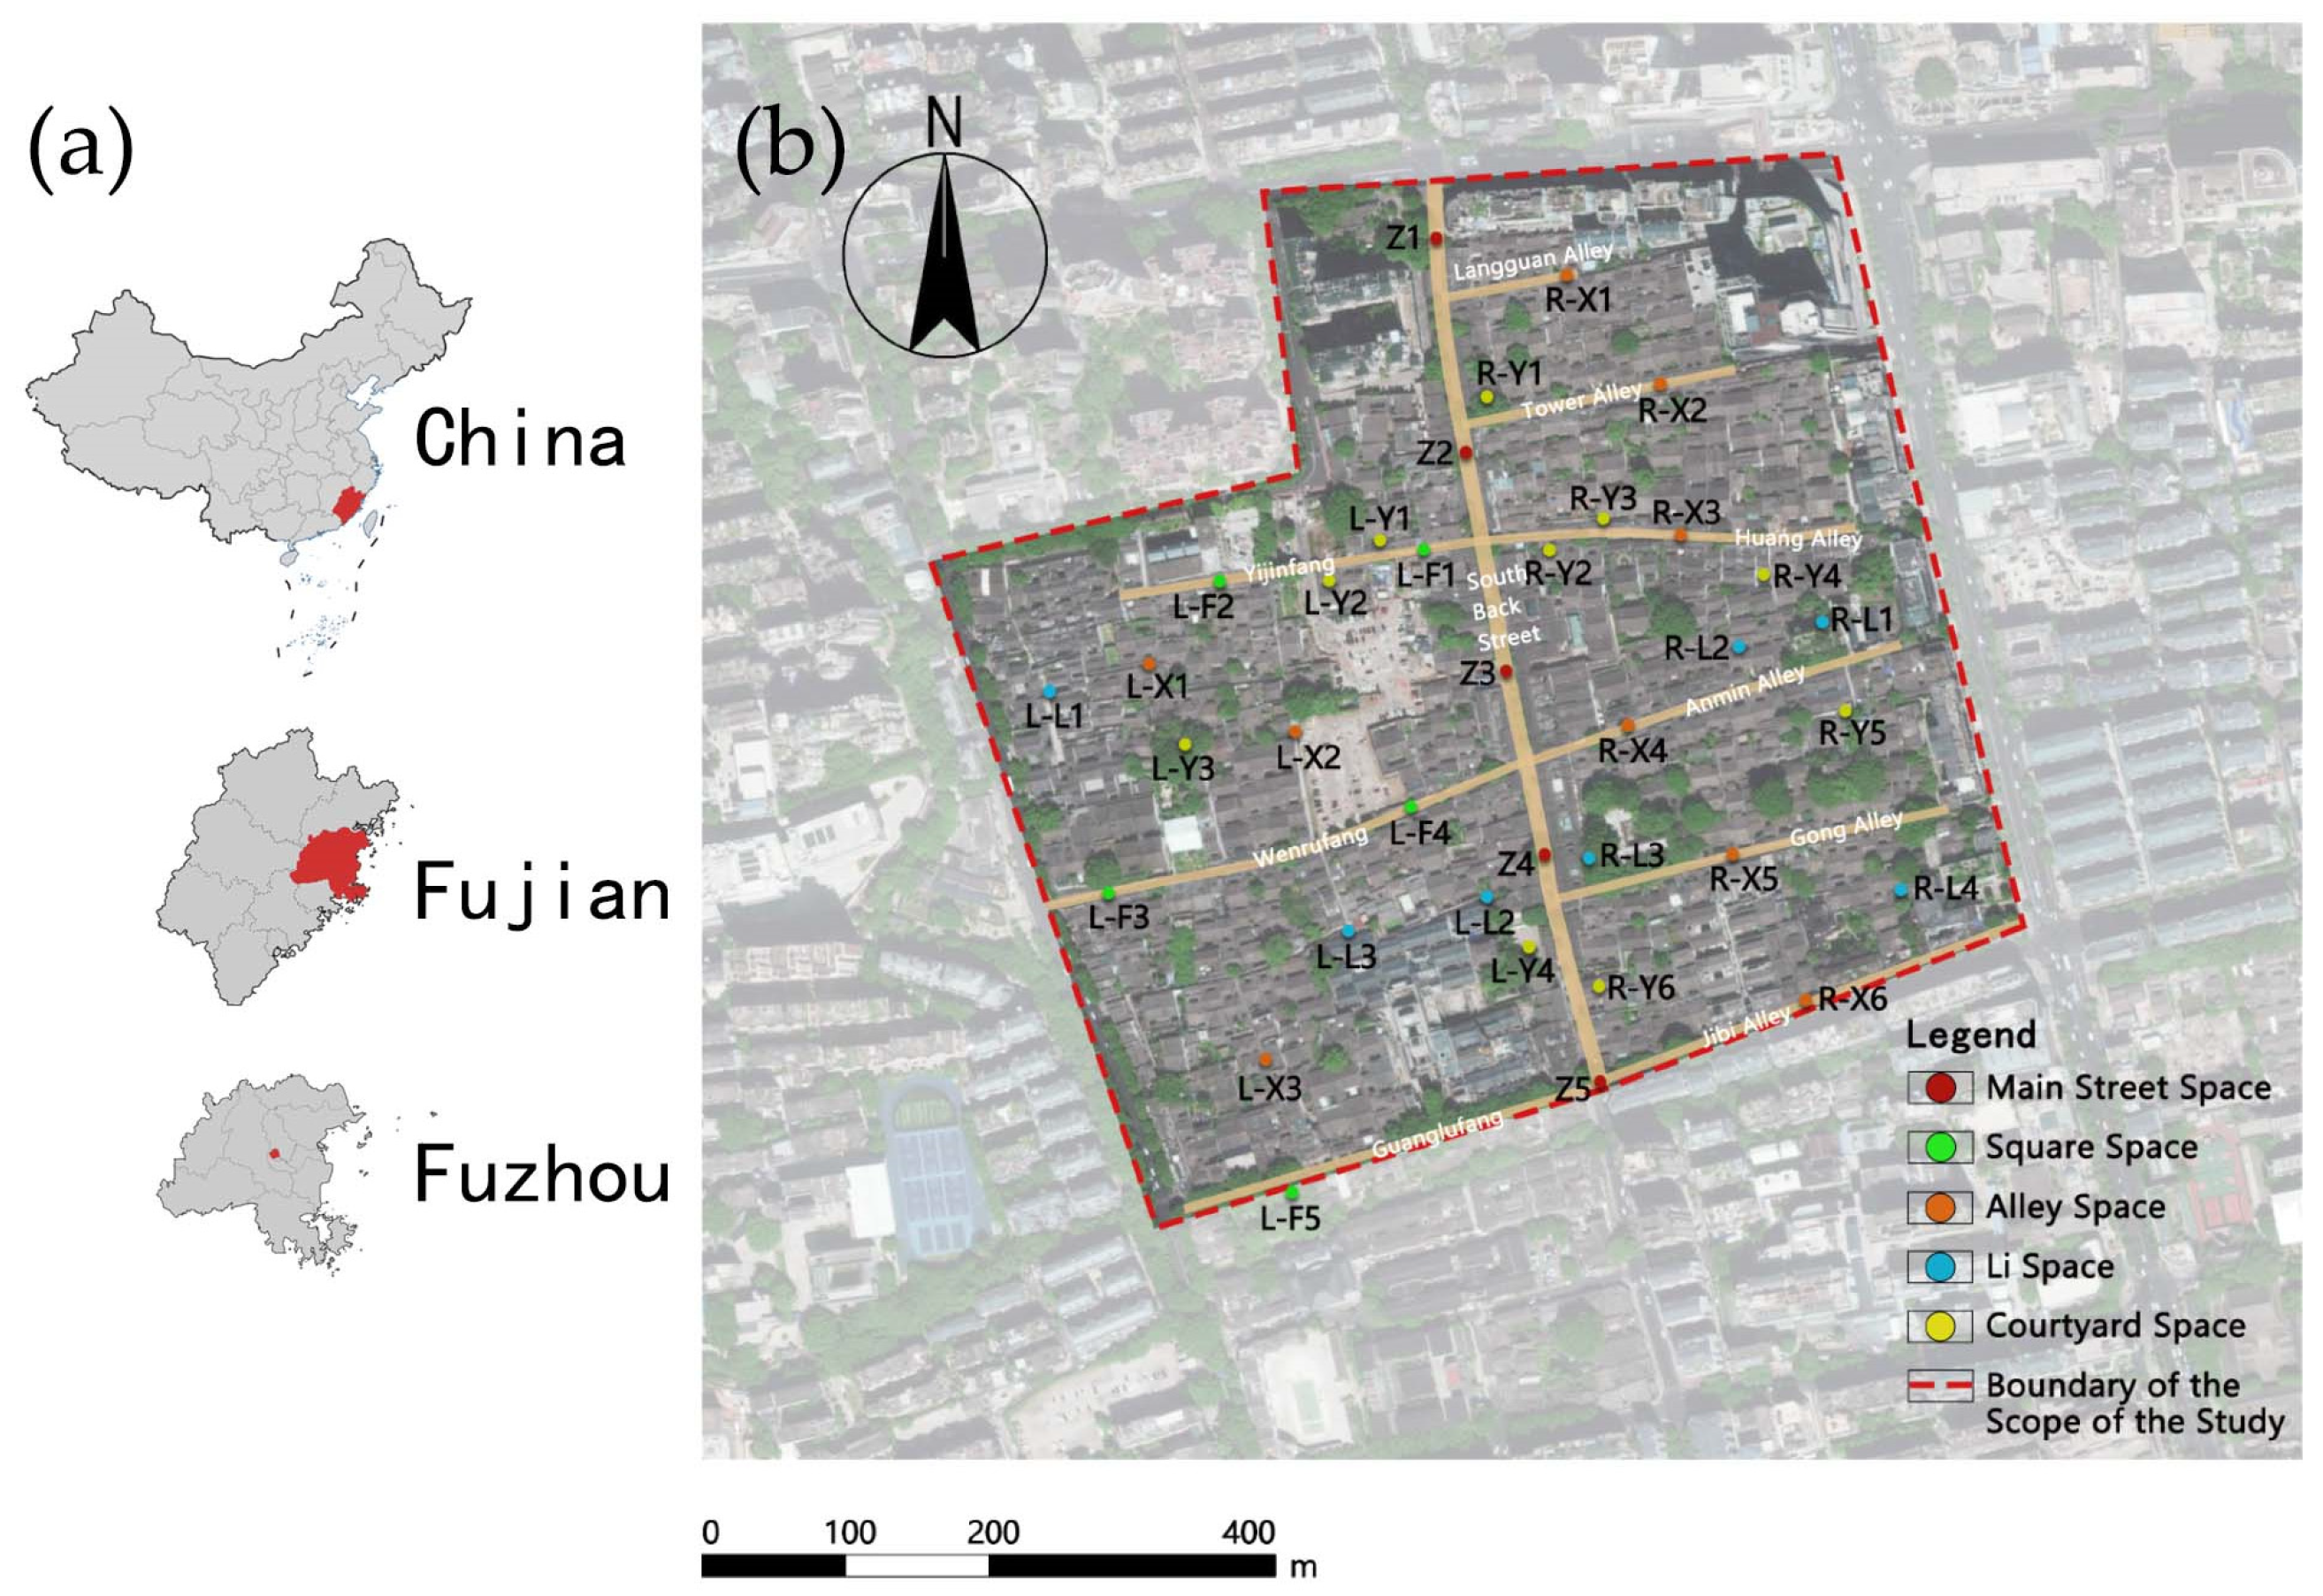
2.1. Sample Plot Overview

Fuzhou, the Three Square and Seven Alleys Historic and Cultural District (Hereinafter referred to as the Three Square and Seven Alleys) is located in the center of Fuzhou, a national historical and cultural city with a history of 2200 years, with a planned scope of protection of about 38 hm2, which is a large-scale and more completely protected historic and cultural district in China and is known as the “A living fossil of the Chinese urban neighbourhood system” and “China’s Museum of Ming and Qing Dynasty Architecture”; it is one of the typical representatives of the domestic dynamic, open mode, with the composite functions of residence, commerce, culture, and tourism [28]; characterized by a deep historical and cultural background, diverse visiting groups, and rich types of sound sources, it is very suitable as a research object. The Three Square and Seven Alleys consists of the main street—“South Back Street” and nine alleys arranged in sequence from north to south on both sides, including Yijinfang, Wenrufang, Guanglufang, Langguan Alley, Tower Alley, Huang Alley, Anmin Alley, Gong Alley, and Jibi Alley. The landscape pattern is arranged in a “fishbone-like” structure [29]. Before the formal research, according to the analysis of spatial evolution laws, interrelationships, and type characteristics, the study area of the Three Square and Seven Alleys is divided into five types of street and alley space types [30], i.e., main street space, square space, alley space, li space, courtyard space, and a total of 36 monitoring sample points were selected according to the accessibility and representativeness of the sample points (Figure 1).
A total of 17 familiar sound sources were identified in the study area through on-site research and classified into six types: biological sound, geophysical sound, human activity sound, folk activity sound, mechanical sound, and musical sound (Table 1) [9].

2.2. Data Sources

The research was conducted on the rest days with low wind speed and clear and mild weather, respectively, on 10–11 November 2023, and 24–25 November 2023. The sampling points satisfyied the characteristics of accessibility and typicality to ensure the differences in functional space, landscape, and spatial scales, and the spacing between two neighboring sound-walking points was more than 100 m. There are 36 sampling points with relatively uniform spatial distribution. Soundscape monitoring data, soundscape perception data, and pedestrian flow statistics were collected through on-site sound monitoring and questionnaire surveys.

2.2.1. Soundscape Monitoring Data

A sound level meter (AWA6228) was used to measure the acoustic index data at each selected sample point, including the equivalent continuous A sound level ( L Aeq ) and cumulative percent sound level  L 10  (reflecting foreground sound characteristics) and  L 90  (reflecting the background sound characteristics). And synthetic parameters  L 10 L 90  were introduced in the subsequent analysis to reflect the dynamic characteristics of the acoustic metrics [31]. The low-frequency sound pressure measurement range was 20–132 dBA, and the high-frequency sound level measurement range was 30–142 dBA. Sound pressure measurements were 30 s each time and repeated 20 times, with the sound level meter calibrated before each measurement. Measurements were conducted quietly, avoiding pedestrian visits, to ensure more accurate results. The collection time was concentrated in 8:30–10:30, 10:30–12:30, 12:30–14:30, 14:30–16:30, 16:30–18:30, and 18:30–20:30.

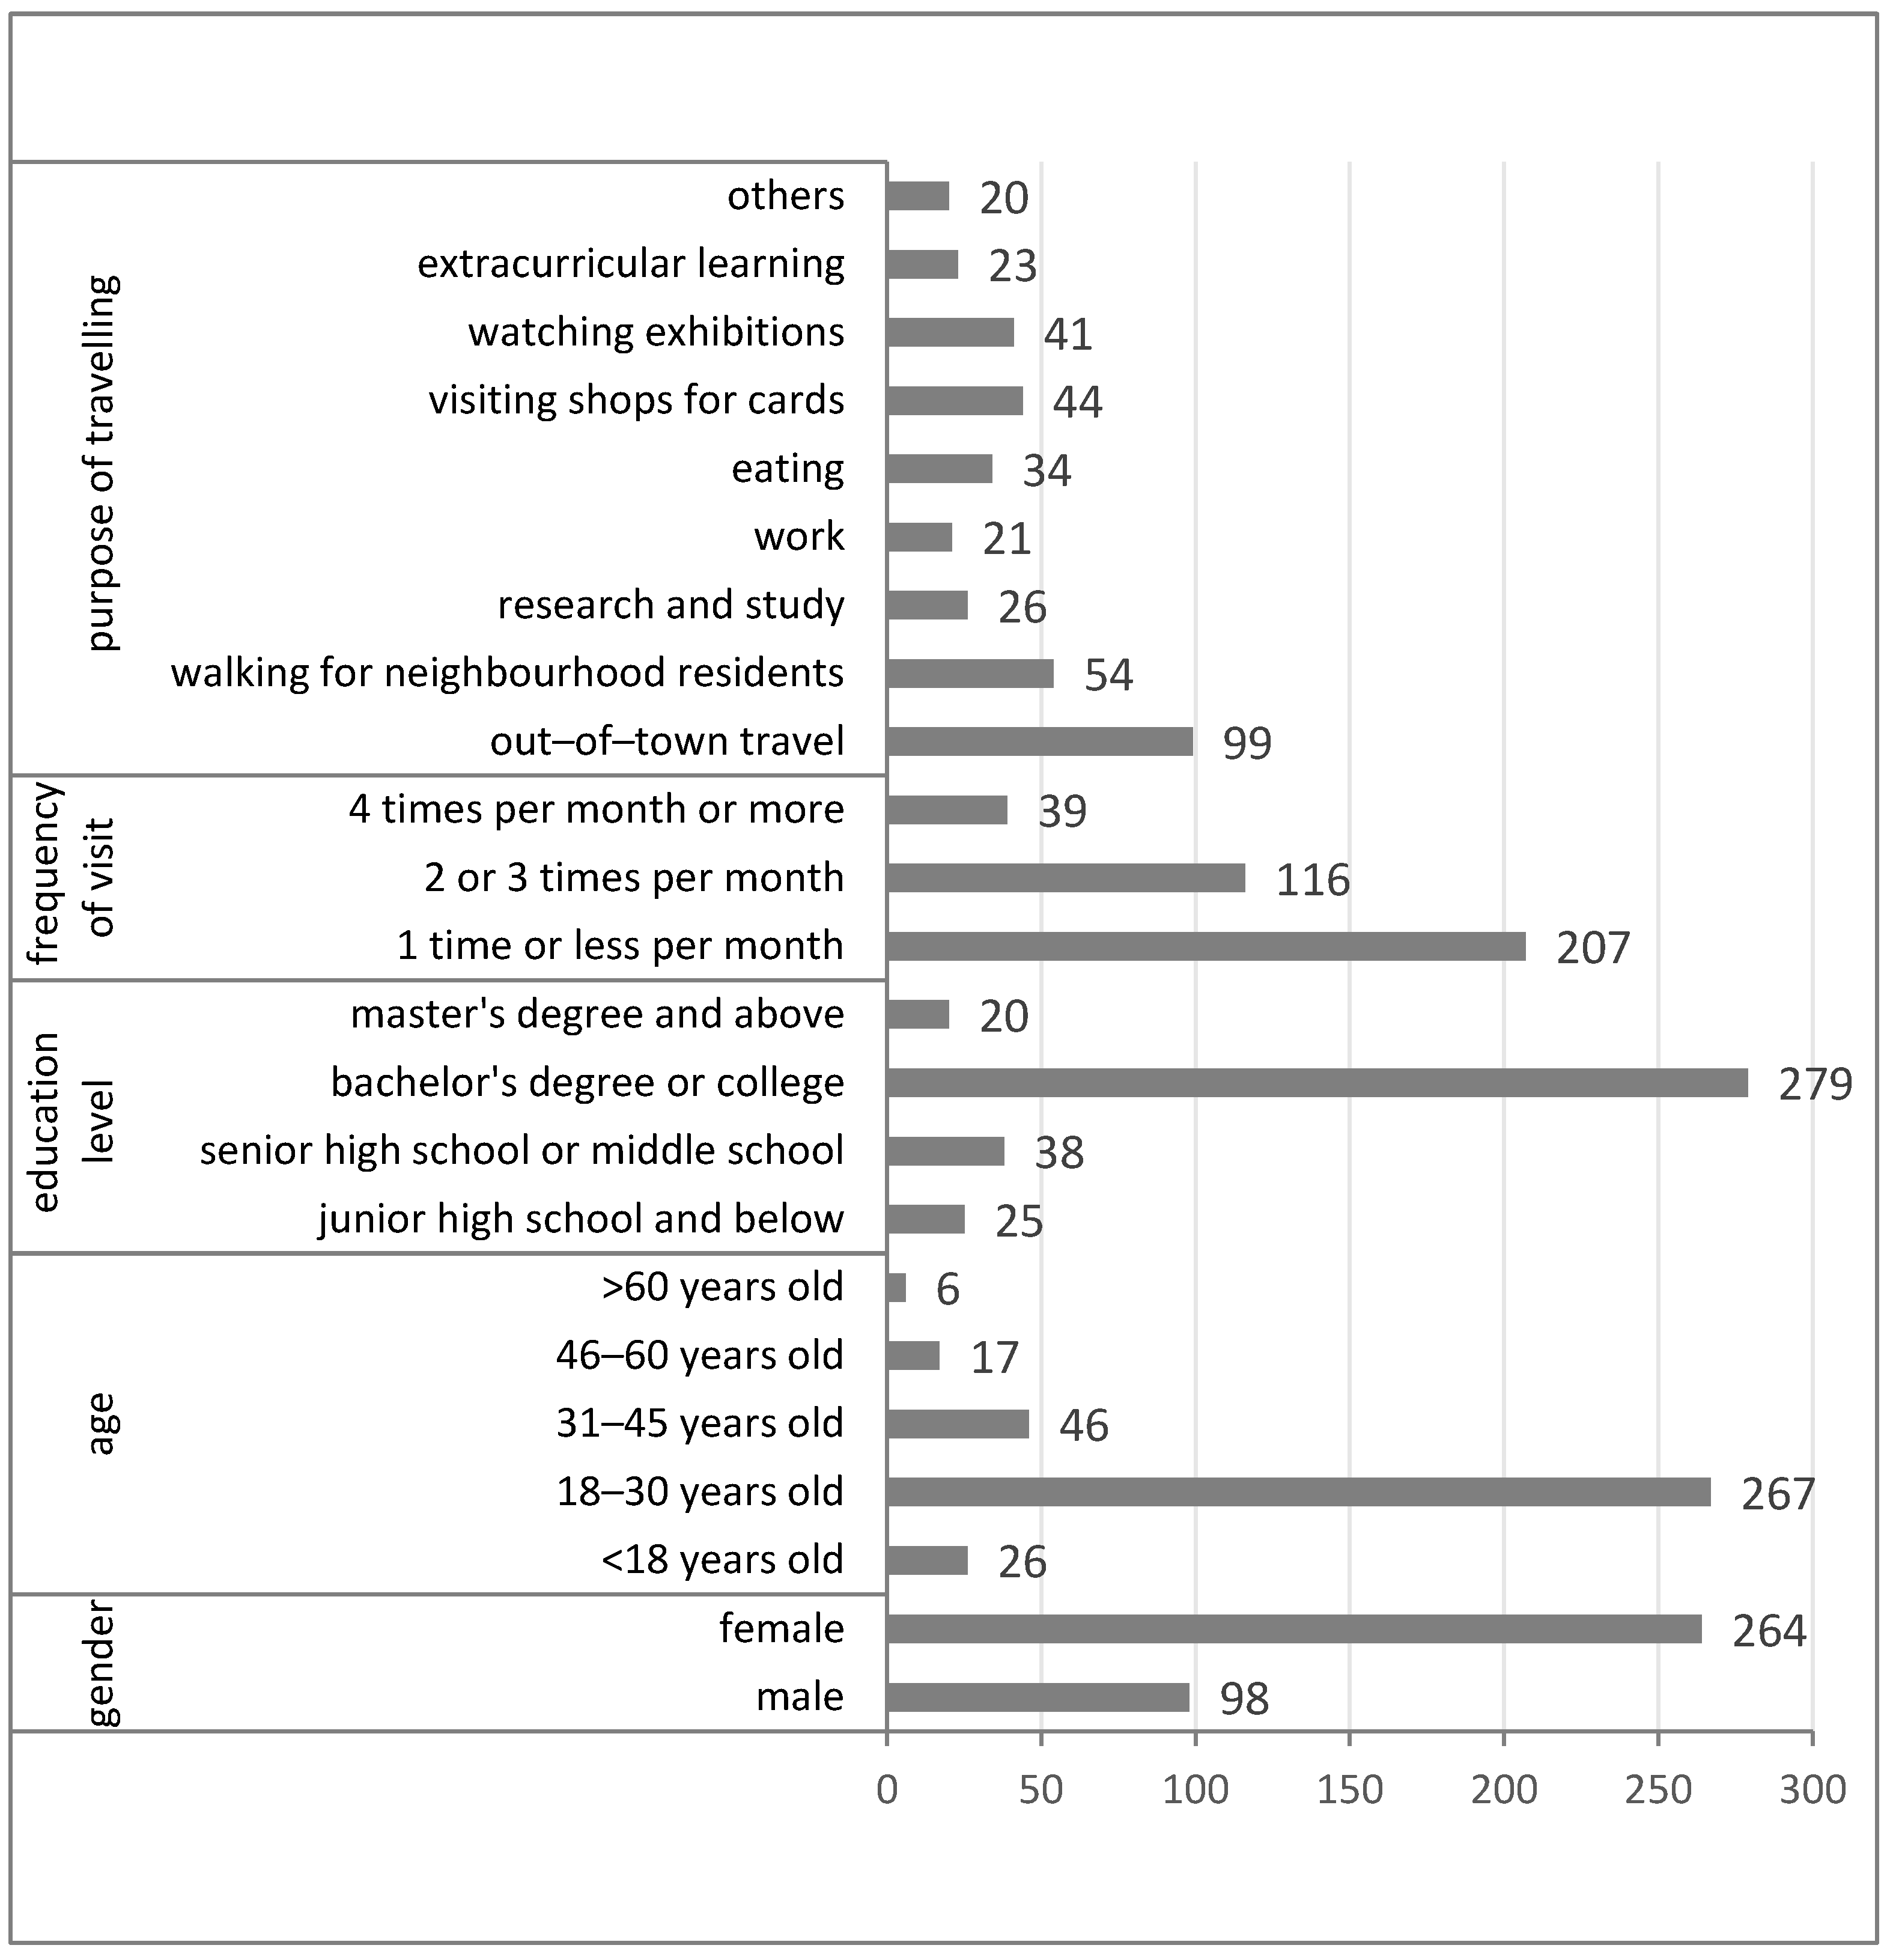
2.2.2. Soundscape Perception Data

After the data collection of acoustic indicators was completed, tourists were randomly selected within 150 m of the selected sample point for soundscape perception data collection. The questionnaire was anonymous, and the respondents were informed in advance of the purpose of the survey and the survey method. The questionnaire survey period was the same as the acoustic indicator data collection period and, to minimize the bias that may be introduced by the selection of respondents at a particular point in time, the study controlled the number of questionnaires to be distributed consistently at each selected sample point. This approach ensured that the data collection was balanced and representative and that the amount of information obtained from each sampling point was equal, thus improving the reliability and validity of the study results.
The questionnaire of this study was divided into two main parts. The first part was designed to investigate the basic information of the respondents, including gender (male and female), age (<18 years old, 18–30 years old, 31–45 years old, 46–60 years old, and >60 years old), education level (junior high school and below, senior high school or middle school, bachelor’s degree or college, and master’s degree and above), frequency of visit (1 time or less per month, 2 or 3 times per month, 4 times per month or more), and the purpose of travelling (out-of-town travel, walking for neighborhood residents, research and study, work, eating, visit a shop, watching exhibitions, extracurricular learning, others).
In the second part, the respondents’ perceptions of various sound sources in their space were investigated in terms of perceived occurrences of sound (POS), perceived loudness of sound (PLS), and preference for sound (PFS), which were evaluated using a five-point Likert scale (1 very low, 5 very high). A five-point scale of POS was used as follows: 1—never heard, 2—occasionally heard, 3—average, 4—heard more frequently, 5—heard very often. The five-point scale of PLS was used as follows: 1-very weak sound, 2—weak sound, 3—average, 4—loud sound, 5—very loud sound. The five-point scale of PFS: 1—very annoying, 2—more annoying, 3—average, 4—more likeable, 5—very likeable [32].

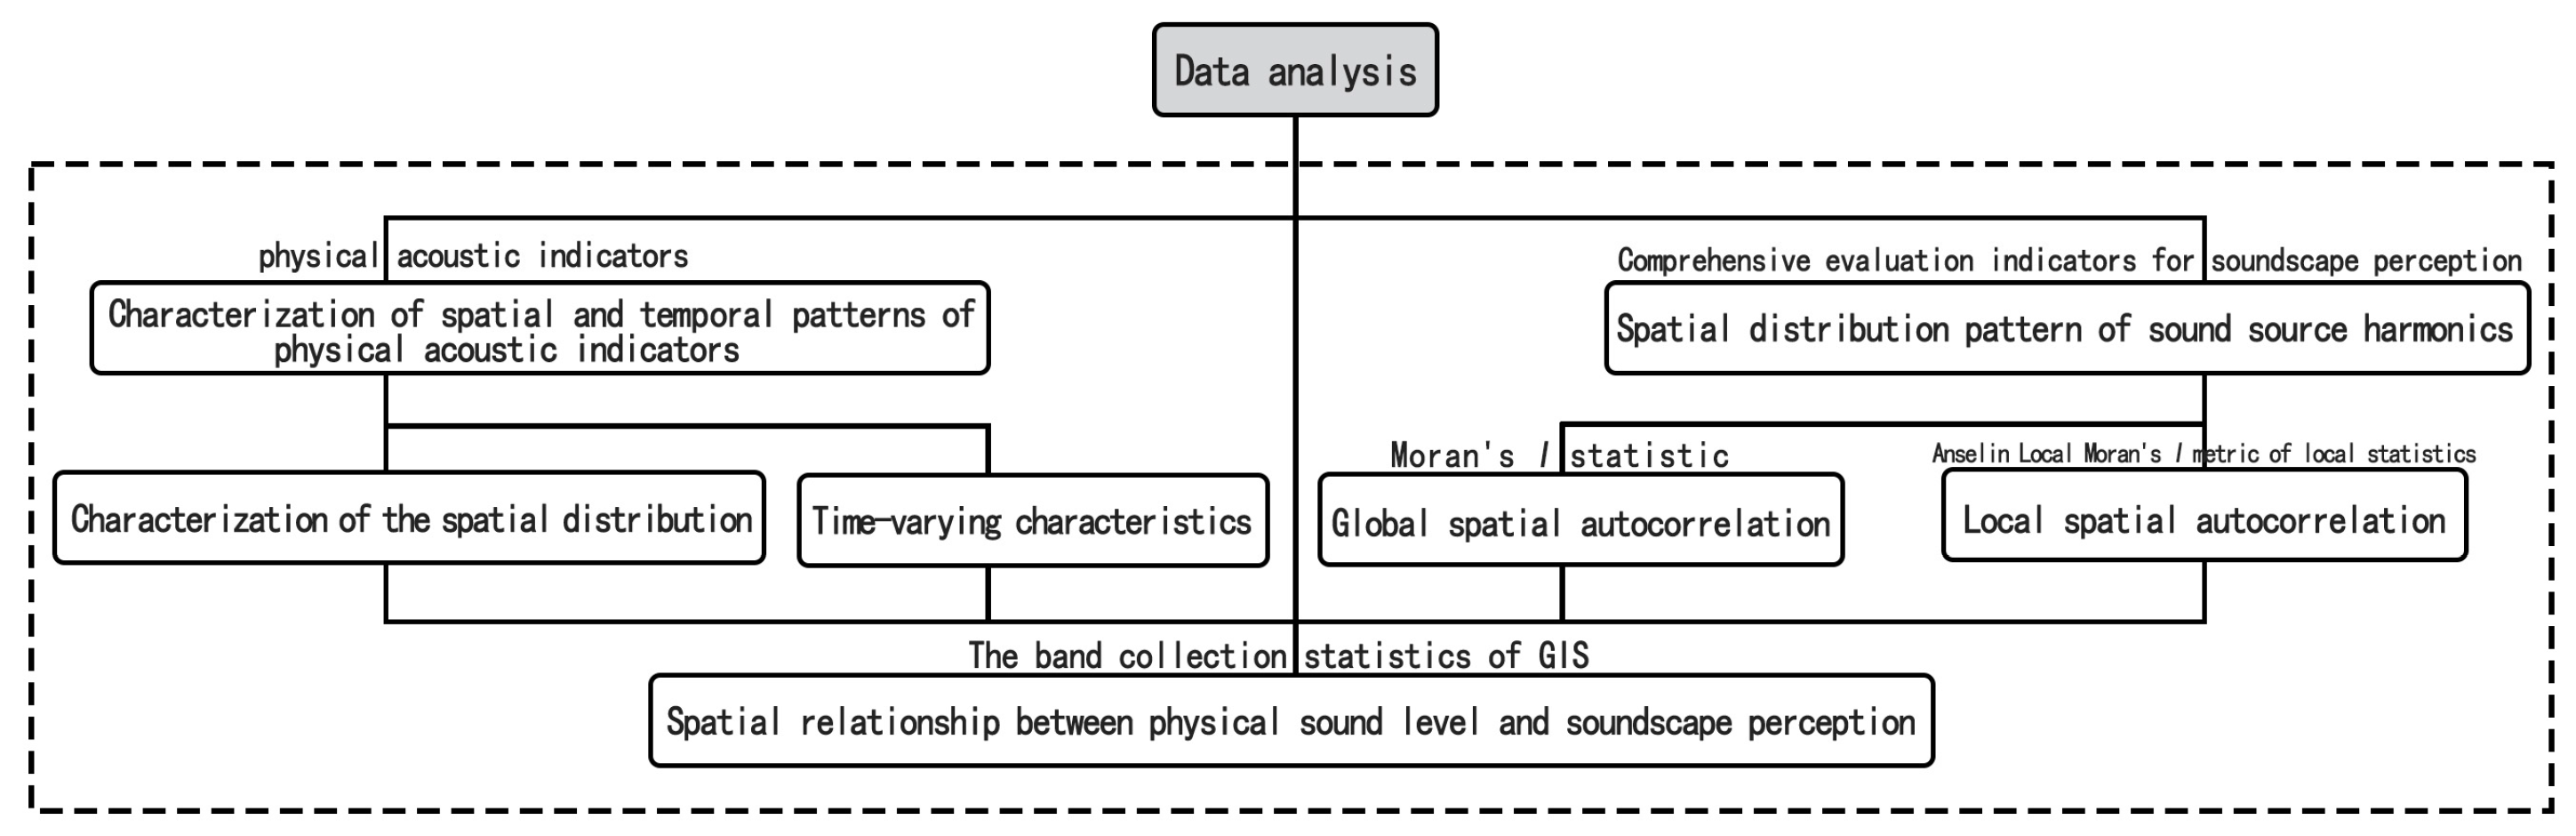
2.3. Data Processing

The research was conducted on rest days with low wind speed and clear and mild weather on 10–11 November 2023, and 24–25 November 2023, respectively. After excluding invalid questionnaires, 362 valid questionnaires were obtained (Figure 2), with a validity rate of 97%. After the reliability test, the Cronbach’s alpha coefficient was 0.828 (>0.7), and the questionnaire was highly reliable. Validity analysis was performed by KMO and Bartlett’s sphericity test, where KMO = 0.802 (>0.6), significance p = 0.000 (<0.01), and the validity of the questionnaire was good.
Based on the soundscape monitoring data, the physical acoustic indicators data of each observation point in each sampling period were calculated and visualized in ArcGIS10.7 by comparing different interpolation methods provided in the spatial analysis tools. The inverse distance weighting (IDW) method was selected to produce soundscape information maps to analyze the spatiotemporal dynamic characteristics of the acoustic indicators. The IDW is a method of treating data distribution at irregular intervals that can estimate the potential value of any location within a region based on the location and value of known points. This means of interpolation can show the spatially smooth distribution characteristics of the values [33], and IDW is especially suitable for areas with multi-point uniform dispersion characteristics, which can ensure that the interpolation results follow the actual situation of the original sample points and maintain the authenticity of the data. This study also cites a variety of spatial analysis metrics, and the flow of all metrics used is shown in Figure 3.

2.3.1. Comprehensive Evaluation Indicators for Soundscape Perception

To more comprehensively analyze the presence and harmony of sound sources in the study site, two comprehensive indicators of sound source perception, sound dominant degree (SDD) and sound harmonious degree (SHD), were used to analyze the subjective perception evaluation information [34]. Sound dominant degree (SDD) refers to the degree of dominance of the sound source in a particular soundscape, expressed as the product of perceived occurrences of sound (POS) and perceived loudness of sound (PLS). The formula is shown in (1) [35]:
  S D D j i = P O S j i × P L S j i
where j is the jth sample, and i is the ith sound source.
Source harmony is determined by source dominance and source preference, reflecting the dominance of a particular source in the environment and the degree of conformity of people’s choice for it [34]. The formula is shown in (2) [35]:
S H D j i = [ 1 ( e j = 1 n P F S j i ln P F S j i + 1 ) 0.5 ] × S D D j i
where j is the jth sample, i is the ith sound source, and n is the sample size. The degree of sound dominance determines the degree of sound source harmony. The preference degree of the sound source utilizes the characteristics of the exponential function to determine the value of its direction. When the preference degree is greater than the mean value of the preference degree, the greater the dominance degree and the greater the degree of harmony. On the contrary, if the preference degree is smaller than the average value of the preference degree, then the dominance degree is more significant, and the harmony degree is more minor; multiplying the direction value of the preference degree with the dominance degree can obtain the harmony degree of the sound source.
To eliminate the influence on the calculation results due to the different index scales, the sound source harmony is standardized by the extreme value method, and the calculation formula is as shown in (3) [36]:
S i = ( X X m i n ) / ( X m a x X m i n )
where    S i  is the standardized score of the indicator, and  X  is the raw indicator value, the  X m a x , and  X m i n  are the maximum and minimum values of the original indicators.

2.3.2. Spatial Analysis of Soundscape Perception Features

Based on the analysis of previous studies, the global model is universal and more applicable to all situations in soundscape planning applications [37]. Global statistics can better reflect the general characteristics of Soundscape in space. Still, due to the interference of many factors in the surroundings, the global model is not always valid for Soundscape, and the soundscape perception changes as the surrounding environment changes [38]. In this study, the global and local spatial autocorrelation models are used to analyze the harmony of various types of sound sources more deeply, to explore the autocorrelation of the sound source harmony between each sampling point and the neighboring sampling points, and to obtain the spatial distribution pattern of soundscape perception in the study area.
  • Global spatial autocorrelation
Global spatial autocorrelation analysis can be used to test for spatial correlation and clustering of source types across the study area. Moran’s I statistic is the most widely used measure and test for spatial autocorrelation. Compared to other tests of spatial autocorrelation, Moran’s I has better statistical efficacy in the presence of W misspecification. Global Moran’s is calculated as follows [39]:
I = n i j w i j i j w i j ( x i x ˜ ) ( x j x ˜ ) i ( x i x ˜ )
where n equals the number of spatial units indexed by i and j; x is a correlation variable representing the global mean; and  w i j  denotes the spatial weight between i and j, which can be of any form, including binary, random, or distance-based weights.
By the significance test of Moran’s I index, if Moran’s I is significant at a given confidence level and I > 0, it means that the source types are spatially positively correlated and clustered together; the closer the I value is to 1, the less spatially different the source types are; if Moran’s I is significant and I < 0, it means that the source types are negatively correlated spatially and the closer the I value is to −1, the more critical the spatial difference is [40]. Global autocorrelation was tested for significance through p-values and z-scores, where z-scores indicate multiples of the standard deviation, and when z > 1.96, z < 1.96, or z > 2.58, z < 2.58, it indicates that there is significant or high significant spatial autocorrelation of an attribute of the element in space [41].
2.
Local spatial autocorrelation
The Anselin Local Moran’s I metric of local statistics is used to analyze when global spatial autocorrelation does not exist in sound source harmony and to find the location of local spatial autocorrelation that may be masked; when global spatial autocorrelation exists in sound source harmony, the analysis is explored to analyze the presence of spatial heterogeneity. It can effectively reflect the different degrees of spatial differences and significance levels between each sample point and its neighboring regions [42].
When I > 0 indicates that the element has neighboring elements containing equally high or equally low values of the attribute, the element is part of a cluster and is spatially homogeneous; when I < 0 indicates that the component has neighboring elements containing different values, the element is an outlier and the spatial distribution is spatially differentiated [42]. The formula of Anselin Local Moran’s I model is as follows [43]:
I i = ( x i x ¯ ) j = 1 n w i j ( x j x ¯ ) i = 1 n ( x i x ¯ ) 2
where  x i  and  x j  are the attribute values of the ith and jth elements,  x ¯  is the average of the attribute values, and  w i j  is the spatial weight between the ith and jth elements. The article utilized the clustering and outlier analysis tools in ArcGIS to implement the process. The inverse distance method was chosen for the spatial relationship parameters. Different types of spatial clustering or dispersion in high-value clustered areas (HH), low-value clustered areas (LL), high and low outliers (HL), and low and high anomalies (LH), as well as non-significant (NS), were derived.
3.
Spatial relationship between physical sound level and soundscape perception
Band collection statistics is a spatial multivariate statistical analysis method for calculating raster band statistics information, which describes the spatial correlation of two datasets by calculating the covariance and correlation matrix between the layers. In this study, we utilized the band collection statistics of GIS spatial multivariate analysis to import sound level and soundscape perception raster maps into the analysis, construct the correlation coefficient matrices between different raster data, and explore the spatial correlation between sound level and soundscape perception [35]. The correlation coefficient Corr was used to express the correlation between two spatial variables, and the correlation coefficient was in the range of [−1, 1]. The larger the absolute value is, the stronger the correlation is, and the formula follows [44]:
C o r r i j = k = 1 n ( z i k μ i ) ( z j k μ j ) ( m 1 ) δ i δ j
where the correlation coefficient  C o r r i j , in general, the correlation coefficient 0 < |Corr| ≤ 0.1 is considered to be weak correlation, when 0.1 < |Corr| ≤ 0.3 is low correlation, 0.3 < |Corr| ≤ 0.5 is medium correlation, 0.5 < |Corr| ≤ 0.8 is high correlation, 0.8 < |Corr| < 1 is significant correlation, and |Corr| = 1 is complete correlation [45]; i, j are raster layers;  μ  is the mean value of layer image elements; m is the number of image elements;  z i k  is the kth image value of layer i z j k  is the kth image value of layer j; and  δ  is the standard deviation.

3. Results and Analysis

3.1. Characterization of Spatial and Temporal Patterns of Physical Acoustic Indicators

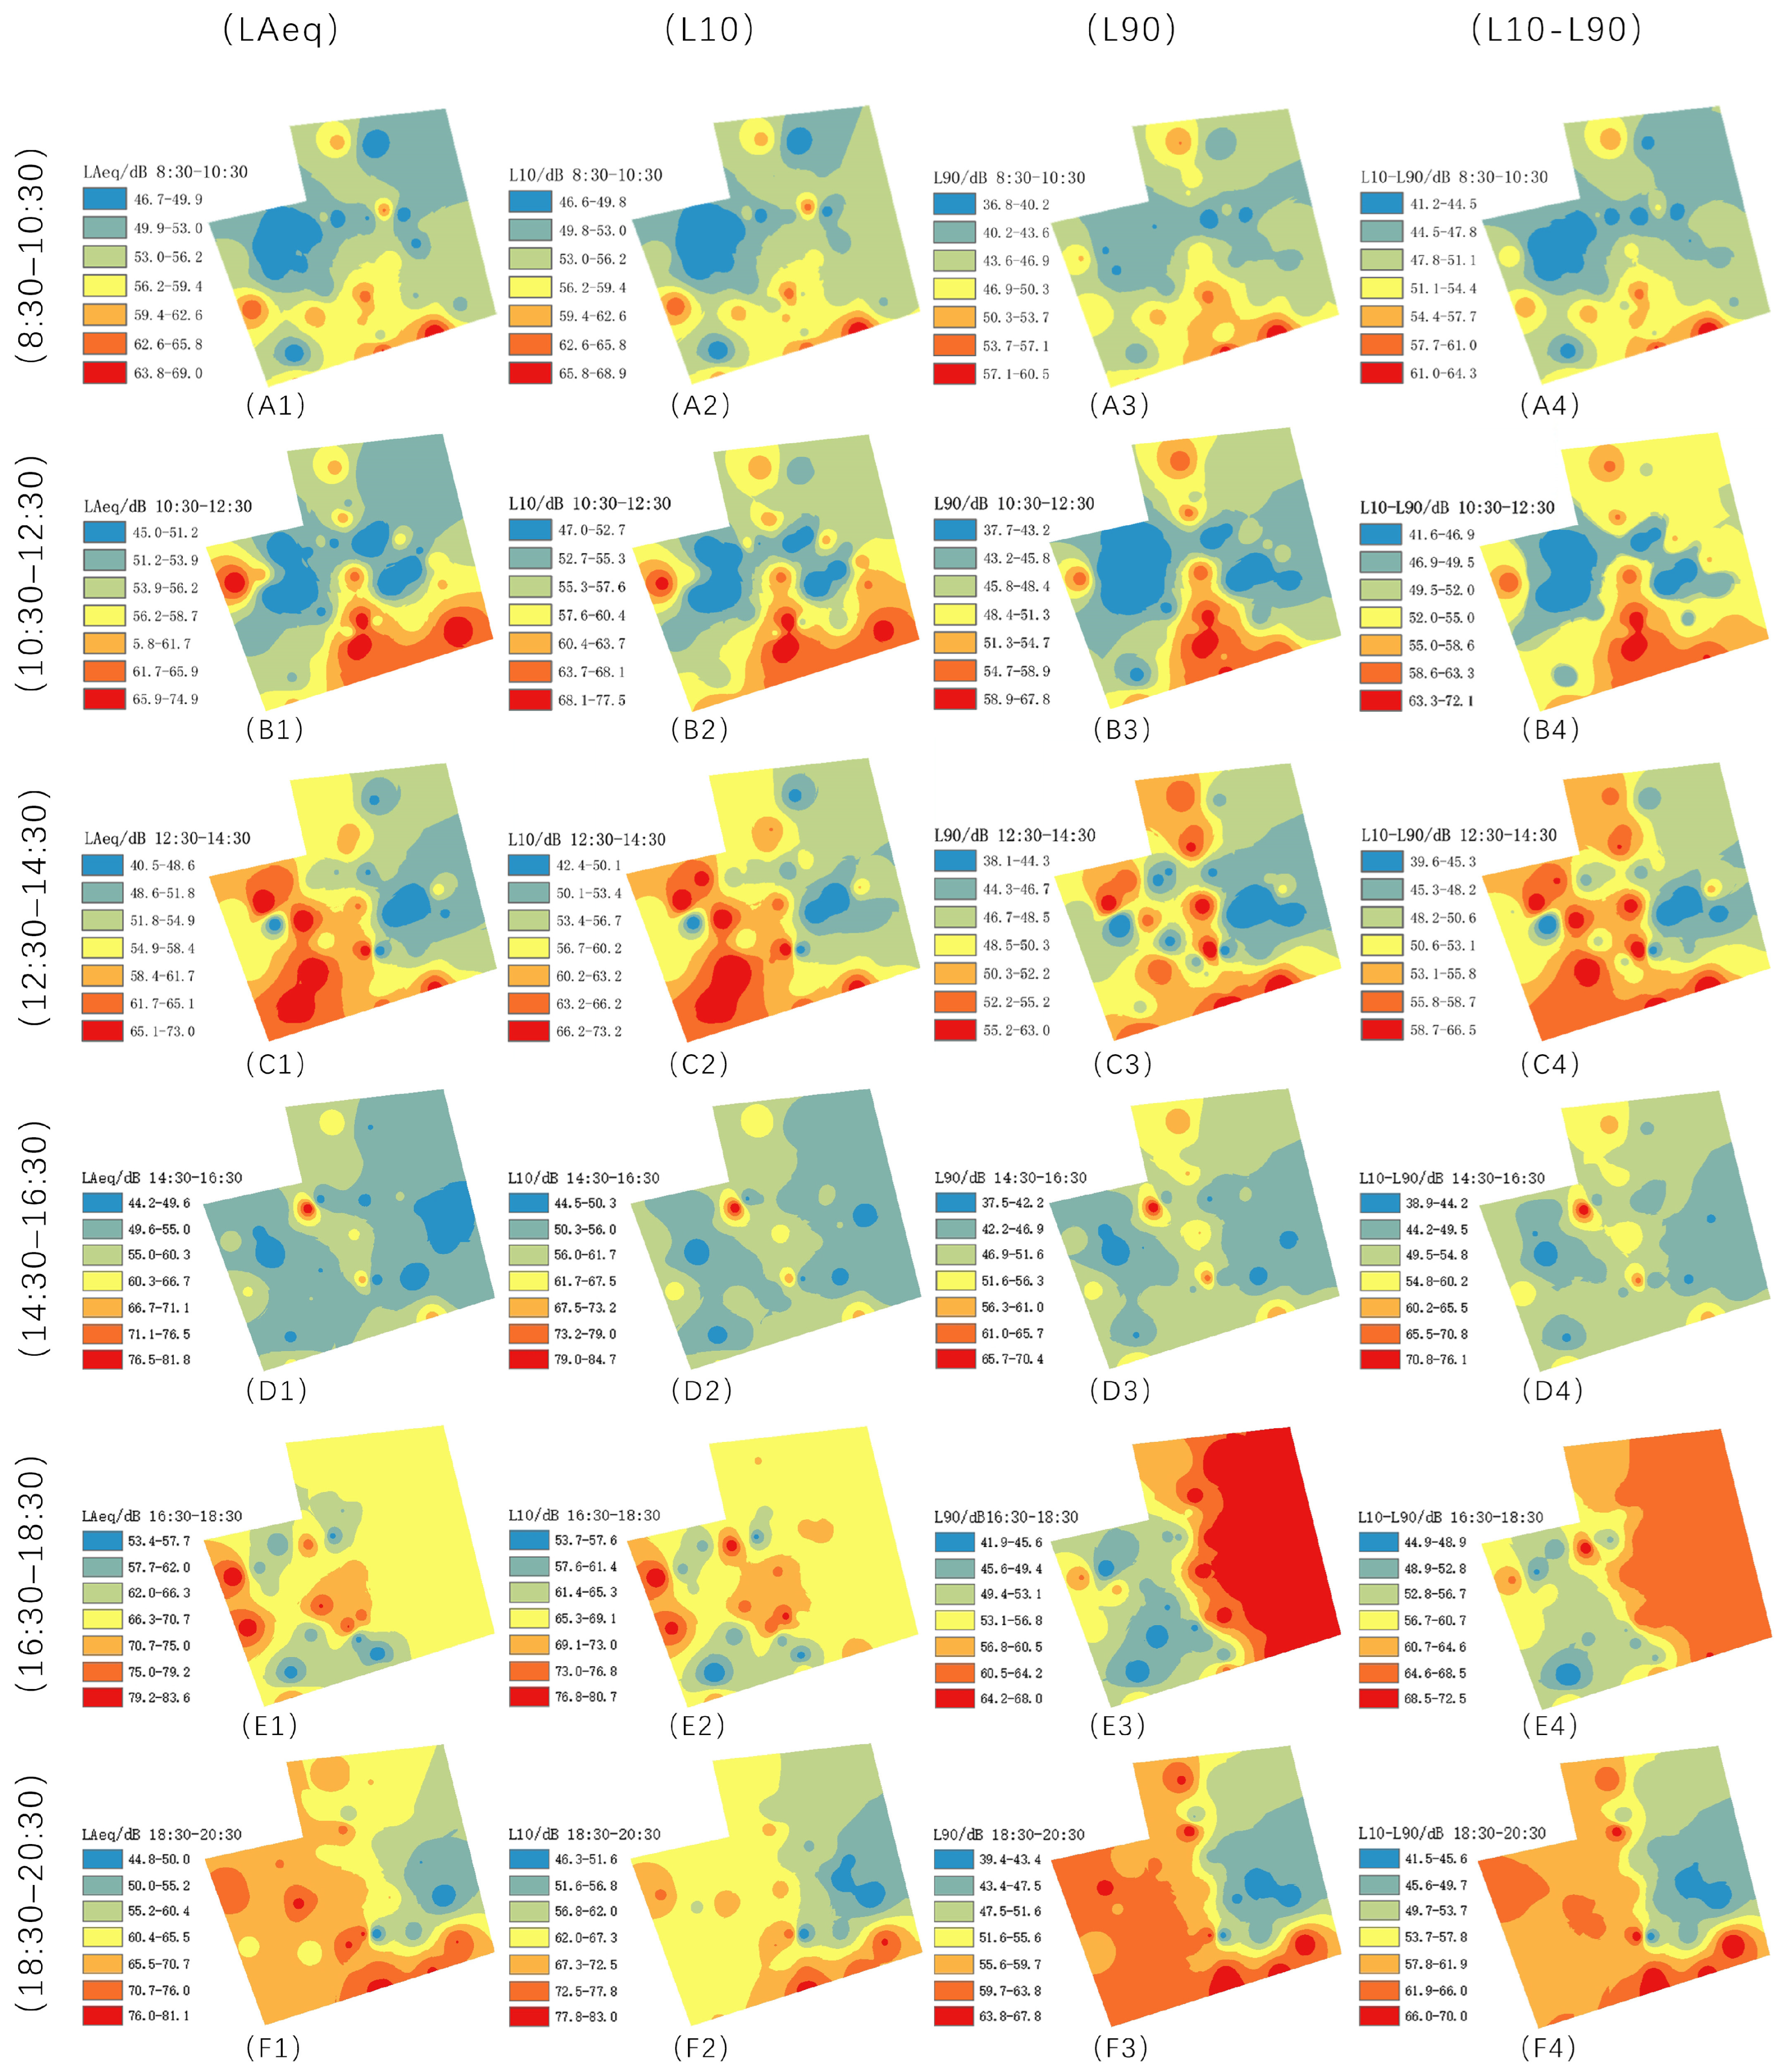
3.1.1. Characterization of the Spatial Distribution of Physical Acoustic Indicators

The spatial distribution pattern of the physical acoustic indicators ( L Aeq L 10 L 90 L 10 L 90 ) for different periods is shown in Figure 4. On the whole, the areas with high values of sound pressure level in all periods are mainly distributed at the entrances and exits of the main streets in the south and the north, and the sound pressure levels of the inner space of the lanes and courtyards are always at a lower value. The overall distribution of sound pressure levels in the Three Square and Seven Alleys showed a high level at the end of the main road and a low level in the inner courtyard, with the peaks of  L Aeq  occurring at the entrances and exits of the western side of the Square Road from 16:30 to 18:30 (E1) and the entrances and exits of the southern side of the main street from 18:30 to 20:30 (F1), and the highest fluctuating differences between the peaks of  L 10  (F2) and  L 10 L 90  (F4) occurring from 18:30 to 20:30 in the southern side of the Square Road.  L 10  (F2) peak values and  L 10 L 90  (F4) fluctuations with the most significant difference between the two areas occurred in the south of the main street entrance at 18:30–20:30, probably because most tourists will leave from the south of the main street entrance and exit in that time; the  L 90  (D3) in the courtyard space of the Shouzheng Hall at 14:30–16:30 reached the peak value of the day, probably because the residents of the Three Square and Seven Alleys time travel less; the flow of people to the tourists are mainly concentrated in the main street area. The Shouzheng Academy is far from the main street, and the neighborhood is under renovation, so the background sound was more robust than in other times and spaces. The lower sound pressure levels in the mile and courtyard spaces on either side of the central main street may be because these spaces are primarily cultural spaces with less foot traffic. The changes in the high values of acoustic indicators in different periods also specifically reflect the activity pattern of the Three Square and Seven Alleys. From the morning (8:00–10:30) to the evening (18:30–20:30), the location of the high-value areas changed gradually, from the southern entrance and exit of the main street (A1–A4) to the li spaces and courtyard spaces of the popular attractions (C1–C4), to the courtyard spaces near the Shouzheng Academy (D1–D4), and finally to the southern entrance and exit of the main street (F1,F2).

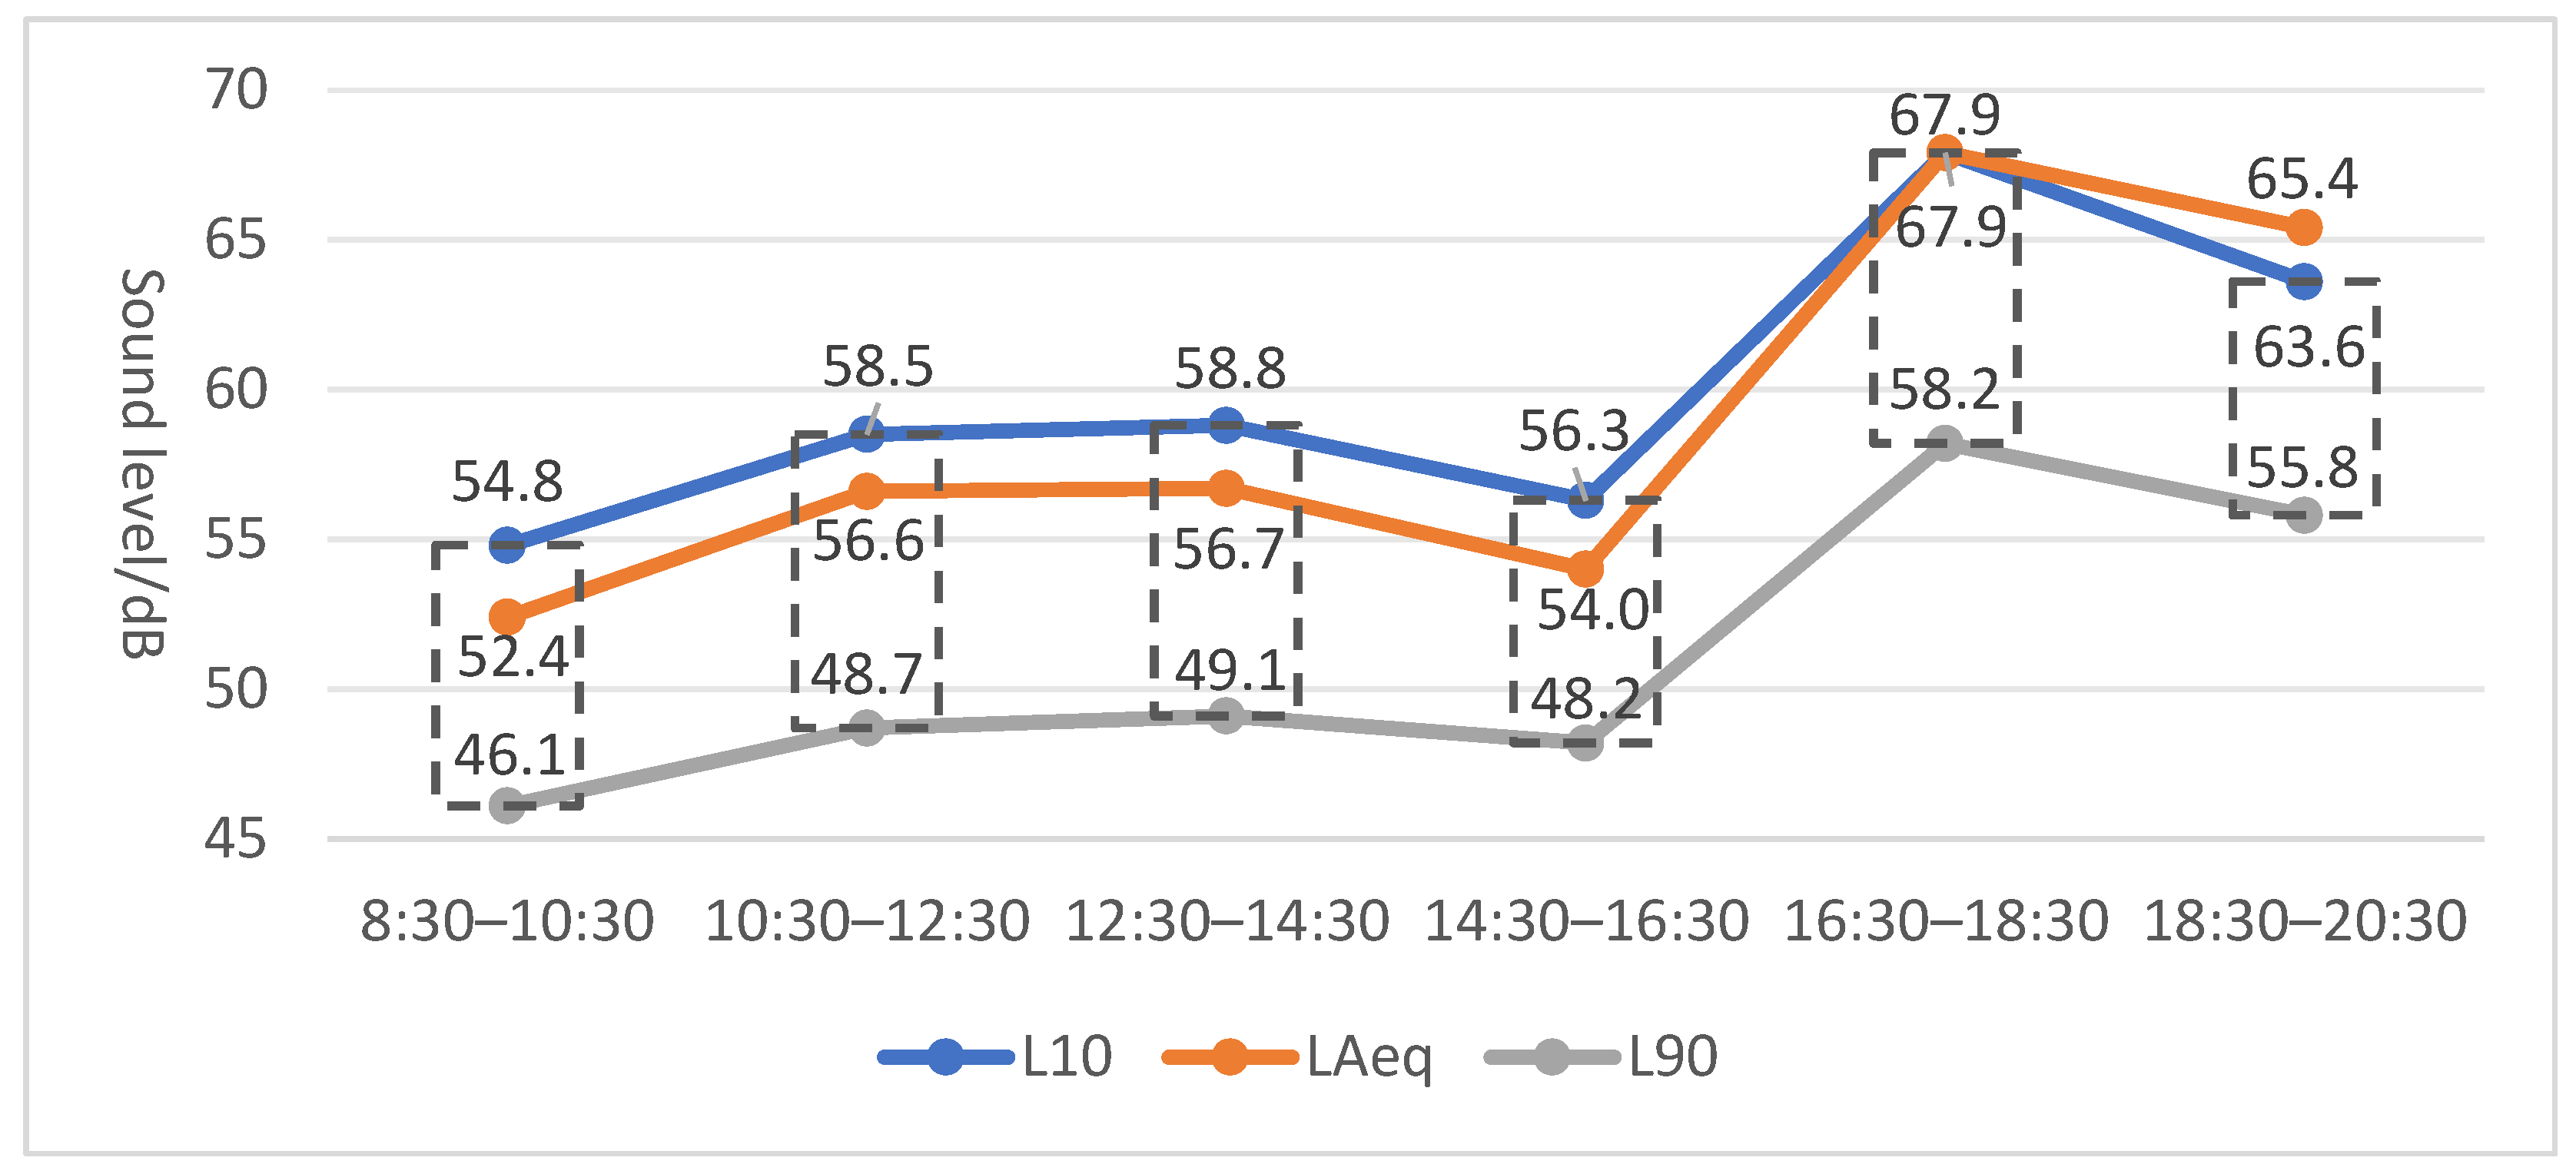
3.1.2. Time-Varying Characteristics of Physical Acoustic Indicators

The temporal variation of the overall physical acoustic indicator values is shown in Figure 5. The overall trend of physical acoustic indicators throughout the day is similar, showing an upward-to-downward and then upward-to-downward trend; the acoustic indicators both reached their lowest and highest values of the day in the morning (8:30–10:30) and evening (16:30–18:30). Among them,  L 10 L 90  had the most significant fluctuation differences in acoustic indicators in the morning and in the evening and later (10:30–12:30, 16:30–18:30, and 18:30–20:30), 9.8, 9.7, and 9.6, respectively, and the minor fluctuation difference in the afternoon period (14:30–16:30), 8.1.

3.2. Spatial Distribution Pattern of Sound Source Harmony

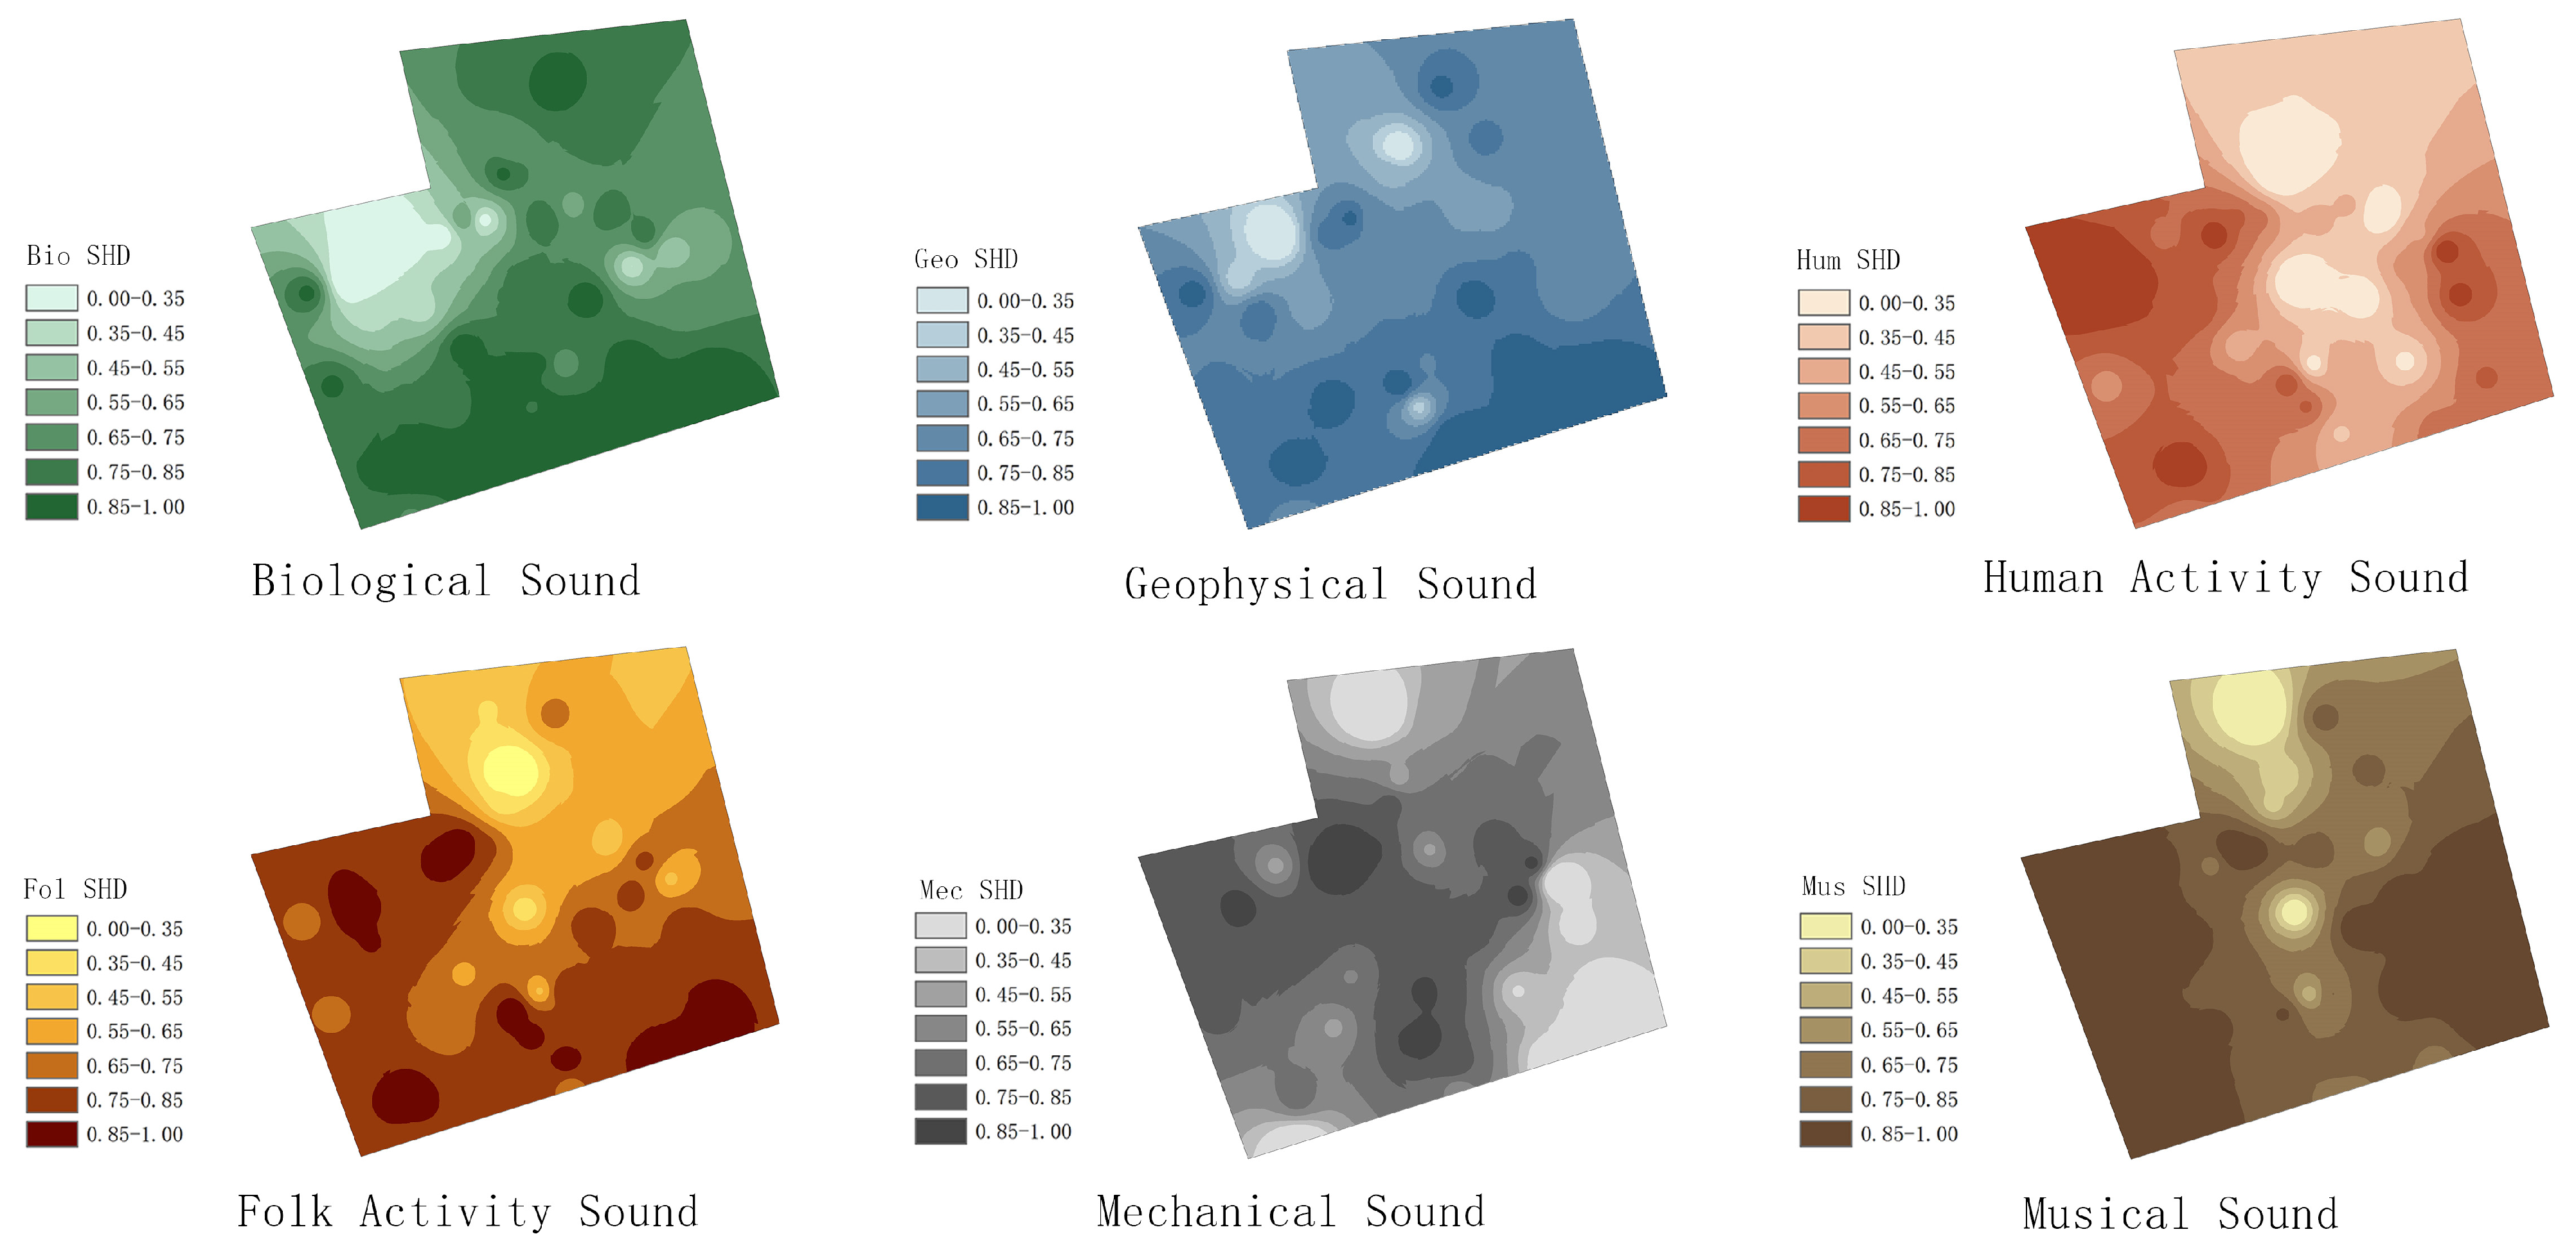
3.2.1. Characteristics of the Spatial Distribution of Sound Source Harmony

The mean values of the dominance of each type of sound source at each sampling point were standardized, and the spatial distribution of every kind of sound source harmony was obtained by the inverse distance weight method. The spatial distribution patterns of the six types of sound source harmony are shown in Figure 6. The distribution of harmonics of different kinds of sound sources is different. The spatial distribution of biological sound and geophysical sound acoustic harmonics is similar, with higher scoring areas located in the southern part of the Three Square and Seven Alleys and at the entrance of Langguan Alley, which is rich in vegetation. Lower scoring areas were located in the parking lot area under construction in the study area and in the western part, where there is less vegetation. The high values of human activity sound harmony were concentrated in the street space with low traffic flow, and the low values were focused on the main street space with high traffic flow and the street space close to the main street, which shows that people’s preference for human activity sound is low. Music sound harmony was lower in the main street space; the farther away from the main street, the higher the sound harmony. The high values of the sound harmony of folk activity sound were mainly distributed at the entrances of the alleys and temples, and the low values were primarily concentrated in the northern part of the Three Square and Seven Alleys and the main street and other areas with high pedestrian flow. Mechanical sound harmony was low near the city road and high in the space far away from the city road. Overall, spaces away from the main street had relatively high sound source harmony, while areas with higher foot traffic and sound levels had lower sound source harmony.

3.2.2. Global Spatial Dependence of Sound Source Harmony

The global autocorrelation results of the harmonics of the six types of sound source harmony are shown in Table 2. The global Moran’s I index was positive, and all the sound source types had spatial positive autocorrelation in a clustering pattern. Folk activity sound, human activity sound, and biological sound harmony showed extremely significant clustering patterns, in which the z-score of biological sound harmony was 3.941, with the most significant spatial positive autocorrelation; the z-score of mechanical sound harmony was 1.961, with a significant spatial positive autocorrelation; and the geophysical sound and musical sound harmonies showed a clustering pattern spatially, but the z-scores were not significant, and the degree of clustering was small.

3.2.3. Local Spatial Dependence of Sound Source Harmony

Compared to the global model, the local spatial model possessed more accuracy and could effectively identify the specific location of occurrence of different types of sound source perception clusters or outliers [35]. To further explore the existence of spatial heterogeneity, it was necessary to conduct an in-depth study on the local spatial autocorrelation of various types of sound source harmony to reveal whether the phenomena of positive correlation and negative correlation coexist in the same space.
The results of the local spatial autocorrelation of the sound source harmony are shown in Table 3. HH and LL represent the spatial homogeneity of the sound source harmonies, where HH indicates high sound source harmony in a region. The sound source harmony of the surroundings was also high. LL indicates that the harmonies of the sound sources in an area were low. The harmonies of the surrounding sound sources are also low. Both cases exhibited spatial positive autocorrelation. HL and LH represent the spatial heterogeneity of sound source harmony, with HL indicating that the harmonization of a sample point was high compared to that of the surrounding sound sources and LH indicating that the harmonization of a sample point was low compared to that of the surrounding sound sources, both of which show spatial negative autocorrelation. The remaining unlabeled points indicate that the local Moran’s I index of sound source harmony at the sample points was insignificant and showed a random distribution pattern [35].
The number of sample points with HH and LL clustering patterns was higher for human activity sound, folk activity sound, and biological sound; mechanical sound harmony mainly showed HH clustering patterns; the distribution of sample points with HH and LL clustering patterns was similar for folk activity sound and human activity sound source harmony; abnormal values were observed for all sound sources except for sound source harmony of human activity sound, with musical sound being the primary source type for which abnormal values were observed.
Sound source harmony showed that the sample points of HH agglomeration were mainly distributed in the space of the square, the space of the li, and the courtyard space of the left half of the Three Square and Seven Alleys; the sample points of LL agglomeration were concentrated in the space of the main street, the space of the alley and the courtyard space of the left half of the Three Square and Seven Alleys. The geophysical sound, biological sound, and music sound source harmony at the former residence and the memorial hall appeared HL anomalies; maybe the Shouzheng Hall and Zen Master’s Memorial Hall and other nodes of the courtyard had less circulation of people and there were courtyards that were blocked, so the sound source harmony compared to the surroundings was high. The sound source harmony of folk activities sound and machinery sound had LH anomalies near the parking lot and the entrance/exit of the alley, and the parking lot and the entrance had a large flow of people, and frequent sound of machines, so the sound source harmony was low compared to the surrounding area. The overall space was represented as sample points with the same sound source harmony distribution pattern, characterized by similar spatial types. All sound source-type perceptions in the local spatial model showed significant spatial autocorrelation.

3.3. Spatial Relationship between Physical Acoustic Indicators of the Soundscape and the Perceived Sound Source Harmony

The results of the spatial correlation between the soundscape physical acoustic indicators and the sound source harmony are shown in Table 4. The spatial correlation coefficient Corr was in the range of [−1, 1]; when Corr > 0, it is a spatially positive correlation, showing a clustering pattern and the absolute value of the coefficient is more considerable, the more significant the clustering tendency is; when Corr < 0 it is a spatially negative correlation, showing a discrete pattern and the absolute value of the coefficient is smaller, the more significant the discrete tendency is; when Corr = 0 it is no dependence relationship [35].
The sound source harmony other than biological sound showed different degrees of negative spatial correlation with each physical acoustic indicator, in which the Corr values of the harmony of human activity sound, folk activity sound, and musical sound with each physical acoustic index were all negative, with more obvious discrete effects, and were more influenced by physical acoustic indicators. Biological sound source harmony showed a spatial positive correlation with each physical acoustic indicator; the Corr values were all less than 0.3, and the degree of clustering was smaller. Geophysical sound source harmony was spatially positively correlated with  L Aeq  (0.031),  L 90  (0.471), and  L 10 L 90  (0.013), and spatially negatively correlated with  L 10  (−0.021), with the physical acoustic indicators showing little clustering or dispersion, except for those with  L 90 ; mechanical sound source harmony was spatially positively correlated with  L Aeq  (0.149) and  L 10  (0.147), but their degree of clustering was small. Each physical acoustic indicator showed different spatial correlations with each sound source harmony, with  L 90  showing the most significant correlation with each sound source harmony.

4. Discussion

4.1. Spatial and Temporal Variations of Physical Acoustic Indicators in the Three Square and Seven Alleys

The overall distribution of sound pressure levels in the Three Square and Seven Alleys shows a high level at the end of the road trunk and a low level in the courtyard space (Figure 4). The high sound pressure level at the end of the main road may be because the main street and the entrances and exits of the alleys serve as distribution spaces, prone to crowd gathering and a relatively noisy acoustic environment [46,47]. The sound pressure level in the courtyard space is low, probably because the courtyard space is mostly the former residence of celebrities, cultural space, exhibition attractions, etc., which is relatively closed compared with other street and alley spaces, with less flow of people. This kind of space carries the spatial function of cultural exchange and spiritual dissemination, so the acoustic environment is relatively quiet [48]. The overall physical acoustic indicators change from morning to evening from a rising to falling to a rising to falling trend, and in the morning (8:30–10:30) and evening (16:30–18:30), two hours to reach the day’s low peak and peak, respectively (Figure 5). The main factor causing changes in physical acoustic indicators may be the flow of people in different functional spaces at various times of the day. High crowd density, frequent activities, and spatial locations tend to gather more traffic flow, i.e., one of the main factors triggering the high and wide range of sound levels [35,49]. These findings suggest that physical acoustic indicators reflect the activity level and behavioral patterns of human activities to a certain extent. Therefore, in soundscape planning, noise control can be carried out at different spatial and temporal nodes with high values of  L Aeq L 10 , and  L 90 , as well as significant differences in the fluctuations of  L 10 L 90 , depending on the objective properties of the soundscape, e.g., implementation of dynamic noise control measures and installation of temporary noise barriers for morning and evening acoustic peak hours (8:30–10:30 and 16:30–18:30).

4.2. Spatial Distribution Patterns of Sound Source Harmony in the Three Square and Seven Alleys

The distribution areas of low and high sound source harmony in the Three Square and Seven Alleys are different, with prominent spatial characteristics (Figure 6). The areas with high values of biological sound and geophysical sound source harmony are located in the southern part of the Three Square and Seven Alleys and the entrance and exit of Langguan Alley, etc., which are rich in vegetation. The ecological quality of these areas is good, and it is easy to attract birds, insects, and other sound-producing organisms to congregate [50]; the wind-blown foliage sound will be more prominent where the vegetation is rich and concentrated, so the perceived frequency of these two types of sound sources is higher in these areas. The degree of sound source harmony is high. The low mechanical sound source harmony values are mainly concentrated near the urban road, and the high values focus on the area far from the urban road. This may be due to the low preference for mechanical sounds, such as traffic and construction sounds [51], and areas close to urban roads, which are dominated by traffic functions and have a high traffic volume. Hence, the mechanical sounds are more pronounced and become the primary source of the sound, which can lead to a decrease in the degree of harmony, while in the area far away from the city road, the mechanical sounds, such as traffic sounds, are no longer the primary sound source, and the degree of sound source harmony is increased. Areas with high values of sound source harmony of folk activities are mainly located at the mouths of alleys and in areas where temples are concentrated. These are the concentrated areas of special folk performances or religious music playing, with a high frequency of perception and high sound source harmony. Influenced by the functional space, human activities are mainly concentrated in the main street, and the high flow of people is one of the main factors affecting the change of the sound source harmony of music and the sound of folk activities. Therefore, the low values of the sound source harmony of human activities, the sound of music, and the sound of folk activities are all concentrated in the main street, and the high values are focused on the space far away from the main street. In summary, the dominant position of different sound sources in the spatial dimension of the Three Square and Seven Alleys varies according to the function of the place, which confirms the conclusion of the previous study [24,52]. Therefore, according to the perceptual attributes of the soundscape, the functional spaces with lower or higher sound source harmony of various sound sources can be regulated or protected, and different types of soundscape can be created in other areas according to their spatial characteristics, such as at the mouths of alleys, temples and other places with frequent folk activities, and planning of regular folk performances and cultural displays, to enhance the perceived frequency and harmony of the cultural soundscape, and at the same time, using soundscape design to guide the flow of tourists and reduce the pressure on the sound environment of the main street.
The study of global spatial autocorrelation found that sound source harmony showed different degrees of spatial positive autocorrelation (Table 2), which verified that there is some spatial interaction of sound source harmony, i.e., there is spatial dependence, and that differences in the type of sound source can lead to different degrees of spatial differences in the soundscape. The clustering pattern of human activity sound (3.607) and biological sound (3.941) harmonics is the most significant, and the spatial difference is slight compared with other sound source types. It may be because the Three Square and Seven Alleys cover a vast area, most of the area is far away from the main traffic arteries, the internal travel is based on walking, and the greenery is planted in an orderly manner in the neighborhood so that human activities and biological activities are evenly distributed in the Three Square and Seven Alleys. These two types of sound sources have the most significant similarity in the sound source harmony of the individual sampling points with those of the neighboring areas, forming the substrate for the internal sound of the historic and cultural district. This phenomenon also reflects the similarity of human activities and the natural environment per space unit with the surrounding space [35]. The sound source harmony of folk activity sound (3.244) shows a highly significant clustering pattern, probably because folk event sounds are mainly generated by music played in temples and ancestral halls, performances of folk events, etc., which has less spatial variability within the scenic area [53]. Although the sound source harmony of mechanical sound (0.205) shows an aggregation pattern, its z-score (1.961) was smaller than that of biological sound, human activity sound, and folk activity sound, and considering that most of the sampling points set up at the edge of the area were located at the border between the Three Square and Seven Alleys and the city traffic, the mechanical sound harmony will be affected by the city traffic sound at the edge area, but the traffic sound inside the space is not affected much [54]. From the above, it can be seen that the perception of sound sources inside the Three Square and Seven Alleys will be influenced by the neighboring environment, not randomly distributed, and the soundscape space is self-contained in the city with a self-organized spatial layout pattern., which aligns with the results of the previous studies [27,35]. Therefore, different sound source types should be regulated at the macro level to maintain the overall homogeneity in the region. The sound source types that show a very significant aggregation pattern in source harmonization, such as human activity sound, biological sound, and folk activity sound, can be protected as a whole, preserving the memory of the original place and creating a landscape atmosphere that is different from that of the urban space.
The research results of local spatial autocorrelation show that the distribution pattern of soundscape perception quality is closely related to the spatial type, and the sample points with the same distribution pattern of sound source harmony have similar spatial functional characteristics (Table 3). Sound source harmony shows that the sample points of the LL cluster are concentrated in the space of the main street, the space of the alley, and the courtyard space of the right half of the Three Square and Seven Alleys, and the space of this type of area is relatively mobile, and the noise interference generated by human activities and traffic circulation is more serious; the sample points of the HH cluster were mainly distributed in the space of the square, the space of the alley, and the courtyard space of the left half of the Three Square and Seven Alleys, and the space of this type of area is relatively static, with a secluded environment, low sound level, and far away from all kinds of noise pollution. Among them, the LL clustering sample points of the sound source harmony of folk activity sound were concentrated in the space of the main street of the Three Square and Seven Alleys and the right side of the alley near the main street, the courtyard space, the low sound source harmony of this sound source is opposite to the positive effect that is generally believed, probably because of the distribution of the sound of the region of the folk activities of the sound of the penetration of the sound of the folk, folk sounds mixed, and the lack of, or challenging to reflect the local characteristics of the local culture, and cannot evoke emotional resonance [55]. The HH clustering sample sites are concentrated on the left side of the main street in the remote and quiet space of the workshop and courtyard. The distribution area is usually for the former residences of celebrities, exhibitions of famous artists’ works, and Zen space and other independent spaces. These venues are important carrier spaces for cultural exchanges with high soundscape quality [8,56]. It is thus concluded that there may be a positive relationship between the distribution pattern of the perceived quality of soundscape in the Three Square and Seven Alleys and the cultural environment in which it is located. Exploring the factors that influence space type on the propagation of sound sources and the degree of matching between the cultural attributes expressed by the sound sources and the environment can provide a reference for optimizing soundscape in the surrounding areas with similar spatial environments.

4.3. Spatial Relationship between Physical Acoustic Indicators and Sound Source Harmony in the Three Square and Seven Alleys

The study results show that the spatial relationship between the physical acoustic indicators and the sound source harmony mainly indicates different degrees of spatial negative correlation, with a more significant spatial dispersion trend (Table 4). The sound source harmony of human activity sound, music sound, and folk activity sound showed a significant spatial negative correlation with each physical acoustic indicator, indicating that when the sound level is in a higher state, the sound source harmony of these three sound sources will decrease, and the higher the physical acoustic indicators, the stronger the spatial dispersion effect of the sound source harmony. Among them, the spatial negative correlation between human activity sound source harmony and  L 90  was the most significant (−0.683), i.e., when the background sound of the sound field is in the state of high sound level for a long time, the human activity sound harmony will be affected to a greater degree. With the enhancement of the background sound, the decline of human activity sound harmony will be more significant. A possible reason is that the Three Square and Seven Alleys have the dual attributes of a historic and cultural district and a commercial pedestrian street with frequent human activities. The sound of human activities such as footsteps, talking, and children’s playfulness has become the most common sound source in the Three Square and Seven Alleys [29]. An increase in sound pressure level increases the perception of human activity sound, decreasing the soundscape’s quality and negatively affecting the sound source harmony [57]. People’s preference for the type of sound source affects their subjective perception [58,59], and the sound of musical sound and folk activities are favorite sounds as characteristic sound sources for a sense of place creation. When the physical acoustic indicators increased, these two types of sound sources are masked by the sound of human activities, affecting the soundscape’s quality and decreasing the sound source harmony [55]. Although the spatial positive correlation between the biological sound source harmony and each physical acoustic indicator is presented, the degree of clustering is small, indicating that the bio-sound harmony increases when the sound level is higher. Still, it is not significant, i.e., changes in physical acoustic indicators have a small effect on the bioacoustic harmony, probably because the bio-sound is not affected by the urban sound sources (human sound and traffic sound) and forms its system within the Three Square and Seven Alleys [60]. Geophysical sound (0.471) and mechanical sound (−0.426) harmony show less clustering or dispersion with physical acoustic indicators except  L 90 . That is,  L 90  significantly affects the sound source harmony of geophysical and mechanical sounds, probably because geophysical and mechanical sounds act as low-frequency background sounds [61,62], which change considerably with background sound enhancement of these two types of sound sources. Based on the above, it can be concluded that each physical acoustic indicator potentially negatively impacts the spatial distribution of sound source harmony, consistent with previous studies’ results [35]. As a result, measures can be taken to control the sound levels of physical acoustic metrics such as  L 90 , which have a significant impact and can improve the sound source harmony of specific sound sources more effectively.

4.4. Limitations and Prospects

This study still has some limitations. Regarding sound sources, several artificially created sounds within the scope of the research object, such as artificial birdsong, artificial water sounds, etc., may impact sound source perception and need to be explored further. For the analysis of temporal and spatial characteristics, only the physical acoustic indicators of the research object have been analyzed in terms of time and space. They should not be limited to space in terms of sound source perception. The temporal dimension is also a key aspect in exploring spatial dependence [63], and it is necessary to combine the research. Therefore, future studies need to consider expanding to longer-term soundscape monitoring with more temporal data to analyze spatial correlations over different periods, such as accumulating cross-seasonal time-series data, to explore soundscape characteristics of the study area more comprehensively, and to improve soundscape quality. In addition, this study is based on the summary of the specific case of the Three Square and Seven Alleys, and the generalizability of its conclusions needs to be verified by studies in larger areas.

5. Conclusions

In this study, soundscape information of the Three Square and Seven Alleys in Fuzhou was obtained through field sound monitoring and questionnaire surveys, and soundscape maps were used to visualize the data. This study identifies the spatial and temporal patterns of the soundscape’s physical acoustic indicators and the sound sources’ spatial characteristics. It explores the spatial relationship between physical acoustic indicators and soundscape perception. The main findings include the physical acoustic indicators ( L Aeq L 10 L 90 L 10 L 90 ) show dynamic changes on the spatial and temporal scales, are mainly affected by the flow of people in different functional spaces at other times of the day, and reflect a certain level of activity and behavioral patterns of human activities. Each sound source perception has prominent spatial characteristics, and sound source harmonics differ in different functional spaces. Sound source harmony shows spatial autocorrelation in both global and local models, and the distribution pattern of soundscape perception attributes is closely related to the spatial type and influenced by the surrounding environment. Sound source harmony and the physical acoustic indicators mainly show a spatial negative correlation, and the physical acoustic indicators may hurt the perception of sound source harmony. Therefore, in the management and protection of historic districts, appropriate measures can be considered, such as the implementation of time-period crowd dispersion strategies to manage the flow of people dynamically; the introduction of acoustic barriers and sound-absorbing materials, such as green belts and noise-insulating walls, for high-flow areas to reduce the noise level while maintaining the historical appearance of the neighborhoods; and the development of specific soundscape planning guidelines based on the functions of the places.
The above research results can provide a scientific basis and empirical data for the optimization and future development of urban historic and cultural districts, help decision-makers and planners to accurately meet the public’s expectations of soundscape, and guide the development of refined construction and renovation strategies to enhance the quality of soundscape and the overall quality and experience of urban historic spaces. Future research will further explore the effects of visitor background, preference, specific sound sources, spatial environment, and seasonal time on sound perception to deepen the understanding of the complexity of soundscape management in historic districts and promote further exploration of soundscape management and design.

Author Contributions

Conceptualization, J.Y., L.W. and Q.Z.; methodology, J.Y.; software, L.W., Q.Z. and Y.Y.; validation, L.W.; formal analysis, L.W. and Q.Z.; investigation, T.L., Y.H. and Y.Z.; resources, J.Y.; data curation, T.L. and Y.H.; writing—original draft preparation, L.W.; writing—review and editing, J.Y.; visualization, L.W. and Q.Z.; supervision, J.Y.; project administration, T.H.; funding acquisition, J.Y. All authors have read and agreed to the published version of the manuscript.

Funding

The research was funded by the Social Science Foundation of Fujian Province (FJ2024BF080).

Data Availability Statement

Data not available due to confidentiality requirements.

Conflicts of Interest

The authors declare no conflict of interest.

References

  1. Feng, G. Why should sound cities have memories? Chongqing Archit. 2005, 6. [Google Scholar]
  2. Zhao, Z.Y.; Li, Z. Street life: A study of healing places in historic districts in urban renewal. Art Des. Res. 2024, 1, 88–93. [Google Scholar]
  3. Lin, Y.; Xuan, Y.; Guo, H. Cultural Space Creation in Historic Neighbourhoods from an Operational Perspective: The Case of Sanfangqixiang in Fuzhou City. Urban Archit. 2023, 20, 65–68. [Google Scholar] [CrossRef]
  4. Xiao, M.; Guo, J.; Zhao, X. A preliminary study on the spatial and temporal differentiation of soundscape in the historical and cultural neighbourhood of Jianghan Road, Wuhan. Cent. China Archit. 2023, 41, 35–40. [Google Scholar]
  5. Cao, J.; Kang, J. A Perceptual Structure of Soundscapes in Urban Public Spaces Using Semantic Coding Based on the Grounded Theory. Int. J. Environ. Res. Public Health 2023, 20, 2932. [Google Scholar] [CrossRef] [PubMed]
  6. Xie, H.; He, Y.; Liu, C. A study on the renewal design strategy of historic districts under the intervention of soundscape: The case of the old street of Danzishi in Chongqing. Mod. Urban Res. 2021, 10, 55–62. [Google Scholar]
  7. Hu, X.; He, J. in Soundscape Application for the Conservation and Vibrant Revival of Historical and Cultural Neighbourhoods—Taking Changsha Taiping Old Street as an Example. In Proceedings of the 2019 Architectural Society of China Architectural History Branch Annual Meeting and Symposium, Beijing, China, 8–10 November 2019; p. 4. [Google Scholar]
  8. Chen, M.-C.; Wu, W.-L.; Qu, G.-C. Research on the protection and optimization of soundscape heritage based on subject-object perception: A case study of Huishan Ancient Town, Wuxi. China Famous City 2021, 35, 65–70. [Google Scholar] [CrossRef]
  9. Liu, J.; Yang, L.; Zhang, X. A study on the relationship between soundscape perception and landscape evaluation of historical neighbourhoods—A case study of Sanfangqixiang, Fuzhou. Chin. Gard. 2019, 35, 35–39. [Google Scholar]
  10. Qin, Y. Scope of soundscape. In Proceedings of the Ninth National Conference on Building Physics, Nanjing, China, 15–17 October 2004. [Google Scholar]
  11. Wang, J.; Jia, L. A study of living street soundscape in Chengdu from the perspective of cultural heritage. Urban Archit. 2022, 19, 177–182. [Google Scholar] [CrossRef]
  12. Hong, J.Y.; Ong, Z.; Lam, B.; Ooi, K.; Gan, W.; Kang, J.; Feng, J.; Tan, S. Effects of adding natural sounds to urban noises on the perceived loudness of noise and soundscape quality. Sci. Total Environ. 2020, 711, 134571. [Google Scholar] [CrossRef]
  13. Aletta, F.; Kang, J.; Axelsson, Ö. Soundscape descriptors and a conceptual framework for developing predictive soundscape models. Landscape Urban Plan. 2016, 149, 65–74. [Google Scholar] [CrossRef]
  14. Northwestern Polytechnical University; Zhejiang University; Tongji University; Chongqing University; Institute of Acoustics, Chinese Academy of Sciences; Zhejiang Institute of Science and Technology; Guangdong Qiyuan Architectural Engineering Design Institute Co. Acoustics Soundscape Part 1: Definitions and conceptual framework. In State Administration for Market Supervision and Regulation; National Committee for Standardisation: Beijing, China, 2014. [Google Scholar]
  15. Jo, H.I.; Jeon, J.Y. Effect of the appropriateness of sound environment on urban soundscape assessment. Build. Environ. 2020, 179, 106975. [Google Scholar] [CrossRef]
  16. Xu, X.; Zhuang, A.; Han, F. Effects of dominant tones on perceived emotions of soundscapes in nature conservation sites—A case study of Wulingyuan World Heritage Site. Chin. Gard. 2019, 35, 28–33. [Google Scholar] [CrossRef]
  17. Yuting, Y.; Yuhan, S.; Huilin, L.; Yiying, H.; Like, J. Predicting and Visualizing Human Soundscape Perception in Large-Scale Urban Green Spaces: A Case Study of the Chengdu Outer Ring Ecological Zone. Forests 2023, 14, 1946. [Google Scholar] [CrossRef]
  18. Aletta, F.; Kang, J. Soundscape approach integrating noise mapping techniques: A case study in Brighton, UK. Noise Mapp. 2015, 2, 1–12. [Google Scholar] [CrossRef]
  19. Wang, Y.; Yin, C.; Ni, X.; Wang, Y. Experimental study on soundscape and audiovisual perception in urban historic districts. Appl. Acoust. 2020, 39, 104–111. [Google Scholar]
  20. Rui, Q.X.; Zhao, W. In Winter and Summer Differences in Soundscape Perception for Landscape Evaluation of Historical and Cultural Neighbourhoods—A Case Study of Central Avenue. In Proceedings of the 2021 Annual Meeting of the Chinese Society of Landscape Architecture, Changsha, China, 15–17 April 2021; p. 4. [Google Scholar]
  21. Jeon, J.Y.; Hong, J.Y. Classification of urban park soundscapes through perceptions of the acoustical environments. Landsc. Urban Plan 2015, 141, 100–111. [Google Scholar] [CrossRef]
  22. Efstathios, M.; Jian, K.; Francesco, A.; Östen, A. On the relationship between land use and sound sources in the urban environment. J. Urban Des. 2020, 25, 626–642. [Google Scholar] [CrossRef]
  23. Liu, J.; Kang, J.; Luo, T.; Behm, H.; Coppack, T. Spatiotemporal variability of soundscapes in a multiple functional urban area. Landsc. Urban Plan 2013, 115, 1–9. [Google Scholar] [CrossRef]
  24. Hong, J.Y.; Jeon, J.Y. Influence of urban contexts on soundscape perceptions: A structural equation modeling approach. Landsc. Urban Plan 2015, 141, 78–87. [Google Scholar] [CrossRef]
  25. Zhu, C.; TianYuan, Z.; Jiang, L.; XinChen, H. Before Becoming a World Heritage: Spatiotemporal Dynamics and Spatial Dependency of the Soundscapes in Kulangsu Scenic Area, China. Forests 2022, 13, 1526. [Google Scholar] [CrossRef]
  26. Rychtáriková, M.; Vermeir, G. Soundscape categorization on the basis of objective acoustical parameters. Appl. Acoust. 2013, 74, 240–247. [Google Scholar] [CrossRef]
  27. Hong, J.Y.; Jeon, J.Y. Exploring spatial relationships among soundscape variables in urban areas: A spatial statistical modelling approach. Landsc. Urban Plan 2017, 157, 352–364. [Google Scholar] [CrossRef]
  28. Pan, S. Ruminations on the Conservation and Development of Three Square and Seven Alleys in Fuzhou. Dev. Res. 2004, 10, 72–73. [Google Scholar]
  29. Guo, T.; Yang, L.; Gui, Y.; Zhu, T.; Liu, J.; Ren, W. Research on the influencing factors of placemaking in historic districts under soundscape perception. Acoust. Technol. 2022, 41, 108–115. [Google Scholar]
  30. Chen, L.; Fang, K.; Wang, X.; Zhang, W.; Zhu, G.; Zhang, Z.; Furuya, N. The spatial feature and use pattern of external space in Chongqing traditional urban settlement. J. Asian Archit. Build. 2022, 22, 125–138. [Google Scholar] [CrossRef]
  31. Liu, K. Soundscape design in city parks: Exploring the relationships between soundscape composition parameters and physical and psychoacoustic parameters. J. Environ. Eng. Landsc. 2015, 23, 102–112. [Google Scholar] [CrossRef]
  32. Weijters, B.; Geuens, M.; Baumgartner, H. The Effect of Familiarity with the Response Category Labels on Item Response to Likert Scales. J. Consum. Res. 2013, 40, 368–381. [Google Scholar] [CrossRef]
  33. Jing, M.; Wu, J. Fast image interpolation using directional inverse distance weighting for real-time applications. Opt. Commun. 2013, 286, 111–116. [Google Scholar] [CrossRef]
  34. Liu, J.; Xiong, Y.; Wang, Y.; Luo, T. Soundscape effects on visiting experience in city park: A case study in Fuzhou, China. Urban Urban Gree 2018, 31, 38–47. [Google Scholar] [CrossRef]
  35. Liu, J.; Zhu, T.; Hong, X. Spatio-temporal dynamics and spatial dependence characteristics of sound source perception in urban forest parks. Chin. Gard. 2022, 38, 64–69. [Google Scholar]
  36. Lei, J.; Chen, Z.; Chen, Y.; Chen, X.; Li, Y.; Wu, T. Evolution of ecological security pattern of wetland landscapes on Hainan Island, 1990–2018. J. Ecol. Environ. 2020, 29, 293–302. [Google Scholar]
  37. Ricciardi, P.; Delaitre, P.; Lavandier, C.; Torchia, F.; Aumond, P. Sound quality indicators for urban places in Paris cross-validated by Milan data. J. Acoust. Soc. Am. 2015, 138, 2337. [Google Scholar] [CrossRef]
  38. Yong, J.J.; Young, H.J.; Jik, L.P. Soundwalk approach to identify urban soundscapes individually. J. Acoust. Soc. Am. 2013, 134, 803–812. [Google Scholar] [CrossRef]
  39. Negreiros, J.G.; Painho, M.T.; Aguilar, F.J.; Aguilar, M.A. A comprehensive framework for exploratory spatial data analysis: Moran location and variance scatterplots. Int. J. Digit. Earth 2010, 3, 157–186. [Google Scholar] [CrossRef]
  40. Wang, Y.; Ji, Y.; Yu, H.; Lai, X. Measuring the Relationship between Physical Geographic Features and the Constraints on Ecosystem Services from Urbanization Development. Sustainability 2022, 14, 8149. [Google Scholar] [CrossRef]
  41. Guo, A.; Yang, J.; Sun, W.; Xiao, X.; Cecilia, J.X.; Jin, C.; Li, X. Impact of urban morphology and landscape characteristics on spatiotemporal heterogeneity of land surface temperature. Sustain. Cities Soc. 2020, 63, 102443. [Google Scholar] [CrossRef]
  42. Rogerson, P.A. Optimal geographic scales for local spatial statistics. Stat. Methods Med. Res. 2011, 20, 119–129. [Google Scholar] [CrossRef]
  43. Hu, J.; He, P. Spatial and temporal coupling and coordination between new urbanization and agricultural green development in China. J. Party Sch. Yunnan Prov. Comm. Communist Party China 2024, 25, 125–139. [Google Scholar]
  44. Zeng, J.; Yin, M.; Xu, J. Study on the spatial coupling relationship between urban residential price distribution and public service facilities—A comparative analysis of second-hand and rental housing in central Nanjing as an example. In Proceedings of the 2022/2023 China Annual Conference on Urban Planning, Wuhan, China, 23–25 September 2023. [Google Scholar]
  45. Gu, Q.; Geng, G.; Zheng, R.; Zhang, B.; He, Z. Analysis of spatial and temporal variation of soil moisture and its influencing factors in the Weihe River Basin. Soil Water Conserv. Res. 2024, 1–13. [Google Scholar] [CrossRef]
  46. Zhao, X.; Zhang, S.; Meng, Q.; Kang, J. Influence of Contextual Factors on Soundscape in Urban Open Spaces. Appl. Sci. 2018, 8, 2524. [Google Scholar] [CrossRef]
  47. Sheng, F.; Guo, S.; Lin, G.; Wen, M. Vibrant Spaces of Historical and Cultural Neighbourhoods Based on Open Big Data—A Case Study of Sanfangqixiang in Fuzhou. In Proceedings of the 2022/2023 China Annual Conference on Urban Planning, Wuhan, China, 23–25 September 2023; p. 9. [Google Scholar]
  48. Wang, X.; Wang, S.; Xue, Y. Analysis of spatial use and main factors of historic districts: The case of Sanfangqixiang. Res. Nat. Cult. Herit. 2023, 8, 13–22. [Google Scholar] [CrossRef]
  49. Weifu, G.; Jian, K.; Hui, M.; Chao, W. The effects of environmental sensitivity and noise sensitivity on soundscape evaluation. Build. Environ. 2023, 245, 110945. [Google Scholar] [CrossRef]
  50. Ednie, A.; Gale, T. Soundscapes and protected area conservation: Are noises in nature making people complacent? Nat. Conserv. 2021, 44, 177–195. [Google Scholar] [CrossRef]
  51. Ye, J.; Zheng, J.; Wang, H.; Zheng, Y. Evaluation of acoustic landscape preferences in wetland parks. Acoust. Technol. 2022, 41, 734–741. [Google Scholar]
  52. Hong, J.Y.; Jeon, J.Y. Comparing associations among sound sources, human behaviors, and soundscapes on central business and commercial streets in Seoul, Korea. Build. Environ. 2020, 186, 107327. [Google Scholar] [CrossRef]
  53. Ye, J.; Li, S.; Chen, Y.; Ma, Y.; Chen, L.; He, T.; Zheng, Y. A Study of the Effects of Historical Block Context on Soundscape Perception. Buildings 2024, 14, 621. [Google Scholar] [CrossRef]
  54. Lee, H.M.; Lee, H.P.; Liu, Z. Acoustical Environment Studies in the Modern Urban University Campuses. Acoustics 2022, 4, 14–25. [Google Scholar] [CrossRef]
  55. Ye, J.; Chen, L.; Zheng, Y. Effect of an Artificial Sound-Based Index on the Perception of Historical Block Environments. Buildings 2023, 13, 2372. [Google Scholar] [CrossRef]
  56. Zhao, Z.; Wang, Y.; Hou, Y. Residents’ Spatial Perceptions of Urban Gardens Based on Soundscape and Landscape Differences. Sustainability 2020, 12, 6809. [Google Scholar] [CrossRef]
  57. Pérez-Martínez, G.; Torija, A.J.; Ruiz, D.P. Soundscape assessment of a monumental place: A methodology based on the perception of dominant sounds. Landsc. Urban Plan 2018, 169, 12–21. [Google Scholar] [CrossRef]
  58. Zhang, D.; Zhang, M.; Liu, D.; Kang, J. Soundscape evaluation in Han Chinese Buddhist temples. Appl. Acoust. 2016, 111, 188–197. [Google Scholar] [CrossRef]
  59. Bruce, N.S.; Davies, W.J. The effects of expectation on the perception of soundscapes. Appl. Acoust. 2014, 85, 1–11. [Google Scholar] [CrossRef]
  60. Liu, K.; Behm, L. Landscape spatial pattern indices and soundscape perception in a multi-functional urban area, Germany. J. Environ. Eng. Landsc. 2014, 22, 208–218. [Google Scholar] [CrossRef]
  61. Bittencourt, L.; Barbosa, M.; Bisi, T.L.; Lailson-Brito, J.; Azevedo, A.F. Anthropogenic noise influences on marine soundscape variability across coastal areas. Mar. Pollut. Bull. 2020, 160, 111648. [Google Scholar] [CrossRef] [PubMed]
  62. Pelletier, C.; Weladji, R.B.; Lazure, L.; Paré, P. Zoo soundscape: Daily variation of low-to-high-frequency sounds. Zoo. Biol. 2020, 39, 374–381. [Google Scholar] [CrossRef] [PubMed]
  63. Li, L.; Li, Y.; Li, Z. Efficient missing data imputing for traffic flow by considering temporal and spatial dependence. Transp. Res. Part C 2013, 34, 108–120. [Google Scholar] [CrossRef]
Figure 1. Case study area: (a) location of the Three Square and Seven Alleys in Fuzhou, Fujian Province, China; (b) distribution of sampling points in different spatial types.
Buildings 14 01753 g001
Figure 2. Statistics on sample information on social, demographic, and behavioral indicators of respondents (N = 362).
Buildings 14 01753 g002
Figure 3. Flow chart for the use of spatial analysis indicators.
Buildings 14 01753 g003
Figure 4. Spatial distribution pattern of each physical acoustic indicator in different periods in the Three Square and Seven Alleys: (A1–A4) 8:30–10:30 Spatial distribution pattern of the physical acoustic indicators ( L Aeq L 10 L 90 L 10 L 90 ) in the study area; (B1–B4) 10:30–12:30 Spatial distribution pattern of the physical acoustic indicators ( L Aeq L 10 L 90 L 10 L 90 ) in the study area; (C1–C4) 12:30–14:30 Spatial distribution pattern of the physical acoustic indicators ( L Aeq L 10 L 90 L 10 L 90 ) in the study area; (D1–D4) 14:30–16:30 Spatial distribution pattern of the physical acoustic indicators ( L Aeq L 10 L 90 L 10 L 90 ) in the study area; (E1–E4) 16:30–18:30 Spatial distribution pattern of the physical acoustic indicators ( L Aeq L 10 L 90 L 10 L 90 ) in the study area; (F1–F4) 18:30–20:30 Spatial distribution pattern of the physical acoustic indicators ( L Aeq L 10 L 90 L 10 L 90 ) in the study area.
Buildings 14 01753 g004
Figure 5. Overall physical acoustic indicators of the Three Square and Seven Alleys time change: the bars line indicate differences in the volatility of the acoustic indicators ( L 10 L 90 ).
Buildings 14 01753 g005
Figure 6. Spatial distribution patterns of the six types of sound source harmony in the Three Square and Seven Alleys.
Buildings 14 01753 g006
Table 1. Typical sound source composition in the historic and cultural district.
Sound Source CategorySound Source Name (Number)
Biological soundBirdsong (BS)
Geophysical soundTree rustling (TR),
Water sounds (WS)
Human activity soundFootsteps (FS)
Adult talk (AT)
Playful children (PC)
Shops sound (SS)
Horn sound (HS)
Folk activity soundReligious music sound (RM)
Manual tapping (MT)
Specialized folk performance (SF)
Mechanical soundConstruction sound (CS)
Urban traffic sound (UT)
Machinery buzz (MB)
Musical soundBroadcast music sound (BM)
Street performer sound (SP)
Shop music sound (SM)
Table 2. Results of global spatial autocorrelation analysis of sound source harmony.
Source HarmonyMoran’s Iz-Scorep
Biological sound0.4363.941 **0.000
Geophysical sound0.0961.0830.279
Human activity sound0.4053.607 **0.000
Folk activity sound0.3443.244 **0.001
Mechanical sound0.2051.961 *0.050
Musical sound0.1391.4750.140
Note: * z < 1.96 or z > 1.96, ** z < 2.58 or z > 2.58.
Table 3. Results of local spatial autocorrelation analysis of sound source harmony.
Source HarmonyDistribution ModelSample Point
Biological soundHHL-L2, L-L3, L-Y4
LLl-f2, l-x1, l-x2, l-y1, l-y2, l-y3
HLL-L1
Geophysical soundHHR-X6
LLZ2
HLL-Y3
LHL-Y4
Human activity soundHHl-f2, l-x1, l-l1, l-y3
LLz1, z2, r-x1, r-x4, r-y1, r-y2,r-y3
Folk activity soundHHL-F2, L-Y2
LLz1, z2, r-x1, r-y1, r-y2
LHL-L1
Mechanical soundHHl-f1, l-l2, r-l3
LLR-X6
LHL-F2
Musical soundHHL-Y3
LLR-Y1
HLR-X1, R-Y2
LHR-Y1
Table 4. Spatial correlation coefficients between physical acoustic indicators and sound source harmony.
Source Harmony   L Aeq   L 10   L 90   L 10 L 90
Biological sound0.0610.0610.2980.236
Geophysical sound0.031−0.0210.4710.013
Human activity sound−0.043−0.221−0.683−0.659
Folk activity sound−0.118−0.228−0.554−0.545
Mechanical sound0.1490.147−0.426−0.291
Musical sound−0.319−0.434−0.527−0.607
Disclaimer/Publisher’s Note: The statements, opinions and data contained in all publications are solely those of the individual author(s) and contributor(s) and not of MDPI and/or the editor(s). MDPI and/or the editor(s) disclaim responsibility for any injury to people or property resulting from any ideas, methods, instructions or products referred to in the content.

