Article

Advanced Energy Performance Modelling: Case Study of an Engineering and Technology Precinct

1
School of Civil Engineering, The University of Sydney, Sydney, NSW 2006, Australia
2
School of Built Environment, The University of New South Wales, Sydney, NSW 2052, Australia
*
Author to whom correspondence should be addressed.
Buildings 2024, 14(6), 1774; https://doi.org/10.3390/buildings14061774
Submission received: 25 March 2024 / Revised: 23 April 2024 / Accepted: 7 May 2024 / Published: 12 June 2024
(This article belongs to the Special Issue Strategies for Building Energy Efficiency)

Abstract

:
The global demand for energy is significantly impacted by the consumption patterns within the building sector. As such, the importance of energy simulation and prediction is growing exponentially. This research leverages Building Information Modelling (BIM) methodologies, creating a synergy between traditional software methods and algorithm-driven approaches for comprehensive energy analysis. The study also proposes a method for monitoring select energy management factors, a step that could potentially pave the way for the integration of digital twins in energy management systems. The research is grounded in a case study of a newly constructed educational building in New South Wales, Australia. The digital physical model of the building was created using Autodesk Revit, a conventional software for BIM methodology. EnergyPlus, facilitated by OpenStudio, was employed for the traditional software-based energy analysis. The energy analysis output was then used to develop preliminary algorithm models using regression strategies in Python. In this regression analysis, the temperature and relative humidity of each energy unit were used as independent variables, with their energy consumption being the dependent variable. The sigmoid algorithm model, known for its accuracy and interpretability, was employed for advanced energy simulation. This was combined with sensor data for real-time energy prediction. A basic digital twin (DT) example was created to simulate the dynamic control of air conditioning and lighting, showcasing the adaptability and effectiveness of the system. The study also explores the potential of machine learning, specifically reinforcement learning, in optimizing energy management in response to environmental changes and usage conditions. Despite the current limitations, the study identifies potential future research directions. These include enhancing model accuracy and developing complex algorithms to boost energy efficiency and reduce costs.

1. Introduction

1.1. Background

Considering the global focus on sustainable development, the importance of research into energy efficiency and sustainability within the construction industry must be considered. The construction sector is pivotal in our energy landscape. Data reveals that the building sector alone is responsible for approximately one-third of the world’s total energy consumption [1]. Over the past few years, the design principles of low-carbon and green buildings have emerged as globally recognized solutions to energy challenges. These concepts have garnered significant attention worldwide, marking a shift towards more sustainable and energy-efficient architectural practices [2,3]. However, it is imperative to employ precise tools and sophisticated methodologies to translate these green building and low-carbon design concepts into reality. These instruments and methods are crucial in conducting a thorough analysis and accurately predicting a building’s energy performance. This involves understanding how a building consumes energy under different conditions and identifying opportunities for energy conservation and efficiency improvements [4,5]. The imperative to reduce energy consumption within the building sector intensifies as the global community shifts toward a sustainable, low-carbon energy framework [6]. Building Information Modeling (BIM) and Digital Twin (DT) technologies, which represent the avant-garde in digital methodologies, are increasingly prevalent in contemporary construction practices. These technologies are being combined with a myriad of software packages to facilitate the meticulous energy analysis and optimization of building designs [7,8]. The convergence of Building Information Modeling (BIM) and Digital Twin (DT) technologies is anticipated to persist as a predominant industry trend, offering essential support for building design and operational management [9,10].
The current application of DT technology is more conceptual than fully operational in the building sector. Building energy management primarily uses software for energy simulation analysis, which provides reasonably accurate forecasts but lacks real-time capabilities essential for DT. Consequently, a significant gap exists in achieving a fully functional DT that integrates real-time simulation with the Internet of Things, which is necessary for comprehensive and effective energy management. By creating a DT structure, a recent study seeks to address challenges experienced by smart greenhouses in urban environments [11]. The present study aims to optimize resource use and augment agricultural productivity through meticulous monitoring and regulating greenhouse gases, employing cutting-edge networking and machine learning technologies. After their findings, the researchers advocate for applying machine learning algorithms to predict environmental variables and allocate resources dynamically. Given the promising stage of Digital Twin (DT) technology in smart greenhouses, there needs to be more literature on its tangible applications. This study underscores a substantial lacuna in scholarly research about applying digital twin technology, especially regarding intelligent management systems for building environments.
The study contemplates a hybrid approach, intertwining conventional energy simulation analysis with modern algorithmic techniques, to scrutinize and enhance the energy efficiency of buildings with heightened precision. It employs regression equation analysis, leveraging collected data, to formulate a predictive model of a building’s energy consumption that boasts high accuracy [12]. This methodology, which melds established and avant-garde technological practices, offers a more efficacious, precise, and dependable modality for analyzing energy performance. It equips policymakers with the requisite analytical tools to assess a building’s energy efficiency with greater confidence and to inform their decision-making processes. Integrating Digital Twin (DT) technology with energy simulation and regression equation analysis heralds a novel trajectory for energy efficiency and sustainability research within the construction sector. This convergence facilitates the exploration of innovative strategies to enhance the energy performance of buildings, contributing to the advancement of the industry’s sustainable development goals [13].

1.2. Problem Definition

In the practical domain, the imperative to precisely forecast and optimize the energy consumption of buildings emerges as an exigent issue that commands immediate and rigorous attention [14], Moreover, a pronounced disparity exists between the theoretical constructs of Digital Twin (DT) technology and its pragmatic applications within the energy sector, delineating a significant chasm in its current utility and potential exploitation. Bâra and Oprea [15] attempted to develop and implement a DT model to enhance coordination within energy communities. Bâra and Oprea [15] conducted a thorough analysis that highlighted the necessity for additional research into integrating elements like social dynamics and economic frameworks into Digital Twins (DTs) to enhance the energy management system’s comprehensiveness. The study advocates for future research on the scalability and adaptability of DTs across diverse energy communities and settings. Furthermore, they recommend further studies to examine the enduring effects of DT deployment on achieving energy conservation and sustainability objectives.
The prevailing focus of research in the field centers on employing a range of software tools or machine learning algorithms for forecasting a building’s energy needs. Traditional software-centric approaches are straightforward and relatively precise, yet they must provide real-time results. Conversely, methods grounded in algorithms offer real-time capabilities, albeit with increased complexity in their operation. Nonetheless, the core of the ongoing debate remains firmly anchored on attaining highly accurate predictions of building energy consumption [14], Additionally, there is a notable gap in the seamless integration of these predictive techniques with actual Digital Twin (DT) applications.
Thus, engineers must continuously monitor environmental parameters within edifices, such as temperature and humidity levels. This data should be meticulously integrated with sophisticated predictive models to facilitate precise prognostications of future energy requirements. Only through this rigorous integration can one implement energy management initiatives that are effective and optimize energy utilization sustainably [16].

1.3. Research Objectives

This research focuses on the Engineering and Technology Precinct (J03) of the University of Sydney, located at the Camperdown/Darlington campus, as a representative case study. The J03 precinct functions as a central locus for student engagement, housing state-of-the-art research facilities and attracting a significant daily influx of students and academic personnel. Given its pivotal role within the university grounds and its environmentally conscious architectural design, the building was deemed an exemplary candidate for executing advanced combined energy simulation analysis. As depicted in Figure 1, Figure 2 and Figure 3, the primary architecture of the structure comprises a nine-storey educational space constructed in the year 2020.
This investigation is committed to addressing the lacuna in scrutinizing various data typologies to enhance Digital Twins (DTs) for optimal building energy management. It introduces an avant-garde paradigm that amalgamates time-honored modeling techniques with an underutilized regression model within the energy sector. The intent of this scholarly pursuit is not the construction of an exacting energy model or a pragmatic DT for an individual structure. Instead, it is an inquiry into a more efficacious methodology that capitalizes on the strengths inherent in both traditional and computational algorithmic approaches. Yet, an exigent challenge remains the paucity of granular and precise datasets, which poses a significant limitation to the expansion of this research frontier.

2. Literature Review

2.1. Building Energy Simulation

Securing energy sustainability emerges as a paramount objective within building energy simulations. These simulations apprehend the geometric intricacies of edifices and aggregate comprehensive datasets encompassing material specifications, cost analyses, and project timelines. Building Information Modeling (BIM) transcends traditional design paradigms by coalescing extensive datasets that detail material properties, financial estimations, scheduling frameworks, and elaborate geometric configurations of structures. The adoption and subsequent expansion of BIM applications yield considerable advancements in technical and organizational synergy and cross-platform interoperability, thus obviating the prevalent challenges that obstruct its efficacious integration [17]. The comprehensive suite of functionalities inherent in Building Information Modeling (BIM) empowers project participants to enhance the management of construction endeavors significantly. This is achieved through the strategic optimization of resource allocation, the systematic reduction of waste, and the meticulous orchestration of project schedules. As a corollary, construction ventures witness a marked elevation in productivity and an advancement in sustainable practices. The integration of BIM thus creates a formidable environment conducive to executing sophisticated simulation activities within architecture, engineering, and construction, leading to increased operational efficacy and accuracy.
In intensifying worldwide imperatives for energy sustainability, predictive models grounded in data analytics for building energy consumption have increasingly become a focal point of scholarly inquiry [18]. The endeavor of devising Digital Twin (DT) models for quantifying energy consumption across the entire lifecycle of buildings assumes a critical function in various applications. These include, but are not limited to, the management of energy within building infrastructures and establishing baselines for comparative analysis [19]. Building energy simulation represents a confluence of multiple scientific disciplines, serving to prognosticate and dissect the energy utilization, ecological performance, and whole-life costing of edifices through sophisticated computer-aided models. This integrative scientific practice delivers pivotal support to the realms of architectural design and the operational stewardship of building projects [20]. This technological innovation not only aids in articulating more judicious decisions during the design phase by predicting building energy needs and elucidating the potential dividends of energy-saving interventions but also serves as a critical apparatus in codifying and actualizing more exacting energy efficiency criteria [21].
The assessment of a building’s energy performance is a nuanced and dynamic field characterized by the continuous advancement of energy system modeling. Amid various determinants, including structural properties, mechanical and electrical systems, climatic variables, occupant interactions, and societal ramifications, the characterization of energy performance in buildings manifests with considerable complexity. Hence, deploying precision-oriented prognostic tools for energy consumption estimation is critical and holds substantial weight within the domain of energy analysis [22]. The contemporary epoch is characterized by an imperative transition towards an energy paradigm that is both sustainable and characterized by low carbon emissions. This transformative juncture necessitates articulating and exploring varied prospective energy pathways, underpinning the decision-making apparatus at disparate magnitudes of governance. These deliberative processes, ranging from transnational energy policy development to micro-level energy systems planning, intersect with the proliferating technological, economic, and socio-economic intricacies. Inextricably linked to this is the evolution of energy system models, which has become increasingly pivotal in scenario planning’s burgeoning role since the 20th century. This evolution empowers analysts to penetrate the depths of an ever-more complex energy sector, enabling them to hypothesize and construct sophisticated scenarios that envisage its potential future developments [23].
The discipline of building energy analysis has been underway for over thirty years, representing a substantial track record in this area of research and application [24]. Moreover, it has consistently enhanced the precision of its predictive capabilities over time. The dominant research paradigm in the field has evolved to prioritize the integration of Building Information Modeling (BIM) as an essential instrument in conducting energy analyses. Concurrently, there is a marked trend towards leveraging machine learning techniques to refine and increase the precision of energy consumption forecasts [25]. In pursuit of advancing the exactitude of these predictive models, researchers are increasingly integrating exhaustive assessments of environmental parameters, thereby enriching the analytical robustness of their scientific inquiries [26], researchers are progressively applying Geographic Information Systems (GIS) to emulate the environmental context of adjacent building aggregations, thereby achieving a more comprehensive and nuanced model of the interplay between built environments [27], and combine hybrid algorithms with the capacity to train using extended data sequences [28]. These techniques have demonstrated their effectiveness by boosting the accuracy of predictions to beyond 75%. Nonetheless, the intricate nature of real-world dynamics means that attaining perfect prediction accuracy, or 100%, remains an elusive target.
Currently, two principal approaches are employed for energy analysis: the first involves using specialized energy analysis software, while the second leverages machine learning algorithms, with some strategies integrating both methodologies for enhanced effectiveness [29]. Currently, in the field of energy analysis, two primary methodologies prevail. The first pertains to the deployment of specialized software tools, such as EnergyPlus and Autodesk Insight, which have been extensively employed and cited in many scholarly articles and empirical studies in recent years. These software applications are renowned for their comprehensive simulation capabilities and are integral to the quantitative analysis of energy consumption and modeling within built environments. The second methodology involves the application of sophisticated machine learning algorithms, which are increasingly recognized for their predictive power and adaptability in handling large datasets and complex variables inherent in energy consumption patterns. Furthermore, there is a growing trend towards integrating these two methodologies, aiming to harness the strengths of both computational simulation and machine learning to yield more accurate, reliable, and comprehensive energy analyses [23]. In building energy analysis, an array of software instruments, each with unique attributes and scopes of application, is employed with the common objective of deciphering and enhancing the energy efficiency of buildings. These instruments are distinguished by their traits, functions, and comparative merits in addressing particular analytical challenges. Scholarly metrics reveal that among these tools, EnergyPlus stands out as the preeminent choice within the academic community, celebrated for its extensive capabilities that cover a broad spectrum of energy consumption evaluation and optimization scenarios [29]. The domain of energy analysis software encompasses a diverse portfolio of tools, each engineered with distinct functionalities and intended applications yet uniformly aimed at elucidating and refining the energy performance of building structures. Among these, EnergyPlus emerges as the quintessential instrument, and its application is prevalent in scholarly discourse. This software is adept at navigating various analytical tasks, from fundamental energy consumption assessments to elaborate thermal performance analyses and comprehensive environmental modelling. Its robust simulation capabilities enable a holistic examination of building energy dynamics, facilitating a deeper understanding and optimization of energy systems. Concurrently, in machine learning, scholarly pursuits coalesce around a cadre of principal research themes integral to energy systems management. These themes encompass the prognostication of energy demand, the amplification of energy conservation measures, the meticulous calibration and validation of energy models, and the sophisticated orchestration of energy system operations. The thrust of these research endeavours is the refinement of predictive accuracy, the elevation of efficiency standards, the enhancement of model reliability, and the optimization of energy distribution and consumption, all of which are critical to advancing sustainable energy practices. The contemporary research milieu in building energy consumption is increasingly concentrated on constructing and enhancing predictive models. These models are designed to forecast various aspects of energy use, such as ‘short-term energy consumption’, ‘thermal and cooling load prediction’, and ‘building energy prediction’. Such models are not merely academic exercises but serve as critical tools for energy management professionals, providing them with the foresight necessary to implement energy-saving measures and to plan for future energy requirements with greater precision. A cadre of sophisticated algorithms has been widely adopted within this research domain due to their demonstrated success in prediction accuracy and their adaptability to complex datasets. Notably, the Random Forest (RF) algorithm, with its ensemble of decision trees, each influenced by the values drawn from an independently sampled random vector and sharing this vector across the forest, has been extensively validated in empirical studies. Concurrently, Support Vector Machines (SVM) excel in finding the optimal hyperplane for classification and regression tasks; Artificial et al. (ANN), known for their ability to model non-linear relationships; and Deep Neural Networks (DNN), which are capable of modelling highly intricate patterns through deep architectures, are all algorithms that have been rigorously applied and studied within the energy prediction research community. Each algorithm brings a distinctive approach to the modelling process, addressing the stochastic nature of energy consumption and providing a robust predictive framework that underpins decision-making in energy management [30].
The support-vector network is a computational learning apparatus tailored for binary classification endeavors. Its core operational principle involves transforming input vectors into a high-dimensional feature space through nonlinear processes, facilitating the delineation of decision boundaries for classification [31]. Artificial neural networks (ANNs), which originated in the 1980s at the intersection of cognitive science and computer science, delve into diverse learning methodologies, encompassing inductive and deductive reasoning approaches [32]. Deep neural networks (DNNs) comprise several layers containing non-linear computational nodes, often called neurons, meticulously architected to distill, and amplify intricate and distinct features from datasets. Through their hierarchical structure, these networks progressively build up abstract representations that facilitate sophisticated data analysis and pattern recognition tasks [33]. These algorithms possess the ability to forecast energy demands ranging from broad to specific needs, as well as to anticipate related environmental impact indicators, including electricity costs and carbon emissions [29]. Energy analysis techniques can be applied across various building categories, encompassing residential dwellings, office complexes, commercial spaces, educational facilities, and hospitality venues. Advancements in building energy simulation are marked by improvements in depth and precision, achieved through the fusion of conventional software instruments with cutting-edge machine learning strategies to assess and elevate energy efficiency.

2.2. Utilizing Regression Models for Enhanced Energy Simulation

This analysis aims to evaluate and predict a building’s energy usage throughout its lifecycle by employing energy simulation techniques. It also serves to refine building design and operations to achieve energy efficiency and sustainability targets. The importance of data-driven models in forecasting building energy use is well recognized. However, there is a prevalent issue with the misapplication of these models under unsuitable circumstances. For example, certain studies construct models using data-driven methodologies with limited datasets, which can jeopardize the model’s precision and dependability [34]. Advanced methods like multi-curve regression are instrumental in finely simulating the energy dynamics of buildings, presenting a wide array of options to tailor to the unique energy demands and architectural nuances of different structures [21,23]. These developments signify groundbreaking strides and forward momentum in cultivating a built environment that is more sustainable and ecologically benign.
For instance, employing models derived from multivariate linear regression equations enhances the capacity to forecast energy consumption in medium-sized commercial buildings, often presenting more intricate and diverse geometric configurations [35]. These models are highly effective at predicting thermal and cooling loads in structures with complex shapes. They are versatile and suitable for various building types, such as large and small office spaces, hotels, and residential buildings, whether high-rise or low-rise [35]. Furthermore, the straightforward nature of multiple linear regression techniques offers an alternative method for evaluating building energy balances. This approach can streamline the initial phases of energy assessment and tackle intricate challenges associated with building energy equilibriums [36]. Adopting this methodology has set a pragmatic benchmark that is crucial to building energy efficiency standards and regulations [36]. Nevertheless, conventional regression approaches, such as linear regression focusing on Energy Use Intensity (EUI) and similar energy metrics, encounter certain constraints. These techniques typically rely on simplified assumptions regarding the internal building environment and external weather conditions, leading to potential limitations in precisely capturing actual building operations’ dynamic and complex characteristics [37].

2.3. Application of Building Information Modeling (BIM) in Energy Simulation

Building Information Modeling, or BIM, represents an advanced 3D digital technology that captures extensive details about the physical and functional characteristics of a building. It encompasses data on design, the composition of materials, financial estimates, and timelines. The richness of this information facilitates the execution of simulations and analytical procedures, which are crucial for the mastery of architecture, engineering, and construction endeavors [18]. BIM’s in-depth and diverse dataset enables more accurate forecasting of a building’s energy efficiency. Moreover, using digital twins and virtual counterparts to physical structures, facility managers can observe and enhance the energy consumption of buildings in a live setting.
The advent of the Third Industrial Revolution, characterized by the global embrace of computers and the internet, laid the foundation for groundbreaking advancements in the management of building energy systems [38]. Building Energy Modeling (BEM) ‘s popularity has surged due to utilizing energy simulation software, which has proven highly effective in boosting energy savings [39]. Digital Twin technology has recently concentrated on integrating sensors and BIM software to improve the visualization and management of energy use within buildings [18]. Digital twins can model buildings virtually and scrutinize their energy behaviors, pinpointing influential factors on efficiency. For instance, DT technology has the potential to refine the operation of lighting and HVAC systems to curtail electrical consumption and diminish CO2 emissions. Additionally, it can enhance the selection of building façade materials and the architectural design of windows to boost insulation and ventilation, which contributes to the reduction of energy use and lessens ecological footprints. Building Information Modeling (BIM) has yet to be fully exploited in some respects, but stakeholders must merge appropriate practices with Life Cycle Assessment (LCA) to fully realize its advantages [18]. BIM is instrumental in gauging a building’s energy dynamics, considering aspects like geometric configurations, climatic influences, and material properties that affect energy consumption and retention. By providing granular data at the outset of building ventures, BIM applications allow for early-stage performance comparisons and assessments of limitations before construction. This equips project participants with the knowledge to make judicious choices and realize the construction of buildings optimized for energy efficiency. For the seamless transition of information, it is possible to create hybrid methods that employ the right tools and extensions, aiming to reduce data erosion and accomplish energy conservation targets during the later phases of a project [40].
The interoperability between Building Information Modeling (BIM) and Building Energy Simulation (BES) tools facilitates a seamless exchange of geometric and semantic data during the extraction of models from BIM. However, integrating current BES tools with BIM often encounters challenges such as transferring inaccurate geometric information and fragmented dissemination of semantic data. Recognizing and addressing these issues is crucial to enhancing future interoperability on both geometric and semantic fronts. BIM exerts a substantial influence on the energy efficiency of buildings across all phases of their lifecycle, encompassing design, operation, decommissioning, and retrofitting activities. This influence highlights BIM’s pivotal role in the pursuit of optimal building energy performance [41]. The convergence of Building Information Modeling (BIM) with the predictive capabilities of regression analysis, alongside the real-time monitoring and optimization offered by digital twins, constitutes a robust and comprehensive method for building energy simulation. This fusion of advanced technologies drives innovation and steers the construction industry toward a more sustainable and eco-conscious future.

2.4. Former Case Studies

This section showcases two pivotal case studies that significantly contribute to the research and have served as notable wellsprings of inspiration. These studies exemplify a transition from conventional, software-based energy analysis to more sophisticated, algorithmic-driven approaches to energy simulation.

2.4.1. Abercrombie Business School (ABS)

This case study focuses on the Abercrombie building at the University of Sydney, utilizing Building Information Modeling (BIM) data encapsulated in gbXML format to perform regression analysis. The objective is to ascertain the correlation between diverse building design elements and Energy Use Intensity (EUI) [42]. In this investigation, Autodesk Green Building Studio (GBS) was leveraged to conduct energy simulations for various prototype models, including L-shaped, U-shaped, H-shaped, diamond-shaped, and rectangular configurations. Monte Carlo simulations were utilized to validate the models, divided into two categories: unit linear models and multivariate linear models. Each architectural prototype was subjected to 10,000 linear simulations within R Studio. Design variables were systematically identified by GBS through its building performance simulation system, covering aspects such as the Window-to-Wall Ratio (WWR), wall and roof construction, openings, efficiency of lighting and power outlets, HVAC systems, internal loads, envelope attributes, building morphology, daylight harnessing, occupancy trends, and orientation.
The investigation pinpointed several challenges associated with applying regression techniques in the parametric analysis of building energy efficiency. These challenges stem from the models’ intrinsic uncertainty and multifaceted nature, compounded by the limited scope of parameters examined. Nonetheless, the prototype modeling strategy yielded promising results, indicating a capacity for deeper investigation in subsequent research endeavors.

2.4.2. Tyree Building (UNSW)

This study delves into the energy performance of the Tyree Building at the University of New South Wales in Australia. This facility has earned a 6 Green Star rating for its sustainable design [43]. This research mirrors the approach taken with the Abercrombie building case, scrutinizing the impact of internal building factors on energy usage. The analysis employed Autodesk Insight 360 and Green Building Studio (GBS) for energy simulations across six room geometries. The simulation outputs were then extracted as CSV files for further examination. The statistical evaluation of the data was executed using MathWorks MATLAB (R2021a).
The investigation found that the direct data transfer from Revit to Green Building Studio (GBS) is the most expedient and user-friendly approach. Alternative BIM utilities necessitate supplementary data or manual entry, rendering them less accessible. Preliminary findings were gleaned using streamlined research techniques, which indicated that model inaccuracies surpassed tolerable thresholds. Out of thirteen interior design variables identified for the study, only five were assessed, suggesting the possibility of partial conclusions. A more exhaustive and meticulous inquiry is warranted to elucidate the connection between building variables and energy efficiency fully.

2.4.3. Summary of Case Studies

The two research initiatives mark a significant transition from the conventional practice of software-driven energy simulations to a more advanced, algorithm-centric approach to energy modeling. The insights harvested from these algorithmic simulations hold the potential to catalyze the development of groundbreaking applications, such as Digital Twin (DT) technology, wherein regression analysis becomes an instrumental mechanism for technological progression.
The studies presented demonstrate certain constraints, primarily focusing on specific energy aspects of the buildings, which may only partially reflect the overall energy dynamics. Each study investigates the link between architectural design features and Energy Use Intensity (EUI), employing a Green Building Studio (GBS) for simulation. To enhance the reliability and precision of future research, it would be advantageous to utilize more robust energy analysis tools, such as EnergyPlus. In the instance of the Tyree building, linear regression analysis was deemed inadequate for a comprehensive energy analysis, having a propensity for considerable errors. Subsequent investigations should consider adopting alternative regression techniques to heighten the precision of the findings.

2.5. Elevating Building Energy Management and Optimization Systems via the Implementation of Digital Twin (DT) Technology

Monitoring and managing building systems depend on in-person inspections, alongside dedicated software and hardware, to effectively gather, store, and analyze data [24]. Building Information Modeling (BIM) has provided a measure of visibility into the intricacies of building systems. Nonetheless, its capabilities could be improved regarding comprehensive building lifecycle management and facilitating fluid data exchange. Moreover, BIM needs provisions for interactive virtual interfaces with tangible assets, rendering it inadequate to provide real-time performance feedback or effectively inform operational decisions [44]. Digital twin technology has been under exploration for nearly a decade and presents a viable solution to this challenge, offering sophisticated systems that mirror physical entities [25]. Digital twin technology facilitates a seamless fusion of the physical and virtual realms, heralding a new integration era. This convergence furnishes the construction sector with actionable, real-time energy management strategies, transcending theoretical forecasts. Furthermore, it signifies an evolution of digital twins, transforming from a mere transition of tangible assets into the digital sphere to empowering them with autonomous self-regulation features [45]. The advent of digital twin technology intertwines computational models with actual systems, enabling a dynamic two-way flow of data between tangible assets and their virtual counterparts. By harnessing this data and continuous feedback, digital twins are endowed with the capacity for self-learning, reasoning, and the development of independent operations. They excel at real-time monitoring, early detection of complications, underpinning maintenance approaches, forecasting imminent issues, and providing all-encompassing management across the lifecycle of products or systems. Digital twins are particularly advantageous in building energy analysis, offering substantial contributions throughout all stages, from initial design to ultimate decommissioning [24].
Leveraging bi-directional data flows, digital twins are not merely digital facsimiles but dynamic entities capable of self-improvement, deduction, and independent operation. These capabilities equip them to conduct vigilant real-time surveillance, preemptively unearth discrepancies, buttress maintenance protocols, foresee potential pitfalls, and orchestrate thorough lifecycle stewardship of products or systems. Their impact on building energy analysis is profound, influencing the entire spectrum from the drawing board to the dismantling process [24]. Paulius et al. [46] employed real-time monitoring with Building Information Modeling (BIM) to assess buildings’ energy performance during operations. This approach entailed persistent surveillance of the building’s functional parameters, methodically amassing intricate operational data throughout the diverse seasonal cycles within a year. The collected real-time operational insights were then synergized with the static data derived from the BIM model to render a more nuanced and precise portrayal of the building’s energy consumption. They introduced an array of seasonal operational metrics that meticulously outline the energy utilization across different building systems—spanning lighting, electrical appliances, heating, and cooling—classified by the number of occupants, duration of occupancy, spatial area, and volume. Integrating real-time operational data with a Building Information Modeling (BIM) framework, like the approach of Paulius et al. [46], yielded an enriched suite of metrics. This fusion facilitated a more granular and targeted analysis of the building’s energy performance, offering greater depth and specificity insights.
Seo et al. [47] delved deeper with a comprehensive investigation employing digital twin (DT) methodologies to conceive and evaluate energy-efficient lighting solutions for university classrooms. They executed a digital twin-centric evaluation model through an extensive case study at a South Korean university in Daegu. By examining data from 55 classrooms, they extracted valuable conclusions regarding lighting energy conservation. Their outcomes affirmed that DT-informed lighting control strategies surpassed the efficacy of conventional approaches. The investigative techniques these researchers apply mark significant strides in building energy simulation under the DT paradigm, encompassing the establishment of analytical frameworks, the strategic design of building operations, and the application of these frameworks to curtail building energy usage.
The primary lacuna in current research emerges from the need to synthesize the real-time monitoring and BIM integration techniques of Paulius et al. [46] with the energy strategy design and implementation methodologies based on digital twins, as demonstrated by Seo et al. [47]. Although these approaches have individually contributed substantial progress to building energy analysis, their amalgamation holds the potential to forge an entirely novel research frontier.
The work of Francisco et al. [48] epitomizes the research that embodies this innovative concept. Their study accentuates the immense potential that lies in the confluence of real-time monitoring, Building Information Modeling (BIM), and digital twin technologies. By leveraging this integrated approach, they underscore the capability to forge more encompassing and efficacious strategies for energy management in buildings.
The research team, led by [48], settled on the Georgia Institute of Technology campus as their central investigative locus, conducting an exhaustive electricity usage analysis at the building level for 38 edifices. The data acquisition spanned from 26 September 2015, to 25 September 2016, meticulously recording the average power consumption for each building at quarter-hour intervals. Utilizing this granular data trove, Francisco and her colleagues partitioned the information into six distinct temporal categories, encompassing active and dormant phases during the academic year, various summer stages, and the aggregate annual period. This detailed temporal disaggregation enabled a thorough examination of energy use across different times. They crafted a regression-based analytical model to deduce efficiency scores, clearly delineating dependent and independent variables within the benchmarking model to facilitate precise energy efficiency comparisons among the assorted buildings. The independent variables shed light on the disparate energy usage behaviours of the buildings, aiding in the normalization of energy consumption. After normalizing the data, each structure’s Energy Use Intensity (EUI) was calibrated to a scale from 0 to 1, representing a quantified efficiency rating. This rating system was instrumental in refining management strategies and their effective deployment throughout the campus buildings. The foundation of strategy formulation in their study was predicated on historical data, selected for its relevance to the unique attributes of their research focus. The advancement of building energy analysis has transitioned from dependence on conventional predictive models to the embrace of real-time monitoring and predictive analytics, bolstered by the adoption of Building Information Modeling (BIM) and Digital Twin (DT) technologies. Concurrently, DT technology offers the architectural industry a fresh vantage point, guaranteeing that energy solutions extend beyond theoretical projections to encompass real-time, implementable tactics.
The research conducted by Paulius et al. and Seo et al. [46,47] highlights the practical uses of these methodologies. Specifically, Paulius et al. concentrate on merging real-time monitoring with BIM, while Seo et al. investigate the application of DT technology within the development and execution of energy strategies. Researchers are given a deeper and more nuanced comprehension of building energy consumption by leveraging real-time monitoring data with BIM models. This comprehensive energy profile paves the way for formulating energy conservation strategies that are both more precise and specifically tailored. The instantaneous feedback offered by the digital twin’s real-time monitoring allows immediate strategy refinements tailored to the actual operational conditions, amplifying the energy conservation benefits. Moreover, the ongoing data collection inherent in this synergistic approach progressively refines building energy analysis models and conservation methodologies. Therefore, investigating the synergy of these techniques has the potential to fill the current research void, offering substantial theoretical and empirical backing for optimizing energy efficiency in buildings.
This research was initiated to bridge the noted knowledge gap and explore the application of Digital Twin (DT) technology in building energy management while introducing innovative perspectives and methodologies to the discipline. The integration of DT technology with data-centric techniques is posited to facilitate buildings in achieving more thorough, effective, and smart energy management solutions. As highlighted in the concluding section, the strategic use of real-time monitoring data, BIM models, and DT technology equips researchers with a more detailed and precise depiction of building energy usage. Strategies derived from this all-encompassing energy profile are expected to be inherently accurate and precisely targeted. Moreover, the real-time feedback capabilities of digital twins offer immediate insights for deploying strategies, permitting live adjustments in response to actual operational conditions.

3. Methodology

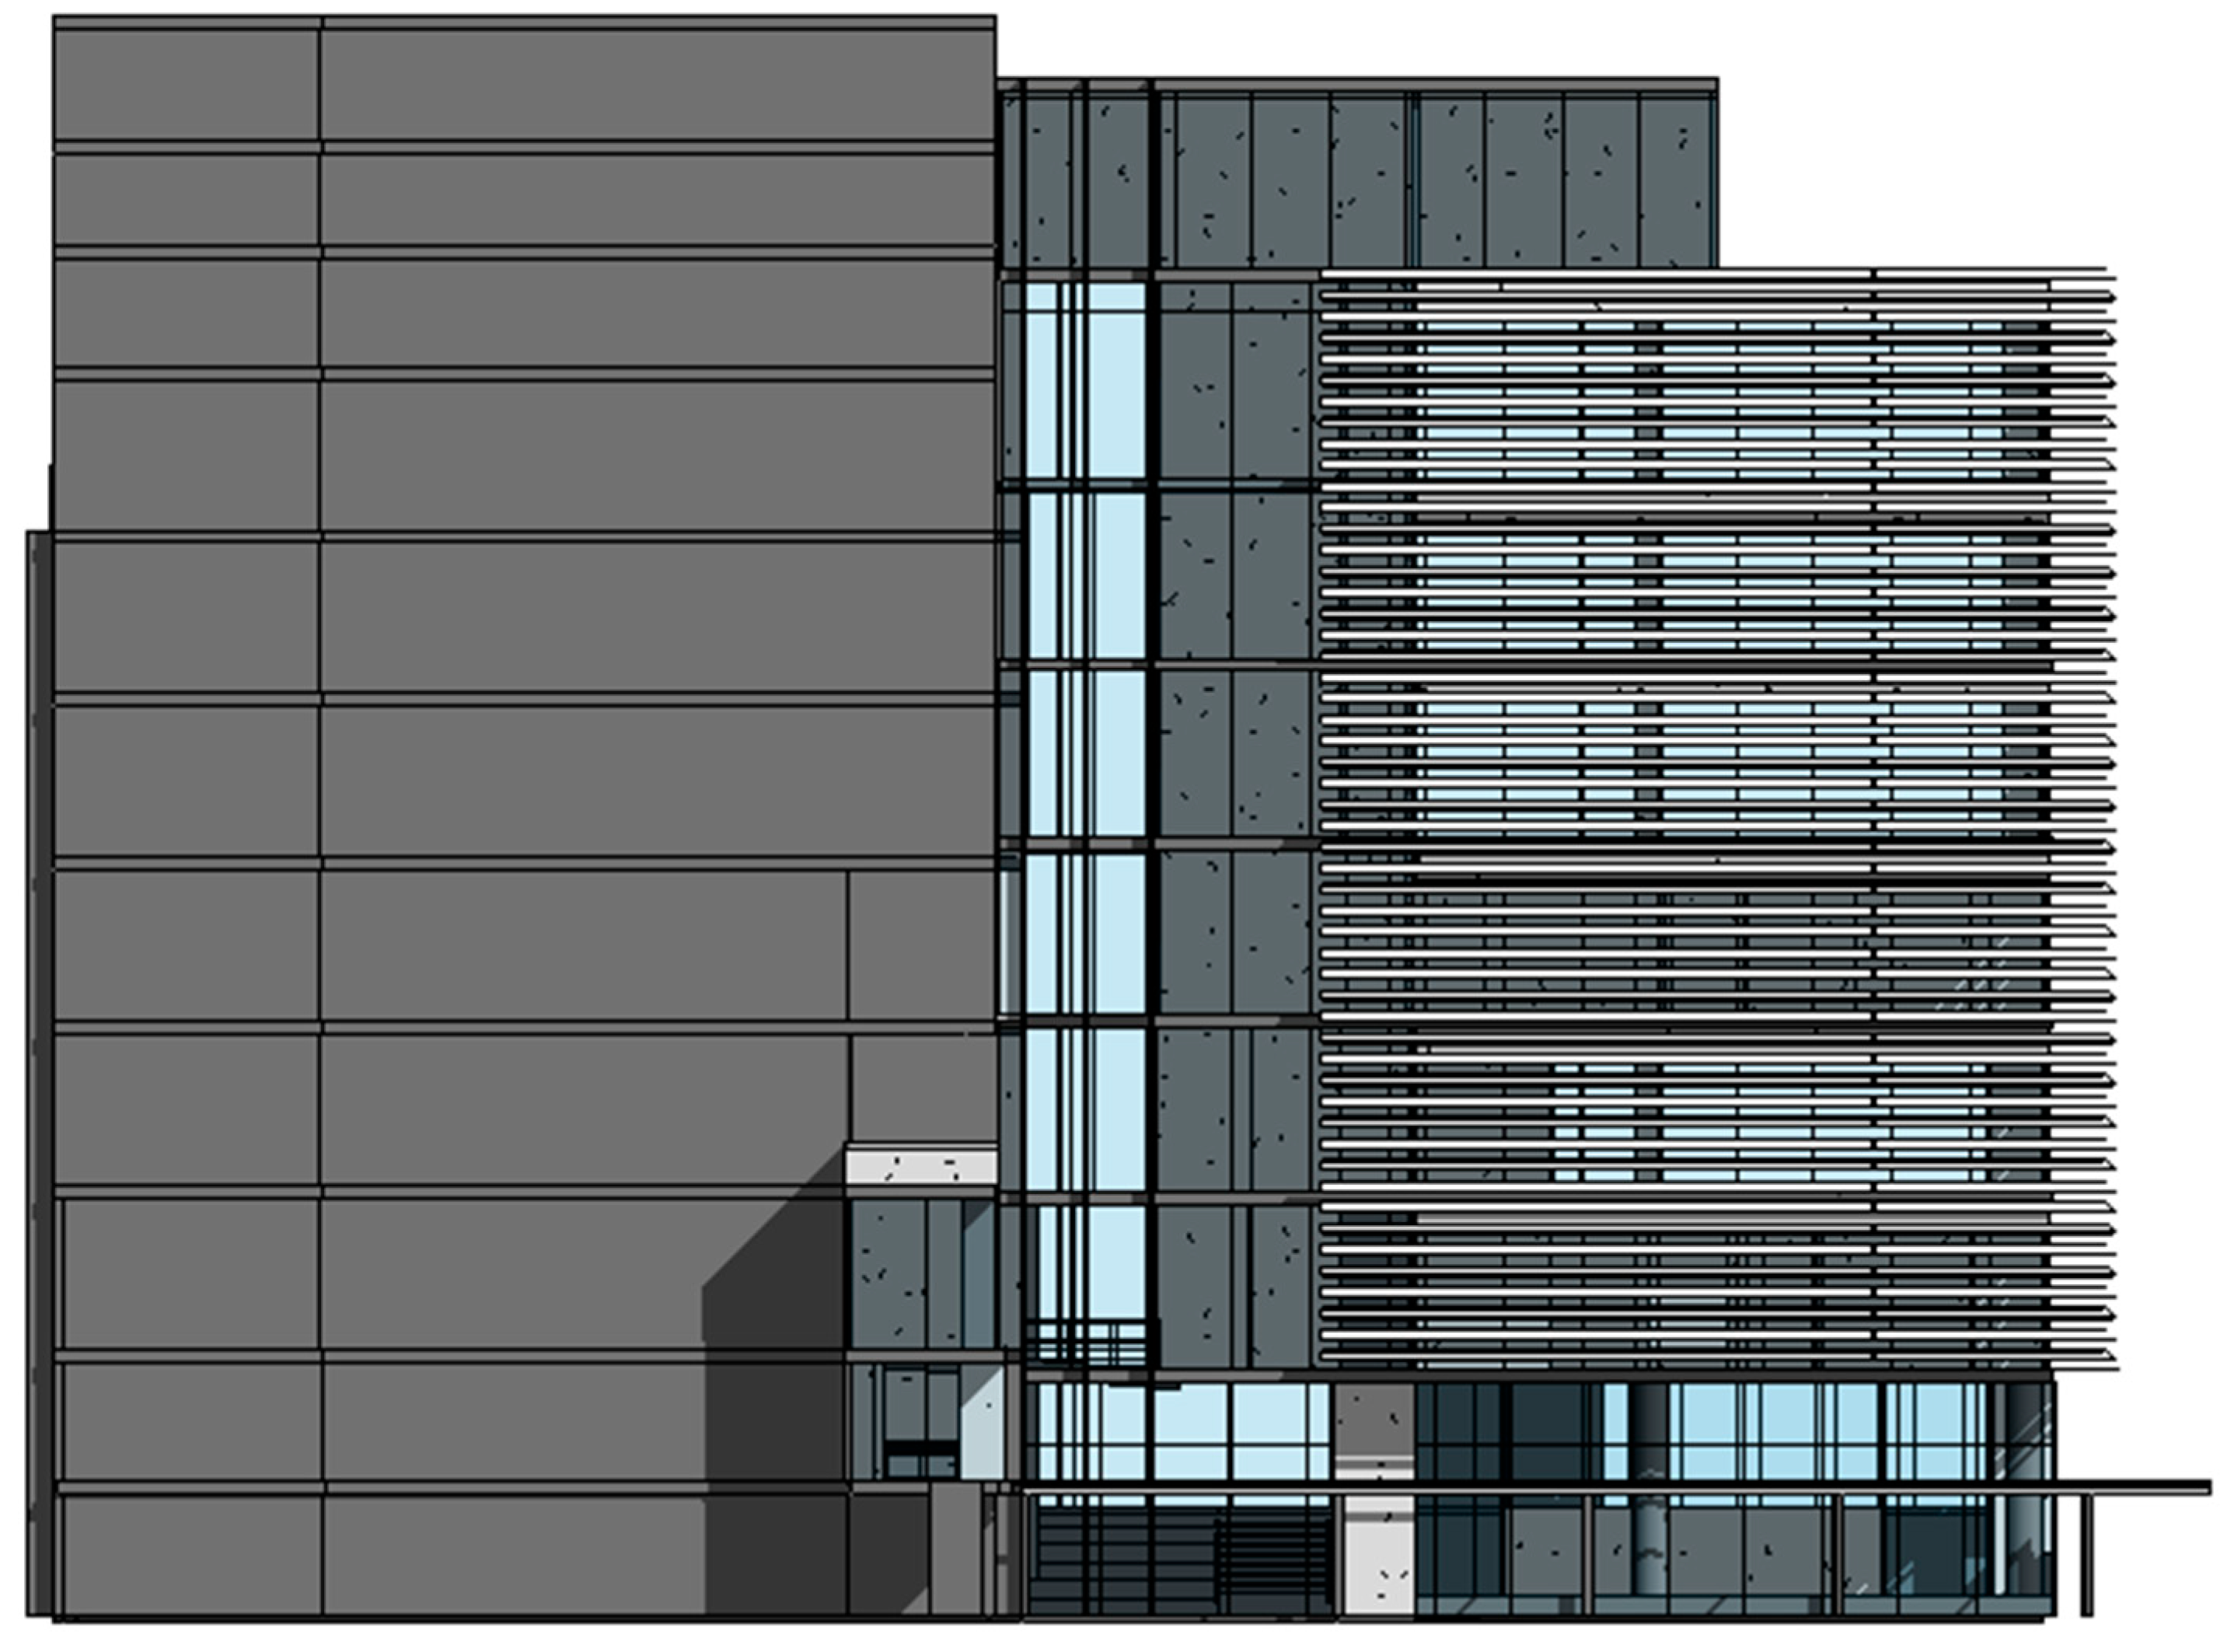
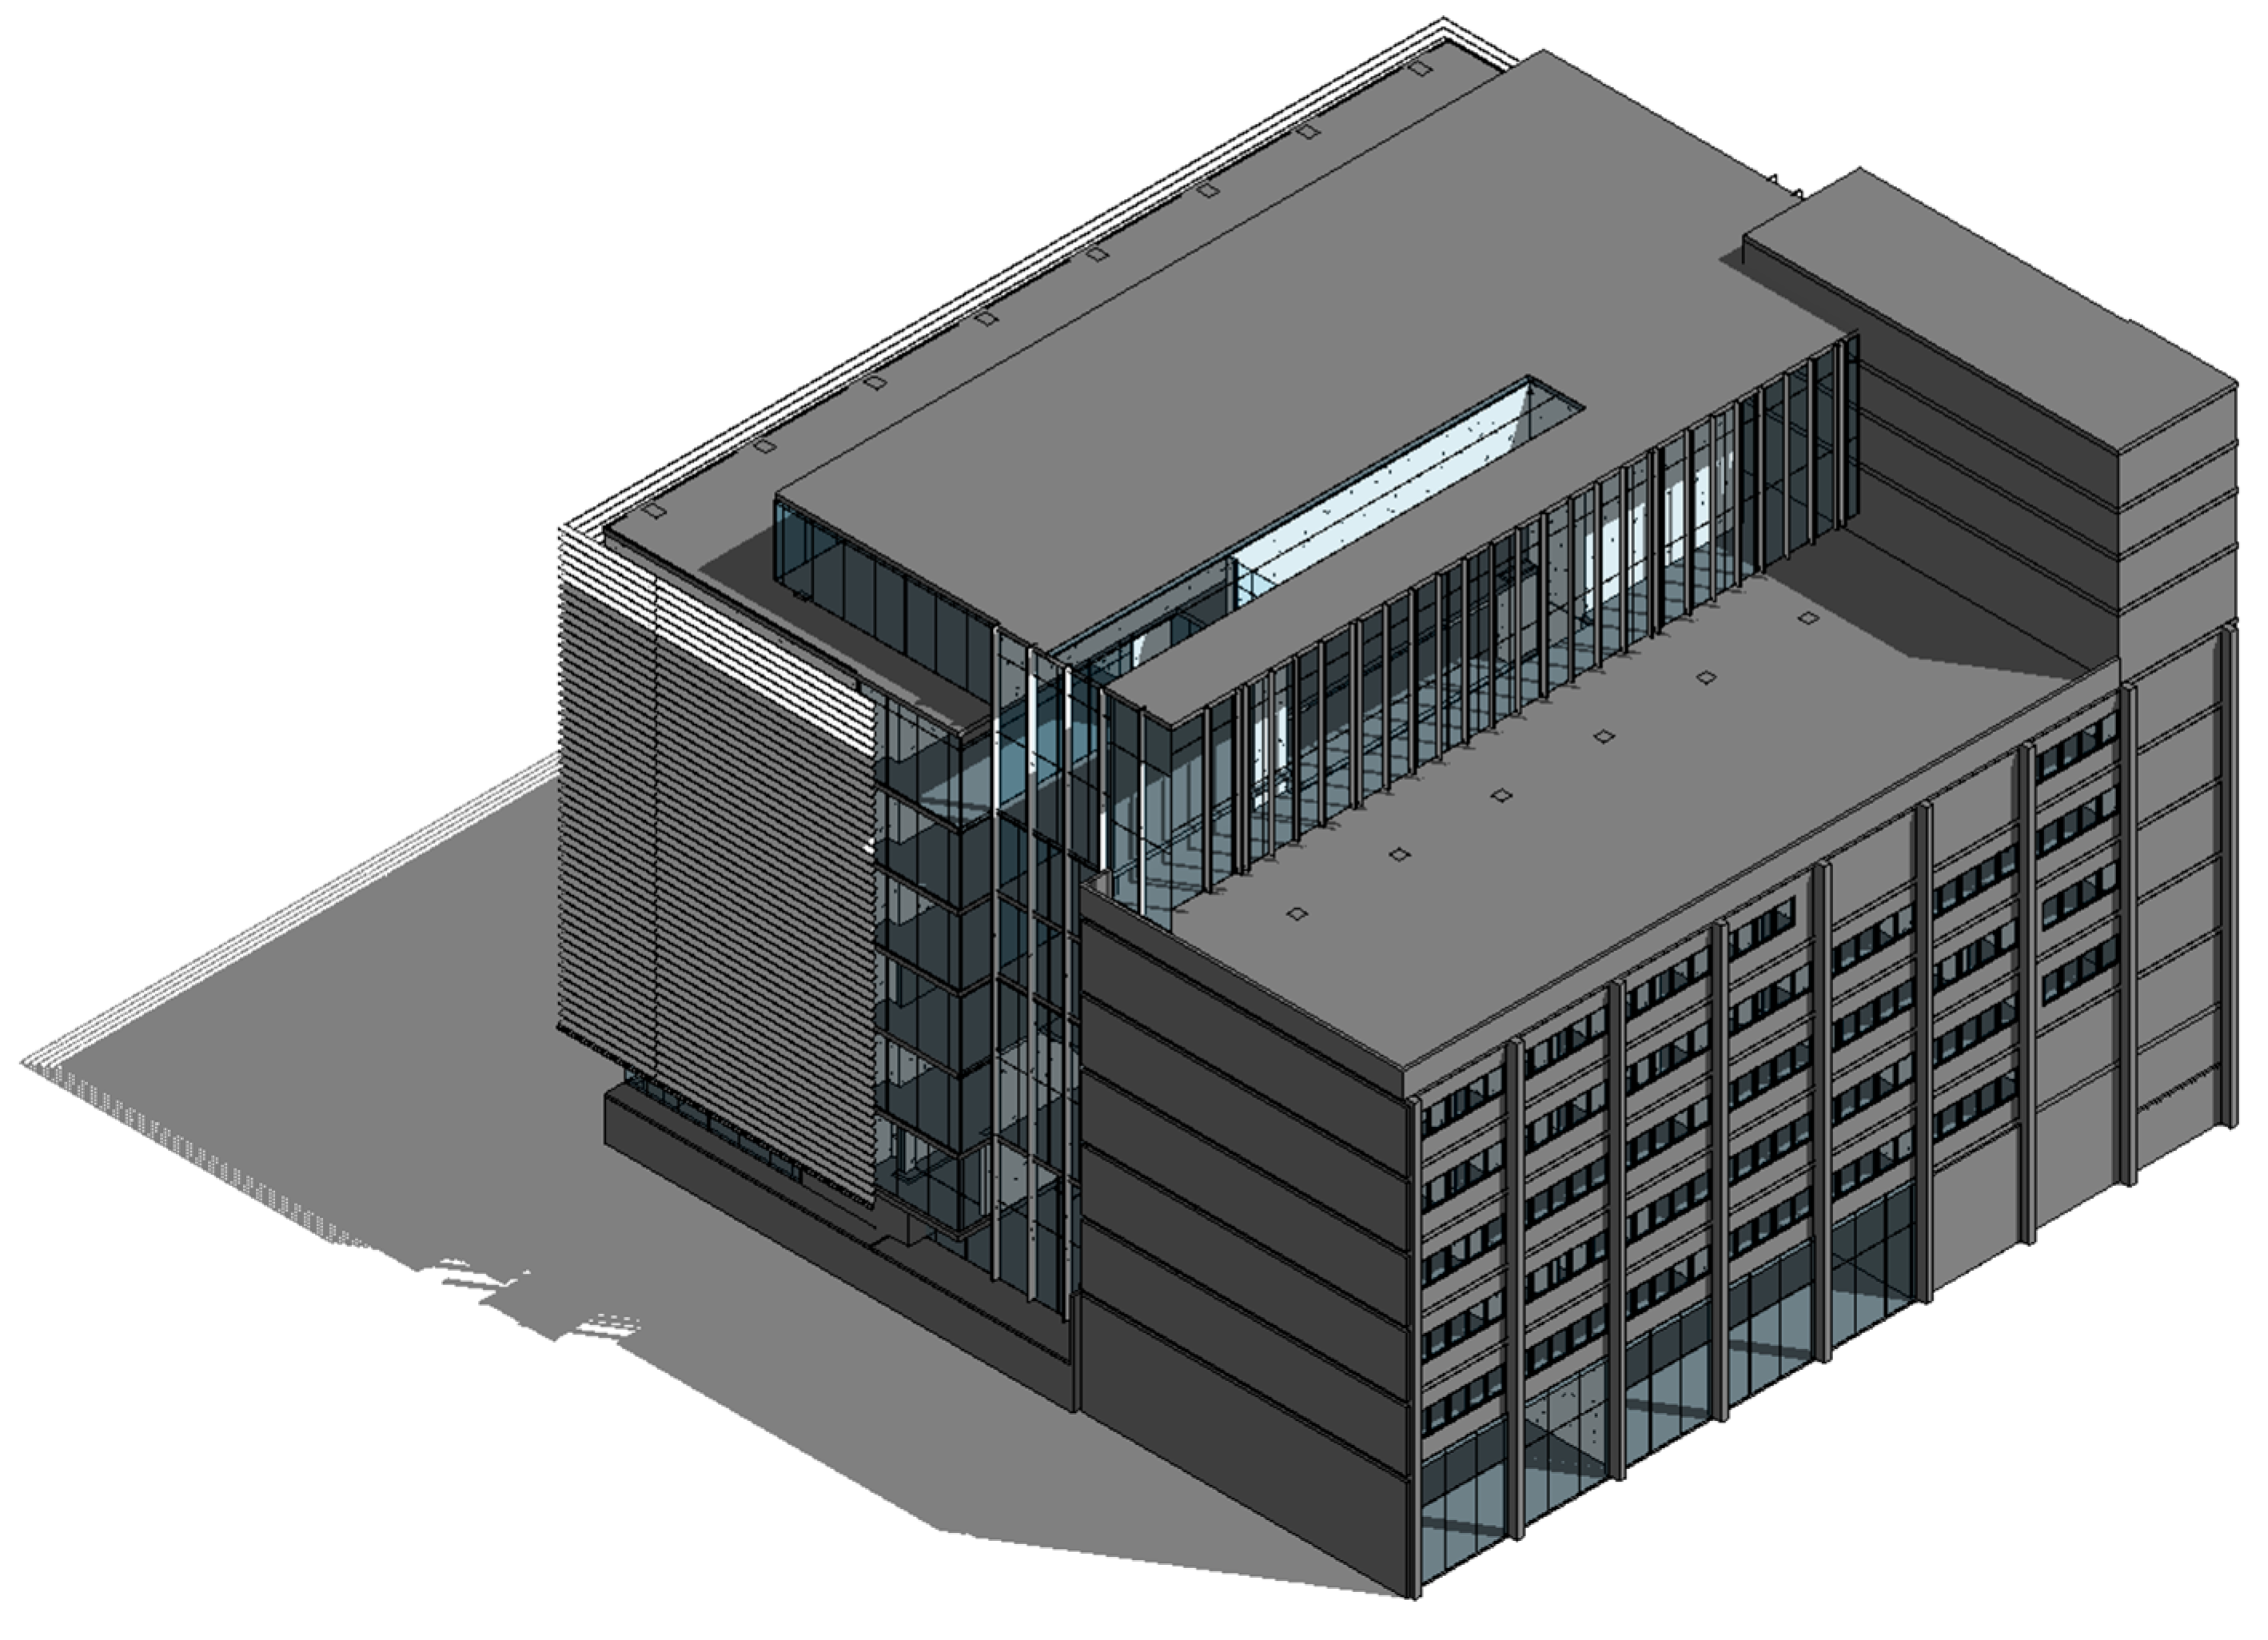
3.1. BIM-Based Modelling

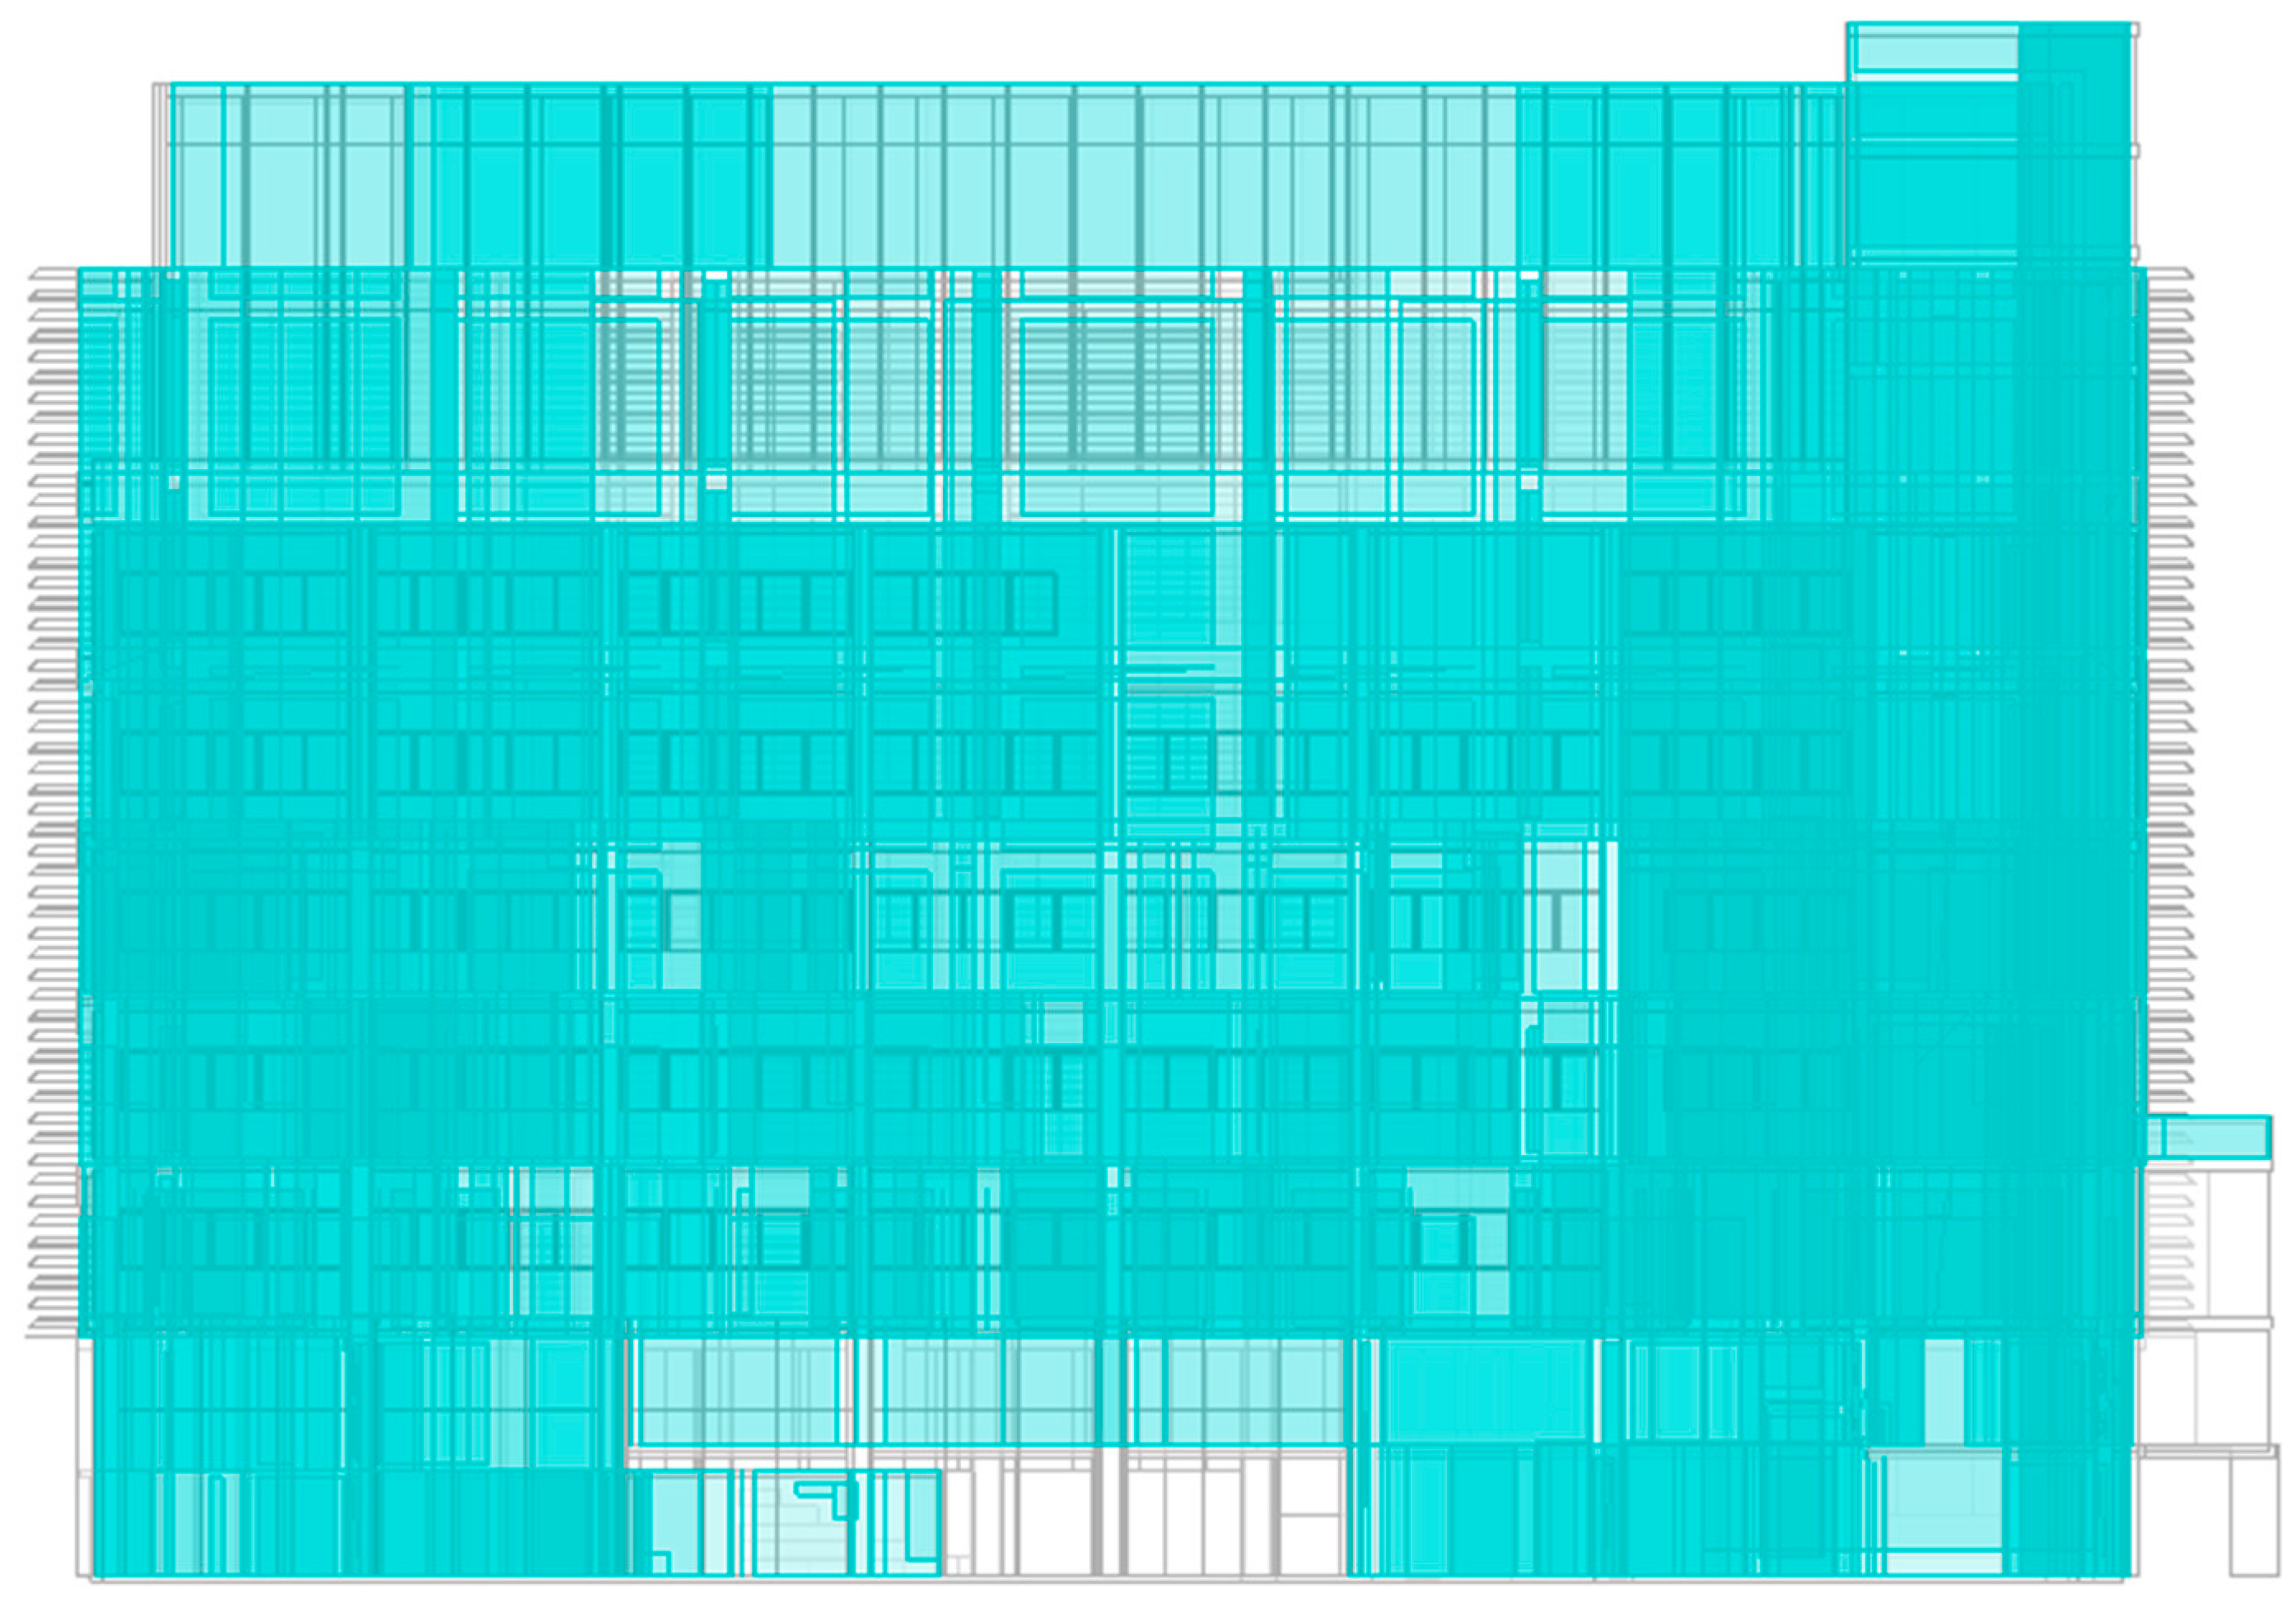
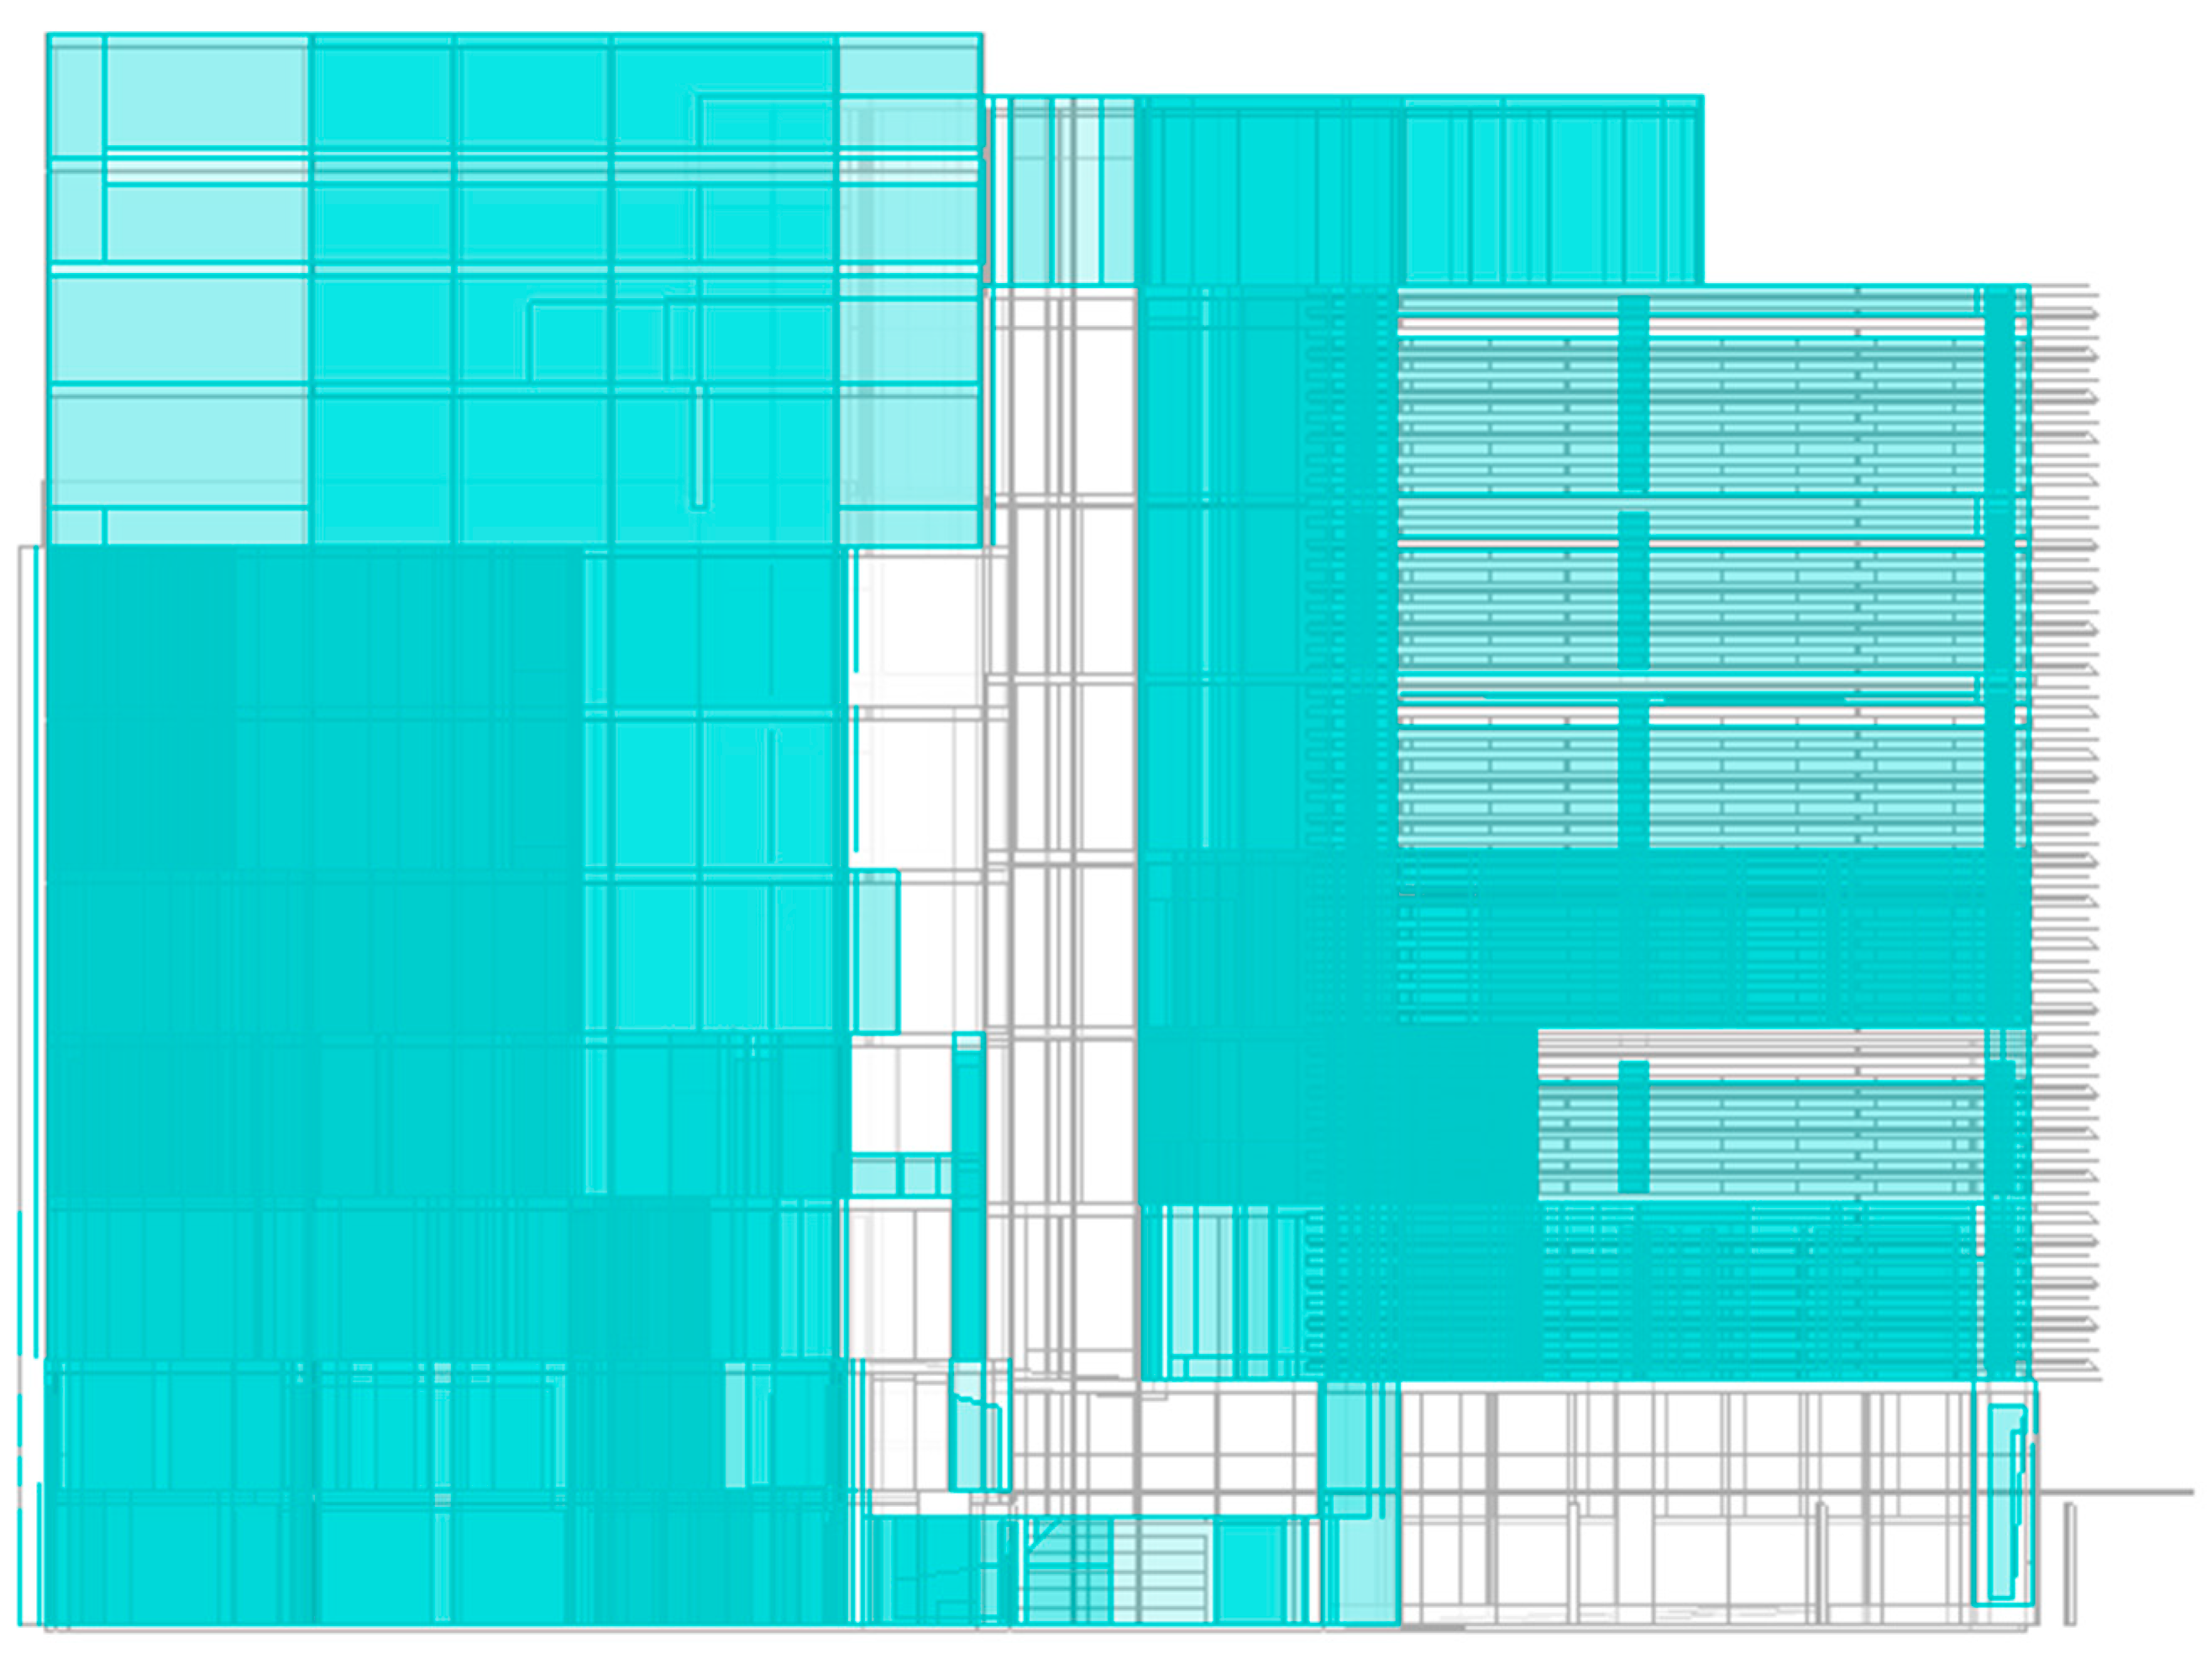
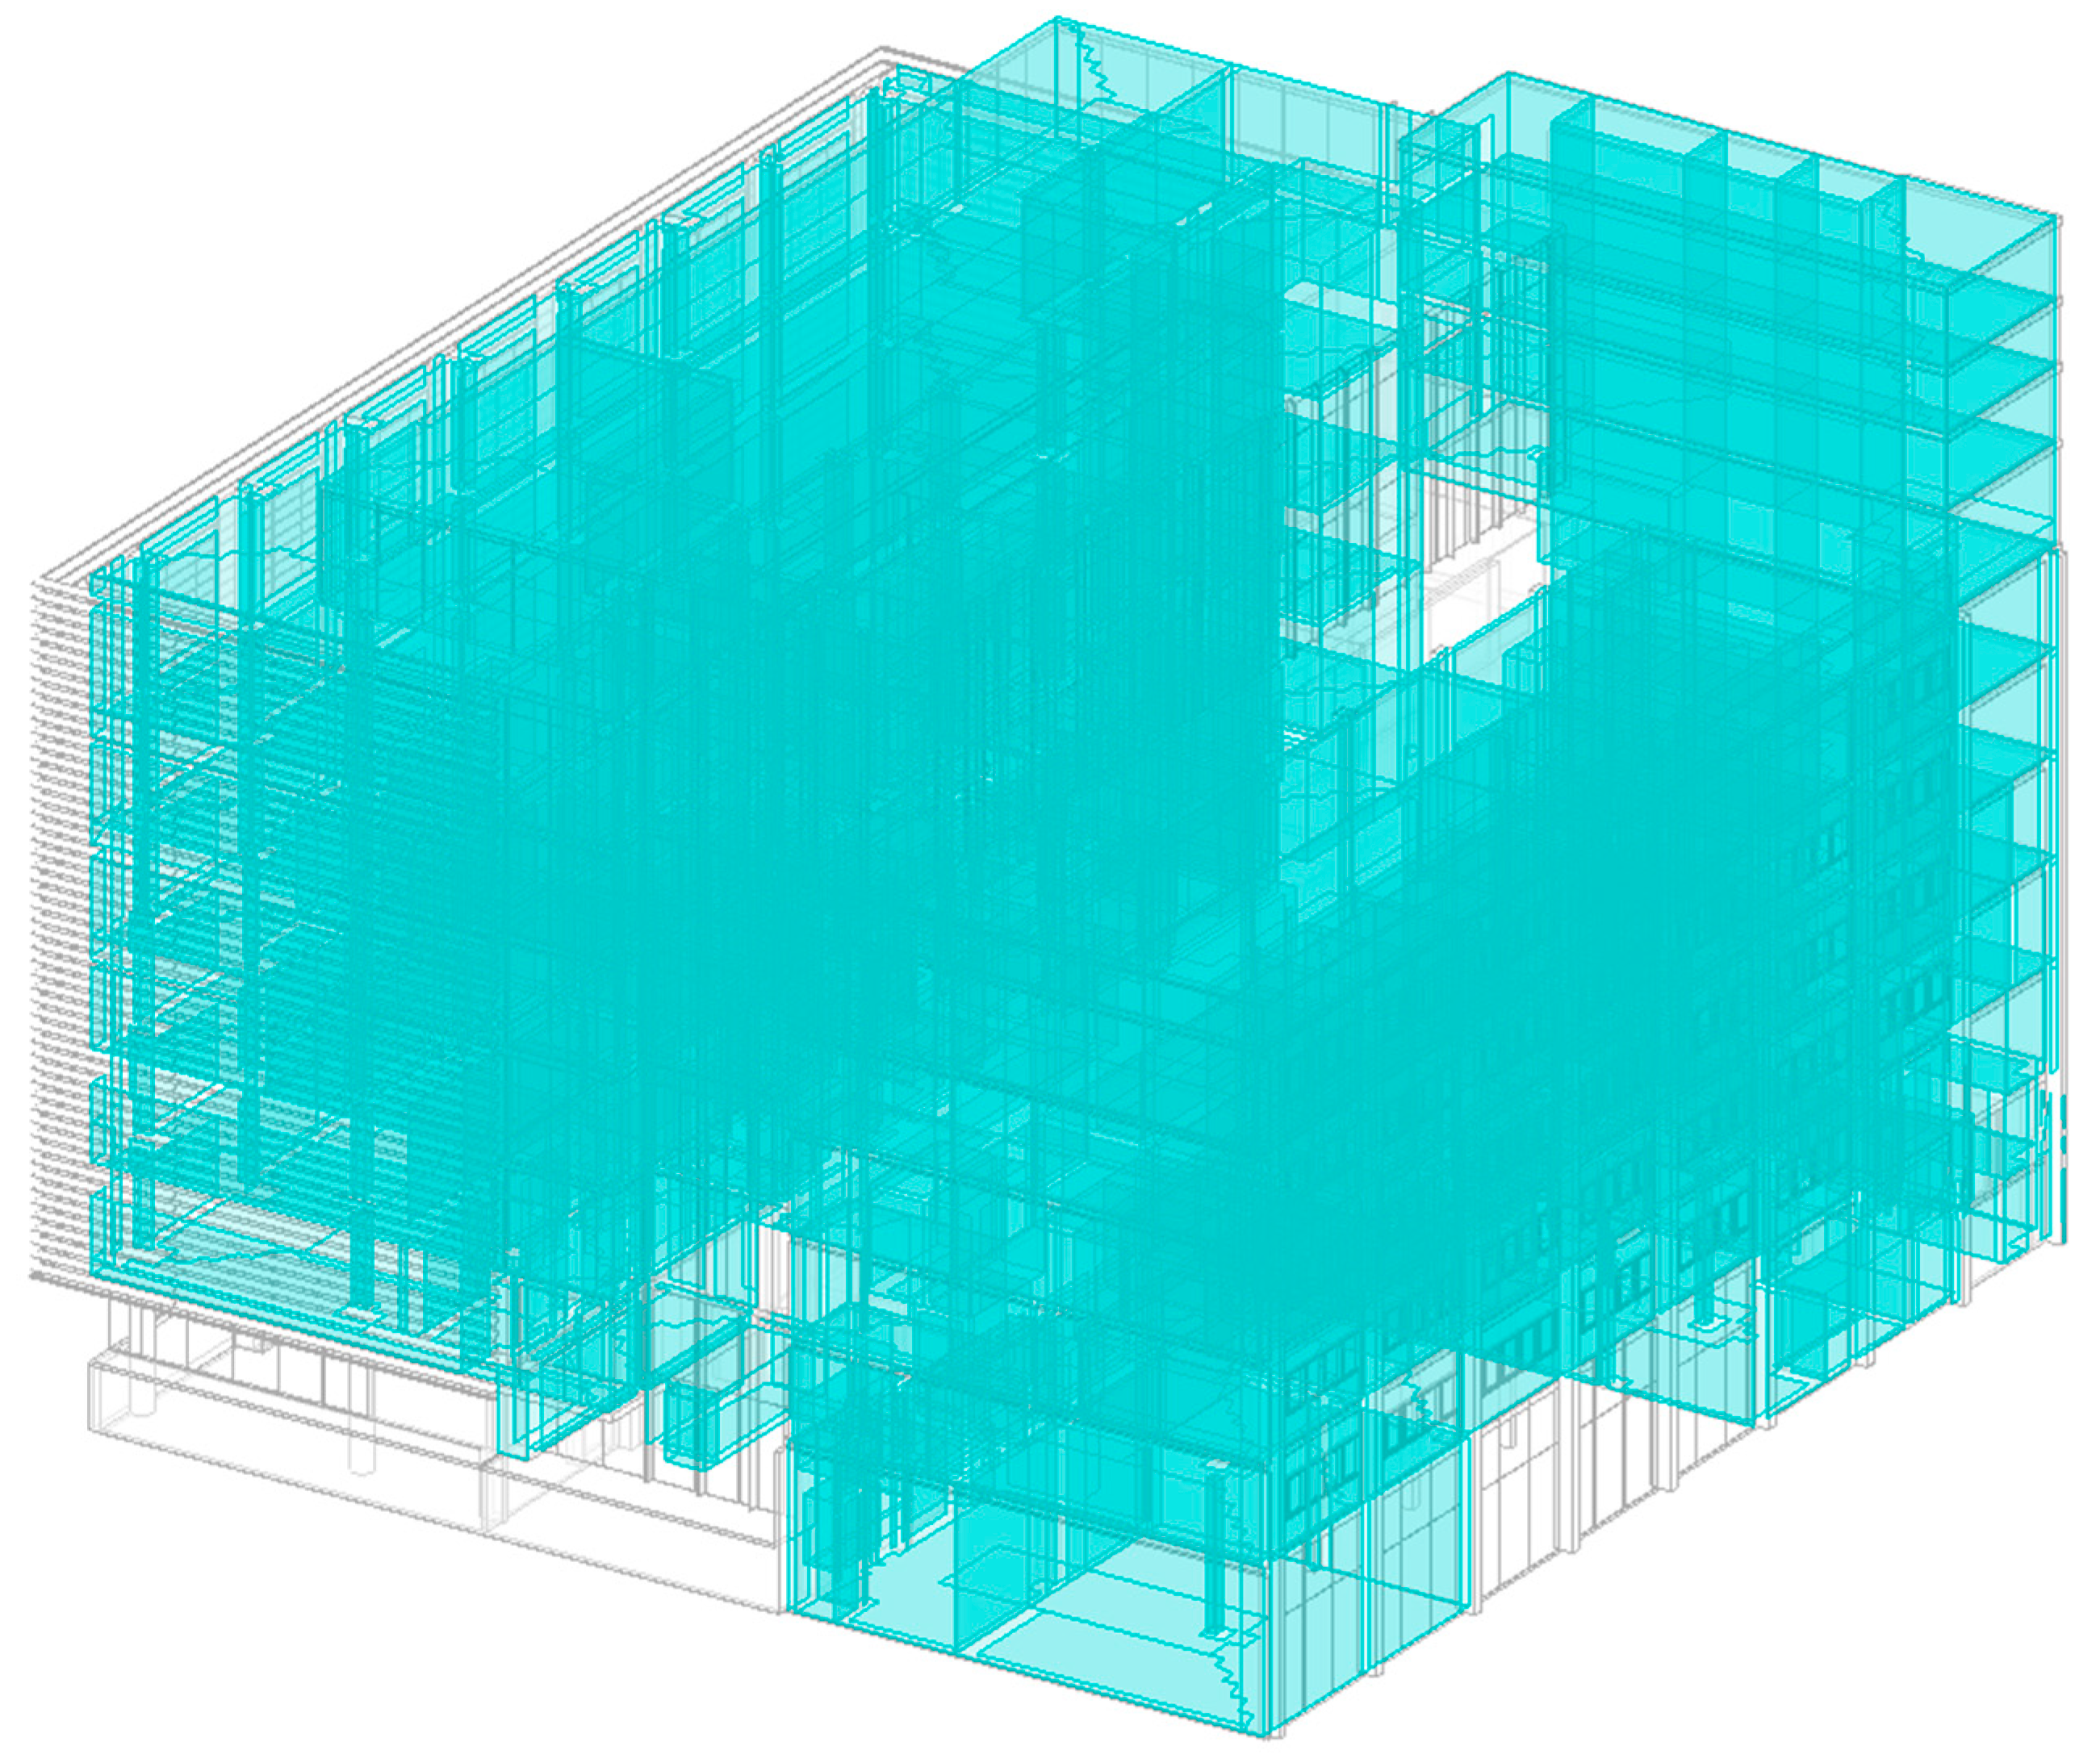
3.1.1. Building Geometry Model

The research was grounded in simulation-based methodologies, where energy outputs generated from BIM tools and energy simulation software were considered trustworthy, given their validated precision and prevalent application. The study aims to delve into more efficacious energy simulation regression techniques that bolster the advancement of algorithmic models for energy simulation. This study utilizes Revit 2022 [49], OpenStudio 3.6.1 [50], EnergyPlus 23.1.0 [51], and Python 3.10.11 [52] for data analysis and model building. The research methodology is segmented into six distinct phases:
  • Construct a Virtual Geometric Model: Develop an intricate virtual geometric model that accurately represents the architectural structure.
  • Formulate a Building Energy Model: To emulate the building’s energy dynamics and consumption patterns.
  • Perform Energy Analysis via Software: Engage dedicated software tools to conduct an in-depth energy analysis of the building.
  • Apply Python for Energy Analysis Algorithms: Use Python to create and implement sophisticated energy analysis algorithms.
  • Assess Algorithm Performance: Investigate and evaluate the efficacy of the deployed energy analysis algorithms.
  • Integrate Real-Time Monitoring Sensors: Embed sensors to provide continuous real-time data, enhancing the building’s energy performance analysis.
The following section leverages Autodesk Revit 2023, supplemented by on-site measurements and detailed construction engineering drawings, to construct a precise geometric model of the building. Notably, this model must incorporate equipment such as power and air conditioning. The material settings for the model are defined as follows:
Exterior walls: The actual building materials are meticulously replicated.
Interior walls: The default base cement wall is employed.
Dimensions: Follow the specifications in the engineering drawings.
Figure 4, Figure 5, Figure 6, Figure 7 and Figure 8, presented below, offer a visual representation of the completed building geometric model, showcasing both the facade view and the 3D perspective view.

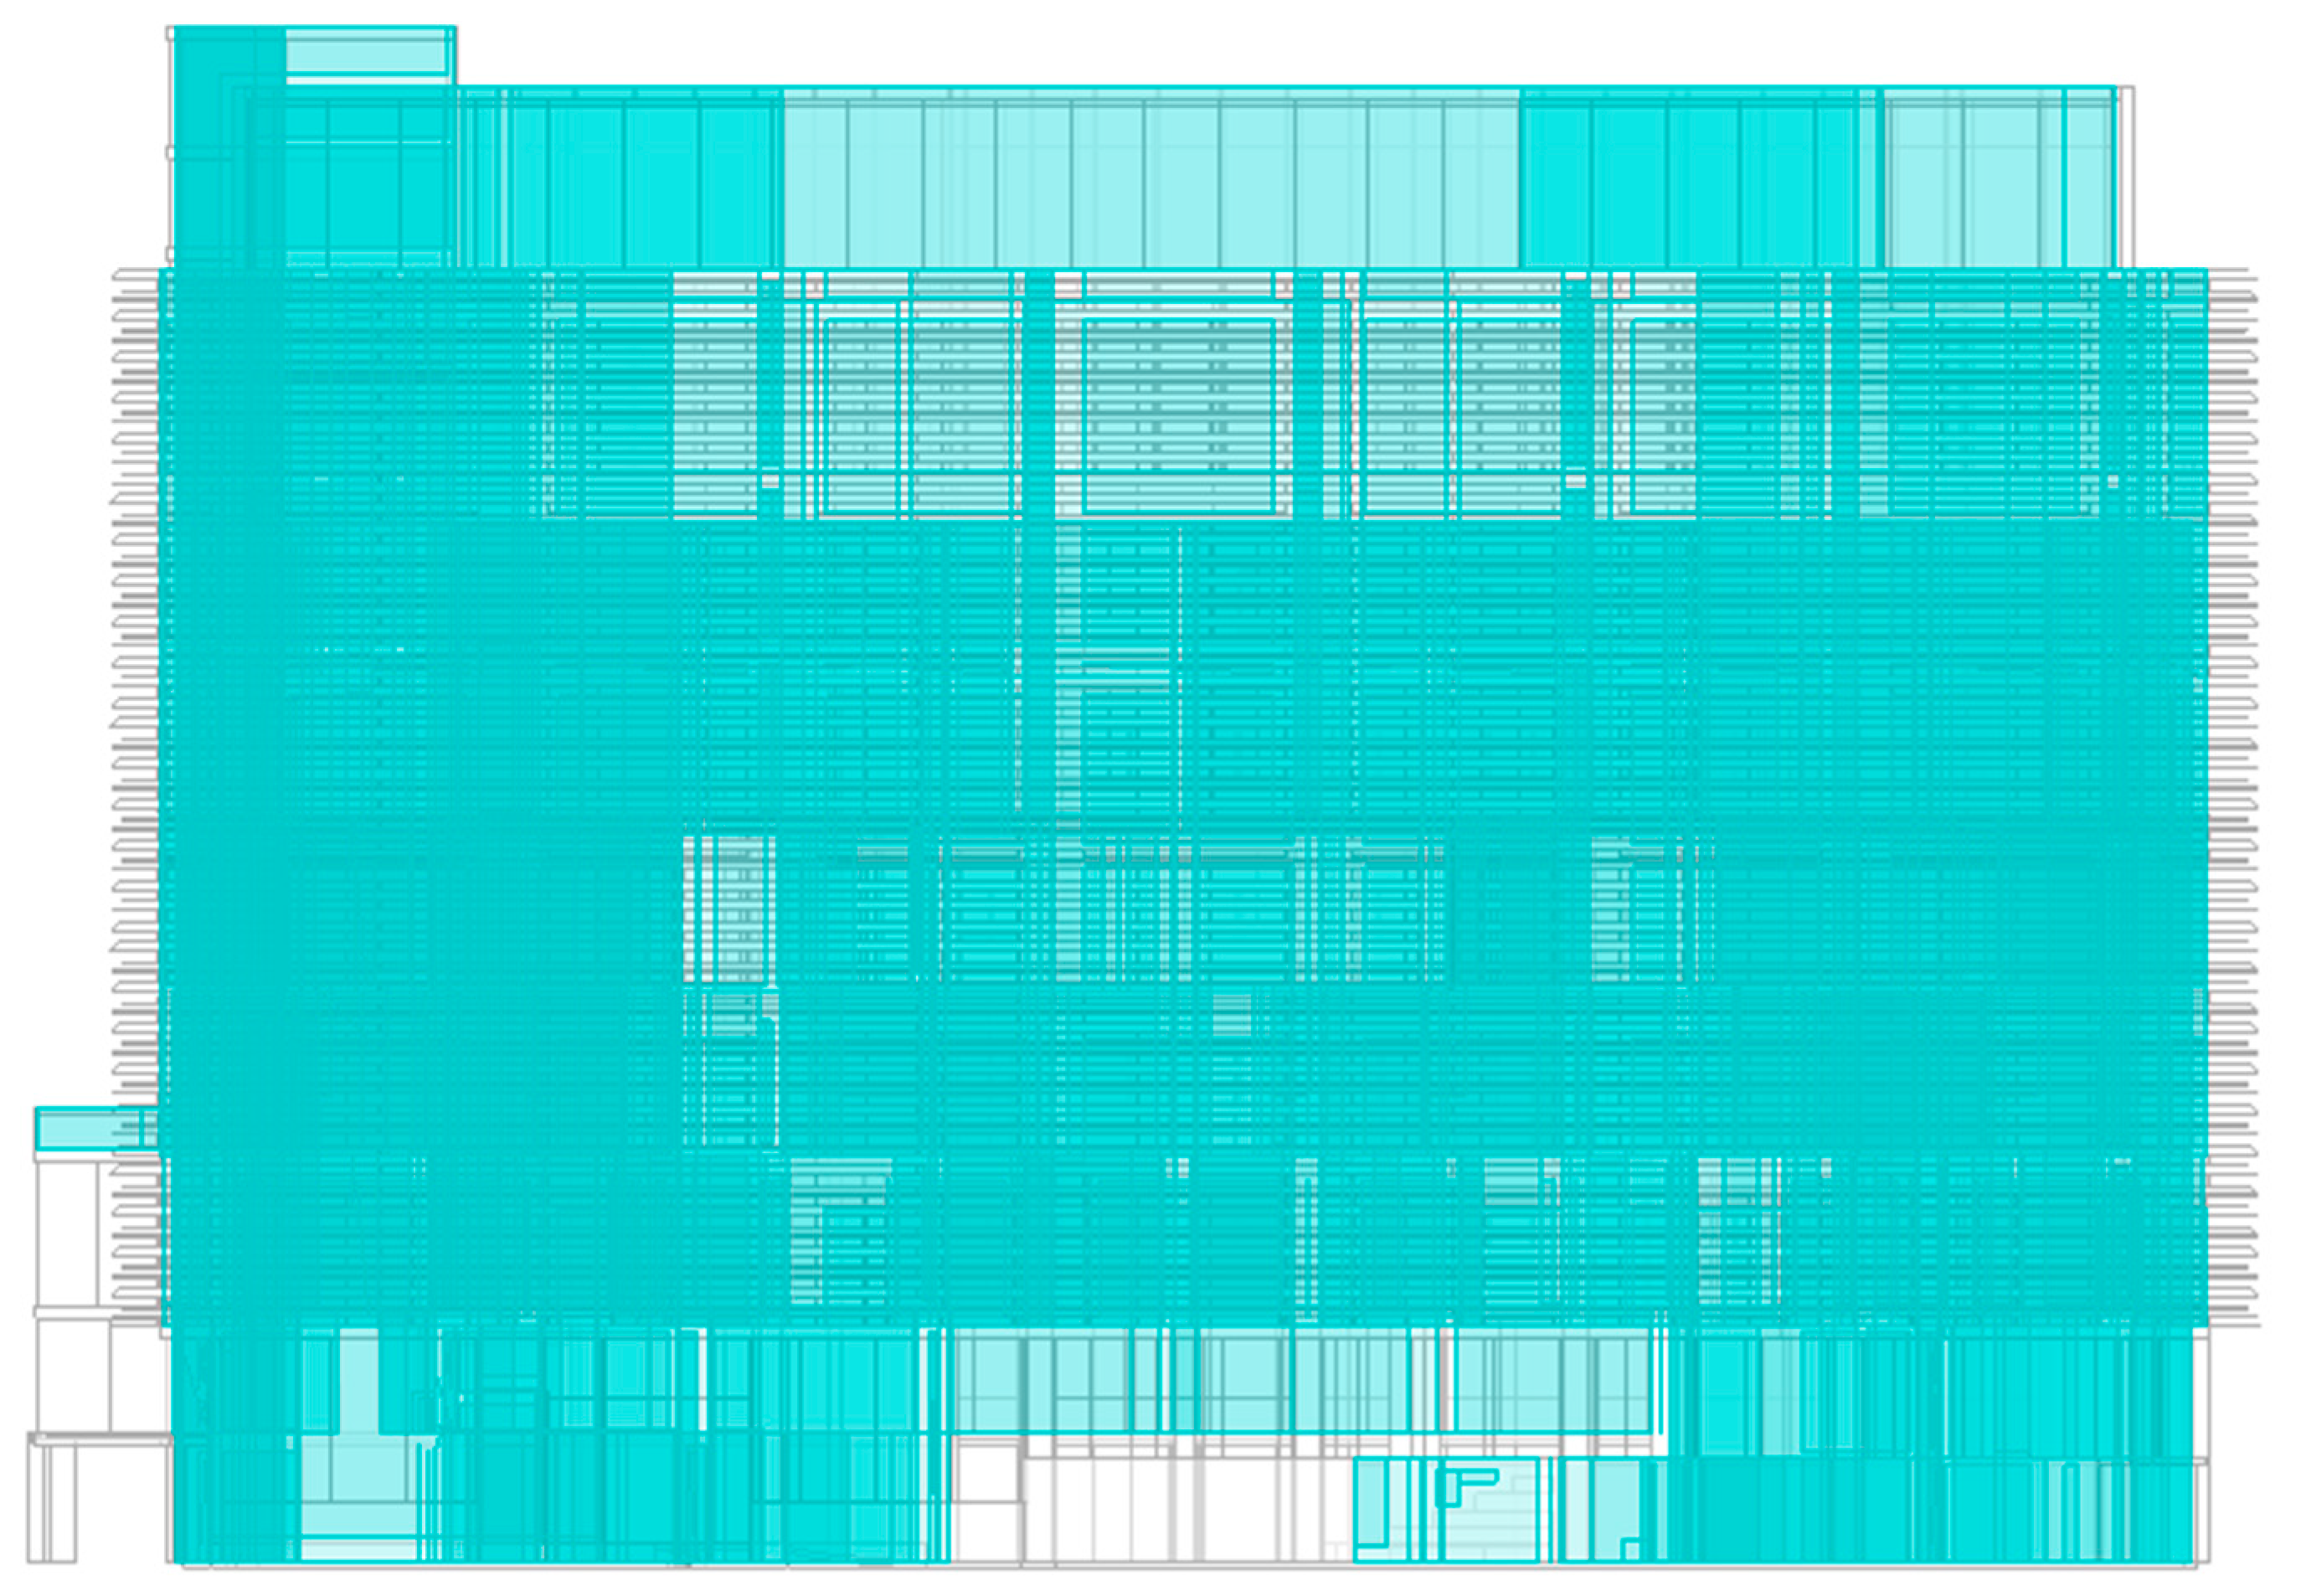
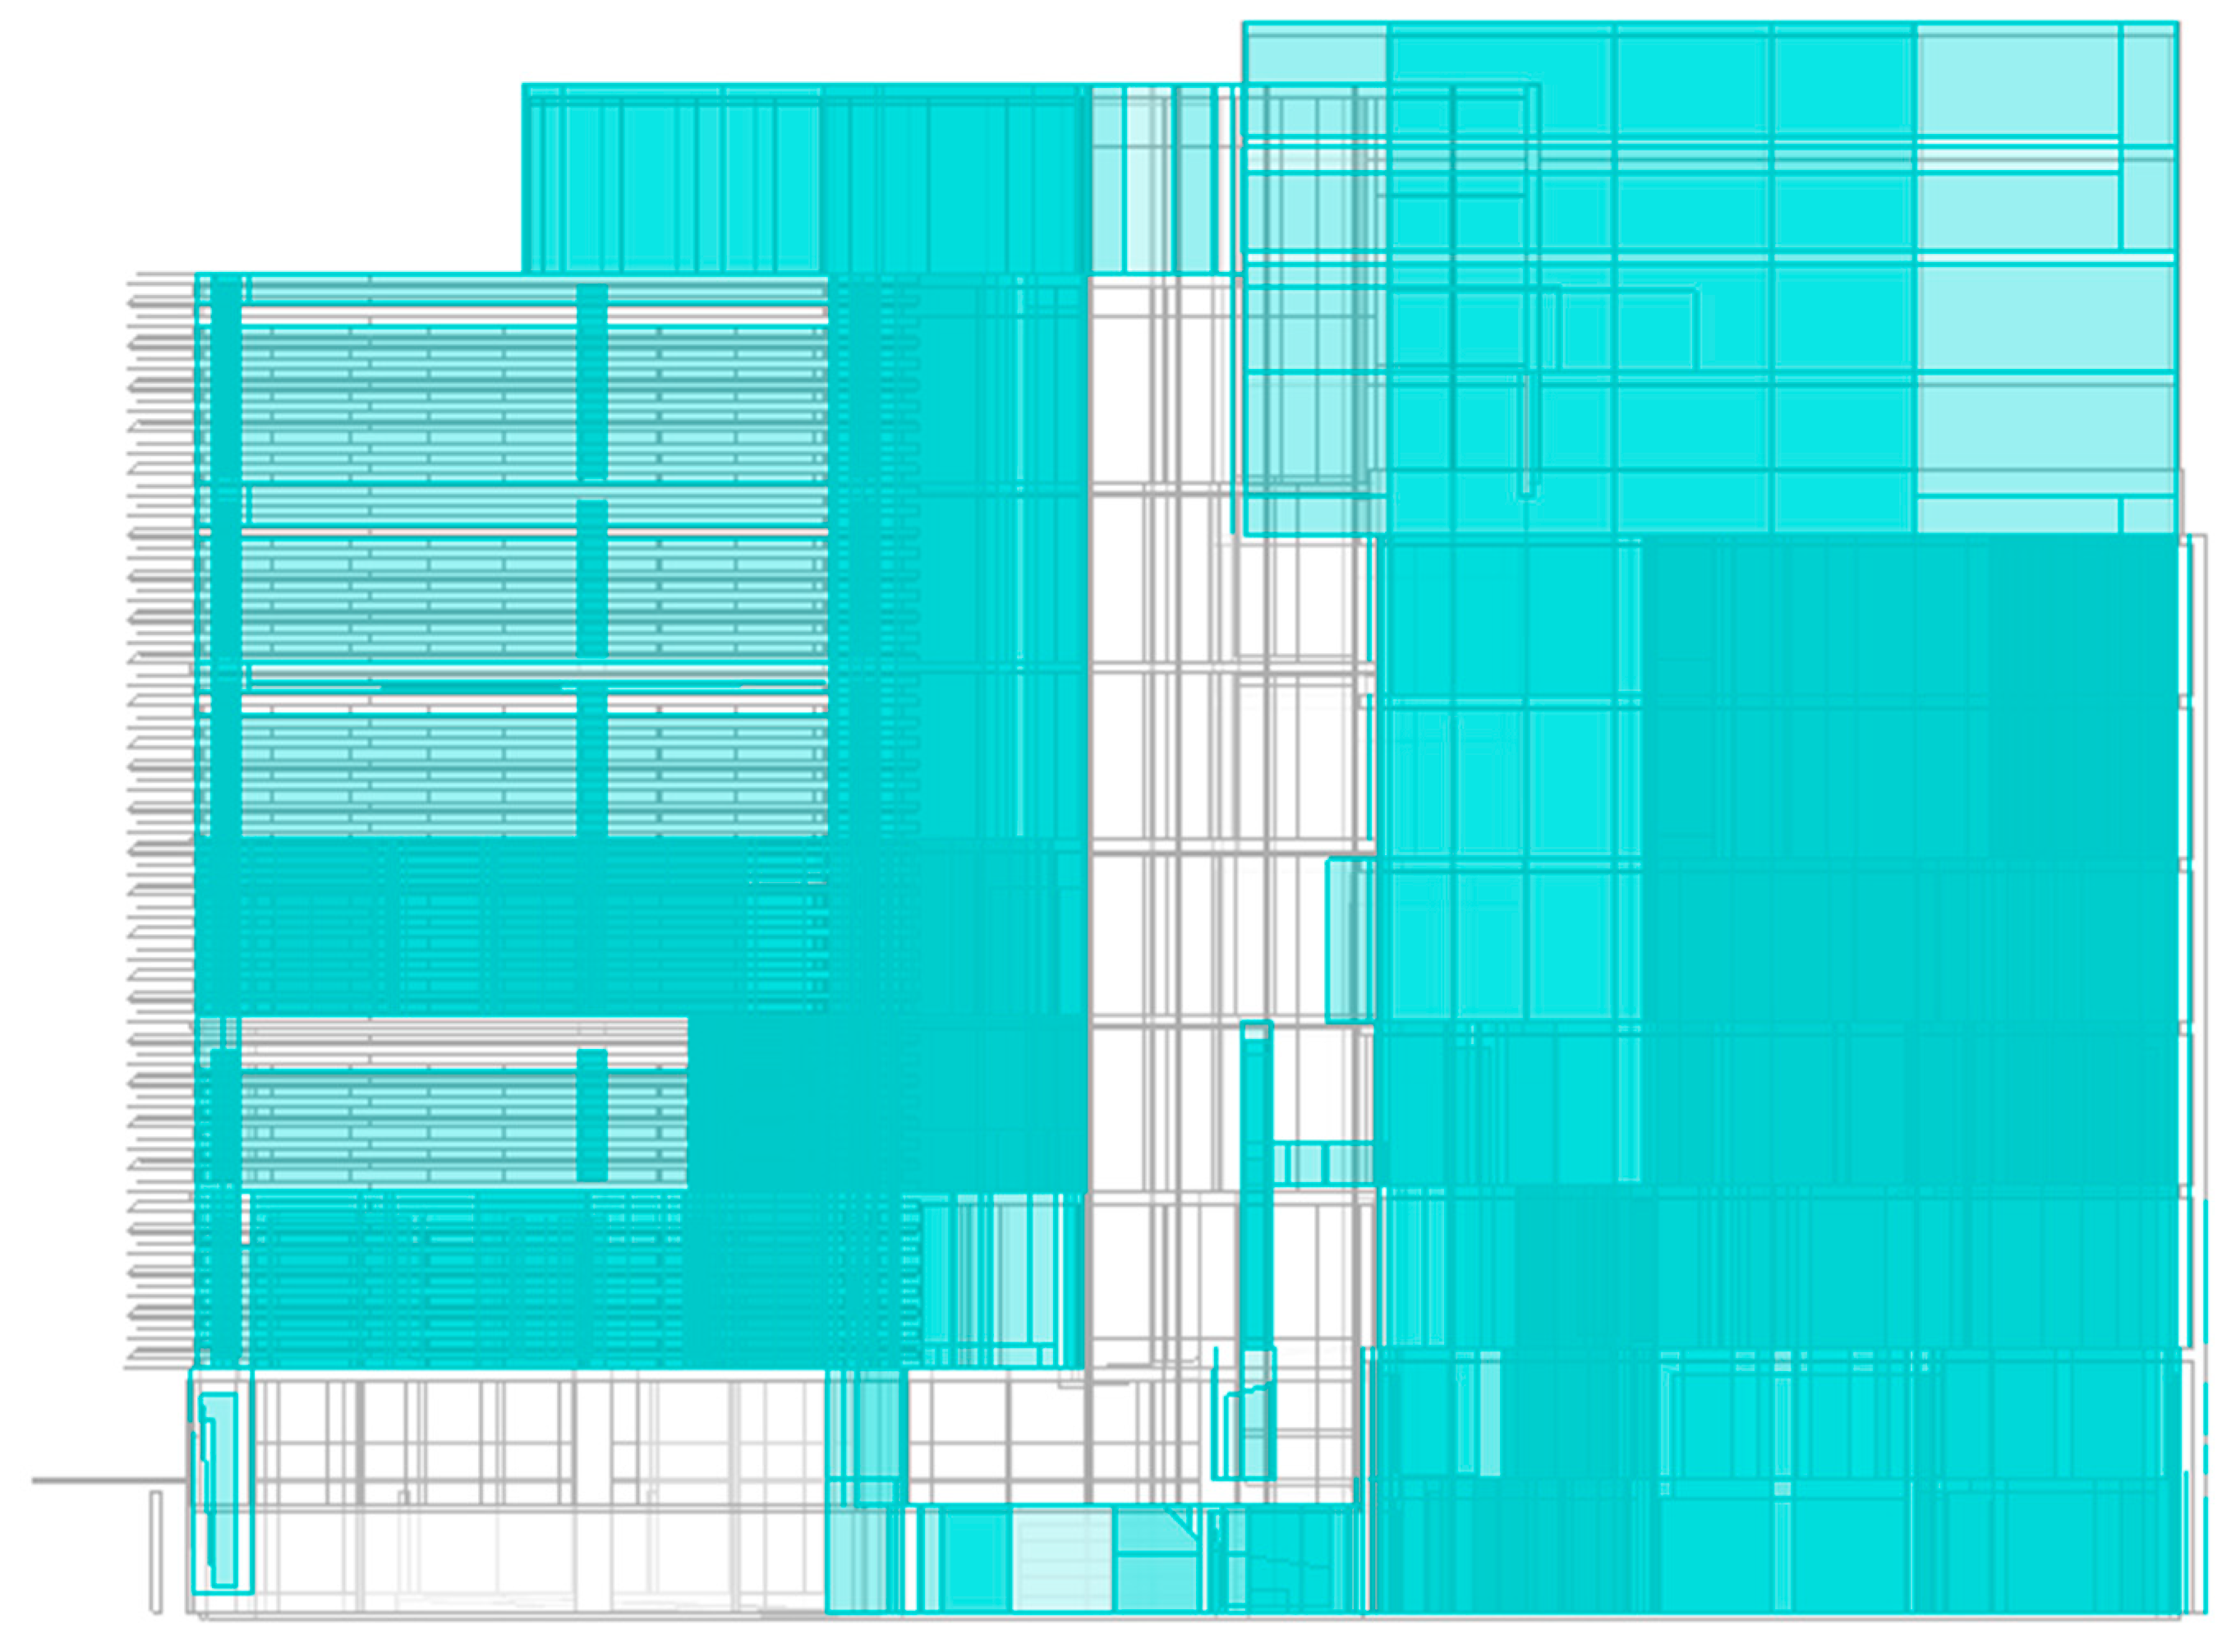
3.1.2. Building Energy Model

The built-in energy model generation function under Revit’s analysis tab creates the building’s energy model. This model is then exported in .xml file format. Figure 9, Figure 10, Figure 11, Figure 12 and Figure 13 below illustrate the energy model built in Autodesk Revit.

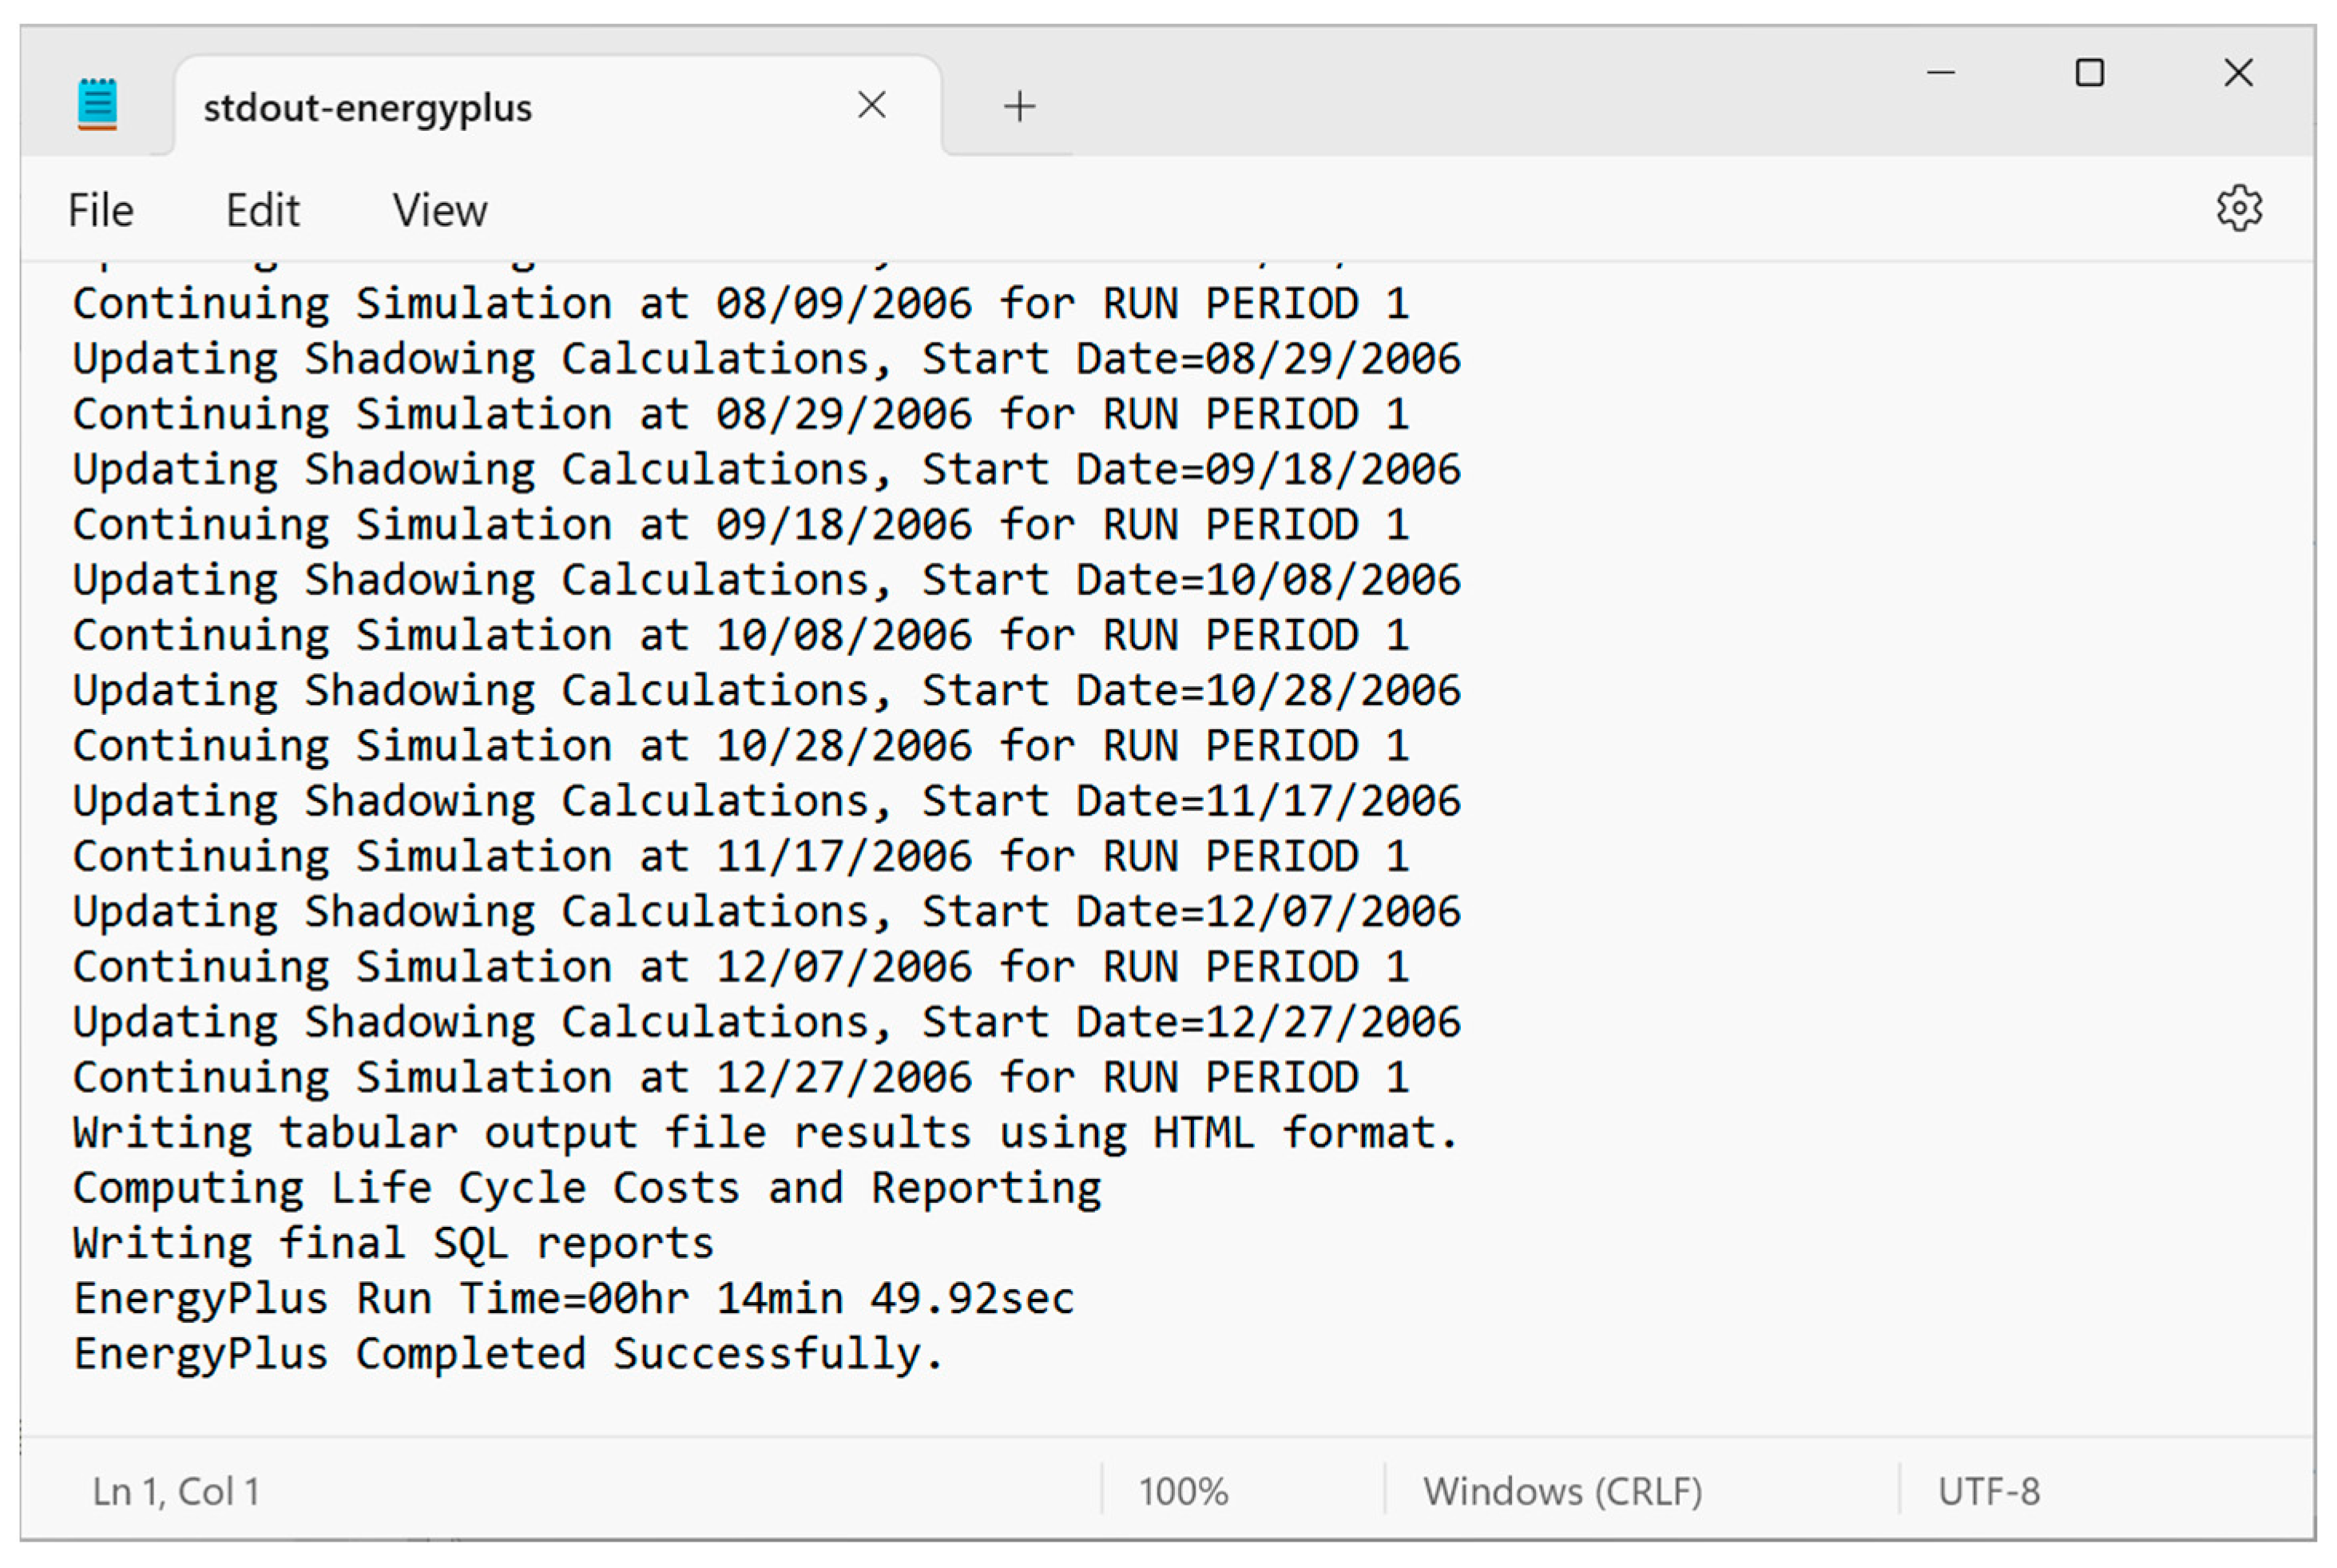
3.2. Energy Simulation in OpenStudio Using EnergyPlus

3.2.1. Simulation Parameter Settings

OpenStudio version 3.6.0 and EnergyPlus version 23.1.0-87ed9199d4 were employed for the energy analysis to conduct the simulations. We initiated the energy modeling process by creating the model in Revit and exporting it as a .xml file for integration into OpenStudio. To set the stage for the simulation, we implemented the following baseline configurations:
  • Space type designation was standardized using the ‘Default file 189.1-2009—office—closed office’.
  • The simulation adhered to the schedule defined by the ‘Default file 189.1-2009—office—closed office’.
  • Building construction parameters were aligned with the ‘Default file 189.1-2009-CZ1-office’.
  • Climate data was sourced from the Sydney area weather file on the EnergyPlus official website.
To enhance the model’s efficiency and reduce the simulation’s computational load, we consolidated all energy zones in the building into a single ‘office space’ type. While this approach streamlines the process, it could influence the outcomes’ precision. After finalizing the configuration settings, we launched the simulation in the software. The simulation’s progress was meticulously recorded, as shown in Figure 14, which illustrates the EnergyPlus process log.

3.2.2. Simulation Result Data Processing

Prior to undertaking the regression analysis, it was essential to preprocess the output data. In adherence to the Australian Standard 5151 [53], the Energy Efficiency Ratio (EER) and Coefficient of Performance (COP) metrics were extracted to compute the energy consumption for heating and cooling. This approach was favoured over the direct use of Energy Use Intensity (EUI) values. The EER is the ratio of the total cooling capacity to the practical power input to the cooling device under designated rating conditions.
Similarly, the COP measures the ratio of heating capacity to the effective power input for the heating device, also under specific rating conditions. Subsequently, the focus shifted to the ‘zone condition’ segment within the OpenStudio result report to obtain pertinent data. The details concerning zone conditions have been systematically organized and are displayed in Table 1.
Based on relevant research, we set the value of EER to 1.6 and the value of COP to 0.64 for the system efficiency [54]. Detailed time-temperature data are used as dependent variables to calculate energy consumption, while average temperature and humidity are independent variables. After using panda’s modulus in Python to convert the 12 temperature intervals into degrees Celsius, we perform the following processing on the data in the table. For each independent energy unit from the energy model:
Energy Consumption = Heating Loads + Cooling Loads.
The Heating and Cooling Loads are calculated according to the physical definitions of energy consumption and system efficiency [55]:
Loads = Efficiency × System Power × Working hours.
The efficiency for heating and cooling can be taken as COP and EER, respectively, according to Australian Standard 5151 (AS/NZS ISO 5151:2022) [53,56]. Therefore, for heating loads:
E h e a t i n g   j = i = 1 12 C O P p o w e r h e a t i n g   h o u r s i .
For cooling loads:
E c o o l i n g   j = i = 1 12 E E R p o w e r c o o l i n g   h o u r s i .

3.3. Regression Analysis

This investigation was built upon two studies mentioned in the literature review, both of which utilized linear regressions to conduct a linear analysis between parameters and EUI [42,43]. However, linear regression may be an overly optimistic analysis method. This is because energy consumption cannot infinitely increase with influencing factors; the system’s rated power binds it. The anticipated approach is one akin to a sigmoid regression analysis.
Our study focuses on the independent variables average temperature and average relative humidity, and the dependent variable, energy consumption.
The choice of regression model will be based on the scatter plot. The model will be flexibly adjusted according to the model structure, such as considering transformed independent variables. Model optimization by iteration in regression is automated using the corresponding Python package, eliminating the need for manual adjustments. Model performance is evaluated by comparing R-squared, Mean Squared Error, AIC, and BIC across different model categories. The best-performing model will be integrated with thermal sensors in subsequent stages for real-time simulation.
This study will not further calibrate the model, as access to actual building data was restricted by authorities. Consequently, calibrating with simulated data alone is considered to have limited value.

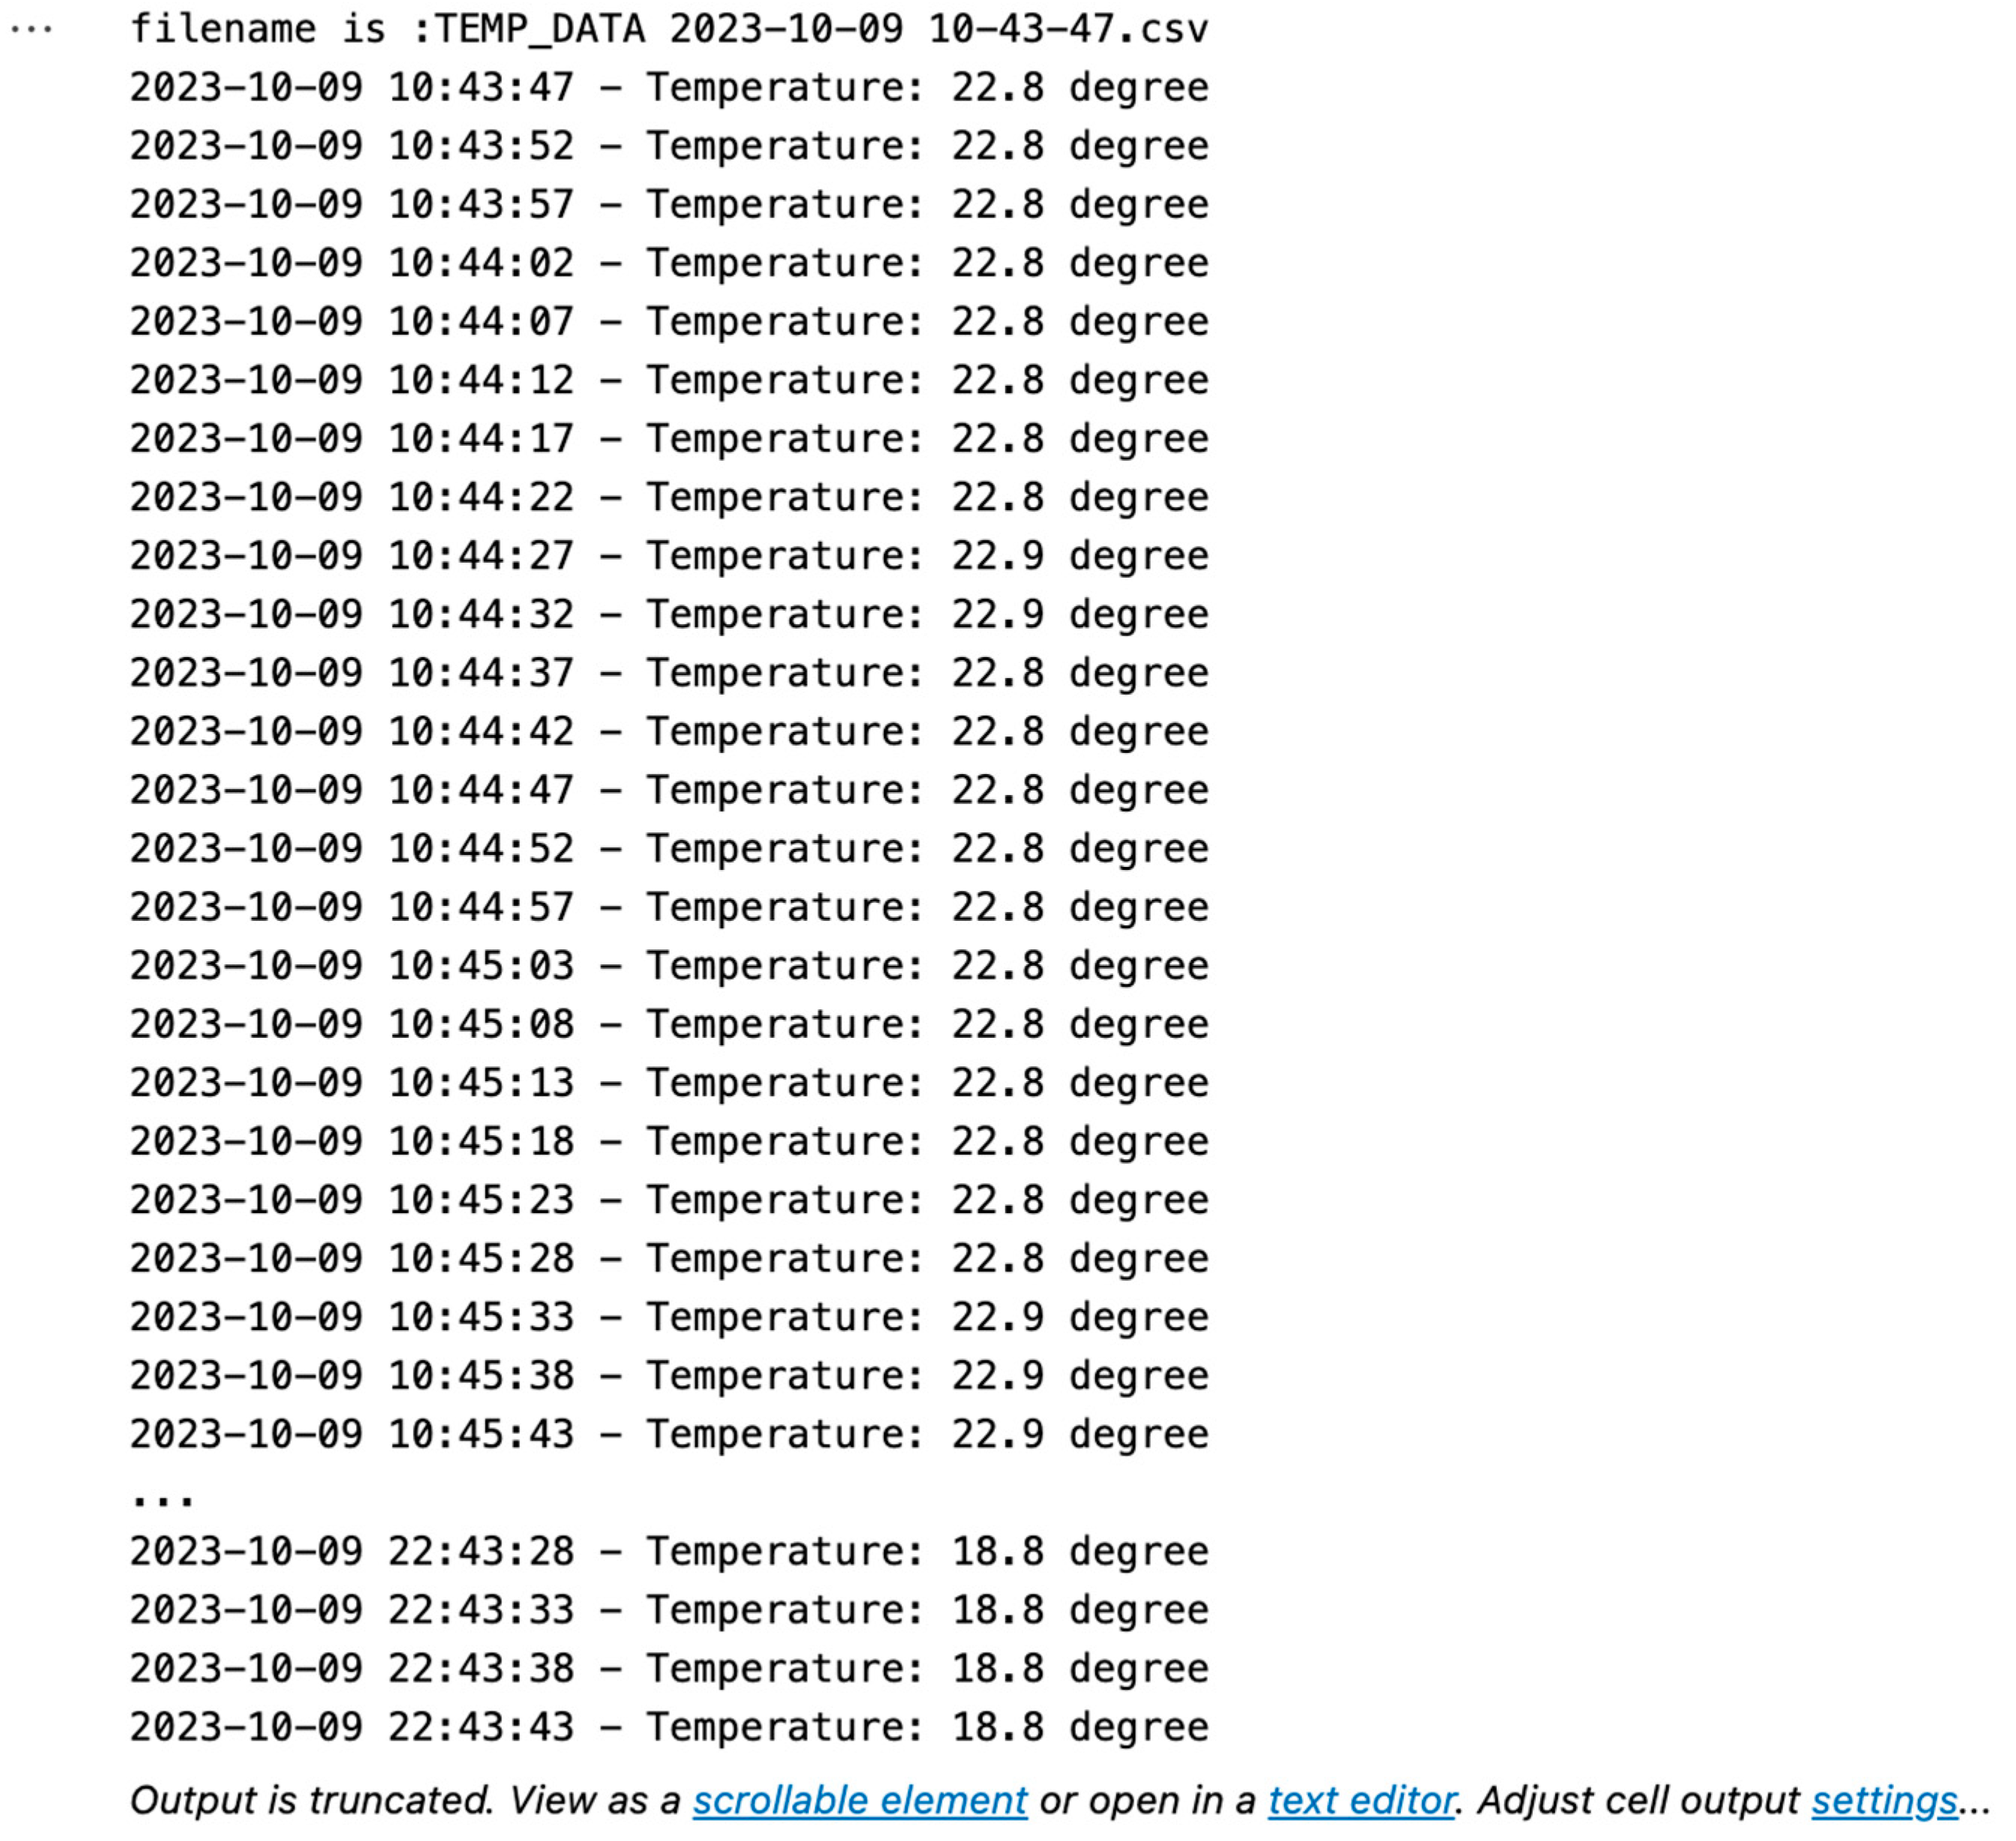
3.4. Implementing Sensors for Real-Time Simulation

This phase tracks the outside ambient temperature to predict energy use. Using a DL11A-MC-D1 temperature sensor (as shown in Figure 15) with Modbus RTU via USB, data are collected using Python and the minimalmodbus library on a Windows PC. The sensor records the temperature every 10 min, saving it in a CSV file with timestamps.
The sensing process includes four steps:
  • Setting up Modbus Communication: Configuring serial parameters and initializing an object.
  • Creating a CSV File: Opening a new file with headers for timestamp and temperature.
  • Real-Time Data Logging: Continuously read and log temperature and time, displaying them in real time.
  • Error Handling: Managing reading errors by displaying messages and continuing data collection.
This process is supported in applying a regression model for energy consumption forecasting and temperature visualization.

3.5. DTFramework Model under the J03 Case Study

This section further explores the DT framework model for the J03 architectural case. This framework refers to adaptive data exchange between physical entities and virtual models through an innovative information modelling system. The DT of the J03 building may connect to its actual building through real-time data and status feedback. In this system, sensors installed in buildings collect real-time data on critical indicators such as temperature, becoming the link between physical and virtual models.
This data is fed into a proposed DT that simulates the current physical state of the building. The DT model is expected to be closely connected with BIM, providing a multi-dimensional perspective that enables managers to adjust the environment more accurately within the physical building and optimize its energy efficiency based on the predictions and recommendations of the virtual model. Figure 16 visualizes this research theory in this study, based on our own understanding and digestion of previous research about DT [57].

3.5.1. Assumed Efficiency Coefficients & Adaptive Factor Adjustments

The DT framework is an integrated system that combines physical objects in the real world with digital models in the virtual world. A DT is defined as a virtual replica of a physical object, and the availability of real-time data will help mirror conditions, states, and changes occurring in a building or an asset. A DT can be a basic system demonstrating the update of the physical entity, and it can be advanced and sophisticated with a two-way communication flow.
Sensors on the physical object are critical tools to collect information from the physical assets and constantly feed data that is often about its performance to the virtual model, which can then be used to monitor the object, predict future issues, and even optimize its operations. DTs can be created for anything from buildings and machines to entire processes, and they are becoming increasingly important for improving efficiency and performance in many industries.
To better demonstrate the effect of this framework, especially the adaptive optimization behaviour generated based on the prediction results, this study makes some assumptions about the energy coefficient and simulation behaviour. The reason is that in actual operation, the actual energy efficiency coefficient of each building area may be difficult to measure directly or change in real time, directly affecting the accuracy and adaptability of the DT model.
When establishing the previous model, EER and COP were introduced to describe the energy efficiency of the air conditioning system under specific conditions, and they represent the air conditioner’s energy efficiency in a single space. To generally represent the energy efficiency of the entire building area, all relevant factors need to be considered, as many different systems and activities contribute differently to energy consumption. Therefore, for later analysis, the EER and COP were replaced by a general total cooling factor and heating factor.
In the second half of this study, air conditioning, lighting, and human activity were considered. Such an assumption is based on a specific scenario: an open space during the summer [58], where the air conditioner runs 12 h a day and the lights run 10 h [59]. Weighting the energy efficiency of air conditioners and lights according to their usage time results in a weight of 0.545 for air conditioners (because 12 h accounts for a little more than half of a day) and a weight of 0.455 for lights (because 10 h accounts for a little less than half of a day). Moreover, according to the previous EnergyPlus simulation results, the time weights of cooling and heating are set to 0.8 and 0.2, respectively, which reflects that cooling accounts for a larger proportion than heating [57]. In this section, many values are based on limited assumptions and some existing relevant literature and are not real effective values for this building. Because the primary purpose of this study is to explore potential Digital Twin implementation methods rather than to simulate the energy of buildings accurately, the results below are largely inaccurate, and the parameters might not have universal reference significance and application value.
Combine the weights and assumptions, the total cooling factor is the weighted sum of the product of the air conditioner’s EER and the time weight and the lighting efficiency, while the total heating factor is the weighted sum of the product of the air conditioner’s EER and the heating time weight and the lighting efficiency. Based on [49,50,51,52,53,54,55] it can be concluded that:
Total Cooling factor per zone = 0.545 × 0.8 × EER + 0.455 × Light Efficiency,
Total Heating factor per zone = 0.545 × 0.2 × COP + 0.455 × Light Efficiency.
For the energy efficiency coefficient of LED lights, it is assumed that a highly efficient LED light is in use, which has minimal energy losses. Therefore, the energy efficiency coefficient for the LED light is assumed to be 0.9 [57].

3.5.2. Adaptive Factor Adjustments

In this study, the variations in adjustment factors arising from two types of adaptive behaviours are simulated.

Window Ventilation

Opening windows allows for natural ventilation, aiding in regulating indoor temperatures. In the summer, this can help reduce the indoor temperature, thereby lessening the load on the air conditioner. Opening windows can also raise the indoor temperature during winter if the external temperature is relatively high.
When windows are opened for ventilation, the energy efficiency coefficient can be multiplied by an adjustment factor (less than 0.1) to reflect this influence. Therefore, the adjusted cooling efficiency coefficient based on the general thermodynamic principles and [48,49,50,51,52,53] can be derived as:
Adjusted cooling efficiency coefficient = Total Cooling or Heating factor per zone × Window ventilation adjustment factor (≤10%).

Dimming Light Intensity

By reducing the light intensity in unnecessary areas (zones with no human activity), the power consumption of the lights diminishes, leading to decreased energy consumption. The impact of dimming the light intensity can be accounted for by adjusting the weight or the efficiency coefficient of the light. For instance, if the light intensity is reduced by 50%, its efficiency coefficient can be multiplied by 0.5, or its weight can be multiplied by 0.5. Therefore, the adjusted light efficiency coefficient according to general thermodynamic principles can be derived as:
Adjusted light efficiency = Original light efficiency × Light intensity adjustment factor (≤30%).
Here, the value of the light intensity adjustment factor depends on the proportion by which the light intensity is reduced.
These adjustment factors are assumptions made as part of the simplified model. In real-world scenarios, adjustments and optimizations require data analysis on the effects of window ventilation and reduced light intensity to be accurately determined.

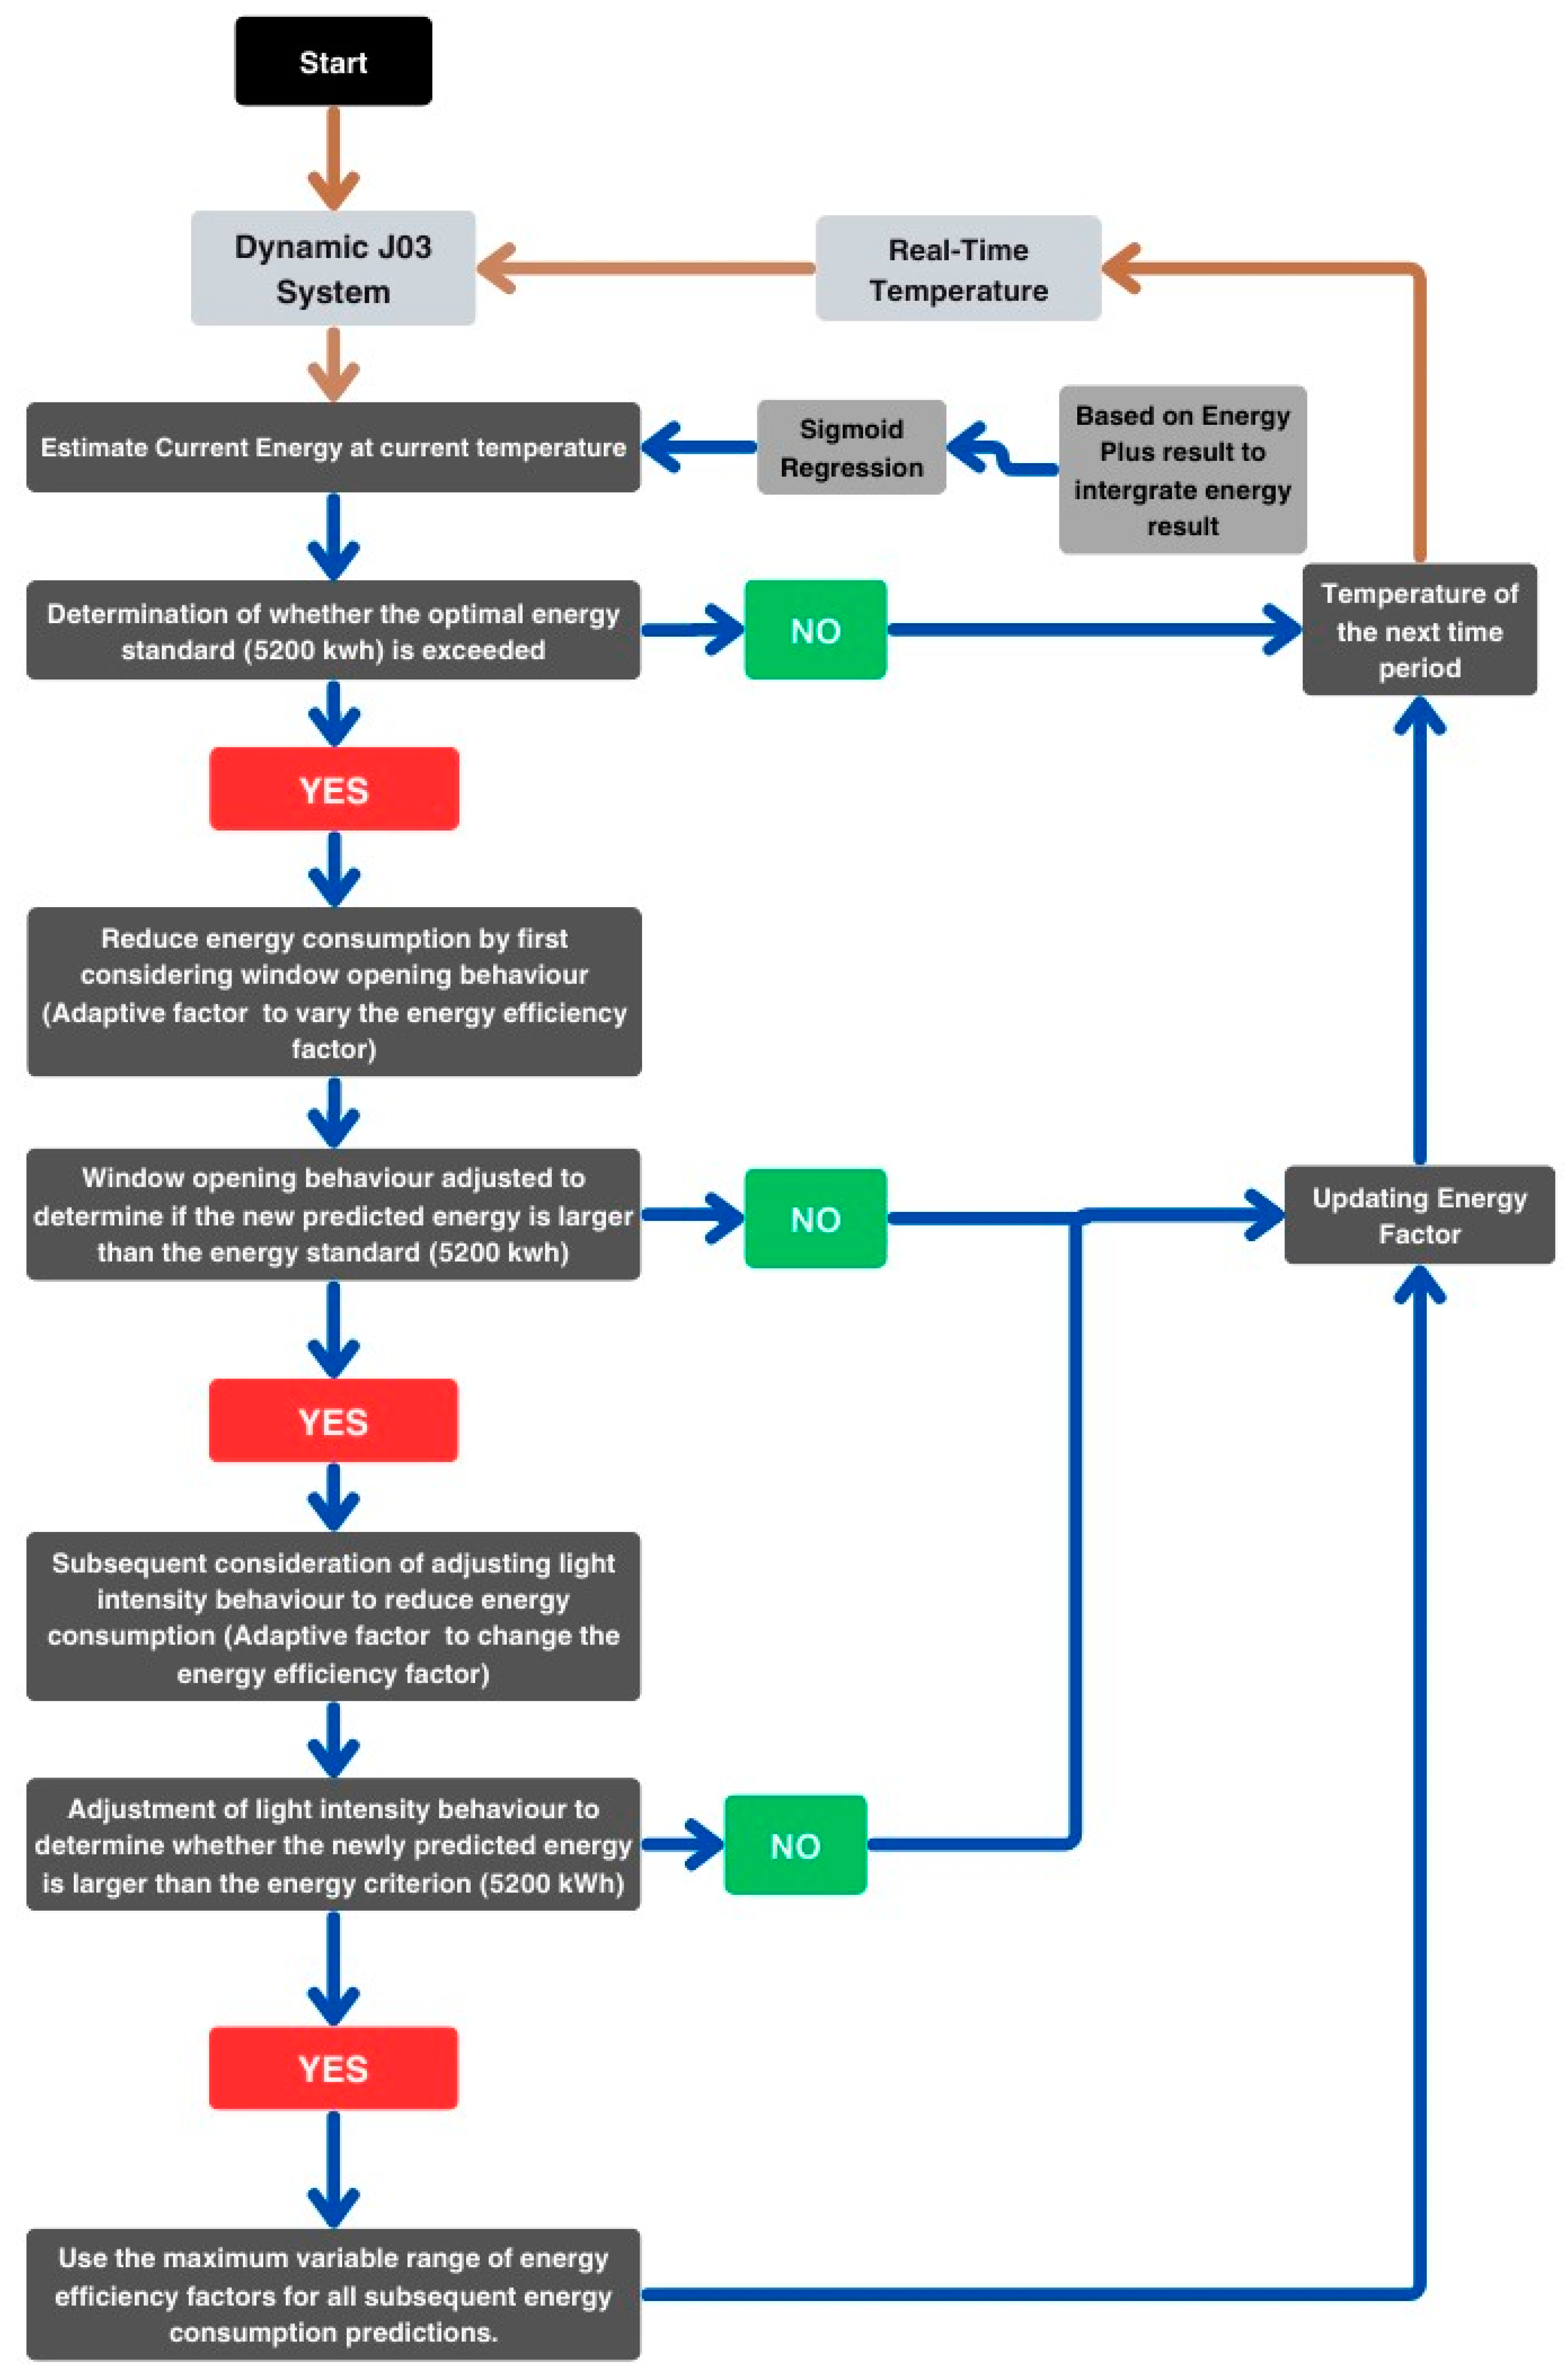
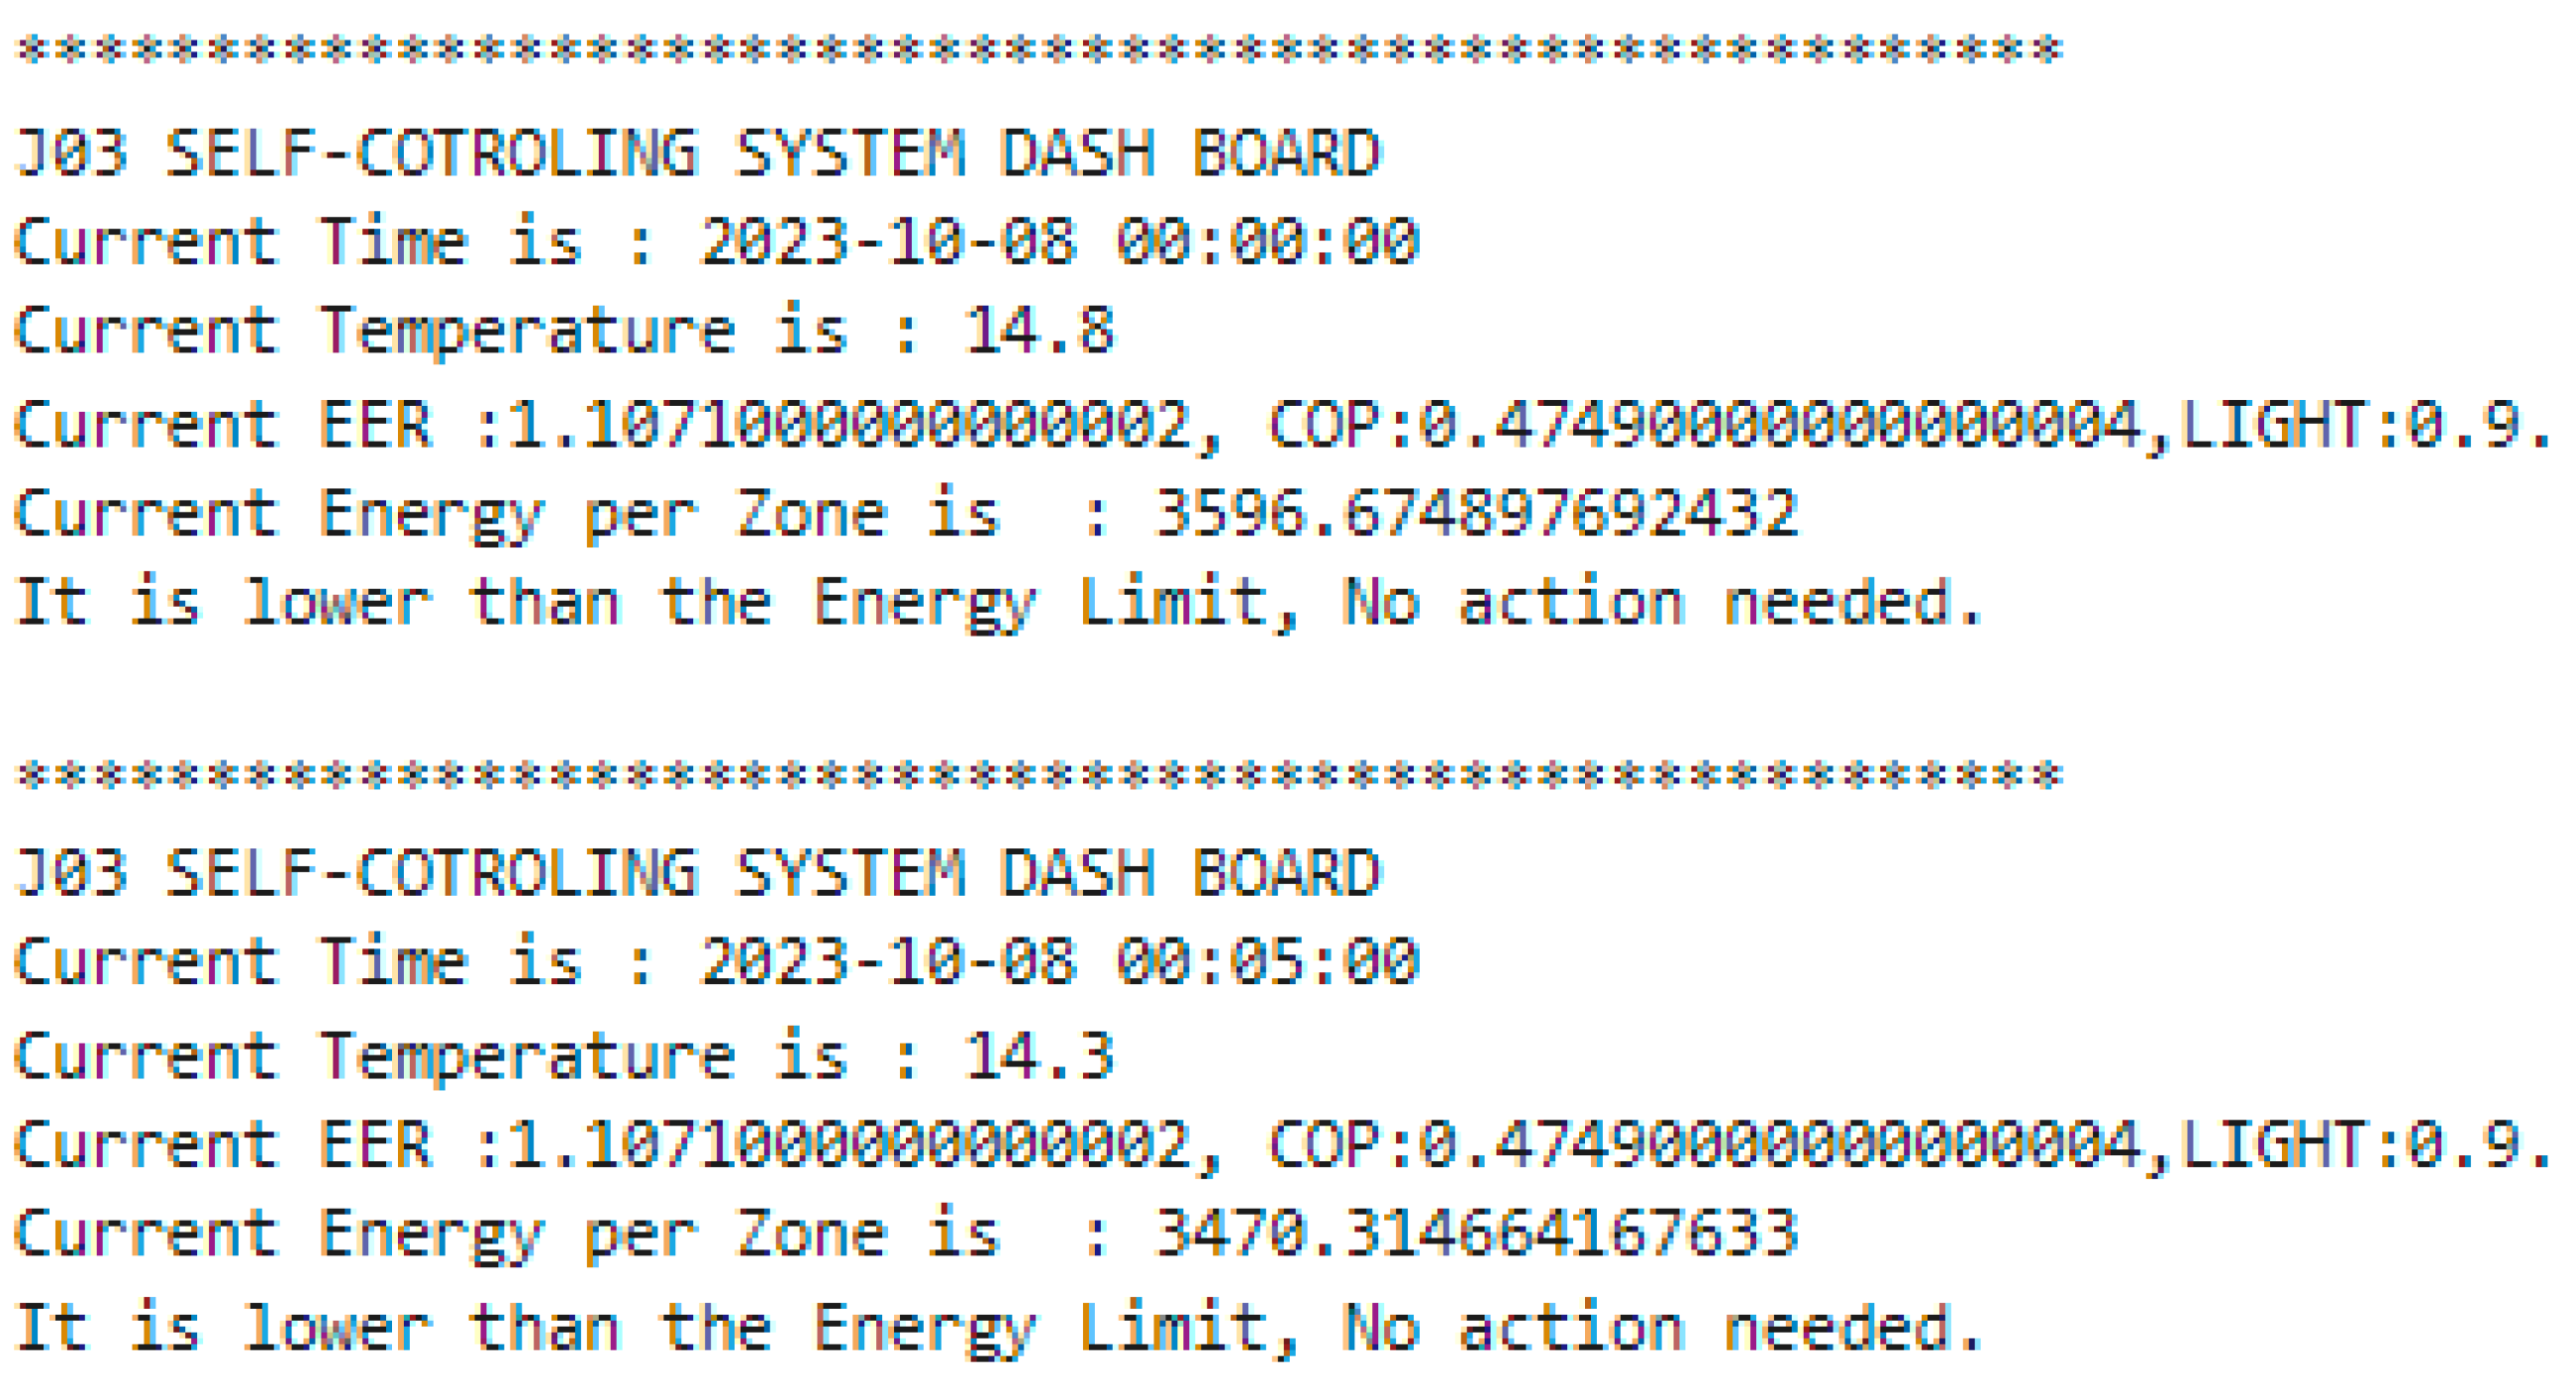
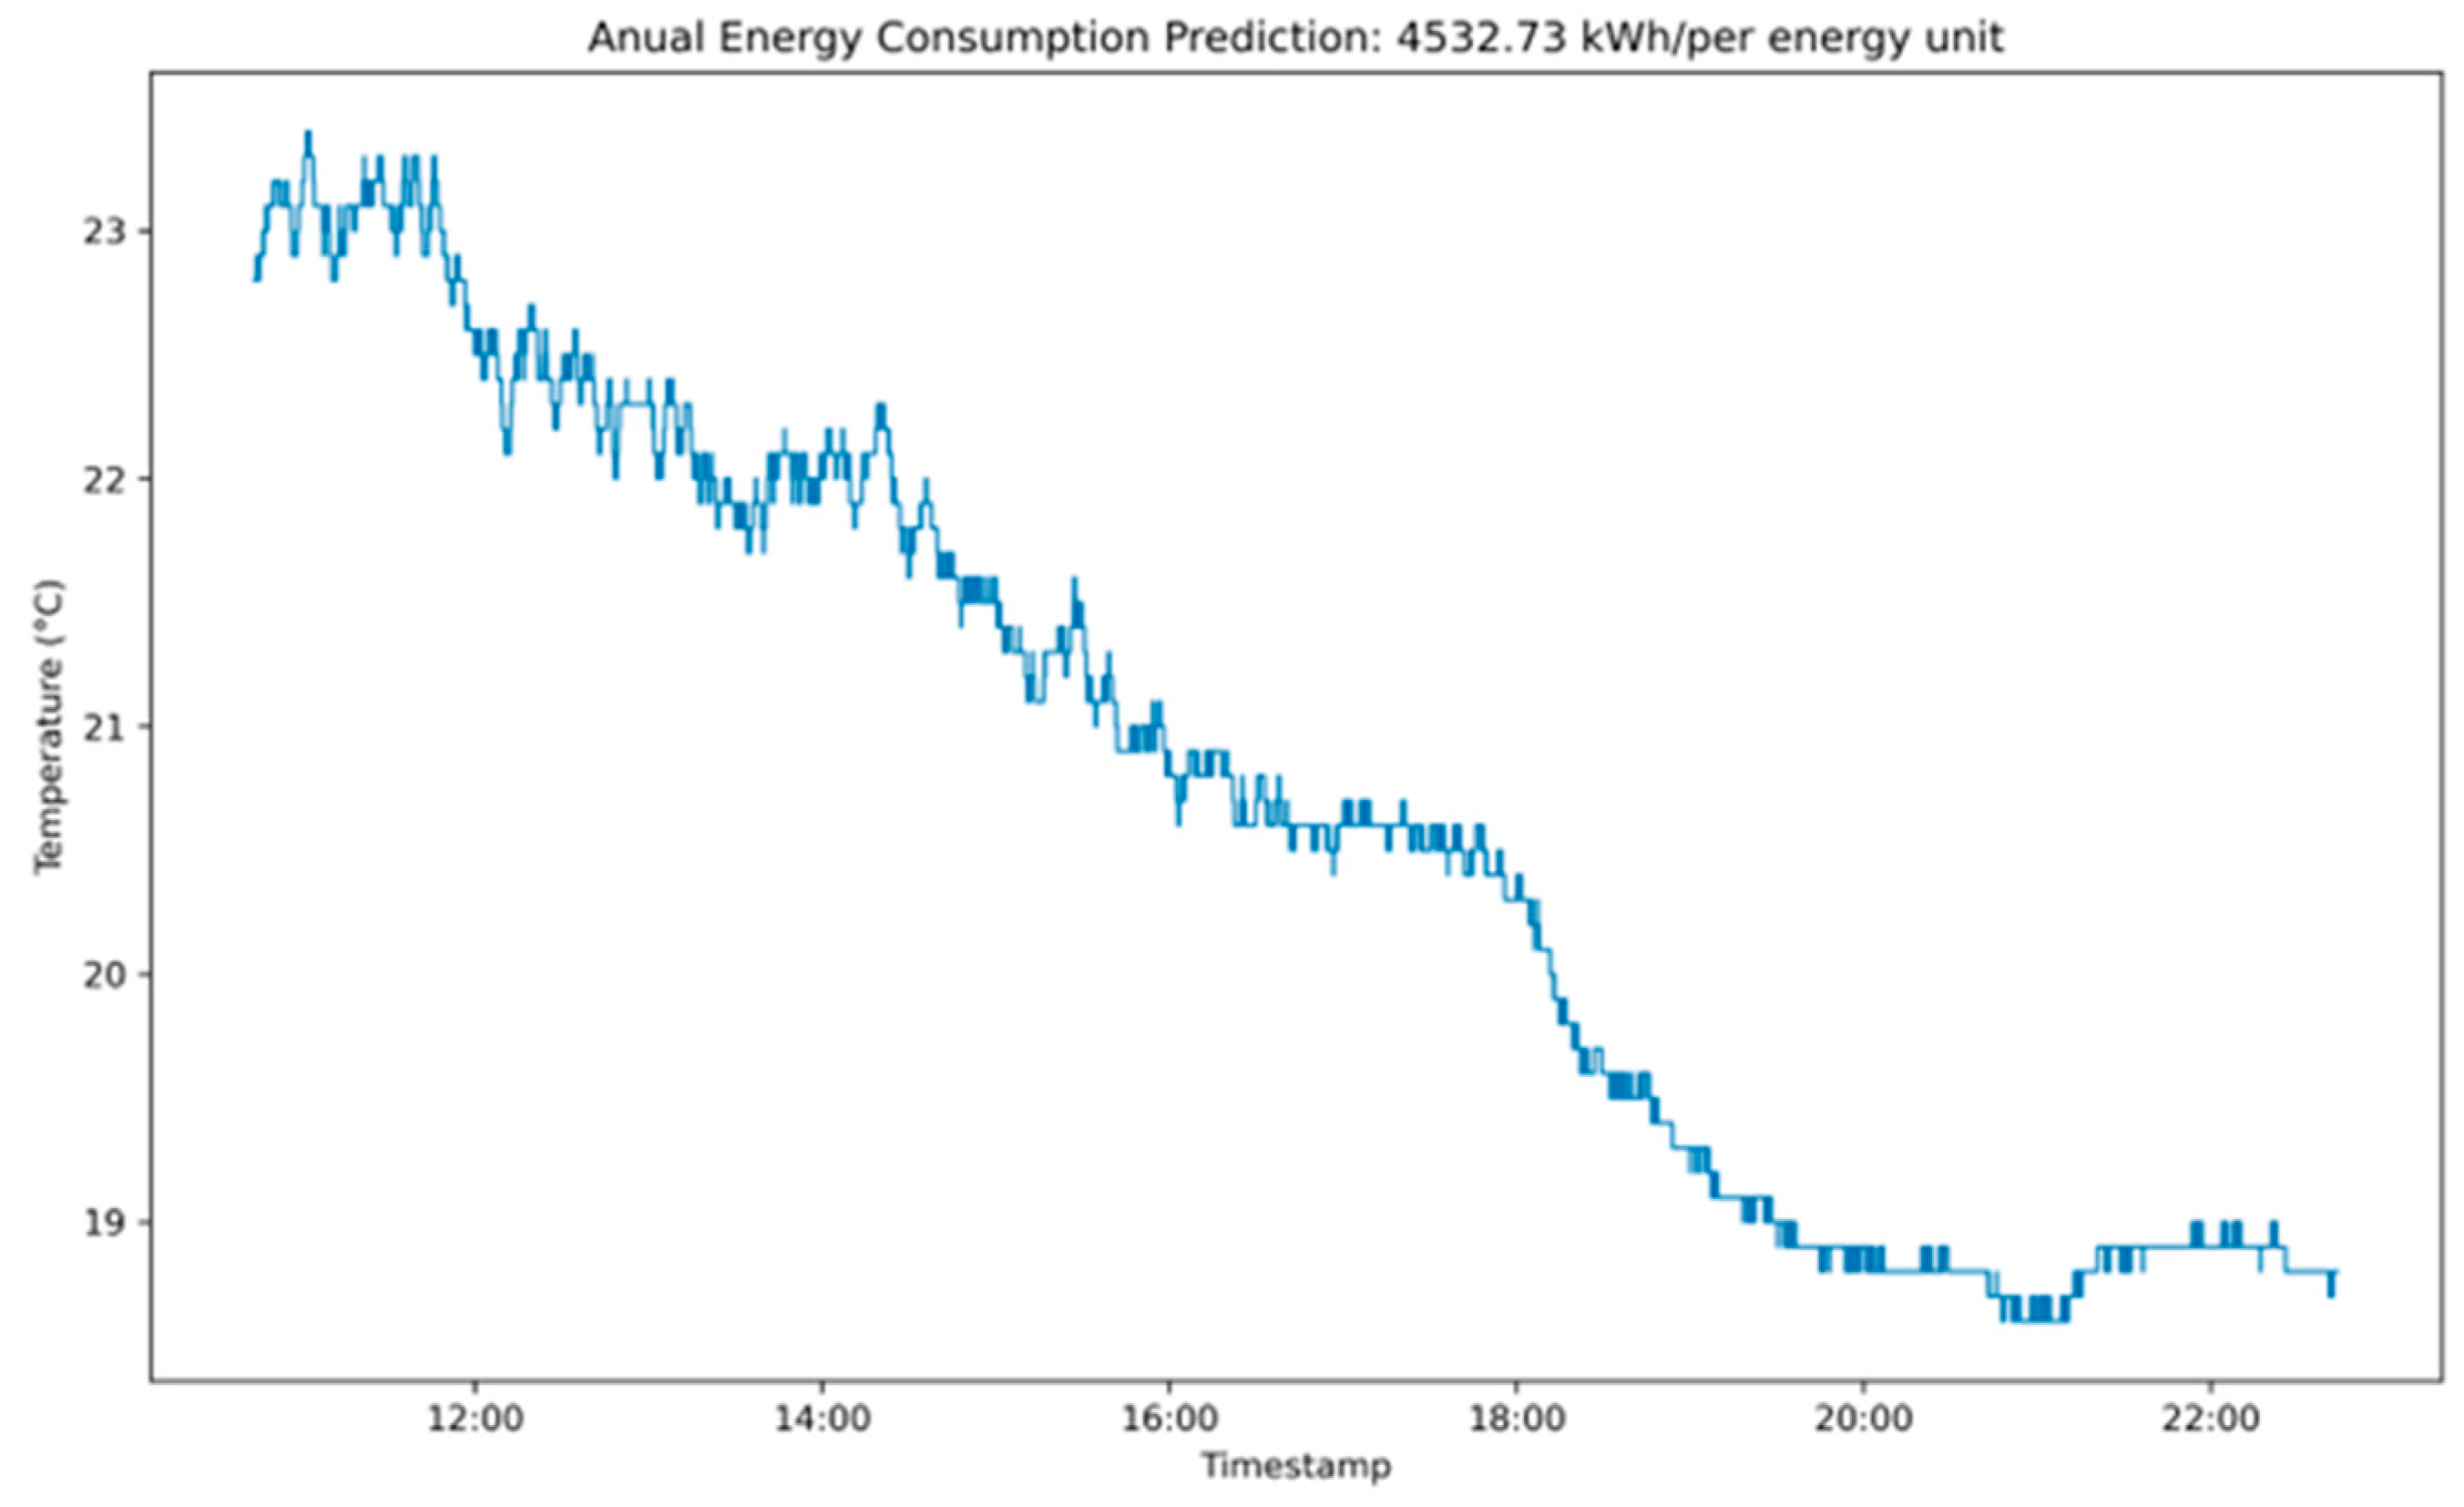
3.5.3. Simulation of Building Optimization System Based on Real-Time Temperature

With all collaborative adjustment factors and parameters set, the process of implementing the simulation of system behaviours can commence. Simulating system behaviour refers to the use of code to emulate actions. For instance, the code would print an observable instruction when the system indicates a need for window ventilation. The system would recognize this instruction as a genuine operation, subsequently managing the adjustment factors. In addition, adjustments to the energy consumption predictions for buildings are made using presumed comprehensive coefficients of cold and hot energy efficiency, along with the variations of adaptive adjustment factors.
Before the implementation of the simulation optimization system, several assumptions regarding input parameters need to be clarified:
  • For air conditioning systems, EER and COP are assumed to be 1.6 and 0.6 [54,55,56,57,58,59].
  • The additional light coefficient is assumed to be 0.9 [54,55,56,57,58,59,60].
  • These are average values for the entire building, based on the standard area (68.19 m2) determined by Energy Plus results.
  • The total power in the standard area is 2.5 kW, including air conditioning and LED lighting [54,55,56,57,58,59,60].
  • The annual optimal electricity consumption standard for the region is 5200 kWh (calculated based on 260 days multiplied by 8 h per day), which can be adjusted as needed.
  • The temperature data comes from the J03 building of the University of Sydney on October 8 and is assumed to be the real-time temperature within the system.
As shown in Figure 17, which is based on previous similar research [53], the system was built using Python code, and the initial EER was first fitted to the results from the EnergyPlus file to obtain a preliminary prediction of the building’s energy consumption. Then, using the algorithm-based energy model obtained previously, the resulting sigmoid regression equation is used to determine the area’s annual energy consumption (in kilowatt-hours) at the current temperature. This consumption is compared with the optimal energy standard of 5200 kWh in the next step. If the consumption is less, the calculation continues for further periods without changing the energy efficiency coefficient. If the electricity consumption exceeds 5200 kWh, energy-saving measures will be taken. This study assumes that window-opening behaviour is first considered. For each 1% increase in window opening, the EnergyPlus file results are refitted to obtain a new iterated sigmoid regression equation. Enter the current temperature again to see if the new forecast is less than optimal.
The cycle continues until the maximum window opening of 10% is reached. This shows that even if the windows are fully opened and the energy efficiency coefficient changes by 10%, energy consumption still exceeds the optimal standard.
Similar to window opening cycles, the system adjusts lighting intensity in an attempt to reduce energy consumption. Once the estimated energy falls below the optimal standard, the system exits this adjustment cycle and continues estimating energy consumption for the next period.
If the windows are opened and the lighting is not adjusted to optimal energy standards, the system will continue to operate at the current optimal energy efficiency factor.
Figure 18 and Figure 19 below show the algorithm prompts for two cases; the original code is provided in Appendix A.

4. Results

4.1. Processed Energy Simulation Results from EnergyPlus

Table 2 shows the preliminary processed raw data and Figure 20 visualised distribution of mean temperature simulated across different zones, ranging from 20 °C to 50 °C. The temperatures in the majority of zones are relatively warm, around 30 °C to 35 °C. Figure 20 comprehensively depicts the mean temperature profiles across a diverse array of zones, with the temperature spectrum extending from an astonishing 20 °C to a scorching 50 °C. Most of the zones within this range are warm, with mean temperatures predominantly clustering in the balmy 30 °C to 35 °C range, hinting at a general thermal comfort zone for these regions. A careful analysis of the distribution suggests that it closely emulates the bell-shaped curve typical of a normal distribution, indicating that the temperatures in most zones gravitate towards an average value. Despite this general tendency towards equilibrium, the figure reveals a distinct asymmetry with a gentle but persistent skew towards the higher end of the temperature scale. This is most apparent in the elongated tail reaching the right within the graphical representation.
Figure 21 meticulously maps out the mean relative humidity levels across different zones, showcasing a range from the arid low of 20% to the saturated peak of 100%. Many zones fall into the ideal humidity bracket of 40% to 60%, a range widely considered comfortable for indoor settings and conducive to a pleasant environment for the building’s occupants. A particularly noteworthy aspect of Figure 21 is the emergence of two distinctive bell-shaped curves within the distribution graph. This dual-peaked phenomenon signals a bimodal distribution, revealing the existence of two separate clusters of zones where the relative humidity diverges significantly.
Figure 22 provides a comprehensive analysis of energy usage across various zones, depicting a spectrum of consumption values spanning a modest 5000 kilowatt-hours (kWh) to a substantial 10,000 kWh. The data converges most frequently within the 8000 to 9000 kWh range, suggesting this is the typical energy consumption bracket for many zones. This concentration of energy usage data points towards a pronounced demand for power in these areas, reflecting higher activity levels, higher occupancy, or the utilization of energy-intensive equipment.

4.2. Linear Regression Analysis

The code utilized for the simulations that resulted in the outputs discussed in this section is available in Appendix A. This facilitates a thorough review of the computational methodology and enables the replication of the findings. Figure 23 represents a linear model that the empirical data from previous case studies on the ABS and Tyree buildings have informed. The adequacy of this model is observed to be confined to specific data points within the lower temperature range. This observation indicates a less-than-optimal fit for the entirety of the dataset, as the model does not generalize well across all observed temperatures. This constrained efficacy of the model, particularly at higher temperature values, underscores the challenges of relying on a simple linear approach for complex datasets. The current model may not be fully equipped to capture the diverse dynamics present within the data. Consequently, the findings suggest the necessity for a more sophisticated modeling technique that can accurately reflect the dataset’s breadth.
As depicted in Figure 24, a general trend is observable within the data points that suggest a decrease in energy consumption corresponding to an increase in relative humidity across most zones. However, it is noteworthy that several data points deviate from this overarching pattern. There is a discernible tendency for more dispersion of data points towards the left portion of the curve, indicating that this inverse relationship between humidity and energy consumption does not uniformly apply to all observed instances.
Figure 25 illustrates the interdependence between relative humidity and temperature within the zones, suggesting a complex interaction between these two variables. To streamline the focus of the analysis, the study will concentrate exclusively on the relationship between energy loads and the mean temperature of the zones. The figure shows a notable dispersion of data points, particularly in the humidity range of approximately 25 to 35 percent. This significant scattering indicates variability in how the energy loads correlate with mean temperatures when the relative humidity is within this bracket.
For mean temperature, combined with the scatter point, the sigmoid model is the best to fit the shape of the distribution of the scatters. The choice of the sigmoid model was inspired by McFadden’s contributions to traffic engineering [61]. As shown in Figure 26, the sigmoid model aligned with the scatters with the same trend and relatively small variations between scatters and fitting curves. The Mean Squared Error (MSE) of this model is 177,377, and the Coefficient of Determination ( R 2 ) is 0.88.

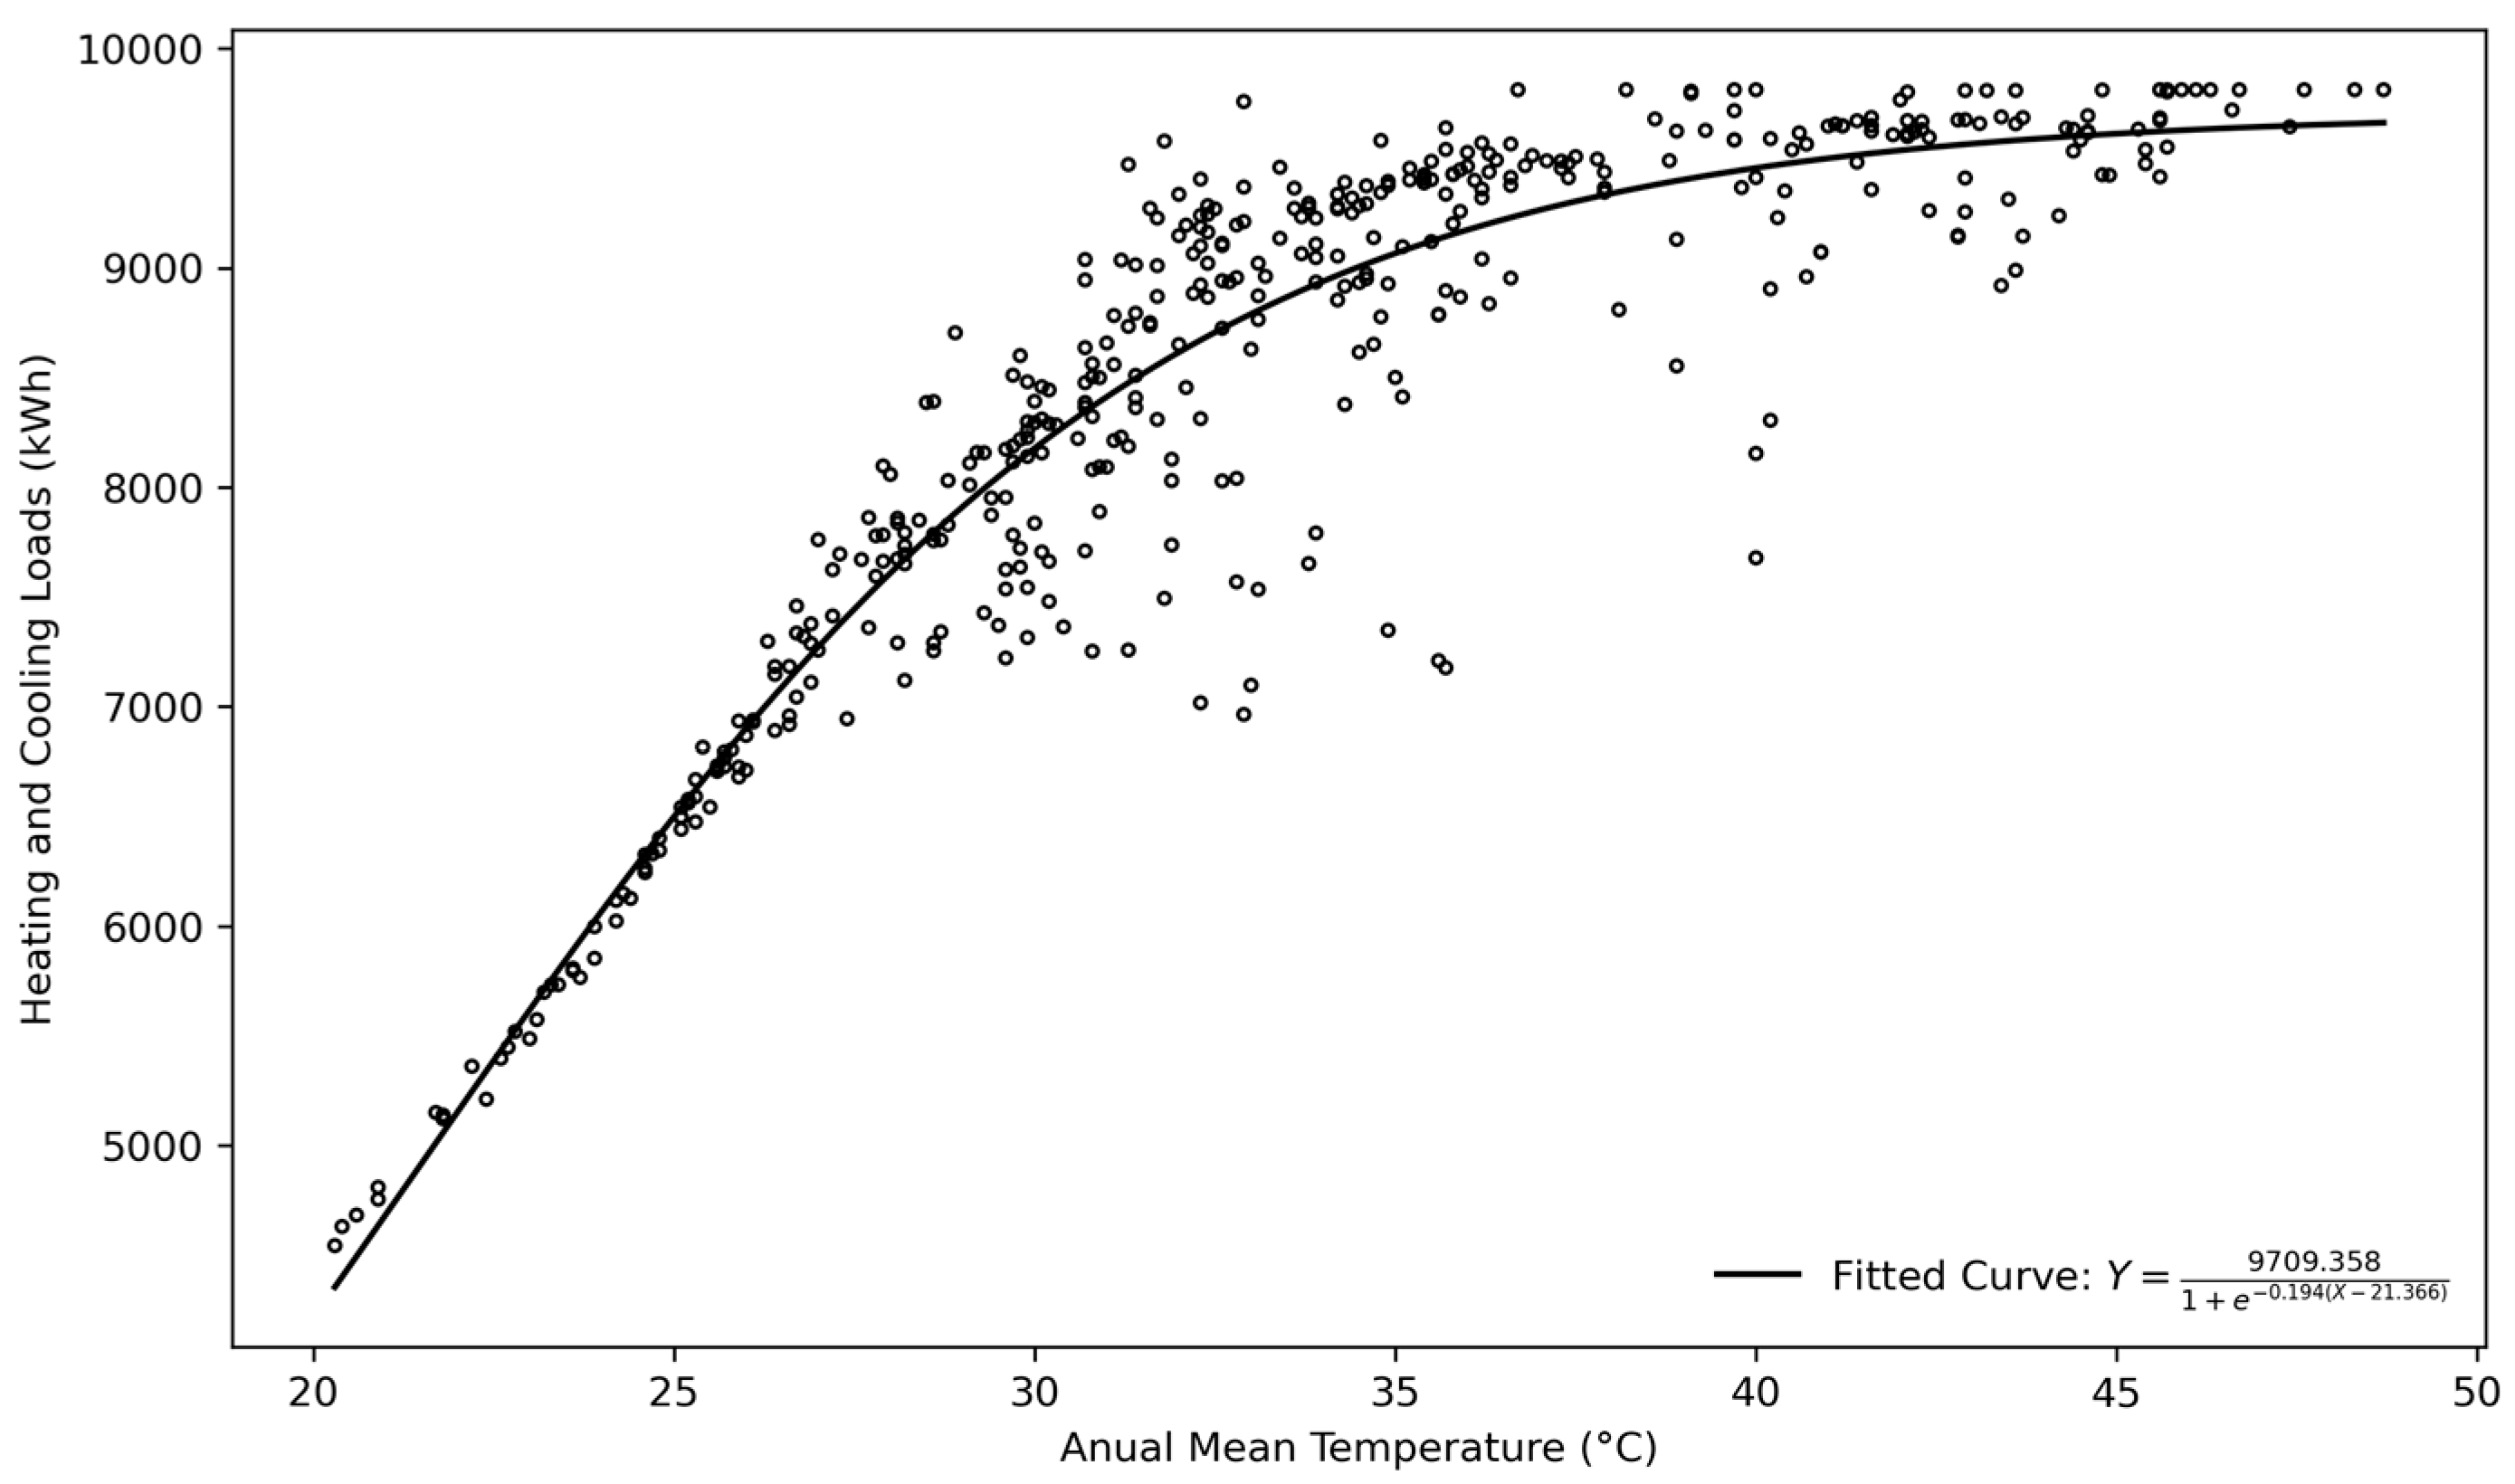
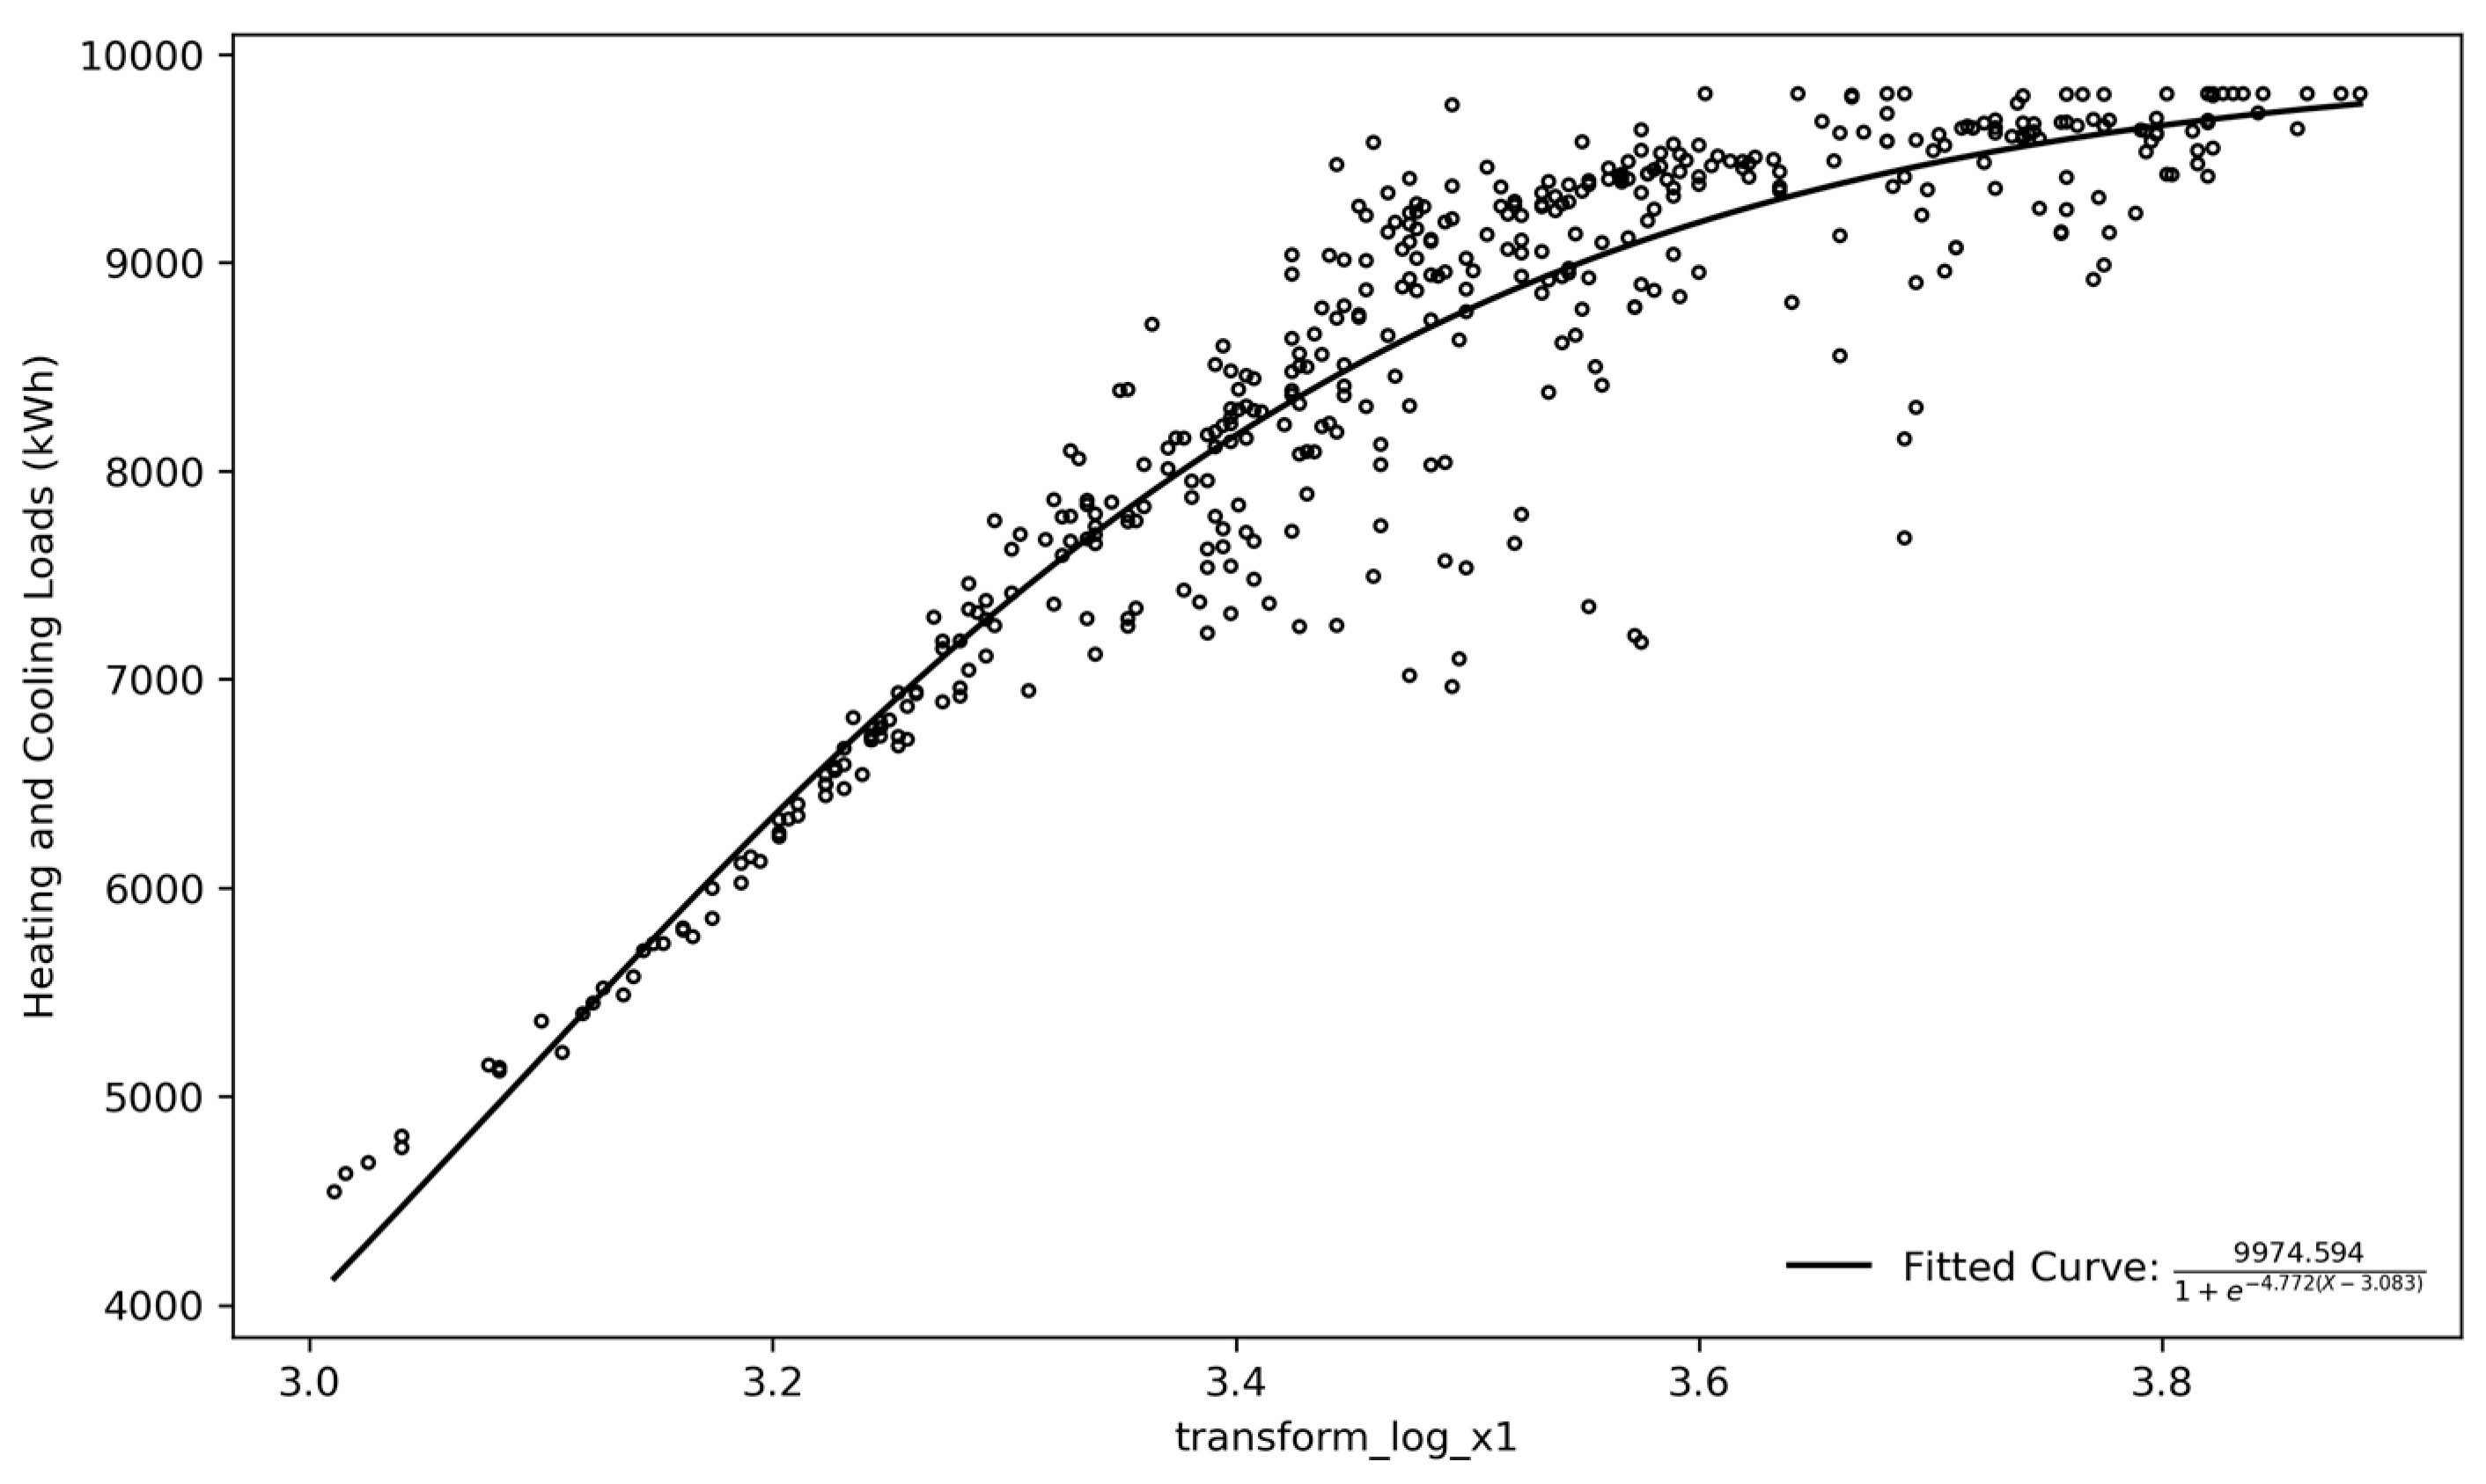
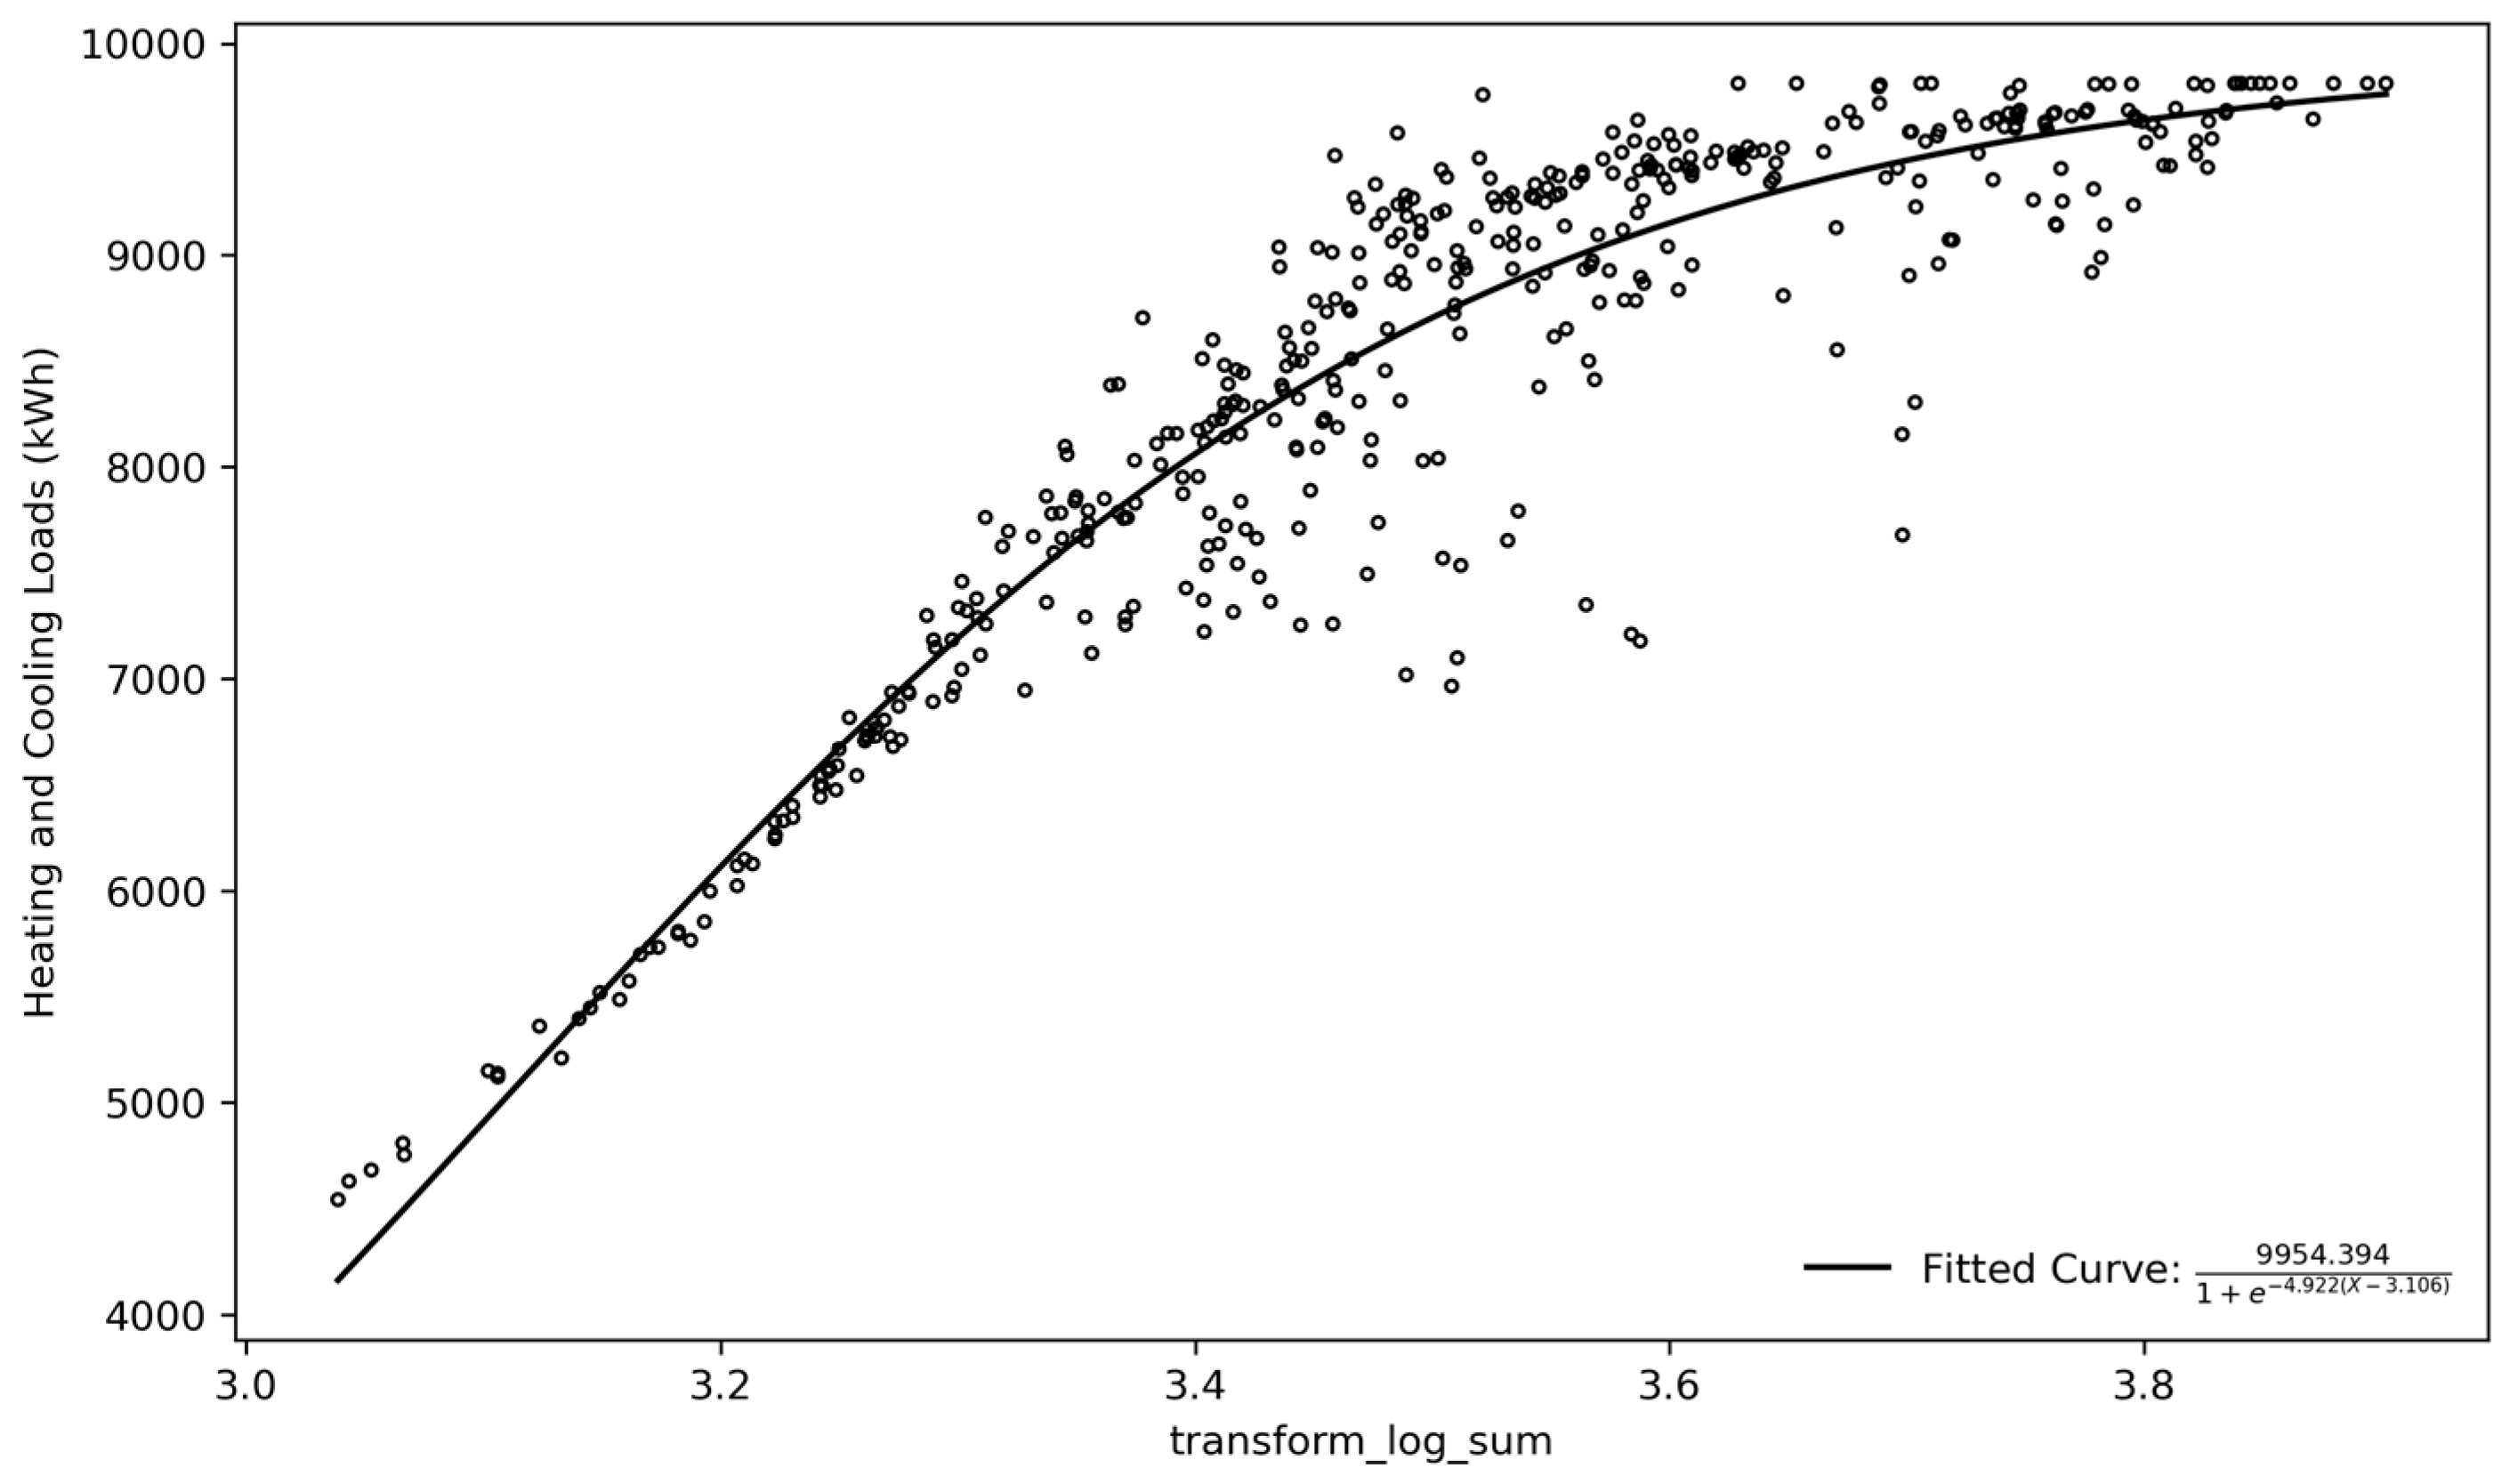
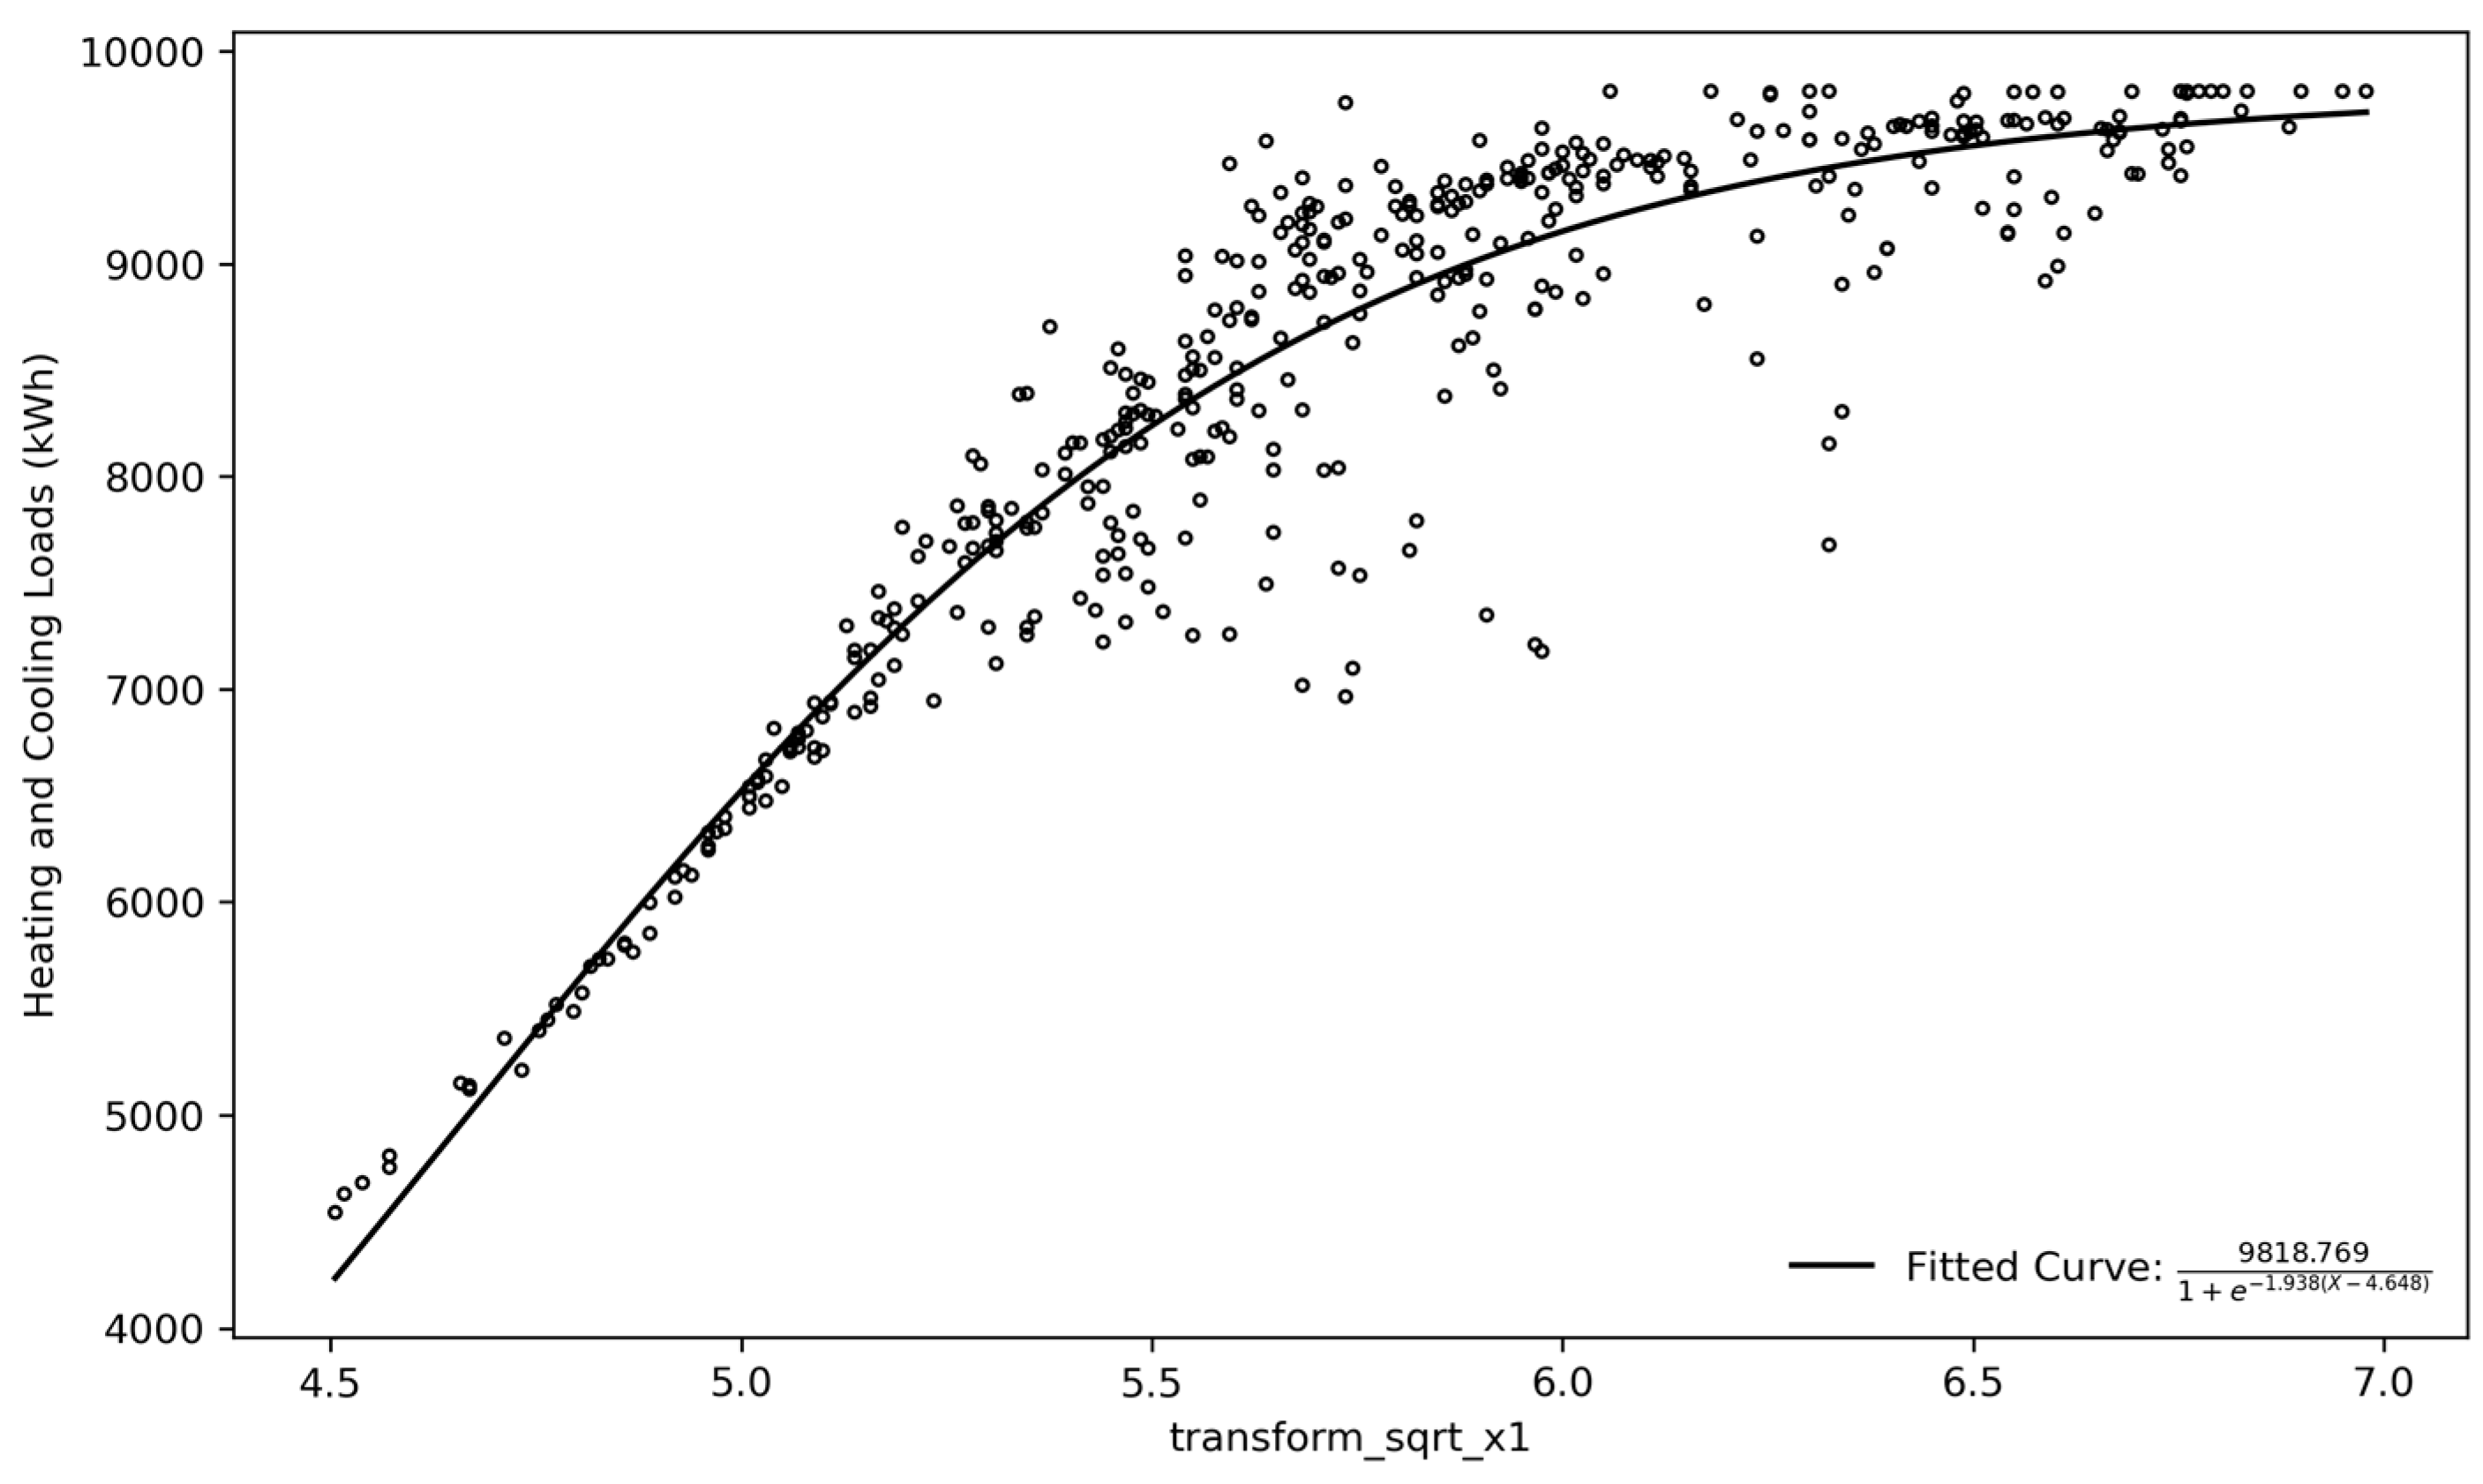
4.3. Sigmoid Model with Transformed Xs

This section further investigates building a better sigmoid model, where several transformed X values are tested.
With the notation for the variables to be:
X 1 = Mean temp.
X 2 = Mean humidity.
Y = Energy consumption.
Table 3 shows the results of these sigmoid models for energy consumption related to the transformed Xs. With the smallest value of MSE and the largest R 2 , the original model is the best among all models. Thus, no transformed X could be reached for a better model. Figure 27, Figure 28, Figure 29 and Figure 30 show the visualization of these models, in general, all with a reasonably well-fitting pattern.

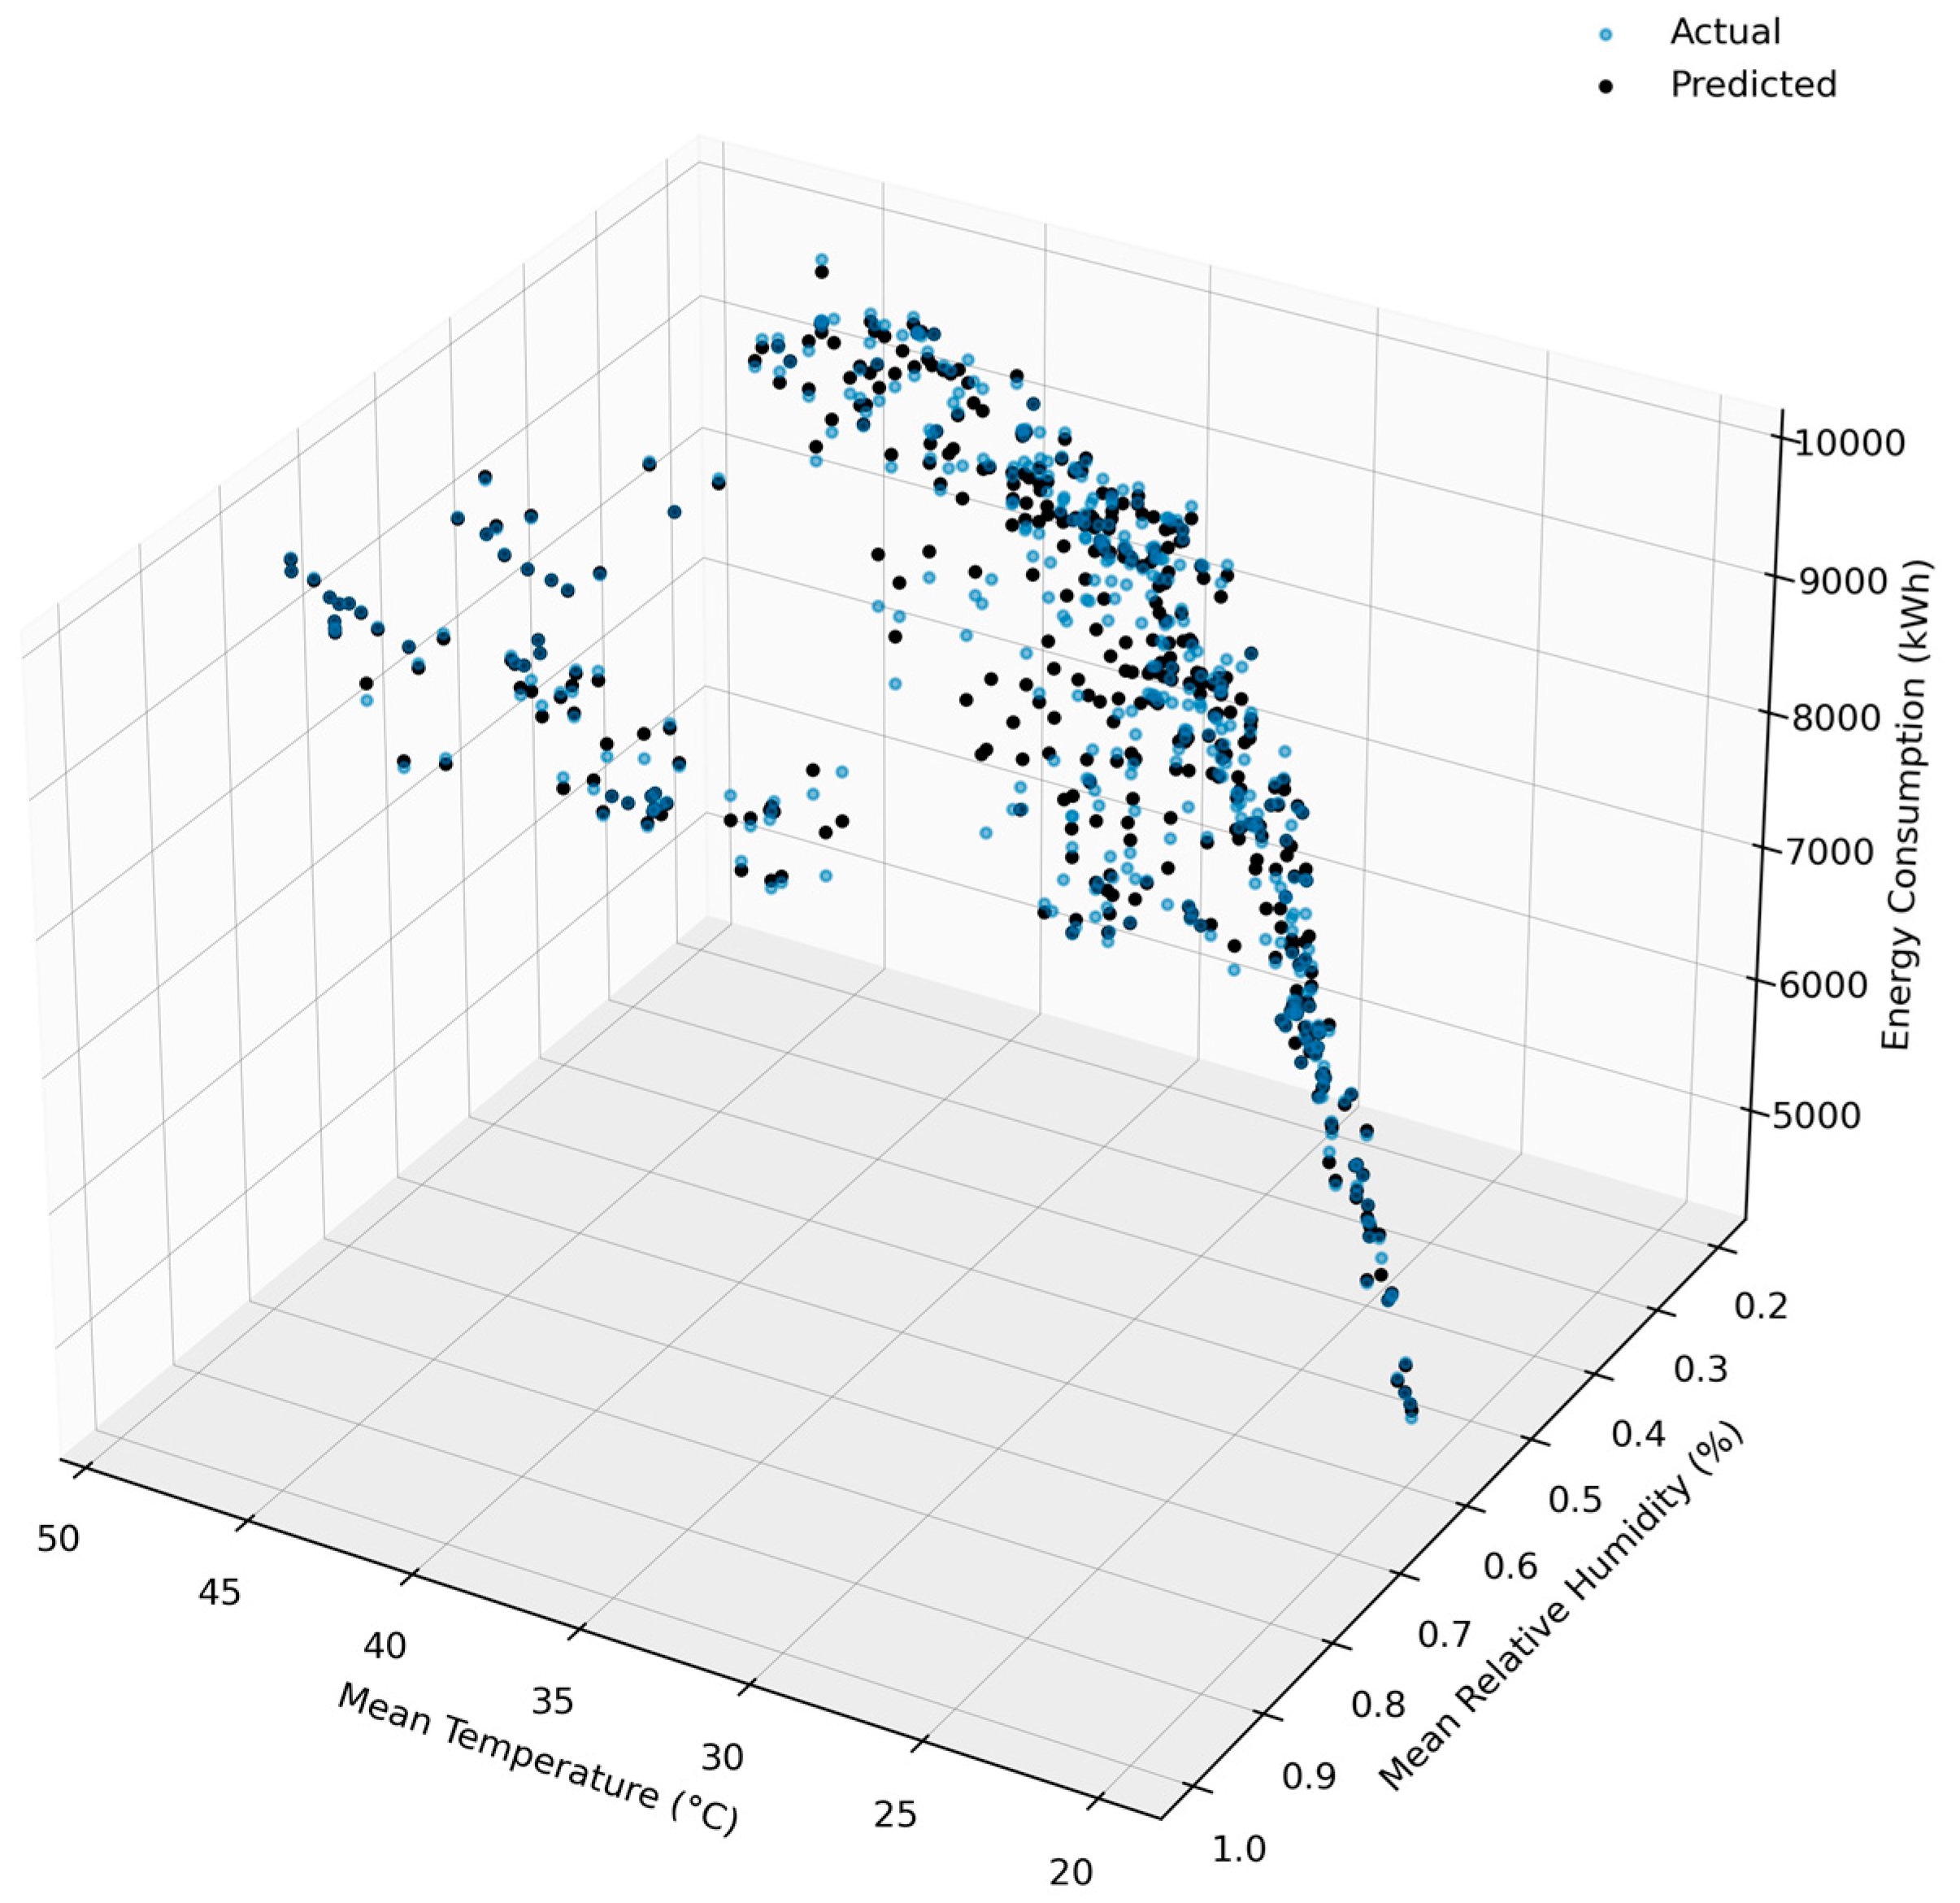
4.4. Random Forest Regression Model

As demonstrated in Figure 31, the outcomes of the Random Forest model, which incorporates mean temperature and relative mean humidity as independent variables to predict the dependent variable of energy consumption, are presented. The congruence between the actual data points and those predicted by the model is visually apparent, as they exhibit parallel trends and undulate in a closely matched pattern.

4.5. Regression Models Comparison

Table 4 summarizes the three models, linear, sigmoid, and RF. The sigmoid model is preferred with the larger R square value, smaller mean square error, AIC, and BIC values, which indicates good fitness without over fitness. Therefore, the sigmoid model is adopted into the real-time simulation [61] with a function of:
E = 9709 1 + e 0.194 m e a n   t e m p 21.4

4.6. DTModels

The Python code utilized for the analysis and modelling in this section is included in Appendix A for reference and further exploration. Figure 32 and Figure 33 depict the real-time outputs from sensors captured and processed using Python for data handling and visualization purposes. These figures represent a continuous 12-h monitoring period, during which sensor data was collected from various locations around the J03 building in an outdoor setting.
Figure 34 depict the variations in predicted energy consumption under different energy constraints over various time periods, illustrating that variable energy limits significantly influence the system’s simulated adaptive behaviour as it interfaces with the building. With an energy limit set at 5200 kWh, there is a pronounced initial reduction in building energy consumption through the transmission of commands to lower the energy efficiency coefficient, leading to a noticeable decrease in energy usage. The magnitude of reduction percentages over different short periods is also similar, demonstrating that under the control of the system with a 5200-kWh limit, energy consumption consistently stays below the baseline from midnight to 7 a.m.
To probe the system’s limitations, Figure 34 simulates operations with energy inputs of 9000. Under a 9000-kWh limit, the system maintains consumption below the baseline for half of the time (12 h). Compared to different energy limits, the system only acts according to the baseline; if the consumption is below this threshold, the system opts not to issue any commands for simulated building behaviours. Additionally, each figure features a period where the simulated energy consumption coincides with the baseline, indicating the system’s continuous adaptive changes to keep building energy within the standard range. With a higher threshold, predicted energy consumption may never exceed the standard, suggesting that exploring how to ensure efficient building operation within energy constraints is worthwhile, particularly the variation of energy standards.

5. Discussion

5.1. Significance and Limitation

This research primarily explores the practical uses of Digital Twin (DT) technology in building energy management. The study aims to reveal a novel concept that utilizes a dual-simulation strategy, combining software and algorithmic simulations for enhanced analysis. We developed an initial DT model rooted in the results of software simulations, which selectively integrates different data types to optimize the processing of real-time thermal information. This initial model can make early predictions about energy usage across various building sections. Moreover, it establishes basic controls for energy saving in DT systems by harnessing live temperature and humidity data.
This approach encourages the early implementation of Digital Twin (DT) technology in a building’s lifecycle, promoting a fluid transition to advanced phases through Building Information Modeling (BIM). Such an integrated process is essential, particularly for new constructions or existing buildings requiring enhanced intelligent features [8]. The methodology is incredibly influential for new constructions and buildings in transition during the critical energy evaluation and model development phases. Despite facing numerous challenges, the primary aim persists in improving the precision of an established prediction model, a goal that aligns with findings from related research [62].
This research acknowledges limitations, including reliance on default EnergyPlus configurations, a lower resolution in the modeling detail, and a constrained evaluation of the impact on integral building systems such as HVAC. This is a common challenge that parallels issues encountered in prior studies concerning model parameters within the software [63]. Even though EnergyPlus provides a vast selection of modifiable parameters, including detailed choices for constructing materials, mapping out occupant movements, setting operational timings, and outlining system blueprints, the research primarily relied on the built-in default settings. Therefore, these presets may not fully capture the building’s unique features and situational dynamics.
Moreover, translating a geometric model into an energy model can introduce inaccuracies that skew the simulation results away from real-world conditions [64,65,66]. Interoperability challenges frequently surface between Revit and EnergyPlus, with the latter sometimes incapable of acknowledging and replicating certain elements transferred from Revit. Such discrepancies further compound the uncertainty inherent in the model.
Additionally, this research treats the building’s overall energy consumption as the aggregate of the energy expended by its individual, discrete spaces, overlooking the synergistic nature of real-world HVAC systems within a building. As a result, the insights gleaned from this study should be seen as a broad outline rather than a tool for detailed analysis of a building’s energy use [48,49,50,51,52,53,54,55,56,57,58,59].
Another limitation is that the establishment of parameters is guided by assumptions rather than concrete reality, which affects simulation accuracy. Except for energy models and weather data, most input parameters use EnergyPlus’s default settings, so simulation results may appear overly ideal. This idealization manifests itself in an apparent S-shaped regression in the data. With actual data to refer to, it becomes easier to assess the veracity of simulation results. Another example is the assumption of EER and COP values and the adjustment factor assumed during DT adjustment. By obtaining more accurate and detailed parameters, this approach to modelling may significantly improve its accuracy in predicting energy consumption and the effectiveness of energy-saving adjustments. Indeed, the model’s basic concepts and structure hold great potential.

5.2. Comparison of the Regression Models

The study predicts energy consumption based on simple variables, such as average temperature and humidity. The sigmoid model appears the most efficient in this dataset, exhibiting the highest R 2 value and the lowest mean square error (MSE), closely followed by the Random Forest model. The linear model is not suitable for capturing the reality.
The merit of the Sigmoid model is attributed to its ability to accurately reflect real-world energy consumption patterns, particularly temperature variations. It should be clarified that while the Sigmoid model is preferred for its simplicity and faster simulation speed, especially in real-time simulations, the Random Forest model might be better suited for larger, more complex datasets despite its more extended training and simulation times.
Compared to the two case studies mentioned in Section 2.4, the results of those two studies might offer more precision for practical energy consumption predictions due to their specificity.

5.3. Simulated Adaptive System Limitations

Adaptive systems are the critical elements proposed in this study to predict and respond to changes in the built environment. By taking only air conditioning and lighting systems into account, the current simplified model shows clear limitations in capturing the complex internal dynamics of a building. The model’s prediction ability and response accuracy are limited, and it lacks more flexible energy constraints, so it cannot sufficiently reflect actual energy usage. When considering changes in energy demand during peak and off-peak periods, the model should optimize energy allocation to reduce the energy burden during peak periods.
Given the significant decline in energy consumption, the existing adjustment factor formula needs to be re-evaluated, and a more detailed adjustment mechanism needs to be introduced. In addition, existing models need more practical feedback mechanisms to verify the effect of system optimization measures, which means that current adaptive systems may not ensure the effectiveness of their prediction and control measures. Effective adaptive systems should be based on precise feedback and control strategies. This requires improvements to existing models and the establishment of a robust feedback loop between simulation and actual operation to ensure that the system can adjust and optimize its performance in real time.

5.4. Implications of Energy Efficiency and Management

The primary impact of the DT in the energy sector is the optimization of Building Energy Performance. As demonstrated in this case study, energy consumption can be predicted in real time by DT measures, providing insights into necessary measures to be taken and thereby facilitating more informed decisions for energy management. The real-time functionality is also crucial for ensuring efficient energy use that adapts to dynamic environmental conditions [67,68]. It will benefit management if the model can be calibrated with real-time data to improve accuracy.
Regarding the simple dynamic adjusting system we proposed, the automated measures taken can be integrated to reduce energy consumption immediately, resulting in better building operation and maintenance [69,70].
These advantages all support our sustainable design, and the proposed method can help devise effective strategies to tackle global energy challenges [71].

5.5. Future Direction

The research presented in the study proposes adaptive changes aimed at reducing energy consumption, which serves as a simplified reference model. Future applications can build on this by devising various adaptive changes tailored to different building conditions. The following are some potential directions for future research.

5.5.1. Based on Environmental Changes

A more realistic approach to environmental changes is monitoring external factors such as wind speed and direction, which can influence a building’s ventilation needs and heat load. In addition, the temperature difference between indoor and outdoor spaces also needs to be considered when establishing the system because it is directly related to the building’s insulation performance and the operating efficiency of the heating and cooling system. Some further considerations may include the distribution of sunlight within the area and the orientation of windows in the building area.
The Internet of Things is essential for considering these realities more comprehensively. It enables monitoring and responding to real-time changes in environmental conditions by deploying more sensors and more sophisticated control systems within buildings. Applying intelligent control algorithms to optimize the response of HVAC systems can more comprehensively include various environmental parameters to ensure comfort while maximizing energy savings.

5.5.2. Based on Occupancy Monitoring

Occupancy monitoring plays a pivotal role in the energy management of sizeable commercial structures, where the utilization of space ebbs and flows with the movement of patrons and staff. Tailoring energy consumption to align with the patterns of human activity serves as a potent conservation tactic. In these contexts, cameras and sensors distributed throughout the premises can gauge the concentration of occupants and modulate energy consumption in response. For instance, lighting and HVAC systems may be programmed to deactivate in the absence of individuals or scale back their energy draw during sparse occupancy. Leveraging computer vision technologies such as OpenCV, in tandem with surveillance infrastructure, enables the real-time monitoring of human movement, paving the way for intelligent energy management across various zones. Such a system significantly boosts energy efficiency, adapts to immediate needs, curtails superfluous energy consumption, and presents a sustainable, economically viable energy management blueprint for expansive commercial edifices. Control flow based on this paradigm is depicted in Figure 35 below.

5.5.3. Zone by Zone Control: Enhancing Building Energy Efficiency

Leveraging insights from population flows and environmental shifts, enhanced building energy management systems can be developed by segmenting internal spaces based on their functionality and usage profiles. Adaptive control strategies customized to the particularities of each space allow for delineating distinct areas—ranging from offices and conference rooms to break areas and thoroughfares—each with their specific energy needs and patterns of use. This strategic zoning ensures that energy consumption is precisely aligned with each zone’s actual activity and requirements [17,19,24]. This zoning strategy enables finely tuned optimization of energy use, custom-fitted to the demands of each section within the building. For example, areas with lower foot traffic see an automatic reduction in lighting and climate conditioning, conserving energy. Conversely, in high-traffic zones, adjustments are seamlessly made in real time to maintain harmony between conserving energy and providing a comfortable environment [45,46,47,48,49,50,51,52,53,54,55,56,58,59].
Machine learning technology can be harnessed to significantly enhance intelligence by crafting sophisticated control strategies. In real-world scenarios, reinforcement learning algorithms are subject to ongoing training and refinement, enabling them to adjust to evolving environmental factors and variations in occupancy. Take automated HVAC systems as an illustration; they track external temperatures, humidity levels, indoor CO2 levels, and room occupancy, all to ascertain the most effective operating plan. Such a strategy elevates energy conservation and ensures a comfortable indoor environment [33,34,45,46,47,48,49,50,51,52,53,54,55,56,57,58,59].
The agent garners positive reinforcement by adapting its behavior through a feedback loop, with energy inefficiency or diminished environmental quality incurring negative repercussions. These rewards guide the agent in perpetually refining its strategic approach towards optimization. As a result, the agent progressively master’s more nuanced and efficient HVAC control strategies, contributing to energy savings, lowering usage, and augmenting the comfort of residential and commercial interiors. Furthermore, it formulates a unique energy usage profile for the building, predicting forthcoming demand shifts and facilitating a more tailored, focused, and accurate approach to energy stewardship [51,52,53,54,55].

6. Conclusions

This research melds established energy simulation tools with cutting-edge digital technologies to investigate strategies for bridging the gap in implementing the Digital Twin (DT) concept. The potential of the DT approach can be expanded to refine the forecasting and governance of building energy performance.
The outcomes of energy consumption and Digital Twin simulations are utilized chiefly as benchmarks rather than precise energy use measures. This investigation is based on numerous presumed and cited parameters and equations that are both limited and imprecise, thus providing limited practical utility for the accurate energy forecasting of this building. The primary aim is to delve into the possibilities for Digital Twin applications, not to ascertain exact energy consumption figures. As a preliminary endeavour, the research recognizes the presence of potential inaccuracies and looks forward to enhancing the precision of parameters and the strength of simulation models in future work.
The research underscores the fusion of conventional energy simulation software with modern, data-driven algorithmic techniques. While the approach is forward-thinking, the study encounters challenges mainly related to the accuracy concerns inherent to both methodologies. Nevertheless, the Sigmoid regression model emerges as a promising tool for energy modelling due to its precision and forecasting proficiency, which aligns well with the data at hand.
Improvement avenues for the DT framework in energy management include more rigorous calibration using actual data to improve precision. An essential advancement is the integration of environmental responsiveness through the real-time tracking of variables like wind and temperature changes via IoT technologies. Moreover, analysing human movement patterns through camera systems can lead to dynamic modifications in energy consumption, scaling down supply in times of lower occupancy, and deactivating systems in vacant spaces. Implementing zone-specific controls allows DT systems to tailor energy management to distinct areas within a building, considering their usage and unique attributes. This study lays the groundwork for incorporating DT technology into architectural energy management. Nevertheless, continued research is imperative to surmount the current limitations and elevate the precision and adaptability of the model. Advancements in this field hold the potential to markedly boost energy efficiency and slash operational expenditures in the management of buildings.

Author Contributions

Conceptualization, F.T., L.L., S.W. and Y.K.; methodology, F.T., L.L., S.W. and Y.K.; Validation F.T., L.L., S.W. and Y.K.; formal analysis, F.T., L.L., S.W. and Y.K.; investigation, F.T., L.L., S.W. and Y.K.; data curation, F.T., L.L., S.W. and Y.K.; Significant knowledge and interpretation: F.T., L.L., S.S. and Y.K.; Writing: F.T., L.L., S.S. and Y.K.; supervision, F.T.; funding acquisition, F.T. All authors have read and agreed to the published version of the manuscript.

Funding

This research received no external funding.

Data Availability Statement

The original contributions presented in the study are included in the article, further inquiries can be directed to the corresponding author.

Acknowledgments

The author extends gratitude to N. Jayasooriah, Technical Support Officer at the University of Sydney, for providing valuable drawings and information for proposed modeling at the early stages of this project.

Conflicts of Interest

The authors declare no conflicts of interest.

Appendix A

Figure A1. Python Code for DT Framework Model (Section 3.5).
Buildings 14 01774 g0a1
Figure A2. Python Code for the Regression Models—Part 1 (Section 4.2).
Buildings 14 01774 g0a2
Figure A3. Python Code for the Regression Models—Part 2 (Section 4.2).
Buildings 14 01774 g0a3
Figure A4. Python Code for the Regression Models—Part 3 (Section 4.2).
Buildings 14 01774 g0a4
Figure A5. Python Code for the Regression Models—Part 4 (Section 4.2).
Buildings 14 01774 g0a5
Figure A6. Python Code for DTModels—Part 1 (Section 4.6).
Buildings 14 01774 g0a6
Figure A7. Python Code for DTModels—Part 2 (Section 4.6).
Buildings 14 01774 g0a7

References

  1. Lu, C.; Li, S.; Lu, Z. Building energy prediction using artificial neural networks: A literature survey. Energy Build. 2022, 262, 111718. [Google Scholar] [CrossRef]
  2. GhaffarianHoseini, A.; Dahlan, N.D.; Berardi, U.; GhaffarianHoseini, A.; Makaremi, N.; GhaffarianHoseini, M. Sustainable energy performances of green buildings: A review of current theories, implementations and challenges. Renew. Sustain. Energy Rev. 2013, 25, 1–17. [Google Scholar] [CrossRef]
  3. Kumaraswamy, M.M.; Hewa Welege, N.M.; Pan, W. Accelerating the delivery of low-carbon buildings by addressing common constraints: Perspectives from high-rise, high-density cities. Buildings 2023, 13, 1455. [Google Scholar] [CrossRef]
  4. Pan, Y.; Zhu, M.; Lv, Y.; Yang, Y.; Liang, Y.; Yin, R.; Yang, Y.; Jia, X.; Wang, X.; Zeng, F.; et al. Building energy simulation and its application for building performance optimization: A review of methods, tools, and case studies. Adv. Appl. Energy 2023, 10, 100135. [Google Scholar] [CrossRef]
  5. Liu, Z.; Zhang, X.; Sun, Y.; Zhou, Y. Advanced controls on energy reliability, flexibility and occupant-centric control for smart and energy-efficient buildings. Energy Build. 2023, 297, 113436. [Google Scholar] [CrossRef]
  6. Zhou, P.; Lv, Y.; Wen, W. The low-carbon transition of energy systems: A bibliometric review from an engineering management perspective. Engineering 2023, 29, 147–158. [Google Scholar] [CrossRef]
  7. Jafari, M.; Kavousi-Fard, A.; Chen, T.; Karimi, M. A review on digital twin technology in smart grid, transportation system and smart city: Challenges and future. IEEE Access 2023, 11, 17471–17484. [Google Scholar] [CrossRef]
  8. Nguyen, T.D.; Adhikari, S. The role of bim in integrating digital twin in building construction: A literature review. Sustainability 2023, 15, 10462. [Google Scholar] [CrossRef]
  9. Sepasgozar, S.M.E.; Khan, A.A.; Smith, K.; Romero, J.G.; Shen, X.; Shirowzhan, S.; Li, H.; Tahmasebinia, F. Bim and digital twin for developing convergence technologies as future of digital construction. Buildings 2023, 13, 441. [Google Scholar] [CrossRef]
  10. Pan, Y.; Zhang, L. Integrating bim and ai for smart construction management: Current status and future directions. Arch. Comput. Methods Eng. 2023, 30, 1081–1110. [Google Scholar] [CrossRef]
  11. Rahman, H.; Shah, U.M.; Riaz, S.M.; Kifayat, K.; Moqurrab, S.A.; Yoo, J. Digital twin framework for smart greenhouse management using next-gen mobile networks and machine learning. Future Gener. Comput. Syst. 2024, 156, 285–300. [Google Scholar] [CrossRef]
  12. Phillip, D.; Chen, J.; Maksakuli, F.; Ruci, A.; Sturdivant, E.e.; Zhu, Z. Improving Building Energy Efficiency through Data Analysis; Association for Computing Machinery: New York, NY, USA, 2023. [Google Scholar]
  13. Kineber, A.F.; Singh, A.K.; Fazeli, A.; Mohandes, S.R.; Cheung, C.; Arashpour, M.; Ejohwomu, O.; Zayed, T. Modelling the relationship between digital twins implementation barriers and sustainability pillars: Insights from building and construction sector. Sustain. Cities Soc. 2023, 99, 104930. [Google Scholar] [CrossRef]
  14. de Moura Scortegagna, E.; Martins, N.; Lamberts, R. Can we trust building energy performance models’ results? In Proceedings of the 18th International IBPSA Building Simulation, Shanghai, China, 4–6 September 2023. [Google Scholar]
  15. Bâra, A.; Oprea, S. Enabling coordination in energy communities: A Digital Twin model. Energy Policy 2023, 184, 1–21. [Google Scholar] [CrossRef]
  16. Kaghembega, W.S.-H.; Chen, S.; Tchewafei, A.; Jiang, K.; Yingying, L. Evaluation of environmental impact and GHG emission with energy system modeling combined with LCA in building sector: A review. E3S Web Conf. 2023, 433, 02001. [Google Scholar] [CrossRef]
  17. Shirowzhan, S.; Sepasgozar, S.M.E.; Edwards, D.J.; Li, H.; Wang, C. BIM compatibility and its differentiation with interoperability challenges as an innovation factor. Autom. Constr. 2020, 112, 103086. [Google Scholar] [CrossRef]
  18. Durdyev, S.; Dehdasht, G.; Mohandes, S.R.; Edwards, D.J. Review of the building information modelling (Bim) implementation in the context of building energy assessment. Energies 2021, 14, 8487. [Google Scholar] [CrossRef]
  19. Khasreen, M.M.; Banfill, P.F.G.; Menzies, G.F. Life-cycle assessment and the environmental impact of buildings: A review. Sustainability 2009, 1, 674–701. [Google Scholar] [CrossRef]
  20. Hilpert, S.; Kaldemeyer, C.; Krien, U.; Günther, S.; Wingenbach, C.; Plessmann, G. The Open Energy Modelling Framework (Oemof)—A new approach to facilitate open science in energy system modelling. Energy Strategy Rev. 2018, 22, 16–25. [Google Scholar] [CrossRef]
  21. Pfenninger, S.; Hawkes, A.; Keirstead, J. Energy systems modeling for twenty-first century energy challenges. Renew. Sustain. Energy Rev. 2014, 33, 74–86. [Google Scholar] [CrossRef]
  22. Asadi, S.; Amiri, S.S.; Mottahedi, M. On the development of multi-linear regression analysis to assess energy consumption in the early stages of building design. Energy Build. 2014, 85, 246–255. [Google Scholar] [CrossRef]
  23. Olu-Ajayi, R.; Alaka, H.; Owolabi, H.; Akanbi, L.; Ganiyu, S. Data-driven tools for building energy consumption prediction: A review. Energies 2023, 16, 2574. [Google Scholar] [CrossRef]
  24. Liu, C.; Zhang, P.; Xu, X. Literature review of digital twin technologies for civil infrastructure. J. Infrastruct. Intell. Resil. 2023, 2, 100050. [Google Scholar] [CrossRef]
  25. Liu, X.; Ding, Z.; Li, X.; Xue, Z. Research progress, hotspots, and trends of using bim to reduce building energy consumption: Visual analysis based on wos database. Int. J. Environ. Res. Public Health 2023, 20, 3083. [Google Scholar] [CrossRef]
  26. Gupta, R.; Mathur, J.; Garg, V. Assessment of climate classification methodologies used in building energy efficiency sector. Energy Build. 2023, 298, 113549. [Google Scholar] [CrossRef]
  27. Anand, A.; Deb, C. The potential of remote sensing and GIS in urban building energy modelling. Energy Built Environ. 2023, 5, 957–969. [Google Scholar] [CrossRef]
  28. Li, F.; Wan, Z.; Koch, T.; Zan, G.; Li, M.; Zheng, Z.; Liang, B. Improving the accuracy of multi-step prediction of building energy consumption based on EEMD-PSO-Informer and long-time series. Comput. Electr. Eng. 2023, 110, 108845. [Google Scholar] [CrossRef]
  29. Tahmasebinia, F.; Lin, L.; Wu, S.; Kang, Y.; Sepasgozar, S. Exploring the benefits and limitations of digital twin technology in building energy. Appl. Sci. 2023, 13, 8814. [Google Scholar] [CrossRef]
  30. Breiman, L. Random forests. Mach. Learn. 2001, 45, 5–32. [Google Scholar] [CrossRef]
  31. Oviedo De Valeria, J. Problemas de máximos y mínimos y algunas reflexiones sobre el automatismo en su resolución. Educación matemática 1994, 6, 73–86. Available online: http://www.revista-educacion-matematica.org.mx/descargas/vol6/vol6-2/vol6-2-5.pdf (accessed on 6 May 2024). [CrossRef]
  32. Artificial Neural Network—An Overview|Sciencedirect Topics. Available online: https://www.sciencedirect.com/topics/neuroscience/artificial-neural-network#:~:text=Artificial%20Neural%20Network%20(ANN)%20mimics,is%20obtained%20as%20an%20output (accessed on 6 May 2024).
  33. Pawan, S.J.; Rajan, J. Capsule networks for image classification: A review. Neurocomputing 2022, 509, 102–120. [Google Scholar] [CrossRef]
  34. Tekler, Z.D.; Low, R.; Zhou, Y.; Yuen, C.; Blessing, L.; Spanos, C. Near-real-time plug load identification using low-frequency power data in office spaces: Experiments and applications. Appl. Energy 2020, 275, 115391. [Google Scholar] [CrossRef]
  35. Al Gharably, M.; DeCarolis, J.F.; Ranjithan, S.R. An enhanced linear regression-based building energy model (Lrbem+) for early design. J. Build. Perform. Simul. 2016, 9, 115–133. [Google Scholar] [CrossRef]
  36. Ciulla, G.; D’Amico, A. Building energy performance forecasting: A multiple linear regression approach. Appl. Energy 2019, 253, 113500. [Google Scholar] [CrossRef]
  37. Begić, H.; Galić, M. A systematic review of construction 4.0 in the context of the bim 4.0 premise. Buildings 2021, 11, 337. [Google Scholar] [CrossRef]
  38. Schwab, K. The Fourth Industrial Revolution; Currency Press: Sydney, Australia, 2017; p. 194. [Google Scholar]
  39. Low-Energy Building Design—The Process and a Case Study—ProQuest. Available online: https://www.proquest.com/openview/330c19f6ef3f0b358d2373fa1ab8a56c/1?pq-origsite=gscholar&cbl=34619 (accessed on 6 May 2024).
  40. Chen, S.; Jin, R.; Alam, M. Investigation of interoperability between building information modelling (Bim) and building energy simulation (Bes). Int. Rev. Appl. Sci. Eng. 2018, 9, 137–144. [Google Scholar] [CrossRef]
  41. Pereira, V.; Santos, J.; Leite, F.; Escórcio, P. Using BIM to improve building energy efficiency—A scientometric and systematic review. Energy Build. 2021, 250, 111292. [Google Scholar] [CrossRef]
  42. Tahmasebinia, F.; Jiang, R.; Sepasgozar, S.; Wei, J.; Ding, Y.; Ma, H. Using regression model to develop green building energy simulation by bim tools. Sustainability 2022, 14, 6262. [Google Scholar] [CrossRef]
  43. Tahmasebinia, F.; He, R.; Chen, J.; Wang, S.; Sepasgozar, S.M.E. Building energy performance modeling through regression analysis: A case of tyree energy technologies building at unsw sydney. Buildings 2023, 13, 1089. [Google Scholar] [CrossRef]
  44. Lu, Q.; Xie, X.; Parlikad, A.K.; Schooling, J.M.; Konstantinou, E. Moving from building information models to digital twins for operation and maintenance. Proc. Inst. Civ. Eng.—Smart Infrastruct. Constr. 2021, 174, 46–56. [Google Scholar] [CrossRef]
  45. Callcut, M.; Cerceau Agliozzo, J.-P.; Varga, L.; McMillan, L. Digital twins in civil infrastructure systems. Sustainability 2021, 13, 11549. [Google Scholar] [CrossRef]
  46. Spudys, P.; Afxentiou, N.; Georgali, P.-Z.; Klumbyte, E.; Jurelionis, A.; Fokaides, P. Classifying the operational energy performance of buildings with the use of digital twins. Energy Build. 2023, 290, 113106. [Google Scholar] [CrossRef]
  47. Seo, H.; Yun, W.-S. Digital twin-based assessment framework for energy savings in university classroom lighting. Buildings 2022, 12, 544. [Google Scholar] [CrossRef]
  48. Francisco, A.; Mohammadi, N.; Taylor, J.E. Smart city digital twin–enabled energy management: Toward real-time urban building energy benchmarking. J. Manag. Eng. 2020, 36, 04019045. [Google Scholar] [CrossRef]
  49. Autodesk. 2022. Revit. [Software]. Version 22.1.30.34. Available online: http://www.autodesk.com/products/revit/overview (accessed on 6 May 2024).
  50. Guglielmetti, R.; Macumber, D.; Long, N. Openstudio: An Open Source Integrated Analysis Platform; National Renewable Energy Lab (NREL): Golden, CO, USA, 2011. [Google Scholar]
  51. Energyplus™; National Renewable Energy Laboratory (NREL): Golden, CO, USA; Lawrence Berkeley National Laboratory (LBNL): Berkeley, CA, USA, 2017.
  52. Python Software Foundation. Python. [Software] Version 3.10.11. 2023. Available online: https://www.python.org/downloads/release/python-31011/ (accessed on 6 May 2024).
  53. AS/NZS ISO 5151:2023; Non-Ducted Air Conditioners and Heat Pumps—Testing and Rating for Performance. Standards Australia Store: Sydney, Australia, 2023.
  54. Pérez-Lombard, L.; Ortiz, J.; Maestre, I.R.; Coronel, J.F. Constructing HVAC energy efficiency indicators. Energy Build. 2012, 47, 619–629. [Google Scholar] [CrossRef]
  55. Liao, S.-B.; Walker, J.; Halliday, D.; Resnick, R. Student Solutions Manual to Accompany Fundamentals of Physics, 10th ed.; Halliday, D., Resnick, R., Walker, J., Eds.; John Wiley & Sons: Hoboken, NJ, USA, 2014; p. 509. [Google Scholar]
  56. ISO. Guide to the Expression of Uncertainty in Measurement; ISO: Geneva, Switzerland, 2008. [Google Scholar]
  57. Monteiro, S.; Monteiro, F.P.; Tostes, M.E.L.; Carvalho, C.M. Methodology for Energy Efficiency on Lighting and Air Conditioning Systems in Buildings Using a Multi-Objective Optimization Algorithm. Energies 2020, 13, 3303. [Google Scholar] [CrossRef]
  58. Energyplus. Energy.gov. Available online: https://www.energy.gov/ (accessed on 6 May 2024).
  59. Nouidui, T.; Wetter, M.; Zuo, W. Functional mock-up unit for co-simulation import in EnergyPlus. J. Build. Perform. Simul. 2014, 7, 192–202. [Google Scholar] [CrossRef]
  60. Chapter 2—Policies, recommendations and standards (International technical standards, main laws and regulations; eu directives; energy labeling). In Handbook of Energy Efficiency in Buildings; Asdrubali, F.; Desideri, U. (Eds.) Butterworth-Heinemann: Oxford, UK, 2019; pp. 5–73. [Google Scholar]
  61. McFadden, D. Conditional logit analysis of qualitative choice behavior. In Frontiers in Econometrics; Academic Press: New York, NY, USA, 1974; pp. 105–142. [Google Scholar]
  62. Hauer, M.; Hammes, S.; Zech, P.; Geisler-Moroder, D.; Plörer, D.; Miller, J.; van Karsbergen, V.; Pfluger, R. Integrating Digital Twins with BIM for Enhanced Building Control Strategies: A Systematic Literature Review Focusing on Daylight and Artificial Lighting Systems. Buildings 2024, 14, 805. [Google Scholar] [CrossRef]
  63. Zhao, J.; Lam, K.P.; Ydstie, B.E.; Karaguzel, O.T. EnergyPlus Model-Based Predictive Control within Design–Build–Operate Energy Information Modelling Infrastructure. J. Build. Perform. Simul. 2015, 8, 121–134. [Google Scholar] [CrossRef]
  64. Panagiotakis, S.; Fandaoutsakis, Y.; Vourkas, M.; Vassilakis, K.; Malamos, A.; Mavromoustakis, C.X.; Mastorakis, G. Energy-Efficient Design of Data Center Spaces in the Era of IoT Exploiting the Concept of Digital Twins. In Convergence of Artificial Intelligence and the Internet of Things; Mastorakis, G., Mavromoustakis, C.X., Batalla, J.M., Pallis, E., Eds.; Springer International Publishing: Cham, Switzerland, 2020; pp. 117–143. [Google Scholar] [CrossRef]
  65. Doe, J.; Smith, A. Digital Twin for Accelerating Sustainability in Positive Energy District: A Review of Simulation Tools and Applications. Front. Sustain. Cities 2021, 3, 663269. [Google Scholar] [CrossRef]
  66. Elnabawi, M.H. Building Information Modeling-Based Building Energy Modeling: Investigation of Interoperability and Simulation Results. Front. Built Environ. 2020, 6, 573971. Available online: https://www.frontiersin.org/articles/10.3389/fbuil.2020.573971/full (accessed on 28 May 2024). [CrossRef]
  67. Fujii, T.Y.; Hayashi, V.T.; Arakaki, R.; Ruggiero, W.V.; Bulla, R., Jr.; Hayashi, F.H.; Khalil, K.A. A Digital Twin Architecture Model Applied with MLOps Techniques to Improve Short-Term Energy Consumption Prediction. Machines 2022, 10, 23. [Google Scholar] [CrossRef]
  68. Clausen, A.; Arendt, K.; Johansen, A.; Sangogboye, F.C.; Kjærgaard, M.B.; Veje, C.T.; Jørgensen, B.N. A digital twin framework for improving energy efficiency and occupant comfort in public and commercial buildings. Energy Inform. 2021, 4 (Suppl S2), 40. [Google Scholar] [CrossRef]
  69. Zhao, Y.; Wang, N.; Liu, Z.; Mu, E. Construction Theory for a Building Intelligent Operation and Maintenance System Based on Digital Twins and Machine Learning. Buildings 2022, 12, 87. [Google Scholar] [CrossRef]
  70. Hodavand, F.; Ramaji, I.J.; Sadeghi, N. Digital Twin for Fault Detection and Diagnosis of Building Operations: A Systematic Review. Buildings 2023, 13, 1426. [Google Scholar] [CrossRef]
  71. He, B.; Mao, H. Digital Twin-Driven Product Sustainable Design for Low Carbon Footprint. ASME J. Comput. Inf. Sci. Eng. 2023, 23, 060805. [Google Scholar] [CrossRef]
Figure 1. Engineering and Technology Precinct of the University of Sydney—View 1.
Buildings 14 01774 g001
Figure 2. Engineering and Technology Precinct of the University of Sydney—View 2.
Buildings 14 01774 g002
Figure 3. Engineering and Technology Precinct of the University of Sydney—View 3.
Buildings 14 01774 g003
Figure 4. Digital building facade—View 1.
Buildings 14 01774 g004
Figure 5. Digital building facade—View 2.
Buildings 14 01774 g005
Figure 6. Digital building facade—View 3.
Buildings 14 01774 g006
Figure 7. Digital building facade—View 4.
Buildings 14 01774 g007
Figure 8. Digital building—3D View.
Buildings 14 01774 g008
Figure 9. Building energy model—View 1.
Buildings 14 01774 g009
Figure 10. Building energy model—View 2.
Buildings 14 01774 g010
Figure 11. Building energy model—View 3.
Buildings 14 01774 g011
Figure 12. Building energy model—View 4.
Buildings 14 01774 g012
Figure 13. Building energy model—View 5.
Buildings 14 01774 g013
Figure 14. EnergyPlus simulation process log.
Buildings 14 01774 g014
Figure 15. DL11A-MC-D1 temperature sensor.
Buildings 14 01774 g015
Figure 16. The J03 case study analysis to support a digital twin-like framework.
Buildings 14 01774 g016
Figure 17. Flow chart for Python System.
Buildings 14 01774 g017
Figure 18. Normal operation (less than 5200 kWh).
Buildings 14 01774 g018
Figure 19. After exceeding energy consumption limit (>5200 kWh).
Buildings 14 01774 g019
Figure 20. Zone mean temperature overview.
Buildings 14 01774 g020
Figure 21. Zone mean relative humidity overview.
Buildings 14 01774 g021
Figure 22. Zone energy consumption overview.
Buildings 14 01774 g022
Figure 23. Visualization of the linear regression model.
Buildings 14 01774 g023
Figure 24. Visualization of the relationship between annual mean relative humidity and energy consumption.
Buildings 14 01774 g024
Figure 25. Visualization of the relationship between annual mean relative humidity and mean temperature.
Buildings 14 01774 g025
Figure 26. Visualization of the sigmoid regression model.
Buildings 14 01774 g026
Figure 27. Visualization of the sigmoid regression model with transformed X = log ( X 1 ).
Buildings 14 01774 g027
Figure 28. Visualization of the sigmoid regression model with transformed X = log ( X 1 + X 2 ).
Buildings 14 01774 g028
Figure 29. Visualization of the sigmoid regression model with transformed X = X 1 2 .
Buildings 14 01774 g029
Figure 30. Visualization of the sigmoid regression model with transformed X = X 1 .
Buildings 14 01774 g030
Figure 31. Visualization of the random forest model.
Buildings 14 01774 g031
Figure 32. Output from Python code displaying sensor readings data.
Buildings 14 01774 g032
Figure 33. Real-time environmental temperature records for a typical day (9 October 2023).
Buildings 14 01774 g033
Figure 34. Predicted energy consumption: uncontrolled vs. 5200/9000 kWh energy limit control.
Buildings 14 01774 g034
Figure 35. Schematic diagram of occupancy monitoring.
Buildings 14 01774 g035
Table 1. First five rows of data sample.
ZoneUnmet Htg (h)Unmet Htg—Occ (h)<56 (F)56–61 (F)61–66 (F)66–68 (F)70–72 (F)72–74 (F)74–76 (F)76–78 (F)78–83 (F)83–88 (F)≥ 88 (F)Unmet Clg (h)Unmet Clg—Occ (h)Mean Temp (F)Mean Relative Humidity (%)
AIM13895800000000661206244824300102.4 (F)89.2
AIM138962007399675929675712677137511587818010074.6 (F)52.2
AIM13896600495717801052684668636119910787306420073.4 (F)50.9
AIM1389700002415142939645256712261350134725250081.0 (F)42.5
AIM13897400293414746784965105141080114197521020078.4 (F)48.3
Table 2. The first five rows of processed data.
ZoneMean_TempMean_Relative_HumidityEnergy_Consumption
AIM13895839.10.8929804.480
AIM13896223.70.5225765.088
AIM13896623.00.5095485.984
AIM13897027.20.4257623.616
AIM13897425.80.4836803.776
Table 3. Summary of the sigmoid model of the transformed x values.
XMSE R 2
X 1 (original) 177,3770.883
log   ( X 1 + X 2 )180,3690.8805
log   ( X 1 )180,5130.8804
X 1 2 177,9350.8821
X 1 178,6000.8817
Table 4. Summary of the three models.
LinearSigmoidRandom Forest
VariablesX = mean tempX = mean tempX1 = mean temp
R squareY = energy consumptionY = energy consumptionX2 = mean humidity
Y = energy consumption
MSE0.7170.8830.834
AIC426,522177,377207,309
BIC6814.396814.396828.16
Disclaimer/Publisher’s Note: The statements, opinions and data contained in all publications are solely those of the individual author(s) and contributor(s) and not of MDPI and/or the editor(s). MDPI and/or the editor(s) disclaim responsibility for any injury to people or property resulting from any ideas, methods, instructions or products referred to in the content.

