Article

Fatigue Evaluation of CFST Arch Bridge Based on Vehicle–Bridge Coupling Vibration Analysis

1
School of Astronautics, Northwestern Polytechnical University, Xi’an 710064, China
2
School of Civil Engineering, Tianjin University, Tianjin 300072, China
3
School of Highway, Chang’an University, Xi’an 710064, China
4
Shaanxi Institute of Teacher Development, Shaanxi Normal University, Xi’an 710062, China
*
Authors to whom correspondence should be addressed.
Buildings 2024, 14(6), 1787; https://doi.org/10.3390/buildings14061787
Submission received: 21 March 2024 / Revised: 4 June 2024 / Accepted: 8 June 2024 / Published: 13 June 2024
(This article belongs to the Special Issue Advances in Steel–Concrete Composite Structures)

Abstract

:
This study proposes a fatigue life analysis method for long-span CFST arch bridges based on a vehicle–bridge coupled vibration analysis model, which can analyze the structural dynamic effects and the excessive fatigue damage caused by the passage of vehicles. In situ test analysis of bridge dynamic characteristics is carried out, and a numerical model considering the vehicle–bridge coupled system is validated according to the measured vibration modes, frequency, and displacement time history. The results indicate that the proposed vehicle–bridge coupled vibration numerical model can be used to simulate the dynamic response of the bridge under various conditions. The factors of vehicle speed, vehicle weight, and road surface condition are further selected to analyze the vehicle–bridge coupled vibration effect, and it is found that the response time history is more sensitive to the vehicle weight factor. In addition, the fatigue life of suspenders at different positions is compared, which is found to decrease significantly with a reduction in suspender length. Due to damage to the suspender caused by environmental erosion, the cross-sectional area decreases and the stress amplitude changes, resulting in a decrease in the fatigue reliability of the suspender under different conditions.

1. Introduction

There has been an increasingly fast rate of development in the application of concrete-filled steel tubular (CFST) arch bridges in the construction industry, due to their certain distinctive benefits including adequate cost, proper appearance, ease of construction, and powerful cross performance [1,2]. However, the vertical and lateral stiffnesses are relatively weak for long-span concrete-filled steel tubular arch bridges, and the structural vibration caused by vehicle loads is prominent. As crucial components of CFST arch bridges, CFST members play a key role in their structural mechanical performance. A previous study has explored a data-driven optimization approach for the torsion design of CFRP-CFST columns, while another study has focused on the vibration mechanics of concrete-filled steel tubular composite columns with ultra-high-performance concrete plates [3,4]. Additionally, the trend towards heavier and faster transportation of vehicles exacerbates fatigue damage to the bridge structure [5,6], resulting in severe damage to the bridge before it reaches its designed service life; as such, some damping measures need to be provided to control vibration-induced fatigue damage [7].
Bridge finite element models aimed at fatigue analysis can effectively reflect local hot spot stresses in the bridge. During the modeling process, vehicle loads are typically simulated as moving concentrated forces or simplified by considering an impact factor for fatigue damage analysis [8,9,10,11]. While these analysis methods can partially depict the dynamic response of the bridge, they neglect the interaction between the bridge and vehicles and fail to consider the influence of factors such as road surface roughness on the bridge’s dynamic response. The accuracy of these methods is insufficient to meet the requirements of fatigue assessment for existing bridges. Additionally, some researchers have analyzed the fatigue performance of bridges using normal stress, hot spot stress, and notch stress methods [12,13]. The vehicle–bridge coupled dynamic analysis technology effectively addresses these issues [14,15,16]. For highway bridges, due to factors such as road surface roughness and expansion joints, fatigue vehicles passing through the bridge at certain speeds will inevitably impact the bridge, and the dynamic effects of vehicle loads accelerate bridge fatigue damage [17]. Previous studies have conducted analyses of bridge fatigue performance based on dynamic response numerical results, including the effects of vehicle speed, axle weight, road surface roughness, and lane configuration on bridge fatigue stress [18,19,20]. These studies indicate that dynamic vehicle loads increase with increasing vehicle weight and worsening road surface roughness, leading to the accumulation of fatigue damage [21,22].
As the primary load-bearing components of steel pipe concrete arch bridges, suspenders are inherently susceptible to fatigue failure under dynamic loads, significantly impacting the safety of long-span arch bridges. In particular, the alternating stresses generated by vehicle loads and wind-induced vibrations can cause fatigue failure of the suspenders well below their static strength [23]. However, limited studies have addressed fatigue life assessments for arch bridge suspenders. Moreover, aside from vehicle loading, which induces fatigue failure in suspenders due to varying stress amplitudes, environmental corrosion also emerges as a critical factor contributing to the damage and degradation of suspender components, and studies have demonstrated the significant impact of environmental corrosion on suspender fracture, where short suspenders are particularly susceptible to the severe effects of fatigue on long-span arch bridges, compared to other suspenders [24,25].
In this study, a vehicle–bridge coupled numerical analysis model is established for a five-hole half-through concrete-filled steel tube tied-arch bridge, comprehensively analyzing the structural dynamic effects and excessive fatigue damage caused by the passage of vehicles. The model considers the effects of various parameters, such as vehicle weight, speed, and road surface roughness, on the dynamic performance of the bridge structure. The S-N curve and Miner linear cumulative damage theory are applied to develop a vehicle–bridge coupled dynamic analysis method in order to assess the fatigue life of suspenders in large-span bridge structures. The impacts of different factors on the fatigue life of suspenders at different positions on the subside span and the central span are separately conducted. This study provides theoretical support for the fatigue design of similar bridge structures.

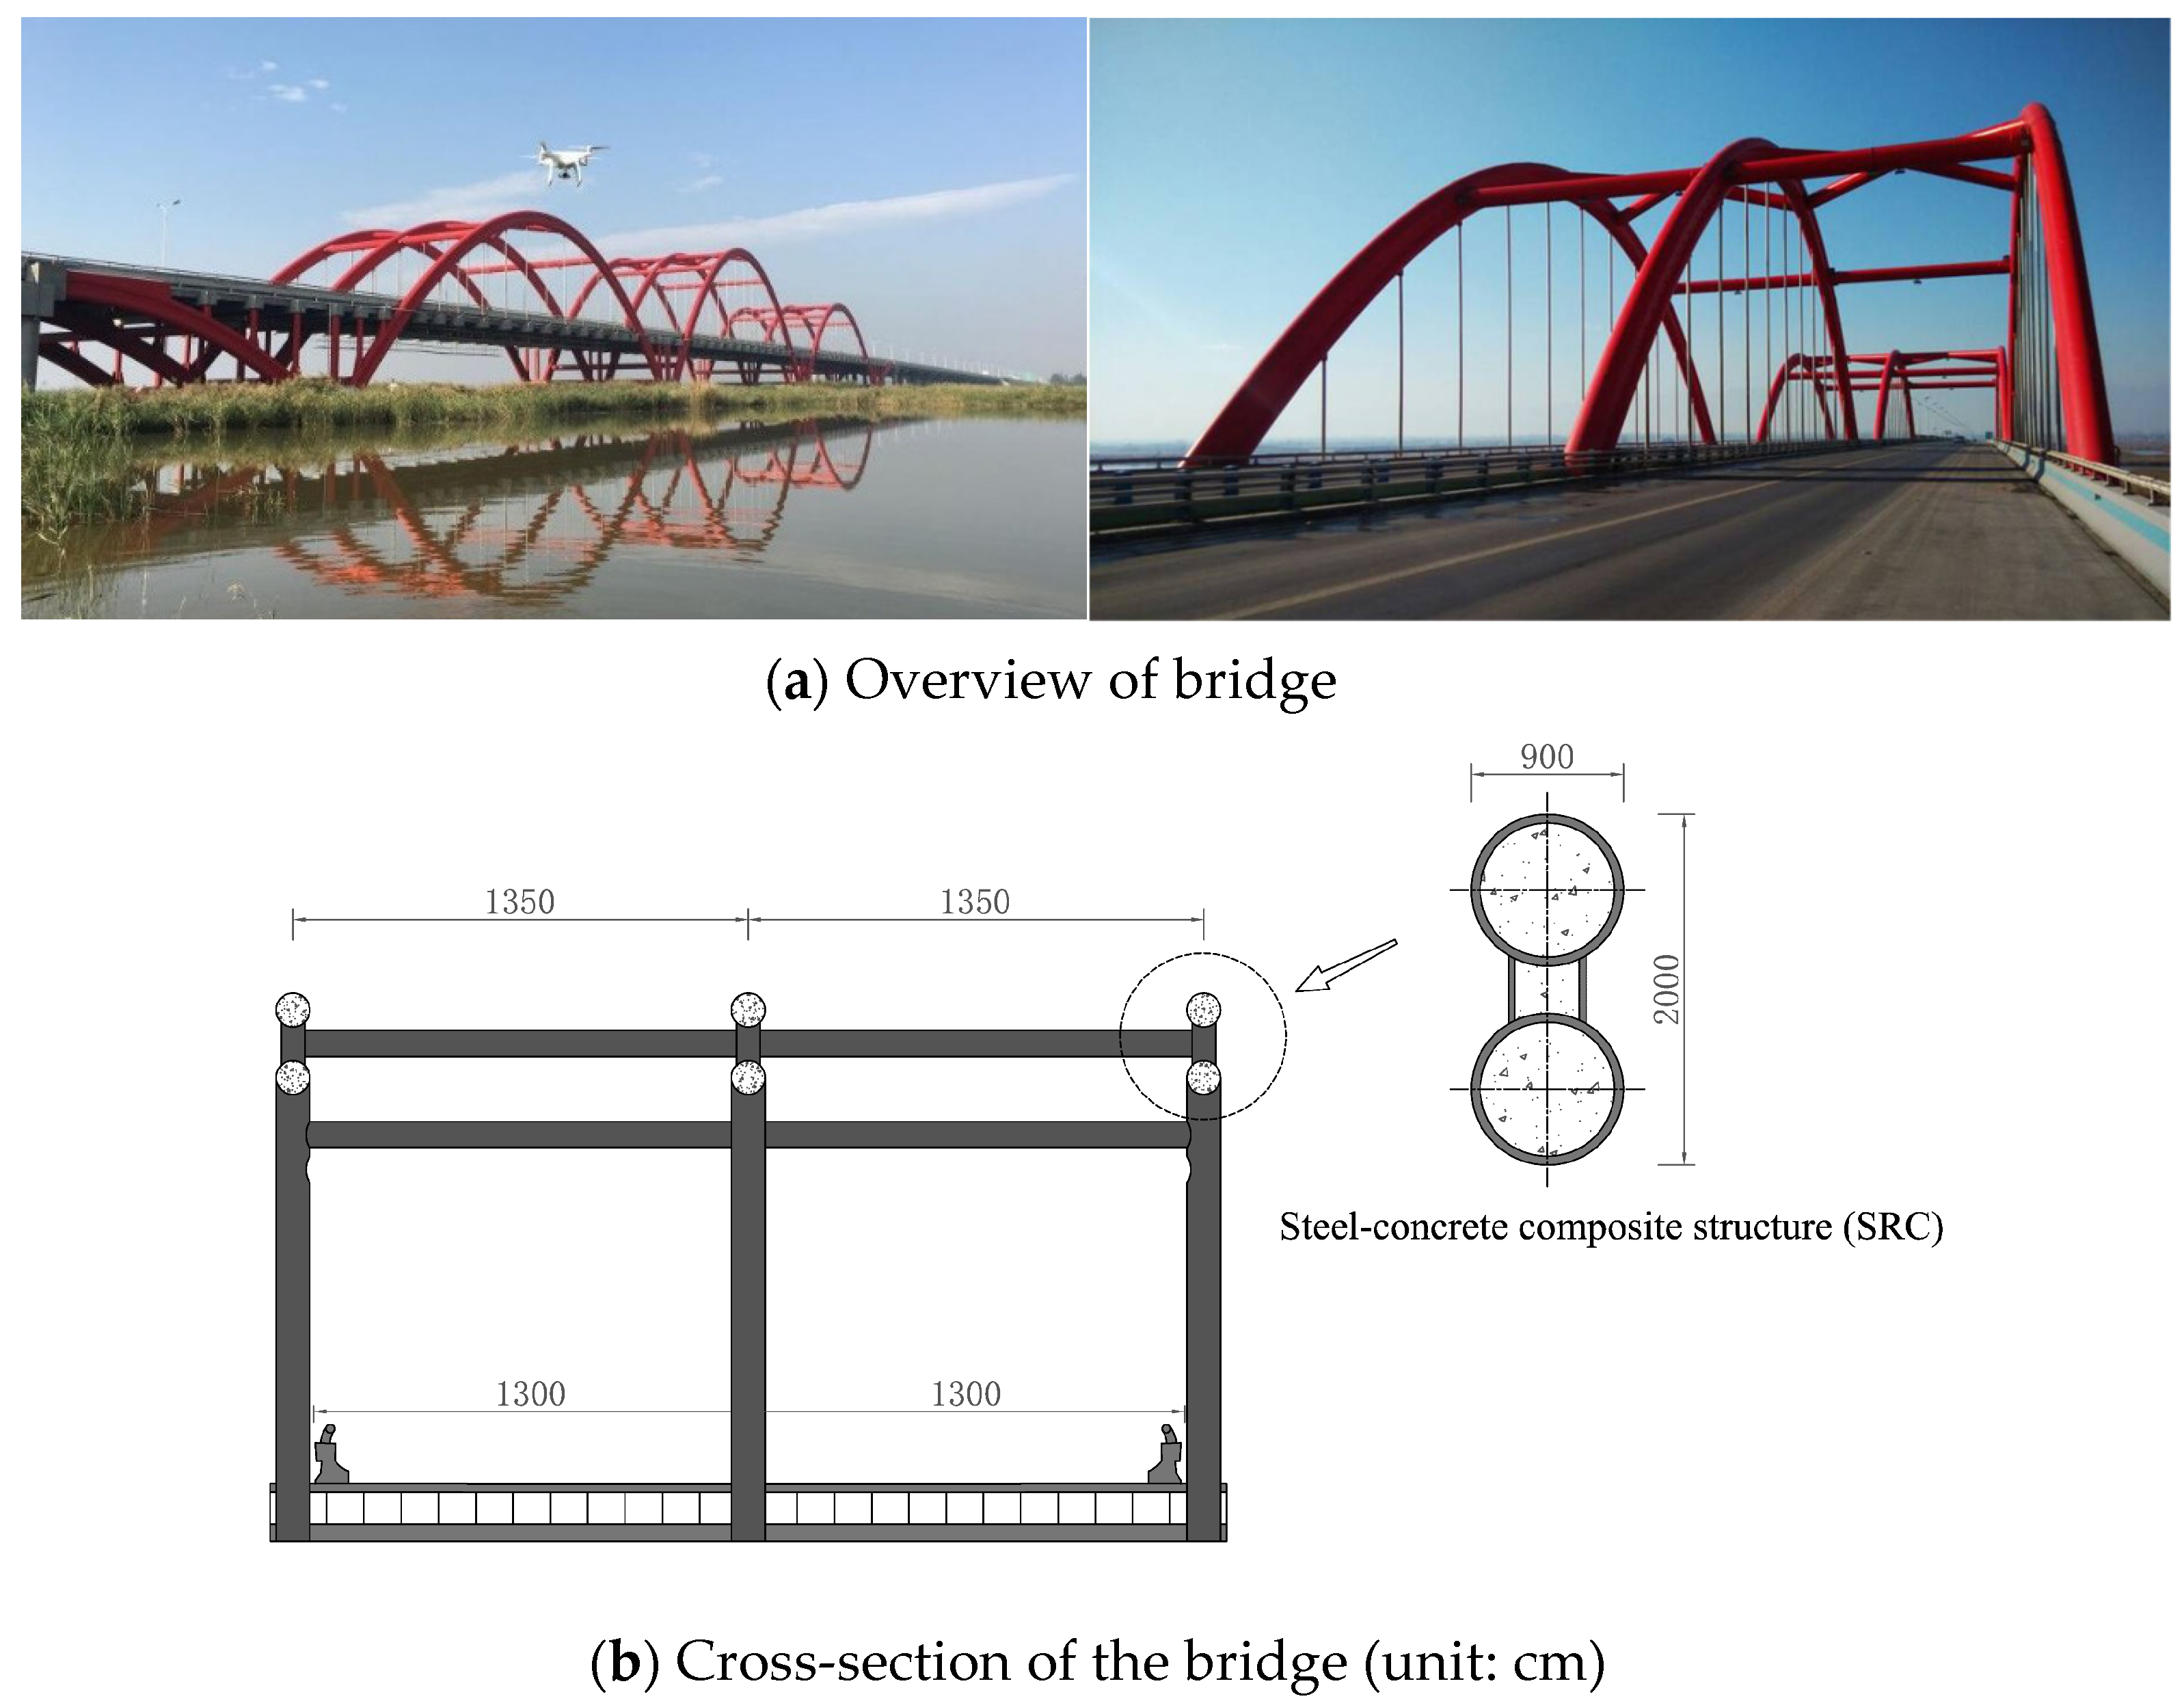
2. Description of the Bridge

The Yuehai bridge is located on the northwest section of the Yinchuan Ring Expressway in Ningxia Hui Autonomous Region, which runs east–west across Yuehai, connecting Yuehai Bay and the Binhe Ecological Park. The bridge adopts the five-hole half-through concrete-filled steel tube tied-arch structure, the span combination is 30 m + 3 × 80 m + 30 m (i.e., the central span and the subside span are 80 m long, the side span is 30 m long), and the width of the bridge deck is 26 m. The arch rib is a concrete-filled steel tube with a dumbbell-shaped section. The rise span ratios of the central hole, the subside hole, and the side hole are 1/2.5, 1/3, and 1/5, respectively, with the axis of a quadratic parabola. The bridge adopts a flexible tied bar of epoxy-sprayed strands, which is anchored to the beams at both ends of the flying swallow part to balance the horizontal thrust of the arch. The suspender is anchored to the upper chord of the arch rib and the lower edge of the crossbeam with a horizontal distance of 5 m. The crossbeam used to anchor the suspender is made of precast box-shaped prestressed concrete members. The columns on the arch rib and the arch seats are concrete-filled steel tubular members, where the diameter of the columns on the arch seat is 80 cm and the diameter of the columns on the arch rib is 60 cm. The slab of the bridge is a precast reinforced concrete trough plate, and the bridge deck is paved with 18 cm deep pavement. The trough plate and bridge deck pavement were originally designed to be continuous, with no expansion joints in the middle. The abutment and pile caps use reinforced concrete, and each pile cap arranges six bored piles with a diameter of 160 cm. The layout of the bridge is shown in Figure 1.

3. Bridge–Vehicle Dynamic Interaction Model

The vibration of a bridge is a cyclical process in which the deformation energy and the kinetic energy of the structural system are mutually converted under an external input. Vehicle dynamic load is a kind of external input that produces a coupling response with the bridge structure, further reflecting the structure’s mechanical properties [26,27]. Therefore, the dynamic performance of a structure can be used to evaluate its structural performance. In the analysis process, the Newmark-β numerical integration method was used to solve non-linear dynamic equilibrium equations, which discretizes the continuous time domain into a series of equally spaced time steps. Each time step corresponds to a specific moment, at which the system’s displacement, velocity, and acceleration are calculated.

3.1. Vehicle Model Parameters

A five-axle vehicle was modeled as a multiple-degree-of-freedom (DOF) system with 16 independent DOFs, which contributes to reflecting the dynamic response of the bridge. The model proposed by Deng et al. [28], based on the design vehicle in Chinese bridge specification, was adopted, which has already been validated for obtaining the dynamic response of a bridge. The vehicle is a rigid body, the constraint between masses M1 and M2 is a rigid connection, and a spring damping system is formed between the vehicle body, the wheels, and the bridge deck. The vehicle analysis model is shown in Figure 2, and the parameters of the vehicle model are listed in Table 1.

3.2. Bridge Model Parameters

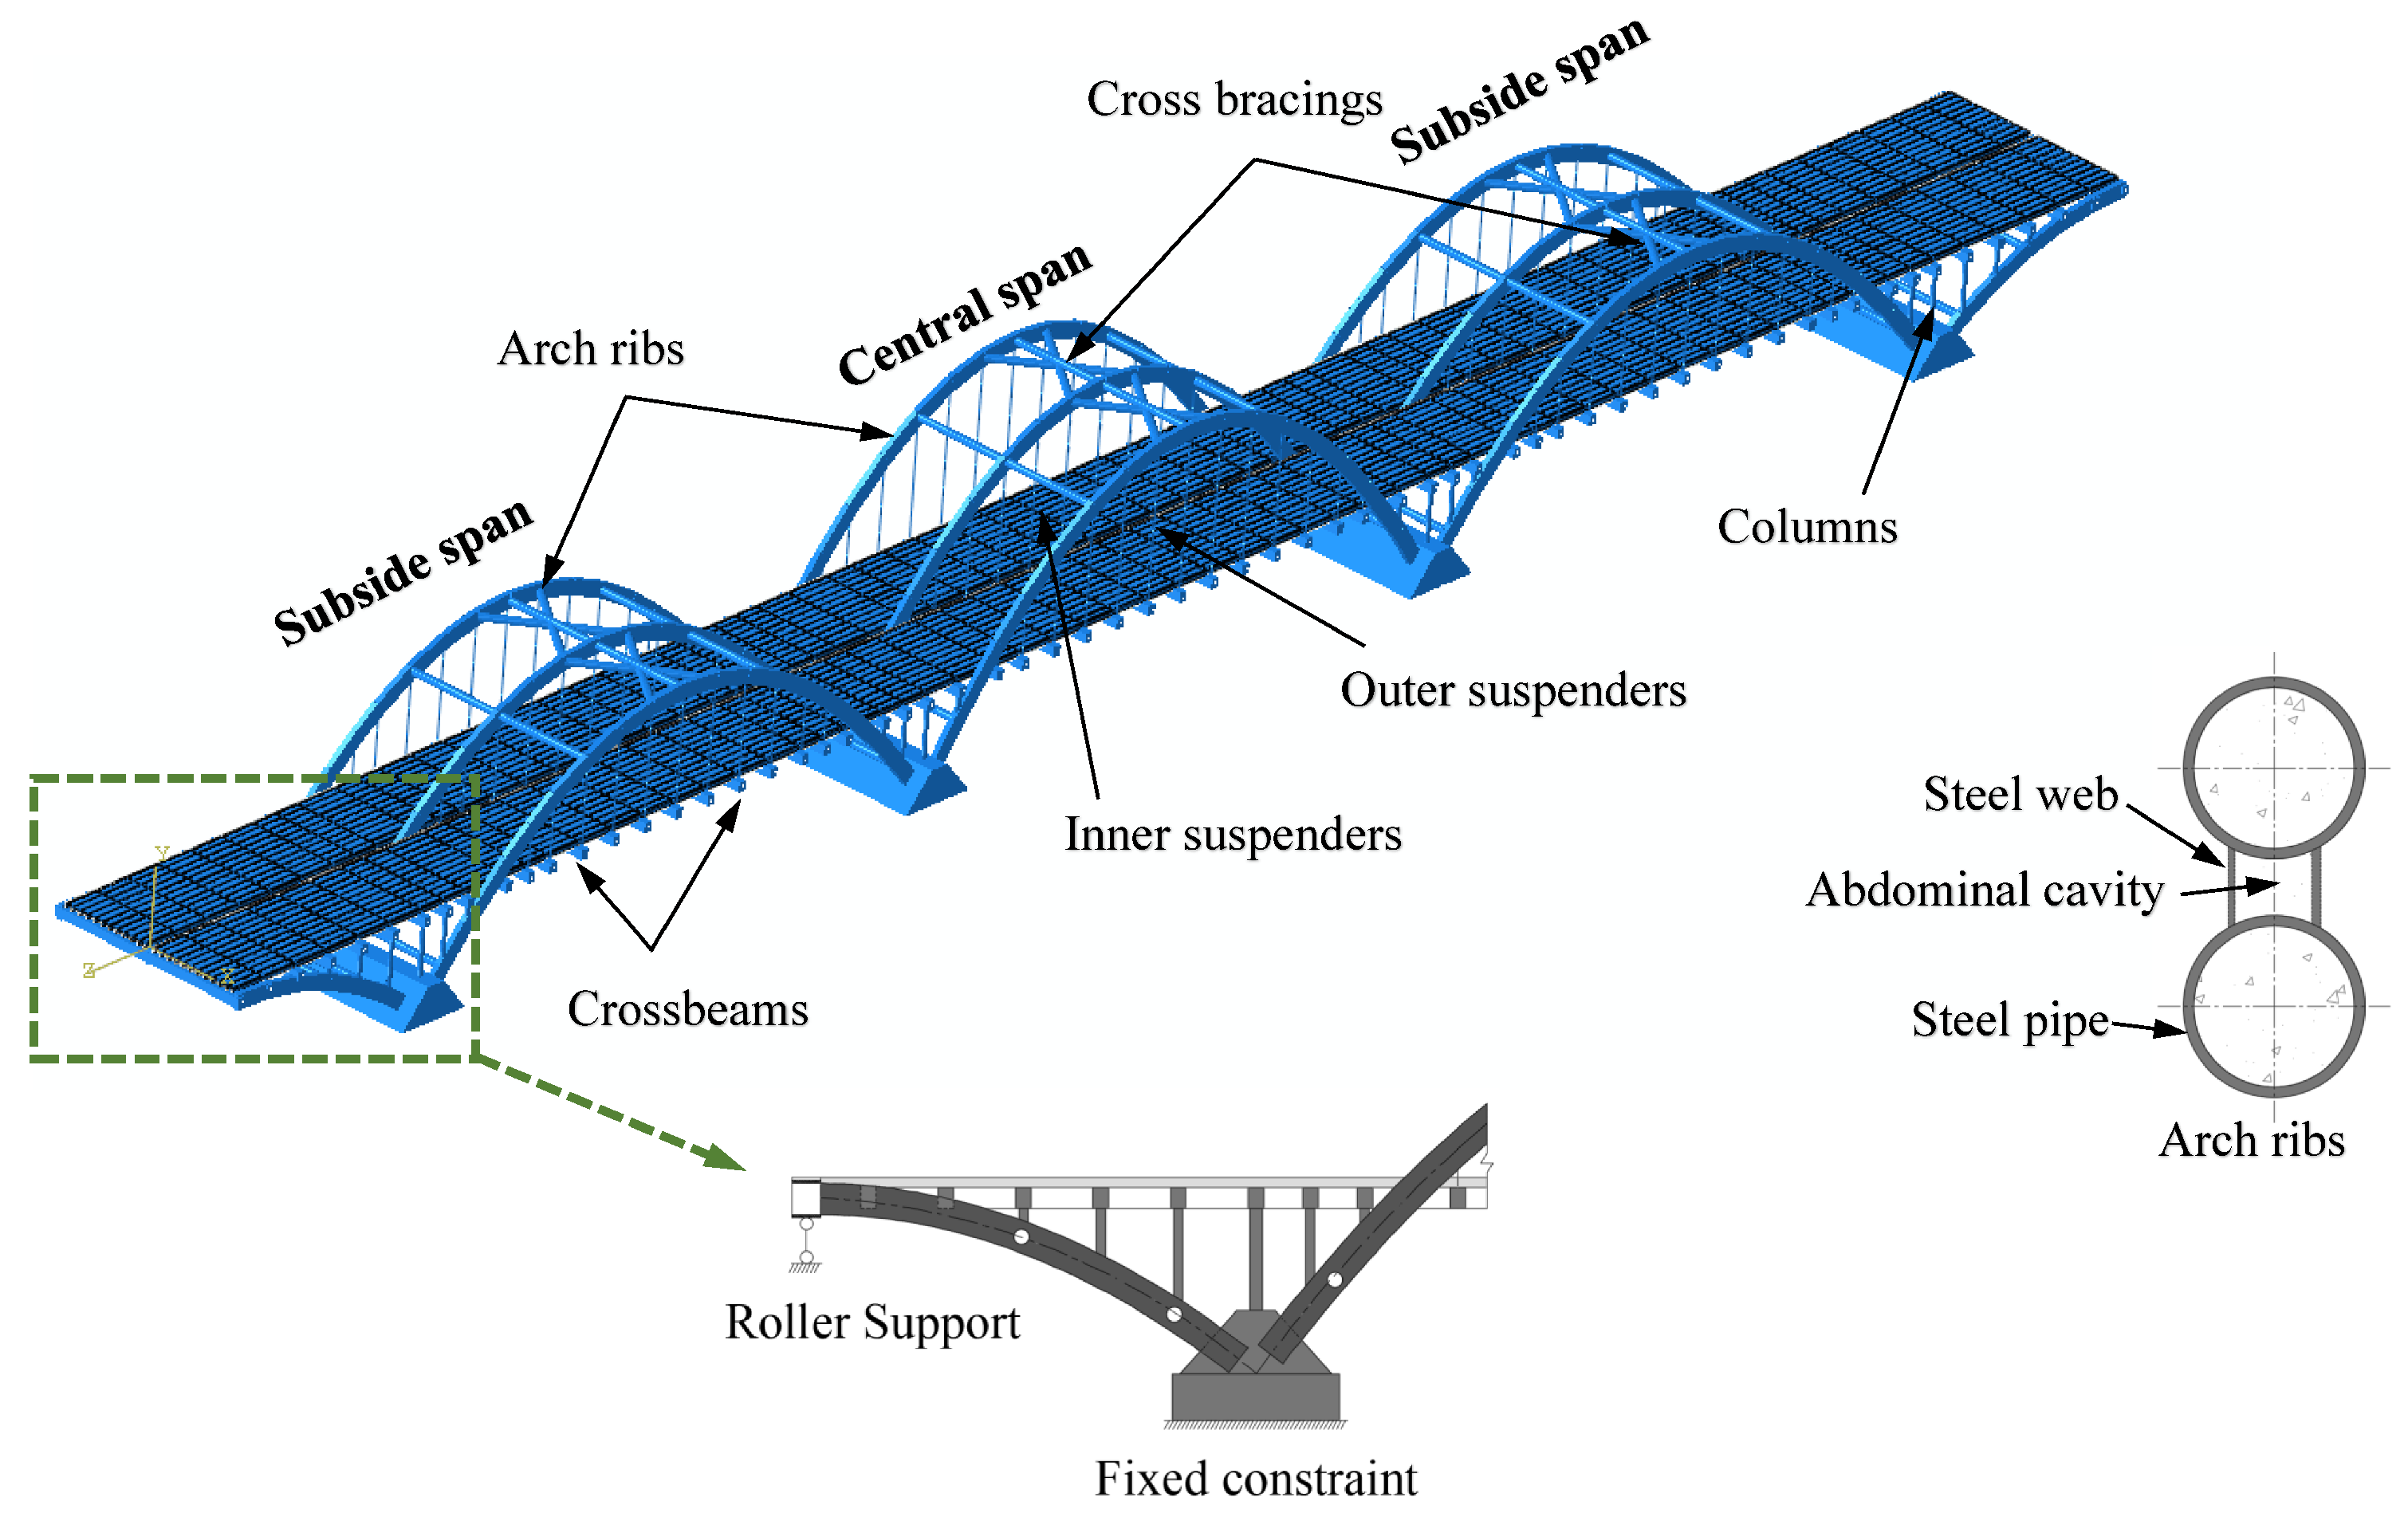
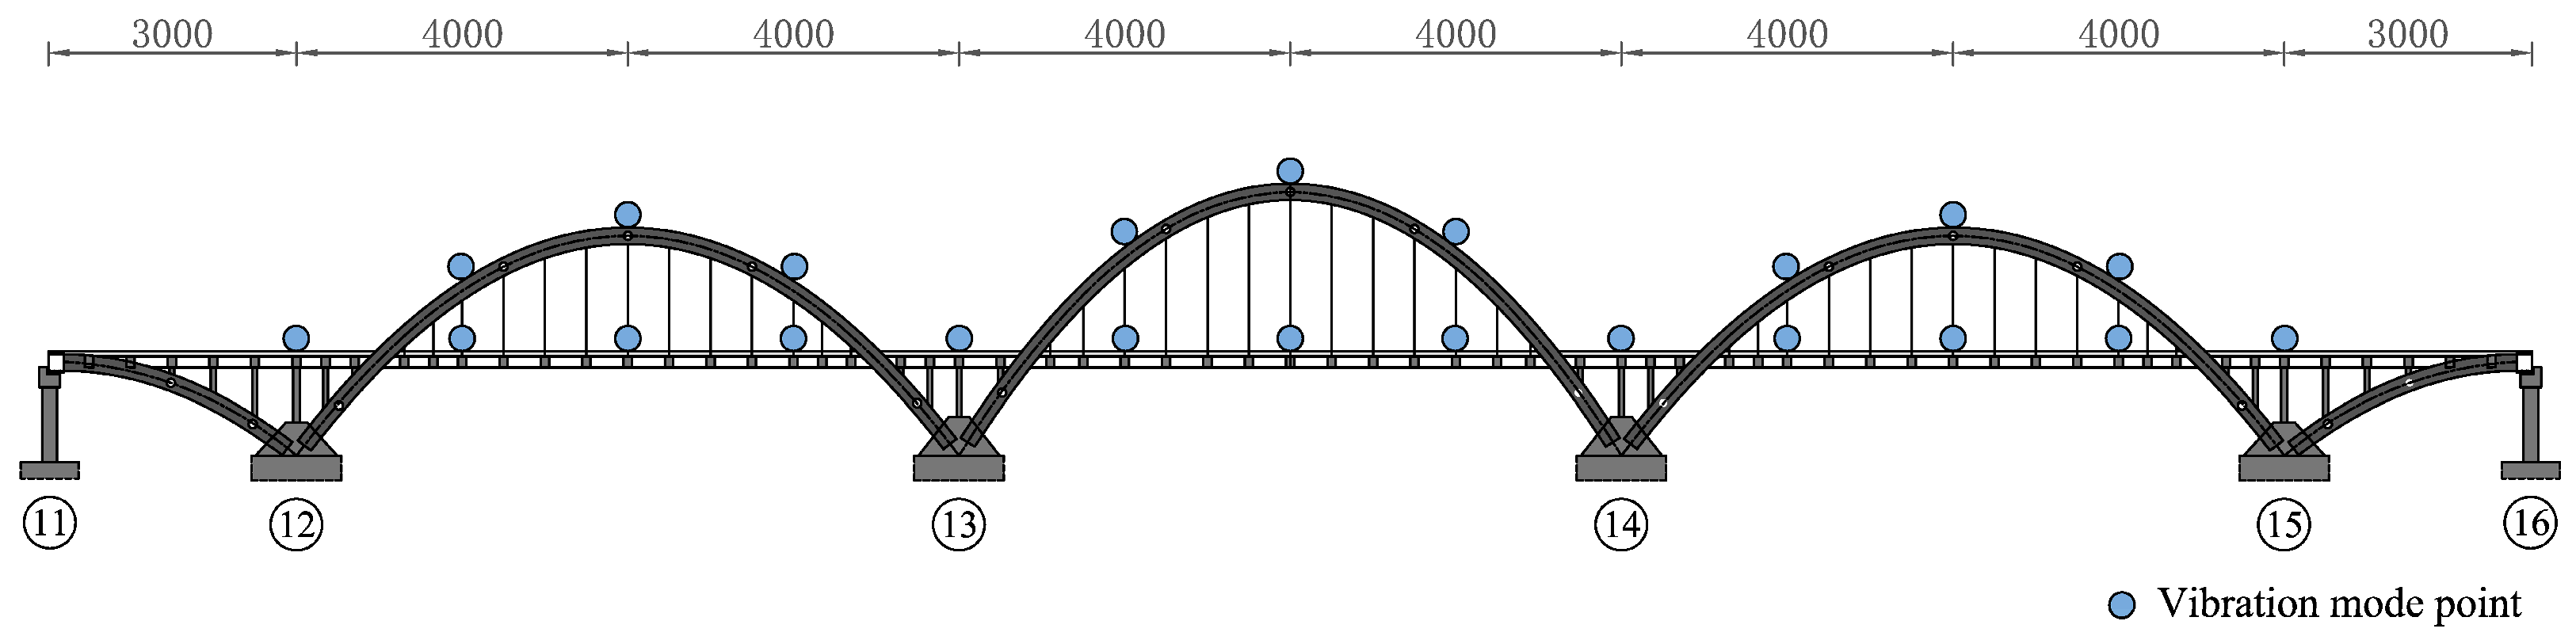
3.2.1. Geometric Model

The FE software ABAQUS 2022 was used to establish a three-dimensional model with the geometry provided in the bridge design. Two-node linear beam elements (B31) were used to model the main beams, columns, arch ribs, suspender cross beams, bent caps, and foundations, while two-node linear truss elements (T3D2) were used for the suspenders and tie bars; additionally, the bridge deck was modeled using shell elements (S4R) with four-node and reduced integration. A dumbbell concrete-filled steel tube section (SRC) was adopted for the arch ring of the main bridge, assuming that there was no relative slip between the steel pipe and the concrete, and the steel pipe wrapping the concrete was converted into the corresponding area of concrete during the calculation. The cross bracings adopted steel tubes, and concrete was not considered to have been poured inside. There were 121 suspenders and four tie bars, which were composed of high-strength and low-relaxation prestressed strands, and the tie bars were embedded within the main beam. The crossbeams were simulated by box-shaped variable-section elements, the arch columns were simulated by the cross-section of the concrete-filled steel tubes, and the combined properties were the same as those of the arch ribs. The bridge deck pavement consisted of 8 cm C40 concrete and 10 cm asphalt concrete. In addition, the model’s boundary conditions included fixed constraints at the base of skewback, while there were roller supports at both ends according to the types of bearings, and the connections between the columns, arch ribs, and crossbeams were of a rigid type. The contact properties between the main beam and the bridge deck were as follows: no relative slip in tangential behavior and no interference in normal behavior. The global FE model is partially shown in Figure 3.

3.2.2. Material Parameters

The material parameters in the model were based on the Code for Design of Highway Reinforced Concrete and Prestressed Concrete Bridges and Culverts [29]; in particular, C50 concrete was used for the prefabricated trough-shaped plates, end crossbeams, and concrete in the main arch rings, while C40 concrete was used for the boom crossbeams, cover beams, and abutments. The anchor underlay and arch ring steel pipe adopted Q345D, the suspenders were made of PES (FD) 7–121 galvanized low-relaxation prestressed steel wire rope, and the tie rod adopted a φ15.2 prestressed steel strand. Both the concrete and steel materials behaved in the linear elastic stage, the elastoplastic process and strain rate of the material were not considered [30], and all bridge components were considered to be damage-free during vehicle loading and unloading. The concrete and steel material parameters are shown in Table 2 and Table 3.

3.2.3. Loading Condition

The grooved slab of the bridge deck was simplified as a shell for the calculation. The weight of the bridge deck pavement was equivalent to a surface load of 4.3 kN·m−2, while the weight of the anti-collision guardrail on the unilateral deck was a linear load of 6.8 kN·m−1. In addition, the influence of temperature on the conventional concrete structures, such as the main beam of bridge decks, suspender beams, bent caps, and end floor beams, was calculated according to General Specifications for the Design of Highway Bridges and Culverts [31].

3.2.4. Road Roughness Simulation

The road roughness was assumed to be a stationary Gaussian random process with zero mean value, and the triangular series method was used to simulate the road roughness [32].
r ( x ) = k = 1 n G d ( n k ) cos ( 2 π n k x + φ k )
where x is the distance between a roughness point on the bridge deck and the starting point of the bridge; G d ( n k ) is the road surface power spectral density; n k = n 1 + ( k 1 / 2 ) Δ n , where k = 1 , 2 , 3 , Δ n = ( n u n 1 ) / N , n u and n 1 are the upper and lower limits of spatial frequency, respectively; N is the number of frequency bands dividing spatial frequency; and φ k is the random phase angle.
The above method was used for simulation to obtain the sample functions of different grades of bridge deck roughness. In this study, after comparing it with the test value, class C pavement was taken as an example, and one sample function curve is shown in Figure 4.

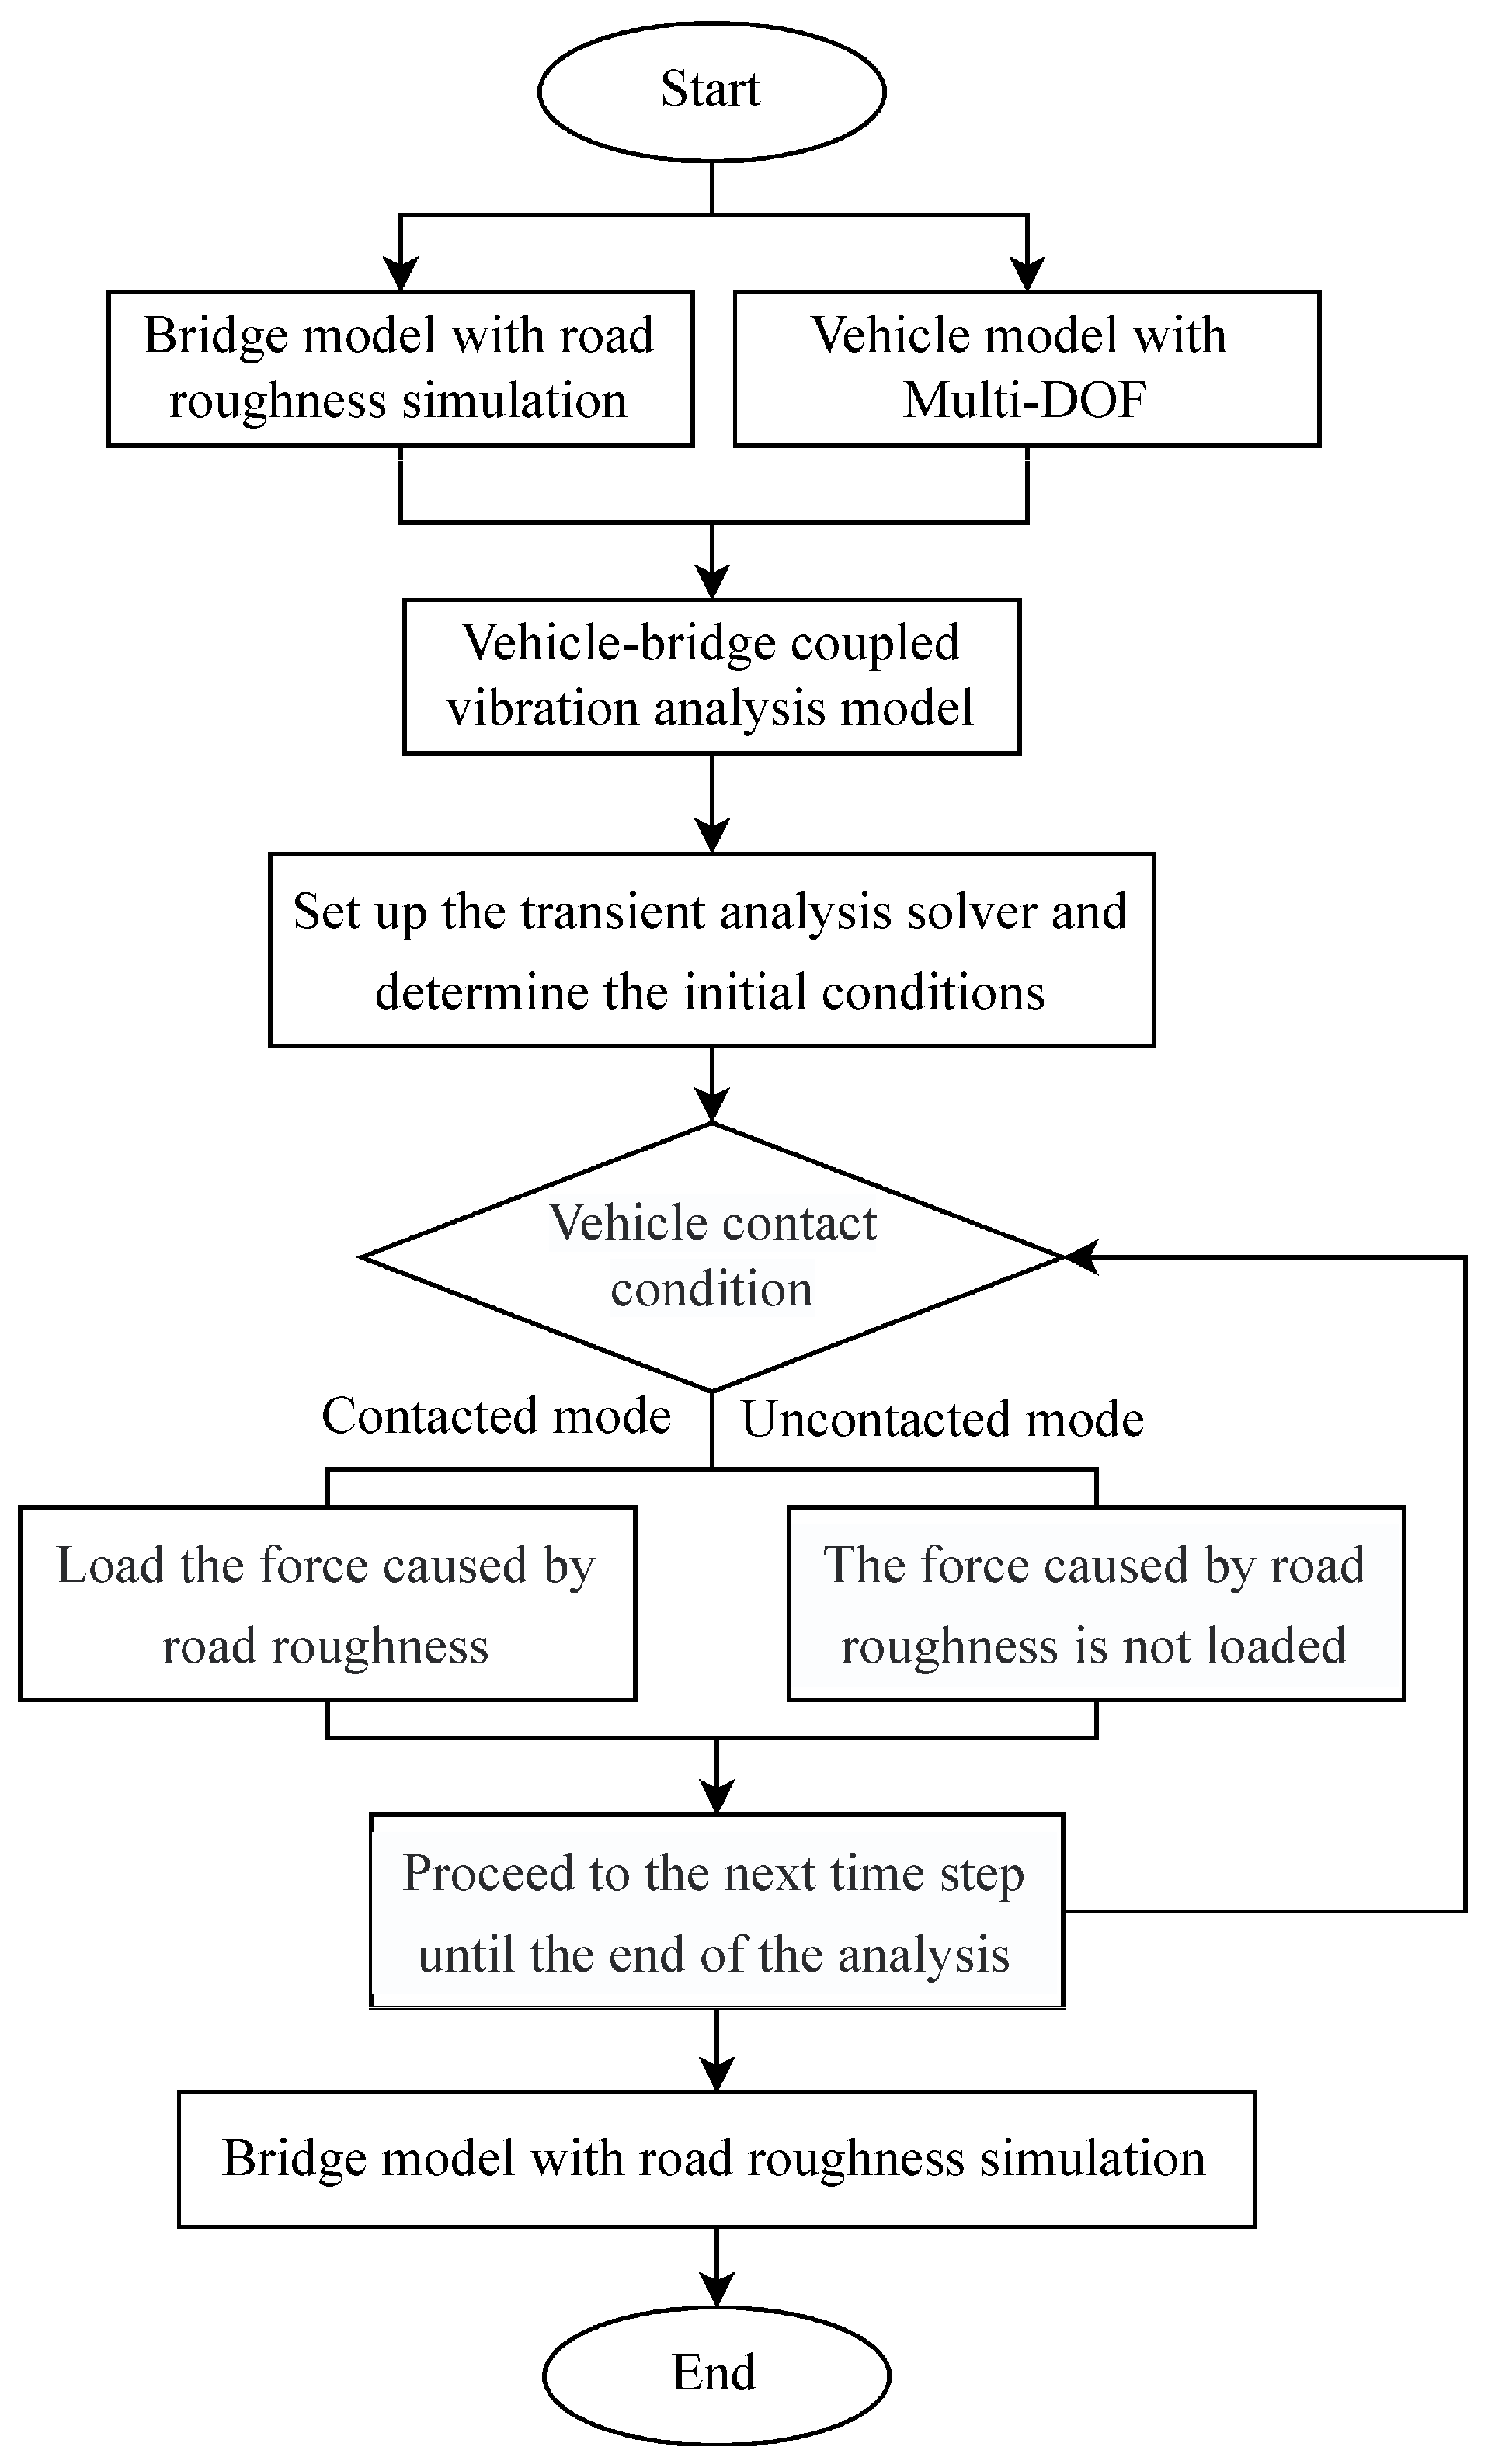
3.3. Vehicle–Bridge Coupled Vibration Analysis Model

The vibration of a CFST arch can be considered as the vibration of a multi-degree-of-freedom system. Its vibration balance equation is shown in Equation (2). The assumption of Equation (2) is based on the Timoshenko beam theory [33,34,35,36], which is suitable for modeling deep beams where shear deformation has a significant impact. When the object of calculation is a slender beam, the results are similar to the Euler–Bernoulli beam theory.
M b q ¨ b + C b q ˙ b + K b q b = F b
where Mb is the mass matrix, Cb is the damping matrix, Kb is the stiffness matrix, q b is the generalized coordinates of different mode shapes, and F b is the force vector.
The vehicle dynamic equilibrium equation is shown in Equation (3), and the lateral position of the vehicle remained unchanged during driving.
M v u ¨ v + C v u ˙ v + K v u v = F v
where u b is the displacement matrix, u ˙ b is the velocity matrix, u ¨ b is the acceleration vector, and the remaining letters have the same meaning as in Equation (2).
The equation of the vehicle–bridge coupled vibration system was established by combining the above equations and considering displacement coordination and force equilibrium, as shown in Equation (4) [37]:
M v 0 0 M b u ¨ v q ¨ b + C v C v B C b v C b + C b v u ˙ v q ˙ b + K v K v b K b v K b + K b v u v q b = F v F b
where M, C, K, and F are mass, damping, stiffness, and force terms, respectively, and the subscripts bv and vb express vehicle–bridge coupled terms.
Through the establishment of the vehicle model, bridge model, and the coupling model of their interaction, the dynamic analysis process based on the vehicle–bridge coupling system was obtained, as shown in Figure 5. The uncontacted mode refers to the state where the moving vehicle is not in contact with the base beam, and the contact force is zero during its horizontal travel [38].

3.4. Fatigue Assessment Method

The rainflow counting algorithm [39] processes the time history of the tension stress σ. Then, with the extracted stress cycles, the fatigue damage of suspension bridge hangers can be estimated using the Miner rule [40]:
D = i = 1 k n i N i
where ni is the cycle number of the stress range Si, Ni is the fatigue life when the stress range is Si, and D is the fatigue damage. According to the Basquin relation and standard for the design of steel structures [41], the total cycle number N of the allowable stress amplitude of the steel strand is specified as 2 × 10⁶ times, and the corresponding fatigue stress range S is 328 MPa. The S-N curves of the suspenders are obtained using Equation (6).
log N = 15.1 3.5 log S m
The effects of mean stress on fatigue damage were considered using the Goodman diagram. The modified stress range Sm is shown in Equation (7) [11], where σm and σu are the mean stress and ultimate tension strength, respectively:
S m = S 1 σ m σ u

4. Dynamic Parameter Analysis

To check the actual dynamic working status of the bridge structure, dynamic tests were conducted to evaluate the performance of the bridge structure under the ambient and vehicle load, and numerical simulation was conducted according to the actual bridge test conditions.

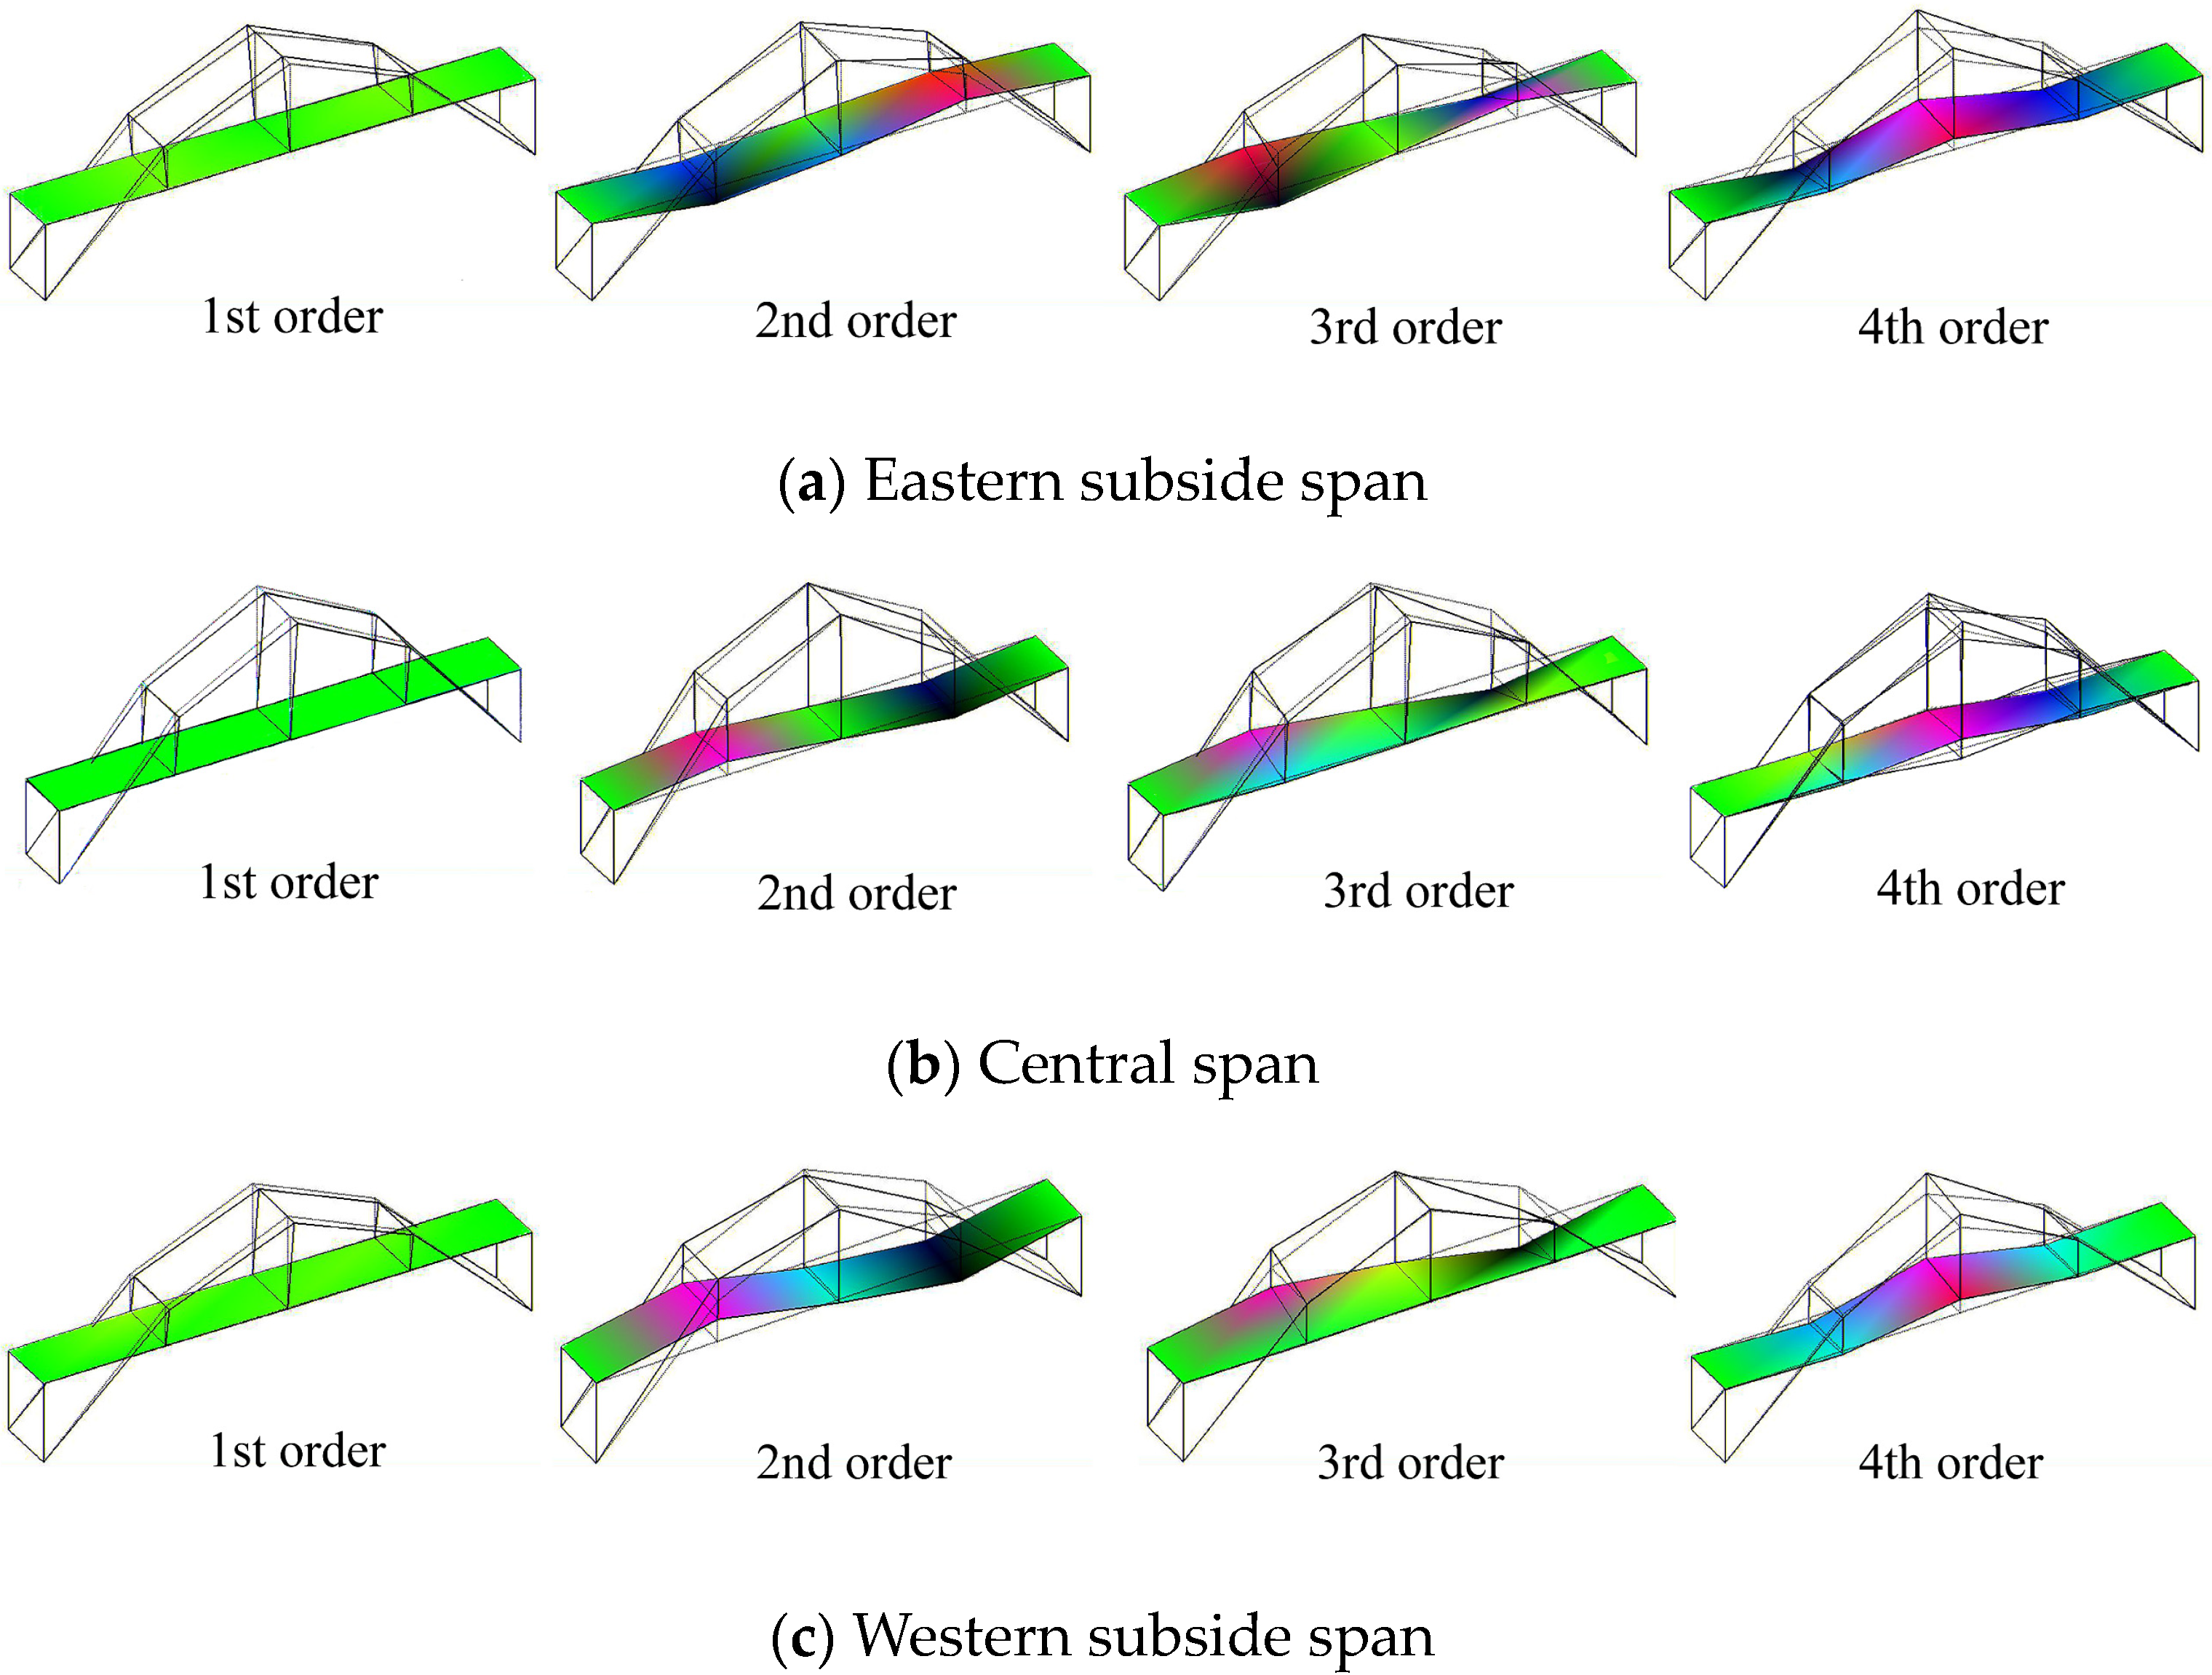
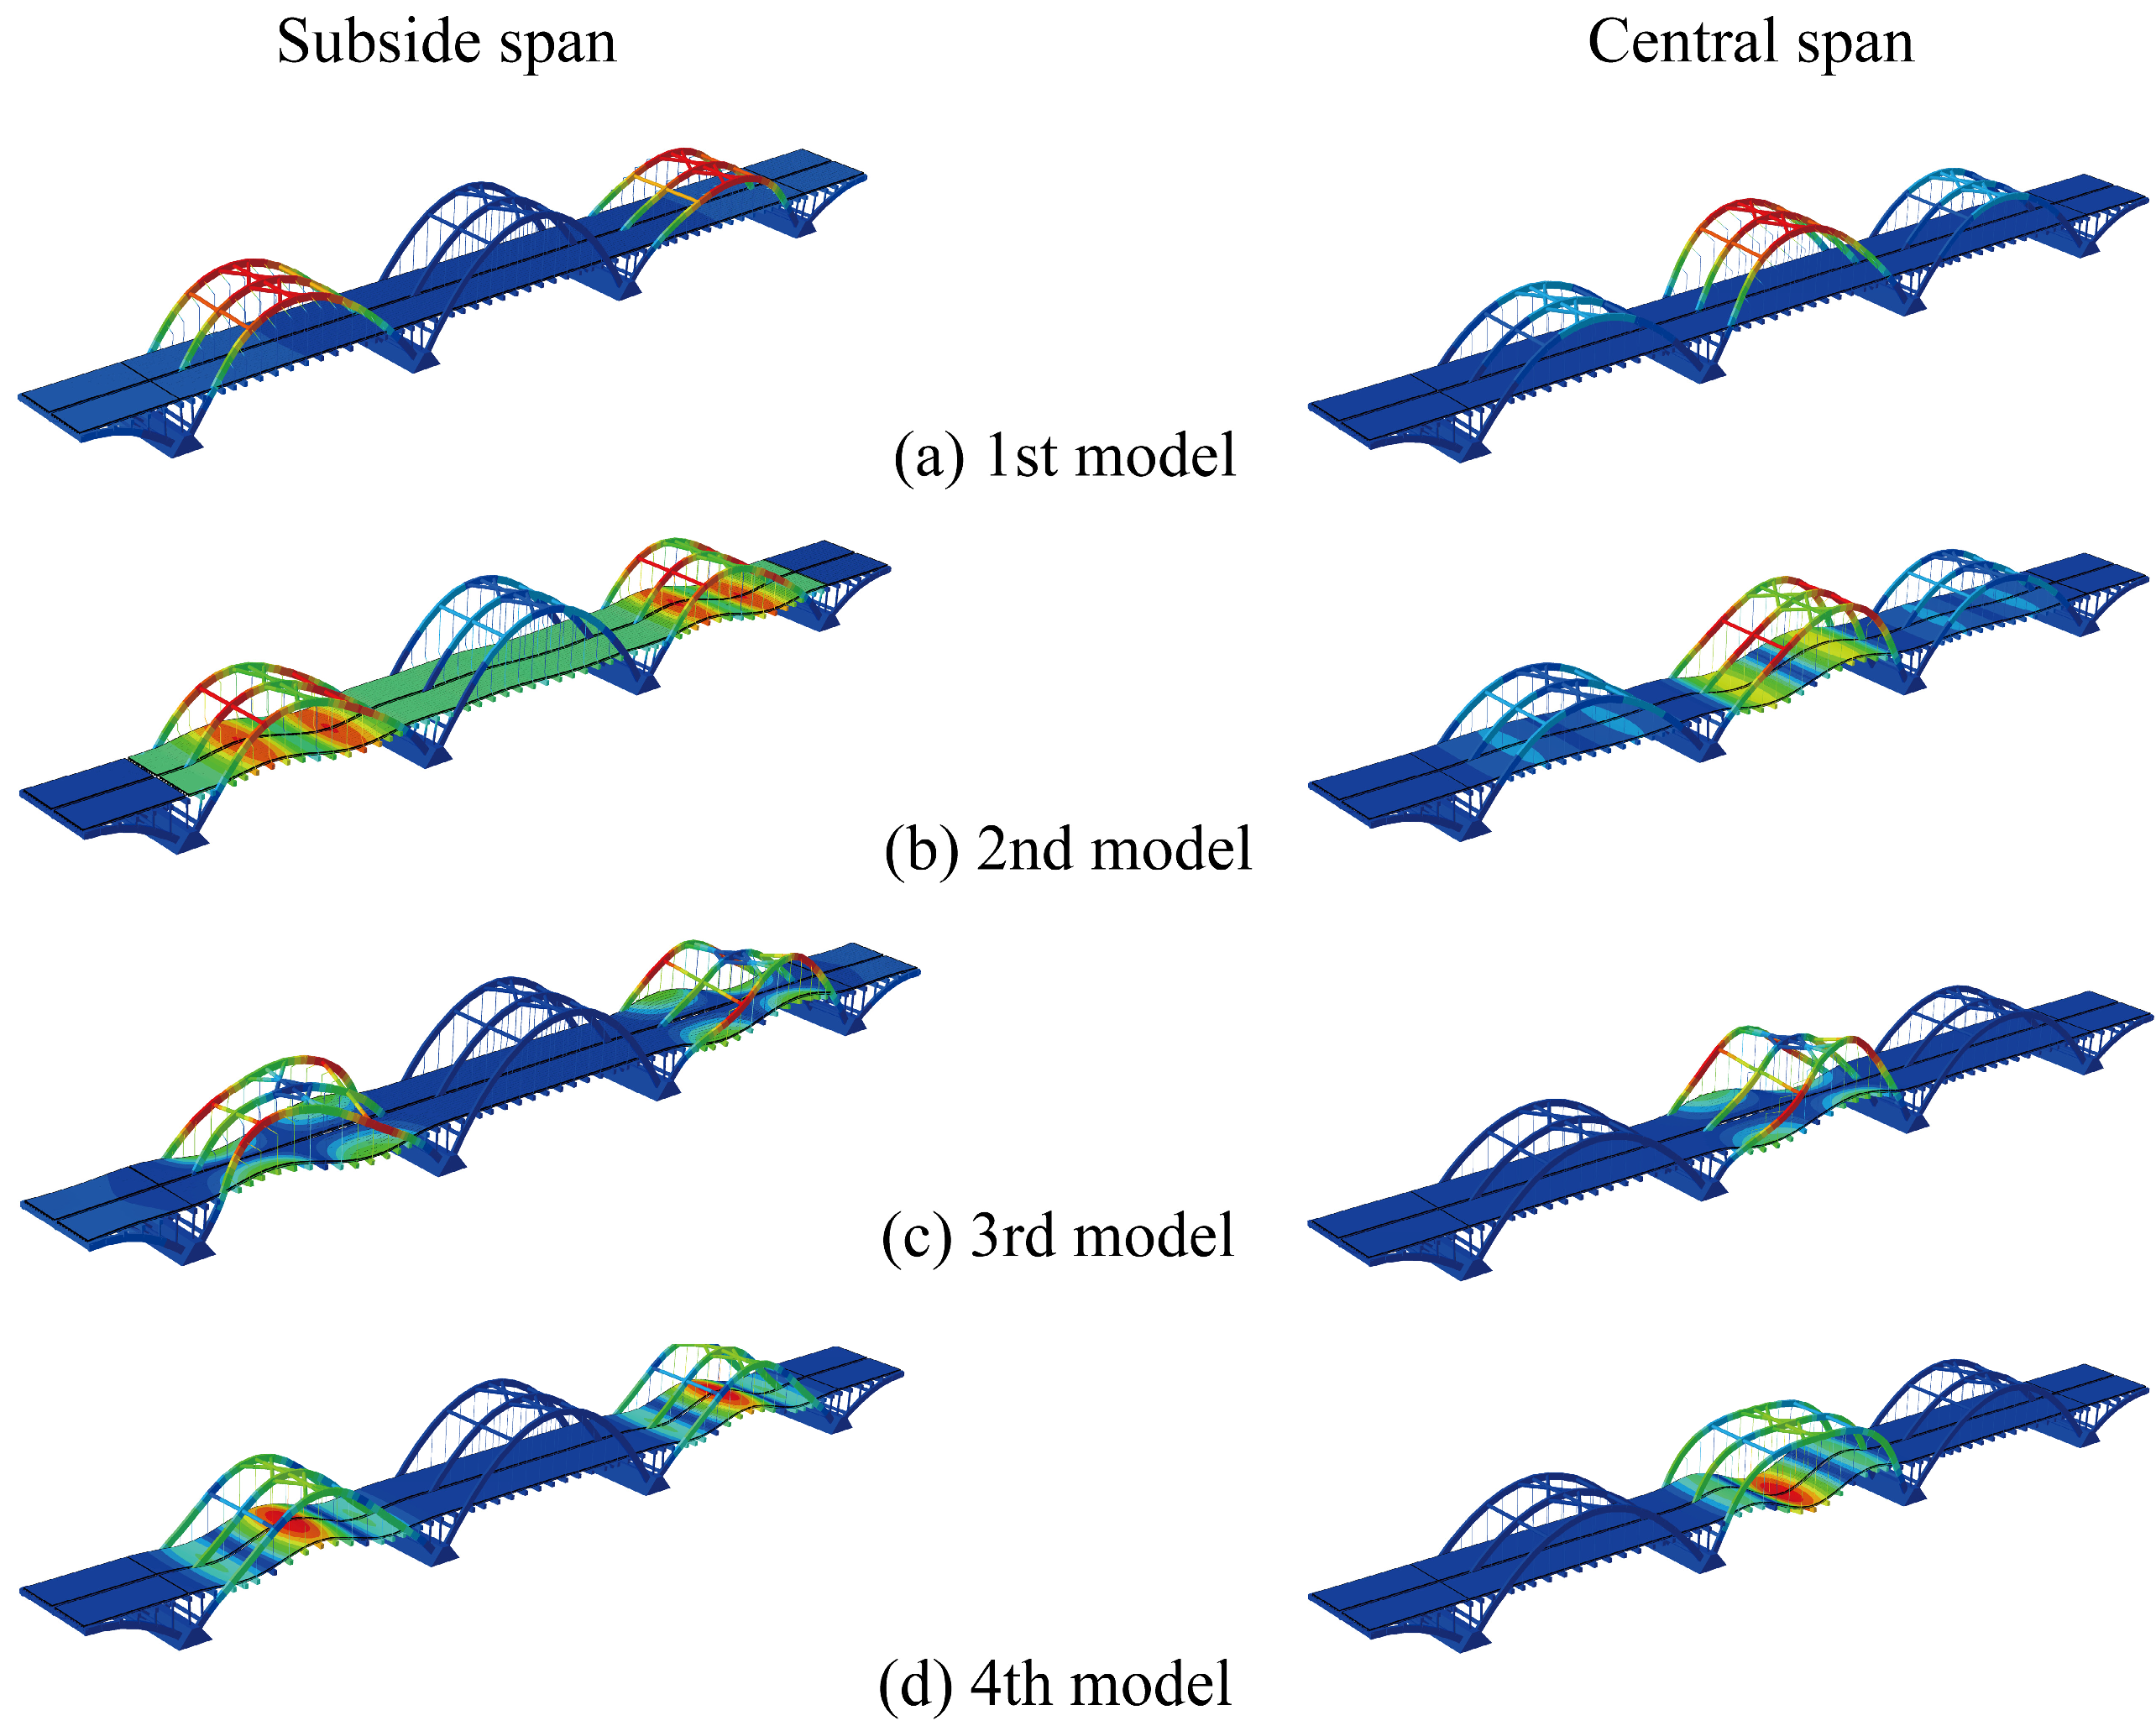
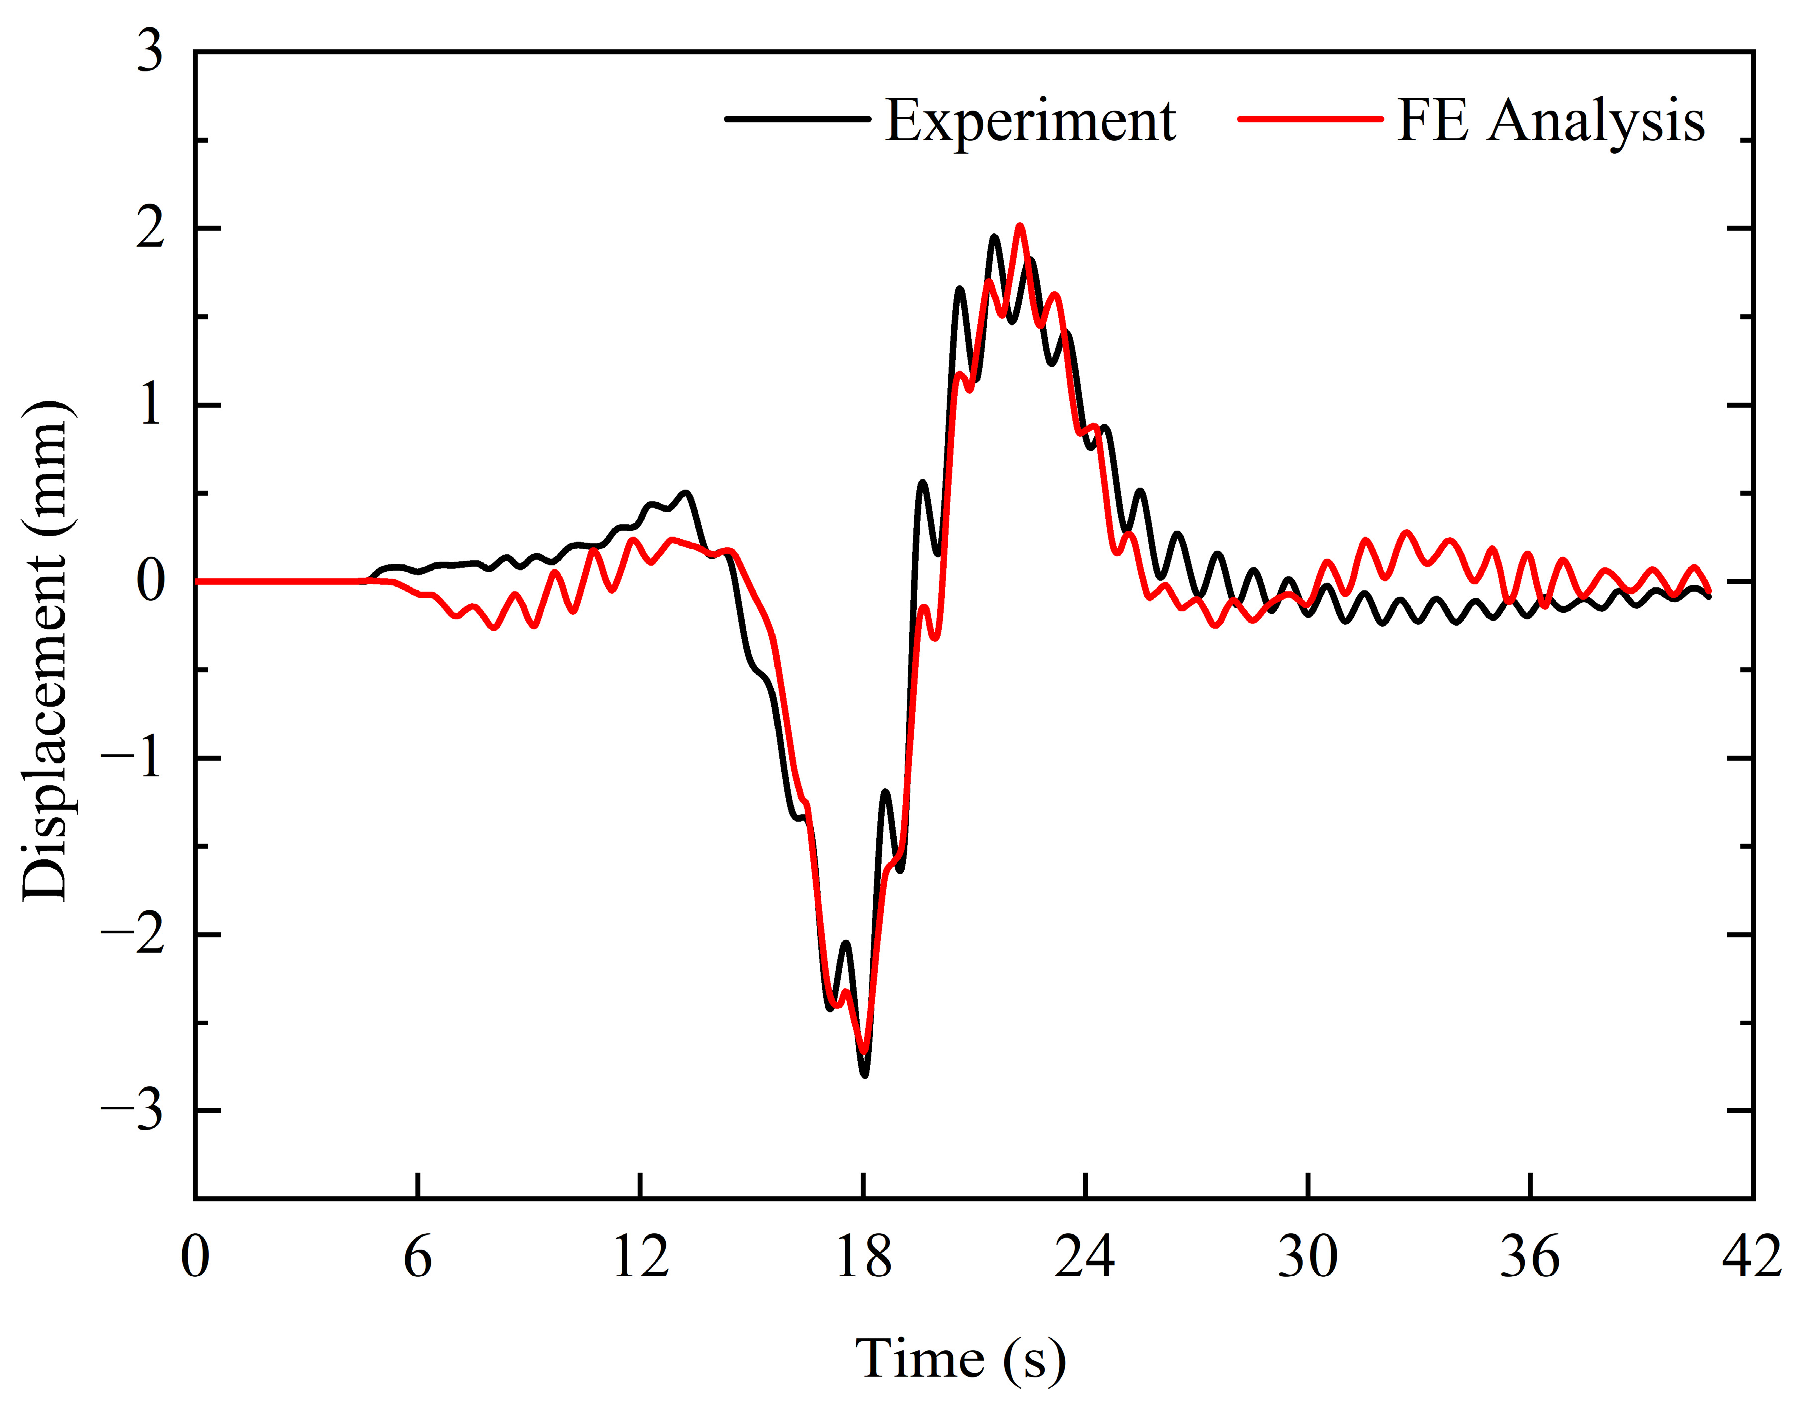
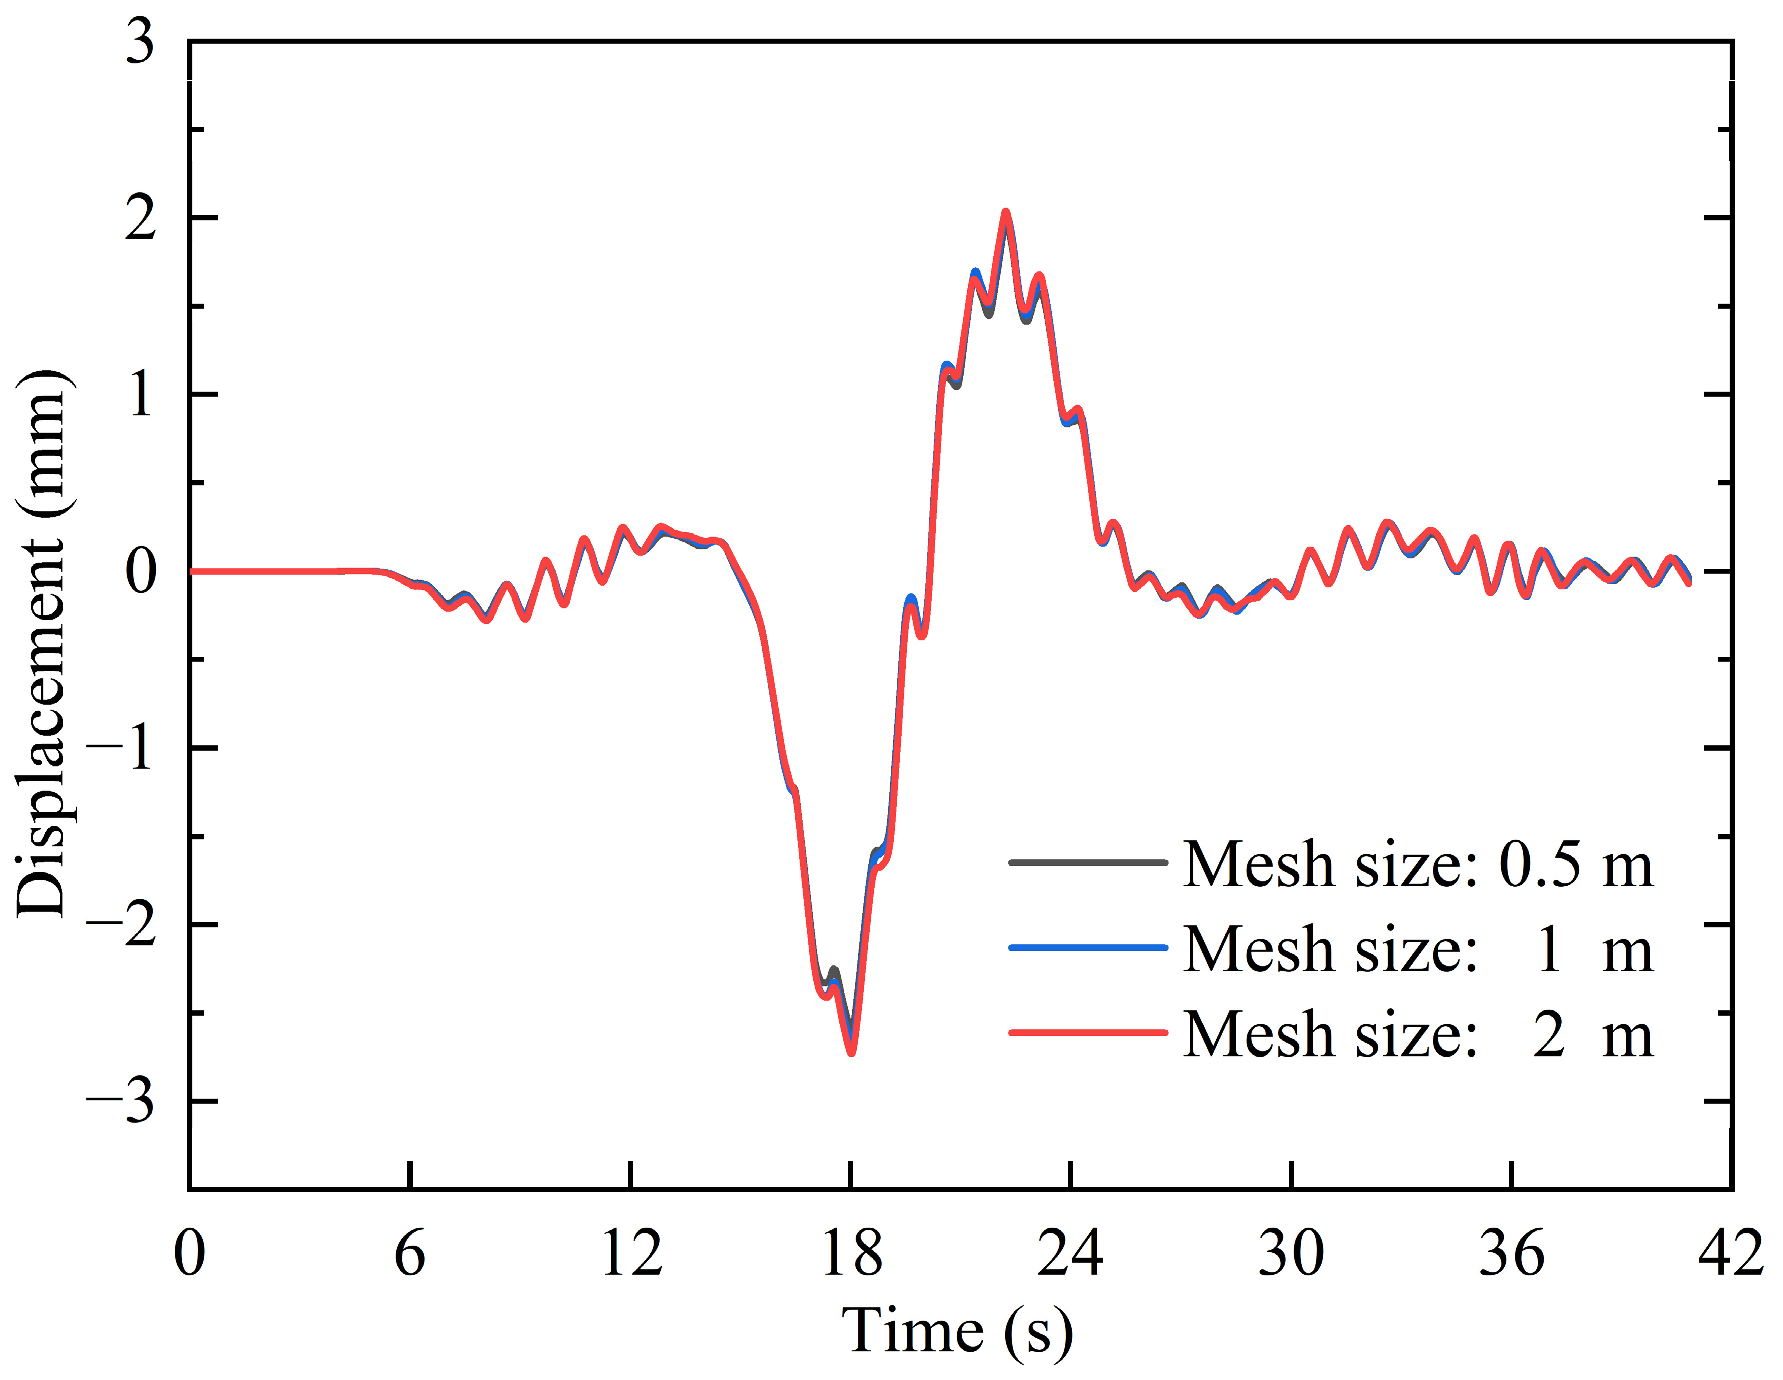
4.1. Verification of Numerical Analysis

The dynamic test included ambient vibration and a moving-vehicle loading test. The mode parameters were identified using the eigensystem realization algorithm (ERA) [42] based on the measured results. The ambient stochastic excitation method was used to collect the accelerometer data using an INV3062W (China Orient Institute of Noise & Vibration, Beijing, China) data acquisition system with a 100 Hz sampling frequency. Vertical sensors were arranged at mid-span sections, quarter-span sections, and the top of the piers, and horizontal sensors were arranged according to the corresponding vertical sensor positions. The vibration mode points are shown in Figure 6.
The first four modal frequencies of each span were obtained (as shown in Figure 7) through modal identification of the measured natural excitation response data. In addition, a moving-vehicle loading test with vehicles passing at speeds ranging from 20 km/h to 50 km/h was carried out on the bridge. The quality of the vehicle model (Figure 2) was the same as that of the test vehicle. The dynamic response data were recorded at the measuring points on the bridge when the vehicle passed.
Based on the in situ test values of the subside and middle spans of the bridge, a finite element numerical model was established to obtain the corresponding modal and frequency numerical values. The analysis results were based on consideration of the axial prestress effect of the tie bars on the main girder, as shown in Figure 8. It can be seen that the modal shapes of the eastern and western subside spans and the central span were basically consistent with those of the numerical model. As the in situ tests only focused on the main beam, the modal shape of the first-order arch ribs was obtained only through numerical analysis. The second to fourth orders corresponded to antisymmetric vertical bending, torsion, and symmetric vertical bending, respectively, and were consistent with the numerical values.
Figure 9 shows the frequency comparison of the experimental and FE analysis values; the frequency values and relative errors for the first four measured orders are given for the eastern subside span (E), the central span (C), and the western subside span (W). The graph illustrates that the maximum errors for the three spans were 6.75%, 8.93%, and 8.82%, respectively, from which it can be concluded that the FE analysis results in this study were in good agreement with the experimental values, thus verifying the reliability of the numerical model.
The deflection variation of the arch rib at the quarter point on the west side of the main span was recorded, using a test vehicle with a weight of 400 kN driving at 30 km/h. The comparison between the displacement predicted in the FE analysis and that obtained from the experiment is shown in Figure 10. From the figure, it is evident that the variation trend of the test and simulation strain values was in good agreement. There was a small degree of reverse deflection phenomenon in the bridge structure model between 30 s and 36 s, which indicates that the interaction of each span of the model is more prominent, and the relative error values at the maximum and minimum displacements were 4.9% and 1.9%, respectively. Therefore, it can be concluded that the variation law of the results presented in this study verifies the numerical analysis model based on the five-axle vehicle and the road roughness, from which reliable vehicle–bridge coupling dynamic response analysis can be obtained. Thus, the model was further utilized for subsequent analysis.
In the numerical analysis of structures, mesh size significantly impacts the accuracy of the results. Therefore, selecting an optimal mesh size is crucial for balancing accuracy and computational efficiency. Figure 11 presents the displacement time history curves under the three mesh sizes of 2 m, 1 m, and 0.5 m, respectively. The analysis results were similar under the different mesh sizes. It should be noted that the mesh sizes shown in the figure are specifically for the bridge deck, with other components having been adjusted proportionally. Considering both accuracy and efficiency, a 1 m mesh size was selected for the numerical model.

4.2. Dynamic Parameter Analysis

In the vehicle–bridge coupling system in Section 3.3, the vehicle acts as the vibration source, and its velocity affects the dynamic response value of the bridge structure. In this study, an analysis of vehicle speed, vehicle weight, and road surface conditions was conducted to evaluate the dynamic characteristics of the bridge. The dynamic performance was evaluated through time history analysis of the main span’s vertical displacement and acceleration. The basic parameters used in the analysis were a vehicle speed of 30 km/h, a vehicle weight of 400 kN, and a road surface condition of grade C. The vehicle and bridge parameters are shown in Table 4.

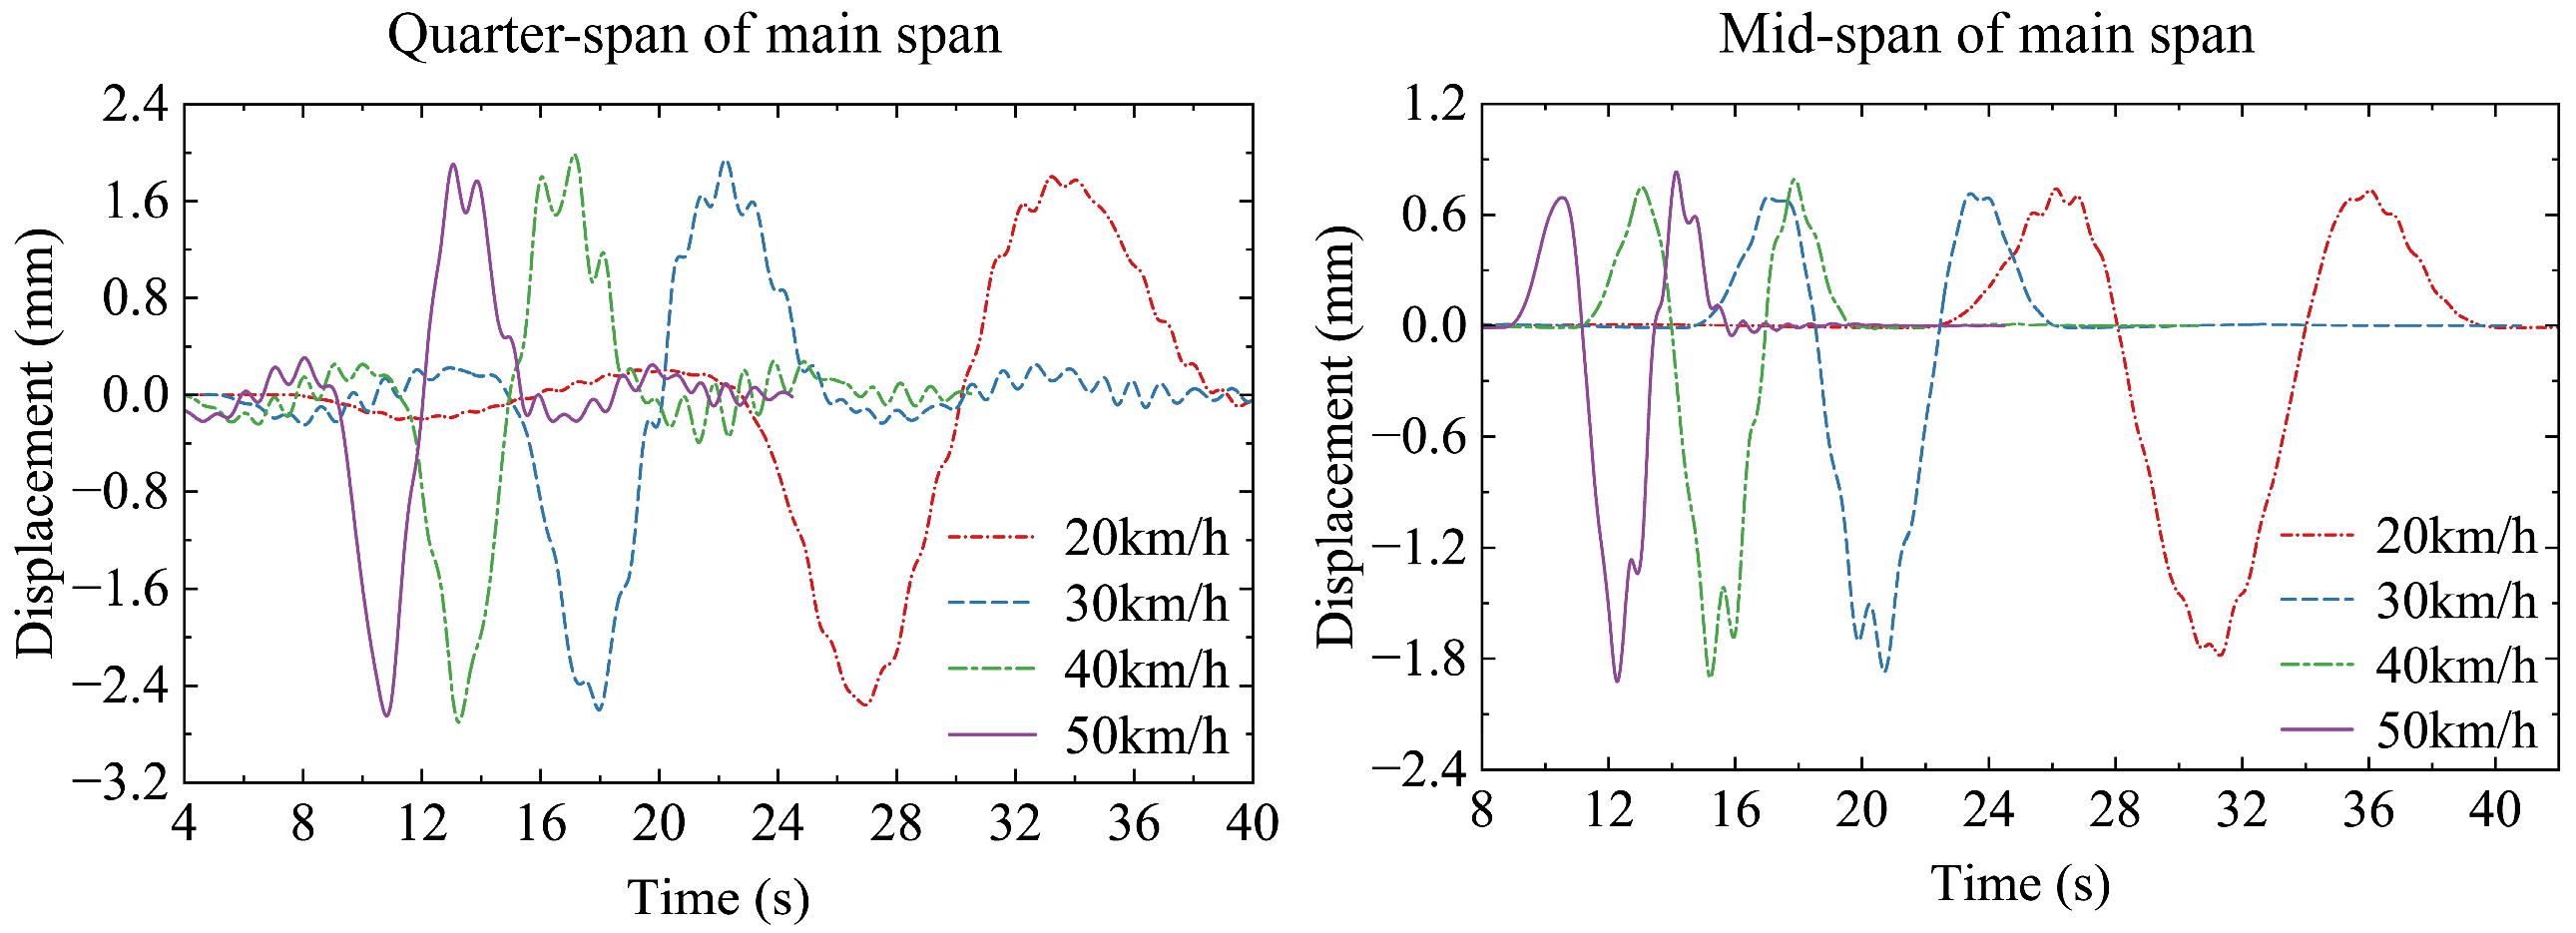
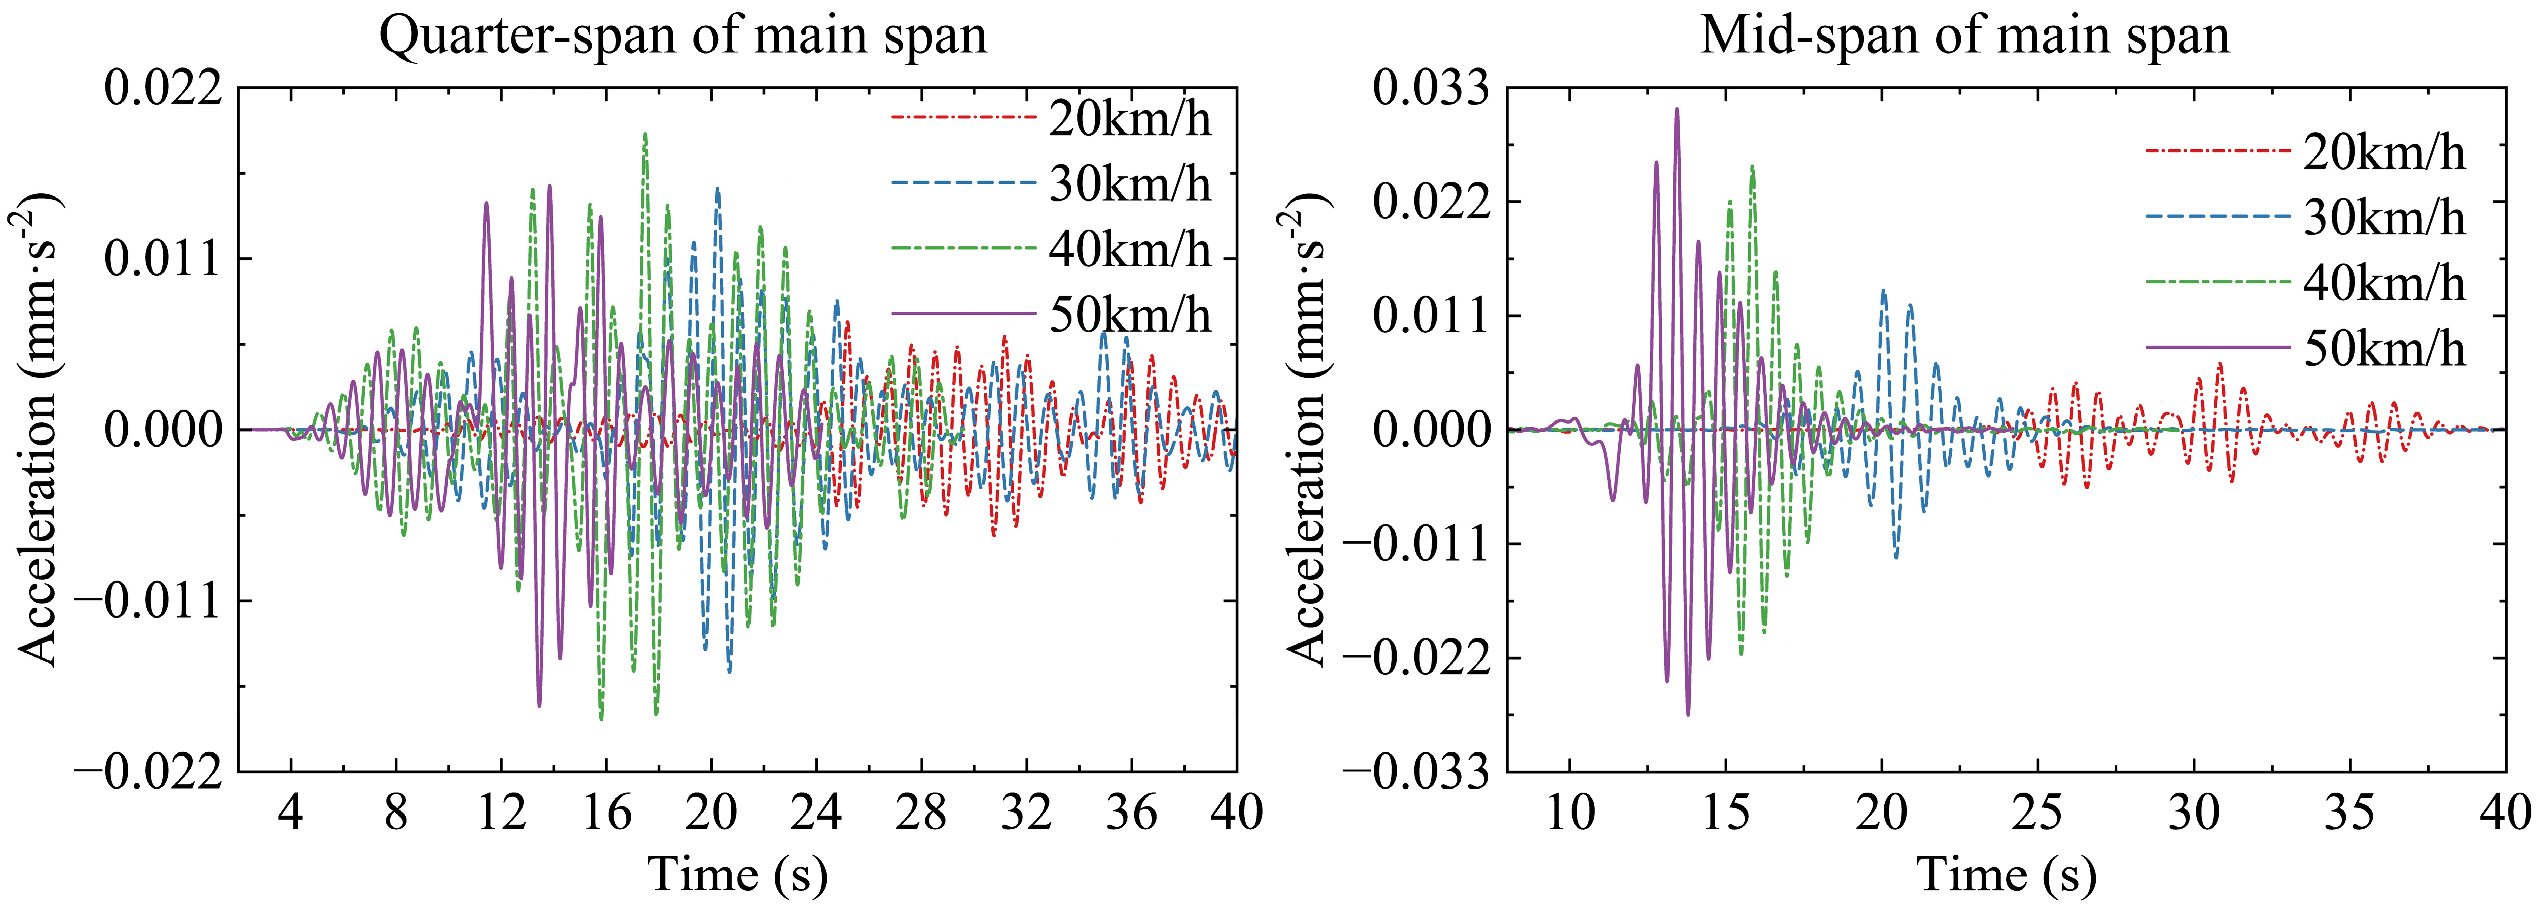
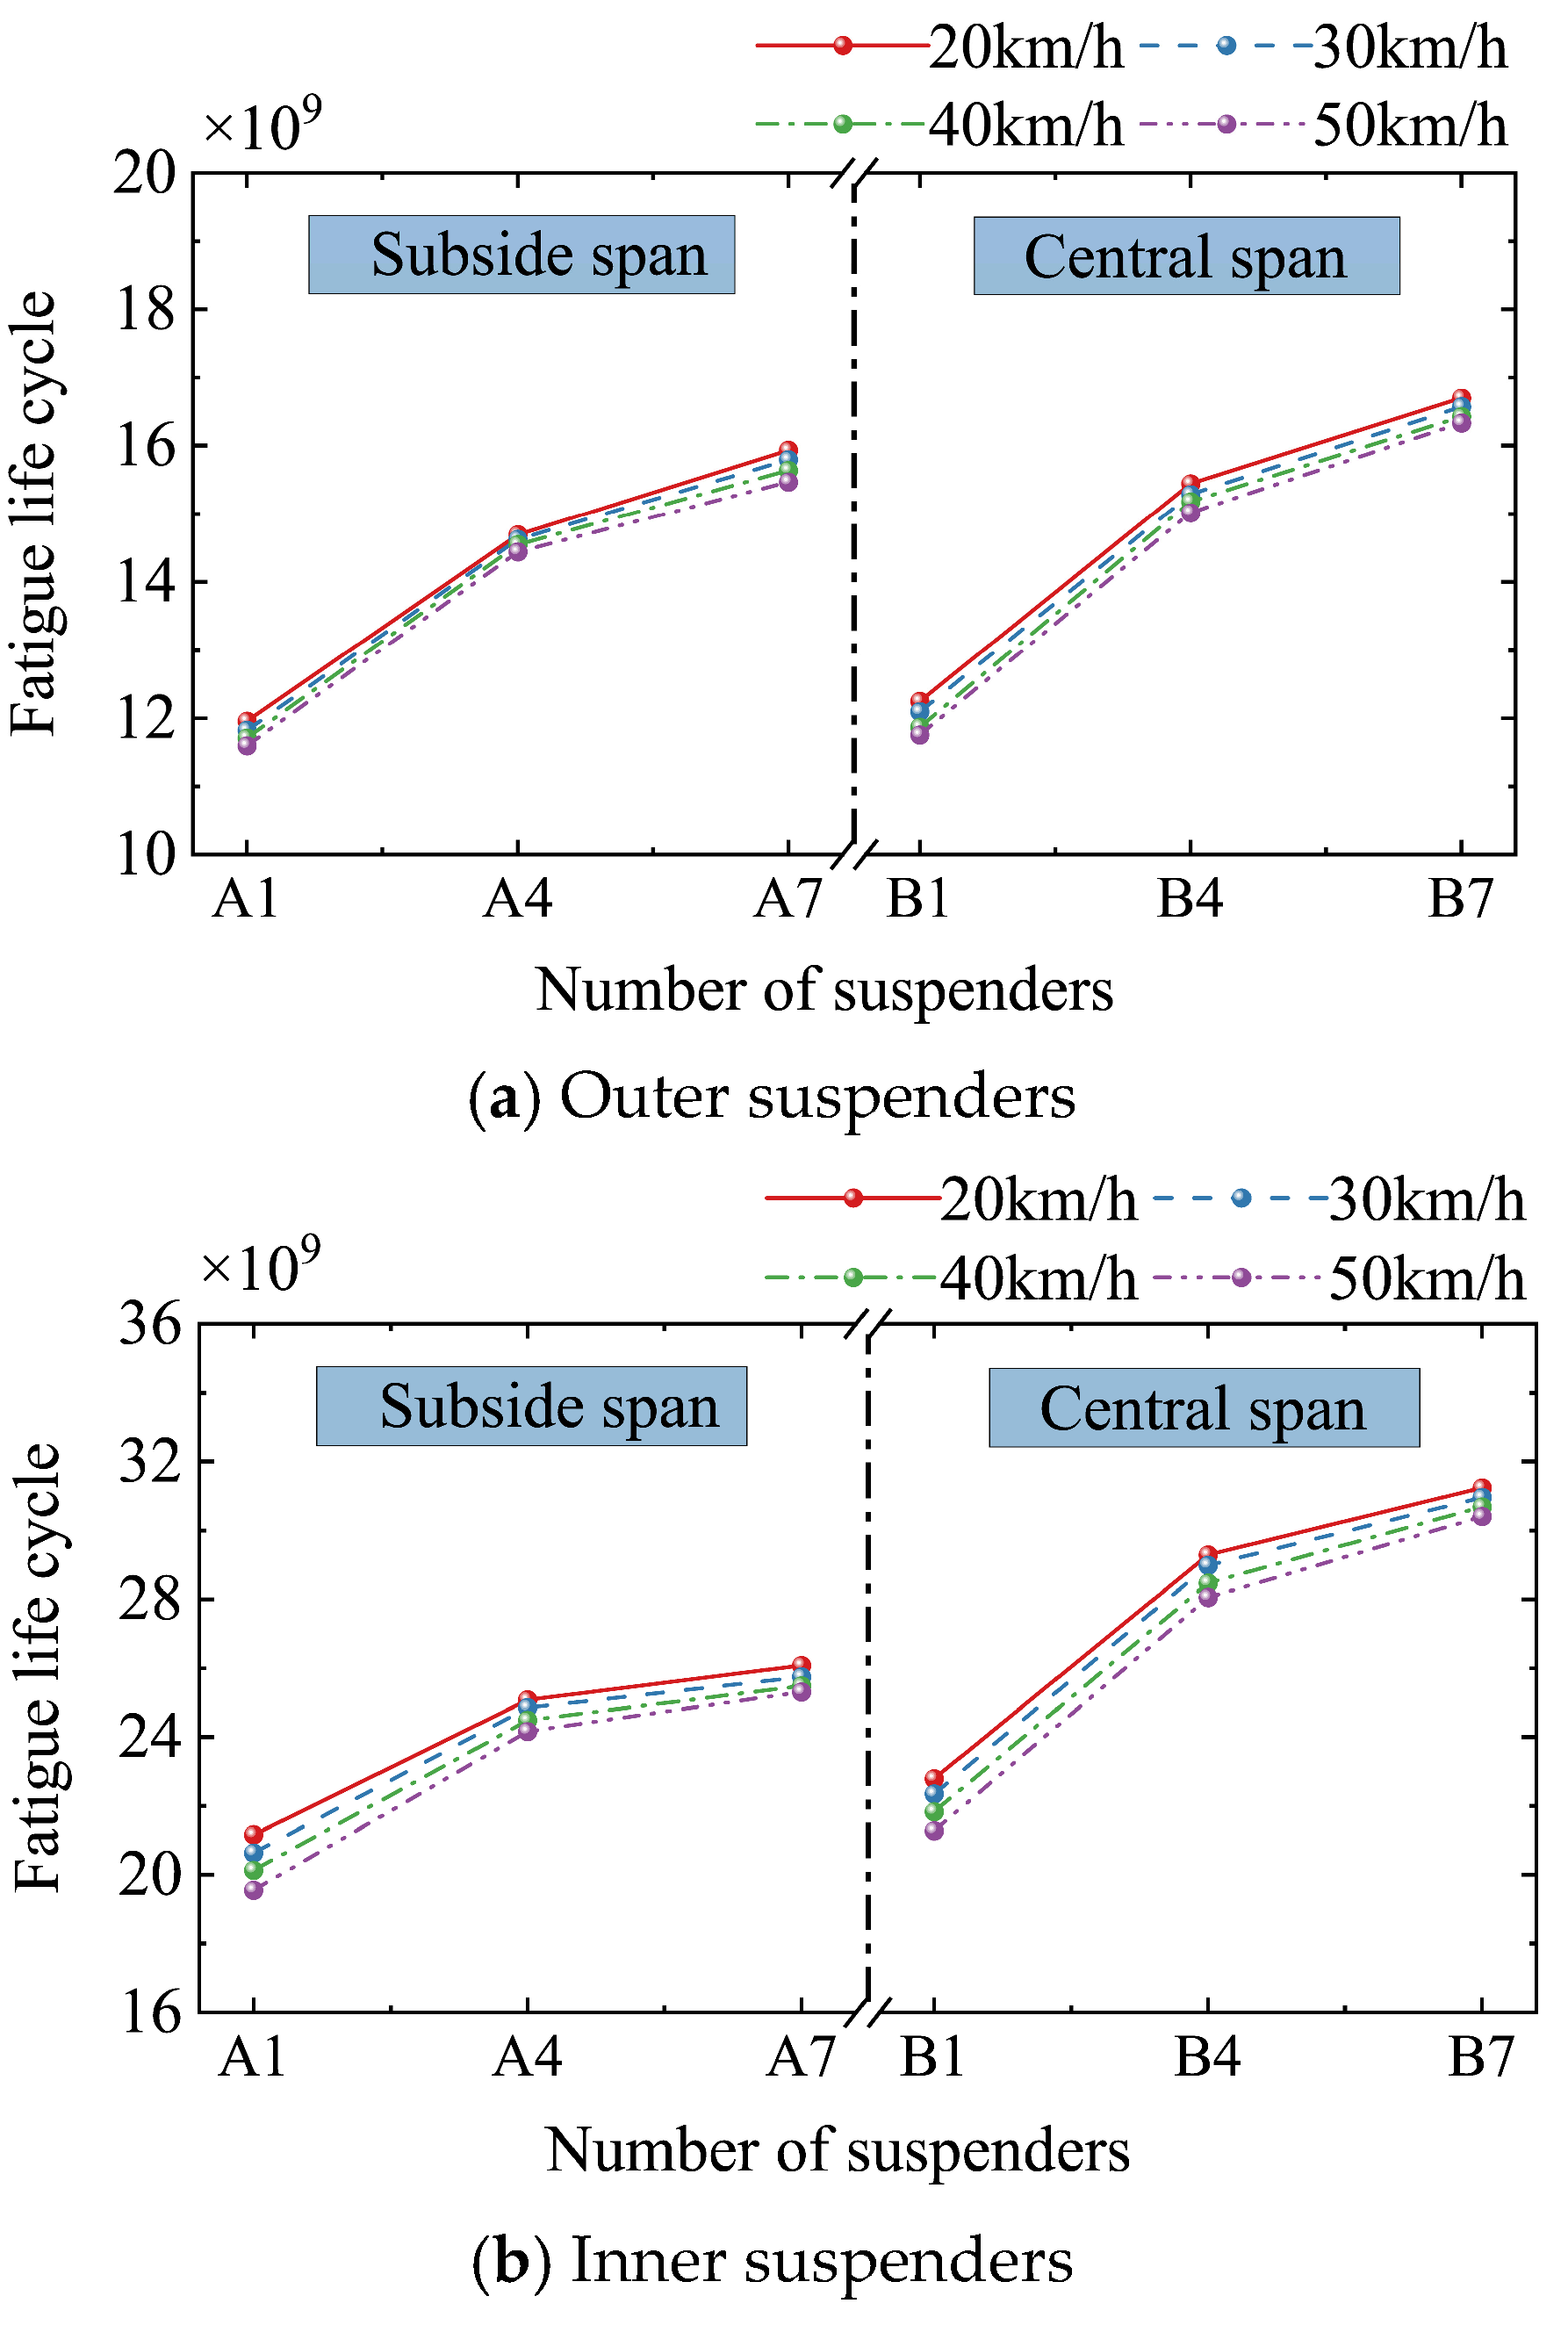
4.2.1. Vehicle Speed

The effect of vehicle speed on the dynamic performance of the structure was analyzed using speed values ranging from 20 km/h to 50 km/h. As shown in Figure 12, with an increase in the vehicle speed, the peak displacement of mid-span and quarter-span did not change much, with a maximum change of 13.9%. Relative to displacement, the acceleration time history curves were more sensitive to vehicle speed, as shown in Figure 13. It is worth noting that the quarter-span acceleration time history curve oscillated significantly at 40 km/h, with a time interval of 13–19 s, which is a critical speed. This phenomenon arises from the periodic loading caused by the spaced-out wheel loads of the vehicle. As a vehicle passes across the bridge at a speed of V, its axle load creates a periodic dynamic force on the bridge with a loading period. When this period matches the natural frequency of the bridge’s nth vibration mode, resonance occurs. Based on calculations from the literature [43], the critical vehicle speed is 38.62 km/h. The numerical analysis results differed from the theoretical calculations in the literature by only 3.6%, and the results can be used to identify conditions that cause resonance. Avoiding resonance frequencies can prevent excessive structural stress, fatigue damage, and material failure, thereby ensuring the bridge’s safety, durability, and comfort.

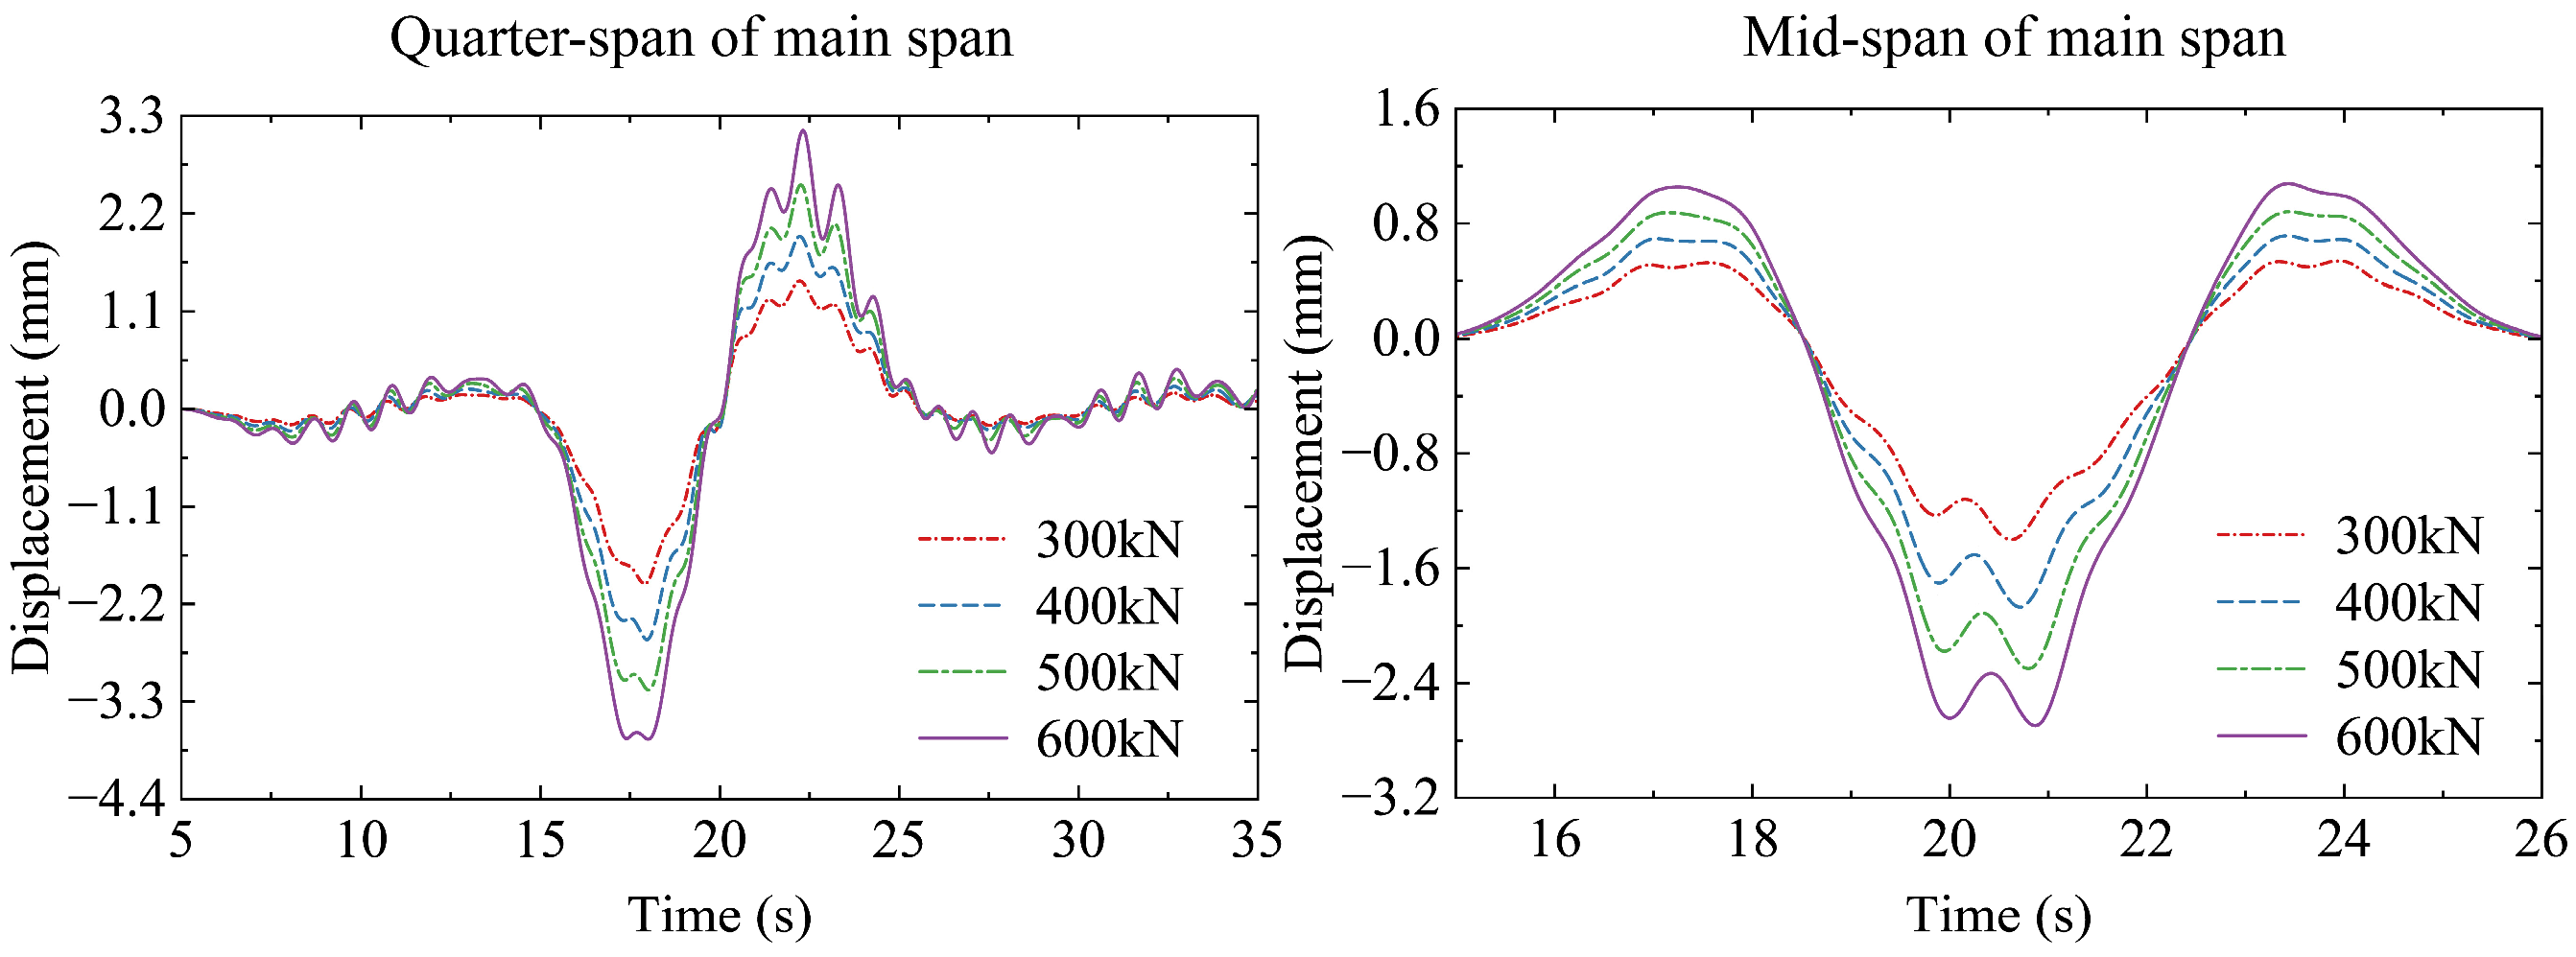
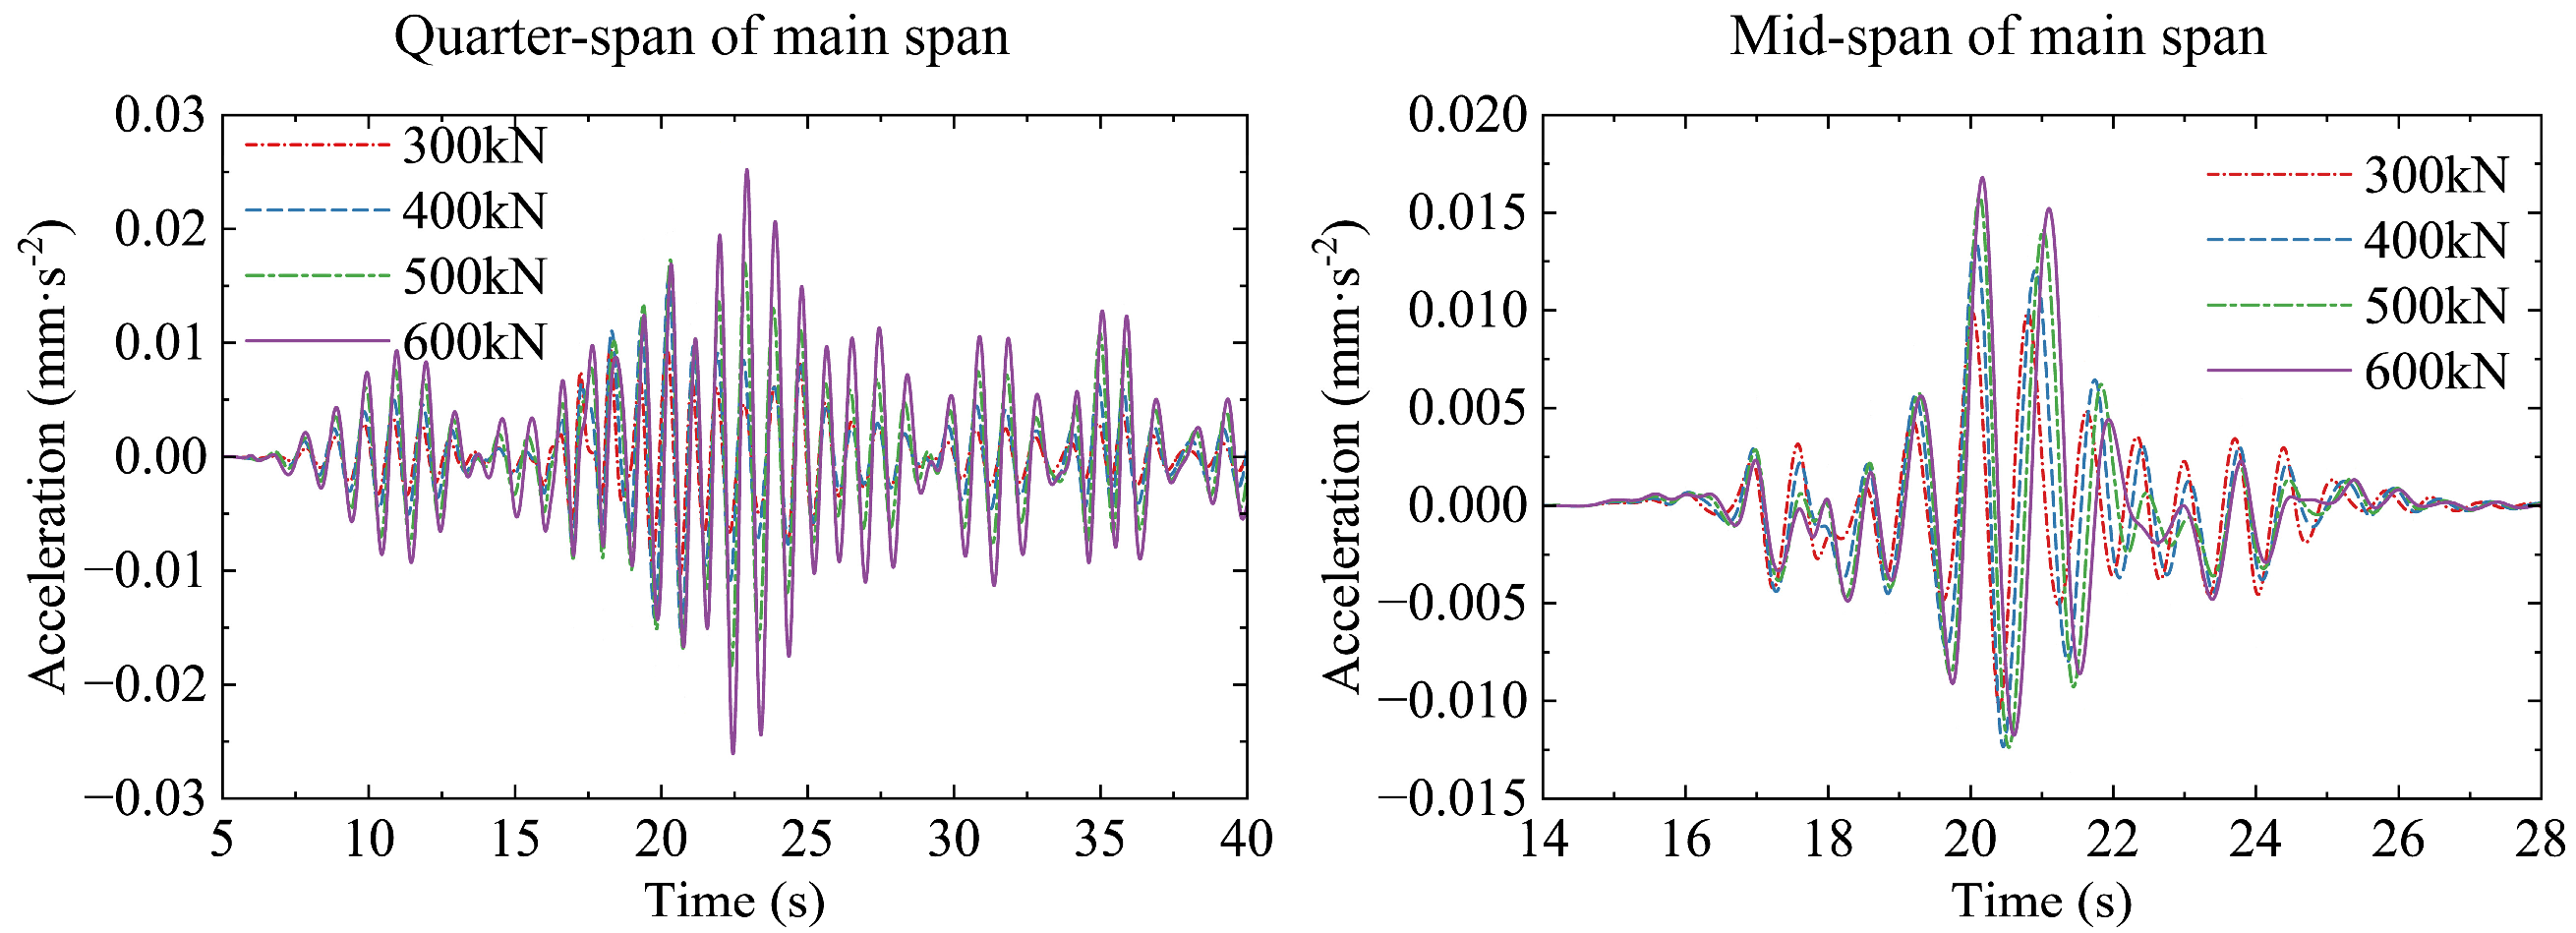
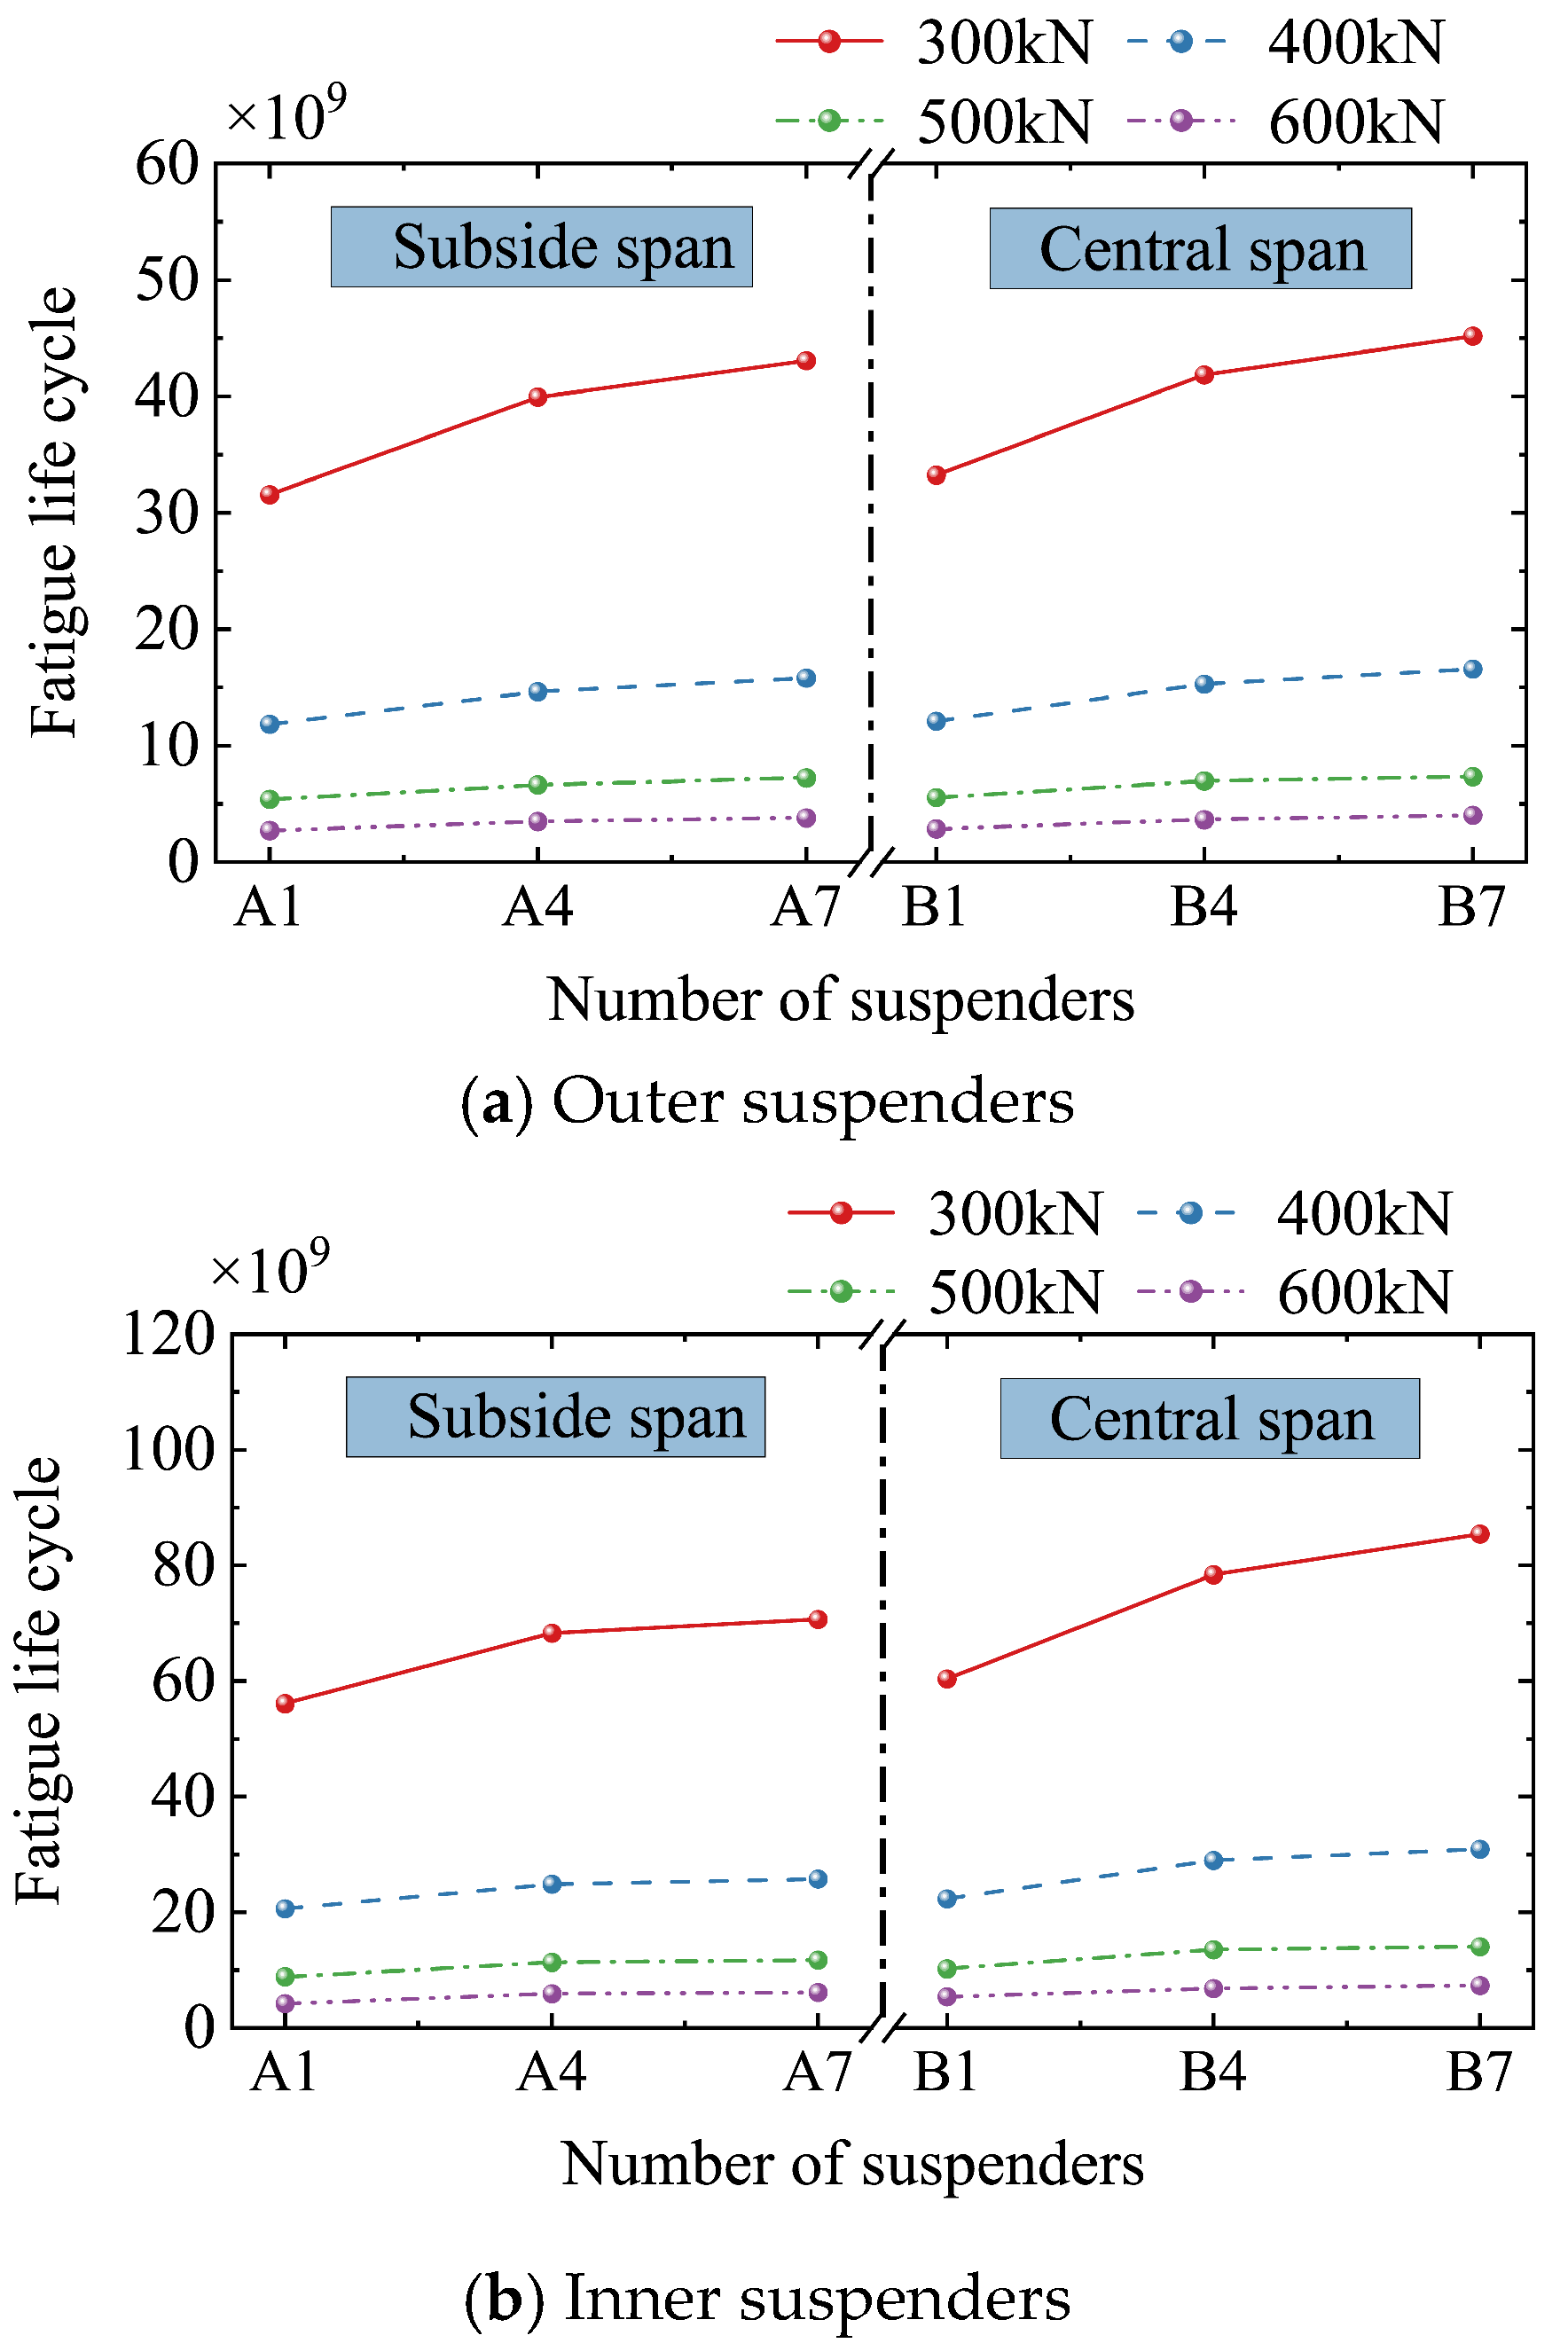
4.2.2. Vehicle Weight

The vehicle weight, as an additional aspect of the vibration source, further affects the dynamic response of the bridge structure. This study analyzed vehicle weights ranging from 300 kN to 600 kN. When compared with the vehicle speed, it can be seen that time history results were more sensitive to vehicle weight, as shown in Figure 14. The peak displacement of the mid-span and the quarter-span of the central span increased with an increase in vehicle weight, with the maximum change being 95.3%. Unlike the vehicle speed, the shape of the time curve generated by the vehicle weight was the same, which indicates that the response levels at the same point remain consistent under different vehicle weights. It is worth noting that the relative residual displacement of the quarter-span was larger than that of the mid-span of the main span, which indicates that different positions have different sensitivities to vehicle weight parameters. Figure 15 shows that the vibration degree of the bridge increased with increasing vehicle weight, while the shape of the acceleration time history curve under different vehicle weights was basically the same; this was the same as the time history law of displacement, and no resonance phenomenon was observed.

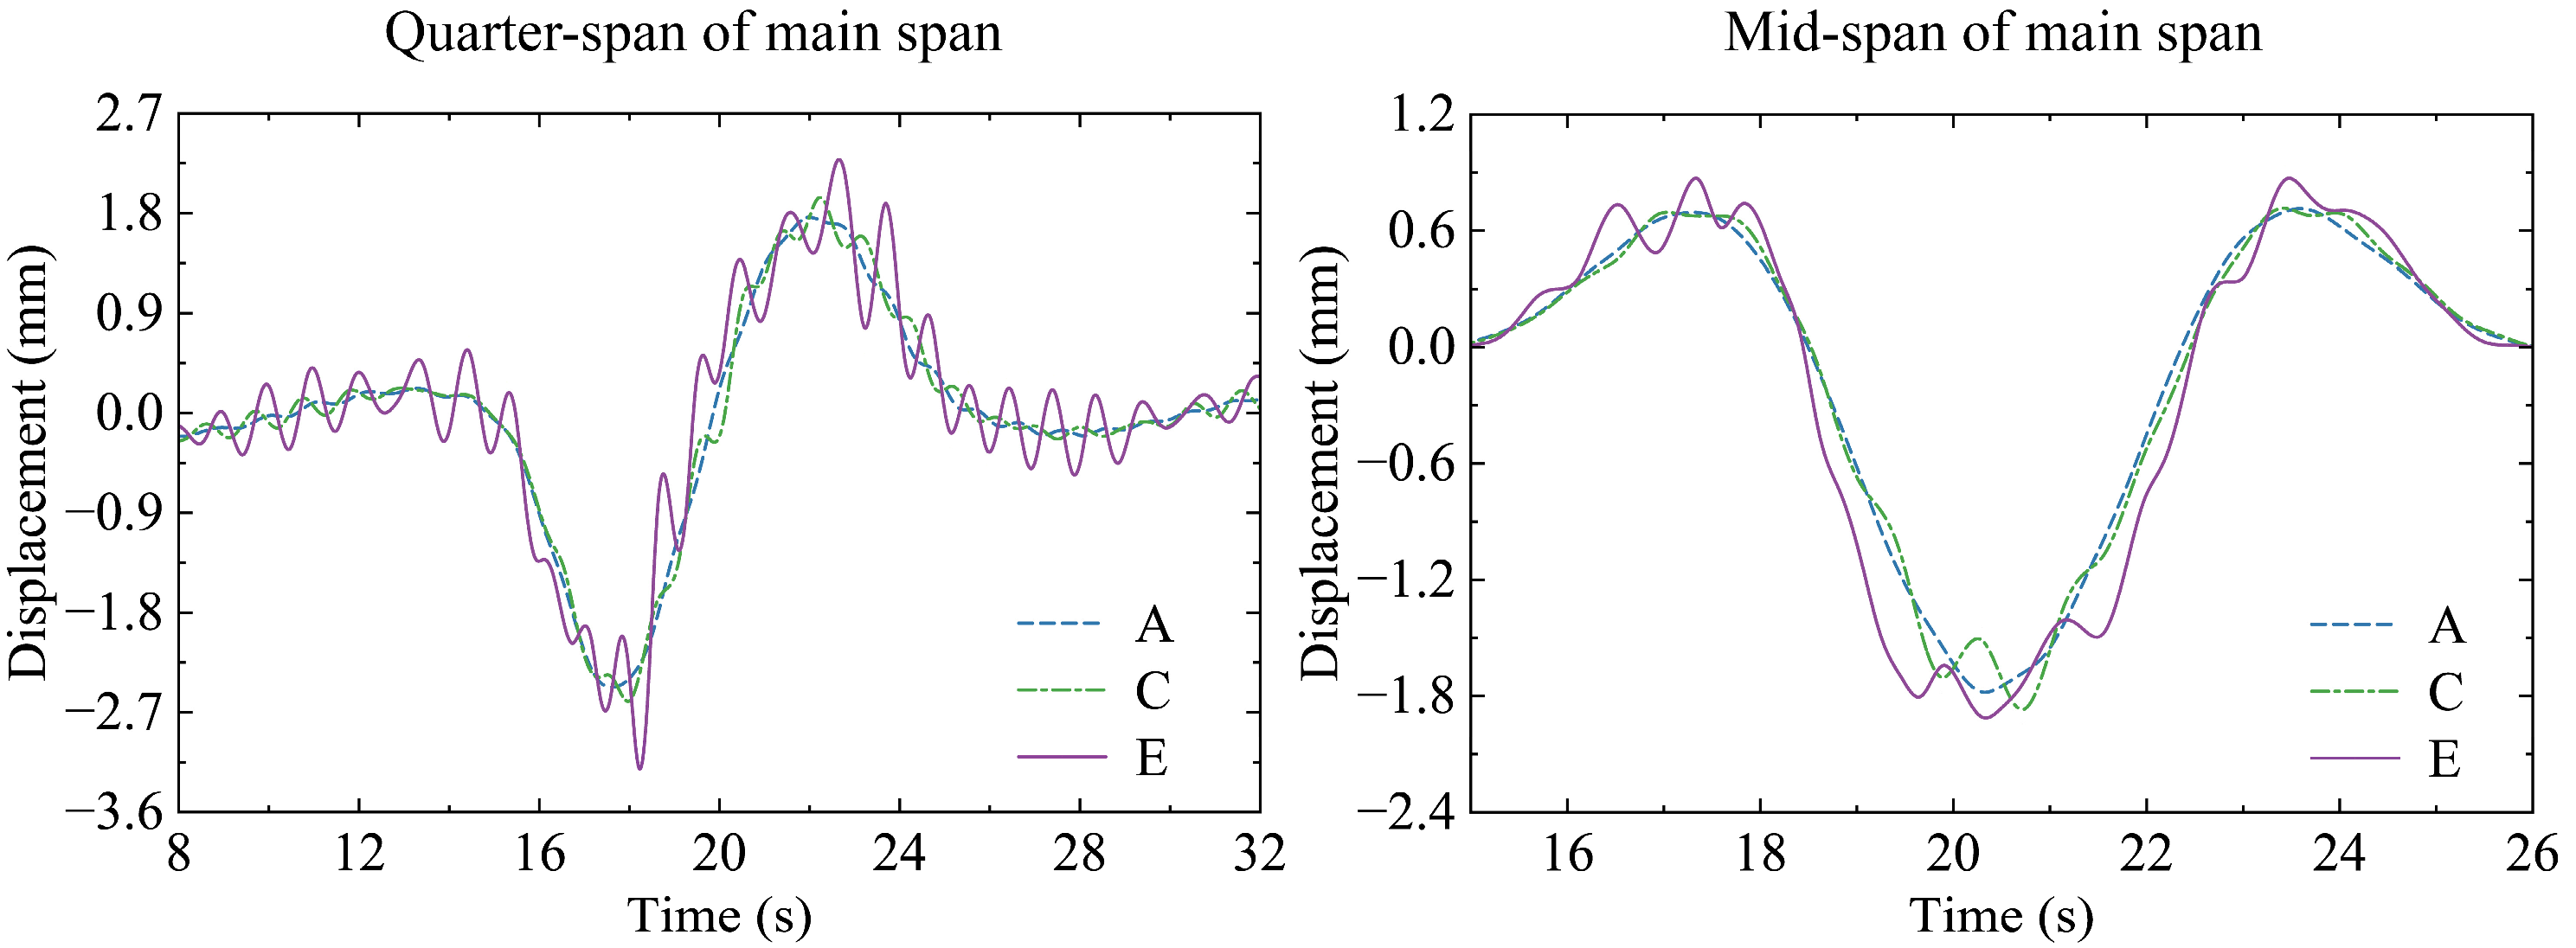
4.2.3. Road Surface Condition

As a parameter of the bridge structure, the road surface condition (RSC) also plays a key role in the response of the vehicle–bridge coupling system. Therefore, three grades of A (very good), C (average), and E (very poor) were used for road surface condition analysis. It can be seen, from Figure 16, that with an increase in the road surface condition level, the oscillation degree of the displacement curve of the mid-span and the quarter-span increases; this is due to the road surface roughness indirectly leading to an increase in vehicle excitation, which, in turn, increases the damage state of the bridge and leads to an increase in displacement. The oscillation amplitude of the curve is more evident in the acceleration time history diagram in Figure 17, from which different road surface conditions can be clearly distinguished; notably, grade E was much higher than the others, and the road surface condition is an essential factor that must be considered in vehicle–bridge coupling analysis.

4.2.4. Results of Key Position

Based on the analysis of various dynamic parameters such as vehicle speed, vehicle weight, and road surface roughness, the stress and displacement results at the mid-span (a key position of the bridge) were evaluated, as shown in Table 5. The results demonstrate that, as vehicle speed and weight increased and when road conditions worsened, the stress and displacement at the key position increased. Compared to vehicle speed and road surface conditions, the results were more sensitive to vehicle weight. Additionally, to further describe the differences in the actual working conditions of the bridge under dynamic loads, compared to those under the same static loads, the variation in the impact coefficient for the key position in the central span under different effect factors was analyzed. The results indicate that, as the vehicle speed increased and the road conditions deteriorated, the impact coefficient at the key position increased, reflecting the enhanced dynamic effects. However, as the vehicle weight increased, the impact coefficient gradually decreased. This is mainly because an increase in vehicle weight leads to a greater static response at the key position of the bridge, while the increase in dynamic response is relatively small, resulting in smoother vehicle passage and reduced dynamic impact on the bridge. According to the specification [31], the impact coefficient calculated based on the frequency was 0.05. The numerical analysis results indicate that it is unsafe to consider only the fundamental frequency of the bridge when calculating the vehicle impact coefficient for long-span concrete-filled steel tube arch bridges.

5. Fatigue Analysis

5.1. Fatigue Life Estimation

An in-depth analysis was conducted to examine the impacts of factors on the fatigue stress cycle counts of the suspenders. Specifically, the inner and outer suspenders located at the subside span and central span of the tied-arch bridge were selected for fatigue analysis. The suspenders (A1, A4, A7, B1, B4, B7) are indicated in Figure 18.
To investigate the effect of vehicle speed, fatigue stress cycle counts during the operational period were calculated for vehicle speeds ranging from 20 km/h to 50 km/h. According to Figure 19, the fatigue stress cycle number of the suspenders decreased slightly with increasing vehicle speed and the maximum value changed by 7.6%, which occurred at the inner suspender A1 in the subside span, while the inner suspender B1 in the central span changed by 6.6%, indicating insensitivity to vehicle speed parameters. Compared to the central span suspenders, the fatigue cycle number of the bridge’s subside suspenders was relatively smaller.
To study the effect of vehicle weight, fatigue stress cycle counts during the operational period were calculated for vehicle weights ranging from 300 kN to 600 kN. The fatigue impact of vehicle weight on each suspender is illustrated in Figure 20. Analysis of the figure reveals significant variations in the fatigue stress cycle counts of bridge suspenders with different vehicle weights. Overloaded vehicles notably impacted the structural fatigue life, as increased overloading accelerates damage accumulation rates, consequently reducing fatigue life [44]. When the vehicle weight was reduced, the variation in fatigue stress cycles for different span suspenders ranged from 63.0% to 92.5%. The fatigue life of the suspenders increased non-linearly with decreasing vehicle weight. Considering the actual operational conditions of the bridge, imposing a weight limit of 400 kN during bridge operations would effectively enhance the fatigue life of the suspenders. Additionally, the analysis indicates that the fatigue stress cycle count of outer suspenders was significantly lower than that of inner suspenders, and generally increased with suspender length. Consequently, special attention should be given to the shorter outer suspenders during the operation of the bridge.
The road surface condition of the bridge deck directly affects the interaction between vehicles and the bridge, significantly impacting fatigue stress [21]. To study the influence of bridge deck unevenness levels, the fatigue cycle counts of suspenders were calculated for levels A, C, and E, where the analysis employed multiple random road surface mean values to eliminate the effects of randomness. Figure 21 illustrates the impact of bridge deck unevenness on the fatigue cycle counts of suspenders, from which it is evident that as the bridge deck deteriorated, the fatigue cycle counts of the suspenders gradually decreased. Moreover, as the bridge deck level changed from A to E, the rate of change in fatigue cycle counts of suspenders gradually increased, indicating a decrease in the fatigue life of the bridge due to severe bridge deck deterioration.

5.2. Fatigue Reliability under Corrosion

A fatigue reliability study was conducted on the suspenders before and after corrosion. The suspender corrosion type was uniform corrosion, which was simulated by reducing the cross-sectional area of the suspender [45]. This method was used to analyze the variations in fatigue reliability under the influence of vehicle speed, vehicle weight, and road surface condition parameters, as shown in Table 6. From the results, it can be observed that, compared to the reliability indicators without corrosion, the mean reliability indicators considering corrosion exhibited decreases ranging from 15.1% to 23.5%, and the decrease was primarily evident in terms of vehicle weight, indicating that changes in vehicle weight have a more significant effect on fatigue under the effect of corrosion. According to the relevant regulations regarding the fatigue limit state of steel components [46], the fatigue reliability index β for the cable was taken as 3.5; as such, the fatigue reliability of the suspenders was greater than the safety standard under non-corrosive conditions. However, under the corrosion effect, the fatigue reliability was less than the safety standard when the weight of the car was 600 kN. As for road surface conditions, the difference between level A and level E was 1.6%. Compared to changes in vehicle weight and road surface condition, the change before and after corrosion was relatively small at different speeds.

6. Conclusions

The fatigue life of a CFST arch bridge was evaluated based on vehicle–bridge coupling vibration analysis. Through establishing a vehicle–bridge coupling model and employing the triangular series method to simulate road roughness, the actual working state of the bridge when a vehicle passes was reflected. The reliability of the numerical model was verified by comparing its predicted results with in situ measured results. The dynamic performance of the considered structure under different vehicle and road surface parameters was analyzed, and discussions regarding the structure’s fatigue life were provided. Corrosion factors were further considered, in order to calculate the change rate of fatigue life of the bridge under different conditions. The main conclusions derived from the performed calculations can be summarized as follows:
(1)
While the effect of vehicle speed on the dynamic performance of the bridge is relatively small, it should be noted that the frequency caused by a change in vehicle speed gradually approaches a certain order of the bridge’s vertical bending frequency, leading to a resonance phenomenon. Compared to vehicle speed and road surface condition, the response time history results are more sensitive to vehicle weight. The increased proportion between vehicle weight response and displacement time history is basically the same. With an increase in the road surface condition, the oscillation degree increases, and this phenomenon is more evident in the acceleration time history.
(2)
Under vehicle loads, the fatigue cycle number of the bridge’s subside span suspenders is relatively smaller, compared to the central span suspenders; that of outer suspenders is significantly lower than that of inner suspenders from the cross-sectional direction of the bridge; and the fatigue life of short suspenders is significantly less than that of longer suspenders.
(3)
Environmental corrosion reduces the effective cross-sectional areas of suspenders, substantially raising their cyclic stresses when subjected to vehicle loads, especially for bridges with heavy vehicle loads and poor road conditions. Thus, specific consideration is required during the evaluation and analysis of suspender fatigue life.
(4)
Improving structural dynamic performance is necessary for a long-serving CFST arch bridge. The proposed fatigue evaluation method based on the vehicle–bridge coupled vibration analysis system reflects the structure’s dynamic performance well.

Author Contributions

Methodology, W.H.; software, B.Z.; validation, B.Z.; formal analysis, X.Z.; data curation, X.Z.; supervision, W.H.; funding acquisition, X.Z. All authors have read and agreed to the published version of the manuscript.

Funding

Key research and development program of Shaanxi (2024SF-YBXM-616), Shaanxi Teacher Development Research Project (SJS2022ZQ019).

Data Availability Statement

Data are contained within the article.

Conflicts of Interest

The authors declare no conflicts of interest.

References

  1. Chen, B.; Wang, T. Overview of Concrete Filled Steel Tube Arch Bridges in China. Pract. Period. Struct. Des. Constr. 2009, 14, 70–80. [Google Scholar] [CrossRef]
  2. Zheng, J.; Wang, J. Concrete-Filled Steel Tube Arch Bridges in China. Engineering 2018, 4, 143–155. [Google Scholar] [CrossRef]
  3. Huang, H.; Xue, C.; Zhang, W.; Guo, M. Torsion Design of CFRP-CFST Columns Using a Data-Driven Optimization Approach. Eng. Struct. 2022, 251, 113479. [Google Scholar] [CrossRef]
  4. Wei, J.; Ying, H.; Yang, Y.; Zhang, W.; Yuan, H.; Zhou, J. Seismic Performance of Concrete-Filled Steel Tubular Composite Columns with Ultra High Performance Concrete Plates. Eng. Struct. 2023, 278, 115500. [Google Scholar] [CrossRef]
  5. Deng, L.; Nie, L.; Zhong, W.; Wang, W. Developing Fatigue Vehicle Models for Bridge Fatigue Assessment under Different Traffic Conditions. J. Bridge Eng. 2021, 26, 04020122. [Google Scholar] [CrossRef]
  6. Zhang, J.; Song, Z.; Han, B.; Xie, H.; Li, P. Research Progress on Fatigue of Highway Concrete Bridges under Vehicle Loading. China Civ. Eng. J. 2022, 55, 65–79. [Google Scholar] [CrossRef]
  7. Zhang, C. The Active Rotary Inertia Driver System for Flutter Vibration Control of Bridges and Various Promising Applications. Sci. China Technol. Sci. 2023, 66, 390–405. [Google Scholar] [CrossRef]
  8. Chan, T.H.T.; Guo, L.; Li, Z.X. Finite Element Modelling for Fatigue Stress Analysis of Large Suspension Bridges. J. Sound Vib. 2003, 261, 443–464. [Google Scholar] [CrossRef]
  9. Zhou, H.; Liu, K.; Shi, G.; Wang, Y.Q.; Shi, Y.J.; De Roeck, G. Fatigue Assessment of a Composite Railway Bridge for High Speed Trains. Part I: Modeling and Fatigue Critical Details. J. Constr. Steel Res. 2013, 82, 234–245. [Google Scholar] [CrossRef]
  10. Imam, B.M.; Righiniotis, T.D. Fatigue Evaluation of Riveted Railway Bridges through Global and Local Analysis. J. Constr. Steel Res. 2010, 66, 1411–1421. [Google Scholar] [CrossRef]
  11. Basso, P.; Casciati, S.; Faravelli, L. Fatigue Reliability Assessment of a Historic Railway Bridge Designed by Gustave Eiffel. Struct. Infrastruct. Eng. 2015, 11, 27–37. [Google Scholar] [CrossRef]
  12. Yang, H.; Wang, P.; Qian, H. Fatigue Behavior of Typical Details of Orthotropic Steel Bridges in Multiaxial Stress States Using Traction Structural Stress. Int. J. Fatigue 2020, 141, 105862. [Google Scholar] [CrossRef]
  13. Huang, Y.; Zhang, Q.; Bao, Y.; Bu, Y. Fatigue Assessment of Longitudinal Rib-to-Crossbeam Welded Joints in Orthotropic Steel Bridge Decks. J. Constr. Steel Res. 2019, 159, 53–66. [Google Scholar] [CrossRef]
  14. Xiao, X.; Yan, Y.; Chen, B. Stochastic Dynamic Analysis for Vehicle-Track-Bridge System Based on Probability Density Evolution Method. Eng. Struct. 2019, 188, 745–761. [Google Scholar] [CrossRef]
  15. Shamsi, M.; Zakerinejad, M.; Vakili, A.H. Seismic Analysis of Soil-Pile-Bridge-Train Interaction for Isolated Monorail and Railway Bridges under Coupled Lateral-Vertical Ground Motions. Eng. Struct. 2021, 248, 113258. [Google Scholar] [CrossRef]
  16. Lou, P.; Yau, J.D.; Au, F.T.K.; Urushadze, S. Shifted Resonance of Railway Bridges Under Trains Passing by Each Other. Int. J. Str. Stab. Dyn. 2022, 22, 2271001. [Google Scholar] [CrossRef]
  17. Zhang, W.; Cai, C.S.; Pan, F. Nonlinear Fatigue Damage Assessment of Existing Bridges Considering Progressively Deteriorated Road Conditions. Eng. Struct. 2013, 56, 1922–1932. [Google Scholar] [CrossRef]
  18. Cui, C.; Chen, A.; Ma, R.; Wang, B.; Xu, S. Fatigue Life Estimation for Suspenders of a Three-Pylon Suspension Bridge Based on Vehicle–Bridge-Interaction Analysis. Mater. 2019, 12, 2617. [Google Scholar] [CrossRef] [PubMed]
  19. Bhetuwal, U.; Shrestha, J.K.; Pradhananga, R. Fatigue Life Analysis of Steel–Concrete Composite Bridge Considering Road Surface Conditions. Innov. Infrastruct. Solut. 2022, 7, 124. [Google Scholar] [CrossRef]
  20. Wang, C.; Zhang, J.; Tu, Y.; Sabourova, N.; Grip, N.; Blanksvärd, T.; Elfgren, L. Fatigue Assessment of a Reinforced Concrete Railway Bridge Based on a Coupled Dynamic System. Struct. Infrastruct. Eng. 2020, 16, 861–879. [Google Scholar] [CrossRef]
  21. Zhang, W.; Cai, C.S. Fatigue Reliability Assessment for Existing Bridges Considering Vehicle Speed and Road Surface Conditions. J. Bridge Eng. 2012, 17, 443–453. [Google Scholar] [CrossRef]
  22. Wang, W.; Deng, L. Impact Factors for Fatigue Design of Steel I-Girder Bridges Considering the Deterioration of Road Surface Condition. J. Bridge Eng. 2016, 21, 04016011. [Google Scholar] [CrossRef]
  23. Zhu, J.; Yi, Q. Study of Safety of New Type Suspenders and Their Impacton Static and Dynamic Performance of Arch Bridge. Bridge Const. 2011, 5, 39–52+51. [Google Scholar]
  24. Liu, Z.; Guo, T.; Hebdon, M.H.; Zhang, Z. Corrosion Fatigue Analysis and Reliability Assessment of Short Suspenders in Suspension and Arch Bridges. J. Perform. Constr. Facil. 2018, 32, 04018060. [Google Scholar] [CrossRef]
  25. Nakamura, S.; Miyachi, K. Ultimate Strength and Chain-Reaction Failure of Hangers in Tied-Arch Bridges. Struct. Eng. Int. 2021, 31, 136–146. [Google Scholar] [CrossRef]
  26. Tan, Y.; He, X.; Shi, L.; Zheng, S.; Zhang, Z.; Wang, X. Reinforcement Effect Evaluation on Dynamic Characteristics of an Arch Bridge Based on Vehicle-Bridge Coupled Vibration Analysis. Comput. Model. Eng. Sci. 2022, 131, 1041–1061. [Google Scholar] [CrossRef]
  27. Chen, L.; He, W.; Li, Q.; Cao, D.; Wang, K.; Ling, L.; Zhu, S.; Li, Y.; Luo, J. Assessment of the Strengthening of Existing Benchmark Monorail Railway Bridge: A Case Study of a Generic Method for Lateral Reinforcement. Struct. Eng. Int. 2019, 29, 362–369. [Google Scholar] [CrossRef]
  28. Deng, L.; Duan, L.; He, W.; Ji, W. Study on Vehicle Model for Vehicle-bridge Coupling Vibration of Highway Bridges in China. China J. Highw. Transp. 2018, 31, 92–100. [Google Scholar] [CrossRef]
  29. JTG D62-2004; Code for Design of Highway Reinforced Concrete and Prestressed Concrete Bridges and Culverts. MOT, (Ministry of Transportation): Beijing, China, 2004. (In Chinese)
  30. Lu, D.; Meng, F.; Zhou, X.; Zhuo, Y.; Gao, Z.; Du, X. A Dynamic Elastoplastic Model of Concrete Based on a Modeling Method with Environmental Factors as Constitutive Variables. J. Eng. Mech. 2023, 149, 04023102. [Google Scholar] [CrossRef]
  31. JTG D60-2015; General Specifications for Design of Highway Bridges and Culverts. MOT, (Ministry of Transportation): Beijing, China, 2015. (In Chinese)
  32. Wang, G.; Li, W. Analysis on the vehicle ride comfort based on vehicle-bridge coupled vibration. J. Vib. Shock 2016, 35, 224–230. [Google Scholar] [CrossRef]
  33. Kiani, K.; Roshan, M. Nonlocal Dynamic Response of Double-Nanotube-Systems for Delivery of Lagged-Inertial-Nanoparticles. Int. J. Mech. Sci. 2019, 152, 576–595. [Google Scholar] [CrossRef]
  34. Sapountzakis, E.J.; Kampitsis, A.E. Nonlinear Response of Shear Deformable Beams on Tensionless Nonlinear Viscoelastic Foundation under Moving Loads. J. Sound Vib. 2011, 330, 5410–5426. [Google Scholar] [CrossRef]
  35. Yu, G.; Kiani, K.; Roshan, M. Dynamic Analysis of Multiple-Nanobeam-Systems Acted upon by Multiple Moving Nanoparticles Accounting for Nonlocality, Lag, and Lateral Inertia. Appl. Math. Model 2022, 108, 326–354. [Google Scholar] [CrossRef]
  36. Ma, X.; Roshan, M.; Kiani, K.; Nikkhoo, A. Dynamic Response of an Elastic Tube-like Nanostructure Embedded in a Vibrating Medium and under the Action of Moving Nano-Objects. Symmetry 2023, 15, 1827. [Google Scholar] [CrossRef]
  37. Li, Y.; Cai, C.S.; Liu, Y.; Chen, Y.; Liu, J. Dynamic Analysis of a Large Span Specially Shaped Hybrid Girder Bridge with Concrete-Filled Steel Tube Arches. Eng. Struct. 2016, 106, 243–260. [Google Scholar] [CrossRef]
  38. Stăncioiu, D.; Ouyang, H.; Mottershead, J.E. Vibration of a Beam Excited by a Moving Oscillator Considering Separation and Reattachment. J. Sound Vib. 2008, 310, 1128–1140. [Google Scholar] [CrossRef]
  39. Matsuishi, M.; Endo, T. Fatigue of Metals Subjected to Varying Stress. Jpn. Soc. Mech. Eng. 1968, 68, 37–40. [Google Scholar]
  40. Miner, M.A. Cumulative Damage in Fatigue. J. Appl. Mech. 1945, 67, 159–164. [Google Scholar] [CrossRef]
  41. GB 50017-2017; Standard for Design of Steel Structures. MOT (Ministry of Housing and Urban-Rural Development): Beijing, China, 2017. (In Chinese)
  42. Juang, J.-N.; Pappa, R.S. An Eigensystem Realization Algorithm for Modal Parameter Identification and Model Reduction. J. Guid. Control Dyn. 1985, 8, 620–627. [Google Scholar] [CrossRef]
  43. Guo, W.; Xia, H.; De Roeck, G. Dynamic Characteristics and Coupling Vehicle-Bridge Vibration Analysis of the High Speed Railway Sesia Bridge in Italy. J. Vib. Shock 2013, 32, 82–88. [Google Scholar] [CrossRef]
  44. Zhu, Z.; Huang, Y.; Xiang, Z.; Mai, P. Fatigue Performance of Floorbeam Cutout Detail of Orthotropic Steel Bridge on Heavy Freight Transportation Highway. China J. Highw. Transp. 2017, 30, 104–112. [Google Scholar] [CrossRef]
  45. Zhu, J.; Xiao, R. Damage Identification of Long-Span Concrete Cable-Stayed Bridge Based on Periodic Detection and Genetic Algorithms. China Civ. Eng. J. 2006, 39, 85–89. [Google Scholar] [CrossRef]
  46. Li, Y.; Lu, D.; Sheng, H. Fatigue Reliability Analysis on Cable of Cable-Stayed Bridge Under Random Vehicle Load and Wind Oad. China J. Highw. Transp. 2012, 25, 60–66. [Google Scholar] [CrossRef]
Figure 1. The layout of the bridge.
Buildings 14 01787 g001
Figure 2. Five-axle vehicle analysis model.
Buildings 14 01787 g002
Figure 3. The global FE model.
Buildings 14 01787 g003
Figure 4. Road roughness sample function.
Buildings 14 01787 g004
Figure 5. Flowchart of dynamical analysis of bridge structure acted upon by moving vehicles.
Buildings 14 01787 g005
Figure 6. Layout of the vibration mode points (unit: cm).
Buildings 14 01787 g006
Figure 7. In situ test of bridge vibration mode in different spans.
Buildings 14 01787 g007
Figure 8. FE analysis of bridge vibration mode.
Buildings 14 01787 g008
Figure 9. Frequency comparison of experimental and FE analysis data.
Buildings 14 01787 g009
Figure 10. Comparison between the displacement predicted by the FE analysis and that obtained experimentally.
Buildings 14 01787 g010
Figure 11. Comparison of numerical calculation results under different mesh sizes.
Buildings 14 01787 g011
Figure 12. Displacement time history under different vehicle speeds.
Buildings 14 01787 g012
Figure 13. Acceleration time history under different vehicle speeds.
Buildings 14 01787 g013
Figure 14. Displacement time history under different vehicle weights.
Buildings 14 01787 g014
Figure 15. Acceleration time history under different vehicle weights.
Buildings 14 01787 g015
Figure 16. Displacement time history under different road surface conditions.
Buildings 14 01787 g016
Figure 17. Acceleration time history under different road surface conditions.
Buildings 14 01787 g017
Figure 18. Layout of the points for fatigue analysis (unit: cm).
Buildings 14 01787 g018
Figure 19. Fatigue life at different vehicle speeds.
Buildings 14 01787 g019
Figure 20. Fatigue life at different vehicle weights.
Buildings 14 01787 g020
Figure 21. Fatigue life under different road surface conditions.
Buildings 14 01787 g021aBuildings 14 01787 g021b
Table 1. Vehicle model analysis parameters.
ParametersValues
(kN·m−1)
ParametersValues (kg)ParametersValues (kN·s·m−1)
Suspension stiffness Ks1, Ks2300.0 M12276.5Suspension damping Ds1, Ds210.0
Suspension stiffness Ks3Ks6500.0M245,246.0Suspension damping Ds3Ds1053.0
Suspension stiffness Ks7Ks101250.0m1700.0Suspension damping Dt1Dt103.0
Tire stiffness Kt1, Kt21500m3, m51000.0
Tire stiffness Kt3Kt103000.0m7, m9800.0
Table 2. Concrete material parameters.
MaterialsElasticity Modulus (MPa)Unit Weight
(kN·m−3)
Poisson’s RatioCompression Strength (MPa)Tensile Strength (MPa)Coefficient of Linear Expansion
C5034,50025.00.16732.42.650.000010
C4032,50025.00.16726.82.400.000010
Table 3. Steel material parameters.
MaterialsElasticity Modulus (MPa)Unit Weight
(kN·m−3)
Poisson’s RatioYield Strength
(MPa)
Coefficient of Linear Expansion
Q345D205,00078500.33150.000012
Prestressed strand195,00078500.318600.000012
Parallel wire205,00078500.316700.000012
Table 4. Effect factors in vehicle–bridge coupled vibration analysis model.
Subsystem TypeEffect FactorParameter Range
VehicleSpeed (km/h)20, 30, 40, 50
Weight (kN)300, 400, 500, 600
BridgeRoad surface conditionA, C, E
Table 5. The stress and deflection results at the mid-span under different factors.
Subsystem TypeEffect FactorParameter RangeStress (MPa)Deflection (mm)Impact
Coefficient
VehicleVehicle speed (km/h)200.96 −1.800.11
301.06 −1.940.20
401.10 −2.030.25
501.12 −2.050.26
Vehicle weight (kN)3000.74 −1.420.28
4001.06 −1.940.20
5001.37 −2.330.14
6001.65 −2.630.08
BridgeRoad surface conditionA0.98 −1.820.12
C1.06 −1.940.20
E1.07 −1.960.21
Table 6. The fatigue reliability of the suspenders.
Vehicle Speed (km/h)Non-CorrosionCorrosionError Percentage (%)
204.994.1217.6
304.994.1117.6
404.984.1017.6
504.984.1017.7
Vehicle Weight (kN)Non-CorrosionCorrosionError Percentage (%)
3005.364.5515.1
4004.994.1117.6
5004.683.7320.2
6004.43 3.3923.5
Road Surface ConditionNon-CorrosionCorrosionError Percentage (%)
A4.964.0817.8
C4.893.9918.4
E4.763.8419.4
Disclaimer/Publisher’s Note: The statements, opinions and data contained in all publications are solely those of the individual author(s) and contributor(s) and not of MDPI and/or the editor(s). MDPI and/or the editor(s) disclaim responsibility for any injury to people or property resulting from any ideas, methods, instructions or products referred to in the content.

