Abstract
The configuration of beam–column joints in precast concrete (PC) building structures varies widely, and different connection methods significantly affect the progressive collapse resistance of the structure. This study investigates the progressive collapse resistance of an innovative beam–column connection node frame. Finite element models of four-story, two-span space frame structures made of reinforced concrete (RC) and PC were developed using ANSYS 14.0/LS-DYNA R5.x software, employing nonlinear dynamic and static analysis to examine structural collapse behavior under bottom middle or corner column damage. Numerical results indicate that following the failure of the middle or corner column due to explosion loading, the vertical displacement and collapse rate of the PC structure with the novel connection method are less than those of the RC structure during collapse progression. Furthermore, upon removal of the middle or corner column, the residual load-carrying capacity of the PC structure with the innovative connection increased by 7% and 3.7%, respectively, compared to the RC structure. This suggests that PC structures with this type of connection demonstrate superior performance in resisting progressive collapse, offering valuable insights for future engineering applications.
1. Introduction
Structures are often subjected to damage and destruction due to accidental loads caused by factors such as explosions, fires, and impacts [1]. In cases where the building is unable to withstand such loads, these events may result in local or partial damage to the structure’s substructure. In some cases, this collapse can extend beyond the initial damage, resulting in large-scale destruction disproportionate to the initial impact. This phenomenon is commonly known as progressive collapse [2]. Due to the catastrophic consequences of building collapses, there is an increasing global emphasis on addressing the issue of progressive collapse. The General Services Administration (GSA) [3] and the Department of Defense (DoD) [4] have introduced comprehensive directives for structural design.
Scholars have conducted extensive research in recent years on the resistance of reinforced concrete structures to progressive collapse [5,6,7,8,9,10]. Fedorova et al. [11] dis-cussed the use of indirect reinforcement as a method of protection in reinforced concrete structures and numerically analyzed a two-span continuous beam, which showed the effectiveness of reinforcement in protecting the structural system from progressive collapse. To investigate the effect of structural redundancy on reinforced concrete frame structures’ resistance to continuous collapse, Ameri et al. [12] analyzed three reinforced concrete frame models with different levels of redundancy by nonlinear dynamic methods, and the results showed that increasing the redundancy improves the resistance of reinforced concrete frame structures to continuous collapse. Due to the growing focus on low-carbon environmental protection, precast buildings have become widely adopted. As a result, researchers have also begun to focus on the progressive collapse resistance of precast structures [13,14,15,16,17,18]. Kang et al. [19] conducted experimental investigations on four distinct types of precast concrete frames, aiming to delve into the progressive collapse resistance exhibited by frames featuring discontinuous steel reinforcement. Feng et al. [20] conducted four static loading tests and two dynamic loading tests to investigate the progressive collapse resistance of conventional precast concrete frames. The test results showed that the connection details and beam reinforcement ratio had a significant effect on the progressive collapse resistance.
Due to the high cost and lengthy duration of experiments, scholars often utilize a combination of experimental and numerical simulation approaches when studying such phenomena [21,22]. To enhance the robustness against progressive collapse in precast buildings, El-sanadedy [23] numerically investigated 11 sets of half-scale beam–column combinations with newly developed precast moment connections using LS-DYNA software. The conclusions of the study highlight that the adoption of innovative connection techniques can significantly reduce the risk of progressive collapse in precast concrete structures. Zhou et al. [24] designed two half-scale reinforced concrete and precast concrete moment substructures to evaluate the asymptotic collapse performance in the presence of sudden loss in the column. Numerical simulations using ABAQUS 2020 finite element software were analyzed and found to be in good agreement with the experimental results.
In conclusion, the progressive collapse of precast concrete substructures or planar frames has been studied more frequently, while the collapse resistance of monolithic structures has been studied less. Therefore, this article analyzes the monolithic frame of the structure, which greatly compensates for the shortcomings of the previous research. At the same time, a new method of connection is proposed, and exploration and research are carried out with regard to the progressive collapse resistance of precast concrete with this new type of connection. These studies provide a reference for future scholars to study the progressive collapse resistance of monolithic frame structures and provide new ideas for the design of new nodes in precast concrete structures.
2. Substructure Finite Element Model Verification
This paper focuses on the joints described in reference [25] as the subject of investigation. The schematic diagram of the splicing node and the site photograph of the substructure concrete pouring are shown in figures 2-3 and 2-4, respectively, as cited in reference [25]. This assembled structure comprises five components characterized by three precast column segments with cantilever beams and two precast beam segments. The longitudinal reinforcement in the joint is bent at a 90-degree angle and subsequently securely welded to the steel connector. The steel connector consists of an end steel plate and four spliced steel plates arranged in a two-row, two-column configuration. High-strength bolts are used to connect each precast segment. The spliced joint area of the precast beam–column segment has a length of 200 mm. Once the assembly is complete, the concrete is poured to create a solid structure.
2.1. Selection and Establishment of Finite Element Model
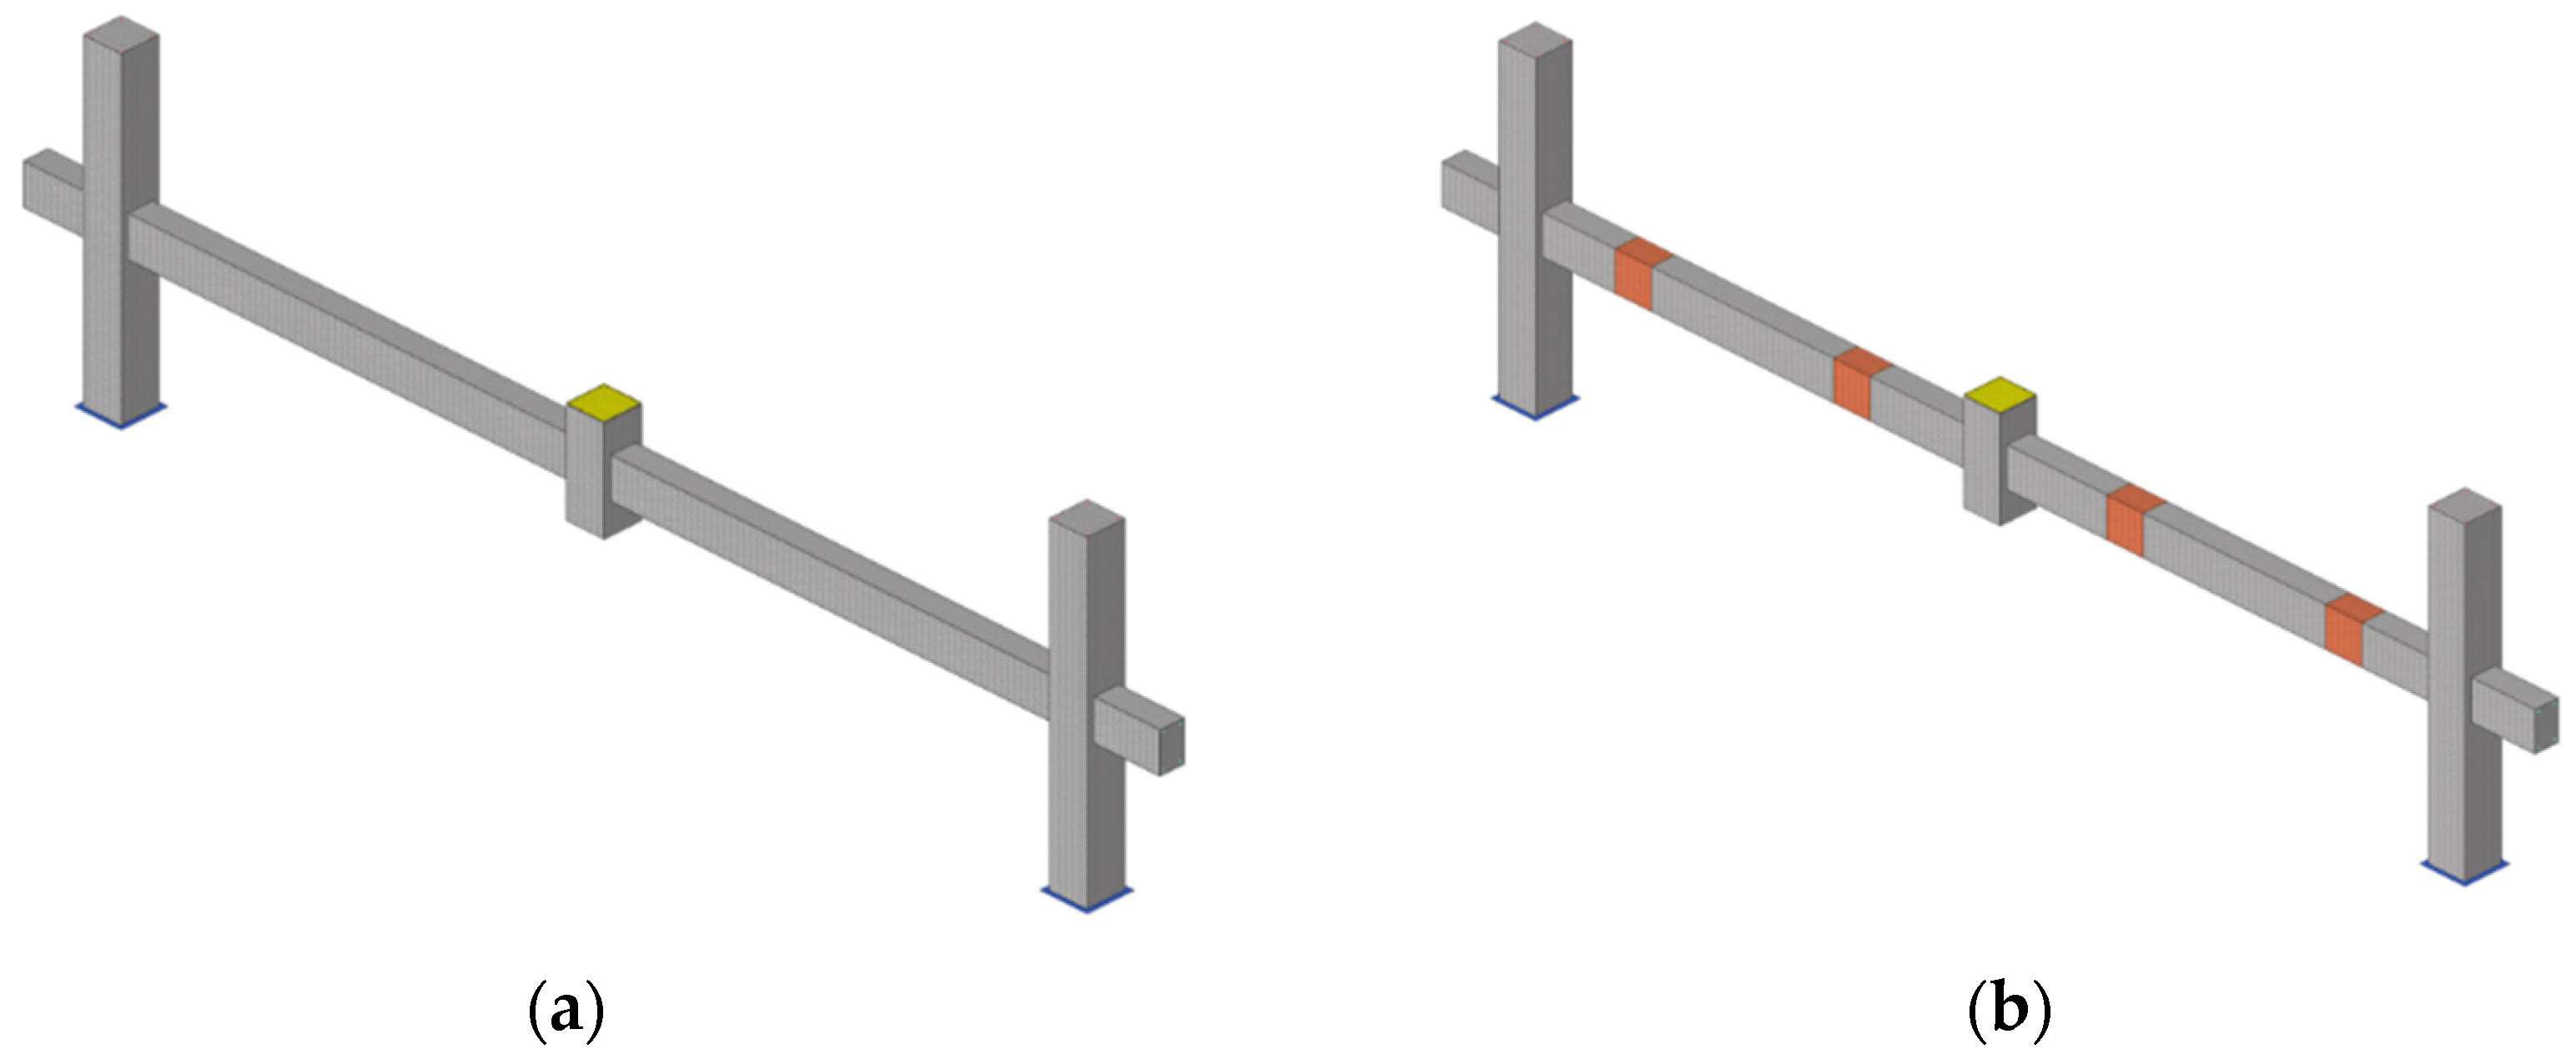
The reinforced concrete component S1 and precast concrete component SS-2 from reference [25] are chosen as the basis for model verification. The cross-section and cross-section reinforcement of the precast concrete members are the same as those of the reinforced concrete members, and only the difference in the connection node settings is considered to compare the differences between the two types of members. The column section has a side length of 200 mm, while the beam section measures 200 mm × 130 mm. The columns are constructed with 16 mm HRB400 longitudinal bars, while the beams utilize 12 mm HRB400 longitudinal bars. The spacing of the encrypted area of the hoop reinforcement of the component is taken as 50 mm, and the spacing of the non-encrypted area is taken as 100 mm. For reinforced concrete component S1, the encrypted area of the beams is within a length of 550 mm from the nodes of the columns, and the encrypted area of the columns is within the failing columns and within a length of 450 mm from the top of the columns of the side columns as a starting point; for precast concrete component SS-2, the encrypted area of the beams is within the cantilevered beams in the prefabricated column segments. For precast concrete component SS-2, the encryption interval for beams is the portion of the cantilever beam in the prefabricated column section. Substructure models for both reinforced concrete and precast concrete are developed, and their numerical simulation results are compared with experimental tests to evaluate the reliability of the models. The concrete frame substructure is modeled in isolation without considering the slip between reinforcement and concrete, and the model mesh sizes are 50 mm, 25 mm, and 20 mm. The member dimensions and the section dimensions are shown in figures 2–5 of reference [25], and the finite element model is shown in Figure 1 and Figure 2.
Figure 1.
Finite element model of the substructure: (a) Reinforced concrete substructure frame; (b) precast concrete substructure frame.

Figure 2.
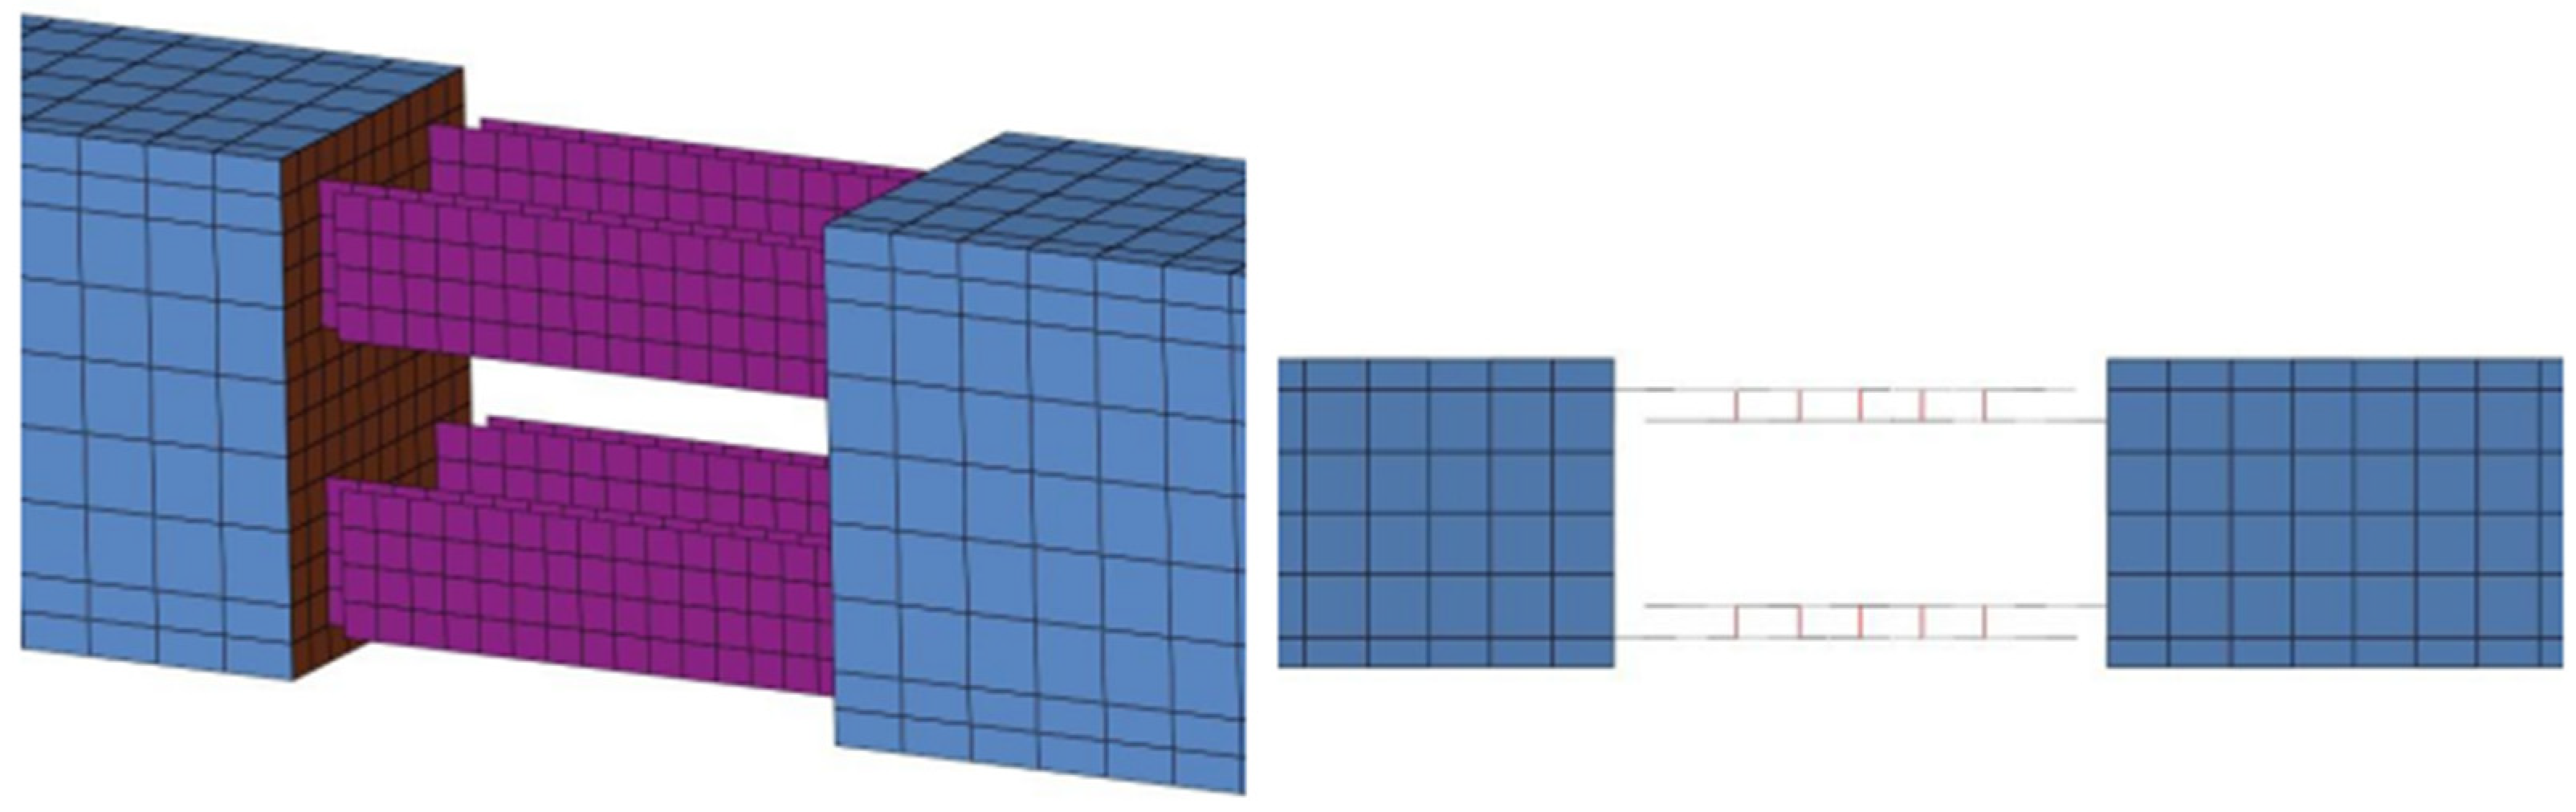
Finite element schematic of beam–column joint.
2.1.1. Material Model
The finite element model of concrete utilizes the SOLID164 solid element, with the material model being 072R3 material (*MAT_CONCRETE_DAMAGE_REL3) in LS-DYNA. The finite element model of reinforcement and bolts adopts the BEAM161 beam cell, with the material model being *MAT_PLASTIC_KINEMATIC. The connection section steel and column foot steel plate are modeled using the SHELL163 shell unit. The connection section steel adopts the *MAT_PLASTIC_KINEMATIC material model, while the column foot steel plate adopts the *MAT_ELASTIC material model.
2.1.2. Boundary Conditions and Loads
The model enforces omnidirectional displacement constraints on the joints of the column base steel plates on both sides. The left and right beam ends are simulated using the COMBI165 spring element and the MASS166 mass element. The *MAT_SPRING_ELASTIC keyword is employed to represent the lateral displacement constraints in the test. The keyword *BOUNDARY_PRESCRIBED_MOTION_RIGID_LOCAL (Disp) is utilized in combination with the *DEFINE_CURVE keyword to apply displacement to the failed column.
2.2. Test Validation
According to the test program in the literature [25], perforated steel plates are welded at the bottom of column A and column C, and the components are fixed by high-tensile bolts. The pre-buried high-strength screws at both ends of the component beam structure and the steel plates arranged at the top of Column A and Column C are connected to the A-frame, which is bolted to the steel beams, and all the steel beams are fixed by ground anchors. Hydraulic jacks are arranged at the top of columns A and C. The force applied to the jacks reacts on the top of the side columns. The loading action of the frame is realized by counterweights arranged on the span of the beams. The bottom of the center column is provided with a temporary steel support, which is connected to the steel beam by means of a pivot. The sudden failure of the center column is realized by hitting the steel support at the bottom of the center column with an external force so that it leaves the bottom of the center column quickly.
2.3. Comparative Analysis of the Results
This paper selects the S1 reinforced concrete structural model for comparative verification of the first group and the SS-2 precast concrete structure model for comparative verification of the second group. Figure 3 presents the load–displacement curves and experimental outcomes for the S1 and SS-2 finite element analyses.
Figure 3.
Load–displacement curve of specimen test and simulation results: (a) S1; (b) SS-2.
The first load peak of specimen S1 is 40 KN, while the finite element simulation result is 44.2 KN, resulting in an error of 10.5%. The initial load peak of the SS-2 specimen is 47.8 KN, whereas the finite element simulation result is 51.9 KN, resulting in an error of 8.58%. The load–displacement curve trends of the two simulation sets exhibit a close resemblance, confirming the accuracy of the finite element model developed in this study. Building upon this foundation, a spatial frame structure is established to analyze the performance of progressive collapse resistance.
3. Analysis of Precast Concrete Space Frame Structure Based on Direct Dynamic Method
3.1. Finite Element Model
In accordance with the code for the design of concrete structures [26] and the code for seismic design of buildings [27], a four-story, two-span concrete frame structure is designed using PKPM V5.2.3 software. The structure consists of one span in the x-direction and two spans in the y-direction, with a column spacing of 4 m and a floor height of 3 m. The cross-sectional dimensions of the columns used are 400 mm × 400 mm and the beams are 350 mm high and 250 mm wide. The novel connections in the article are present at the highlighted locations in the model of the precast frame structure. Figure 4 shows the models of the reinforced concrete and precast concrete frame structure.

Figure 4.
The models of the frame structure: (a) Reinforced concrete frame; (b) precast concrete frame.
3.1.1. Basic Parameters
The structure consists of one span in the x-direction and two spans in the y-direction, with a column spacing of 4 m and a floor height of 3 m. The column sections have dimensions of 400 mm × 400 mm and are reinforced with eight HRB400 steel bars with a diameter of 22 mm. The beam sections measure 350 mm × 250 mm and are reinforced with six HRB400 steel bars with a diameter of 20 mm. The column stirrups are placed within a 500 mm range from the end of the columns, while the beam stirrups are placed within an 800 mm range near the column nodes. The stirrups consist of HRB335 steel bars with a diameter of 10 mm, and the spacing between them is 100 mm. Figure 5 shows the dimensions and reinforcement of the structure.

Figure 5.
The dimensions and reinforcement of the structure.
3.1.2. Material Parameters
The damping of the material is considered to be Rayleigh damping and the damping ratio is taken as 0.05.
For the concrete material model, the concrete material model No. 072R3 (*MAT_CONCRETE_DAMAGE_REL3) from LSDYNA [28] is selected, which is to be used in conjunction with the equation of state, where the concrete pressure–volume–strain relationship is defined by means of the defined equation of state 8 (*EOS_TABULATED_COMPACTION). COMPACTION). The material parameters of the concrete are shown in Table 1 and Table 2 [25]. Cracking and spalling failure occurs when the concrete reaches a certain level of deformation, and the failure of the concrete unit is controlled by defining the maximum strain in the keyword *MAT_ADD_EROSION.

Table 1.
Precast concrete material model parameters.
Table 2.
Post-cast concrete material model parameters.
The BEAM161 beam cell was chosen for the rebar finite element model cell, which is commonly used to simulate the strain produced by the rebar. The material model is *MAT_PLASTIC_KINEMATIC, which can be used to describe the isotropic hardening and hardening plasticity model, and the strain rate effect of the material can also be considered. The specific parameters are listed in Table 3.
Table 3.
Reinforcement material model parameters.
*MAT_PLASTIC_KINEMATIC was selected for the material model of the connecting steel and *MAT_ELASTIC was selected for the material model of the steel plate at the foot of the column. The steel plate of the column foot was set to the elastic state.
BEAM161 unit was selected for the finite element modeling of the bolt, whereas *MAT_PLASTIC_KINEMATIC was selected for material modeling.
3.1.3. Background and Model Parameters
Over the past few decades, there has been a proliferation of both man-made and accidental explosions. Explosions can damage structural components and may lead to disproportionate building collapse. For example, in the 1968 partial collapse of Ronan Point tower in England, a gas explosion on the 18th floor led to a cascade of failures that destroyed the entire corner of the building [29]. Protecting civil buildings from blast loads has become a popular research topic.
Columns, as key load-bearing members of a building, play a major role in the process of blasting loads. The article only uses the column as the member of the blast load scenario that carries the blast pressure.
To control material failure under explosive loads, the effective plastic strain and volume tensile strain are taken into account, following the approach presented by Xu et al. [30]. In the numerical simulation, the primary criterion for implementing the erosion algorithm is that the principal tensile strain reaches 0.01. The reasonable values for the two erosion criteria were determined based on the studies by Shi et al. [31] and Kim et al. [32]. Based on the numerical results, the erosion principal strain criterion and shear strain criterion have limits of 0.15 and 0.9, respectively. The explosion load is applied to the surface of the structure in the x-axis direction using the LOAD_BLAST_ENHANCED command in LS-DYNA. Based on the TNT equivalent and the distance from the target position, the dynamic load on the surface of the unit is automatically generated using the BLE method to simulate the impact of the explosion. Figure 6 illustrates the blast points located within the first 3 m of the middle and corner columns.
Figure 6.
The location of the blast points: (a) Y-Z plane; (b) X-Y plane.
In this paper, the frame structure is subjected to the corresponding constant and live loads prior to the application of an explosive load at t = 100 ms. Various quantities of explosives are considered to induce initial damage to the selected column and minimal initial damage to the adjacent column within the range of proportional distances from 0.42 m·kg−1/3 to 0.73 m·kg−1/3. To minimize the damage to the adjacent column elements, a proportional distance of 0.48 m·kg−1/3 is selected to mitigate the extent of structural collapse.
3.2. Simulation Results under Blasting Load
3.2.1. Analysis of Bottom-Middle Column Damage
Figure 7 and Figure 8 illustrate the state of the frame at 300 ms and 700 ms, respectively. When the blast shock wave reaches the structural columns, the central column at the bottom level is subjected to the blast impact, subsequently initiating structural deformation. This deformation is characterized by significant plastic strains observed at the first- and second-level center columns, as well as the beam–column nodes at each level. Upon the failure of the critical columns, the superstructure of the ground floor center column undergoes a downward displacement, while plastic strain propagates from the beam–column nodes to the mid-span of the beams and the middle of the floor slabs. At 700 ms, the beams on each floor of the reinforced concrete (RC) structure exhibit pronounced bending deformation. In contrast, the precast concrete (PC) structure displays varying degrees of bending at the beam nodal splices due to the different connection methods employed for the precast beams.

Figure 7.
The structural response of a building at 300 ms following damage to the middle column: (a) RC structure; (b) PC structure.

Figure 8.
The structural response of a building at 700 ms when the middle column is damaged: (a) RC structure; (b) PC structure.
Figure 9 presents the displacement–time curves in the z-direction for the fourth-floor vertices of the structures during the damage of the middle column. The curves reveal that at 100 ms, the vertical displacement of the reinforced concrete is −0.43 mm, while the precast concrete measures −0.37 mm. Upon the application of the blast load at 100 ms, the failure of the critical column triggers a downward collapse of the entire structure. Since the structure has not yet entirely lost its bearing capacity, the difference in vertical displacement between the two structures is not substantial. After 320 ms, as structural deformation and collapse progress, the disparity in vertical displacement between the reinforced concrete and precast concrete structures widens. At 400 ms, the vertical displacement of the reinforced concrete reaches −153.25 mm, while that of the precast concrete reaches displacement of −144.78 mm; at 500 ms, the vertical displacement of the reinforced concrete reaches −265.31 mm, while the displacement of the precast concrete reaches −220.22 mm; at 600 ms, the vertical displacement of the reinforced concrete reaches −458.46 mm, while that of the precast concrete reaches −342.53 mm; at 700 ms, the vertical displacement of the reinforced concrete reaches −744.29 mm, while that of the precast concrete reaches −539.36 mm. At 750 ms, the vertical displacement of the reinforced concrete reaches −921.61 mm, while that of the precast concrete reaches −671.54 mm. This indicates that the precast concrete created using this particular connection method exhibits greater collapse resistance compared to reinforced concrete.
Figure 9.
The displacement–time curves in the z-direction for the fourth-floor vertices of the structures during the damage of the middle column.
Figure 10 presents the velocity–time curve in the z-direction for the vertices of the middle column on the first floor. From the figure, it is evident that upon application of the blast load to the key column at 100 ms, the vertical velocity of the node at the top of the column experiences a rapid increase immediately after the impact damage. Subsequently, the node velocity briefly decreases due to the stiffness of the structure itself and the influence of the beams. Furthermore, as the damaged bottom column loses its supporting effect on the superstructure, the adjacent span of the damaged column becomes unstable and begins to displace downwards. The velocity of the node in the z-direction begins to rise. During the initial stage of collapse, the nodal velocities of both the reinforced and precast concrete are similar. However, as the collapse progresses, the nodal velocities of the reinforced concrete exhibit a greater acceleration compared to the precast concrete.
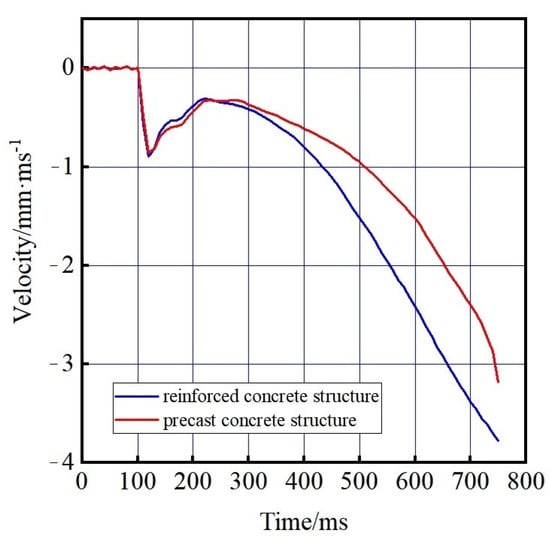
Figure 10.
The velocity–time curve in the z-direction for the vertices of the middle column on the first floor.
To investigate the collapse behavior of the structure in the x-direction, the midpoint of the middle column on the second floor is selected for analysis. Figure 11 shows the velocity–time curve in the x-direction at the midpoint of the middle column on the second floor. As observed in the figure, at 100 ms, the blast load is gradually applied to the key column of the structure. Subsequently, the x-directional velocity of the node experiences a rapid increase within a short time period after the first-story middle column is damaged by the impact, followed by impact-induced damage to the bottom column from the x-direction. However, the nodal velocity returns to 0 since the tensile structural member in the x-direction remains intact, preventing structural collapse. As the support from the superstructure is lost due to the damage sustained by the bottom column, the structure collapses inwards, and the x-directional velocity of the node begins to increase. From the figure, it is evident that during the initial stage of collapse, the nodal velocities of both reinforced and precast concrete are similar. However, as the collapse progresses, the nodal velocities of reinforced concrete exhibit faster development compared to precast concrete.
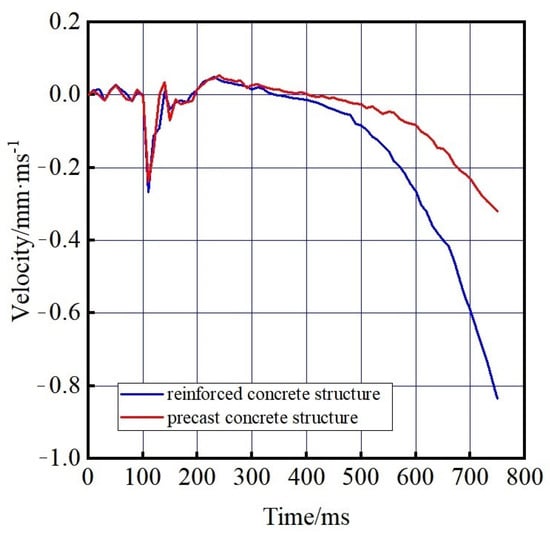
Figure 11.
The velocity–time curve in the x-direction at the midpoint of the middle column on the second floor.
3.2.2. Analysis of Bottom-Corner Column Damage
Figure 12 and Figure 13 show the states of the frame at 300 ms and 700 ms, respectively. From the figures, it is evident that once the blast shock wave reaches the structural columns, the bottom corner column absorbs the blast impact, initiating structural deformation. This deformation is characterized by larger plastic strains observed at the corner columns of the first and second floors, as well as at the nodes of the beams and columns on each floor. As the key columns fail, the superstructure of the ground floor corner column undergoes a downward displacement. By 700 ms, severe bending deformation is observed in the beams on each floor of the reinforced concrete (RC) structure, resulting in a complete collapse of the structure.
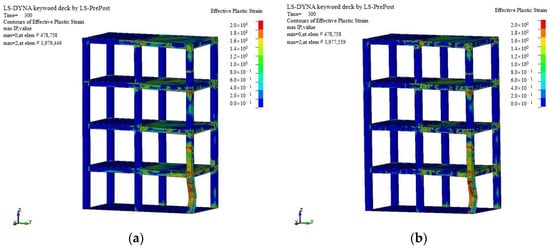
Figure 12.
The structural response of a building at 300 ms when the corner column is damaged: (a) RC structure; (b) PC structure.
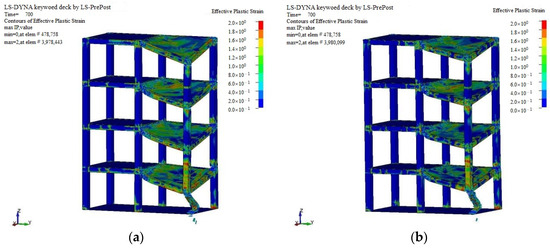
Figure 13.
The structural response of a building at 700 ms when the corner column is damaged: (a) RC structure; (b) PC structure.
Figure 14 presents the displacement–time curves in the z-direction for the fourth-floor vertices of the structures during the damage to the corner column. As observed in the figure, when the blast load is applied at 100 ms and the key column fails, resulting in the downward collapse of the structure, the vertical displacement of the reinforced concrete is greater than that of the precast concrete. However, before 200 ms, the vertical displacement gap between the two structures is not significant, as the structure has not yet fully lost its load-carrying capacity. As the structural deformation and collapse progress, the vertical displacement of the reinforced concrete exceeds that of the precast concrete. At 400 ms, the vertical displacement of the reinforced concrete reaches −231.78 mm, while that of the precast concrete reaches −166.25 mm; at 500 ms, the vertical displacement of the reinforced concrete reaches −415.43 mm, while that of the precast concrete reaches −317.22 mm; at 600 ms, the vertical displacement of the reinforced concrete reaches −740.76 mm, while that of the precast concrete reaches −594.52 mm; at 700 ms, the vertical displacement of the reinforced concrete reaches −1240.33 mm, while that of the precast concrete reaches −1040.28 mm. By 750 ms, the vertical displacement of the reinforced concrete reaches −1537.77 mm, while that of the precast concrete reaches −1316.55 mm. The precast concrete, created with this specific connection method, exhibits stronger collapse resistance compared to reinforced concrete when the corner columns are damaged.
Figure 14.
The displacement–time curves in the z-direction for the fourth-floor vertices of the structures during the damage of the corner column.
Figure 15 shows the velocity–time curve in the z-direction for the vertices of the corner column on the first floor. From the figure, it is evident that at 100 ms, the blast load is gradually applied to the key column of the structure. Consequently, the vertical velocity of the node at the top of the column undergoes a rapid increase within a short time period as a result of the impact damage. Afterwards, the node velocity experiences a temporary decrease caused by the inherent stiffness of the structure and the influence of the beam. When damage occurs to the bottom column, its ability to support the superstructure weakens, leading to instability in the adjacent span and subsequent downward displacement. The velocity of the node in the z-direction begins to rise. During the initial stage of collapse, the nodal velocities of both reinforced and precast concrete are similar. However, as the collapse progresses, the collapse velocity of the reinforced concrete becomes faster.
Figure 15.
The velocity–time curve in the z-direction for the vertices of the corner column on the first floor.
To investigate the collapse behavior of the structure in the x-direction, the midpoint of the corner column on the second floor is selected for analysis. Figure 16 shows the velocity–time curve in the x-direction at the midpoint of the corner column on the second floor. As observed in the figure, at 100 ms, the blasting load is gradually applied to the key column of the structure. Subsequently, the x-directional velocity of the node experiences a rapid increase within a short time period following the impact damage of the corner column on the first floor and the impact force from the x-direction of the bottom column. However, the node velocity returns to 0, since the tensile structural member in the x-direction remains intact, preventing structural collapse. As the support provided by the bottom column is lost, the structure of the adjacent span cannot maintain stability and begins to displace downward, resulting in inward tipping of the structure. Concurrently, the x-directional velocity of the node initiates development. From the figure, it is evident that during the early stage of collapse, the nodal velocities of both reinforced and precast concrete are similar. However, as the collapse progresses, the nodal velocities of the reinforced concrete develop faster than those of the precast concrete.

Figure 16.
The velocity–time curve in the x-direction at the midpoint of the corner column on the second floor.
4. Pushdown Analysis
In nonlinear static Pushdown analysis using the damaged span loading mode [33], it is essential to apply increasing vertical loads to the damaged span structure, which will eventually lead to its collapse. In the load application process, the load coefficient is defined as the ratio of the vertical bearing capacity produced by the structure to the vertical bearing capacity of the initial design. This relationship is represented by Equation (1).
where represents the load coefficient, represents to the vertical bearing capacity of the structure, and represents the vertical bearing capacity of the initial design of the structure. refers to the collapse analysis load combination in DOD [4] specification.
During the assessment of the frame beam’s bearing capacity, the ultimate deformation of the beam is considered to be the failure criterion for the beam member. As per the requirements outlined in DoD [4] and the current progressive collapse resistance code, failure occurs when the vertical displacement of the column end reaches one-fifth of the beam span. In the LS-DYNA simulated loading process, the structure is deemed to have experienced progressive collapse when the vertical displacement of the lower end of the column reaches 800 mm.
Figure 17 and Figure 18 represent structural models where columns have been removed from various positions. The Pushdown analysis is conducted on the residual structure after the removal of the middle column in the reinforced concrete (RC) structure and the corner column in the precast concrete (PC) structure. This analysis aims to compare the relative load–displacement relationships of the different structures.
Figure 17.
Structural model of the bottom middle column removal: (a) Reinforced concrete structure model; (b) precast concrete structure model.
Figure 18.
Structural model of the bottom corner column removal: (a) Reinforced concrete structure model; (b) precast concrete structure model.
4.1. Analysis of the Results of Removing the Bottom Middle Column
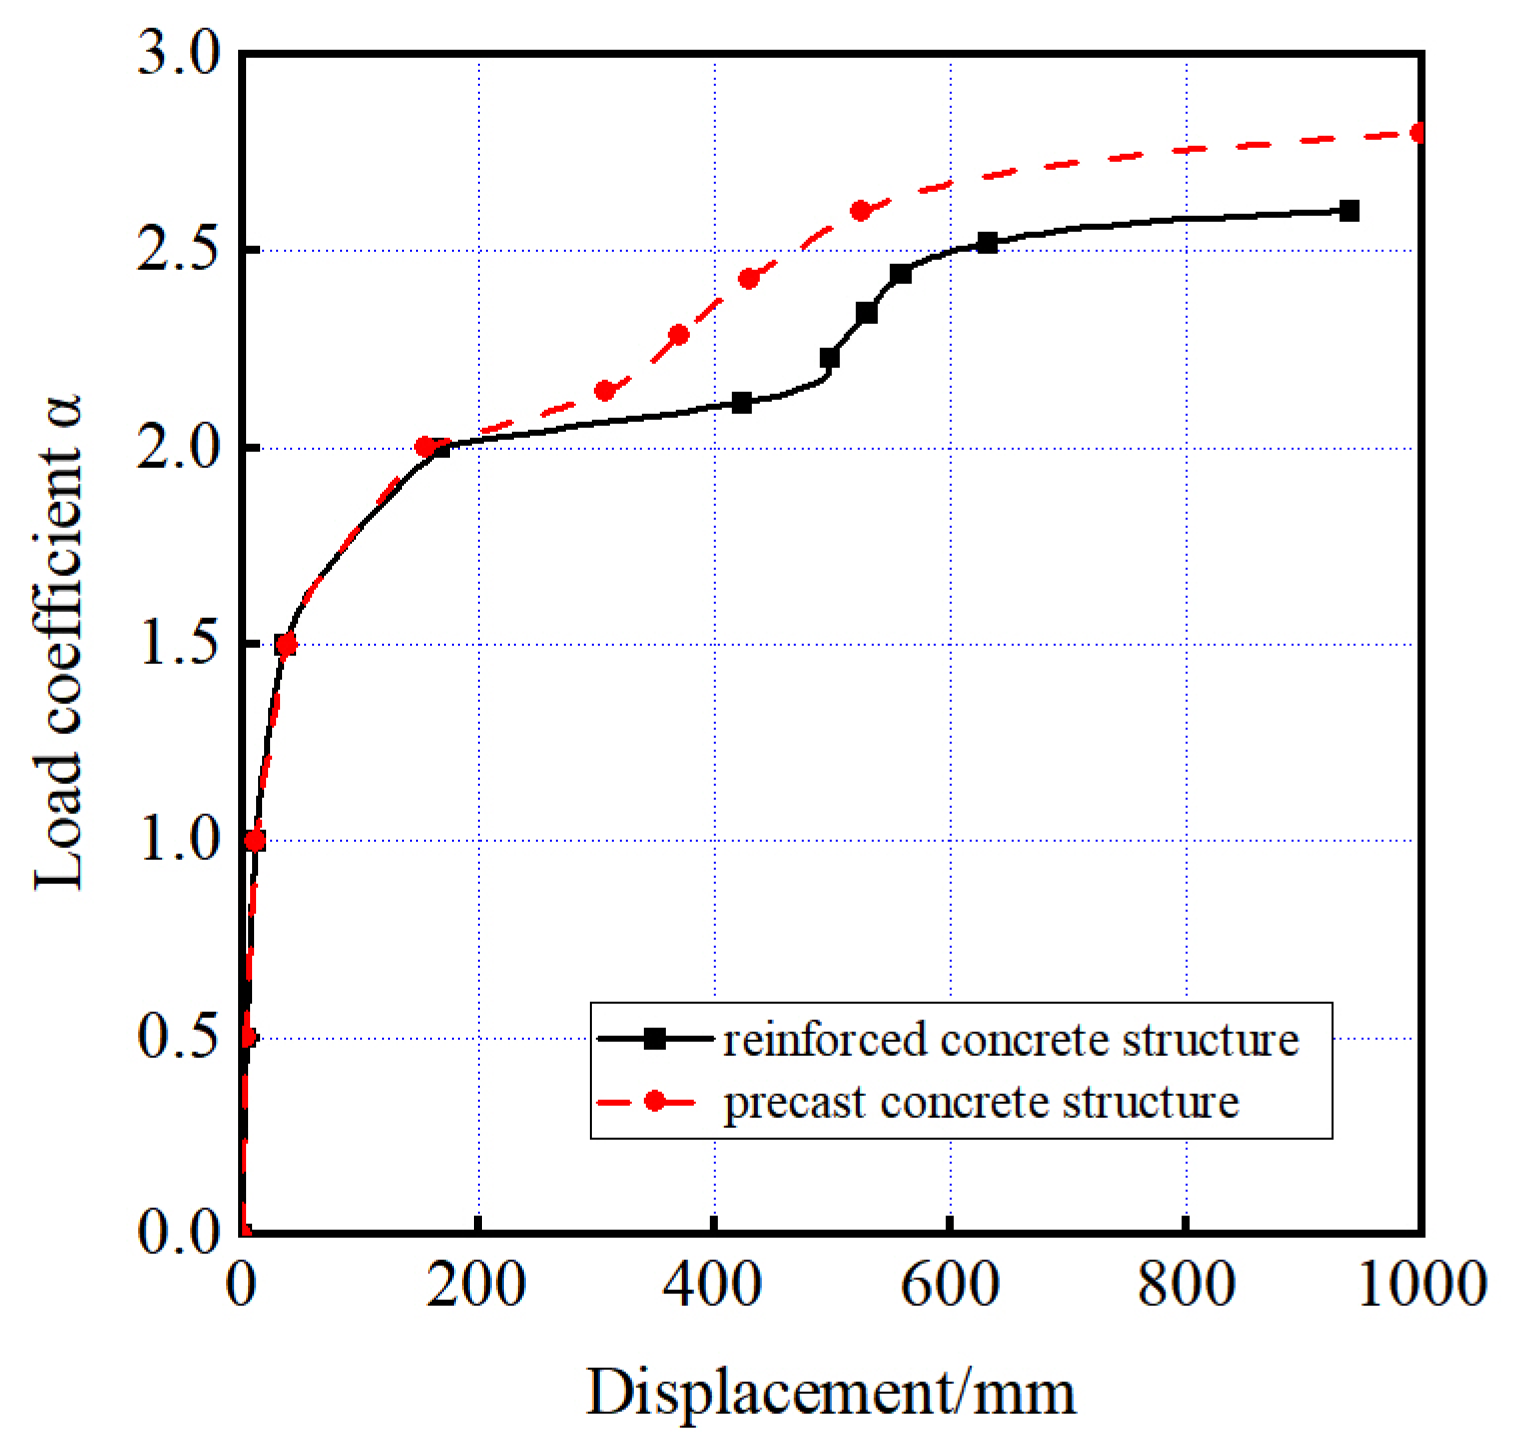
Figure 19 presents the relative load–displacement curves derived from Pushdown analysis performed on the remaining structures subsequent to the removal of middle columns in both reinforced concrete and precast concrete structures. The Pushdown curves reveal a notable augmentation in the structural bearing capacity during the initial elastic phase as the vertical displacement of the frame progresses. However, as the structure transitions into the plastic phase, the structural bearing capacity increases only marginally, even as the vertical displacement rapidly increases. The relative load coefficients () for the vertical displacement of the failed column at 800 mm are 2.58 and 2.76 for the reinforced concrete and precast concrete structures, respectively. This suggests that the vertical ultimate load capacity of the remaining structure after column failure can reach 2.58 g and 2.76 g, where g = 1.2 G + 0.5 L. Furthermore, the precast joint with this specific connection method enhances the relative load capacity of the remaining structures by 7% in the event of middle column failure. This finding highlights the fact that the structure incorporating this type of precast concrete frame possesses sufficient redundancy and load-bearing capacity to contain the unbalanced load stemming from the initial failure of the middle column, thus averting the progressive collapse of the entire structure.
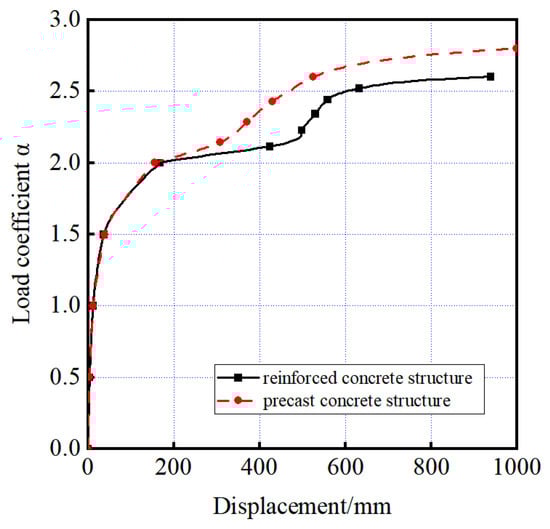
Figure 19.
The relative load–displacement curve of the remaining structure with middle columns removed.
4.2. Analysis of the Results of Removing the Bottom Corner Column
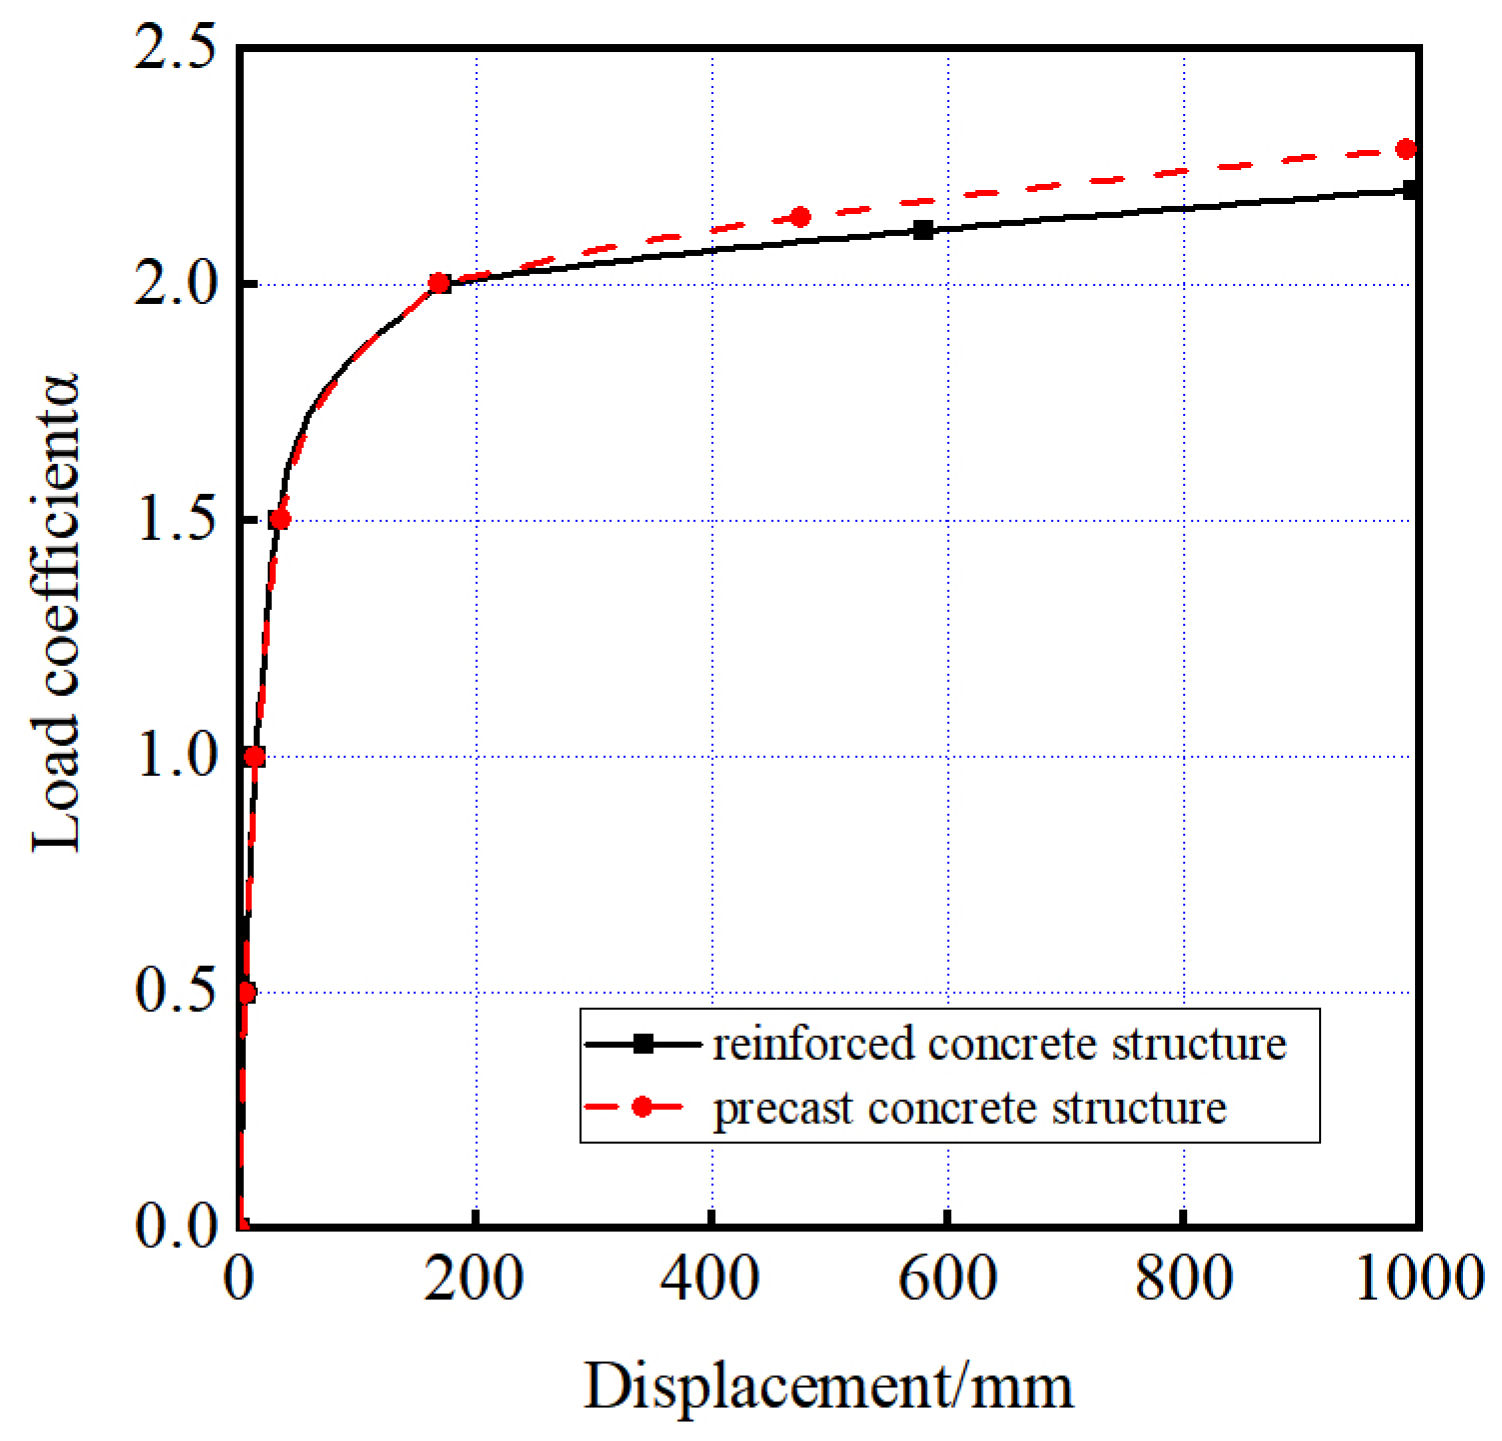
Figure 20 shows the relative load–displacement curves derived from Pushdown analysis performed on the remaining structures subsequent to the removal of corner columns. The curve reveals that when the corner column of the structures fails, the corresponding relative load coefficient () for a vertical displacement of 800 mm is 2.16 and 2.24, respectively. Additionally, the precast joint utilizing this particular connection method enhances the relative load capacity of the remaining structures by 3.7%.
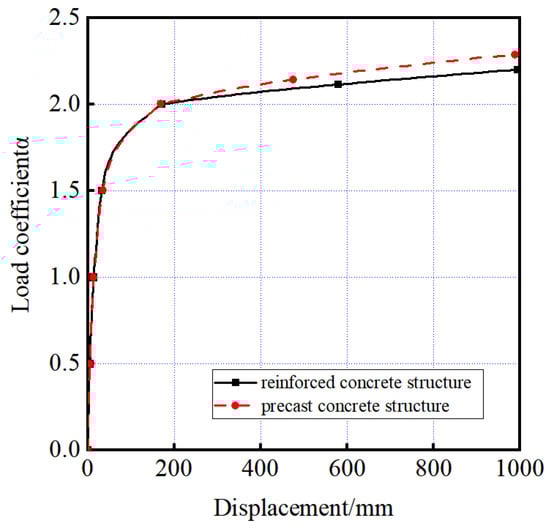
Figure 20.
The relative load–displacement curve of the remaining structure with corner columns removed.
5. Conclusions
This paper focuses on a novel type of precast concrete frame structure. A four-story two-span spatial frame is constructed to investigate the impact of precast joints on the collapse resistance of the structure. The study, after a rigorous examination of the data and thorough analysis of the results, has yielded several crucial conclusions.
During the nonlinear dynamic analysis, the reinforced concrete structure experiences a maximum vertical displacement of −921.61 mm at 750 ms when the middle column fails. In contrast, the precast concrete structure demonstrates a vertical displacement of −671.54 mm under the same circumstances. Furthermore, in the absence of the corner column, the reinforced concrete structure experiences a maximum vertical displacement of −1537.77 mm, while that of the precast concrete structure reaches −1316.55 mm. Comparing these results with those of the reinforced concrete structure, it is evident that the remaining structural bearing capacity is weaker in the event of corner column failure. Consequently, attention must be given to the design of corner columns in building structures. With the failure of the critical columns, the superstructure of the corner column at the ground level experienced downward displacement. This reveals the vulnerability of critical elements of the structure to load and the effect on the stability of the overall structure.
By conducting Pushdown analysis and comparing the relative load–displacement curves of the precast concrete frame and reinforced concrete structures, it is observed that the utilization of precast nodes increases the relative load capacity of the remaining structure by 7% and 3.7% when the middle column and the corner column fail, respectively.
A comparison and analysis are conducted under nonlinear dynamic and static conditions after the key columns in various positions are removed. In the elastic stage, the structure exhibits greater integrity and collapse resistance. However, as the structure transitions into the plastic stage, the collapse and failure mechanisms progress at a faster rate. Numerical results demonstrate that the precast concrete building, which employs this novel connection method, exhibits improved resistance to progressive collapse. These findings hold significant value for engineering applications, offering valuable insights for future engineering design.
Author Contributions
Conceptualization, Funding acquisition and data curation, Q.X. Writing—original draft and writing—review & editing, J.Q.; Software and validation, Y.Z.; Visualization and project administration, L.T.; Formal analysis and supervision, D.M.; Investigation and methodology, X.Z.; Visualization and project administration, T.H. All authors have read and agreed to the published version of the manuscript.
Funding
This study was financially supported by BIM Engineering Center of Anhui Province (AHBIM2021ZR02 and AHBIM20202ZR) and the Project of Science and Technology Plan of Department of Housing and Urban–Rural Development of Anhui Province (2023-YF127).
Data Availability Statement
Available by authors.
Conflicts of Interest
The authors declare no conflicts of interest.
References
- Ellingwood, B.R. Mitigating risk from abnormal loads and progressive collapse. J. Perform. Constr. Facil. 2006, 20, 315–323. [Google Scholar] [CrossRef]
- Osteraas, J.D. Murrah building bombing revisited: A qualitative assessment of blast damage and collapse patterns. J. Perform. Constr. Facil. 2006, 20, 330–335. [Google Scholar] [CrossRef]
- United States General Services Administration. Progressive Collapse Analysis and Design Guidelines for New Federal Office Buildings and Major Modernization Projects; United States General Services Administration: Washington, DC, USA, 2016.
- Department of Defense. Design of Buildings to Resist Progressive Collapse Unified Facilities Criteria (UFC): 4-023-16; Department of Defense: Washington, DC, USA, 2016.
- Kiakojouri, F.; De Biagi, V.; Marchelli, M.; Chiaia, B. A conceptual note on the definition of initial failure in progressive collapse scenarios. Structures 2024, 60, 105921. [Google Scholar] [CrossRef]
- Pang, B.; Wang, F.; Yang, J.; Zhang, W.; Huang, X.-H.; Azim, I. Evaluation on the progressive collapse resistance of infilled reinforced concrete frames based on numerical and semi-analytical methods. Eng. Struct. 2022, 267, 114684. [Google Scholar] [CrossRef]
- Kiakojouri, F.; De Biagi, V.; Chiaia, B.; Sheidaii, M.R. Strengthening and retrofitting techniques to mitigate progressive collapse: A critical review and future research agenda. Eng. Struct. 2022, 262, 114274. [Google Scholar] [CrossRef]
- Azim, I.; Yang, J.; Bhatta, S.; Wang, F.; Liu, Q.-F. Factors influencing the progressive collapse resistance of RC frame structures. J. Build. Eng. 2020, 27, 100986. [Google Scholar] [CrossRef]
- Pham, A.T.; Tan, K.H.; Yu, J. Numerical investigations on static and dynamic responses of reinforced concrete sub-assemblages under progressive collapse. Eng. Struct. 2017, 149, 2–20. [Google Scholar] [CrossRef]
- Ma, F.H.; Gilbert, B.P.; Guan, H.; Xue, H.; Lu, X.; Li, Y. Experimental study on the progressive collapse behaviour of RC flat plate substructures subjected to corner column removal scenarios. Eng. Struct. 2019, 180, 728–741. [Google Scholar] [CrossRef]
- Fedorova, N.V.; Phan, D.Q.; Korenkov, P.A. Indirect reinforcement of reinforced concrete elements as a means of protecting a constructive system from a progressive collapse. IOP Conf. Ser. Mater. Sci. Eng. 2020, 753, 032032. [Google Scholar] [CrossRef]
- Ameri, M.R.; Massumi, A.; Masoomi, H. Effect of structural redundancy on progressive collapse resistance enhancement in RC frame structures. J. Perform. Constr. Facil. 2019, 33, 04018092. [Google Scholar] [CrossRef]
- Quiel, S.E.; Naito, C.J.; Fallon, C.T. A non-emulative moment connection for progressive collapse resistance in precast concrete building frames. Eng. Struct. 2019, 179, 174–188. [Google Scholar] [CrossRef]
- Alshaikh, I.M.H.; Abadel, A.A.; Alrubaidi, M. Precast RC structures’ progressive collapse resistance: Current knowledge and future requirements. Structures 2022, 37, 338–352. [Google Scholar] [CrossRef]
- Alanani, M.; Ehab, M.; Salem, H. Progressive collapse assessment of precast prestressed reinforced concrete beams using applied element method. Case Stud. Constr. Mater. 2020, 13, e00457. [Google Scholar] [CrossRef]
- Qian, K.; Liang, S.L.; Fu, F.; Fang, Q. Progressive collapse resistance of precast concrete beam-column sub-assemblages with high-performance dry connections. Eng. Struct. 2019, 198, 109552. [Google Scholar] [CrossRef]
- Li, Z.X.; Liu, H.K.; Shi, Y.C.; Ding, Y.; Zhao, B. Experimental investigation on progressive collapse performance of prestressed precast concrete frames with dry joints. Eng. Struct. 2021, 246, 113071. [Google Scholar] [CrossRef]
- Nimse, R.B.; Joshi, D.D.; Patel, P.V. Behavior of wet precast beam column connections under progressive collapse scenario: An experimental study. Int. J. Adv. Struct. Eng. (IJASE) 2014, 6, 149–159. [Google Scholar] [CrossRef]
- Kang, S.B.; Tan, K.H. Progressive collapse resistance of precast concrete frames with discontinuous reinforcement in the joint. J. Struct. Eng. 2017, 143, 04017090. [Google Scholar] [CrossRef]
- Feng, F.F.; Hwang, H.J.; Yi, W.J. Static and dynamic loading tests for precast concrete moment frames under progressive collapse. Eng. Struct. 2020, 213, 110612. [Google Scholar] [CrossRef]
- Wang, F.L.; Yang, J.; Nyunn, S.; Azim, I. Effect of concrete infill walls on the progressive collapse performance of precast concrete framed substructures. J. Build. Eng. 2020, 32, 101461. [Google Scholar] [CrossRef]
- Feng, D.C.; Wang, Z.; Wu, G. Progressive collapse performance analysis of precast reinforced concrete structures. Struct. Des. Tall Spec. Build. 2019, 28, e1588. [Google Scholar] [CrossRef]
- Elsanadedy, H.M. New moment-resisting beam-column joints to increase progressive collapse resistance of precast concrete buildings. J. Build. Eng. 2021, 44, 102884. [Google Scholar] [CrossRef]
- Zhou, Y.; Hu, X.; Pei, Y.L.; Hwang, H.-J.; Chen, T.; Yi, W.; Deng, L. Dynamic load test on progressive collapse resistance of fully assembled precast concrete frame structures. Eng. Struct. 2020, 214, 110675. [Google Scholar] [CrossRef]
- Xie, Y.K. Research on Collapse Performance of Prefabricated Concrete Structure. Master’s Thesis, Guangxi University, Nanning, China, 2020. [Google Scholar]
- GB 50010-2010; Code for Design of Concrete Structures. Ministry of Housing and Urban-Rural Development of the People’s Republic of China: Beijing, China, 2010.
- GB 50011-2010; Code for Seismic Design Of Buildings. Ministry of Housing and Urban-Rural Development of the People’s Republic of China: Beijing, China, 2010.
- Livemore Software Technology Corporation. LS-DYNA Keyword User’s Manual; Livemore Software Technology Corporation: California, CA, USA, 2003. [Google Scholar]
- Griffiths, H.; Pugsley, A.; Saunders, O.A. Report of the Inquiry into the Collapse of Flats at Ronan Point, Canning Town: Presented to the Minister of Housing and Local Government; HM Stationery Office: Richmond, UK, 1968. [Google Scholar]
- Xu, K.; Lu, Y. Numerical simulation study of spallation in reinforced concrete plates subjected to blast loading. Comput. Struct. 2006, 84, 431–438. [Google Scholar] [CrossRef]
- Shi, Y.C.; Li, Z.X.; Hao, H. A new method for progressive collapse analysis of RC frames under blast loading. Eng. Struct. 2010, 32, 1691–1703. [Google Scholar] [CrossRef]
- Kim, H.S.; Ahn, H.S.; Ahn, J.G. Erosion criteria for the blast analysis of reinforcement concrete members. J. Archit. Inst. Korea Struct. Constr. 2014, 30, 21–28. [Google Scholar] [CrossRef]
- Khandelwal, K.; El-Tawil, S. Pushdown resistance as a measure of robustness in progressive collapse analysis. Eng. Struct. 2011, 33, 2653–2661. [Google Scholar] [CrossRef]


Disclaimer/Publisher’s Note: The statements, opinions and data contained in all publications are solely those of the individual author(s) and contributor(s) and not of MDPI and/or the editor(s). MDPI and/or the editor(s) disclaim responsibility for any injury to people or property resulting from any ideas, methods, instructions or products referred to in the content. |
© 2024 by the authors. Licensee MDPI, Basel, Switzerland. This article is an open access article distributed under the terms and conditions of the Creative Commons Attribution (CC BY) license (https://creativecommons.org/licenses/by/4.0/).