Abstract
Carbonation depth is essential to determine the durability and predict the remaining service life of concrete structures. This study proposes a multi-frequency Rayleigh wave approximation method (MFRWA) to evaluate carbonation depth by exploiting the frequency-dependent penetration depths of ultrasonic Rayleigh waves. A series of numerical simulations are conducted to investigate the effective penetration depth of Rayleigh waves and the feasibility of the proposed MFRWA method on carbonation depth evaluation. Subsequently, the accelerated carbonation experiment is conducted to evaluate the carbonation depth using low-frequency and high-frequency Rayleigh waves, and the measured results from the Rayleigh wave method are compared with the ones from the phenolphthalein indicator and thermalgravimetric analysis (TGA) method. The results show that carbonation depth measured by Rayleigh wave method meets well with the one from TGA technique, demonstrating that the proposed method could provide a non-destructive and precise carbonation depth estimation. The proposed MFRWA method contributes a novel scheme for concrete carbonation evaluation and holds substantial potential in both laboratory and field applications.
1. Introduction
Concrete carbonation is a prevalent phenomenon in reinforced concrete (RC) structures, characterized by the chemical reaction between the permeated carbon dioxide (CO2) and the hydration products such as calcium hydroxide (Ca(OH)2) [1,2]. This process reduces the pH value in the concrete pore solutions, which would destroy the protective layer surrounding the rebar [3,4] and trigger the corrosion process [5,6] when the carbonation front reaches the rebar. The escalating atmospheric CO2 concentration all over the world [7] makes the assessment of carbonation depth crucial for structural maintenance decisions and enhancement of the service life of RC infrastructures.
Currently, the phenolphthalein indicator is the most commonly employed method for determining carbonation depth in field applications, while it is destructive to structures [8] and limited to localized information. Furthermore, the phenolphthalein indicator is hard to detect the semi-carbonated zones of concrete because of the limited pH sensing range [9,10,11]. While the techniques such as thermogravimetric analysis (TGA) [12], Fourier-transform infrared spectroscopy [13], Raman spectroscopy [14], and nuclear magnetic resonance [15] provide deep insights into concrete carbonation process, they are confined to laboratory tests and infeasible for in situ assessments in practical structures. Therefore, it is an urgent need to develop a non-destructive and in situ method to assess the concrete carbonation depth.
Global vibration characteristics, such as frequency, mode shape, and damping, are extensively utilized for structural condition monitoring [16,17], but they exhibit low sensitivity to minor damages [18]. The acoustic emission (AE) technique, known for its sensitivity and non-destructive testing capabilities [19,20], relies on the stress waves produced by material fracture events [21]. However, concrete carbonation is a gradual process characterized by CO2 absorption rather than material fracturing. Thus, the AE technique encounters difficulties in effectively monitoring concrete carbonation.
Ultrasonic waves-based testing methods have been widely studied in non-destructive evaluation of infrastructures [22,23,24,25,26,27,28,29,30] because of their high sensitivity. In terms of concrete carbonation evaluation, Villarreal et al. [31] utilized the conventional ultrasonic pulse velocity (UPV) method to assess the carbonation degree of cement specimen. The results indicated that the velocity of ultrasonic bulk waves fluctuated in the initial carbonation stages and increased with the development of carbonation. Conversely, Mendes [32] found that the UPV values were similar in different concrete carbonation stages, leading to the conclusion that UPV is challenging to characterize concrete carbonation. The discrepancy in results [31,32] could be attributed to the low sensitivity of bulk waves to near-surface carbonation process, as the bulk waves transmit though the structure and carry little information about the carbonated concrete. Moreover, the applicability of UPV technique in field application is constrained by the requirement of sensor arrangement in both sides of the structures and the high attenuation of bulk waves.
Bouchaala et al. [33] investigated nonlinear resonant acoustic spectroscopy (NRUS) to evaluate the carbonation degree of concrete, and the results demonstrated that NRUS technique exhibited enhanced sensitivity to carbonation changes when compared to dynamic elastic modulus. However, NRUS technique requires excitation of the entire structural vibration, which limits its application in large structures. Kim et al. [34] utilized the nonlinear ultrasonic wave method to monitor the carbonation process in concrete. The results showed that the second harmonic generation effect decreased in carbonation process, indicating the filling of internal concrete pores during carbonation. Nevertheless, the presence of multiple nonlinear sources in concrete, such as micro-pores and cracks, could potentially distort the nonlinear ultrasonic results. Moreover, these two nonlinear methods [33,34] primarily reflect the progression of carbonation rather than precise measurement of the carbonation depth.
Rayleigh waves have gained much attention for their efficacy in detecting [35,36] and quantifying [37,38] the near-surface damage because the energy of Rayleigh waves mainly concentrates near the structural surface. The effective penetration depth is highly related to the frequency [39,40], which allows the control of effective detection depth of Rayleigh waves by selecting the excitation frequency. Meanwhile, the one-sided transducer arrangement of the Rayleigh wave method makes it convenient to be employed in field applications [39]. Given that concrete carbonation initiates at the surface and gradually permeates deeper, Rayleigh waves are well-suited for monitoring and evaluating the concrete carbonation depth.
This study proposes a multi-frequency wavelength approximation method (MFWA) to evaluate concrete carbonation depth. The main principle of the proposed method is the differences in wave field penetration of different frequency Rayleigh waves. Probing waves of varying frequencies are employed to leverage the frequency-dependent penetration depth of Rayleigh waves. The estimation of concrete carbonation depth is achieved by capturing the inflection point of the similarity curve for received ultrasonic Rayleigh signals between unknown carbonization state and healthy state. The proposed method could achieve a non-destructive, real-time and accurate evaluation of concrete carbonation depth.
2. Methodology
In a homogeneous, linear, elastic medium, the relationships between mechanical properties and the velocity of longitudinal (VL) and shear wave (VS) are as follows:
where E, ν and ρ are the Young’s modulus, Poisson’s ratio and density, respectively. When the medium is subjected to vertical excitation on the surface, energy dissipates in the form of stress waves (longitudinal waves, shear waves, and Rayleigh waves). Rayleigh waves are generated by the coupling of longitudinal and shear waves at the surface, and the approximate relationship between Rayleigh wave velocity (VR) and shear wave velocity could be expressed as follows [41]:
The particle displacement trajectories of Rayleigh waves form a counterclockwise ellipse [42], as illustrated in Figure 1a. It has been pointed out that Rayleigh waves contribute to 67% of the total energy, shear waves for 26%, and shear waves for 7% [43] when the surface is loaded by vertical excitation. The attenuation of Rayleigh waves is proportional to the square of the propagation distance, which is attributed to the cylindrical surface. The attenuation rate is notably lower than that of bulk waves, where the attenuation is proportional to the cube of the distance due to the spherical wave front [37,44]. Therefore, Rayleigh waves possess advantages of high energy and low attenuation [45].
As depicted in Figure 1b, the amplitude of particle motion decreases rapidly with increasing depth. The effective penetration depth of Rayleigh waves is commonly considered to be one wavelength [45,46]. Assuming the velocity of Rayleigh waves remains constant, the effective penetration depth of a Rayleigh wave is inversely proportional to the excitation frequency.
where VR, DP, λR and f are the velocity, penetration depth, wavelength and excitation frequency of Rayleigh waves, respectively. Low-frequency Rayleigh waves possess deeper penetration capabilities, enabling the detection of the deeper area of structures. On the other hand, high-frequency Rayleigh waves with shallower penetration depth offer higher resolution for small defects.
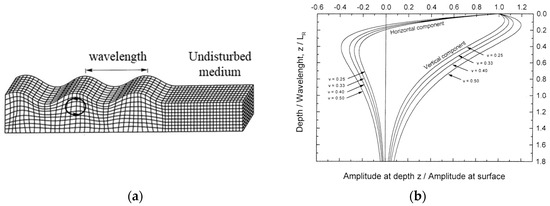
Figure 1.
Propagation behavior of Rayleigh waves: (a) illustration of particle motion of Rayleigh waves [42], (b) decay of amplitude of Rayleigh waves with depth from the surface [47].
Figure 1.
Propagation behavior of Rayleigh waves: (a) illustration of particle motion of Rayleigh waves [42], (b) decay of amplitude of Rayleigh waves with depth from the surface [47].
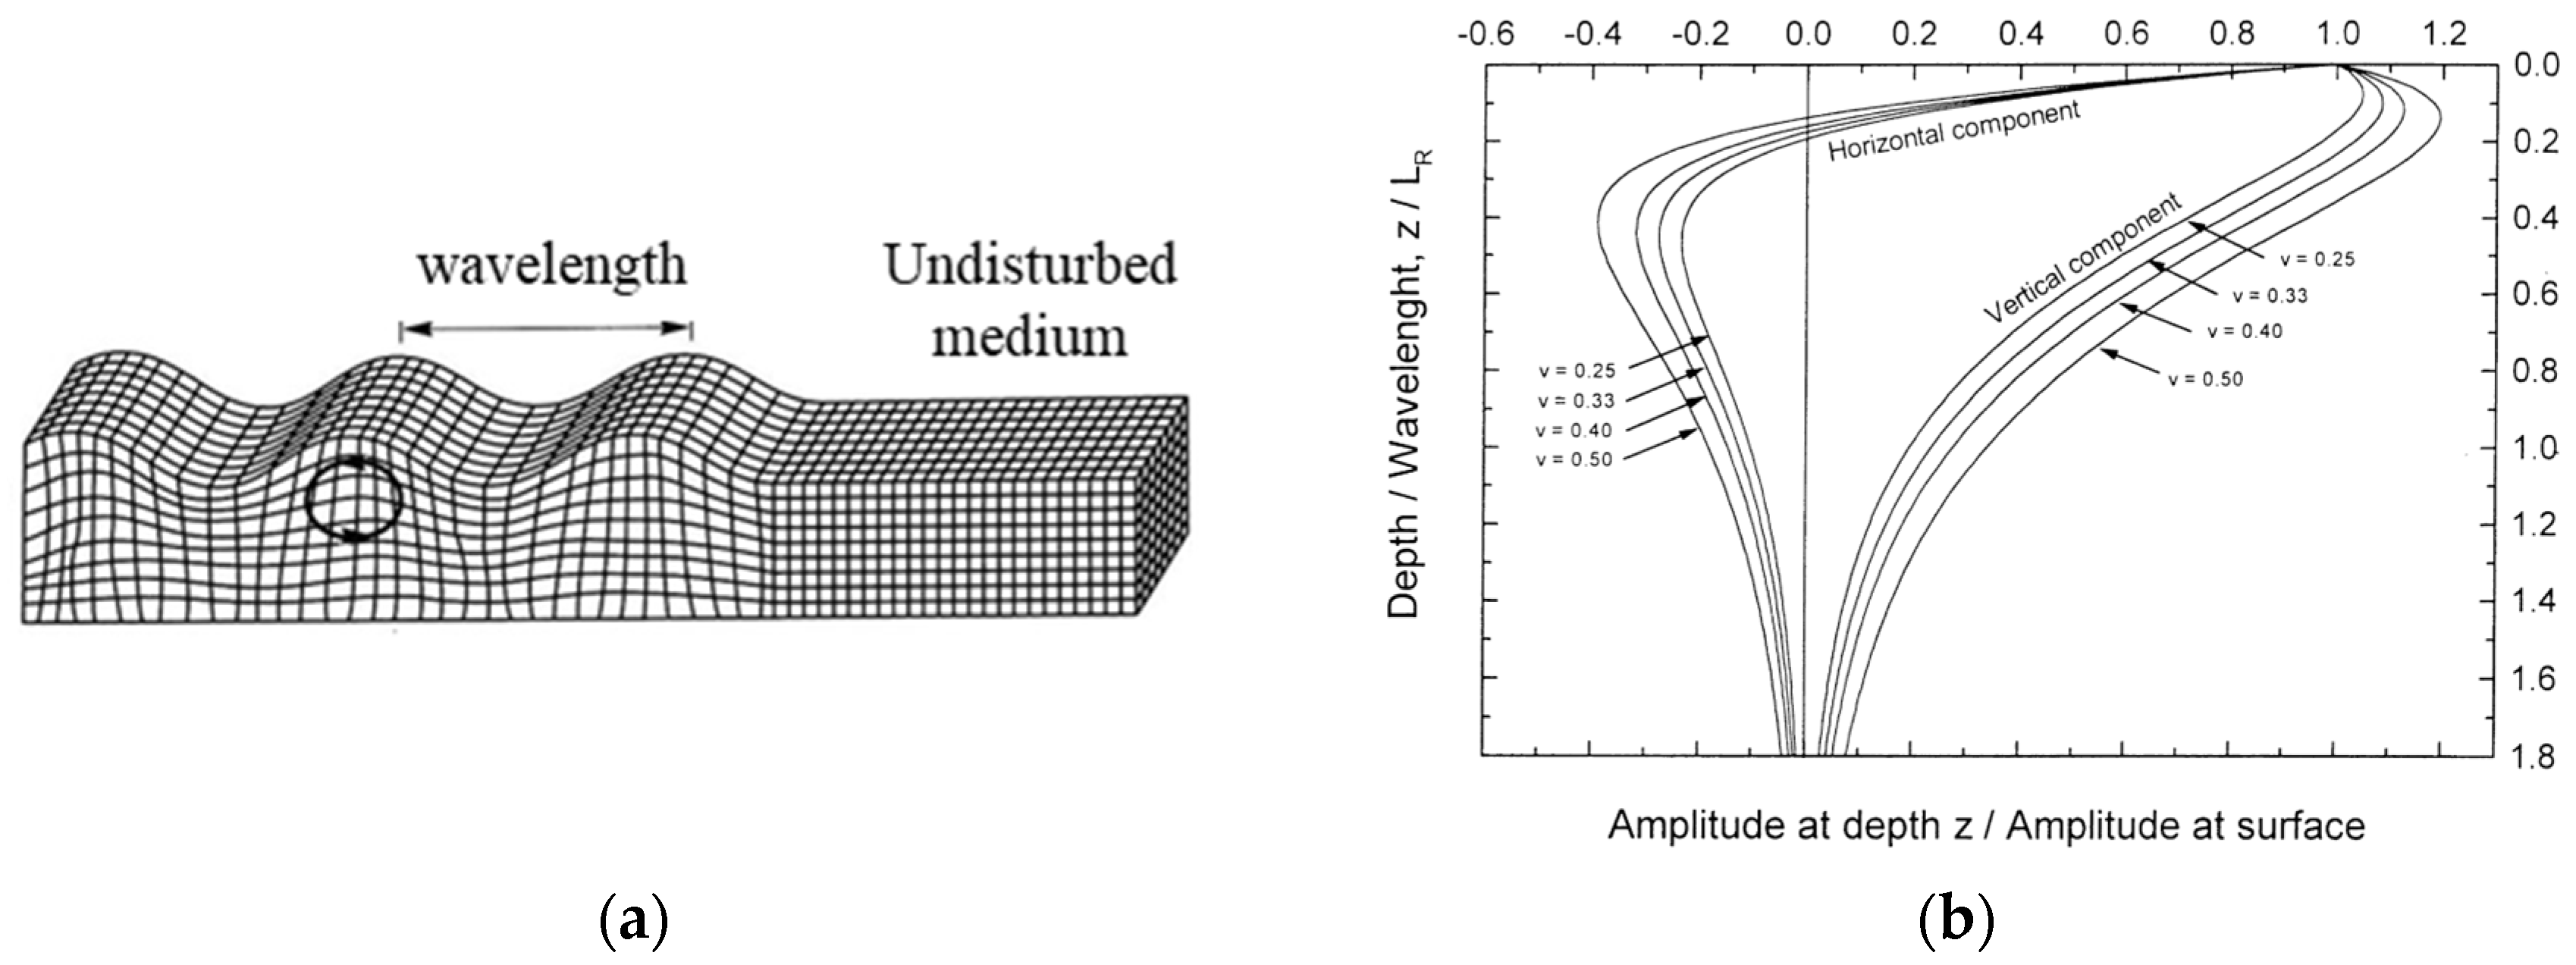
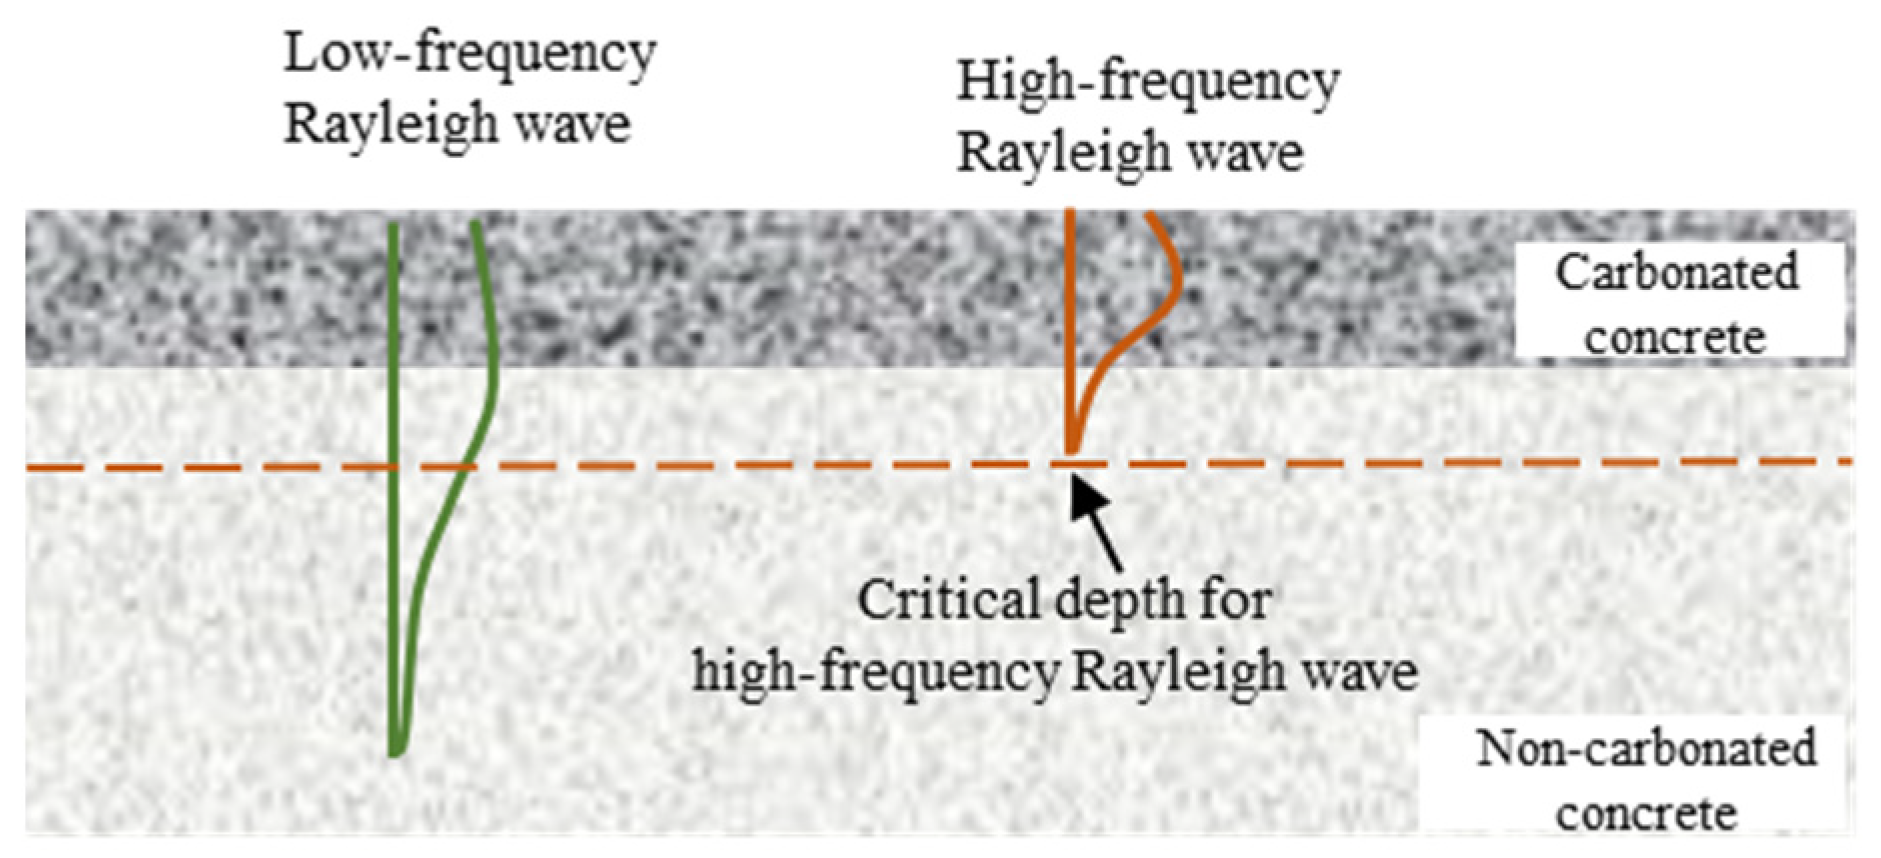
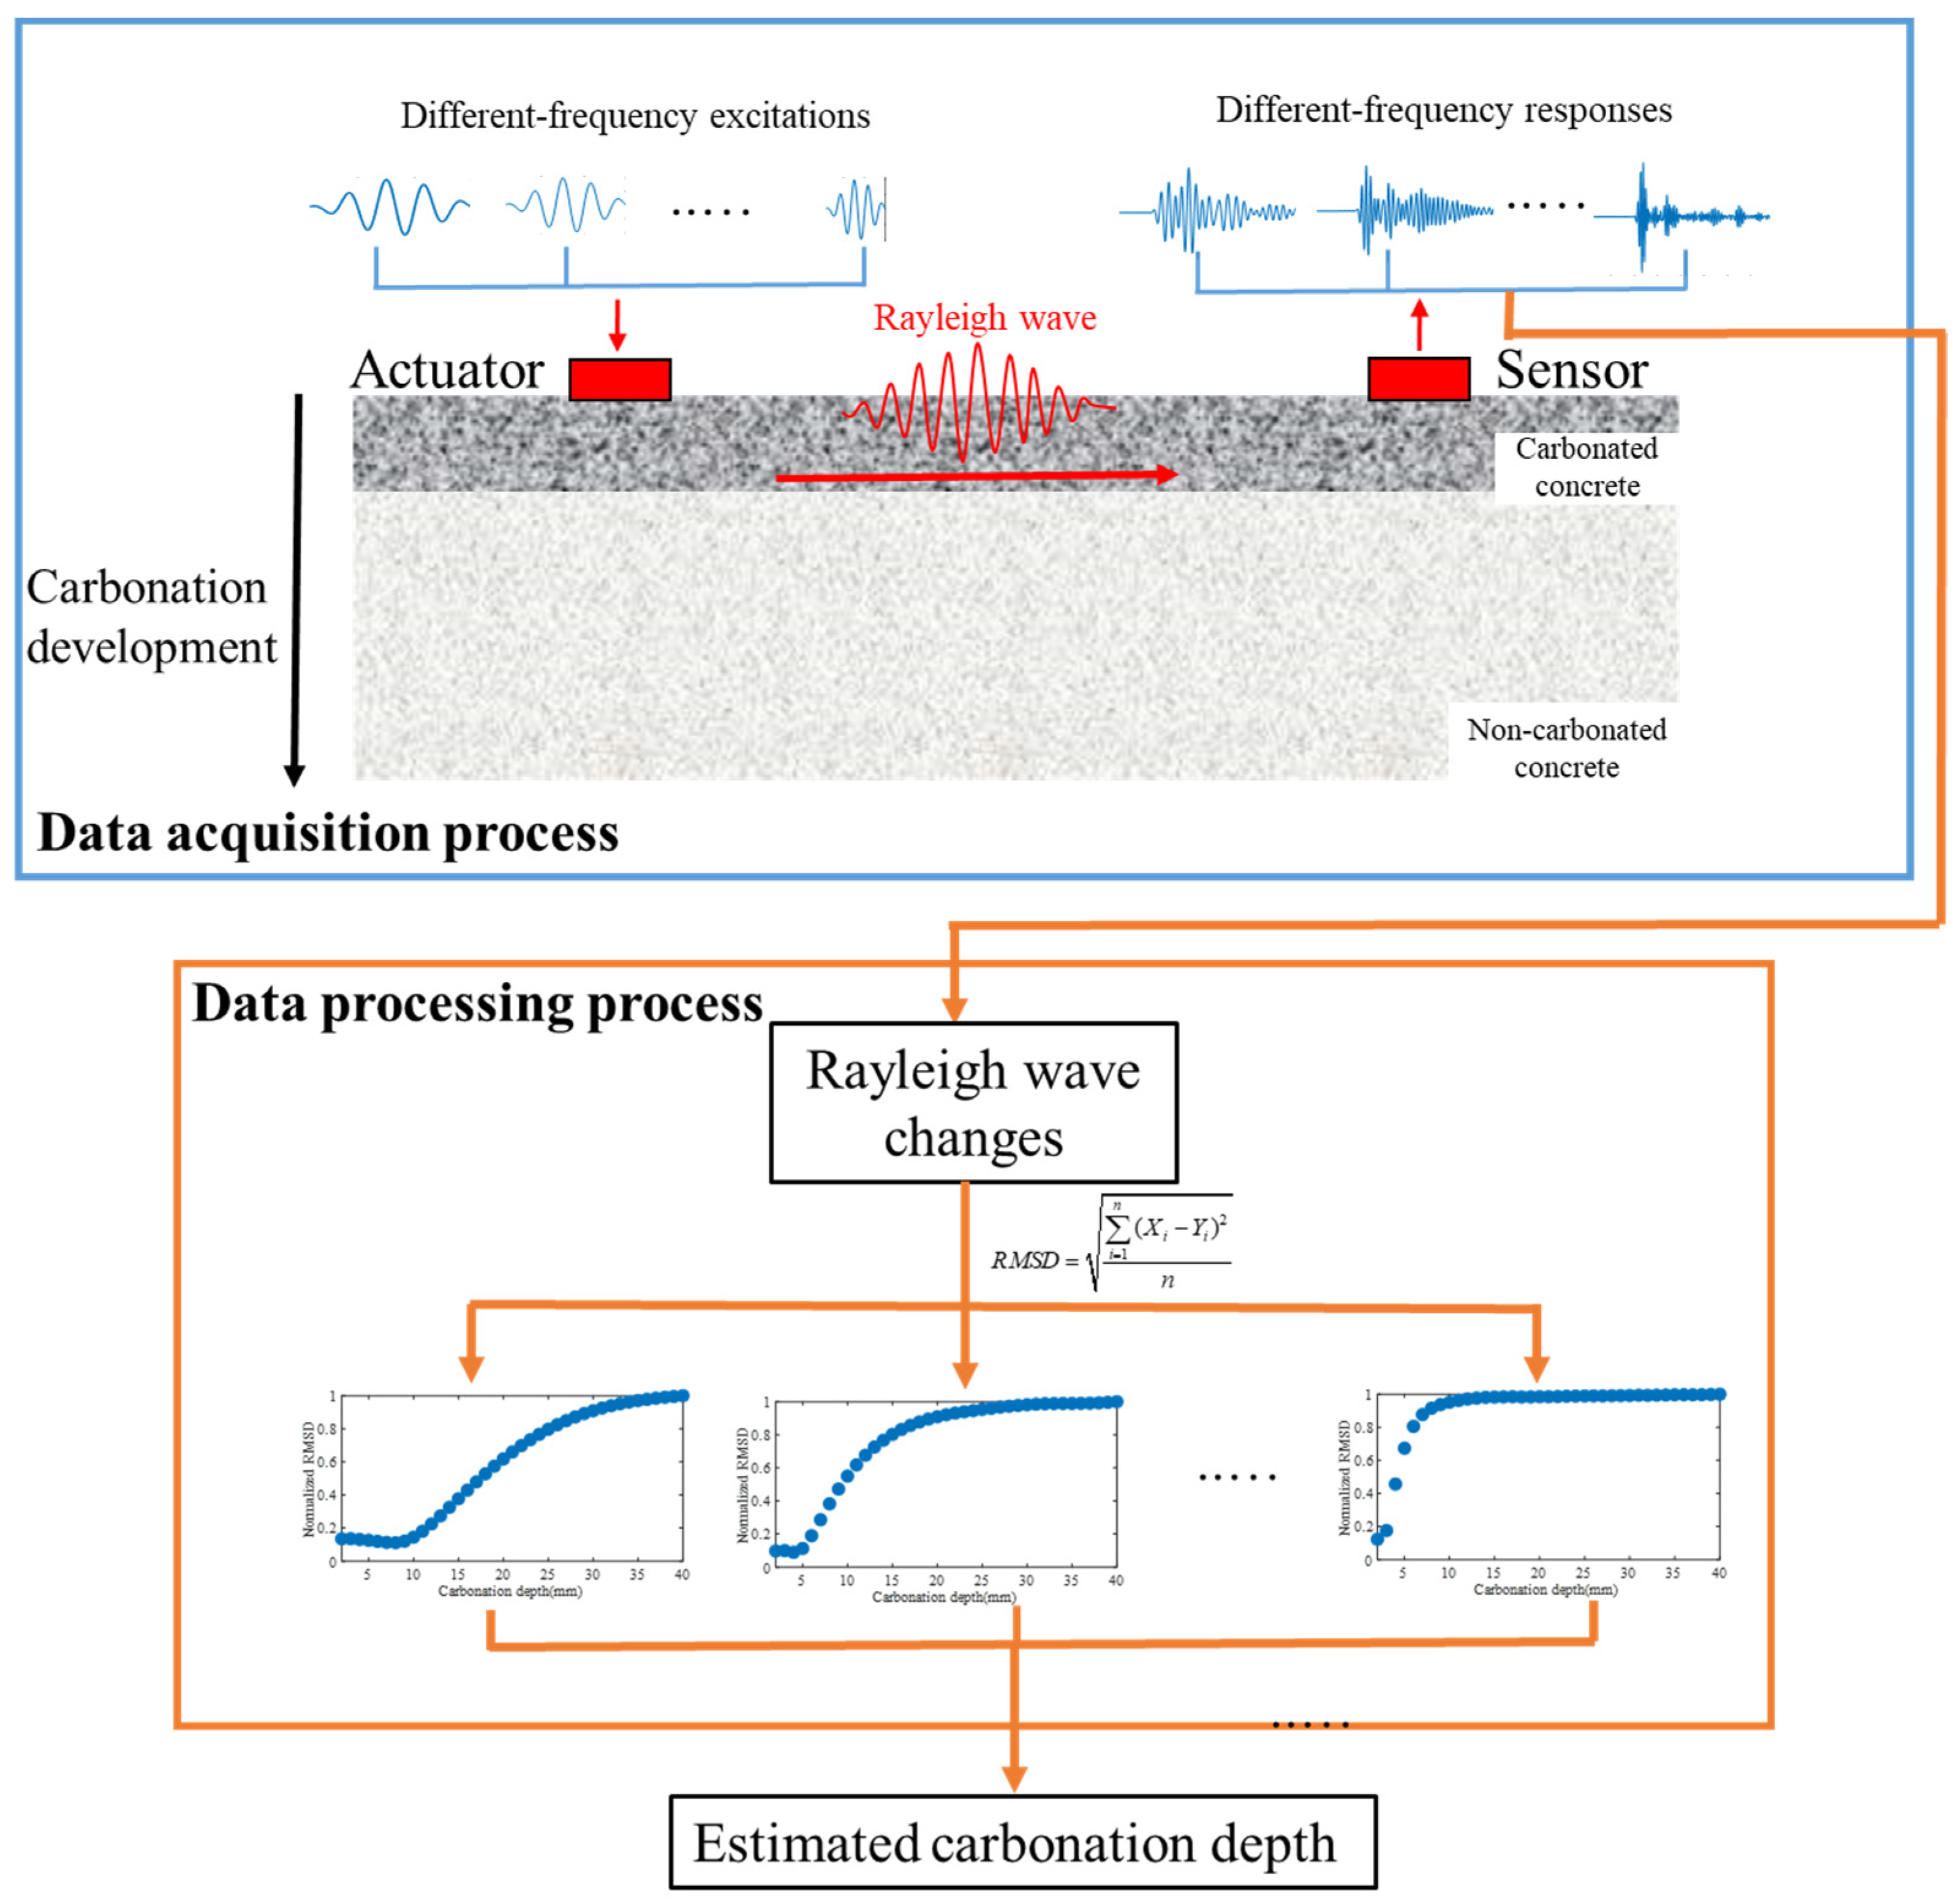
The schematic of Rayleigh waves-based concrete carbonation evaluation is illustrated using vertical displacement of Rayleigh waves, as shown in Figure 2. Concrete carbonation initiates from the surface and gradually permeates deeper. If the carbonation depth lies within the penetration depth of Rayleigh waves, the characteristics of the Rayleigh waves will change continually as the carbonation progresses. Beyond this penetration depth, the characteristics of the Rayleigh waves remain unchanged. Thus, the depth of concrete carbonation can be inferred from the varying trends of Rayleigh waves with different frequencies. The flow chart of the proposed MFRWA method in concrete carbonation depth evaluation method is shown in Figure 3. The different-frequency excitations are used to excite the actuator to generate multiple-frequency Rayleigh waves, and the responses are used to calculate the Rayleigh wave changes in the carbonation process. The different-frequency Rayleigh waves will exhibit different variation patterns, and the carbonation depth could be evaluated from the transition point in the Rayleigh wave variation pattern.

Figure 2.
Schematic illustration of Rayleigh waves-based concrete carbonation evaluation.
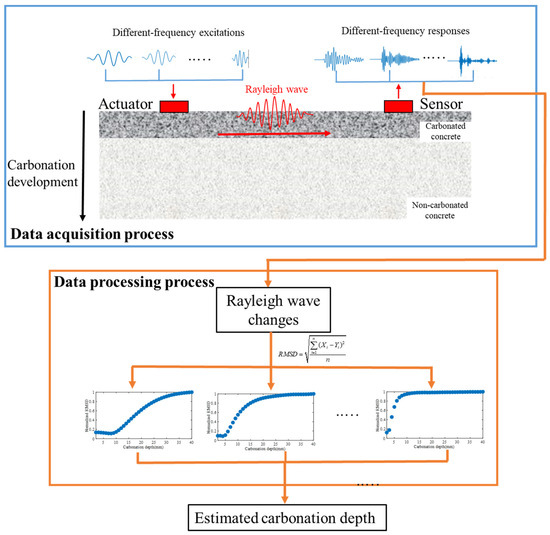
Figure 3.
Flow chart of the MFRWA method in concrete carbonation depth evaluation.
3. Numerical Study
To explore the effective penetration depth and the performances of Rayleigh waves on concrete carbonation depth evaluation, a numerical study is implemented using the finite element (FE) method. Carbonated concrete is simplified as a two-layer medium, as shown in Figure 4. According to the studies [14,48,49], concrete with a specific depth is assigned with increased density and elastic modulus to simulate the carbonation-induced material properties changes. The detailed material properties of the non-carbonated concrete and carbonated concrete are shown in Table 1.
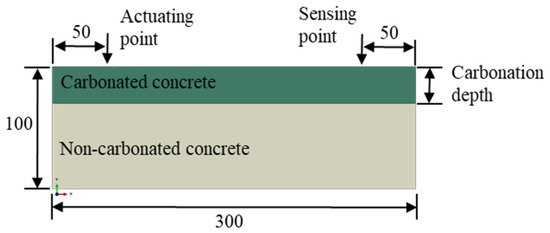
Figure 4.
Numerical model of carbonated concrete (unit: mm).

Table 1.
Material properties of carbonated concrete FE models.
The prerequisite for the generation of Rayleigh waves in the inspected structures is that the wavelength of the wave should be less than the half depth of the specimen [45]. Based on the concrete material properties shown in Table 1, the velocity of Rayleigh waves is determined to be about 2000 m/s, and the wavelength of Rayleigh waves of 60 kHz is calculated to be 35 mm. Consequently, the concrete specimen with a depth of 100 mm allows the formation of Rayleigh waves with frequency higher than 60 kHz.
To accurately simulate the propagation of ultrasonic waves, the time increment step must be less than 1/20 of the ultrasonic wave period:
where Δt represents the time increment step, f and T denote the frequency and period of the probing wave, respectively. The highest frequency employed in the simulation is 180 kHz in this study, and the time increment step should not exceed 0.28 μs according to the Equation (5). To ensure the time-domain resolution of the simulation signal, the time increment step in this study is set to 0.1 μs. Additionally, the model mesh size must be smaller than one-tenth of the wavelength:
where Δl is the mesh size, and λmin is the shortest wavelength of the ultrasonic wave. When the frequency is 180 kHz, the wavelength of Rayleigh waves is approximately 11 mm. A mesh size of 1 mm is employed in this study.
Δt ≤ T/20 = 1/(20 × f)
Δl ≤ λmin/10
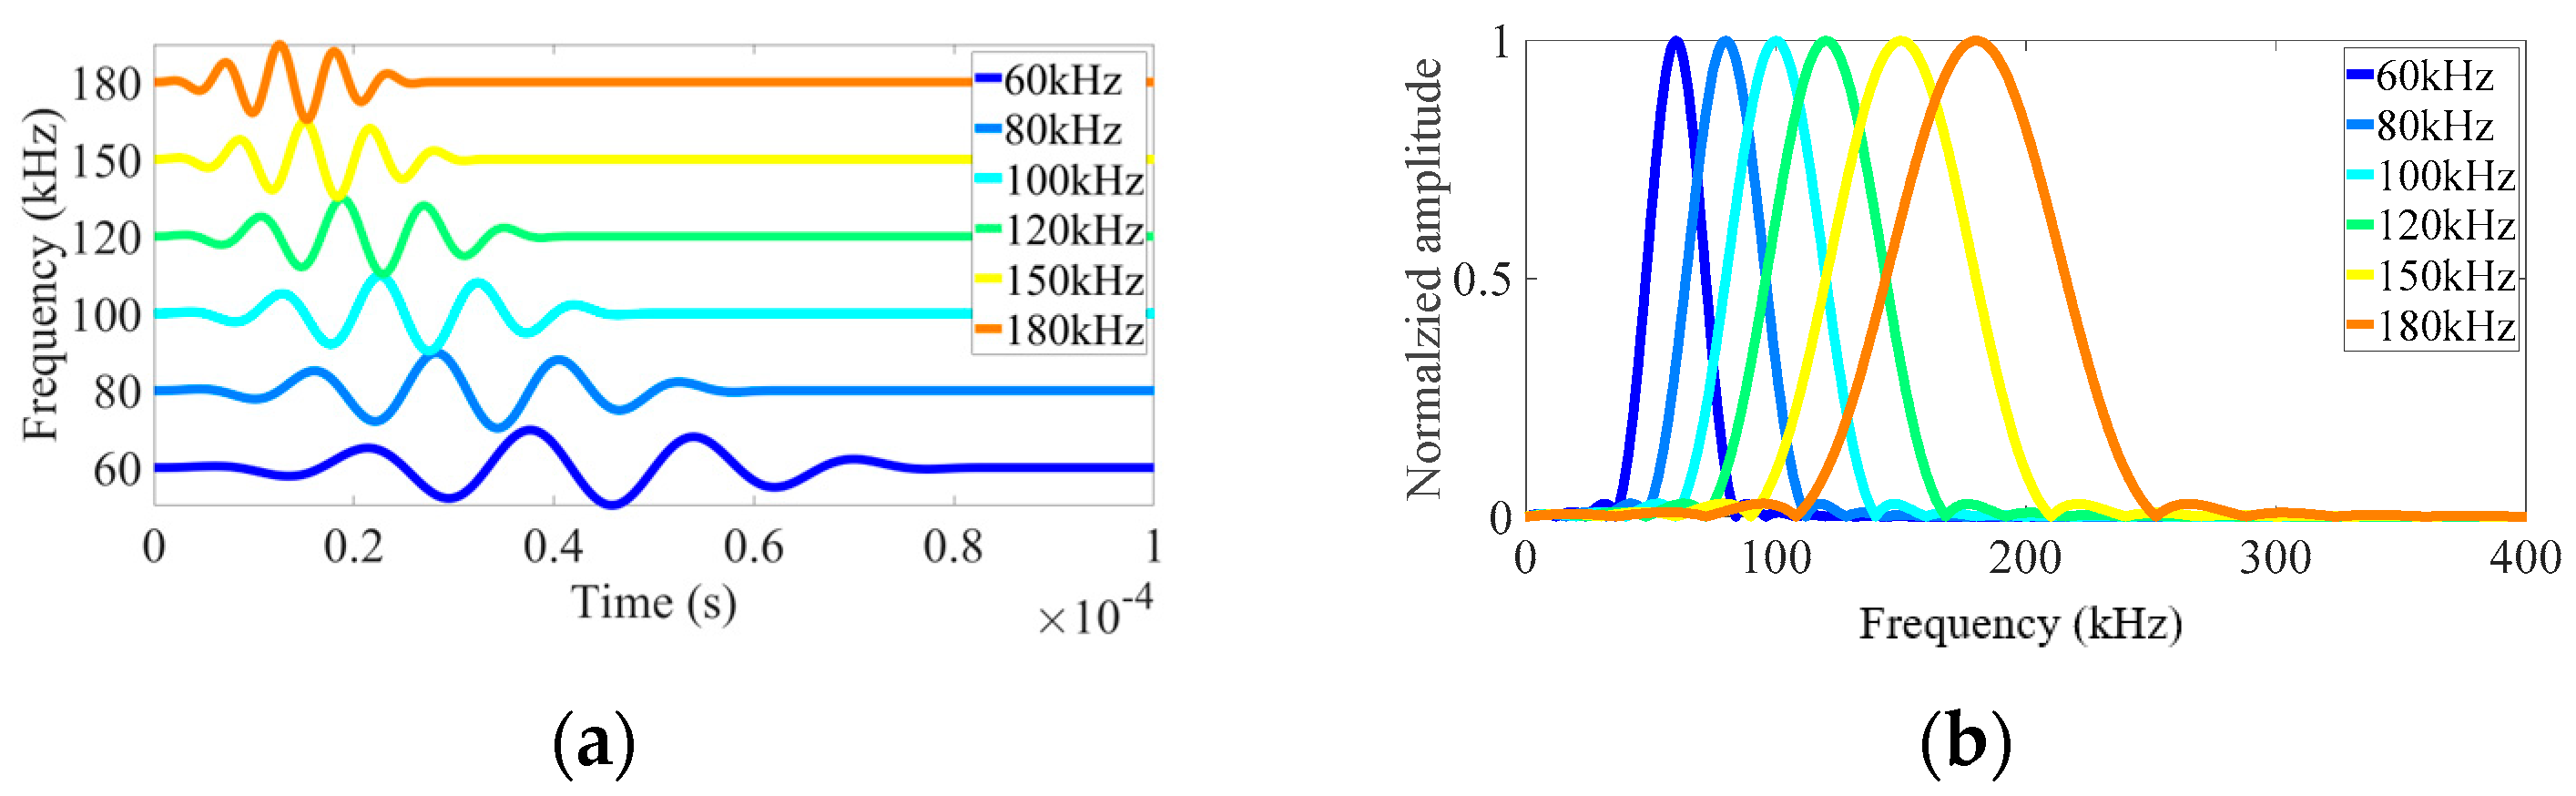
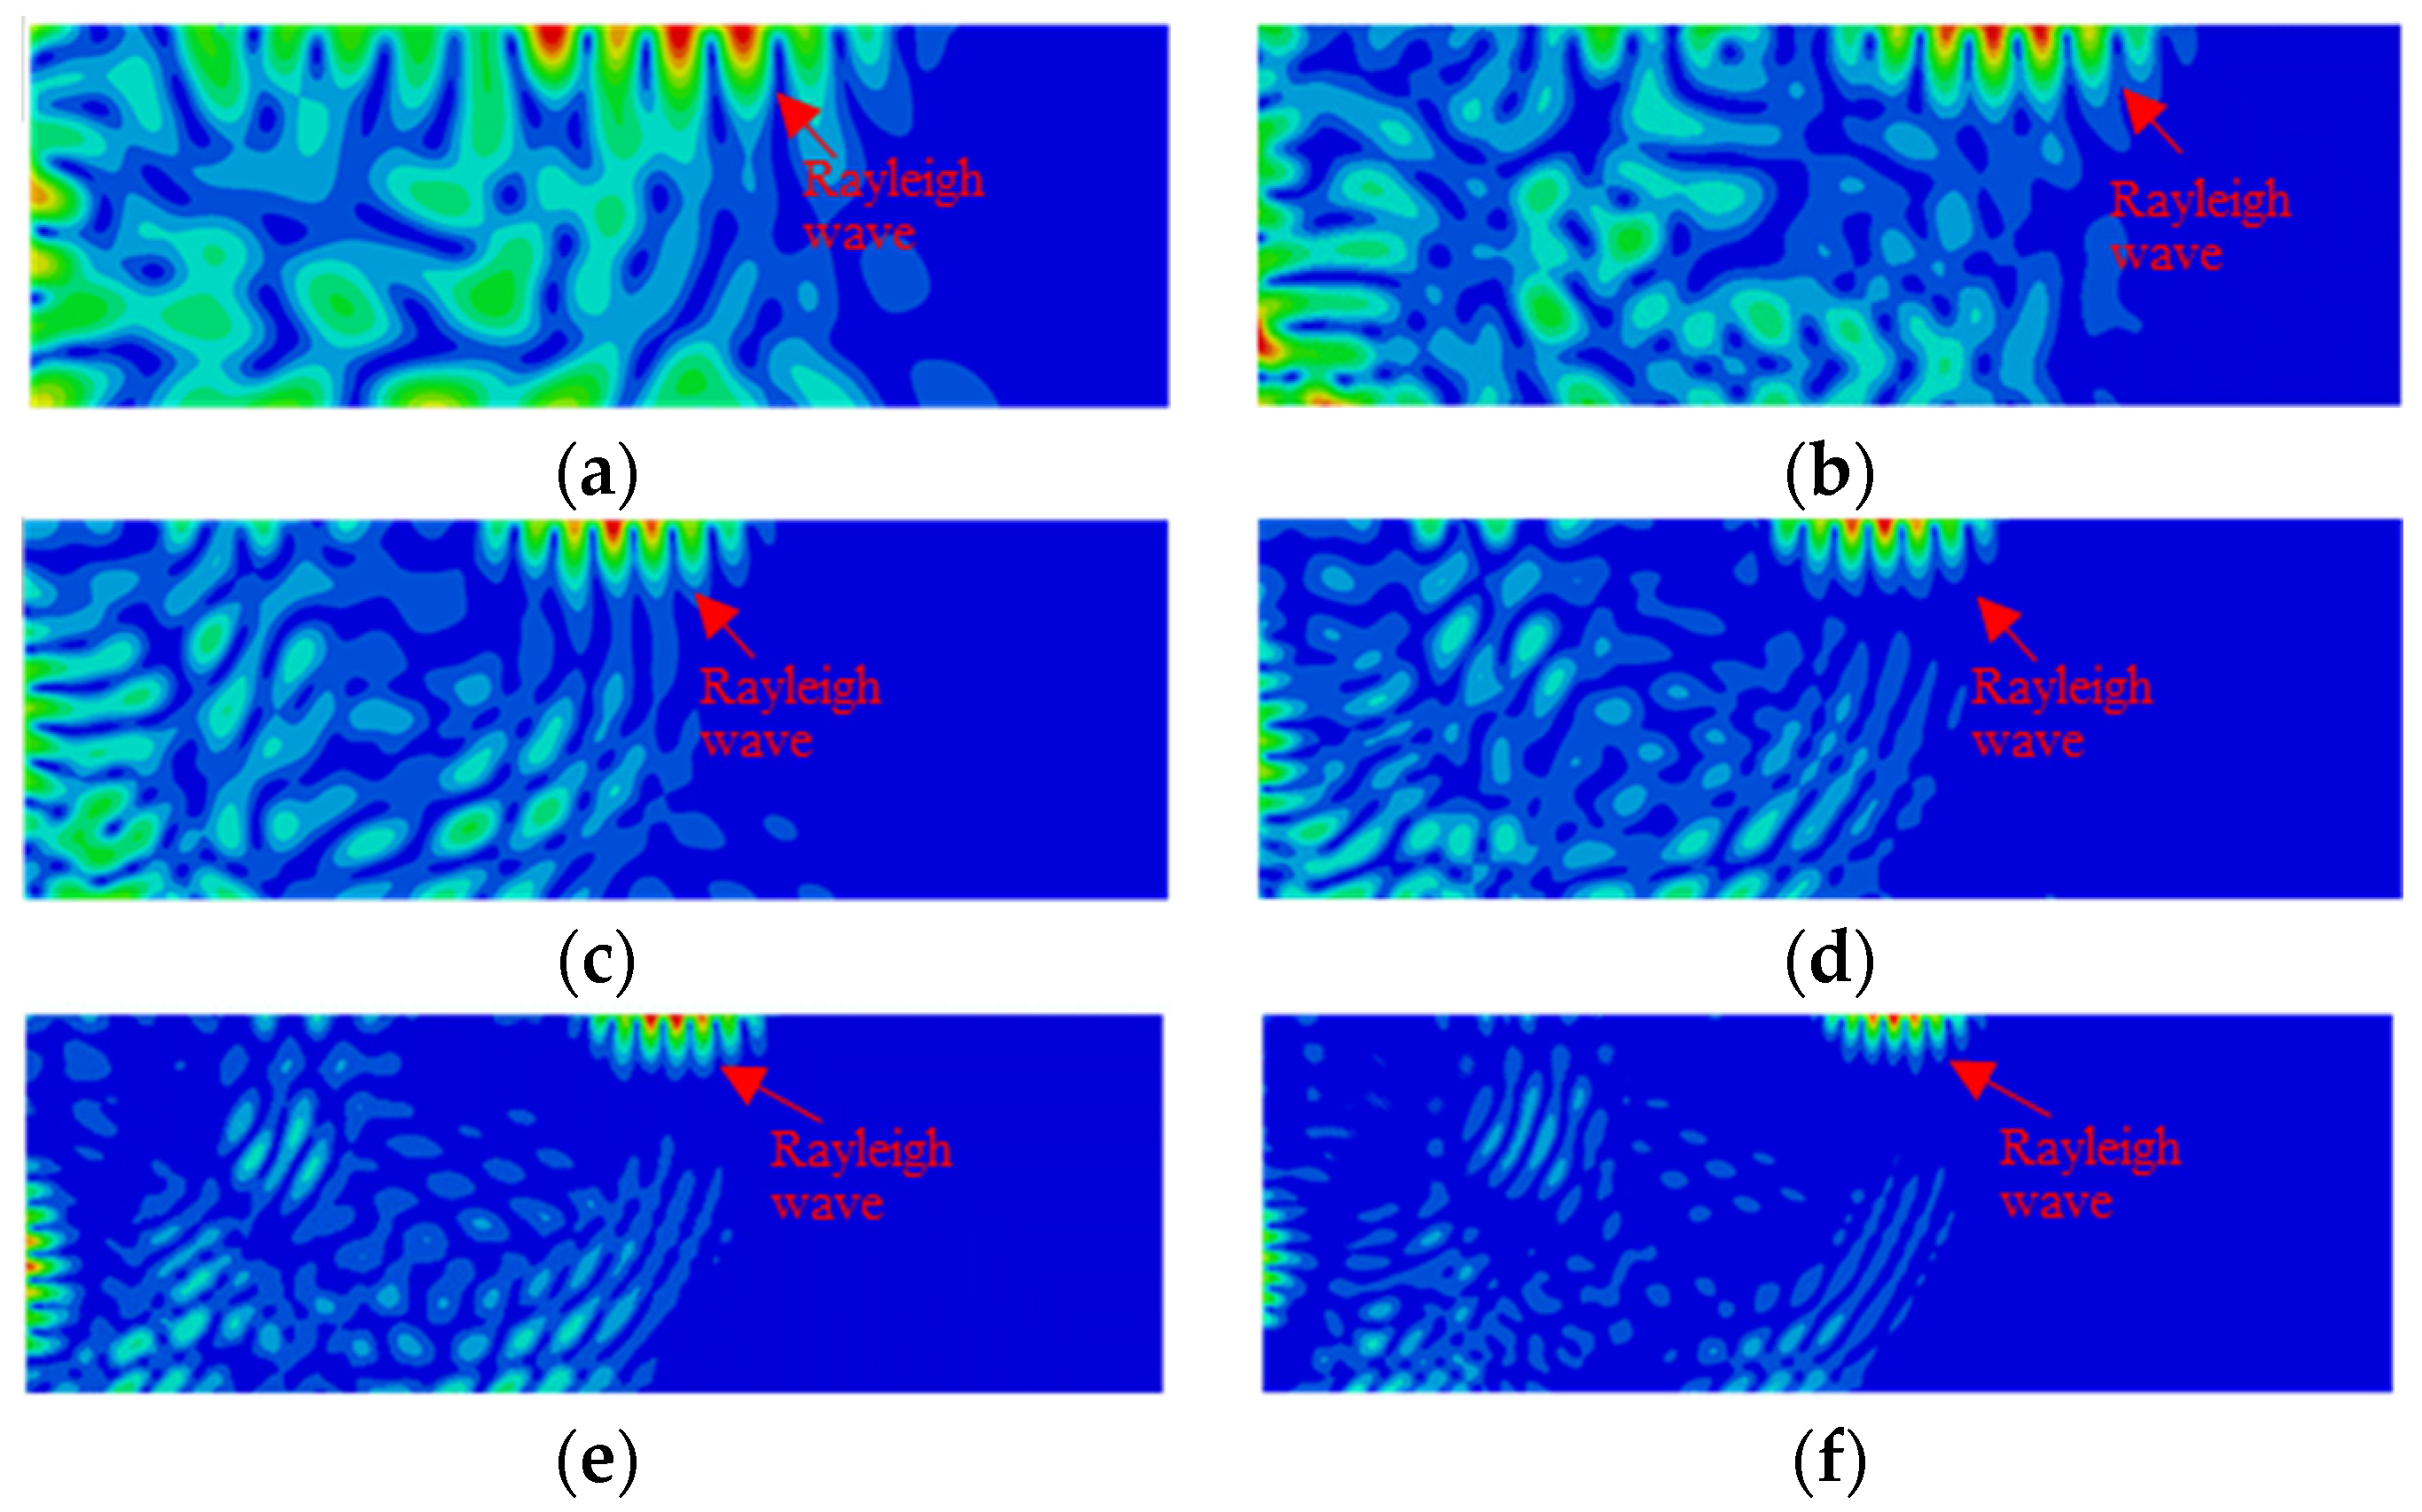
To align with experimental conditions, the finite element model is set with free boundary conditions. In the finite element simulation, the five-cycle Hanning window-modulated sine signals with frequencies of 60 kHz, 80 kHz, 100 kHz, 120 kHz, 150 kHz and 180 kHz are selected as the excitations, as shown in Figure 5. The simulated wave fields shown in Figure 6 demonstrate that the effective penetration depths of Rayleigh waves decrease with the increase in excitation frequency.
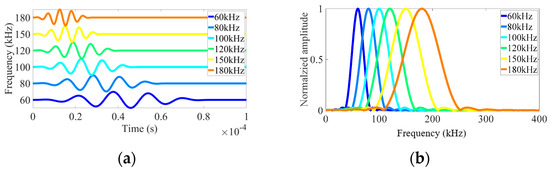
Figure 5.
The excitation signals with frequency of 60 kHz, 80 kHz, 100 kHz, 120 kHz, 150 kHz and 180 kHz: (a) time domain waveforms; (b) frequency domain waveforms.
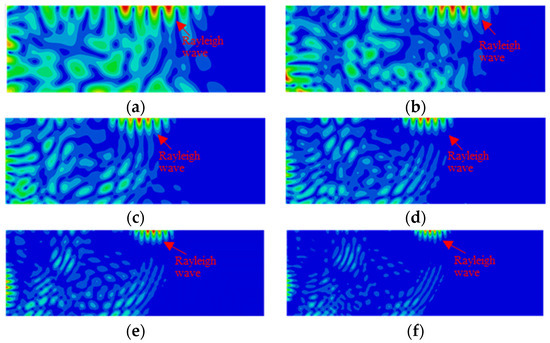
Figure 6.
Simulated wave fields with frequencies of (a) 60 kHz, (b) 80 kHz, (c) 100 kHz, (d) 120 kHz, (e) 150 kHz, (f) 180 kHz.
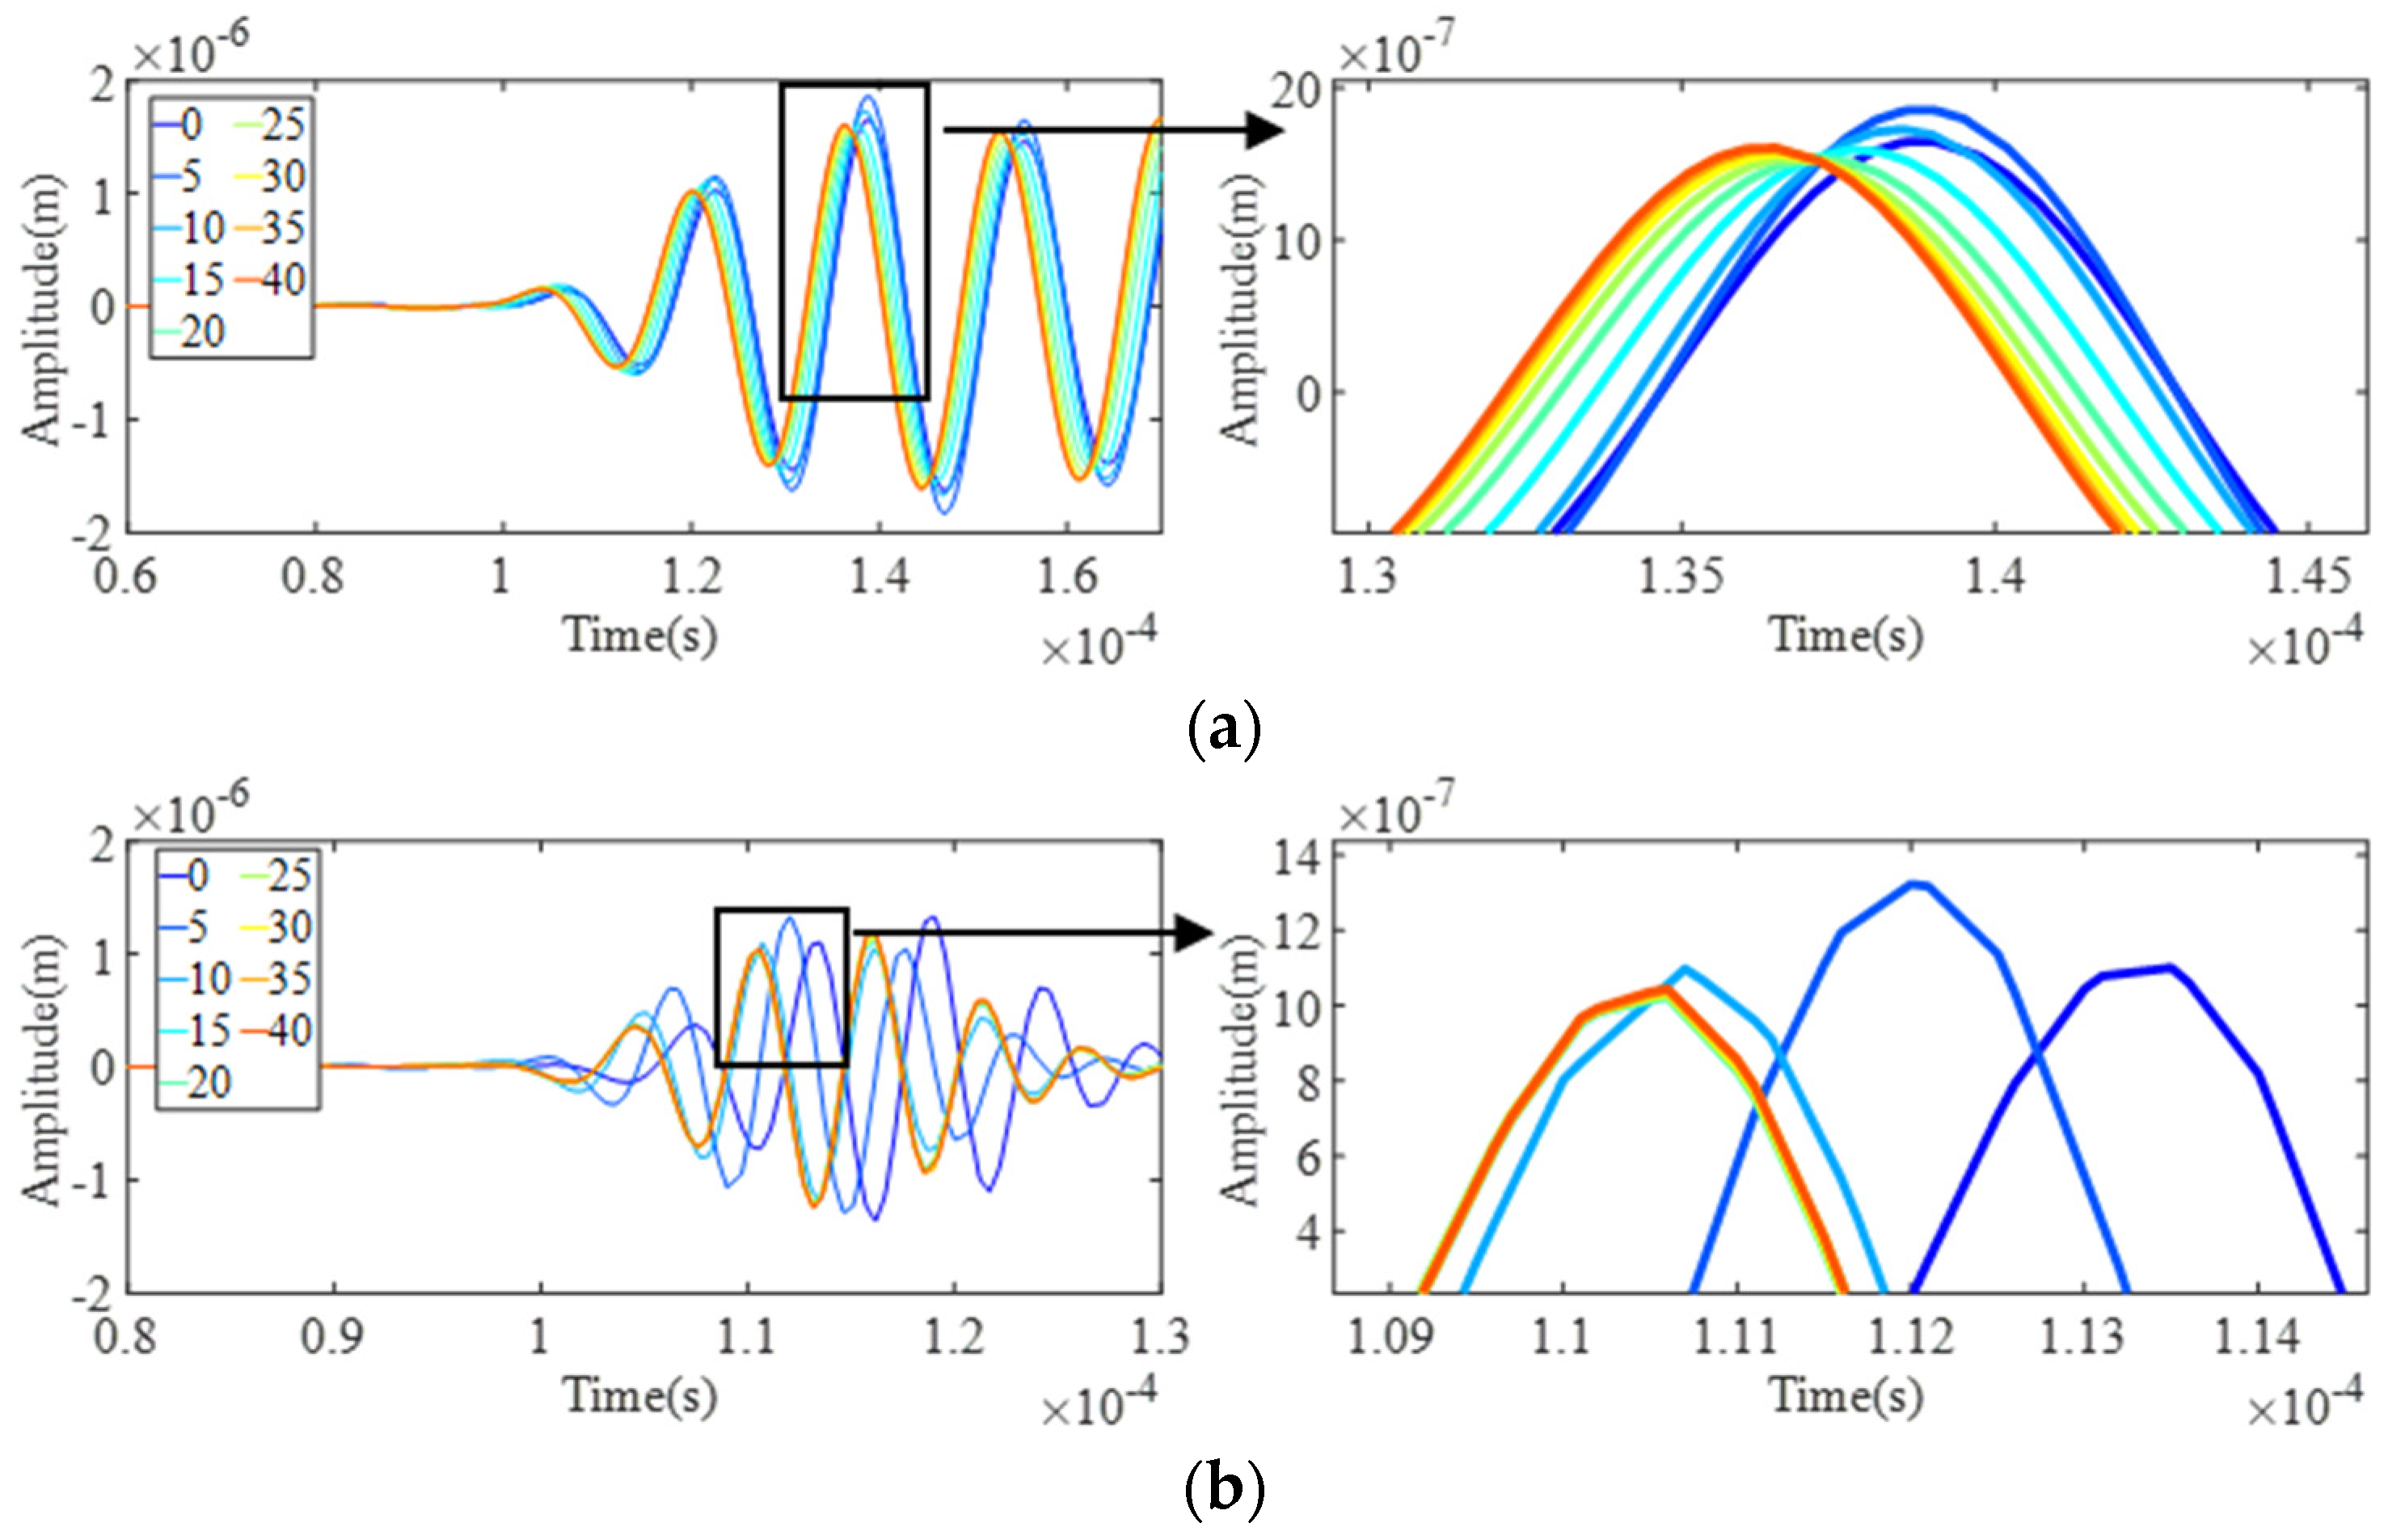
To investigate the performances of Rayleigh waves on carbonation depth estimation, FE models with carbonation depth increasing from 2 mm to 40 mm with increments of 1 mm are established. The vertical displacements at the receiving point are extracted to represent the waveforms of Rayleigh waves because the vertical component is dominant in Rayleigh waves. The time-domain waveforms of Rayleigh waves with frequencies of 60 kHz and 180 kHz are taken as examples to preliminarily demonstrate the variations of low-frequency and high-frequency Rayleigh waves in the carbonation developing process, as illustrated in Figure 7.
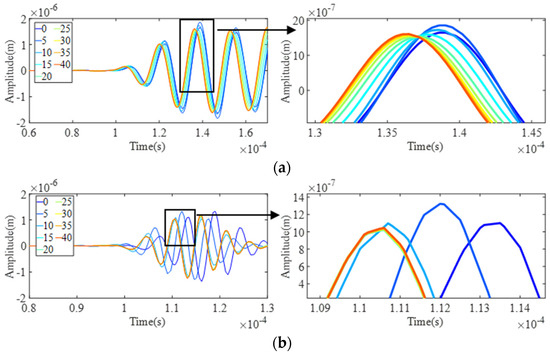
Figure 7.
Simulated Rayleigh waves when the carbonation depth increases from 0 mm to 40 mm in step of 5 mm: (a) 60 kHz; (b) 180 kHz.
As illustrated in Figure 7a, 60 kHz Rayleigh waves exhibit gradual changes when the carbonation depth increases from 0 mm to 35 mm. Notably, the waveforms obtained from 35 mm and 40 mm carbonation condition are almost identical in the Rayleigh wave signals. As shown in Figure 7b, the waveforms of the 180 kHz Rayleigh waves exhibit significant variations when the carbonation depth develops from 0 mm to 10 mm. In contrast, the signals corresponding to carbonation depth beyond 15 mm are almost the same. The variations in the time-domain waveforms of 60 kHz and 180 kHz suggest that Rayleigh waves would transition from a variable to a stable state as the carbonation extends from the surface into the concrete. Moreover, the transition depth decreases with the increase in excitation frequency, highlighting the frequency-dependent nature of Rayleigh wave penetration and its potential in characterizing carbonation depth.
The time-domain waveforms preliminarily validate the feasibility of employing different-frequency Rayleigh waves to assess the depth of concrete carbonation. To quantitatively characterize Rayleigh wave alterations, the root mean square deviation (RMSD) is defined to represent the variation degree of Rayleigh waves:
where X is the Rayleigh wave signal received from the healthy state of concrete, Y is the Rayleigh wave signal after undergoing a certain degree of carbonation, and n is the length of the Rayleigh wave signal.
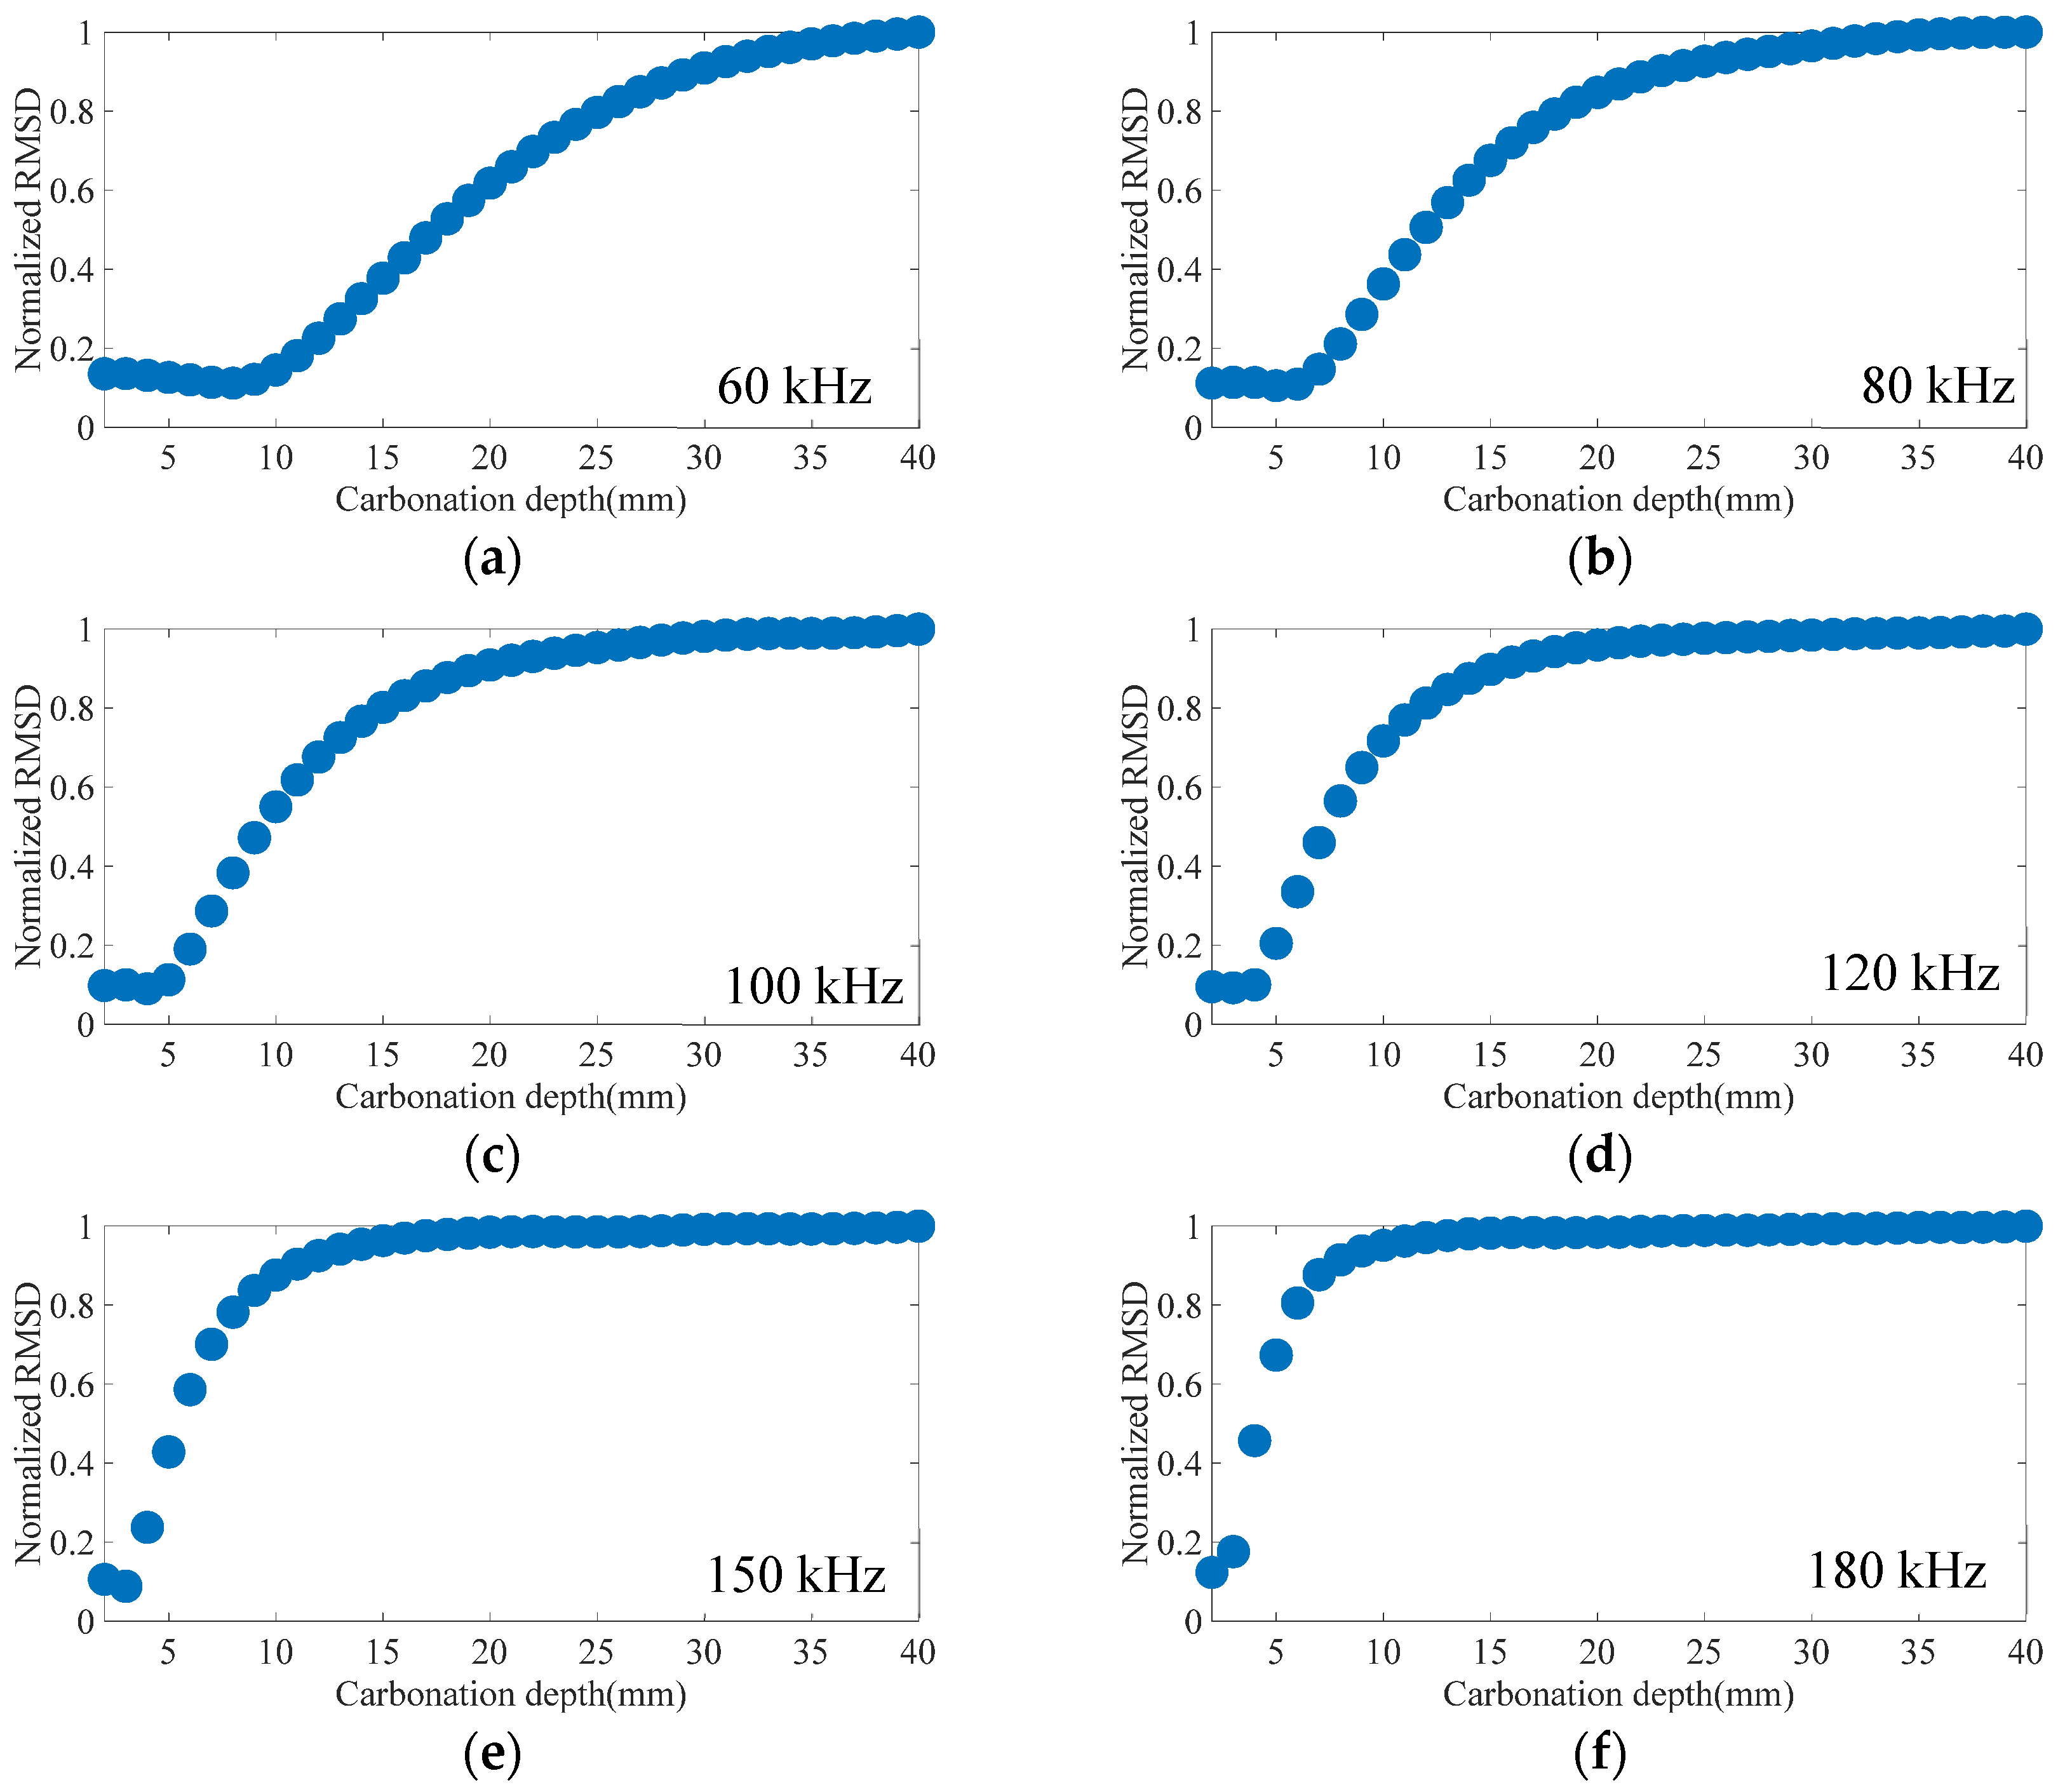
The normalized RMSD values of different-frequency Rayleigh waves are shown in Figure 8. Generally, a similar pattern is observed across these frequencies. The RMSD values show an incremental elevation in the beginning and exhibit a tendency to stabilize with the development of carbonation. The transition from variation to stabilization means the carbonation depth is reaching and exceeding the effective penetration depth of the Rayleigh waves. The carbonation depth could then be estimated as the effective penetration depth of Rayleigh waves at the transition point.
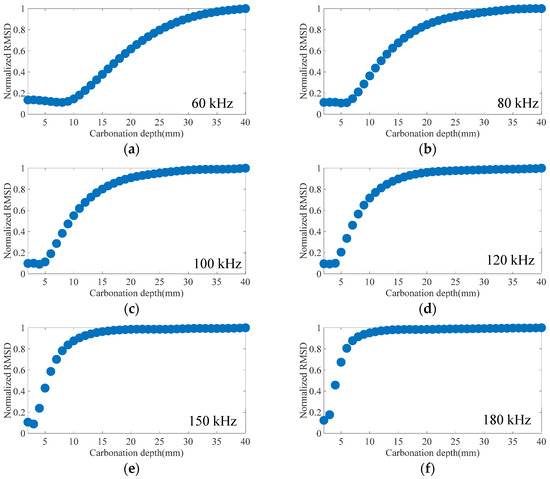
Figure 8.
The changing trends of RMSD values of simulated Rayleigh waves with the increase in carbonation depth: (a) 60 kHz; (b) 80 kHz; (c) 100 kHz; (d) 120 kHz; (e) 150 kHz; (f) 180 kHz.
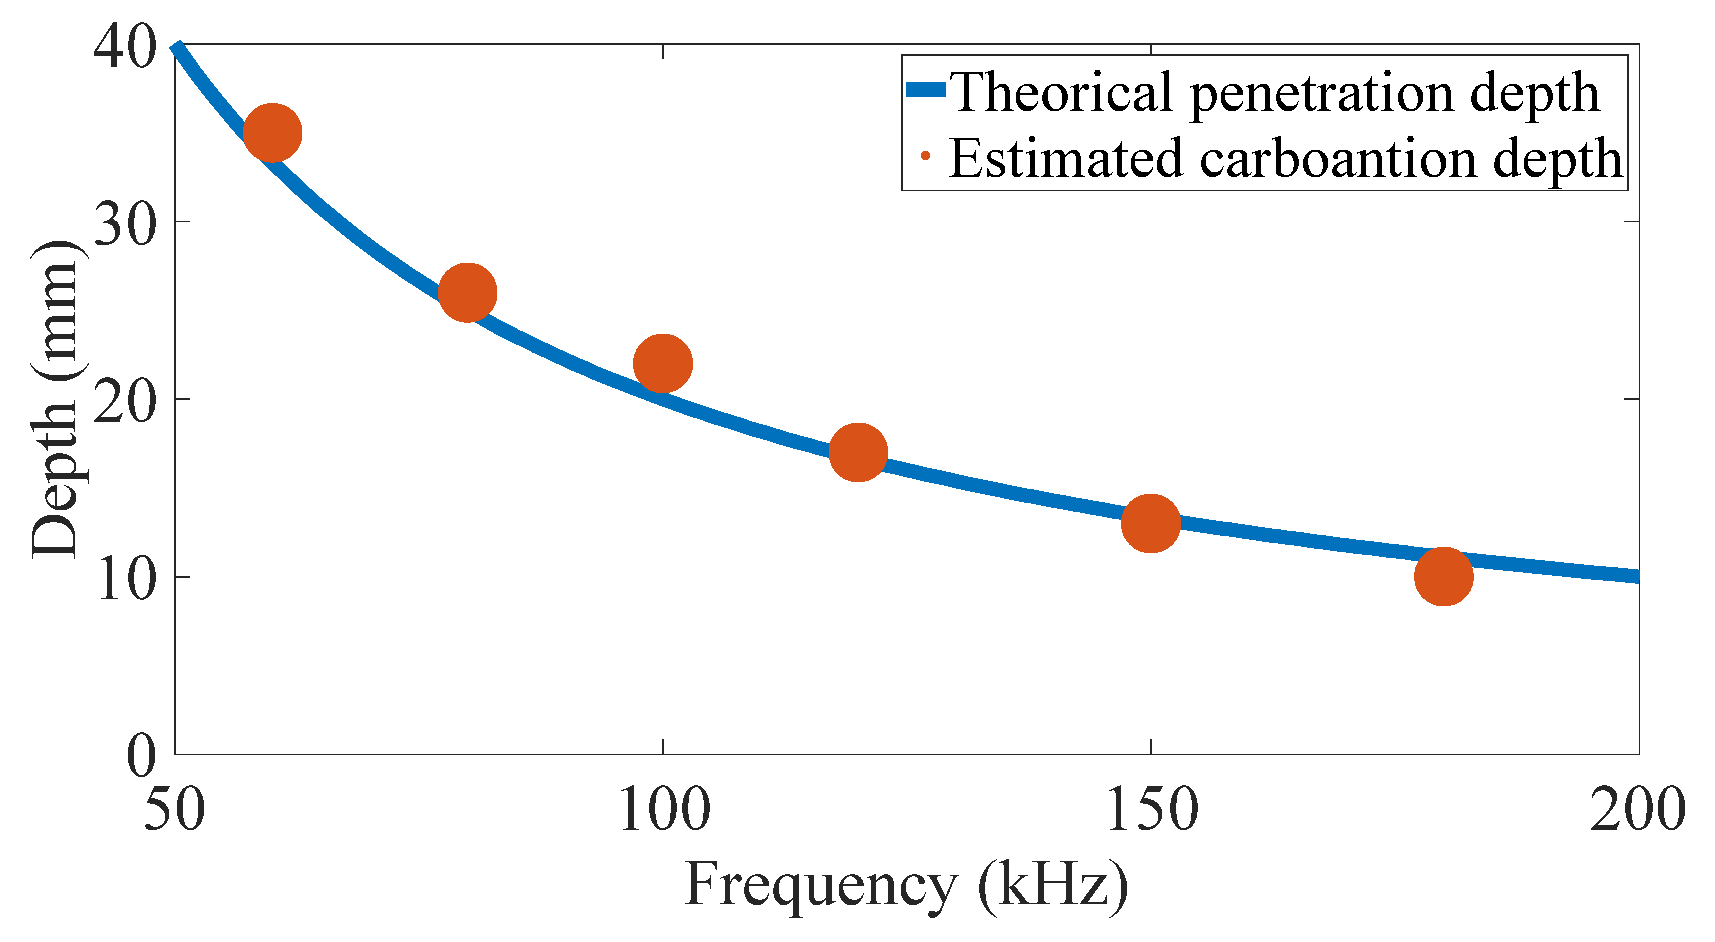
The estimated carbonation depths and the theoretical penetration depth of the Rayleigh waves in selected frequencies are shown in Table 2. The comparisons are shown in Figure 9, the estimated carbonation depth in the transiting points meet well with the theoretical penetration depth. The simulation results reveal that carbonation depth could be accurately evaluated by using the frequency-dependent penetration depth of Rayleigh waves.
Table 2.
Estimated carbonation depth and theoretical penetration depth of the Rayleigh waves.
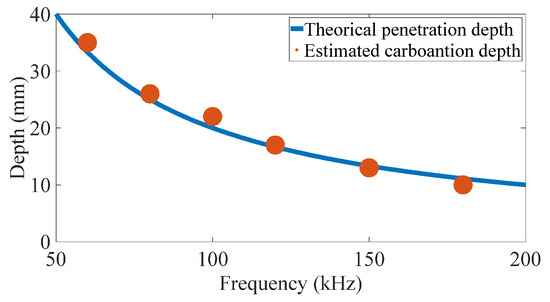
Figure 9.
The comparison between theoretical penetration depth and the estimated carbonation depth in simulation using the six Rayleigh waves with different excitation frequencies.
Specifically, the low-frequency Rayleigh waves (e.g., 60 kHz) show no significant changes until the carbonation depth reaches 10 mm, while the high-frequency Rayleigh waves (e.g., 180 kHz) exhibit notable changes even when the carbonation depth is only 3 mm. This phenomenon indicates that the low-frequency Rayleigh waves provide extended sensing depth, while the sensitivities to near-surface material changes are limited. In contrast, high-frequency Rayleigh waves exhibit high sensitivity to shallow defects, but the penetration depths are restricted.
4. Experimental Verifications
The numerical results show the wave propagation behaviors and perceiving capacities of different-frequency Rayleigh waves. Experiments are conducted on concrete specimens subjected to accelerated concrete carbonation testing to verify the numerical findings.
4.1. Concrete Specimens
Two concrete prism specimens with dimensions of 100 × 100 × 300 mm are cast according to GB/T 50082-2009 [50]. The water/cement ratio is 0.6 to speed up the carbonation process, and the mixture properties are shown in Table 3. The specimens are cured for 28 days and dried in drying chamber (60 °C) for 2 days. Five surfaces of the prisms are sealed with epoxy resin to achieve one-dimensional CO2 diffusion. One specimen is installed with two ultrasonic transducers [51] on the exposed surface to CO2 to acquire ultrasonic signals, and another concrete specimen is utilized to characterize the carbonation. The specimens are allocated in the carbonation chamber (20% CO2 and 70% humidity) [50].
Table 3.
Concrete mixture proportion (kg/m3).
4.2. Ultrasonic System
As illustrated in Figure 10a, the ultrasonic testing system consists of the ultrasonic data acquisition (DAQ) system (SC-HY-PZT-2.0, Sanchuan Inc., Suzhou, Jiangsu, China), piezoelectric actuator and sensor and a laptop. The experiment employs a high-performance piezoelectric ultrasonic sensor [51], which uses a mixture of epoxy resin and cement as the protective layer for the piezoelectric element. The sensor is attached on the surface of the concrete specimen with epoxy resin, and the detailed placement of the transducer is shown in Figure 10b. In addition, a free transducer that is not bonded to the concrete specimen is placed inside the carbonation chamber to acquire the impedance spectra [52] during the accelerated carbonation test. This arrangement is used to assess the durability and stability of the piezoelectric transducer under carbonation environment.
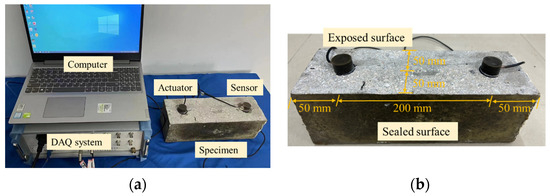
Figure 10.
Ultrasonic-based concrete carbonation monitoring system: (a) ultrasonic system; (b) transducer arrangement.
The experiment utilizes a five-cycle Hanning window modulated sinusoidal signal with center frequencies of 60 kHz and 180 kHz as the excitation signal to reflect the performances of low-frequency and high-frequency Rayleigh waves on concrete carbonation monitoring. The ultrasonic system generates a 10 V excitation signal, which is directly transmitted to the driver to generate ultrasonic waves. The sensor receives the ultrasonic signal with a sampling frequency of 2 MHz. Ultrasonic tests are conducted on the specimen every two days. Due to the low attenuation properties of Rayleigh waves and the high sensitivity of the sensor [51], the experiment does not require a power amplifier or preamplifier to obtain signals with high signal-to-noise ratio, enhancing the potential of this technology in practical engineering.
4.3. Concrete Carbonation Characterization Methods
The actual carbonation degree is necessary to validate the accuracy of the results measured by Rayleigh waves. This study employs the phenolphthalein test method and thermogravimetric (TGA) analysis to characterize the carbonation status of concrete.
4.3.1. TGA Method
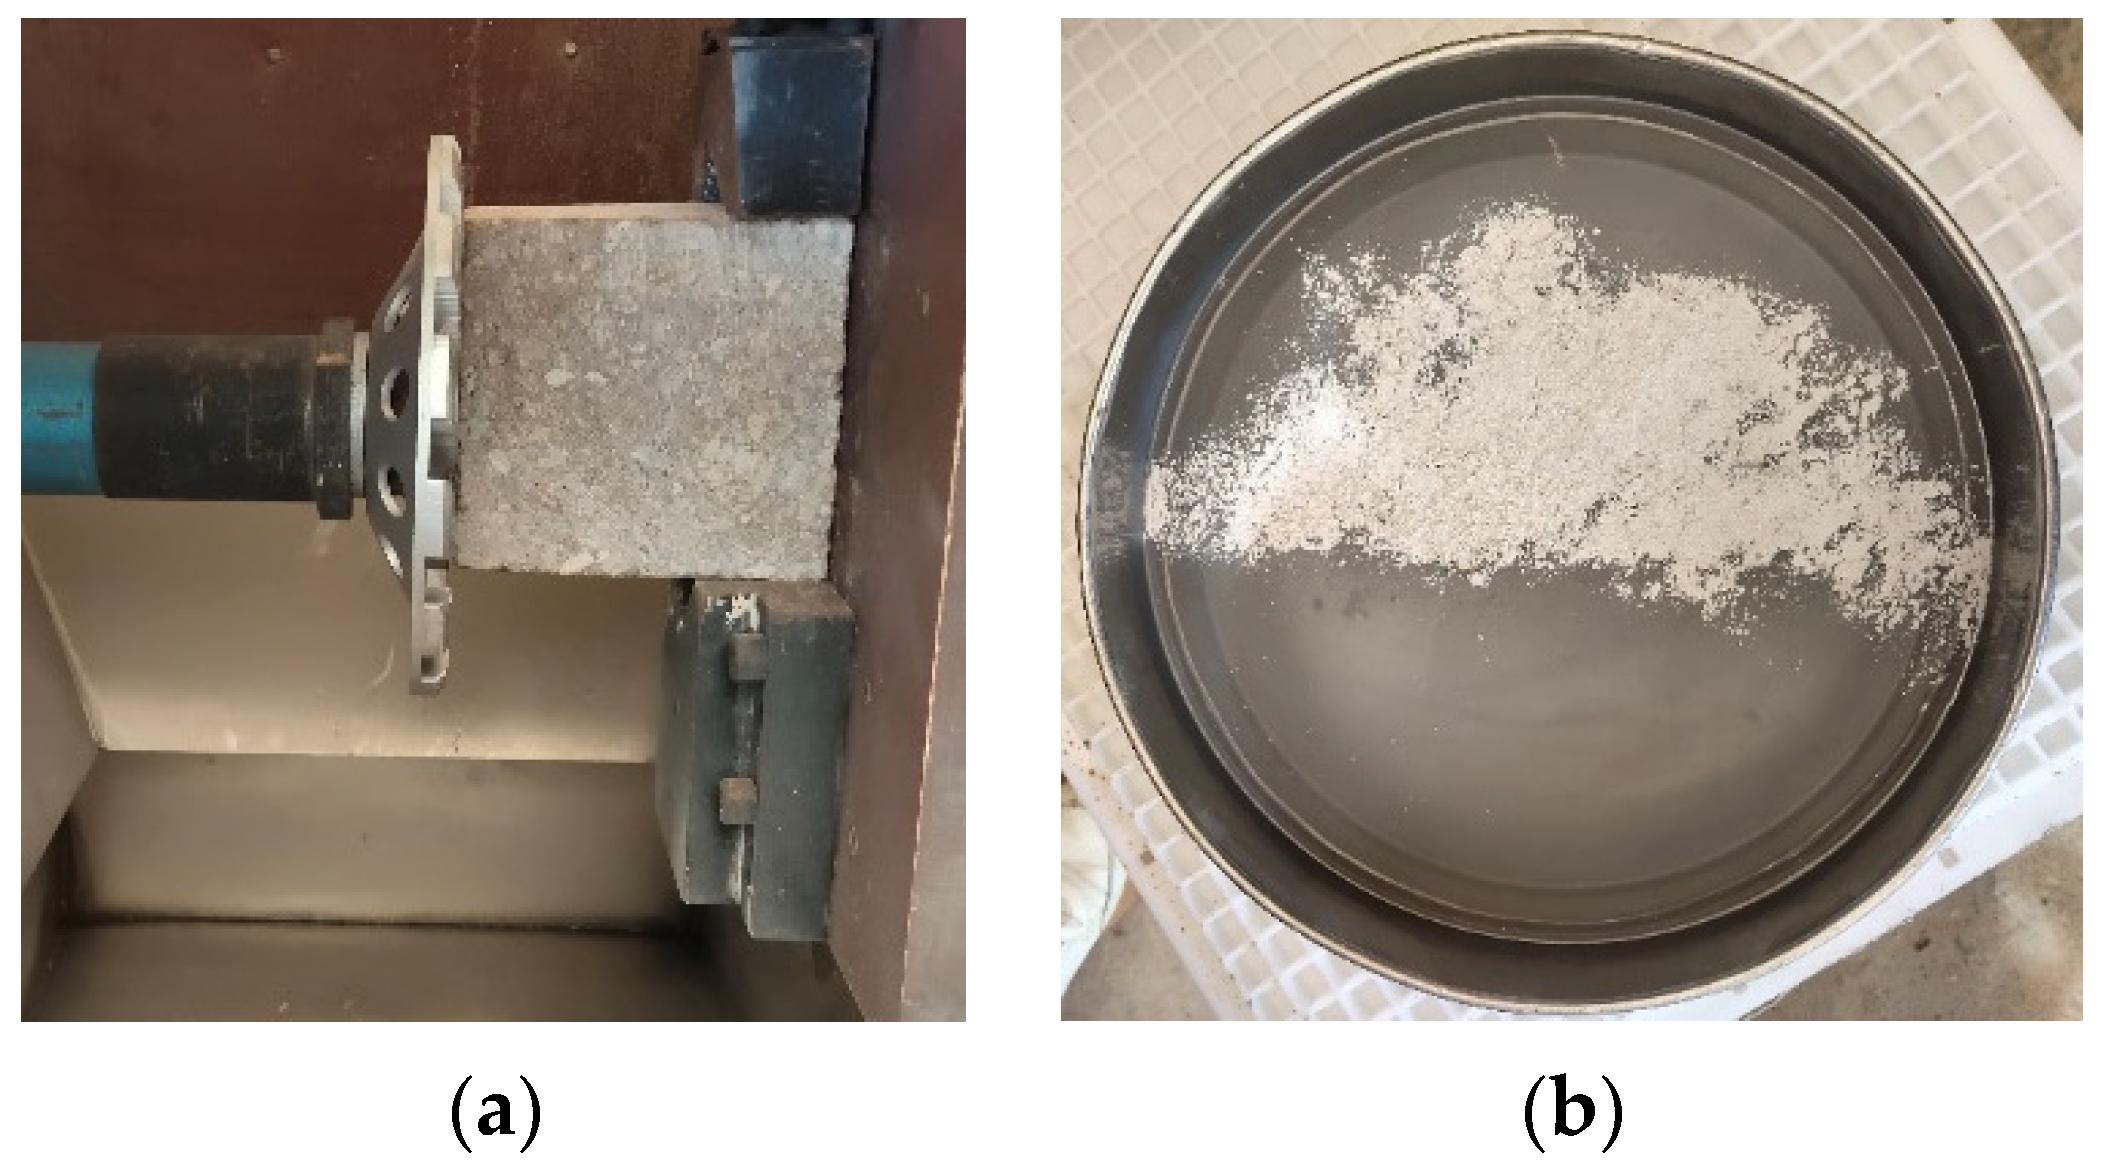
Each component in concrete has a specific decomposition temperature and resultant products in the heating process. At temperatures around 450 °C, the mass loss is primarily caused by the dehydration of Ca(OH)2. The CaCO3 generated by concrete carbonation has a finer granularity and possesses a decomposition temperature ranging from 600 to 750 °C. The mass loss during the heating process of concrete can be used to deduce the composition of the concrete [12]. In this study, the specimen is ground along the depth direction by a concrete grinder, as shown in Figure 11a. The powdered samples obtained from each concrete layer are then sieved through a 45 μm square mesh to filter out the sand particles produced from coarse aggregates, as illustrated in Figure 11b. The samples from the location of 2 mm, 5 mm, 10 mm, 15 mm and 20 mm are analyzed to obtain the carbonation depth. In this research, the carbonation depth measured by the TGA method serves as the benchmark for evaluating the accuracy of the proposed MFWA method and the traditional phenolphthalein testing method. The error is defined as follows:
where e represents the error, Dest denotes the estimated depth obtained from the proposed MFWA method and the phenolphthalein testing method, and DTGA is the depth measured by the TGA method.

Figure 11.
Sampling procedures of TGA: (a) grinding process (b) screening process.
4.3.2. Phenolphthalein Test Method
The phenolphthalein test method is the most widely applied technique for measuring the concrete carbonation depth. The principle of the phenolphthalein indicator is easy to understand, while it is hard to characterize the semi-carbonation zone and underestimate the carbonation depth. In this study, the concrete specimen designated for carbonation characterization is cut for phenolphthalein testing when the high-frequency Rayleigh waves begin to stabilize. The 1% (by mass) phenolphthalein alcohol solution is sprayed onto the fresh cross-section of the specimen block. After approximately 30 s, the carbonation depth is quantified at various locations in the cross-section with measurements taken at intervals of 10 mm [50]. The average value of the measured depths is calculated as the carbonation depth.
5. Experimental Results and Discussions
5.1. TGA Results
The concrete specimen after 14-day accelerated carbonation is analyzed using TGA method to verify the carbonation depth estimated by Rayleigh wave method. The TG-DTG curves are presented in Figure 12a. The thermal dehydration temperature of Ca(OH)2 falls within the 400–440 °C range, and the dehydration peak of Ca(OH)2 increases with the depth of the sample. The thermal dehydration temperature of Ca(CO)3 is 600–750 °C, and the dehydration peak of CaCO3 significantly diminishes as the sample depth increases. The changing trends of Ca(OH)2 and Ca(CO)3 indicate a rapid decrease in carbonation degree along the sample depth. The content of Ca(CO)3 and Ca(OH)2 is calculated based on the area enclosed by the dehydration peaks in the TG-DTG curves, and the mass percentages of CaCO3 and Ca(OH)2 are shown in Figure 12b. It can be seen that the content of Ca(OH)2 significantly increases and the content of CaCO3 decreases before 10 mm. When the depth exceeds 10 mm, the contents of CaCO3 and Ca(OH)2 gradually stabilize. This suggests that the actual carbonation depth of the concrete specimen after 14 days of accelerated carbonation is about 10 mm.
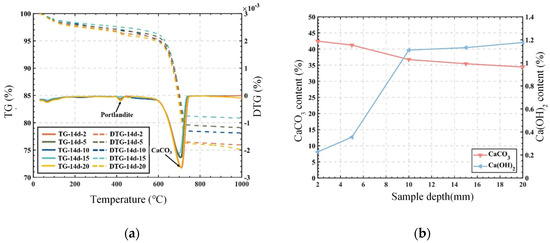
Figure 12.
TGA results of the specimen after 14-day accelerated carbonation: (a) TG-DTG curves of samples with different depth; (b) content of Ca(CO)3 and Ca(OH)2.
5.2. Phenolphthalein Test Results
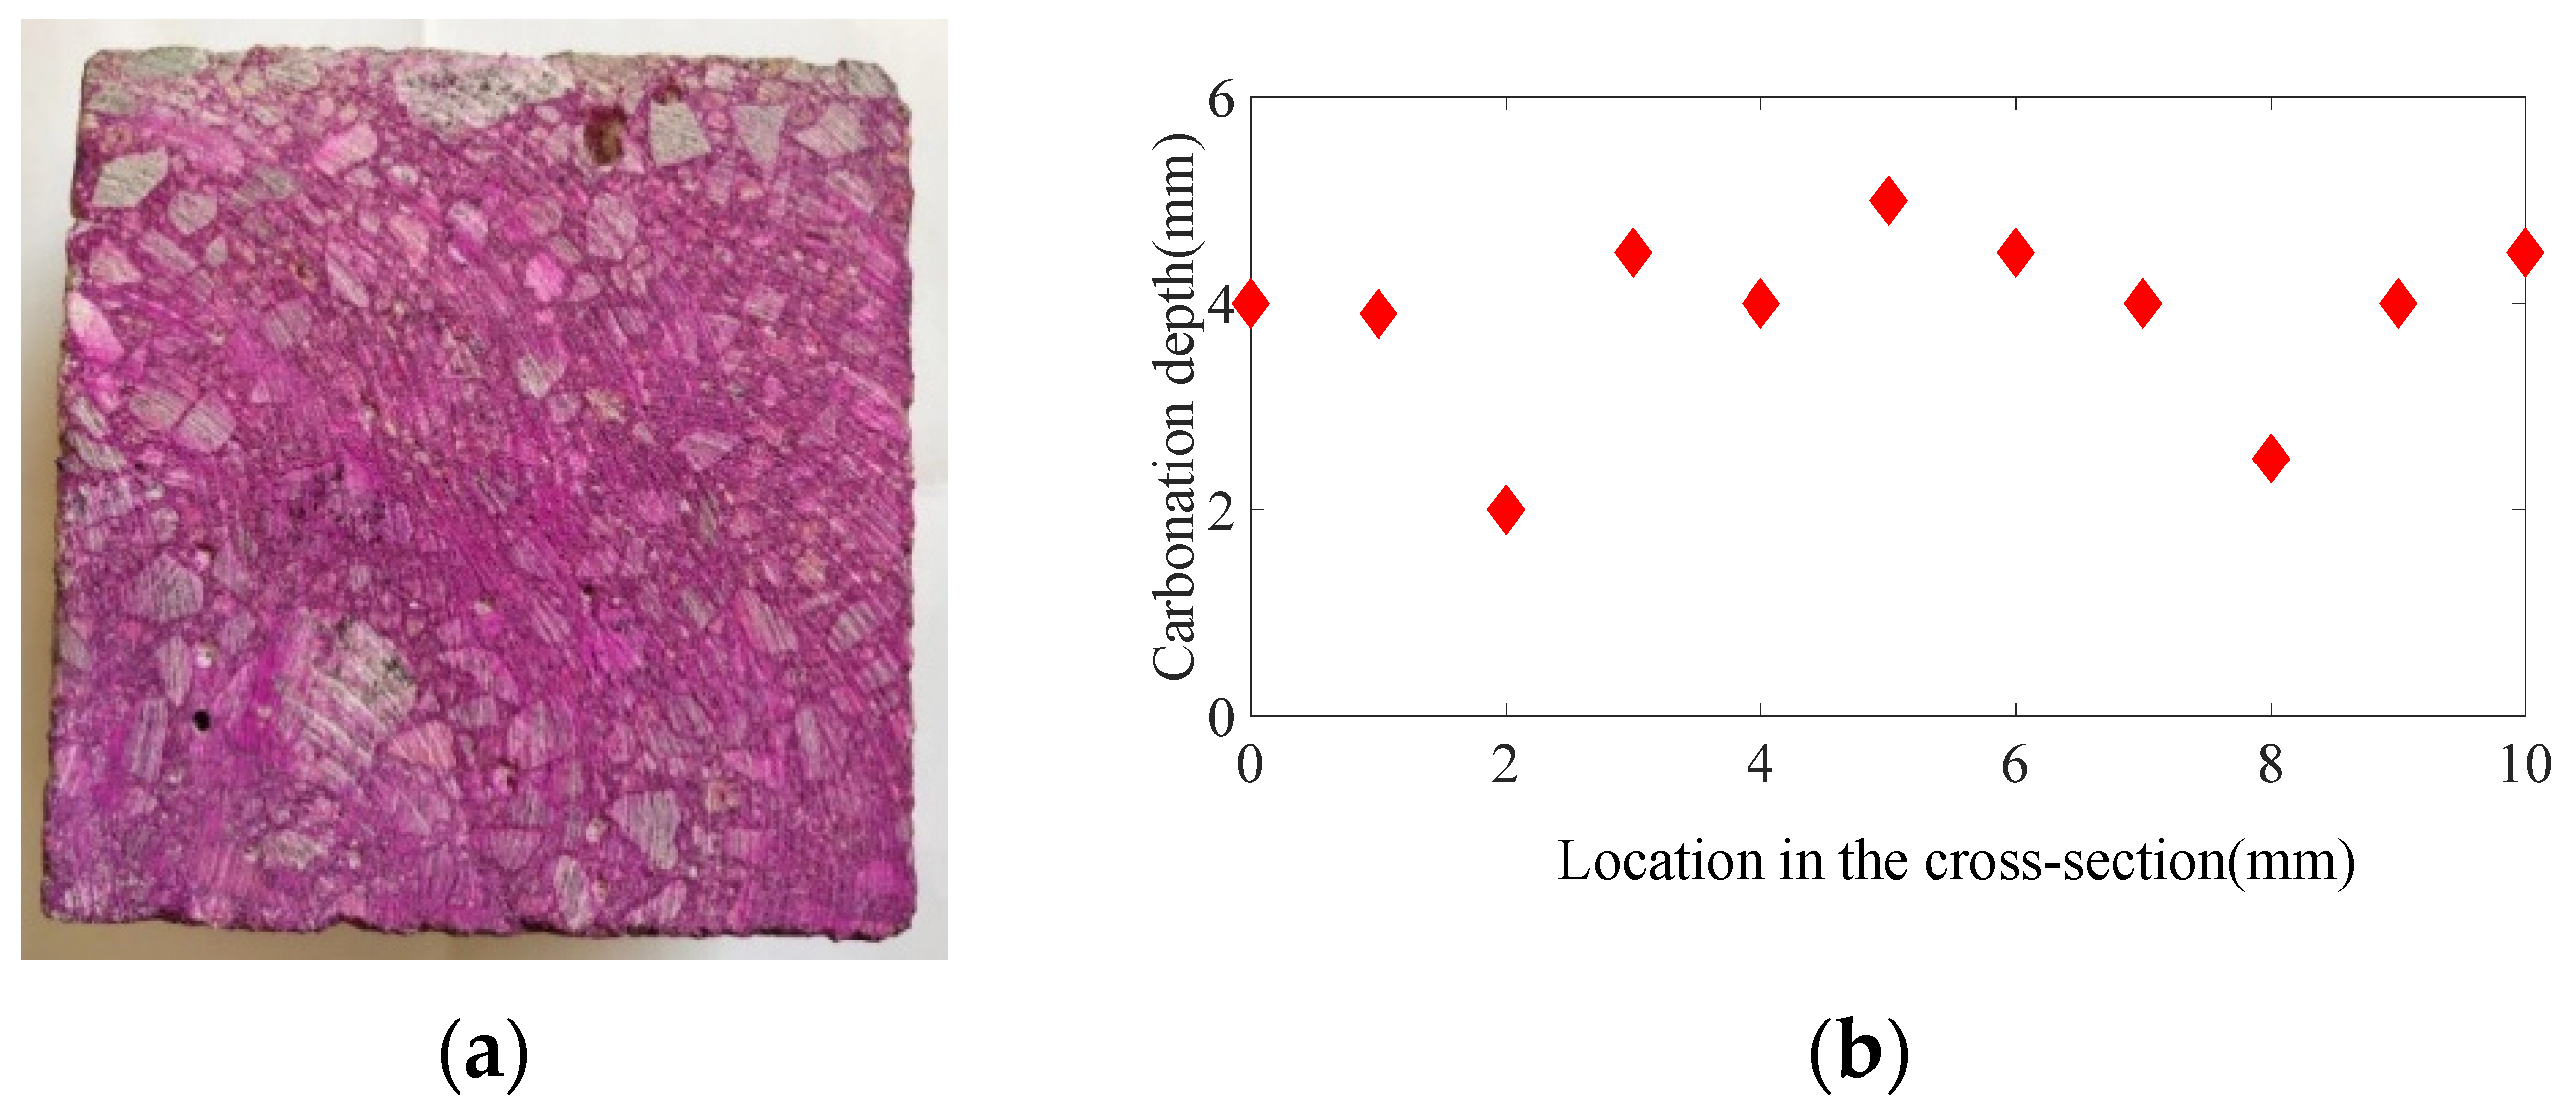
After 14 days of accelerated carbonation, the concrete specimen is cut and sprayed with 1% phenolphthalein indicator, and the results are depicted in Figure 13. The eleven points are drawn in the cross-section at 10 mm intervals to measure the carbonation depth, and the detailed operations follow the GB/T 50082-2009 [50]. The depth of the area that remained uncolored by phenolphthalein was approximately 4.2 mm, which is much smaller than the actual carbonation depth determined through TGA method. The estimated carbonation error is about 60%. This phenomenon is consistent with the conclusions of existing studies [9,10,11], which concluded that phenolphthalein is unable to detect the semi-carbonated zone and often underestimate the carbonation depth.

Figure 13.
Phenolphthalein testing results: (a) the cross-section spraying with phenolphthalein indicator; (b) carbonation depth in different locations on the cross-section measured by phenolphthalein indicator.
5.3. Ultrasonic Transducer Durability and Rayleigh Wave Testing Results
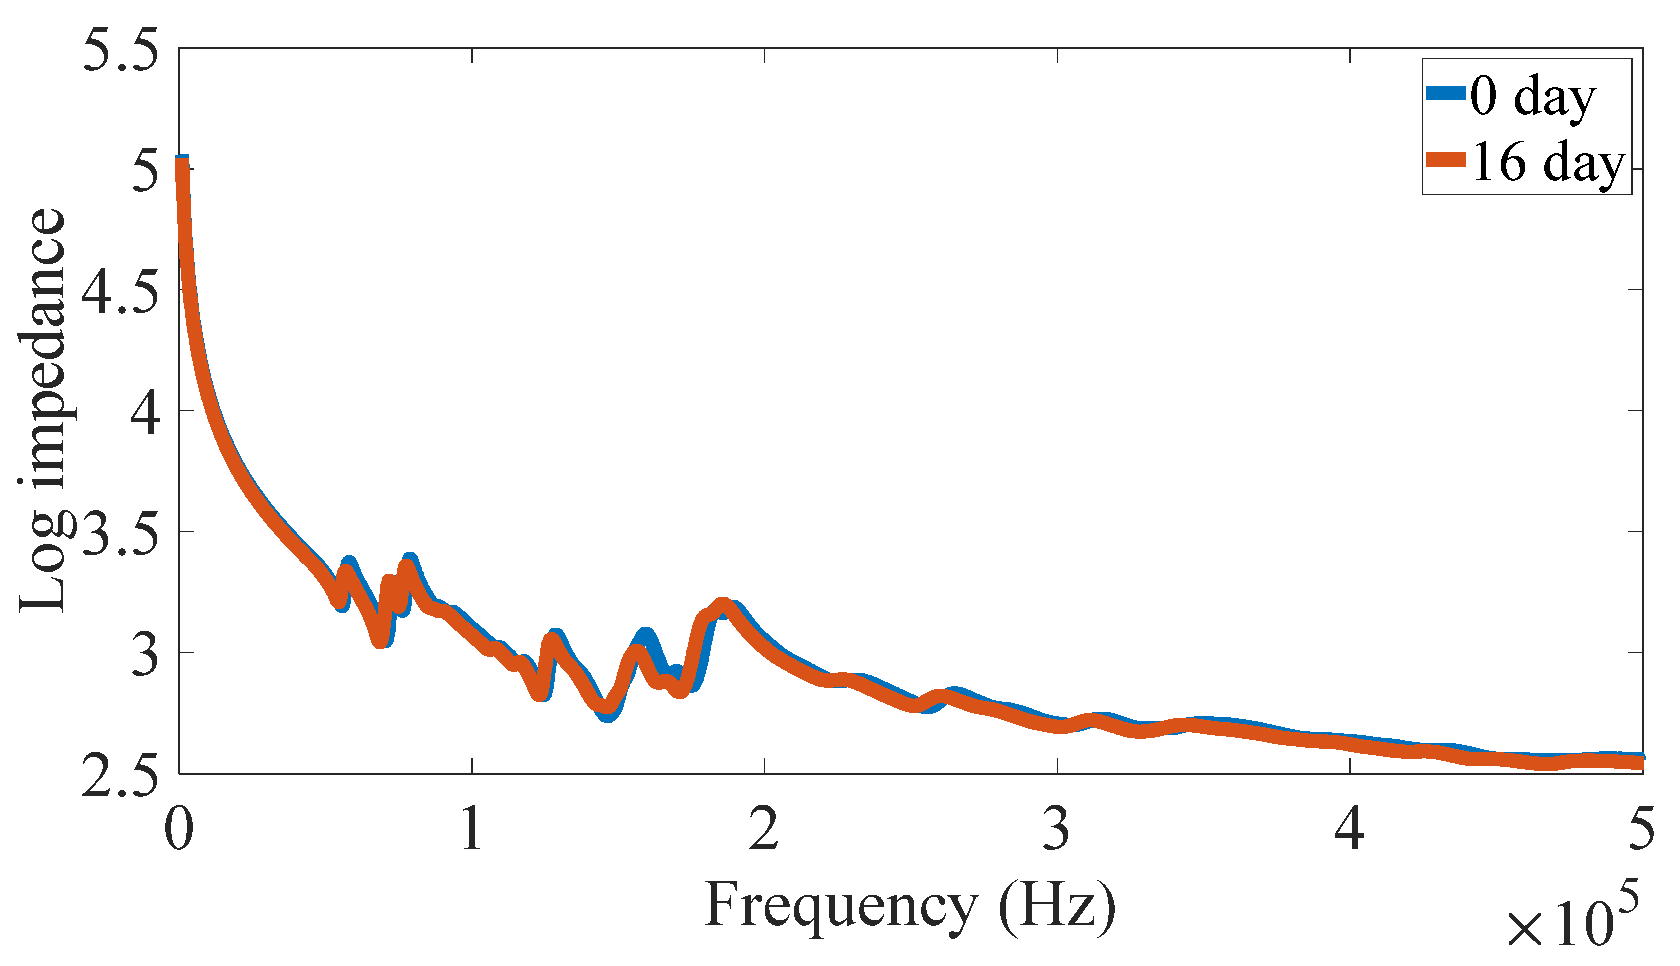
The prerequisite of evaluating the carbonation depth using Rayleigh waves is the durability and stability of the ultrasonic transducer. The protecting layer made of a mixture of epoxy resin and cement has been employed to adapt the environment, the verification of the transducer durability is still necessary to ensure the reliability of the obtained ultrasonic signals. The impedance of a free transducer, reflecting its dynamic characteristics [52], is measured in the initial and end of the test, and the results are shown in Figure 14. It can be seen that the impedance spectrums of the transducer are almost identical after the accelerated carbonation test, which validates the durability of the piezoelectric transducer in carbonation environment and guarantee the variations of the received ultrasonic signals are mainly induced by the concrete carbonation.
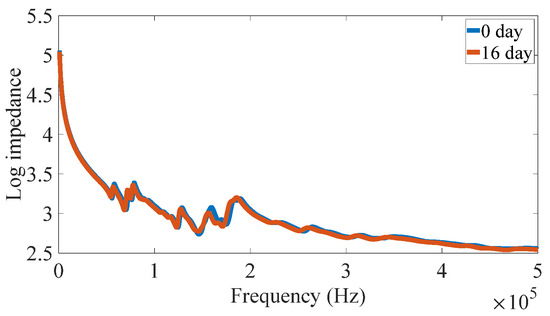
Figure 14.
Impedance spectrums of a free transducer in the carbonation chamber before and after the accelerated carbonation test.
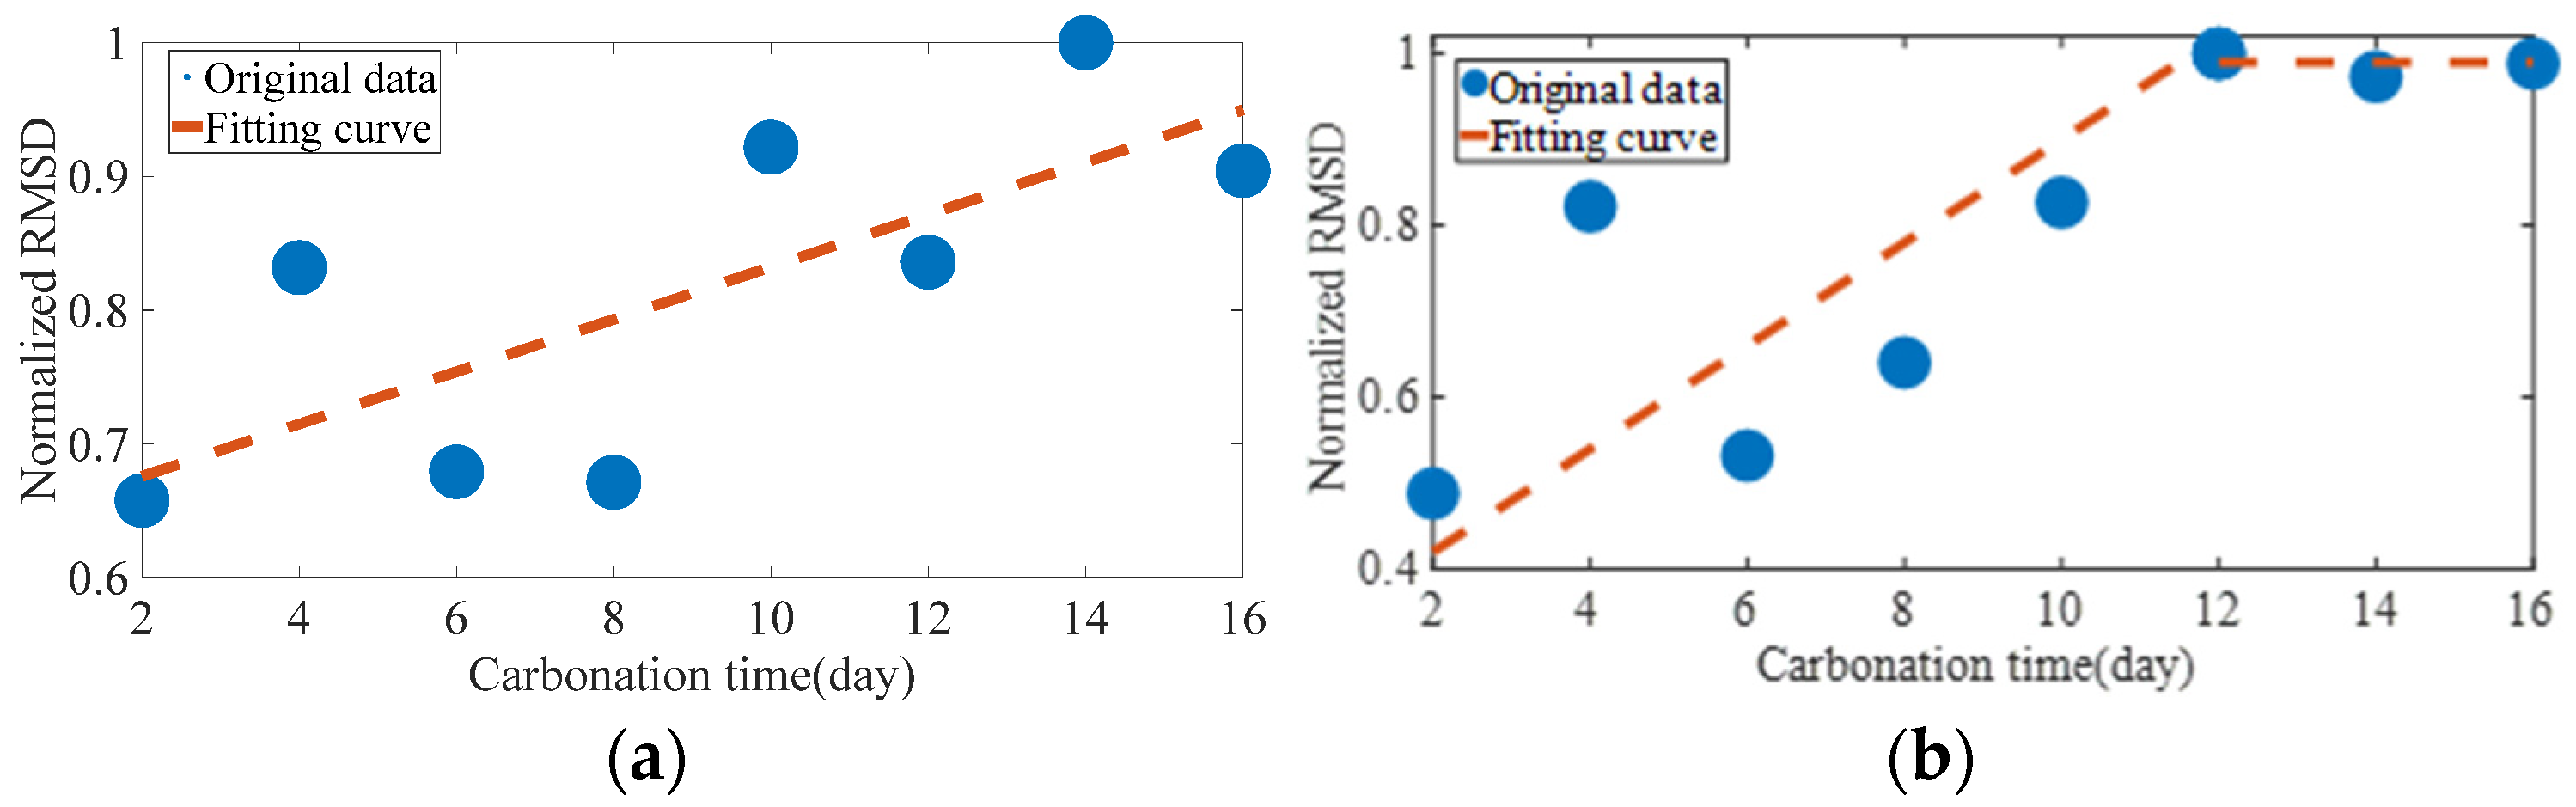
Figure 15 illustrates the changing trend of RMSD values for 60 kHz and 180 kHz Rayleigh waves in the accelerated carbonation test. As shown in Figure 15a, the RMSD values of 60 kHz Rayleigh waves exhibit a general increasing trend with the progression of carbonation because the carbonation depth has not exceeded the effective penetration depth of 60 kHz Rayleigh waves. The fluctuation is mainly induced by the low sensitivity low-frequency Rayleigh wave to the initial stage of carbonation. As shown in Figure 15b, the RMSD values of 180 kHz increase in the initial carbonation stage and become stable after the 12-day accelerated carbonation. The unchanged RMSD values of 180 kHz Rayleigh waves after a 12-day accelerated carbonation suggest that the carbonation has reached the penetration depth, which is about 11 mm at this time. The error of the estimated carbonation depth from the MFWA method is about 10%, which is much lower than the traditional phenolphthalein testing method.
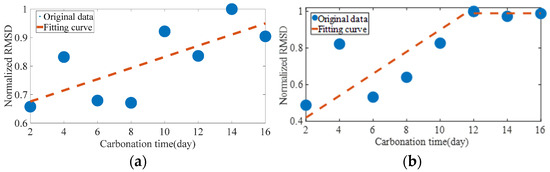
Figure 15.
The trend of RMSD values of Rayleigh waves with the accelerated carbonation time: (a) 60 kHz and (b) 180 kHz.
5.4. Results Discussion
The carbonation depths measured from MFRWA, TGA and the phenolphthalein indicator are shown in Figure 16. TGA provides the accurate carbonation depth, and the TGA results are used as the benchmark for evaluating the precision of the proposed MFWA method and the phenolphthalein test method. It can be seen that the carbonation depth measured from the proposed MFRWA method is close to the benchmark, while the results from the phenolphthalein indicator exhibit large difference with the benchmark. The comparison demonstrates that the proposed MFRWA method could provide more accurate carbonation depth evaluation than the traditional phenolphthalein indicator in a non-destructive manner. The TGA method is believed to be a very precise method to determine the carbonation depth; however, this method is very time-consuming and expensive, which limits its wide application in practical engineering. The widely used phenolphthalein indicator not only destroys the structures, but also underestimates the carbonation depth.
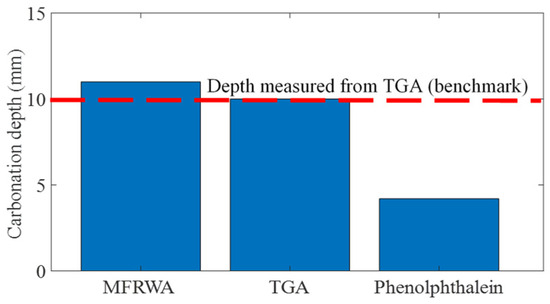
Figure 16.
The comparison of carbonation depth measured from MFRWA, TGA and phenolphthalein indicator.
The proposed carbonation depth estimation method utilizes the informative developing trends of the different-frequency Rayleigh waves to achieve the accurate estimation of the carbonation depth in a non-destructive manner. The baseline signal received from intact conditions is necessary to obtain the full developing curve of Rayleigh waves during concrete carbonation process. In scenarios where the baseline signal is unavailable, the diagnosis could also be conducted by comparing the Rayleigh waves in two interval measurements. Carbonation depth may exceed the penetration depth of Rayleigh waves if the waveforms are similar. It may be shallower than the penetration depth of the Rayleigh wave if the signals exhibit notable changes.
The effective penetration depth of Rayleigh waves is assumed to be one wavelength. However, as illustrated in Figure 1, the primary vibration of Rayleigh waves is concentrated within one wavelength depth, vibrations are still present within a range of 1 to 1.8 times the wavelength. The assumption regarding the effective penetration depth of Rayleigh waves entails certain inaccuracies, thereby introducing errors in the assessment of carbonation depth. Moreover, the wave speed of Rayleigh waves varies with different concrete mixtures. Due to the heterogeneous nature of concrete, Rayleigh waves exhibit dispersion characteristics that could also lead to errors. These errors and their impact on the methodology will be the subject of future research.
Various factors including the water/cement ratio, temperature, and external load would have influences on the proposed MFRWA method for concrete carbonation evaluation, a sensitivity analysis of those factors will be conducted to facilitate the potential applications of this method.
6. Conclusions
This study introduces a novel concrete carbonation depth estimation method based on multi-frequency Rayleigh waves. The feasibility and effectiveness of this method are validated through numerical simulation and experiments, leading to the following conclusions:
(1) The numerical results indicate that the effective penetration depths of Rayleigh waves are approximately equivalent to one wavelength. Low-frequency Rayleigh waves provide extended sensing depth, while the sensitivities to near-surface material changes are limited. In contrast, high-frequency Rayleigh waves exhibit high sensitivity to shallow defects, but the penetration depths are restricted.
(2) Rayleigh waves will transition from a variable to a stable state as the carbonation extends from the surface into the concrete. The carbonation depth can be evaluated by identifying the transition point.
(3) The carbonation depth measured by MFWA method closely aligns with that from the TGA approach, exhibiting an error margin of approximately 10%. In contrast, the phenolphthalein indicator method displays a significantly higher error rate of about 60%. The proposed MFWA method could achieve more accurate concrete carbonation depth estimation than phenolphthalein indicator, and in a non-destructive manner. This method has great potential in carbonation depth estimation in field applications.
Author Contributions
Conceptualization, X.S. and L.C.; methodology, X.S., X.L. and Y.C.; software, X.S. and S.Y.; writing—original draft preparation, X.S. and J.C.; writing—review and editing, L.C. and J.C.; supervision, L.C.; funding acquisition, L.C. All authors have read and agreed to the published version of the manuscript.
Funding
This research is supported by the National Natural Science Foundation of China (Grant number 52308327). The authors greatly appreciate financial support.
Data Availability Statement
The data presented in this study are available on request from the corresponding author.
Conflicts of Interest
The authors declare that they have no known competing financial interests or personal relationships that could have appeared to influence the work reported in this paper.
References
- Manjunatha, M.; Seth, D.; Balaji, K.; Roy, S.; Tangadagi, R.B. Utilization of Industrial-Based PVC Waste Powder in Self-Compacting Concrete: A Sustainable Building Material. J. Clean. Prod. 2023, 428, 139428. [Google Scholar] [CrossRef]
- Seifu, M.N.; Kim, G.M.; Park, S.; Son, H.M.; Park, S. Thermodynamic Modeling of Sulfate Attack on Carbonated Portland Cement Blended with Blast Furnace Slag. Dev. Built Environ. 2023, 15, 100205. [Google Scholar] [CrossRef]
- Fuhaid, A.F.A.; Niaz, A. Carbonation and Corrosion Problems in Reinforced Concrete Structures. Buildings 2022, 12, 586. [Google Scholar] [CrossRef]
- Elsener, B. Corrosion of Steel in Concrete. In Materials Science and Technology: A Comprehensive Treatment; Cahn, R.W., Haasen, P., Kramer, E.J., Eds.; Wiley-VCH Verlag GmbH: Weinheim, Germany, 2000; pp. 389–436. ISBN 978-3-527-61930-6. [Google Scholar]
- Achenbach, R.; Raupach, M. Passivation of Steel Reinforcement in Low Carbon Concrete. Buildings 2024, 14, 895. [Google Scholar] [CrossRef]
- Ervin, B.L.; Reis, H. Longitudinal Guided Waves for Monitoring Corrosion in Reinforced Mortar. Meas. Sci. Technol. 2008, 19, 055702. [Google Scholar] [CrossRef]
- Yoon, I.-S.; Çopuroğlu, O.; Park, K.-B. Effect of Global Climatic Change on Carbonation Progress of Concrete. Atmos. Environ. 2007, 41, 7274–7285. [Google Scholar] [CrossRef]
- Jeong, H.; Jung, B.J.; Kim, J.H.; Seo, S.-Y.; Yun, H.D.; Kim, K.S. pH Sensor Using Aniline Blue and Functionalized Nylon for Monitoring the Final Stage of Concrete Carbonation. Smart Mater. Struct. 2023, 32, 095013. [Google Scholar] [CrossRef]
- Qiu, Q. A State-of-the-Art Review on the Carbonation Process in Cementitious Materials: Fundamentals and Characterization Techniques. Constr. Build. Mater. 2020, 247, 118503. [Google Scholar] [CrossRef]
- Chang, C.F.; Chen, J.W. Strength and Elastic Modulus of Carbonated Concrete. ACI Mater. J. 2005, 102, 315–321. [Google Scholar] [CrossRef]
- Thiery, M.; Villain, G.; Dangla, P.; Platret, G. Investigation of the Carbonation Front Shape on Cementitious Materials: Effects of the Chemical Kinetics. Cem. Concr. Res. 2007, 37, 1047–1058. [Google Scholar] [CrossRef]
- Chang, C.-F.; Chen, J.-W. The Experimental Investigation of Concrete Carbonation Depth. Cem. Concr. Res. 2006, 36, 1760–1767. [Google Scholar] [CrossRef]
- Lo, Y.; Lee, H.M. Curing e Ects on Carbonation of Concrete Using a Phenolphthalein Indicator and Fourier-Transform Infrared Spectroscopy. Build. Environ. 2002, 37, 507–514. [Google Scholar] [CrossRef]
- Hong, S.; Jiang, R.; Zheng, F.; Fan, S.; Dong, B. Quantitative Characterization of Carbonation of Cement-Based Materials Using X-ray Imaging. Cem. Concr. Compos. 2022, 134, 104794. [Google Scholar] [CrossRef]
- Saillio, M.; Baroghel-Bouny, V.; Pradelle, S.; Bertin, M.; Vincent, J.; d’Espinose De Lacaillerie, J.-B. Effect of Supplementary Cementitious Materials on Carbonation of Cement Pastes. Cem. Concr. Res. 2021, 142, 106358. [Google Scholar] [CrossRef]
- Figueiredo, E.; Brownjohn, J. Three Decades of Statistical Pattern Recognition Paradigm for SHM of Bridges. Struct. Health Monit. 2022, 21, 3018–3054. [Google Scholar] [CrossRef]
- Li, D.; Liang, Z.-L.; Ren, W.-X.; Yang, D.; Wang, S.-D.; Xiang, S.-L. Structural Damage Identification under Nonstationary Excitations through Recurrence Plot and Multi-Label Convolutional Neural Network. Measurement 2021, 186, 110101. [Google Scholar] [CrossRef]
- Humar, J.; Bagchi, A.; Xu, H. Performance of Vibration-Based Techniques for the Identification of Structural Damage. Struct. Health Monit. 2006, 5, 215–241. [Google Scholar] [CrossRef]
- Li, D.; Nie, J.-H.; Ren, W.-X.; Ng, W.-H.; Wang, G.-H.; Wang, Y. A Novel Acoustic Emission Source Location Method for Crack Monitoring of Orthotropic Steel Plates. Eng. Struct. 2022, 253, 113717. [Google Scholar] [CrossRef]
- Li, D.; Nie, J.-H.; Wang, H.; Ren, W.-X. Loading Condition Monitoring of High-Strength Bolt Connections Based on Physics-Guided Deep Learning of Acoustic Emission Data. Mech. Syst. Signal Process. 2024, 206, 110908. [Google Scholar] [CrossRef]
- Li, D.; Nie, J.-H.; Wang, H.; Yan, J.-B.; Hu, C.-X.; Shen, P. Damage Location, Quantification and Characterization of Steel-Concrete Composite Beams Using Acoustic Emission. Eng. Struct. 2023, 283, 115866. [Google Scholar] [CrossRef]
- Li, X.-X.; Li, D.; Ren, W.-X.; Zhang, J.-S. Loosening Identification of Multi-Bolt Connections Based on Wavelet Transform and ResNet-50 Convolutional Neural Network. Sensors 2022, 22, 6825. [Google Scholar] [CrossRef]
- Chen, L.; Xiong, H.; Li, X.; Lu, Y.; Kong, Q. An Ensemble Learning Approach to Condition Assessment of Dissipative CLT Connections Based on Piezoceramic Sensor Data. Eng. Appl. Artif. Intell. 2023, 117, 105514. [Google Scholar] [CrossRef]
- Zhang, T.; Zhang, L.; Ozevin, D.; Attard, T. Multi-Scale Ultrasonic Imaging of Sub-Surface Concrete Defects. Meas. Sci. Technol. 2023, 35, 035901. [Google Scholar] [CrossRef]
- Lai, Q.; Lu, L.; Xu, C.; Hu, N.; Deng, M. A Novel Pulse-Echo Piezoelectric Transducer for Detecting Quasi-Static Component Induced by an Ultrasonic Longitudinal Wave. Meas. Sci. Technol. 2023, 35, 035118. [Google Scholar] [CrossRef]
- Sun, X.-T.; Li, D.; He, W.-Y.; Wang, Z.-C.; Ren, W.-X. Grouting Quality Evaluation in Post-Tensioning Tendon Ducts Using Wavelet Packet Transform and Bayes Classifier. Sensors 2019, 19, 5372. [Google Scholar] [CrossRef]
- Sun, X.; Zhang, M.; Gao, W.; Guo, C.; Kong, Q. A Novel Method for Steel Bar All-Stage Pitting Corrosion Monitoring Using the Feature-Level Fusion of Ultrasonic Direct Waves and Coda Waves. Struct. Health Monit. 2023, 22, 714–729. [Google Scholar] [CrossRef]
- Li, X.; Liu, G.; Sun, Q.; Chen, H.; Chen, L.; Zhang, M.; Sun, X. Bolt Tightness Monitoring Using Multiple Reconstructed Narrowband Lamb Waves Combined with Piezoelectric Ultrasonic Transducer. Smart Mater. Struct. 2023, 32, 105017. [Google Scholar] [CrossRef]
- Sun, X.; Guo, C.; Yuan, L.; Kong, Q.; Ni, Y. Diffuse Ultrasonic Wave-Based Damage Detection of Railway Tracks Using PZT/FBG Hybrid Sensing System. Sensors 2022, 22, 2504. [Google Scholar] [CrossRef]
- Gao, W.; Kong, Q.; Lu, W.; Lu, X. High Spatial Resolution Imaging for Damage Detection in Concrete Based on Multiple Wavelet Decomposition. Constr. Build. Mater. 2022, 319, 126057. [Google Scholar] [CrossRef]
- Villarreal, A.; Cosmes-López, M.; León-Martínez, F.M.; Castellanos, F.; Solis-Najera, S.E.; Medina, L. Ultrasonic phase velocity of carbonated cement paste probes. Appl. Acoust. 2019, 154, 129–134. [Google Scholar] [CrossRef]
- Mendes, A.Z.; Medeiros-Junior, R.A.; Da Silva Munhoz, G. Effect of the Corrosion Degree and the Carbonation Depth on the Electrical Resistivity, Ultrasonic Pulse Velocity and Corrosion Potential. J. Build. Rehabil. 2019, 4, 15. [Google Scholar] [CrossRef]
- Bouchaala, F.; Payan, C.; Garnier, V.; Balayssac, J.P. Carbonation Assessment in Concrete by Nonlinear Ultrasound. Cem. Concr. Res. 2011, 41, 557–559. [Google Scholar] [CrossRef]
- Kim, G.; Kim, J.Y.; Kurtis, K.E.; Jacobs, L.J.; Le Pape, Y.; Guimaraes, M. Quantitative Evaluation of Carbonation in Concrete Using Nonlinear Ultrasound. Mater. Struct./Mater. Constr. 2016, 49, 399–409. [Google Scholar] [CrossRef]
- Cheng, W.; Sun, H.-H.; Wan, L.S.; Fan, Z.; Tan, K.H. Corrosion Damage Detection in Reinforced Concrete Using Rayleigh Wave-Based Method. Cem. Concr. Compos. 2023, 143, 105253. [Google Scholar] [CrossRef]
- Liu, X.; He, J.; Cheng, Q.; Yang, S.; Li, M. Surface Defect Identification Based on Broadband Laser-Generated Rayleigh Wave with Wavenumber Filtering. Meas. Sci. Technol. 2023, 34, 125205. [Google Scholar] [CrossRef]
- Lee, F.W.; Chai, H.K.; Lim, K.S.; Lau, S.H. Concrete Sub-Surface Crack Characterization by Means of Surface Rayleigh Wave Method. ACI Mater. J. 2019, 116, 113–123. [Google Scholar] [CrossRef]
- Aggelis, D.G.; Shiotani, T.; Polyzos, D. Characterization of Surface Crack Depth and Repair Evaluation Using Rayleigh Waves. Cem. Concr. Compos. 2009, 31, 77–83. [Google Scholar] [CrossRef]
- Hevin, G.; Abraham, O.; Pedersen, H.; Campillo, M. Characterization of Surface Cracks with Rayleigh Waves: A Numerical Model. NDT E Int. 1998, 31, 289–297. [Google Scholar] [CrossRef]
- Liu, H.; Wang, Z.; Zheng, B. Surface Crack Characterization Using Laser Nonlinear Ultrasonics Based on the Bispectrum. Meas. Sci. Technol. 2020, 32, 035204. [Google Scholar] [CrossRef]
- Achenbach, J. Wave Propagation in Elastic Solids; Elsevier: Amsterdam, The Netherlands, 2012. [Google Scholar]
- Bolt, B.A. Earthquakes, 5th ed.; W. H. Freeman: New York, NY, USA, 1993. [Google Scholar]
- Miller, G.F.; Pursey, H. On the Partition of Energy between Elastic Waves in a Semi-Infinite Solid. Proc. R. Soc. Lond. Ser. A Math. Phys. Sci. 1955, 233, 55–69. [Google Scholar]
- Strobbia, C. Surface Wave Methods: Acquisition, Processing and Inversion. 2003. Available online: https://www.scribd.com/document/499925178/10-1-1-129-9410 (accessed on 12 June 2024).
- Zerwer, A.; Polak, M.A.; Santamarina, J.C. Detection of Surface Breaking Cracks in Concrete Members Using Rayleigh Waves. J. Environ. Eng. Geophys. 2005, 10, 295–306. [Google Scholar] [CrossRef]
- Aggelis, D.; Shiotani, T. Repair Evaluation of Concrete Cracks Using Surface and Through-Transmission Wave Measurements. Cem. Concr. Compos. 2007, 29, 700–711. [Google Scholar] [CrossRef]
- Athanasopoulos, G.; Pelekis, P.; Anagnostopoulos, G. Effect of Soil Stiffness in the Attenuation of Rayleigh-Wave Motions from Field Measurements. Soil Dyn. Earthq. Eng. 2000, 19, 277–288. [Google Scholar] [CrossRef]
- Hussain, S.; Bhunia, D.; Singh, S.B. Comparative Study of Accelerated Carbonation of Plain Cement and Fly-Ash Concrete. J. Build. Eng. 2017, 10, 26–31. [Google Scholar] [CrossRef]
- Chang, J.J.; Yeih, W.; Huang, R.; Chi, J.M. Mechanical Properties of Carbonated Concrete. J. Chin. Inst. Eng. 2003, 26, 513–522. [Google Scholar] [CrossRef]
- GB/T 50082-2009; Standard for Test Methods of Long-Term Performance and Durability of Ordinary Concrete. China Academy of Building Research: Beijing, China, 2009.
- Li, X.; Chen, L.; Chen, H.; Kong, Q. HPSA: A High-Performance Smart Aggregate for Concrete Structural Health Monitoring Based on Acoustic Impedance Matching Method. Smart Mater. Struct. 2023, 32, 075007. [Google Scholar] [CrossRef]
- Lin, B.; Giurgiutiu, V.; Pollock, P.; Xu, B.; Doane, J. Durability and Survivability of Piezoelectric Wafer Active Sensors on Metallic Structure. AIAA J. 2010, 48, 635–643. [Google Scholar] [CrossRef]


Disclaimer/Publisher’s Note: The statements, opinions and data contained in all publications are solely those of the individual author(s) and contributor(s) and not of MDPI and/or the editor(s). MDPI and/or the editor(s) disclaim responsibility for any injury to people or property resulting from any ideas, methods, instructions or products referred to in the content. |
© 2024 by the authors. Licensee MDPI, Basel, Switzerland. This article is an open access article distributed under the terms and conditions of the Creative Commons Attribution (CC BY) license (https://creativecommons.org/licenses/by/4.0/).