Abstract
This paper presents a classification method for earthquake ground motion records utilizing the results of K-means cluster analysis. The moment magnitude and Joyner–Boore distance are utilized as the primary parameters for clustering the earthquake ground motion records. The classification boundaries are established through an examination of moment magnitude ranges, Joyner–Boore distance ranges, and spectral characteristics within each cluster. In this study, a comprehensive dataset comprising 7627 horizontal earthquake acceleration records was meticulously curated for analysis. The data were subjected to separate clustering and grouping procedures, allowing for insightful comparisons between the resultant clusters. Significant disparities in spectral characteristics across the classification groups were demonstrated. These differences become particularly pronounced when a moment magnitude threshold of 6 and a Joyner–Boore distance threshold of 140 km are employed to categorize the ground motion records. The approach underscores the substantial impact of classification based on earthquake ground motion spectral characteristics, while also mitigating the potential instabilities inherent in cluster analysis results. A refined and quantitatively robust framework for understanding and categorizing earthquake ground motions is provided, offering valuable insights for seismic data analysis and contributing to more accurate and reliable assessments of seismic activity.
1. Introduction
Earthquake ground motion records are indispensable tools for gaining insights into seismic events, playing a crucial role in the ongoing evolution of earthquake engineering practices [1,2,3]. The development of methodologies like the response spectrum method, structural dynamic response analysis, and shaking table testing owes much to the wealth of data derived from these records. As observation techniques have advanced and the number of observation stations has grown, there has been an exponential increase in the volume of earthquake ground motion data collected. This proliferation presents fresh challenges in terms of data processing and analysis, underscoring the need for innovative approaches to harnessing and interpreting this wealth of information effectively.
The proper classification of earthquake ground motion records is essential before commencing any statistical analysis. Extensive investigations into earthquake damage have underscored the significant influence of site conditions on the characteristics of earthquake ground motions [4,5,6,7]. Consequently, earthquake ground motion records are initially grouped based on site type, facilitating the establishment of distinct design response spectra [8,9,10,11,12]. Coban et al. identified the site classifications for the Bursa province using the proposed H/V spectral ratio method [13]. The spectral characteristics of earthquake ground motions are notably influenced by both the earthquake magnitude and the propagation distance of seismic waves. Trifunac and Brady investigated the correlations between peak acceleration, velocity, and displacement with earthquake magnitude, distance, and site conditions, revealing strong associations among these factors [14]. Similarly, Shoji et al. discovered that the duration, total power, and amplitude of earthquake ground motions are notably affected by the hypocentral distance and local site conditions [15]. Additionally, Ji et al. performed statistical analyses on 128 significant earthquake records, illustrating that both magnitude and epicentral distance exert influence on the spectral value and attenuation speed of the response spectrum [16]. Furthermore, Nakamura proposed a classification method based on a spectral comparison between horizontal and vertical earthquake components [17]. Naeim and Anderson categorized 1470 horizontal components and 527 vertical components according to their damage potential [18]. Arul and Kareem utilized the shapelet transform in combination with a Random Forest classifier comprising 500 trees to identify earthquake events from continuous seismic data and detect strong velocity pulses from ground motion data [19]. These classification methods are intuitive and practical for engineers, but the specific rules for defining classification boundaries remain subjective. Consequently, unsupervised methods for classifying earthquake ground motions are increasingly being adopted.
The rapid increase in earthquake ground motions in recent years has also prompted researchers to use cluster analysis, an unsupervised big data approach, for categorization [20,21,22,23]. Alimoradi et al. introduced a fuzzy C-means clustering method for strong earthquake ground motion records, classifying 1470 horizontal ground motion records into six categories based on peak ground acceleration, duration, effective peak acceleration, effective peak velocity, maximum incremental velocity, and maximum incremental displacement [24]. Yaghmaei-Sabegh proposed a clustering method for earthquake ground motions based on K-means and self-organizing network algorithms, using various indices to classify 36 simulated and 49 recorded earthquake ground motions [25]. Ding et al. initially categorized earthquake ground motions by site type and subsequently clustered them using magnitude and Joyner–Boore distance as parameters [26,27]. This approach provides a comprehensive consideration of the influence of site type, magnitude, and propagation distance on the spectral characteristics of earthquake ground motions. Sharbati et al. employed a hierarchical and K-means clustering method to categorize a large number of near-fault earthquake ground motions based on velocity pulse intensity [28]. While clustering, as an unsupervised method, can accurately reflect the internal data structure, the uncertainty of initial values often leads to instability, resulting in different outcomes upon repeated clustering. Therefore, this study aims to present a classification method for earthquake ground motion records that combines the advantages of both supervised and unsupervised methods.
In this study, careful consideration is afforded to the strengths inherent in both clustering and classification methods. A novel classification approach for earthquake ground motion records is introduced based on the K-means clustering method. To establish classification boundaries, a comprehensive dataset comprising 7627 horizontal earthquake ground motions was meticulously collected before undergoing K-means clustering analysis. Subsequent to this clustering process, the earthquake ground motion records were effectively categorized using the delineated boundaries. The validity and efficacy of the proposed earthquake ground motion records classification method were further examined through a detailed analysis of the spectral characteristics exhibited by each group of earthquake ground motions. By scrutinizing the spectral attributes across different classification groups, insights were gained into the distinct patterns and behaviors exhibited by seismic events, thereby affirming the utility and reliability of the proposed classification methodology.
2. Earthquake Ground Motion Records
2.1. Collection and Screening of Earthquake Ground Motion Records
The earthquake ground motion records utilized in this study were sourced from the NGA-West2 database of the Pacific Earthquake Engineering Research Center (PEER). A total of 13,556 horizontal earthquake acceleration records from 200 earthquakes was gathered. Figure 1 illustrates the distribution of moment magnitude (), Joyner–Boore distance (), and average shear-wave velocity to a depth of 30 m () for the 13,556 earthquake ground motion records. The Mw values range from 3.7 to 7.9, the RJB spans from 0 km to 620.78 km, and vs30 varies between 89.32 m/s and 2100 m/s. Notably, the selected data encompass a broad range of Mw, RJB, and vs30 values, allowing for the comprehensive consideration of source characteristics, propagation path, and local site ground motion spectral features.
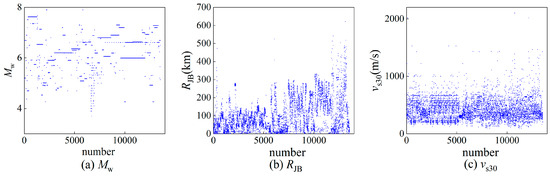
Figure 1.
Distribution of , , and of the collected earthquake ground motion records.
Before categorization, the earthquake ground motion records underwent screening to eliminate irrelevant data and ensure that only meaningful records remained for engineering purposes. Initially, certain far-field earthquake ground motion records were excluded from the study due to their low peak ground accelerations. The exclusion of these records adheres to the following principles:
According to Equation (1), earthquake ground motion records with a moment magnitude less than 6 are excluded from the database if their corresponding Joyner–Boore distance exceeds 150 km and their peak ground acceleration is lower than 0.002 g. Similarly, for earthquake ground motion records with a moment magnitude greater than or equal to 6, exclusion criteria apply if their corresponding Joyner–Boore distance exceeds 400 km and their peak ground acceleration is lower than 0.002 g. Subsequently, some records were excluded for specific earthquake events to address disparities in record quantity. The number of earthquake ground motion records observed for each event varies significantly. Some earthquakes yield thousands of records, while others have only single-digit counts. Records from individual earthquakes with an exceptionally high count were further screened and subsequently excluded to mitigate the disproportionate influence of these events. During the second round of exclusion, the s and s of the remaining records were distributed as widely as possible within the original range. Figure 2 presents the exclusion results for four earthquakes: Chi-Chi, Chuetsu-oki, El-Mayor-Cucapah, and Niigata-Japan. Following the exclusion processes, 7627 earthquake ground motion records were retained for further research.
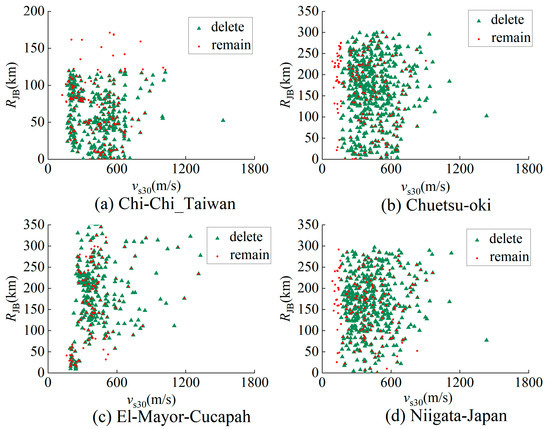
Figure 2.
Exclusion results for four earthquakes.
2.2. Classification of Earthquake Ground Motion Records Based on the Site Type
Recognizing the impact of site conditions on design response spectra, earthquake ground motion records are consistently classified according to the site type in seismic codes worldwide. In this study, to enhance the applicability of the classification results, the earthquake ground motion records were initially categorized following the guidelines outlined in the Code for Seismic Design of Buildings in China (GB50011-2010) [8]. While PEER provides only the values for the site condition of earthquake ground motion records, GB50011-2010 recognizes the site type based on both the shear velocity and soil depth. Establishing a correlation between the site types defined in GB50011-2010 and is imperative. To achieve this, in this study, the correlation proposed by Guo et al. was employed to classify the earthquake ground motion records.
Subsequently, the dataset comprising 7627 earthquake ground motion records underwent division into four distinct groups, each corresponding to site types I, II, III, and IV as delineated in GB50011-2010. The correlation between the site categories stipulated in GB50011-2010 and , along with the detailed breakdown of the record count for each group, is outlined in Table 1. The average acceleration response spectra for these four groups of earthquake ground motion records, with the peak acceleration normalized to 1 m/s2, are depicted in Figure 3. The analysis demonstrates that the characteristic period of the response spectrum and the attenuation velocity of the descending section are influenced by the site types. Moving from group I to group IV, there is an increase in the long-period component of earthquake ground motions.

Table 1.
Correlation between the site categories stipulated in GB50011-2010 and [22] and the number of records for the four site categorization groups.
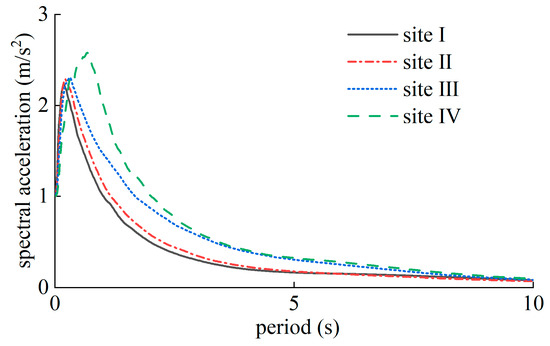
Figure 3.
Average acceleration response spectra for the four site categorization groups with normalized peak acceleration (1 m/s2).
3. Cluster Analysis of Earthquake Ground Motion Records
The spectral characteristics of earthquake ground motions are notably influenced by various factors, including the source, propagation path, and local site conditions. While the classification of earthquake ground motion records according to the site type addresses the influence of local site conditions, it is imperative to further consider the impact of the source and propagation path. Ding et al. introduced a K-means clustering method for earthquake ground motion records, wherein and are considered as cluster parameters. Additionally, frequency parameters are also utilized as cluster parameters [27]. Both the - and frequency content attributes, along with the K-means clustering method, effectively revealed the spectral differences between the different groups, proving their effectiveness. However, and are more easily accepted and utilized by engineers than other types of attributes. Therefore, and were chosen as cluster parameters.
Given the distinct dimensions and orders of and , it is crucial to employ a logical approach that integrates both parameters effectively. Parameter standardization before cluster analysis emerges as a practical solution to harmonize these disparate scales. This approach effectively mitigates the scale discrepancy between and , as the latter typically exhibits a significantly larger order than the former, thereby influencing the result of cluster analysis to a considerable degree. To tackle this challenge, a straightforward linear standardization method is adopted. This method ensures that both attributes are normalized within the range of [0, 1], thereby addressing any potential disproportionality arising from the ’s larger scale compared to that of the . The normalization principles guiding this process are outlined as follows:
where and are the maximum and minimize values of moment magnitude before normalization, respectively; and and are the moment magnitude before and after normalization, respectively. Similarly, and are the maximum and minimize values of the Joyner–Boore distance before normalization, respectively; and and are the Joyner–Boore distance before and after normalization, respectively. Ensure that , , and are expressed in the same units.
3.1. K-Means Clustering Method
K-means stands out as one of the most widely utilized cluster analysis algorithms, where the parameter “K” signifies the user’s specified number of clusters. In this method, the initial K centroids, say the initial seeds, are first determined randomly. Subsequently, each point is assigned to the closest centroid, with the Euclidean distance serving as the measure of proximity. The centroid is updated each time a new point is assigned to the cluster, effectively representing the mean of the points within that group. The initial cluster analysis concludes once all points have been assigned to clusters. Subsequently, the analysis iterates with updated centroids until the clusters stabilize, meaning each point remains assigned to the same cluster as in the previous iteration. The primary steps of the K-means cluster analysis algorithm are outlined in Figure 4.
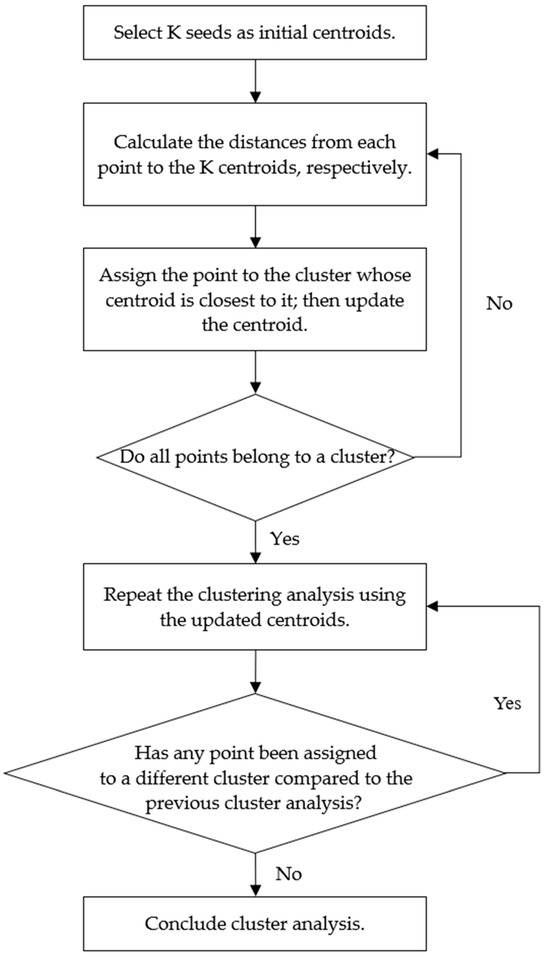
Figure 4.
Primary steps of the K-means cluster analysis algorithm.
3.2. Cluster Results
The earthquake ground motion records from the four site categorization groups were clustered based on their normalized and values. The records from each site categorization group were then grouped into three clusters. The distribution of and within each cluster group is depicted in Figure 5, and the number of earthquake ground motion records in each cluster group is summarized in Table 2. As depicted in Figure 5, the clustering results for the four site categorization groups exhibit similarities: the three cluster groups within each site categorization group can be identified as follows: near-field and small earthquake group, near-field and large earthquake group, and far-field and large earthquake group, hereafter referred to as groups 1, 2, and 3, respectively.
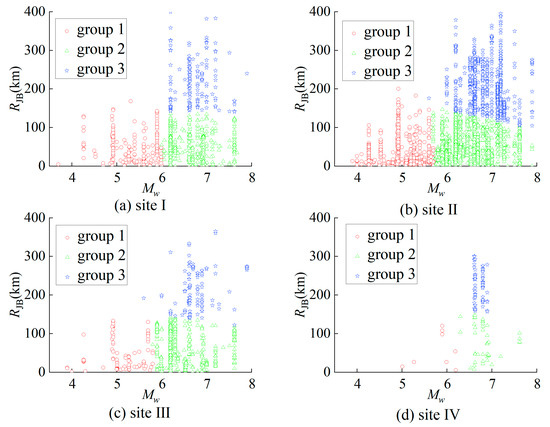
Figure 5.
Distribution of Mw and RJB in the cluster groups.
Table 2.
Number of earthquake ground motion records in each cluster group.
The earthquake acceleration time histories recorded are linearly modulated, with the peak acceleration normalized to 1 m/s2. Following this normalization process, the average acceleration response spectra of the normalized acceleration time histories for the four site categories are depicted in Figure 6. It is important to note that this average acceleration response spectrum, derived from the normalized earthquake accelerations, serves as a reflection of spectral characteristics, as the influence of the peak acceleration has been effectively eliminated. As depicted in Figure 6, significant variations are evident among the average acceleration response spectra of the three cluster groups within each site category. Notably, the long-period component of earthquake ground motions increases with both and , with a discernible rise from site I to site IV. These clustering results underscore the influence of magnitude, propagation distance, and site conditions on the spectral properties of earthquake ground motions.
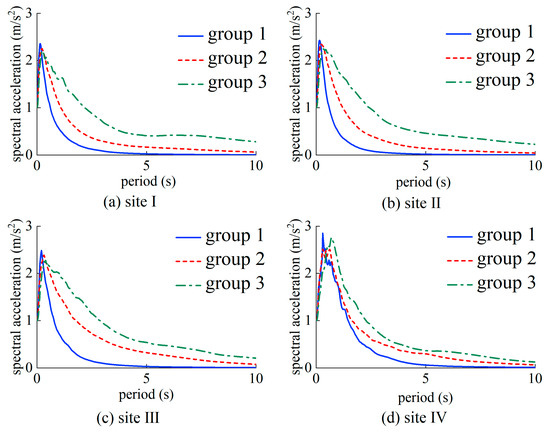
Figure 6.
Average acceleration response spectra of the normalized acceleration time histories for the four site categories.
3.3. Stability Analysis of Clustered Earthquake Ground Motion Records
The formation of clusters from earthquake ground motion records is heavily reliant on the initial seeds chosen. Altering these seeds can produce varying cluster results, with random seed selection being a prevalent approach. Consequently, while the K-means clustering method offers a systematic means of partitioning earthquake ground motion records, it is imperative to assess the stability of these clusters. To illustrate, the earthquake ground motion records from site IV were taken as an example. Four repeated clustering analyses were performed, and the resulting clusters were compared to evaluate their consistency over multiple cluster analyses.
Table 3 presents the numbers of earthquake ground motion records for four repeated clustering analyses conducted on records from site IV, while the distributions of and are illustrated in Figure 7. Upon comparing the four clustering results, it is evident that the number of earthquake ground motion records in each cluster remains consistent across the first repetition, as well as the last two repetitions, whereas significant discrepancies arise between the first two and last two clustering analyses. Similarly, the distributions of and follow a similar pattern. The results from the first two clusters mirror those in Section 3.2. However, in the last two clustering results, there are notable differences in the and distributions of groups 1 and 2. The analysis reveals that sample points near the boundary are unstable, whereas those farther away from the boundary are stable. Overall, this investigation highlights the lack of stability in both the number and distribution of ground motion records within each group through repeated cluster analysis.
Table 3.
Numbers of earthquake ground motion records for four repeated clustering analyses conducted on records from site IV.
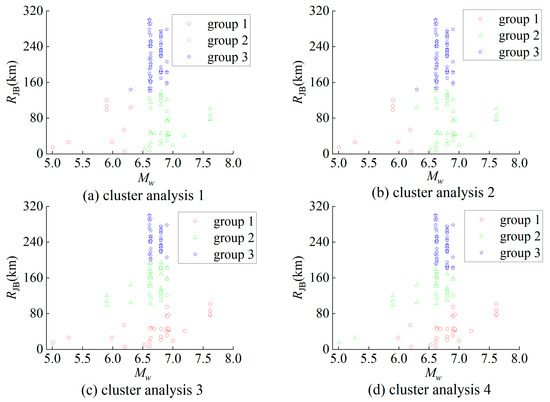
Figure 7.
Distributions of Mw and RJB for four repeated clustering analyses conducted on records from site IV.
Additionally, the spectral characteristics of earthquake ground motions within clustered groups were analyzed across four repeated clustering analyses conducted on records from site IV. The average acceleration response spectra were computed and compared for all cluster groups, as depicted in Figure 8. The analysis unveiled noteworthy discrepancies in spectral accelerations, particularly in the long-period range, among the earthquake ground motions within group 1. Disparities of up to fivefold were observed across the four repeated clustering analyses. Conversely, the response spectra of earthquake ground motions in group 3 exhibited a minimal variation. The differences in response spectra for earthquake ground motions in group 2 fell between those of group 1 and group 3. These findings align with the observations presented in Figure 6, indicating substantial fluctuations in the distribution of cluster samples within group 1, relative stability within group 3, and intermediate behavior within group 2.
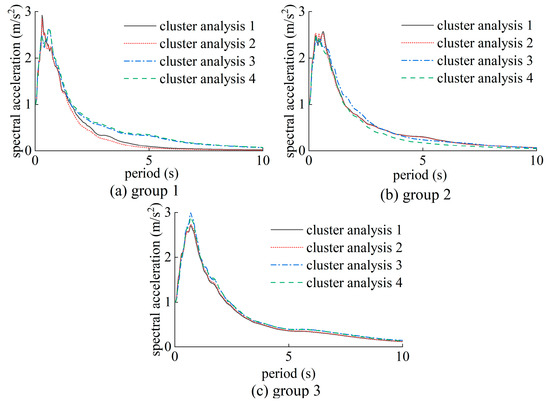
Figure 8.
Average acceleration response spectra of earthquake ground motions across cluster groups: insights from four repeated cluster analyses.
From this analysis, it becomes apparent that, while K-means clustering does provide enhanced insights into the impact of earthquake magnitude and propagation distance on the spectral characteristics of earthquake ground motions, its outcomes are notably vulnerable to variations stemming from the initial seeds selection and subsequent repeated clustering iterations. This susceptibility leads to significant fluctuations in the clustering results observed during repeated cluster analyses.
The stability of the clustering outcomes derived from the K-means clustering method is compromised, thereby diminishing its practical utility in engineering applications. Stable clusters enable more reliable predictions of ground motion characteristics, which are critical for designing earthquake-resistant structures. When clusters are consistent, engineers can develop more accurate response spectra for different site conditions, leading to the improved safety and performance of buildings and infrastructure during seismic events. Conversely, unstable clusters can result in inconsistent design parameters, increasing the risk of structural failures. Therefore, ensuring the stability of clustering methods enhances the robustness of seismic codes and standards, ultimately contributing to the safety and resilience of communities in earthquake-prone areas.
4. Cluster-Based Categorization of Earthquake Ground Motion Records
In this study, a classification method for earthquake ground motion records is proposed to mitigate the instability inherent in the cluster analysis of earthquake ground motion records. The methodology begins by establishing distinct boundaries delineating various groups of earthquake ground motion records, derived from the results of the cluster analysis. These boundaries serve as critical reference points for subsequent classification efforts.
4.1. Boundary
As depicted in Figure 5, the demarcation between group 1 and group 2 primarily correlates with ; likewise, the division between group 2 and group 3 is predominantly associated with . Notably, groups 1 and 3 are nonadjacent. Consequently, the classification of ground motion records hinges solely on delineating the magnitude boundary between group 1 and group 2, as well as the distance boundary between group 2 and group 3.
The earthquake ground motion records obtained from the four types of sites were subjected to independent clustering procedures, each performed four times for every site category. For each clustering analysis, the maximum of records in the first cluster group () and the minimum value in the second cluster group (), as well as the maximum in the second cluster group () and the minimum value in the third cluster group (), were calculated. Utilizing these data, the range of the boundary and the boundary for each site type were initially determined. The range of the boundary between group 1 and group 2 is or , while the range of the boundary between group 2 and group 3 is or . The ranges of boundaries for earthquake ground motion records of the four sites are displayed in Table 4. However, it should be noted that inconsistencies were observed in the distribution of records within the third and fourth clusters of site IV, particularly concerning the patterns observed in small, large, and distant earthquakes. Due to these anomalies, the results derived from these two clusters were deemed unreliable and were consequently disregarded in the subsequent analysis.
Table 4.
Ranges of boundaries for earthquake ground motion records of the four sites.
As indicated in Table 4, the boundary between group 1 and group 2 is approximately 6, exhibiting minimal fluctuation. Meanwhile, the boundary between group 2 and group 3 is consistently around 140 km for the earthquake ground motion records of sites I, III, and IV. However, for site II, the boundary between group 2 and group 3 displays a broader range. The clustering results of earthquake ground motion records for site II, conducted four times, are illustrated in Figure 9. The vertical coordinate of the dashed horizontal line in Figure 9 is 140 km. It is noteworthy that earthquake ground motion records belonging to group 3, with a lower than 140 km, are relatively sparse. Additionally, these records with a lower than 140 km are contiguous with the records of group 2. Consequently, the boundary between group 2 and group 3 for site II is also established at 140 km. In summary, the boundary between group 1 and group 2 for all sites is consistently set at 6, while the boundary between group 2 and group 3 for all sites is uniformly set at 140 km.
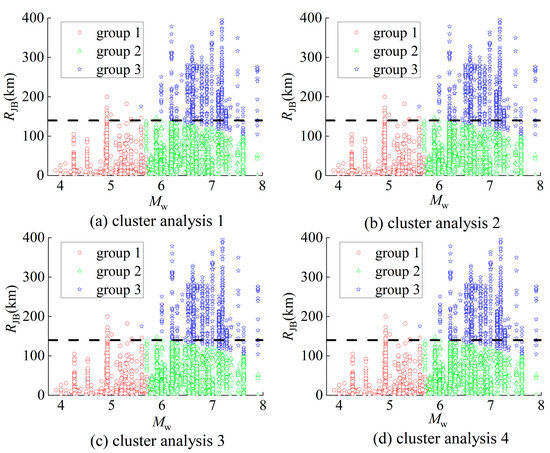
Figure 9.
Clustering results of earthquake ground motion records for site II, conducted four times.
4.2. Classification Results of Earthquake Ground Motion Records
Based on the boundaries established in Section 4.1, the earthquake ground motion records for each of the four site types were classified into three distinct groups. The quantity of earthquake ground motion records in each classification group is detailed in Table 5, while the distribution of and for all classification groups, along with the cluster results, is illustrated in Figure 10. The comparison of Table 2 and Table 5, and Figure 10 reveals that the classification and clustering results for site I and site IV are notably similar in both the number of earthquake ground motion records and the distribution of and . Conversely, the classification and clustering results for site II and site III exhibit significant disparities in the number of earthquake ground motions, but share similarities in the distribution of and .
Table 5.
Quantity of earthquake ground motion records in each classification group.
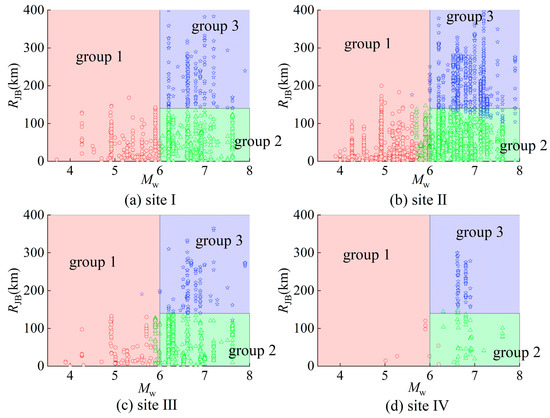
Figure 10.
Distribution of and for all classification groups, along with the cluster results.
Figure 11 displays the average acceleration response spectra of earthquake ground motion records for all classification groups. It illustrates that the long-period component of earthquake ground motions escalates from site I to site IV and from group 1 to group 3. This classification adheres to a fundamental principle: the long-period component of earthquake ground motions increases from hard soil to soft soil, from small magnitude to large magnitude, and from near field to far field. Notably, the classification results closely align with those obtained from clustering. Furthermore, the classification procedure mitigates the instability associated with clustering analysis. Hence, the classification method proves to be considerably more practical for engineers.
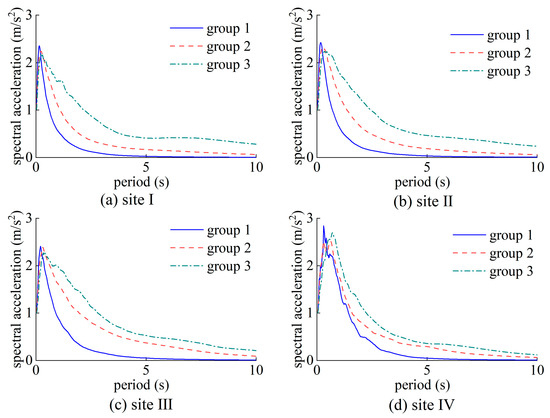
Figure 11.
Average acceleration response spectra of earthquake ground motion records for all classification groups.
5. Conclusions
This study presents novel contributions by establishing classification boundaries for earthquake ground motion records through the analysis of 7627 horizontal records, considering the influence of site conditions, earthquake magnitude, and propagation distance. The records were subsequently classified based on these established boundaries and analyzed from two perspectives: the distribution of in relation to and their spectral properties. The classification results consistently align with the fundamental principles governing the influence of magnitude, propagation distance, and site conditions on earthquake ground motion spectral characteristics. This proposed classification method not only addresses the inherent instability of clustering methods but also improves the efficiency of earthquake ground motion record classification, presenting a practical and reliable approach for earthquake ground motion analysis.
The earthquake ground motion records from each site are innovatively classified into three distinct groups: the near-field and small earthquake group, the near-field and large earthquake group, and the far-field and large earthquake group. These groupings, closely linked to earthquake magnitude and propagation distance, offer high practicality for engineers. Traditional clustering methods, however, suffer from instability due to their sensitivity to initial seed selection, making them less user-friendly. To address this issue, this study introduces a novel classification method with specific boundaries: setting a magnitude threshold at for both the near-field and small earthquake group and the near-field and large earthquake group; and establishing a propagation distance limit at for the near-field and large earthquake group as well as the far-field and large earthquake group. This refinement not only maintains the practical utility of the classification groups but also mitigates the inherent instability of clustering methods. Furthermore, notable distinctions emerged among earthquake ground motion records within each classification group, underscoring the influence of classification attributes on spectral characteristics.
The classification results of earthquake ground motion records help in the development of more accurate seismic design criteria tailored to specific types of ground motions. This ensures that buildings and infrastructure are designed to withstand the unique characteristics of seismic events they are likely to encounter, enhancing safety and resilience. By classifying ground motions, engineers and seismologists can better assess and predict the potential impacts of future earthquakes on different types of structures and sites.
Author Contributions
Conceptualization, Y.D., Y.X., and H.M.; Data curation, M.N.; Formal analysis, Y.D. and M.N.; Funding acquisition, Y.D.; Investigation, Y.D. and M.N.; Methodology, Y.D.; Project administration, Y.X. and H.M.; Resources, M.N.; Software, M.N.; Supervision, Y.D., Y.X., and H.M.; Validation, Y.D., Y.X., and H.M.; Visualization, Y.D.; Writing—original draft, M.N.; Writing—review and editing, Y.X. and H.M. All authors have read and agreed to the published version of the manuscript.
Funding
This research was funded by the National Natural Science Foundation of China (Grant No. 52008339) and China Postdoctoral Science Foundation (Grant No. 2022MD723815).
Data Availability Statement
All the accelerograms used in this study were downloaded from the website http://ngawest2.berkeley.edu/ (2 March 2024).
Acknowledgments
The support of the National Natural Science Foundation of China and China Postdoctoral Science Foundation is appreciated. The authors are also grateful to the Pacific Earthquake Engineering Research Center for providing the earthquake ground motions.
Conflicts of Interest
The authors declare no conflicts of interest.
References
- Ancheta, T.D.; Darragh, R.B.; Stewart, J.P.; Seyhan, E.; Silva, W.J.; Chiou, B.S.; Wooddell, K.E.; Graves, R.W.; Kottke, A.R.; Boore, D.M.; et al. NGA-West2 database. Earthq. Spectra 2014, 30, 989–1005. [Google Scholar] [CrossRef]
- Douglas, J.; Edwards, B. Recent and future developments in earthquake ground motion estimation. Earth-Sci. Rev. 2016, 160, 203–219. [Google Scholar] [CrossRef]
- Rodríguez, C.A.; Rodríguez Pérez, Á.M.; López, R.; Mancera, J.J.C. Comparative analysis and evaluation of seismic response in structures: Perspectives from non-linear dynamic analysis to pushover analysis. Appl. Sci. 2024, 14, 2504. [Google Scholar] [CrossRef]
- Trifunac, M.D. Site conditions and earthquake ground motion–A review. Soil Dyn. Earthq. Eng. 2016, 90, 88–100. [Google Scholar] [CrossRef]
- Nampally, S.; Padhy, S.; Trupti, S.; Prasad, P.P.; Seshunarayana, T. Evaluation of site effects on ground motions based on equivalent linear site response analysis and liquefaction potential in Chennai, south India. J. Seismol. 2018, 22, 1075–1093. [Google Scholar] [CrossRef]
- Adampira, M.; Derakhshandi, M. Influence of a layered liquefiable soil on seismic site response using physical modeling and numerical simulation. Eng. Geol. 2020, 266, 105462. [Google Scholar] [CrossRef]
- Li, Y.; Hao, B.; Chen, Z.; Zhou, Z.; Bian, Z.; Han, Y.; Peng, C. Discussion on Adjustment Method of the Characteristic Period of Site Response Spectrum with Soft Soil Layer. Sustainability 2023, 15, 8837. [Google Scholar] [CrossRef]
- GB 50011-2010; Code for Seismic Design of Buildings. China Architecture and Building Press: Beijing, China, 2010. (In Chinese)
- ASCE/SEI 7-10; Minimum Design Loads for Buildings and Other Structures. ASCE Standard, American Society of Civil Engineers, Structural Engineering Institute: Reston, VA, USA, 2010.
- EN-1998-1; Eurocode 8: Design of Structures for Earthquake Resistance-Part 1: General Rules, Seismic Actions and Rules for Buildings. European Committee for Standardization: Brussels, Belgium, 2004.
- The Building Standard Law of Japan; The Building Center of Japan(BCJ): Tokyo, Japan, 2016.
- Chi, M.; Li, X.; Chen, X.; Ma, S. Problems and suggestions on site classification. Acta Seismol. Sin. 2021, 43, 787–803. [Google Scholar]
- Coban, K.H. Seismic site classification based on H/V spectral ratio from strong ground motion records: The urban areas of Bursa province. J. Seismol. 2024, 28, 321–344. [Google Scholar] [CrossRef]
- Trifunac, M.D.; Brady, A.G. Correlations of peak acceleration, velocity and displacement with earthquake magnitude, distance and site conditions. Earthq. Eng. Struct. Dyn. 1976, 4, 455–471. [Google Scholar] [CrossRef]
- Shoji, Y.; Tanii, K.; Kamiyama, M. A study on the duration and amplitude characteristics of earthquake ground motions. Soil Dyn. Earthq. Eng. 2005, 25, 505–512. [Google Scholar] [CrossRef]
- Ji, J.; Liang, X.; Fu, H.; Han, X. Spectral characteristics of ground motions in the original sites of Kashi, Xinjiang. China Earthq. Eng. J. 2023, 45, 1425–1431. (In Chinese) [Google Scholar]
- Nakamura, Y. A method for dynamic characteristics estimation of subsurface using microtremor on the ground surface. Railw. Tech. Res. Inst. Q. Rep. 1989, 30, 25–33. [Google Scholar]
- Naeim, F.; Anderson, J.C. Design Classification of Horizontal and Vertical Earthquake Ground Motion (1933–1994); John A. Martin and Associates: Los Angeles, CA, USA, 1996. [Google Scholar]
- Arul, M.; Kareem, A. Applications of shapelet transform to time series classification of earthquake, wind and wave data. Eng. Struct. 2021, 228, 111564. [Google Scholar] [CrossRef]
- Bragato, P.L.; Laurenzano, G.; Barnaba, C. Automatic zonation of urban areas based on the similarity of H/V spectral ratios. Bull. Seismol. Soc. Am. 2007, 97, 1404–1412. [Google Scholar] [CrossRef]
- Weatherill, G.; Burton, P.W. Delineation of shallow seismic source zones using K-means cluster analysis, with application to the Aegean region. Geophys. J. Int. 2009, 176, 565–588. [Google Scholar] [CrossRef]
- Kuyuk, H.S.; Yildirim, E.; Dogan, E.; Horasan, G. Application of k-means and Gaussian mixture model for classification of seismic activities in Istanbul. Nonlinear Process. Geophys. 2012, 19, 411–419. [Google Scholar] [CrossRef]
- Ning, C.; Xie, Y. Convolutional variational autoencoder for ground motion classification and generation toward efficient seismic fragility assessment. Comput. -Aided Civ. Infrastruct. Eng. 2024, 39, 165–185. [Google Scholar] [CrossRef]
- Alimoradi, A.; Pezeshk, S.; Naeim, F.; Frigui, H. Fuzzy pattern classification of strong ground motion records. J. Earthq. Eng. 2005, 9, 307–332. [Google Scholar] [CrossRef]
- Yaghmaei-Sabegh, S. A novel approach for classification of earthquake ground-motion records. J. Seismol. 2017, 21, 885–907. [Google Scholar] [CrossRef]
- Ding, Y.; Li, J. Ground motion clustering method based on energy distribution and determination of characteristic periods. J. Tongji Univ. (Nat. Sci.) 2017, 45, 1415–1420. (In Chinese) [Google Scholar]
- Ding, Y.; Peng, Y.; Li, J. Cluster analysis of earthquake ground-motion records and characteristic period of seismic response spectrum. J. Earthq. Eng. 2020, 24, 1012–1033. [Google Scholar] [CrossRef]
- Sharbati, R.; Mostafaei, S.; Khoshnoudian, F.; Ramazi, H.R.; Amindavar, H.R. Cluster analysis of near-fault ground motions based on the intensity of velocity pulses. J. Eng. Mech. 2020, 146, 04020117. [Google Scholar] [CrossRef]


Disclaimer/Publisher’s Note: The statements, opinions and data contained in all publications are solely those of the individual author(s) and contributor(s) and not of MDPI and/or the editor(s). MDPI and/or the editor(s) disclaim responsibility for any injury to people or property resulting from any ideas, methods, instructions or products referred to in the content. |
© 2024 by the authors. Licensee MDPI, Basel, Switzerland. This article is an open access article distributed under the terms and conditions of the Creative Commons Attribution (CC BY) license (https://creativecommons.org/licenses/by/4.0/).