Abstract
The safety and stability of tunnel construction are paramount concerns in tunnel engineering. Traditionally, the assessment of tunnel stability involves evaluating whether tunnel displacement and deformation velocities exceed acceptable thresholds, using specifications and analogical reasoning. However, standardized cautionary indicators often lack adaptability and can result in unnecessary reinforcement and increase economic costs. This study presents a method for determining limit displacement and deformation velocities based on tunnel deformation limit states. Based on the finite difference method, which considers the quality of surrounding rock mass and tunnel geometric configuration, a parametric analysis of these velocities is presented. The vault settlement, relative spandrel displacement, relative hance displacement, and deformation velocity are investigated to establish the thresholds for displacement and deformation velocities. Furthermore, a sensitivity analysis using a multivariate adaptive spline regression model is performed to measure the parameter effects on the early allowance values. Finally, a response surface method is developed to estimate the indicators in order to provide criteria for assessing and warning about surrounding rock stability. The obtained results show that the proposed limit state analysis method is effective for providing a standardized criterion for tunnel excavation, and the sensitivity analysis indicates tunnel depth as the most influential factor on tunnel reliability.
1. Introduction
With the progression of societal development, there has been a surge in the proliferation of large-scale underground water conveyance projects. These significant underground construction projects often confront formidable obstacles while navigating through complex terrains. The New Austrian Tunneling Method (NATM) stands out for its exceptional ability to adjust to challenging geological conditions, establishing itself as the preferred construction technique for such endeavors. As NATM gains widespread adoption, the imperative to monitor surrounding rock deformation in tunneling projects intensifies [1,2]. The deformation of surrounding rock serves as a crucial and comprehensive indicator of tunnel stability [3], facilitating meticulous assessment against displacement control criteria.
The assessment and control of tunnel stability have garnered considerable attention from both the academic and engineering communities [4,5,6]. National standards in China dictate allowable displacements for tunnel crown settlement and peripheral convergence based on rock categories and burial depths [7]. Warning control standards for moderate-sized tunnel crown settlements have been reported, taking into account burial depths and rock categories based on construction experience [8]. For instance, in the case of the Alberg Tunnel in Austria, the allowable net displacement was specified as 10% of the tunnel radius or the length of the anchor, preferably not exceeding 30 cm. Tan et al. [9] suggested that the maximum allowable displacement varied with burial depth and was approximately 1/1000 of the burial depth. Skempton and MacDonald [10] suggested limits on structural deformations based on studies of permissible structural deformations. Ning [11] investigated the relationship between measured convergence displacement in tunnels, rock mass categories, and the time taken to establish safety judgment criteria. This included characteristic values, such as the stability time of various rock masses, stable moment displacement, final convergence displacement, and deformation velocities, achieved through the construction of a database of measured displacements and the application of mathematical statistics. Yu et al. [12] compiled a significant amount of measured displacement data from tunnel engineering to construct a displacement database. They utilized the confidence interval method to determine the stable mean and standard deviation of the tunnel crown settlement, considering both as the warning standard value. Liu et al. [13] analyzed the characteristics of monitoring displacement curves during tunnel excavation. Furthermore, based on a database of measured tunnel deformation and a usage of confidence intervals, they established warning criteria for tunnel collapse deformation. Wu et al. [14] conducted a three-dimensional finite element analysis on tunnels with weak interlayers under different working conditions. They proposed quantitative indicators for controlling tunnel excavation deformation. However, these existing warning indicators, both domestic and overseas, are derived from statistical analyses of excavation deformation and deformation rates of specific tunnels. The warning indicators obtained from this method may not be applicable for the target projects of interest. Moreover, the abovementioned measured deformation and deformation velocities are based on convergent deformation at the stable stage of tunnels. This may lead to conservative warning indicators and further cause excessive support usage during a tunnel excavation. Limited studies focus on standard warning indicators of tunnel excavations with wide applicability, which are obtained from the limit states of tunnels.
The overall objective of this study is to evaluate the threshold value of displacement and deformation velocities based on the tunnel deformation limit states. The finite different method is adopted to investigate the deformation and deformation velocities of excavated tunnels, considering the impacts of rock mass property (e.g., the rock mass quality index BQ value) and geometric parameters (including burial depth and radius) on tunnel excavation. Validations of the established numerical model with the analytical methods and a case study are subsequently conducted. A standardized criterion is developed to recognize the limit state of tunnel excavation. Moreover, a sensitivity analysis on parameters influencing the tunnel predictive indicator values is carried out using the multivariate adaptive spline regression model. Furthermore, response surfaces are presented to illustrate how tunnel rock mass quality, burial depth, and diameter impact the ultimate displacement and deformation rates, thus complementing the established prediction models.
2. Numerical Model Establishment and Verification
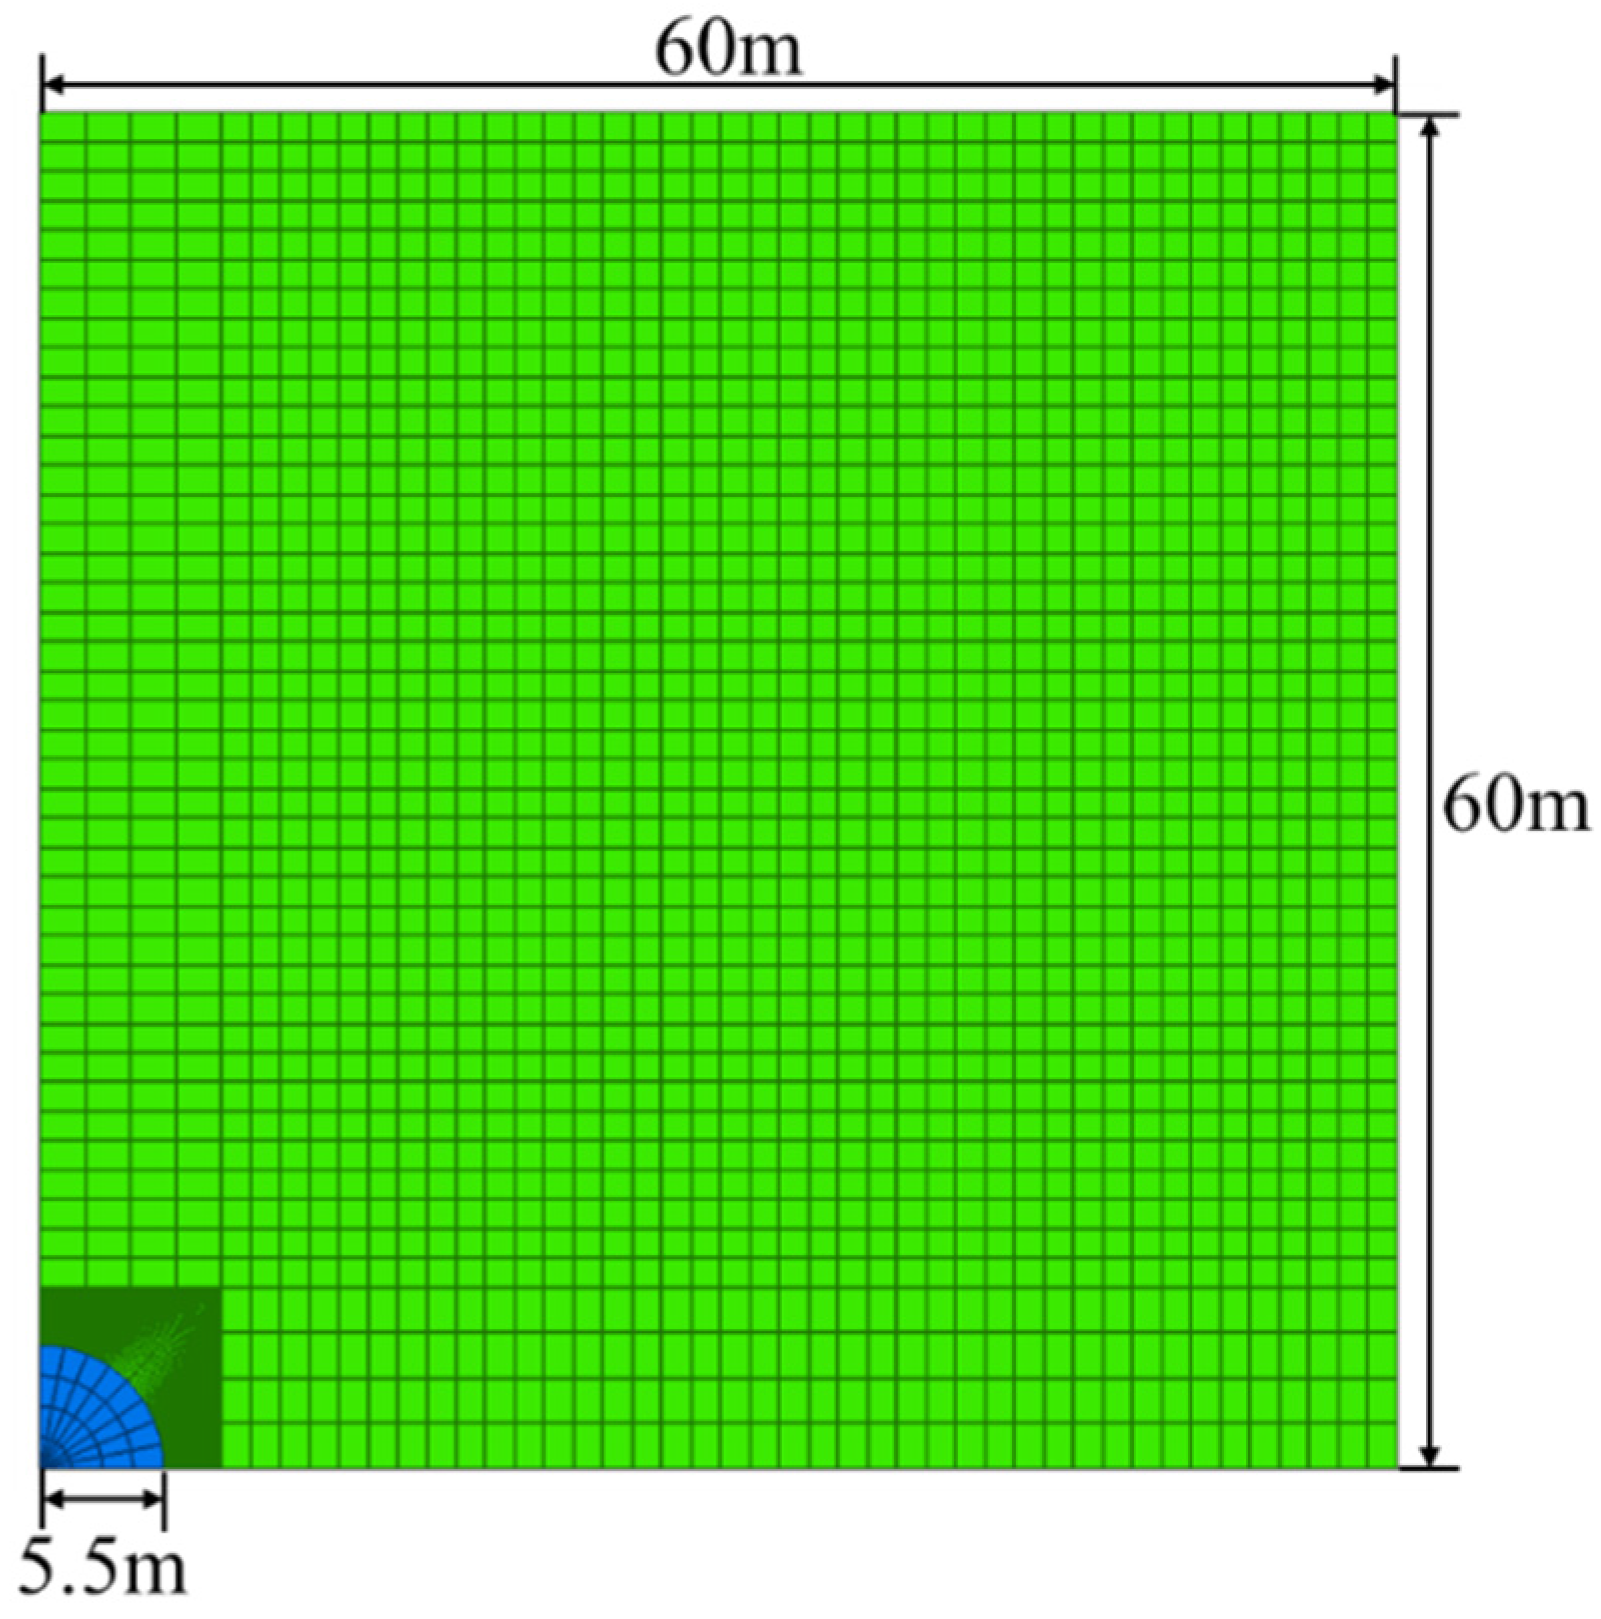
The finite difference software FLAC3D 5.0 is adopted to simulate the tunnels in this study. Figure 1 illustrates the dimensions and geometry of a quarter of the numerical calculation model. The model dimensions are 120 m along the transverse axis of the tunnel (X-direction), 120 m along the vertical axis (Z-direction), and 0.5 m along the longitudinal axis (Y-direction), simplifying the tunnel excavation into a two-dimensional plane strain problem. The model boundaries are fully constrained, and the tunnel burial depth and excavation radius vary based on the working conditions. The rock mass follows an ideal elastic–plastic yielding criterion, with parameters determined using the Hoek–Brown formula and considering rock mass quality classification. Initial ground stress is represented by a static stress field influenced solely by self-weight stress. The horizontal stress is calculated using the well-known Jaky’s equation [15] based on the internal friction angle of the rock mass (K0 = 1 − sinφ), where K0 is the coefficient of static earth pressure and φ is the internal friction angle. The lining system includes steel arches, steel mesh, shotcrete, and grouted rock bolts.
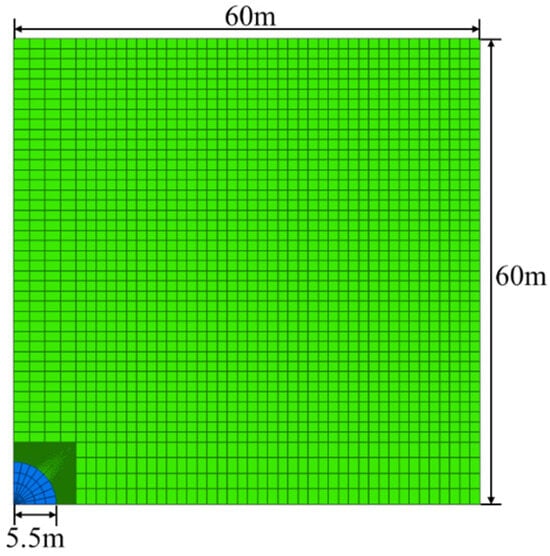
Figure 1.
The configuration of the numerical model.
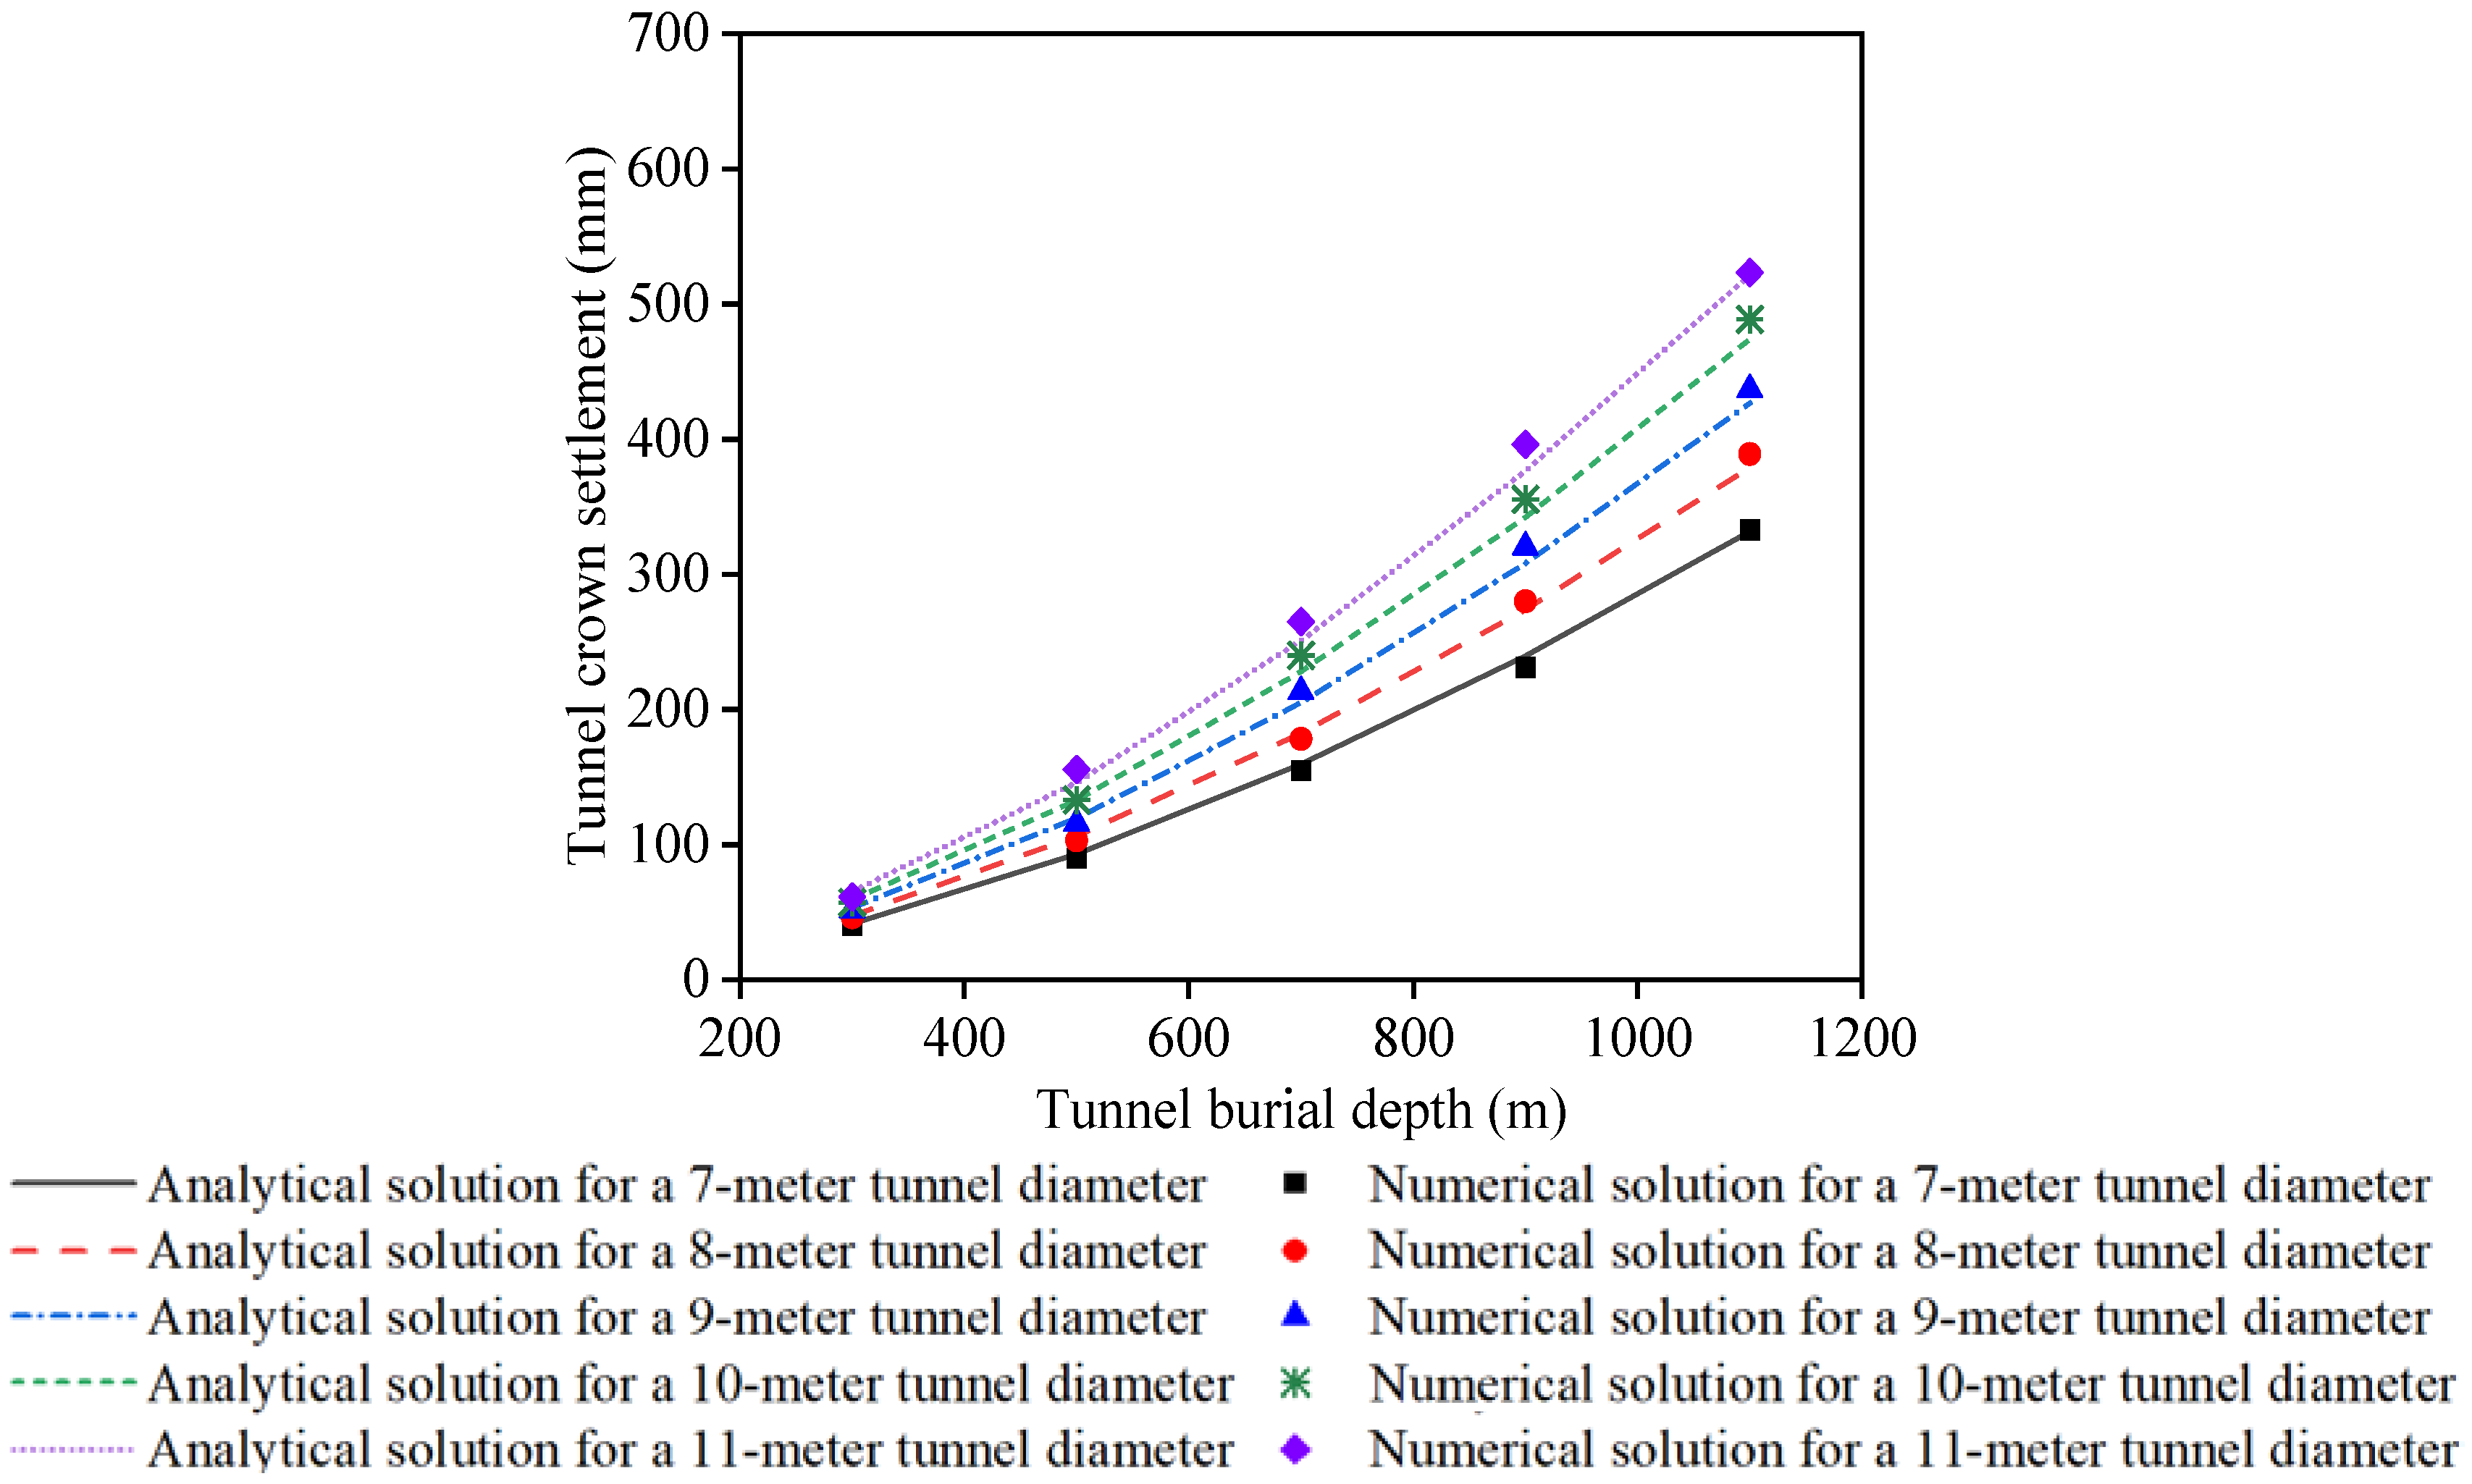
To validate the accuracy of the established model using the finite different method, comparisons with the analytical methods and a case study are carried out, respectively. Figure 2 presents a comparison of radial displacements obtained from numerical simulations conducted in this study with the analytical solution proposed by Carranza-Torres [16]. The physical parameters of the rock mass are obtained from the Engineering Rock Mass Classification Standard [17], where the elastic modulus of the rock mass is 0.66 GPa, the cohesion is 0.26 MPa, the internal friction angle is 27.9°, the Poisson’s ratio is 0.45, and the unit weight is 19.8 kN/m3. The comparison encompasses tunnel burial depths ranging from 300 m to 1100 m and diameters ranging from 7 m to 11 m. The comparisons depicted in Figure 2 reveal a good agreement between the outcomes derived from the numerical model in this study and those proposed by Carranza-Torres [16]. This alignment indicates that the established model employed for estimating the deformation of fully excavated tunnels with varying burial depths and diameters demonstrates sufficient accuracy.
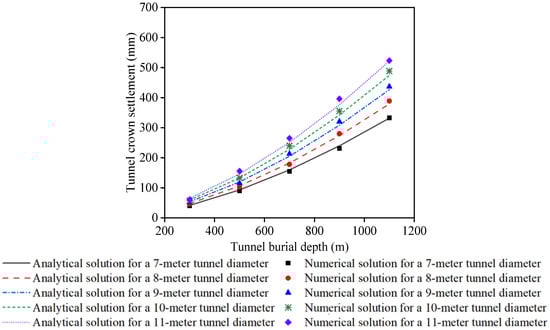
Figure 2.
A comparison of the radial displacements derived from the numerical simulations in this investigation and the analytical solution proposed by Carranza-Torres [16].
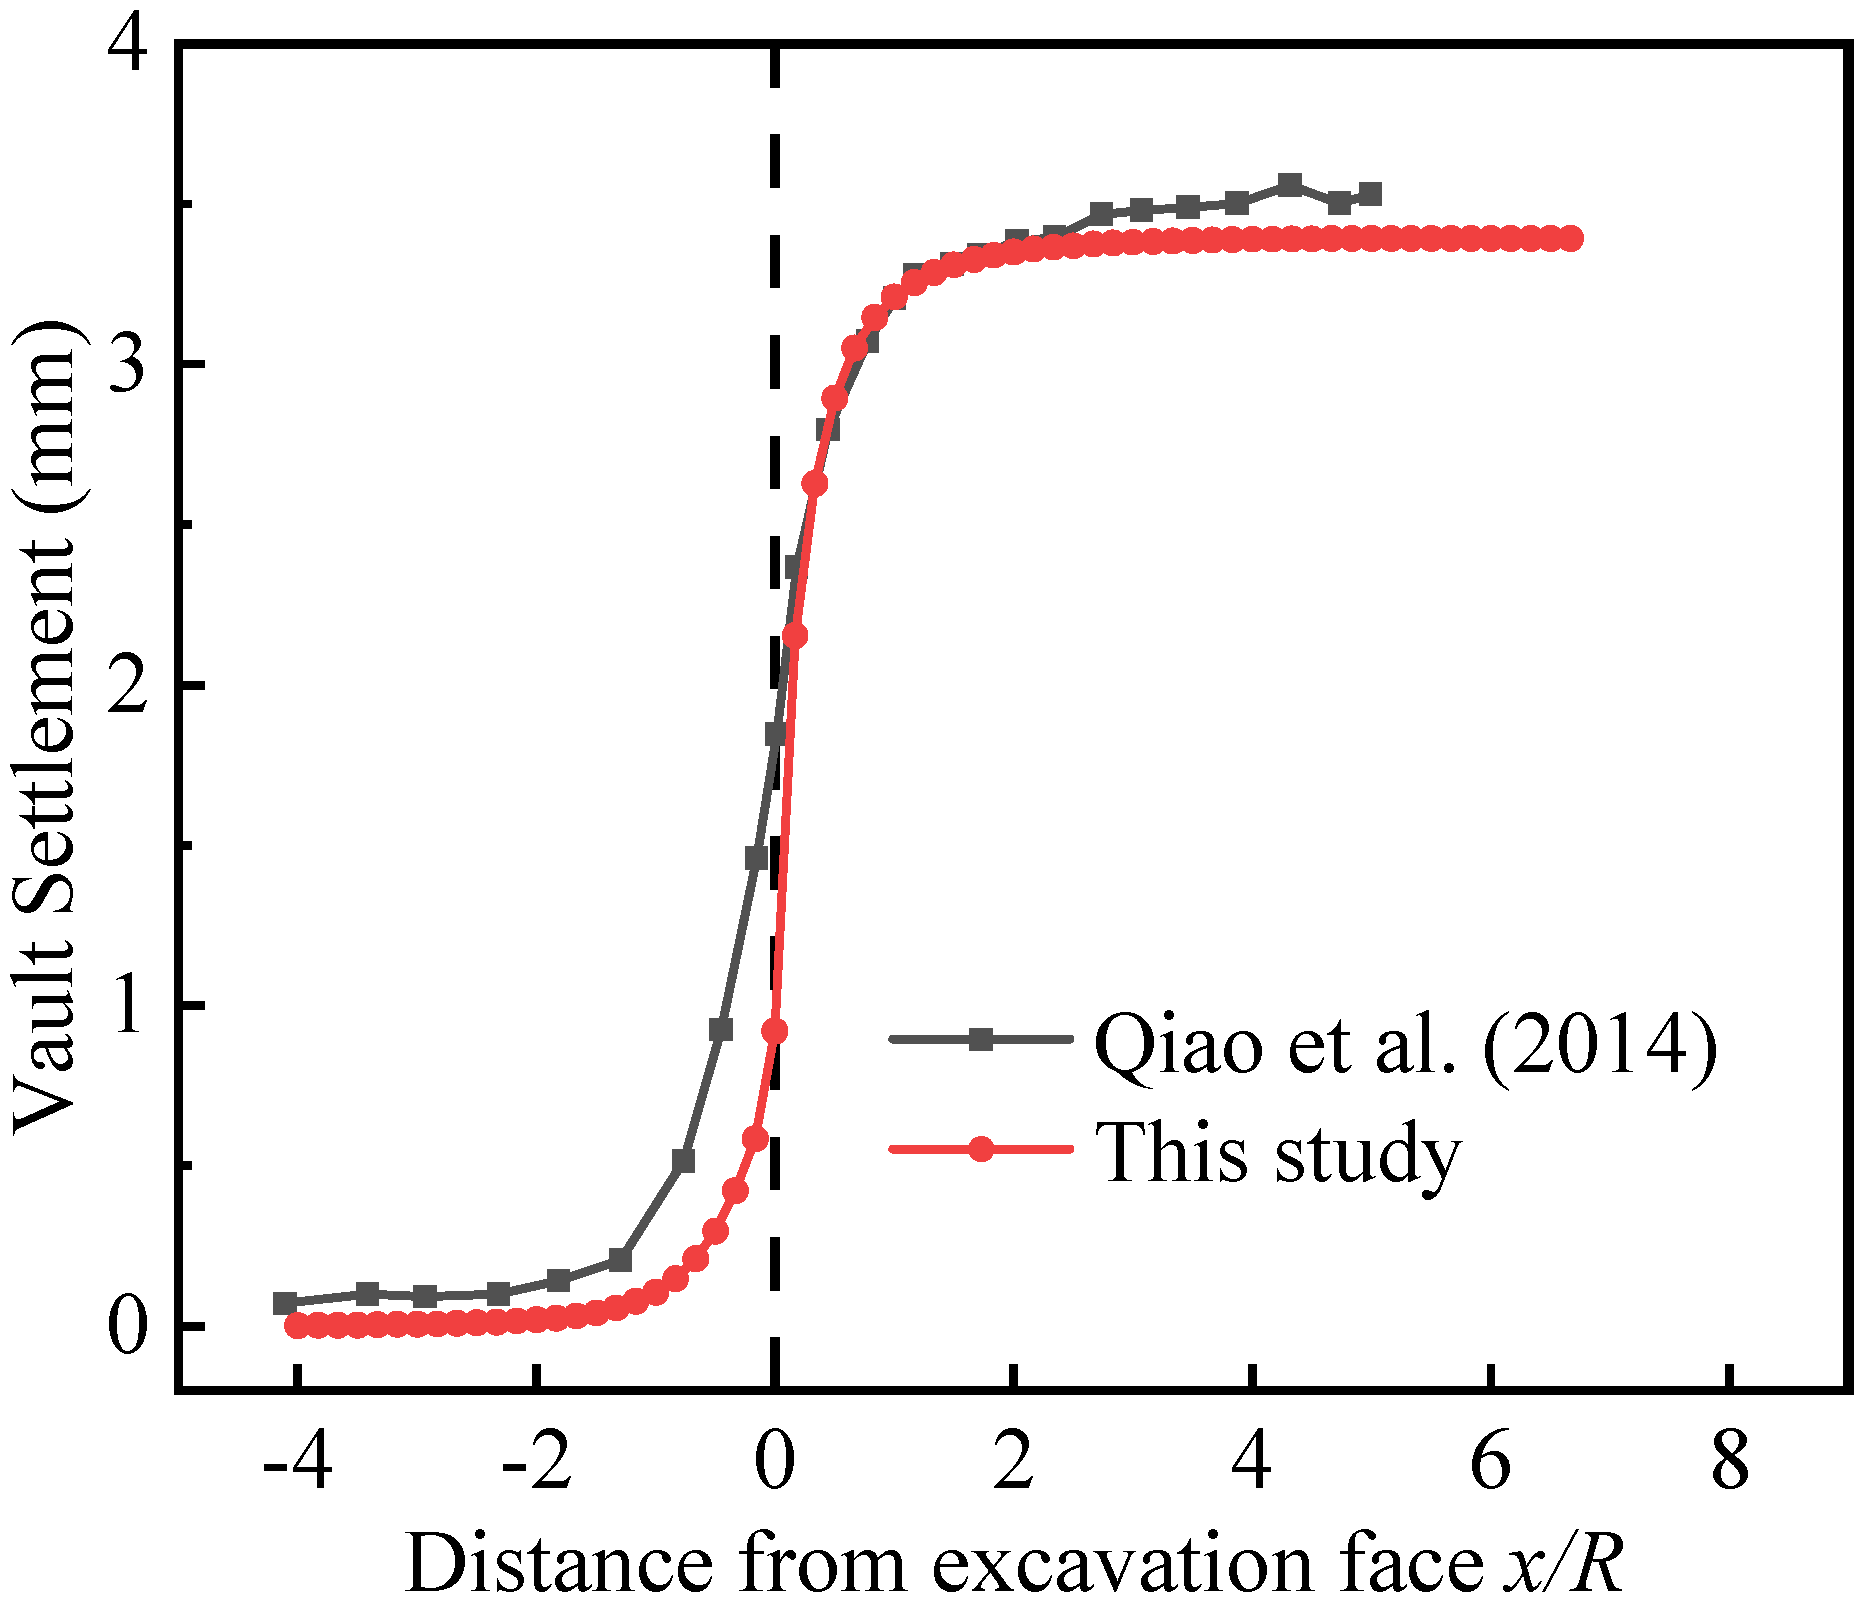
Figure 3 presents a comparison of the vault settlement of the tunnel obtained from the established model in this study with the measured results from a case study by Qiao et al. [18]. The geometric configuration and the property parameters of the tunnel in the case are as follows: the buried depth of the tunnel is 400 m, the elastic modulus of the rock mass is 17.1 GPa, the cohesion is 2.5 MPa, the internal friction angle is 46°, the Poisson’s ratio is 0.19, and the unit weight is 28 kN/m3. The variation in the vault settlement of the tunnel versus the distance from the excavation face is compared in Figure 3, indicating a good agreement of the results obtained from this study and those from the in-situ measurement, both in values and the variation trend. This demonstrates that the established model has sufficient accuracy for the following evaluation in this study.
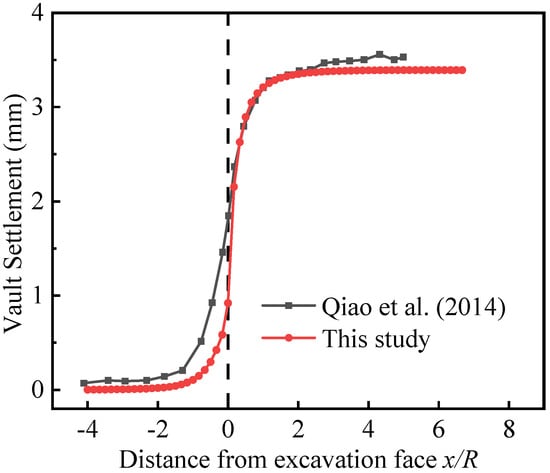
Figure 3.
A comparison of the vault settlement derived from the numerical simulations in this investigation and the measured results from a case study [18].
3. Critical Thresholds
The tunnel excavation sets off a redistribution of initial rock stress, which is particularly noticeable in unlined tunnels where the surrounding rock undergoes plastic yield as stress surpasses its strength. This leads to a gradual expansion of the plastic zone and subsequent progressive rock displacement. The stable state of the tunnel precisely before the collapse signifies its ultimate condition.
As for tunnels equipped with support structures, both the surrounding rock and the support system can afford an increase in pressure caused by the redistribution of ground stress. The ultimate condition of the surrounding rock and support system is indicated by the phenomena of their synchronized deformation without collapse. However, defining the ultimate condition of equipped tunnels is challenging due to various factors such as the rock mass quality, excavation method, and support form. Previous studies lack standardized criteria for determining tunnel ultimate conditions. By examining the tunnel excavation displacement versus stress variations, this study introduces a quantitative representation of the tunnel’s ultimate condition to determine the ultimate displacement and deformation velocity of tunnels.
3.1. Displacement
The determination of the displacement warning value involves evaluating displacements at various monitoring points under specific limit states. These assessments are influenced by factors such as rock mass quality, tunnel burial depth, diameter, excavation method, and support structure. Currently, the assessment of ultimate displacement relies on various approaches, including statistical analysis of field data, laboratory experiments, theoretical analysis, and normative recommendations. It is usually supplemented by engineering analogies. However, the limitations in field conditions and monitoring capabilities may result in insufficient data, particularly lacking data near instability or during unstable states. Additionally, it is difficult to replicate field geological conditions in laboratory settings because of the complication from the heterogeneous composition of engineering rock masses. Also, large-scale field experiments may face challenges due to complicated site conditions. Therefore, this study develops a limit state analysis method to determine the ultimate displacement of tunnel surrounding rock based on the numerical simulation. The proposed methodology involves the following steps:
- (1)
- Construct a two-dimensional plane strain numerical model of tunnel excavation with the release of surrounding rock stress. After the stage of the equilibrium of initial ground stress field, remove the inner part of the tunnel and replace with a decreased support stress along edge of the tunnel compared with the original earth stress, and evaluate the model again. This replaced support stress is set to be uniformly released, and the deformation values of tunnel monitoring points are then extracted at each stress release stage [19].
- (2)
- Plot the curve of the deformation of tunnel monitoring points versus the stress release rate. Find out the threshold value where the displacement shows a sharp increase when the stress release rate exceeds this value (e.g., 0.9 as shown in Figure 4). This condition is considered to reach the limit state.
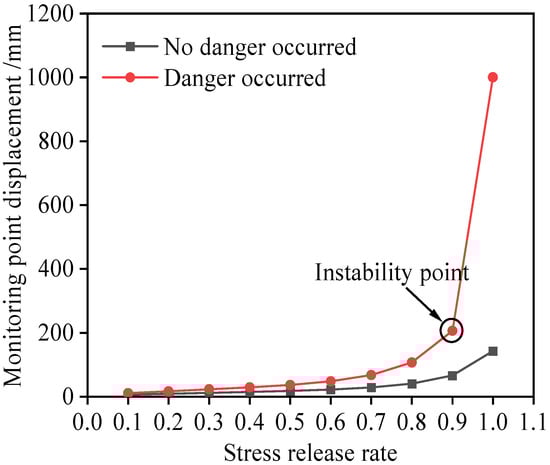 Figure 4. Variation of tunnel monitoring point displacement with stress release rate.
 - (3)
- Extract the displacement corresponding to the stress release stage at the limit state of instability. This serves as the warning value of displacement (Figure 4).
3.2. Deformation Velocity
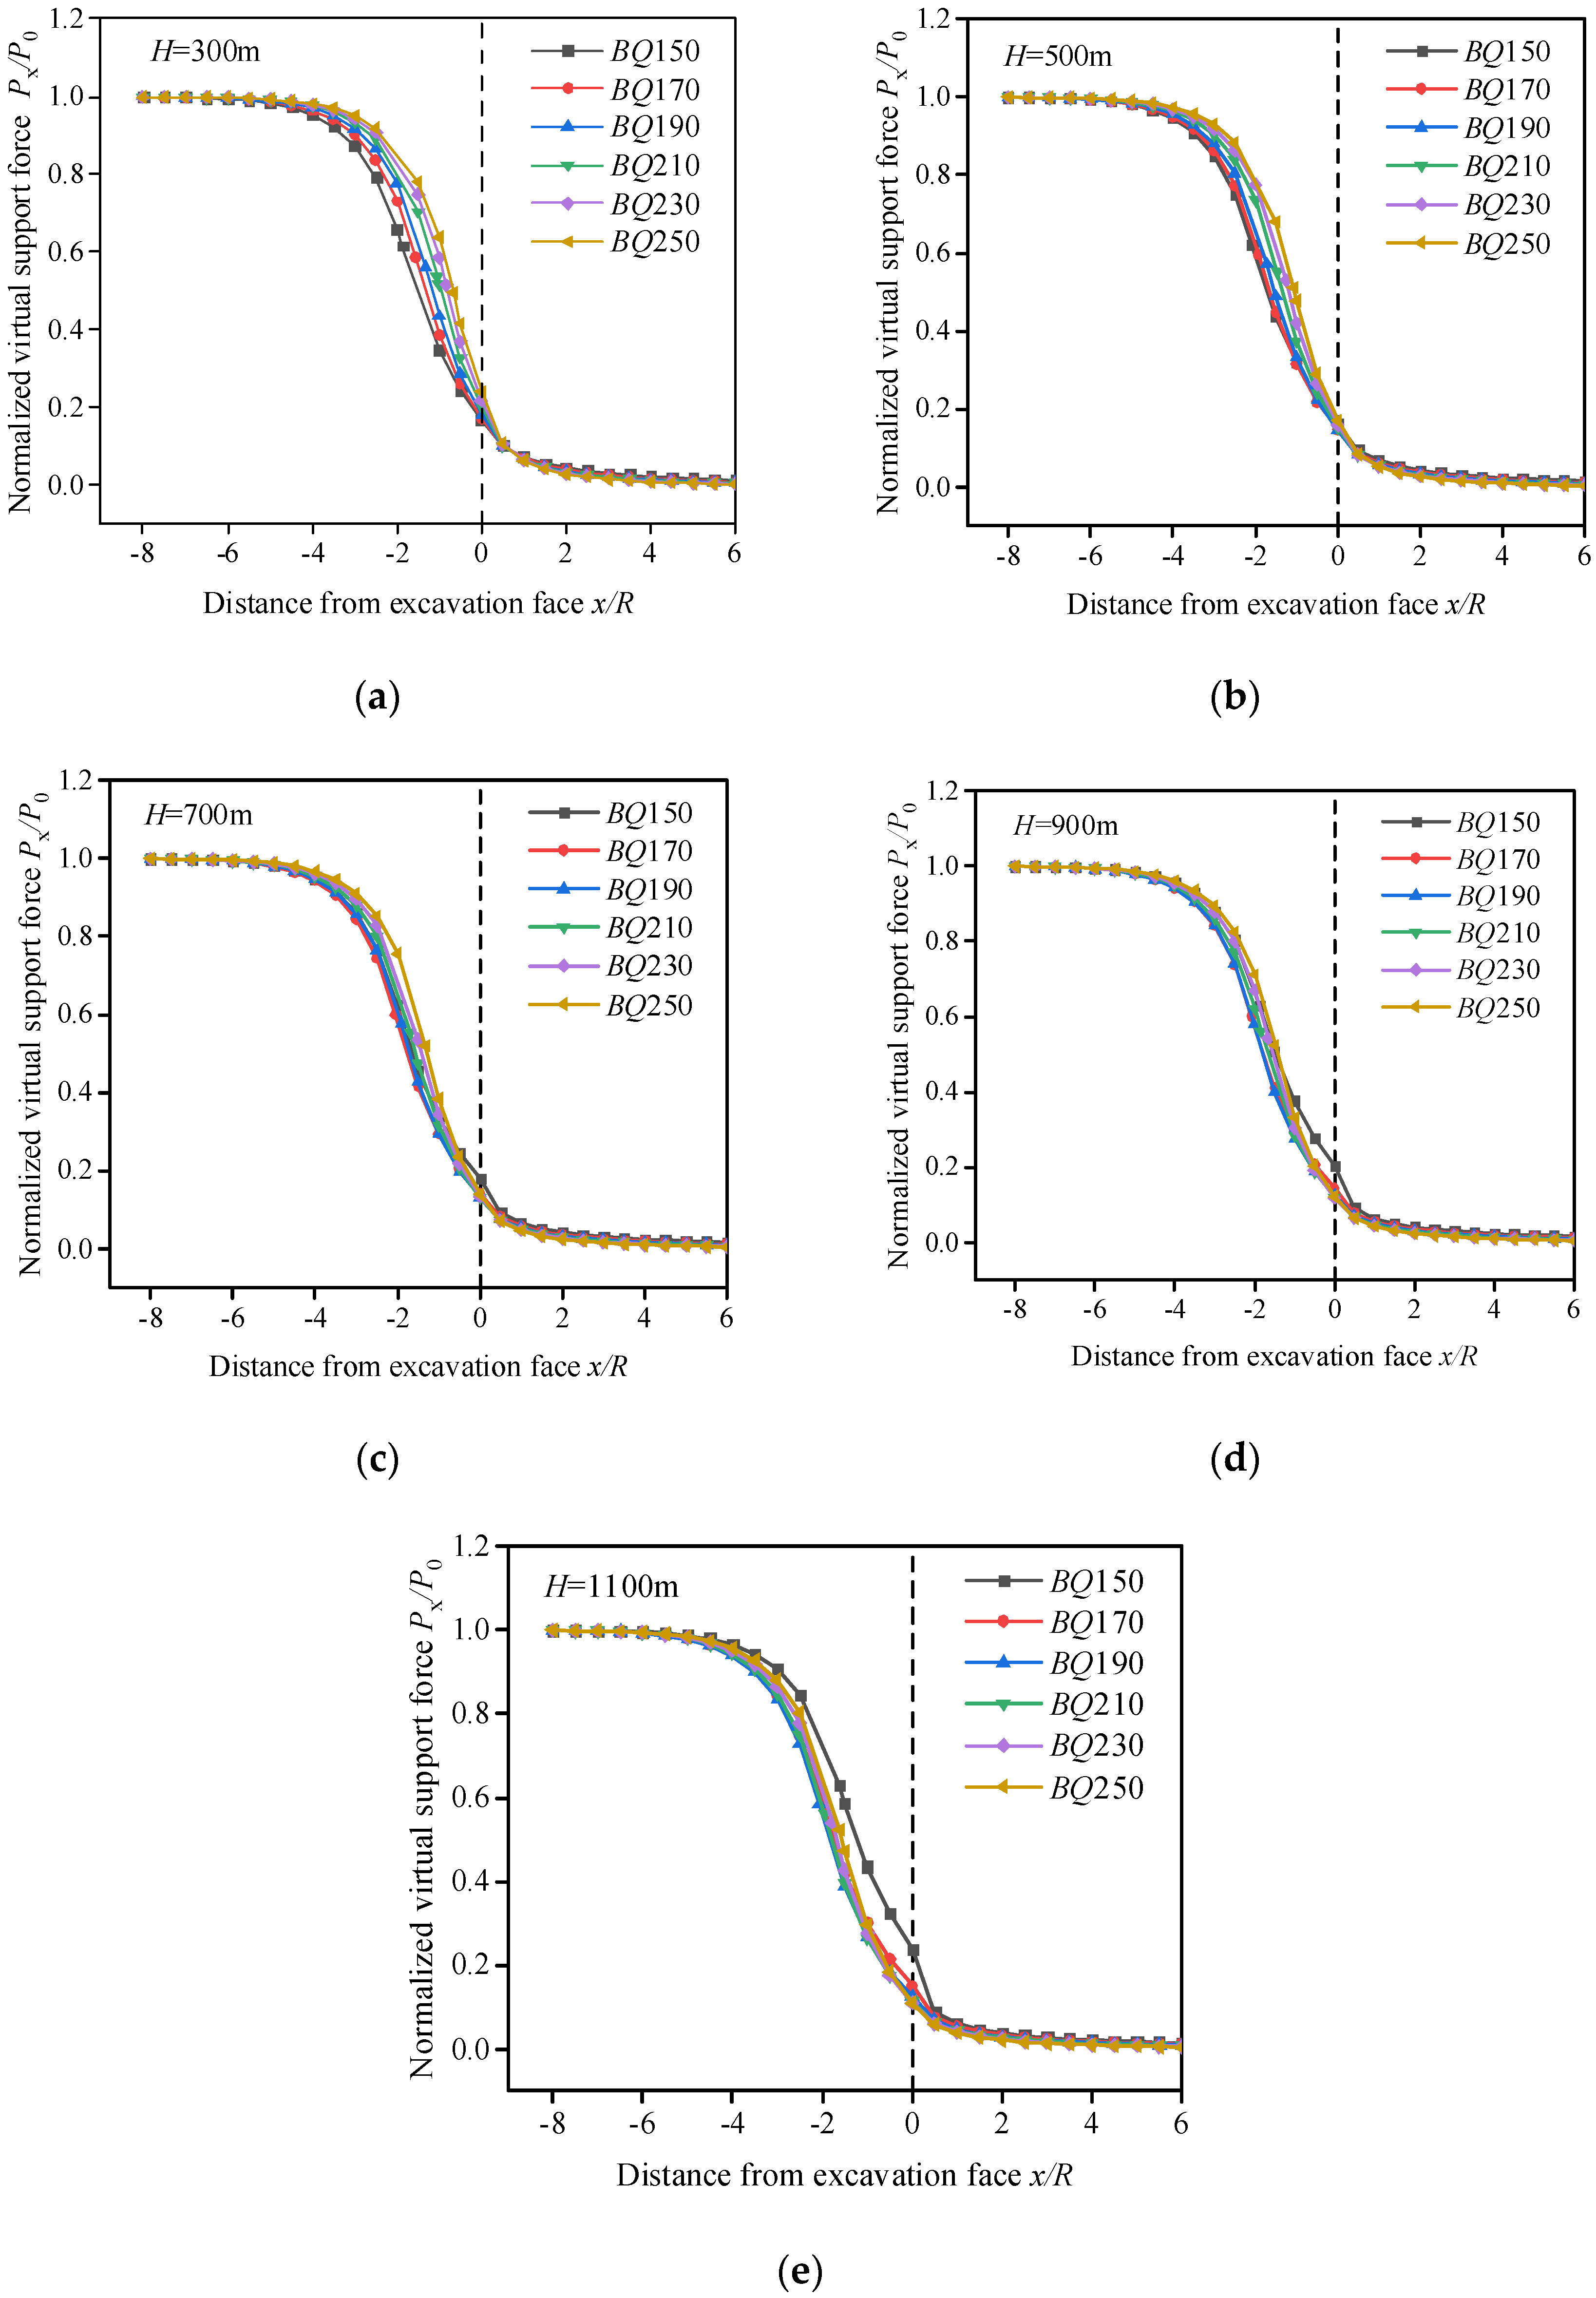
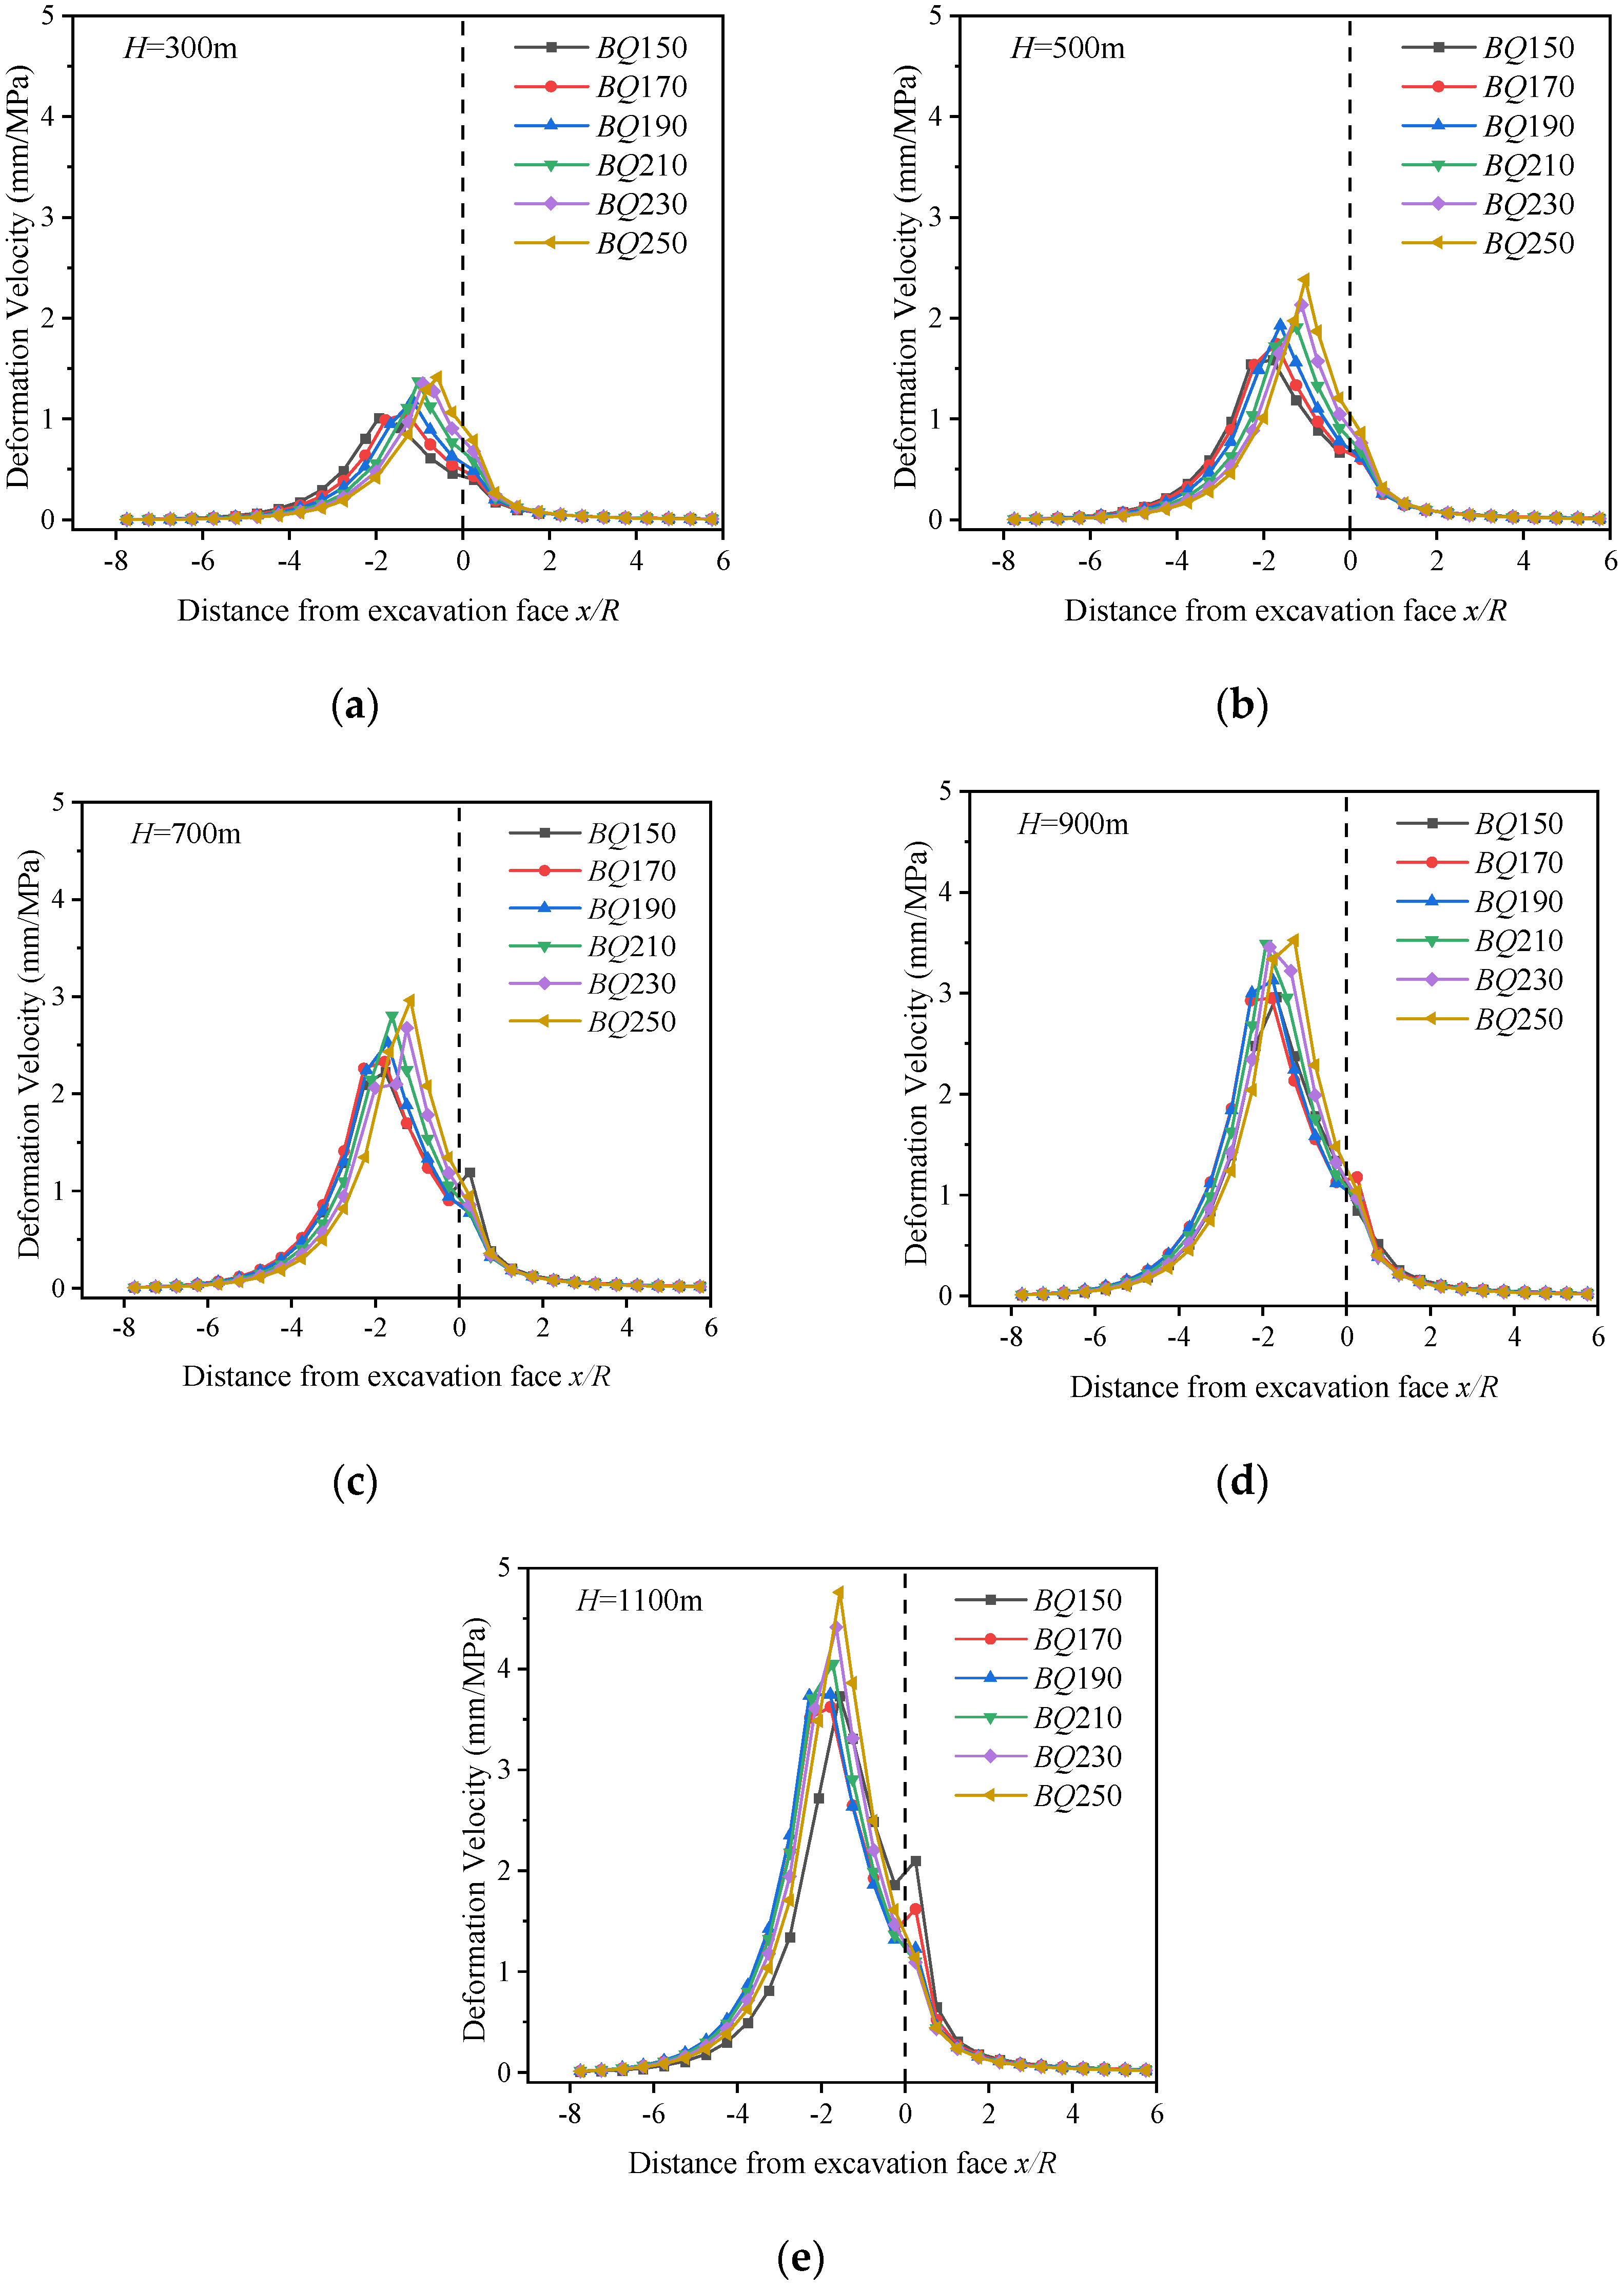
Tunnel excavation poses spatial challenges due to three-dimensional constraints, with semi-circular vault-shaped limitations longitudinally and annular constraints laterally. These constraints hinder the immediate release of elastic–plastic deformations near the excavation face. A virtual support force is added to represent this spatial constraint effect and to simplify tunnel excavation analysis as a plane strain problem. It is observed when a specific tunnel section is excavated, resulting in immediate and continuous convergence displacement. This deformation is arrested by applying a radial force against the tunnel wall, known as the virtual support force. As the excavation face moves away from the section under scrutiny, the virtual support force gradually diminishes until it reaches zero. Previous investigations showed that tunnel excavation can be simplified as a continuous decrease in virtual support force alongside the continuous increase in rock displacement. Upon reaching the limit state of the surrounding rock, the tunnel experiences a significant increase in displacement following a minor stress release. Subsequent displacements at monitoring points can be assessed based on the variation of displacement with the virtual support force. In this study, the slope represents the deformation velocity of the tunnel, indicating the ratio of displacement at the monitoring point to the released virtual support force. Sun [20] derived a comprehensive expression for the virtual support force, allowing for the determination of its variation curve with excavation distance under different working conditions. Based on Sun’s method [20], various variation curves for V-grade rock masses (BQ = 150~250) at burial depths ranging from 300 m to 1100 m are illustrated in Figure 5, providing detailed data for researchers to analyze. Furthermore, the deformation velocity of the tunnel curves versus the distance from excavation face are showed in Figure 6, with various values of V-grade rock masses at burial depths from 300 m to 1100 m. It can be observed from the curves that the maximum deformation velocity shows a significant increase with the crucial depth. By using these curves, researchers can determine the virtual support force and deformation velocity at any point during tunnel excavation under varying burial depths. The results from these curves are crucial for assessing rock mass stability and support design during tunnel excavation, offering valuable guidance for tunnel design and construction in practical engineering projects.
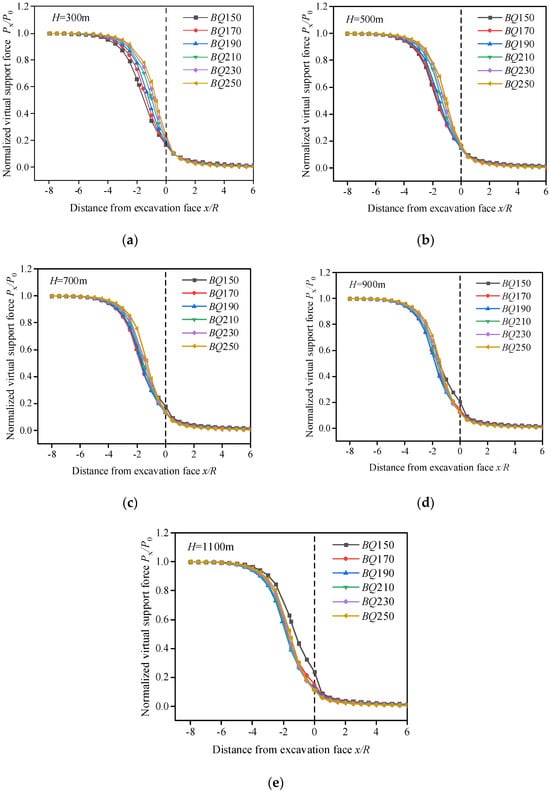
Figure 5.
Longitudinal distribution curve of virtual support force: (a–e) represent the time histories of virtual support forces for V–class surrounding rock at burial depths of 300 m, 500 m, 700 m, 900 m, and 1100 m, respectively.
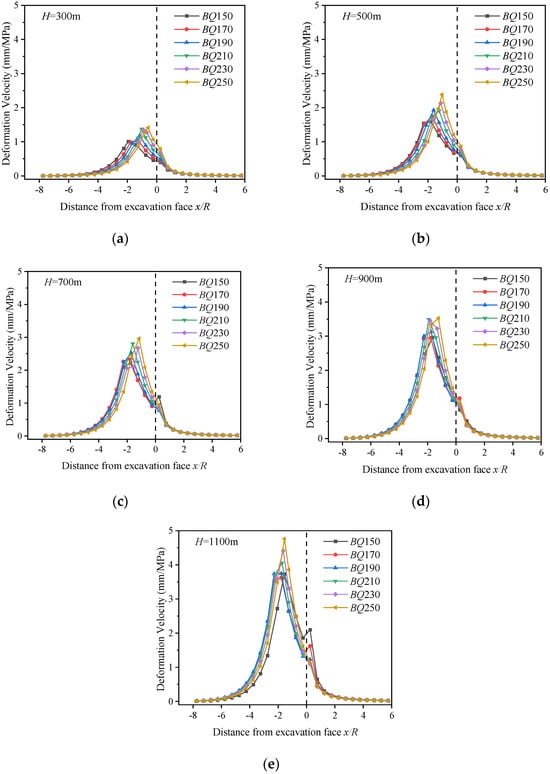
Figure 6.
Longitudinal distribution curve of deformation velocity: (a–e) represent deformation velocity values for V–class surrounding rock at burial depths of 300 m, 500 m, 700 m, 900 m, and 1100 m, respectively.
4. Numerical Simulations of Ultimate Displacement
The numerical model in this study adopts a circular cross-section and assesses rock mass quality using the BQ value recommended by the Engineering Rock Mass Classification Standard [17]. Considering the impact of rock mass quality, tunnel burial depth (ranging from 300 m to 1100 m), and diameter (ranging from 7 m to 11 m) on tunnel ultimate displacement, various scenarios’ databases for the ultimate displacement of tunnels are established. The physical parameters corresponding to each rock mass quality level are chosen based on conversion methods proposed in the literature [21,22] by the Engineering Rock Mass Classification Standard [17]. Details of the parameter selections are provided in Table 1. The support design includes shotcrete, steel arches, steel mesh, and fully bonded grouted rock bolts. Shotcrete, steel arches, and steel mesh are uniformly simulated using the equivalent modulus method, while rock bolts are simulated using cable structural elements.

Table 1.
Rock mass quality classification and corresponding mechanical parameters.
Due to space constraints, this study focuses solely on discussing the simulation results for rock mass grade V, as the distribution forms and variation patterns of simulation results for rock mass grades II-IV are similar. The summarized simulation results for rock mass grades II-IV can be referenced in the literature [17]. Table 2 displays the selected parameters for rock mass grade V, considering the variability of rock mass parameters.
Table 2.
Determination of physical mechanical parameters for grade V rock mass.
4.1. Results
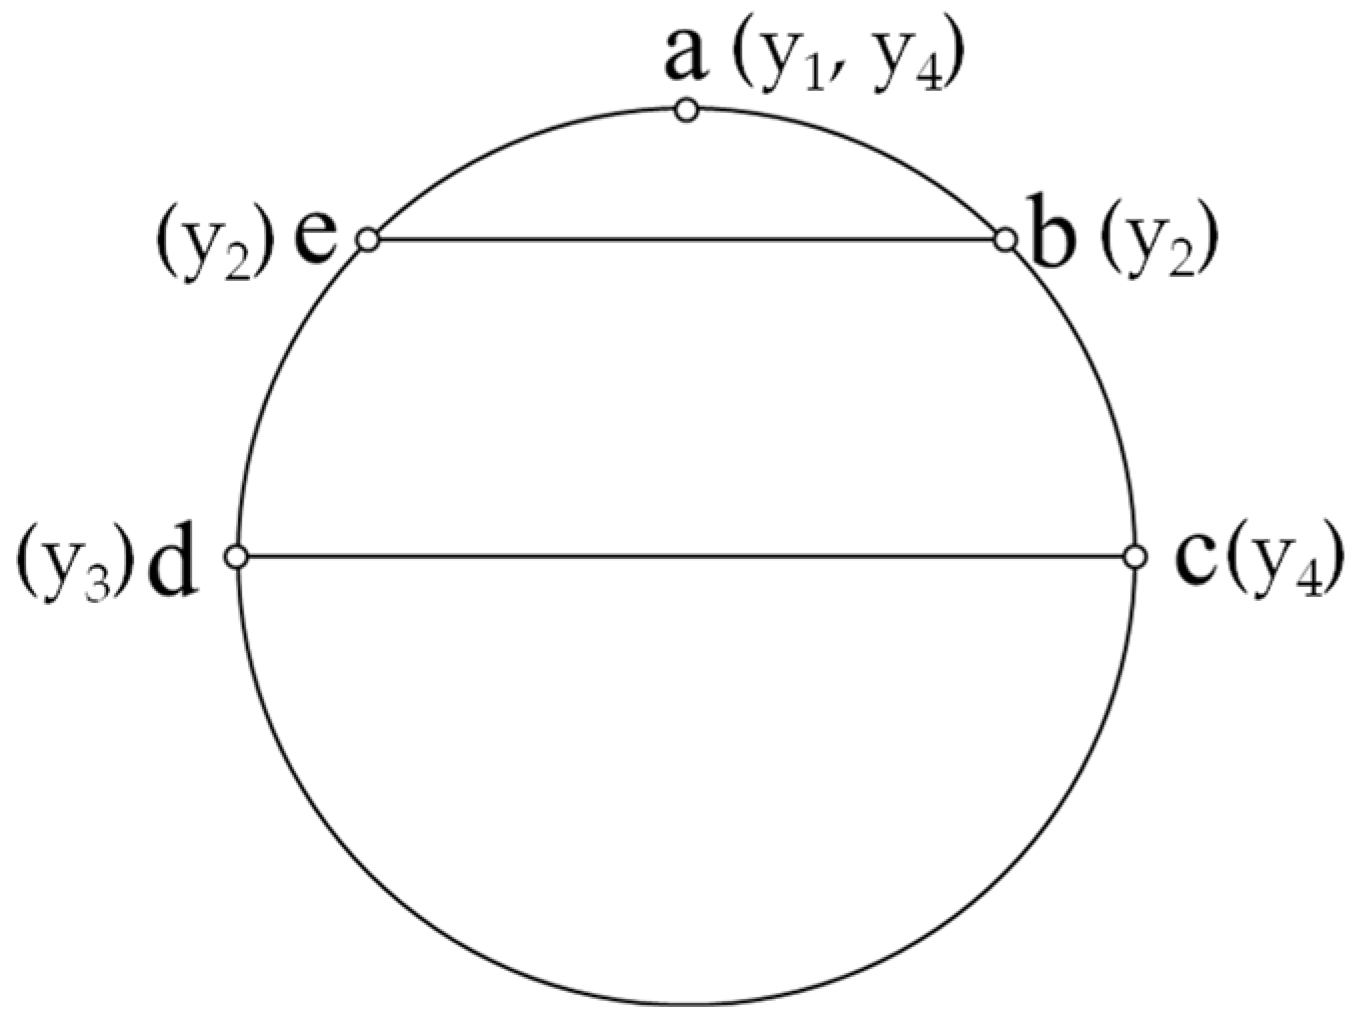
In this study, the effects of rock mass quality, burial depth, and tunnel diameter are investigated. According to the serviceability requirement of China Railway Corporation [7], the ultimate values of crown settlement (y1), relative displacement at the crown shoulder (y2), relative displacement at the crown waist (y3), and the deformation velocity (y4) are statistically analyzed as the four parameters of interest. Particularly, the deformation velocity (y4) is computed based on the crown settlement value. That is, the released virtual support force at the monitoring point is firstly obtained from the corresponding crown settlement using Sun’s method [20], and the deformation velocity (y4) is defined as the ratio of the crown settlement to the virtual support force. These data are obtained at the monitoring points, which are depicted in Figure 7. For a grade V rock mass, a minimum of 150 simulations are required to cover various scenarios. Statistical analysis of the simulation results allows for the determination of data distribution forms, mean values (E), standard deviations (D), and confidence intervals for each statistical indicator value concerning each rock mass grade.
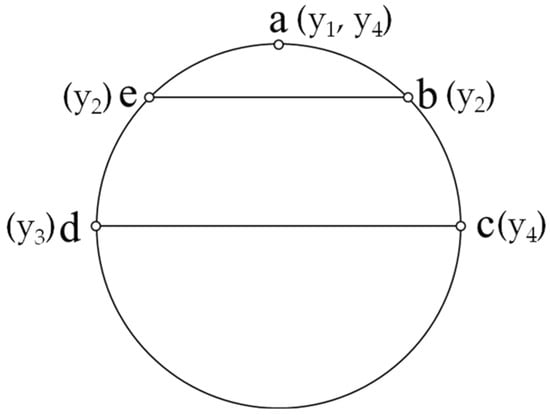
Figure 7.
Layout of measurement lines in the numerical model.
Based on the normal distribution forms of ultimate displacement and deformation velocity, along with the introduction of confidence intervals, mean values, variances, and confidence intervals were determined, as detailed in Table 3. The ultimate displacement values of each statistical indicator form a distribution region, showing a gradual increase as the burial depth increases. Notably, for rock mass grade V, characterized by poor rock mass quality, the impact of excavation disturbance on rock mass stress and displacement redistribution is more severe. This effect intensifies with increasing burial depth, leading to larger ultimate displacements and observable macroscopic phenomena, such as the spalling and peeling of shotcrete.
Table 3.
Ultimate displacement and deformation velocity in V-rock tunnels at varied depths.
The maximum and minimum values of displacement distribution, located at the interval boundaries, lack typical significance as indicators of potential issues. Statistical methods, employed to construct confidence intervals, assume that 95% of ultimate displacements fall within this interval range for each rock mass grade at each burial depth. Utilizing the upper limit of the confidence interval as the warning indicator value is thus deemed more reasonable than solely relying on the calculated maximum and minimum values [23,24].
4.2. Response Surface
The Multivariate Adaptive Regression Splines (MARS) method, introduced by Friedman [25], is a widely adopted non-parametric and non-linear statistical regression approach extensively utilized across diverse geotechnical engineering domains. Its applications encompass the prediction of liquefaction settlement during shallow foundation earthquakes [26], the estimation of displacements in multi-level support structures within excavations [27], and the assessment of spatially varying soil slope stability reliability [28]. The MARS model is constructed by a set of piecewise linear segments (splines) of different gradients, which are known as the basis functions (BFs) connected at knots. The MARS method is employed to conduct a sensitivity analysis, quantifying the impact of tunnel geometry and physical parameters on rock mass displacement and deformation velocity. Furthermore, leveraging the MARS model, this study elucidates intricate response relationships between tunnel rock mass displacement and deformation velocity and tunnel geometry and physical parameters. Analytical expressions for crown settlement, relative displacement at the crown shoulder, relative displacement at the crown waist, and deformation velocity are established, as depicted in Table 4, Table 5, Table 6 and Table 7.
Table 4.
Basis functions and expressions of the MARS model for vault settlement.
Table 5.
MARS model basis functions and expressions for shoulder relative displacement.
Table 6.
MARS model basis functions and expressions for arch waist relative displacement.
Table 7.
MARS model basis functions and expressions for deformation velocity.
Figure 8 illustrates the results of the sensitivity analysis performed on the influencing factors of the selected warning indicators. Among the input variables, tunnel burial depth emerges as the most critical parameter for crown settlement, deformation velocity, relative displacement at the crown shoulder, and relative convergence at the crown waist. Conversely, the influence of tunnel diameter is relatively minor. Specifically, for relative displacement at the crown shoulder and waist, the relative importance coefficients are only 0.15 and 0.16, respectively. The BQ value, representing the quality of the tunnel rock mass, holds a central position. Its relative importance coefficients are 0.62, 0.55, 0.58, and 0.63 for crown settlement, deformation velocity, relative displacement at the crown shoulder, and relative convergence at the crown waist, respectively.
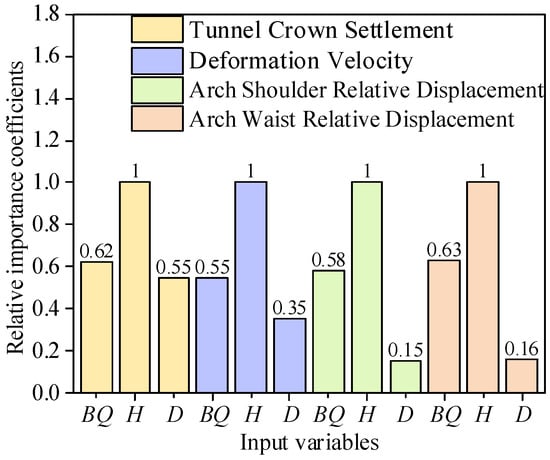
Figure 8.
Sensitivity analysis of tunnel rock mass quality index (BQ), burial depth (H), and diameter (D).
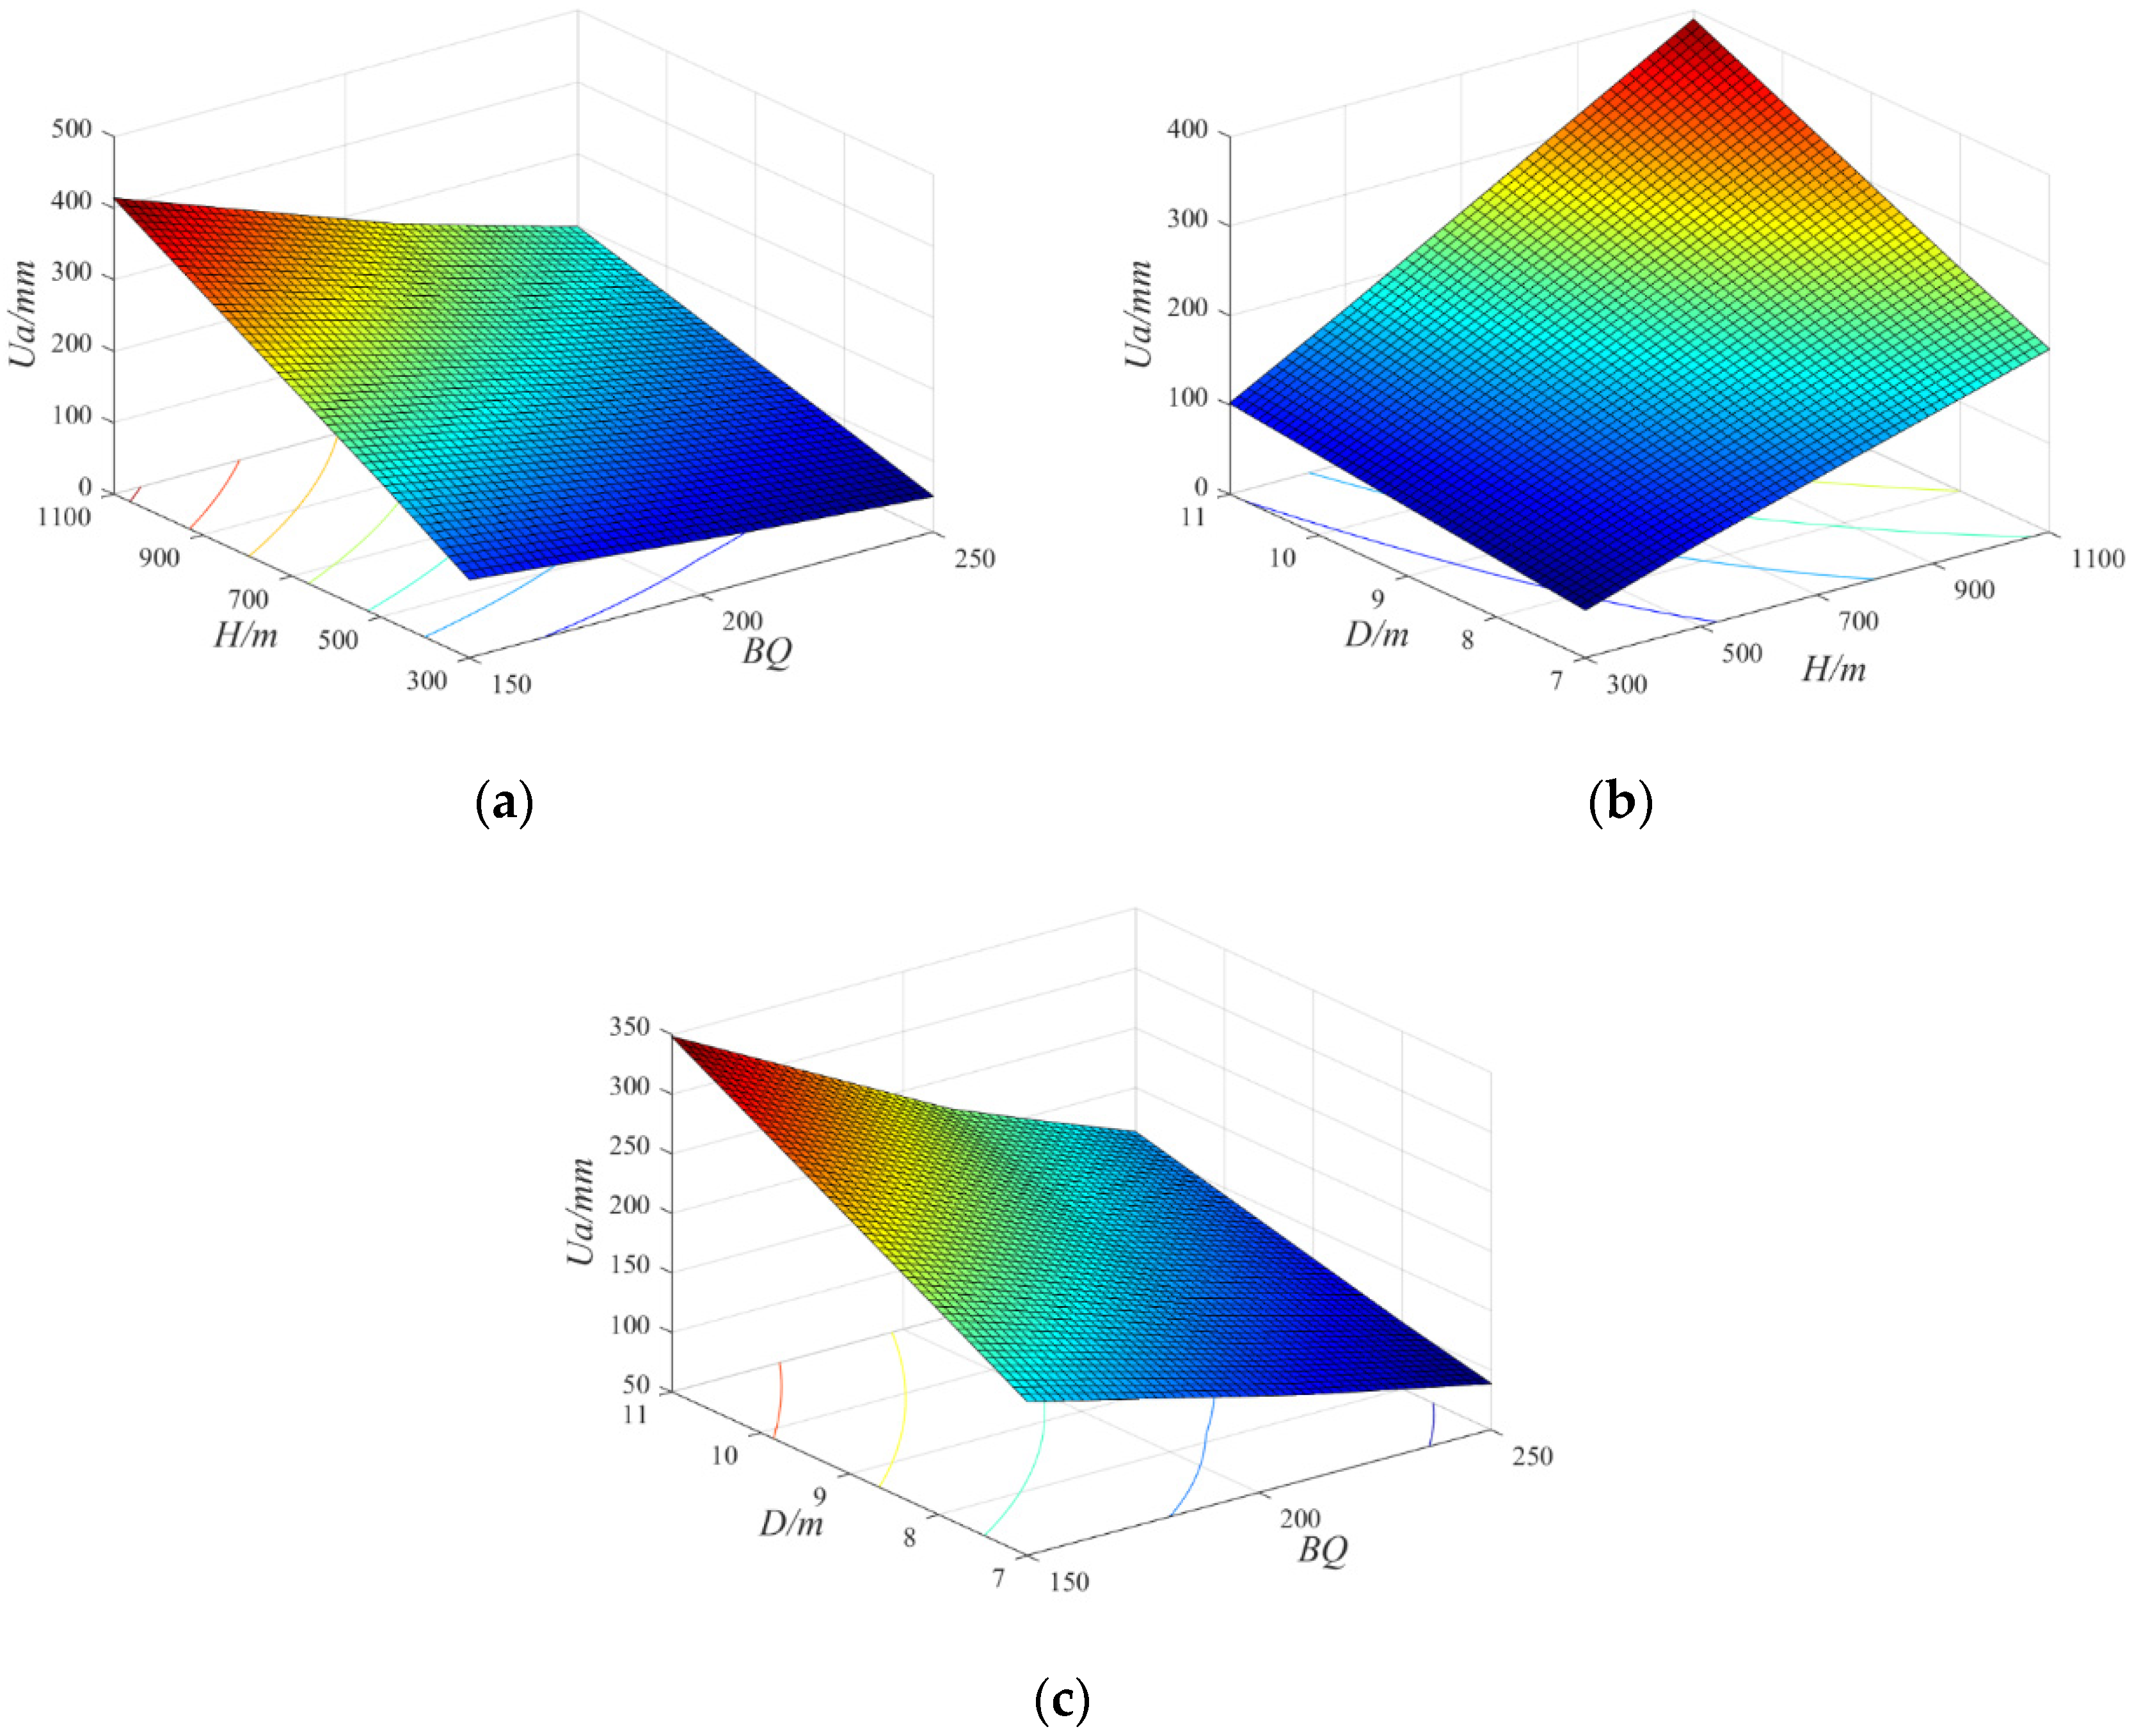
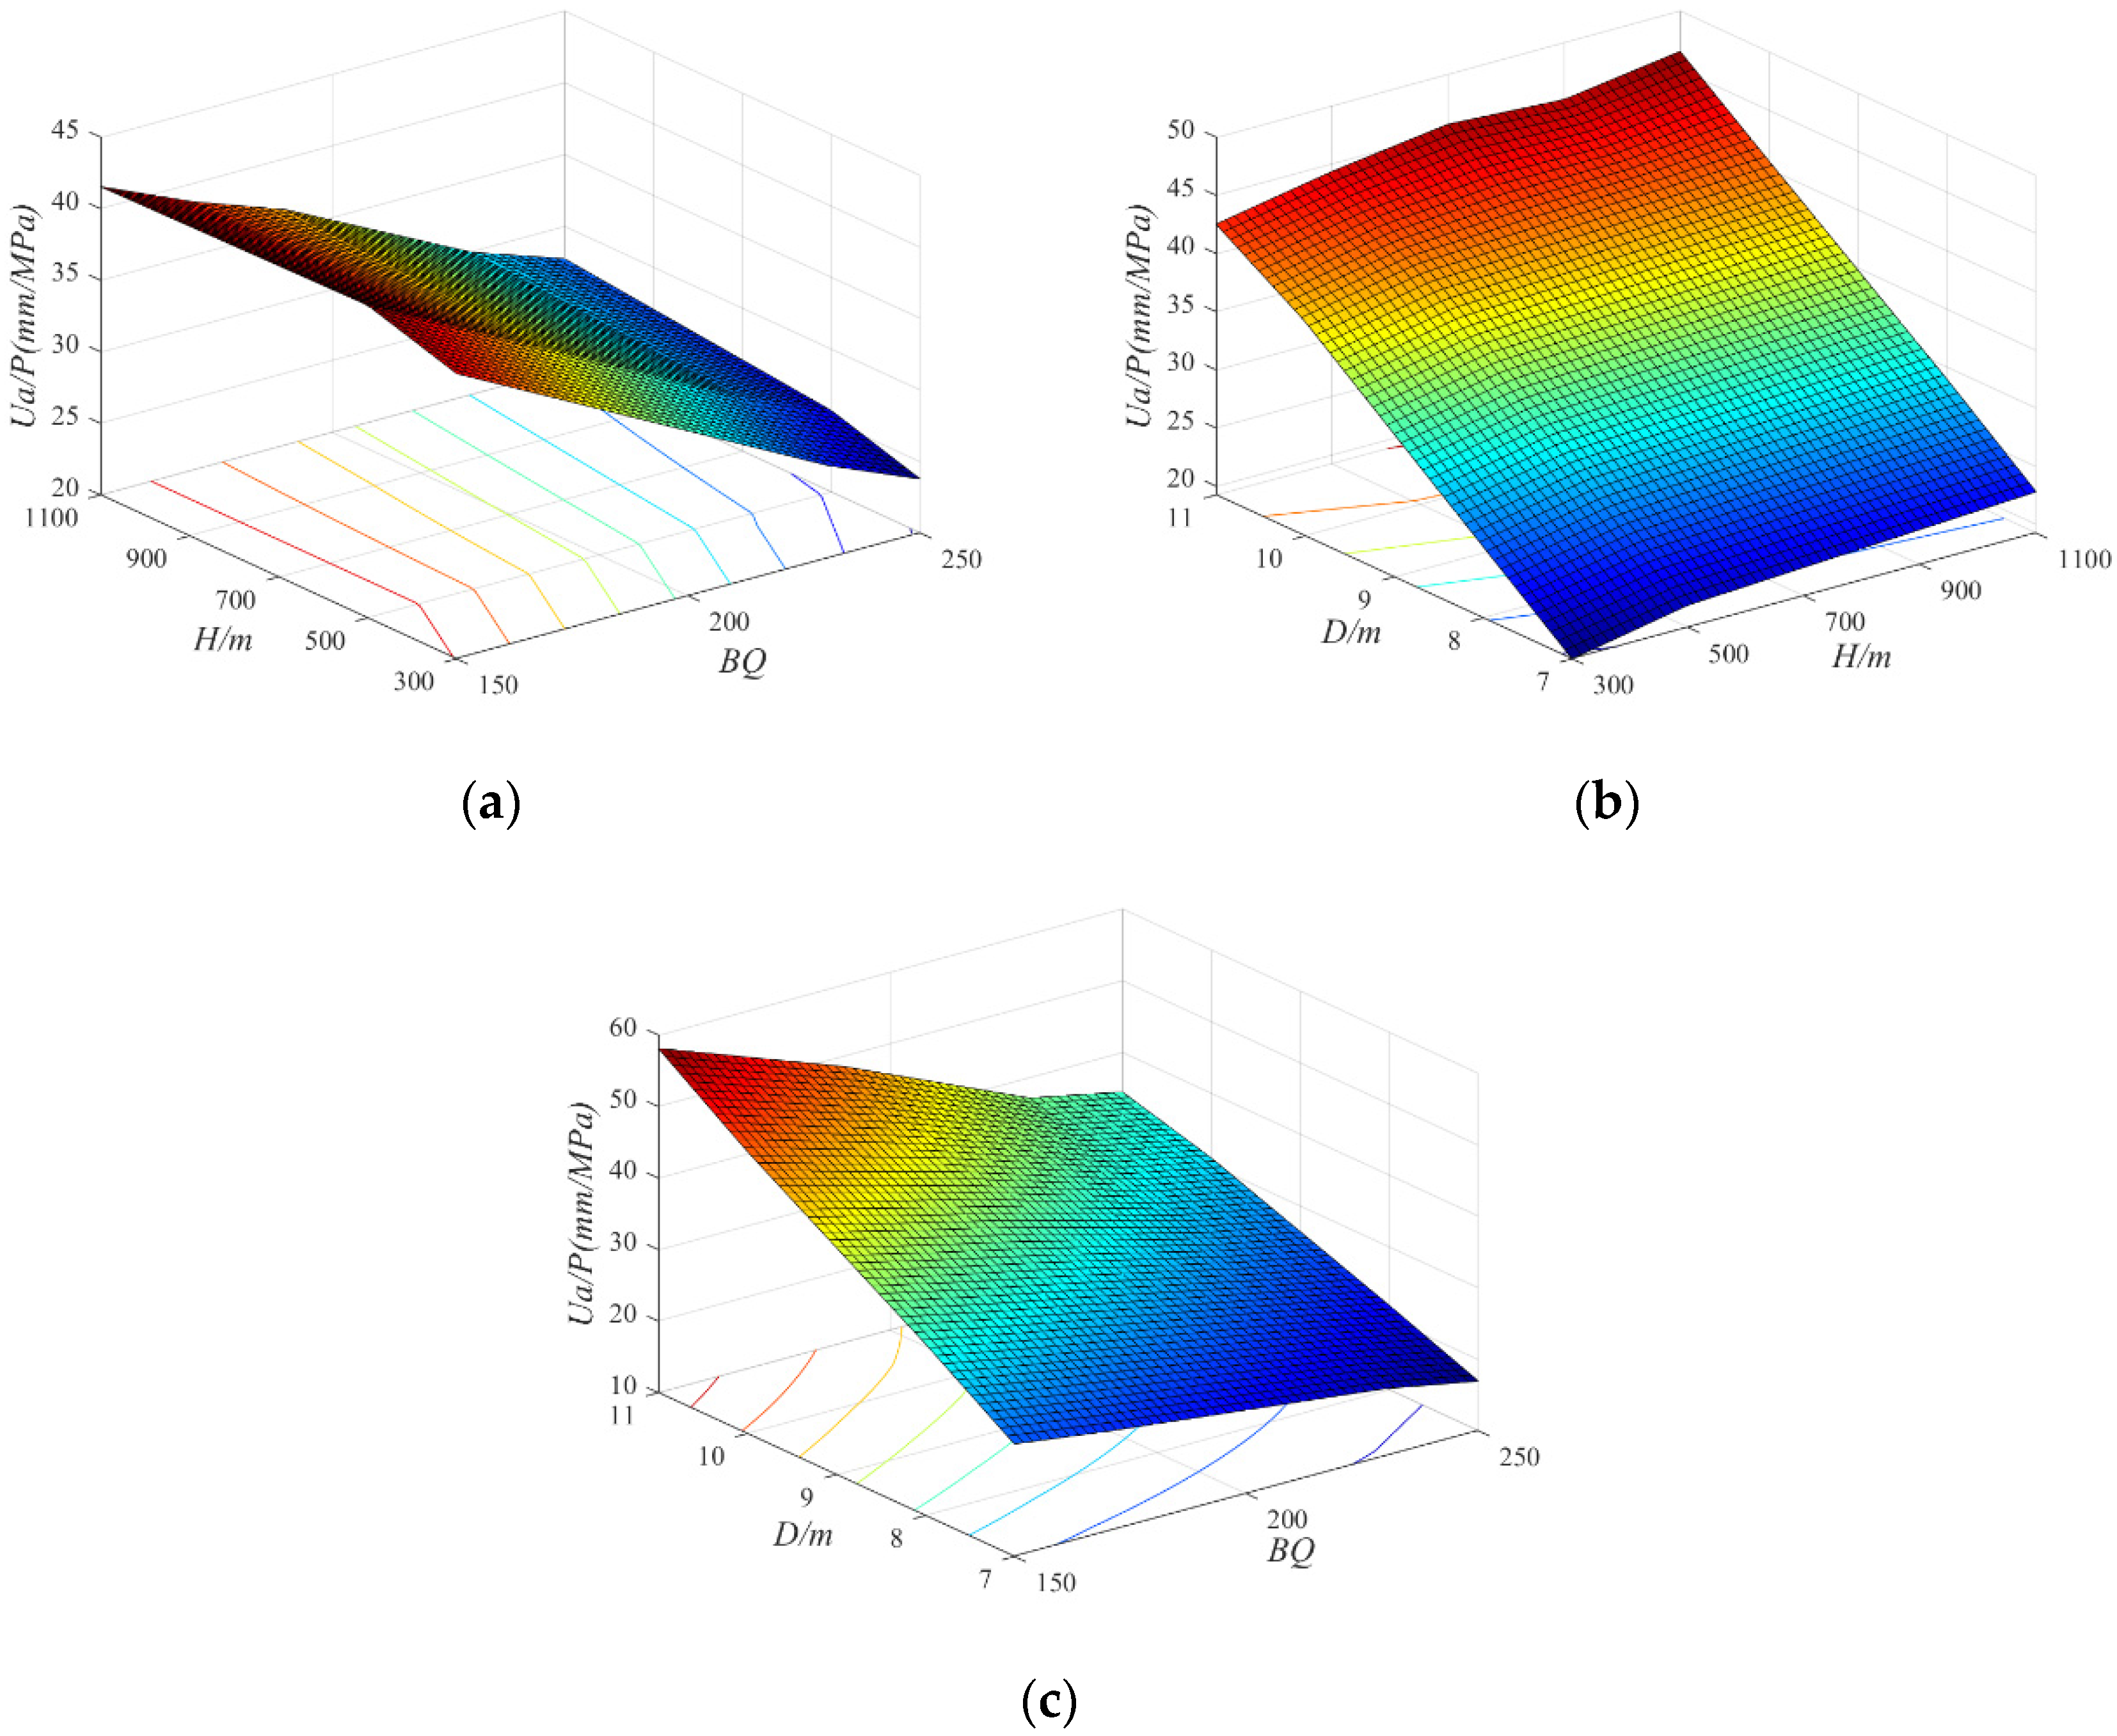
The interactive effects of tunnel rock mass quality index BQ, tunnel burial depth H, and diameter D are considered. These effects on crown settlement, relative displacement at the crown shoulder, relative displacement at the crown waist, and deformation velocity are analyzed separately, as depicted in Figure 9, Figure 10, Figure 11 and Figure 12. The results indicate that for small burial depths, large BQ values, and small tunnel diameters, the ultimate displacement and deformation velocity show minimal variation. With decreasing rock mass quality, tunnel burial depth and diameter increase, leading to continuous increases in ultimate displacement and deformation velocity. Conversely, improvements in rock mass quality, accompanied by decreases in tunnel burial depth and diameter, result in steady decreases in ultimate displacement and deformation velocity. Utilizing the response surfaces of ultimate displacement enables the efficient evaluation of these parameters under specific conditions of rock mass quality, tunnel burial depth, and tunnel diameter.
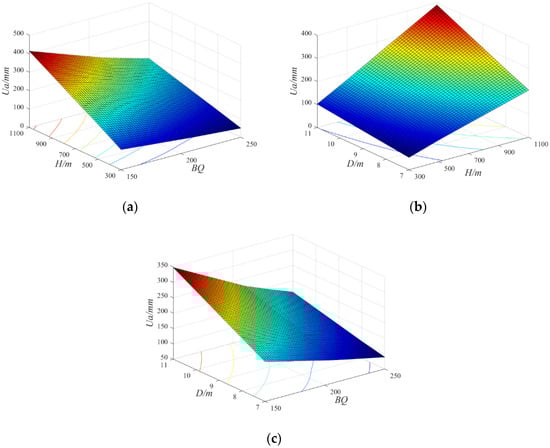
Figure 9.
Response surface of maximum settlement at the crown: (a–c) are the response surfaces of arch crown settlement with respect to variations in H and BQ, D and H, and D and BQ, respectively.
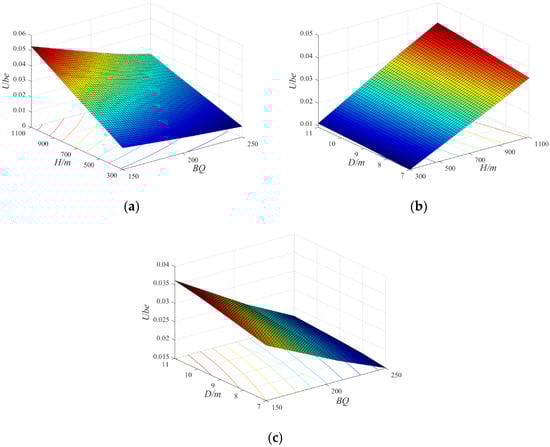
Figure 10.
Response surface of relative maximum displacement at the shoulder: (a–c) are the response surfaces of shoulder relative displacement with respect to variations in H and BQ, D and H, and D and BQ, respectively.
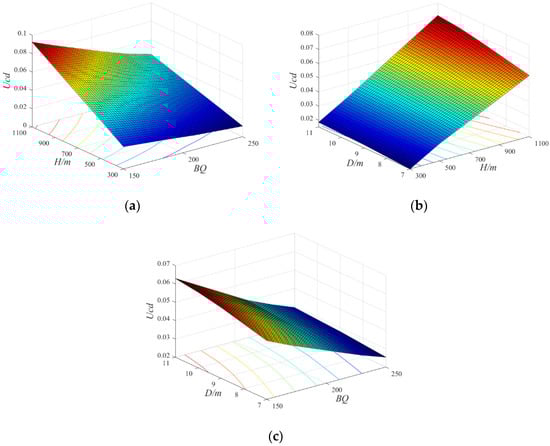
Figure 11.
Response surface of relative maximum displacement at the arch waist: (a–c) are the response surfaces of waist relative displacement with respect to variations in H and BQ, D and H, and D and BQ, respectively.

Figure 12.
Response surface of maximum deformation velocity: (a–c) are the response surfaces of deformation velocity with respect to variations in H and BQ, D and H, and D and BQ, respectively.
5. Conclusions
This study expands upon the significance of limit states and the methodologies for determining limit displacements and deformation velocities. It employs a continuum model to simulate tunnel excavation under diverse conditions, considering parameters such as rock mass quality (BQ), tunnel depth, and diameter. Statistical methods are utilized to analyze simulation data, thereby establishing predictive models for rock mass warning levels. Additionally, sensitivity analyses and quantifications of the coupled effects of influential parameters on warning indicators are performed using the MARS model. Response surfaces for limit displacement and deformation velocity, accounting for rock mass quality, tunnel depth, and diameter, are developed to complement the warning models. The corresponding conclusions are presented as follows:
- (1)
- A finite different model for tunnel excavation is established based on the stress release process. Using this model, a standardized criterion of the point where a notable surge in displacement with the stress release process is observed is developed for assessing tunnel instability. This point is defined as the limit state of the tunnel. The observed displacement at this point is regarded as the limit displacement, and the slope is regarded as the deformation velocity.
- (2)
- As tunnel excavation depths and diameters increase, there is a corresponding gradual increase in both the limit displacement and deformation velocity. This trend is particularly pronounced in scenarios involving deeper excavations and larger diameters, where the rock mass quality is lower. These observations emphasize the complex interplay between rock mass characteristics, tunnel geometry, and stability considerations, underscoring the need for meticulous planning in tunneling projects.
- (3)
- The sensitivity analysis conducted by the MARS model reveals that tunnel depth exerts the most substantial influence on warning indicator values, followed closely by rock mass quality (BQ). Conversely, tunnel diameter exhibits the least impact on these indicators. This comprehensive evaluation provides valuable insights into the relative importance of each parameter at the design stage of tunnel, offering pertinent information for engineering decision making and design optimization.
- (4)
- A series of response surfaces is developed to enhance the prediction of limit displacement and deformation velocity for tunnels under diverse scenarios. The rock mass quality, tunnel depth, and diameter are considered in these surfaces. Their utilization helps engineers with the evaluation of tunnel stability, and allows for a better understanding of the parameters and more accurate predictions for displacement and deformation velocity.
Note that the derived values for limit displacement, while based on the existing theoretical framework and comprehension level, only partially characterize and guide the limit displacement and deformation velocity of tunnel excavation. It is essential to acknowledge that the stability analysis of tunnel excavation presents a multifaceted, multidimensional challenge, requiring continuous theoretical advancements and deeper insights into tunnel excavation. These efforts are necessary for refining warning models with greater precision and enhancing our understanding of tunnel stability.
Author Contributions
Conceptualization, methodology, F.G.; writing—original draft, methodology, X.Y.; software, investigation, Y.S.; writing—review and editing, C.S.; writing—review and editing, B.Z.; resources, H.P.; writing—review and editing, supervision, H.Z. All authors have read and agreed to the published version of the manuscript.
Funding
This research was supported by the National Key Research and Development Program of China (No. 2022YFC30044402) and the Science and Technology Project of Guizhou, China (No. QKH[2023]251). The authors appreciate the financial support.
Data Availability Statement
Data are contained within the article.
Conflicts of Interest
Authors Fawang Guo, Baoqiang Zhu and Hao Peng were employed by the company Power China Guiyang Engineering Corporation Limited. Author Chunyong Shen was employed by the company Power China Renewable Energy Development Co., Ltd. The remaining authors declare that the research was conducted in the absence of any commercial or financial relationships that could be construed as a potential conflict of interest.
References
- Carranza-Torres, C.; Fairhurst, C. The elasto-plastic response of underground excavations in rock masses that satisfy the Hoek-Brown failure criterion. Int. J. Rock Mech. Min. 1999, 36, 777–809. [Google Scholar] [CrossRef]
- Oreste, P.P. Analysis of structural interaction in tunnels using the covergence-confinement approach. Tunn. Undergr. Space Technol. 2003, 18, 347–363. [Google Scholar] [CrossRef]
- Xu, Y.; Li, Y.; Qiu, J. Application of Inclination Sensor in Real-Time Remote Monitoring System of Tunnel Structure Deformation. Wirel. Commun. Mob. Comput. 2022, 2022, 8079543. [Google Scholar] [CrossRef]
- Song, Y.; Liu, Y.; Zhu, Y. Application of response surface method to reliability analysis of monolithic lining of railway tunnel. Chin. J. Rock Mech. Eng. 2004, 23, 1847–1851. (In Chinese) [Google Scholar]
- Su, Y.; Fang, Z.; Gao, Q. Reliability Analysis on Special Underground Rockmass Space by Response Surface Method. Chin. J. Rock Mech. Eng. 2000, 19, 55–58. (In Chinese) [Google Scholar]
- Liu, P.L.; Liu, K.G. Selection of Random Field Mesh in Finite Element Reliability Analysis. J. Eng. Mech. 1993, 119, 667–680. [Google Scholar] [CrossRef]
- TB 10121-2007; Technical Specification for Monitoring Measurement of Railway Tunnel. PRC Ministry of Railways: Beijing, China, 2007.
- Wittke, W.; Pierau, B.; Erichsen, C. New Austrian Tunneling Method (NATM)–Stability Analysis and Design; WBI: Essen, Germany, 2006; Volume 2441. [Google Scholar]
- Tan, L.J.; Zhou, H.Q.; Chen, K.S. Discussion on highway tunnel monthitoring measurement control standards. Appl. Mech. Mater. 2014, 580, 1127–1133. [Google Scholar] [CrossRef]
- Skempton, A.W.; MacDonald, D.H. The allowable settlements of buildings. Proc. Inst. Civ. Eng. 1956, 5, 727–768. [Google Scholar] [CrossRef]
- Ning, Z. Discussion on Safety Prediction and Forecast of Tunnel Construction. Master’s Thesis, Southwest Jiaotong University, Chengdu, China, 2001. (In Chinese). [Google Scholar]
- Yu, W.; Zhou, M.; Liu, X. Deformation and Stability Analysis of Highway Tunnel Based on Monitoring Data. In Proceedings of the 11th National Conference on Rock Mechanics and Engineering, Trentino, Italy, 20–24 June 2010. [Google Scholar]
- Liu, X.; Su, J.; Wang, X. Statistical analysis on time effects and evaluation Index of deformation stability to NATM surrounding rock deformation. China Civ. Eng. J. 2009, 42, 115–120. (In Chinese) [Google Scholar]
- Wu, X.; Yang, X.; Li, Y.; Zhang, J. Research on Control Indices and Deformation Characteristic of Shallow Tunnel with Weak Interlayer. Chin. J. Rock Mech. Eng. 2014, 33, 2685–2691. (In Chinese) [Google Scholar]
- Jaky, J. Pressure in silos. In Proceedings of the Second International Conference on Soil Mechanics and Foundation Engineering, Rotterdam, The Netherlands, 21–30 June 1948; Volume 1, pp. 103–107. [Google Scholar]
- Carranza-Torres, C. Dimensionless graphical representation of the exact elasto-plastic solution of a circular tunnel in a Mohr-Coulomb material subject to uniform far-field stresses. Rock Mech. Rock Eng. 2003, 36, 237–253. [Google Scholar] [CrossRef]
- GB/T 50218-2014; Engineering Rock Mass Classification Standard. Ministry of Water Resources: Beijing, China, 2014.
- Qiao, L.; Liu, J.; Li, S.; Wang, Z.; Jiang, Y.; Wang, Z. Study of spatial effect of excavation face for underground facility and its application. Rock Soil Mech. 2014, 35, 481–487. (In Chinese) [Google Scholar]
- Carranza-Torres, C.; Fairhurst, C. Application of the convergence-confinement method of tunnel design to rock masses that satisfy the Hoek-Brown failure criterion. Tunn. Undergr. Space Technol. 2000, 15, 187–213. [Google Scholar] [CrossRef]
- Sun, Z. The Synergetic Principle and Design Method of Tunnel Support System. Ph.D. Thesis, Beijing Jiaotong University, Beijing, China, 2020. (In Chinese). [Google Scholar]
- Wu, S.; Geng, X.; Gao, Y.; Zhao, G.; Li, J.; Yan, Q. A study of the longitudinal deformation of tunnels based on the generalized Hoek-Brown failure criterion. Rock Soil Mech. 2015, 36, 946–952+987. [Google Scholar]
- Hoek, E. Hoek-Brown failure criterion-2002 edition. In Proceedings of the Fifth North American Rock Mechanics Symposium, Toronto, ON, Canada, 7–10 July 2002; Volume 1, pp. 18–22. [Google Scholar]
- Zhu, Y.; Zhang, S.; Jing, S. Concept and Determination of limit Displacements of Primary Support System of Railway Tunnel. Chin. J. Rock Mech. Eng. 2005, 24, 1594–1598. (In Chinese) [Google Scholar]
- Wu, C. R&D and Application of Construction Monitoring and Collapse Dynamic Analysis Pre-Warning System for Tunnel. Master’s Thesis, Chengdu University of Technology, Chengdu, China, 2017. (In Chinese). [Google Scholar]
- Friedman, J.H. Multivariate Adaptive Regression Splines. Ann. Stat. 1991, 19, 1–67. [Google Scholar] [CrossRef]
- Zheng, G.; Zhang, W.; Zhou, H.; Yang, P. Multivariate adaptive regression splines model for prediction of the liquefaction-induced settlement of shallow foundations. Soil Dyn. Earthq. Eng. 2020, 132, 106097. [Google Scholar] [CrossRef]
- Zhou, H.-Z.; Zheng, G.; He, X.-P.; Wang, E.-Y.; Guo, Z.-Y.; Nie, D.-Q.; Ma, S.-K. Numerical modelling of retaining structure displacements in multi-bench retained excavations. Acta Geotech. 2020, 15, 2691–2703. [Google Scholar] [CrossRef]
- Liu, L.; Zhang, S.; Cheng, Y.-M.; Liang, L. Advanced reliability analysis of slopes in spatially variable soils using multivariate adaptive regression splines. Geosci. Front. 2019, 10, 671–682. [Google Scholar] [CrossRef]


Disclaimer/Publisher’s Note: The statements, opinions and data contained in all publications are solely those of the individual author(s) and contributor(s) and not of MDPI and/or the editor(s). MDPI and/or the editor(s) disclaim responsibility for any injury to people or property resulting from any ideas, methods, instructions or products referred to in the content. |
© 2024 by the authors. Licensee MDPI, Basel, Switzerland. This article is an open access article distributed under the terms and conditions of the Creative Commons Attribution (CC BY) license (https://creativecommons.org/licenses/by/4.0/).