Abstract
The rock classification system was initially applied to drill-and-blast tunnels and subsequently adapted for TBM tunnels; however, the majority of these systems primarily focused on rock stability while neglecting considerations of boreability. Compared with conventional tunnels, TBM tunnels are characterized by their rapid tunneling speed and excellent self-stabilization of the rock mass. Therefore, it is imperative to develop a novel rock mass classification system that considers both the tunneling efficiency of TBMs and the required support measures for tunnel construction. This paper introduces a novel rock classification system for TBM tunnels that accurately predicts the construction rate by evaluating the penetration rate and daily utilization, enabling a more precise assessment of daily advancement in tunneling. Firstly, the penetration rate and construction utilization in different rock strata are analyzed based on comprehensive statistics of existing construction data. Consequently, a discriminant matrix for classifying the boreability of rock is derived. Subsequently, employing the Ensemble Classifier method, a regression prediction model for rock boreability classification is established by incorporating input parameters such as thrust, torque, rotational speed, field penetration index, and the uniaxial compressive strength of rock. The validity of the proposed model is verified by comparing predicted machine performance with actual data sets. The proposed method presents a novel approach for predicting the performance of TBM construction.
1. Introduction
A tunnel boring machine or TBM has evolved to be a rather high-tech piece of equipment that integrates multiple components to allow for near-continuous excavation of the rock. Hard rock TBMs have played an important role in the advancement of tunnel construction in the last few decades and have set many world records in tunneling, unmatched by conventional tunneling or shield tunneling in soft ground applications. When tunneling through complex geological conditions, TBMs often encounter mixed soft and hard strata, which can significantly impact the penetration rate and working hours, making it difficult to accurately predict advancements [1,2].
There have been many studies on the performance prediction of TBMs since the 1980s [3,4,5]. There are several performance prediction models for TBMs that have attempted to include rock conditions by incorporating the existing rock mass classification systems or their input parameters [6,7,8,9,10,11]. The main obstacle in improving TBM performance prediction in complex geological conditions is to figure out the relationship between machine operational parameters and geological parameters [12,13,14,15,16,17,18,19,20]. Rostami [21] maintained that the accuracy of estimating machine performance in complex ground is still very low. Therefore, it is necessary to identify the geological conditions and predict the behavior of the surrounding rock in front of the cutterhead in TBM operations [22]. The relationship between the machine parameters and penetration rate can offer some information about the rock mass at the face and identify potential issues [1,23,24,25,26]. Analysis of TBM operational parameters can offer some insight into the behavior of the surrounding rocks during the tunneling process.
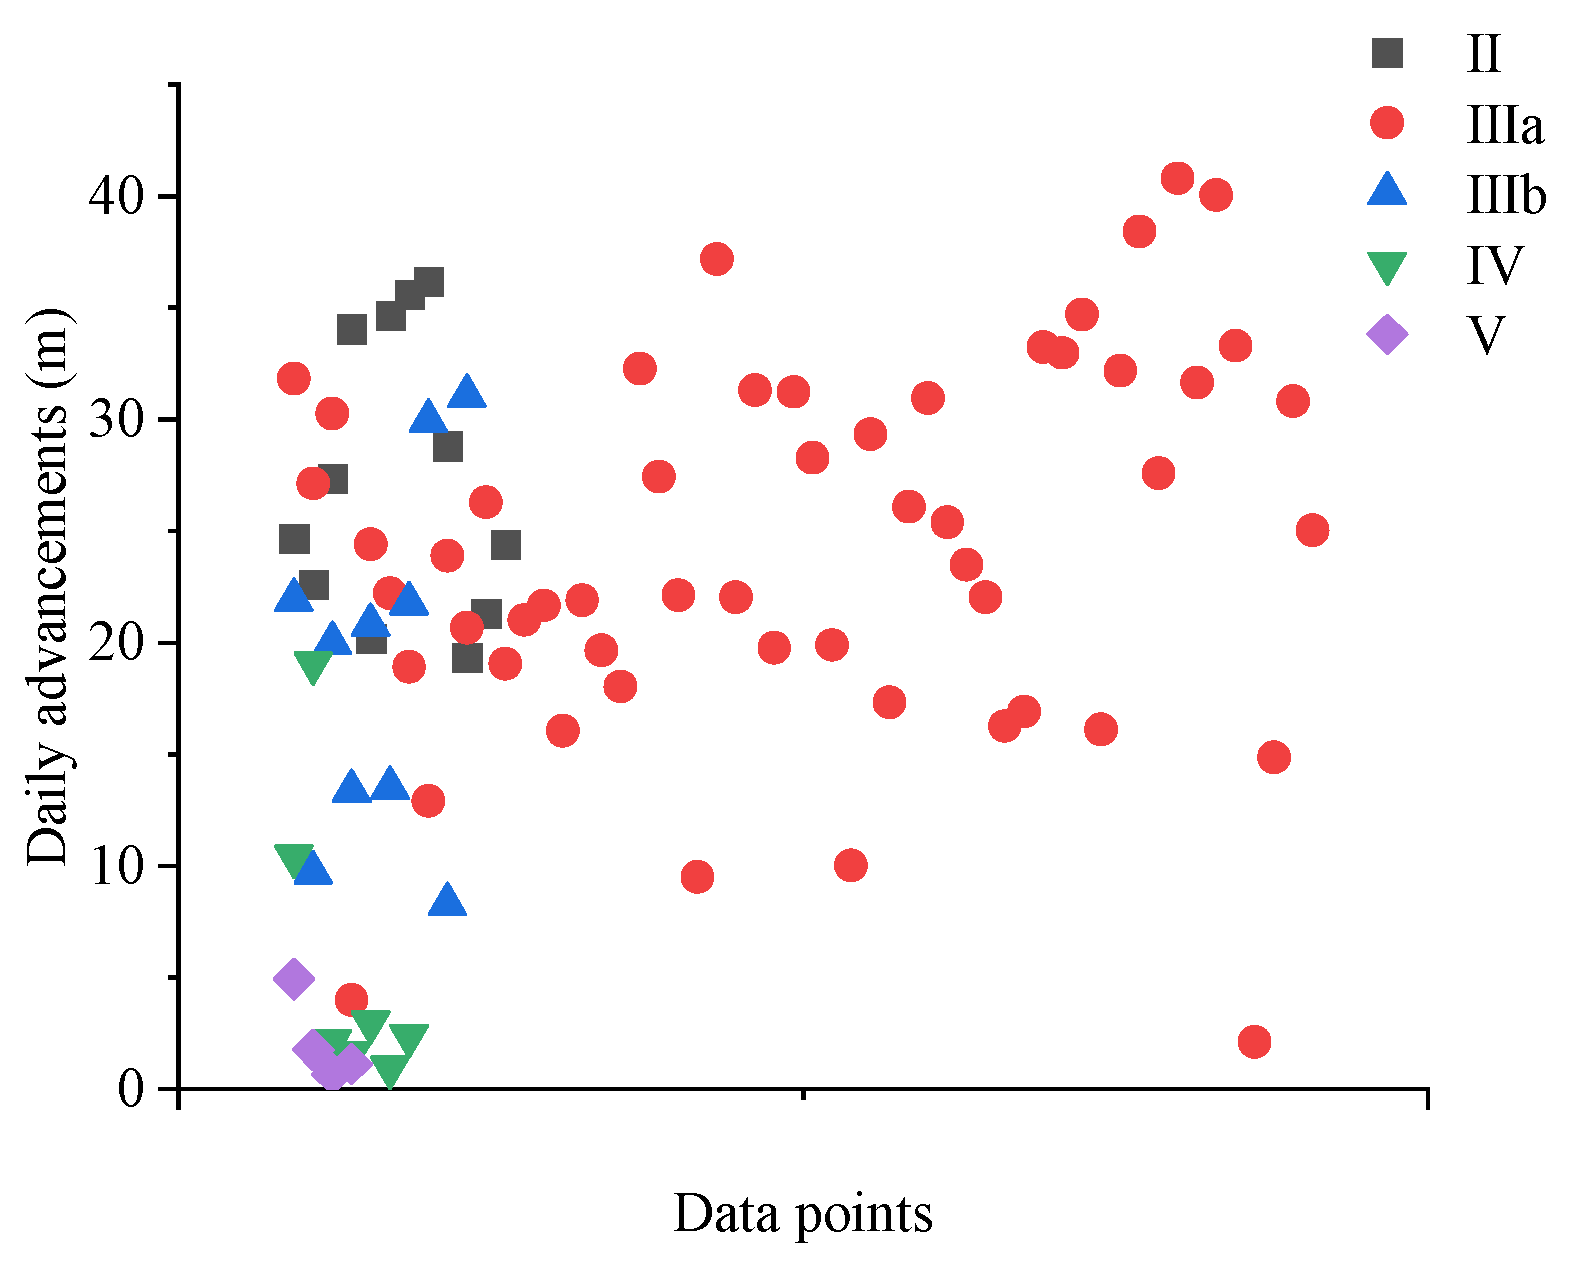
A common method for TBM performance prediction is combining TBM performance with the classification of surrounding rock mass [27]. Innaurato [28] improved Cassinelli’s [4] TBM prediction model by adding uniaxial compressive strength. One of the most famous TBM prediction models based on rock mass classification is the QTBM proposed by Barton [29]. This classification method is based on an extended version of the Q system and takes all rock and machine parameters that affect the advance speed into account. Alber presented RMRTBM, which is a modified RMR system for use in TBM tunneling projects [3,11]. Sapigni presented an improved RMR system for TBM construction, which indicated TBM performance reaches a maximum in the rock mass rating (RMR) range of 40–70 [30]. Bieniawski proposed the concept of the rock mass excavability (RME) index, which the authors found very effective in predicting the excavability of rock masses by TBMs using quantification of TBM performance [31]. By employing multiple and polynomial regression analyses on field data, Khademi attempted to provide a functional predictor equation of the TBM field penetration index (FPI) by using the RMR rock mass classification system [32]. Frough [33] examined the relationship between the rock mass conditions, essentially described by the rock mass rating system (RMR) and TBM performance parameters using field data. Salimi studied the possibility of developing a new rock mass classification system for TBM application by using site-specific models and Genetic Programming (GP) for the analysis of a TBM performance relative to the ground condition data [34]. Although the aforementioned studies have conducted targeted investigations on TBMs and considered the correlation between surrounding rock and driving parameters, they have not accounted for the influence of nonconstruction factors, thus impeding accurate prediction of actual construction advancements. As illustrated in Figure 1, there is no obvious relationship between traditional classification levels (II, IIIa, IIIb, IV, Ⅴ) and daily advancements.

Figure 1.
Relationship between traditional classification levels and daily advancements.
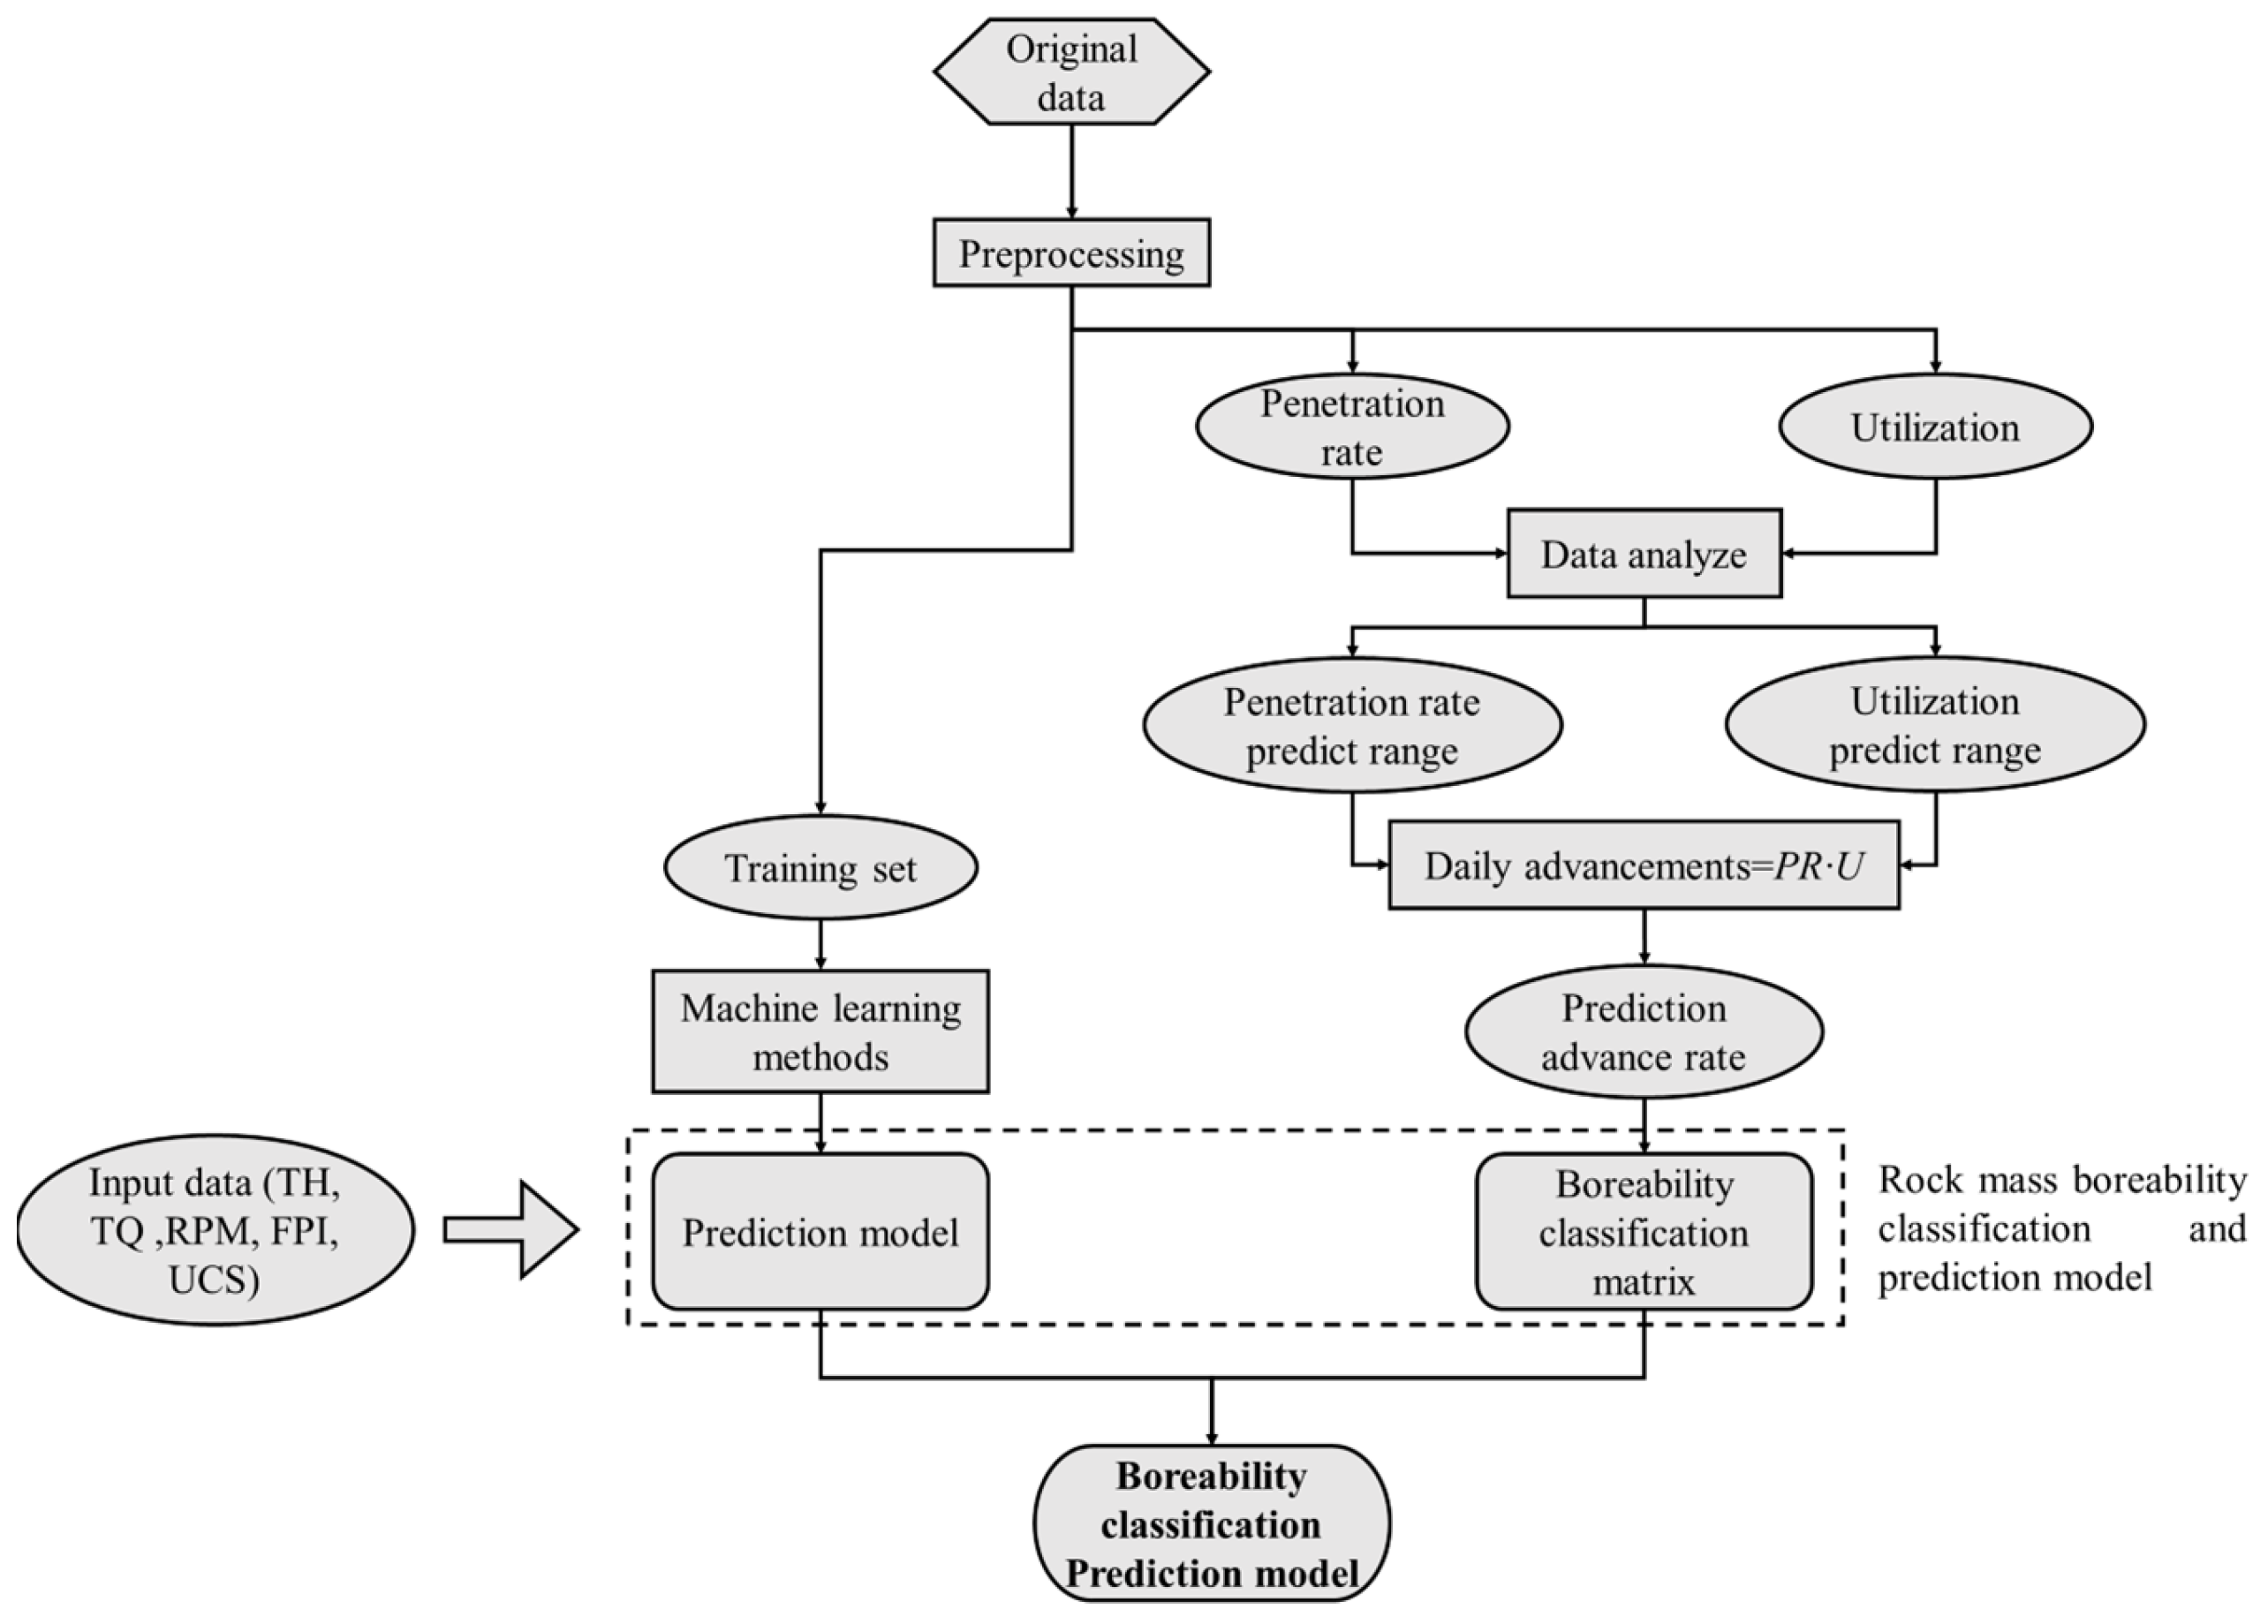
This paper introduces a new method of classifying and predicting rock mass for assessing rock boreability based on the analysis of driving parameters and the corresponding rock parameters, as shown in Figure 2. Firstly, the classification criteria for rock boreability based on penetration rate and utilization are established, leading to the development of a classification matrix as presented in Section 2 of this paper. Subsequently, machine learning methods are employed to establish a predictive model for new boreability classifications by correlating geological and machine operational parameters, as presented in Section 3 of this paper. In Section 4, the accuracy of this novel prediction model is validated through case studies, providing valuable insights for construction departments and facilitating better preparation.
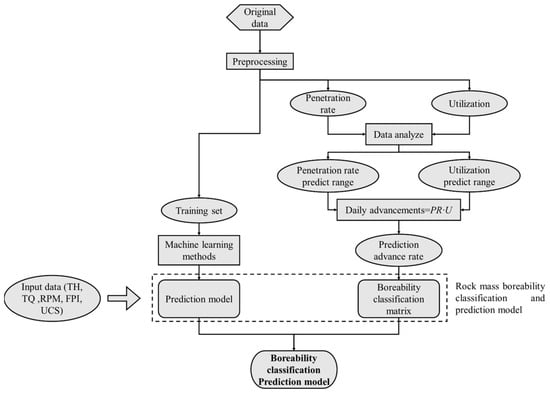
Figure 2.
Flow chart of the research.
The research content of this paper can be divided into two parts:
(1) According to the TBM’s surrounding rock boreability classification matrix, the surrounding rock boreability classification of the construction tunnel can be classified based on penetration rate and utilization.
(2) By adopting the machine parameters, rock parameters, and comprehensive parameters, i.e., TQ, RPM, TH, UCS, and FPI above, as the predictive input parameters, the boreability level can be used as the output result, and the machine learning methods can be used to establish the surrounding rock boreability prediction model.
2. TBM Boreability Classification System
2.1. Project Overview
This research project is a component of the water conservancy initiative in western China. It entails the excavation of a 26.041 km long tunnel with a diameter of 7800 mm, making it the longest hydraulic tunnel ever excavated by a single TBM in China. The project site ranges in altitude from 650 m to 800 m, with a general elevation difference between 10 m and 20 m, and certain areas experience height differences of up to 70 m. Along its alignment, the tunnel traverses Hualixi period granite, Carboniferous tuffaceous sandstone, and black cloud quartzite formations. The depth of the tunnel varies from 40 m to 160 m. Table 1 presents key technical parameters for the TBM employed in this endeavor.

Table 1.
Key technical parameters of the TBM employed for the project.
According to the geological investigation of the ground and analysis of borehole data along the tunnel alignment, the exposed strata lithology mainly consists of Devonian Middle Altay Formation (D2a) monzonite gneiss and monzonite granulite; Carboniferous upper system CzK group (C3K) tuffaceous sandstone, biotite oblique gneiss, and black cloud quartzite; and late Hualixi (γ33b) granite, biotite hornblende plagioclase. This project is situated between the trough zone and compression zone in the middle of a fold system. These two secondary tectonic units are bounded by faults: a geotrough fold belt in the north and a compression belt in the south. Regional features include 54 faults and shear zones such as f43, f55, f58~f61, f73~f75, and f106~f127. The fault zones generally have a width ranging from 5 to 30 m consisting mainly of mylonites and fractured rock.
The project area primarily lies within low hilly areas with scarce surface water resources. Only rivers adjacent to reservoirs carry notable amounts of water near the project area. The water supply in this region mainly comes from ice and snow meltwater in mountainous areas followed by seasonal precipitation. Based on differences in water storage medium and groundwater burial conditions, groundwater types within this project area mainly include Quaternary loose deposit pore diving, clastic rock pore-fracture water, and bedrock fissure water without a unified groundwater level or confrontation. Testing samples from this area revealed that groundwater exhibits medium-to-strong corrosive behavior, including weak-to-moderately corrosive steel bars within reinforced concrete lining, as well as moderately corrosive steel structures directly exposed to incoming fluids.
2.2. Penetration Rate and Utilization
Typical rock mass classification systems focus on the analysis of face and surrounding conditions to assess tunnel stability. However, the proper selection of the driving parameters to match the geological conditions plays a decisive role in the efficiency of tunneling. It is necessary to establish a new rock classification method from the perspective of tunneling efficiency to distinguish the boreability of the ground, where the higher the boreability, the higher the tunneling efficiency, indicating more efficient, faster, and easier tunneling. Simultaneously, the stability of surrounding rock is also influenced by the strength of the rock stratum, with accidents such as deformation and collapse commonly occurring in soft rock formations. These incidents lead to reduced utilization and daily advancements. The focus of this paper lies in the pivotal role of daily advancements in assessing rock boreability, which is contingent upon both penetration rate and utilization.
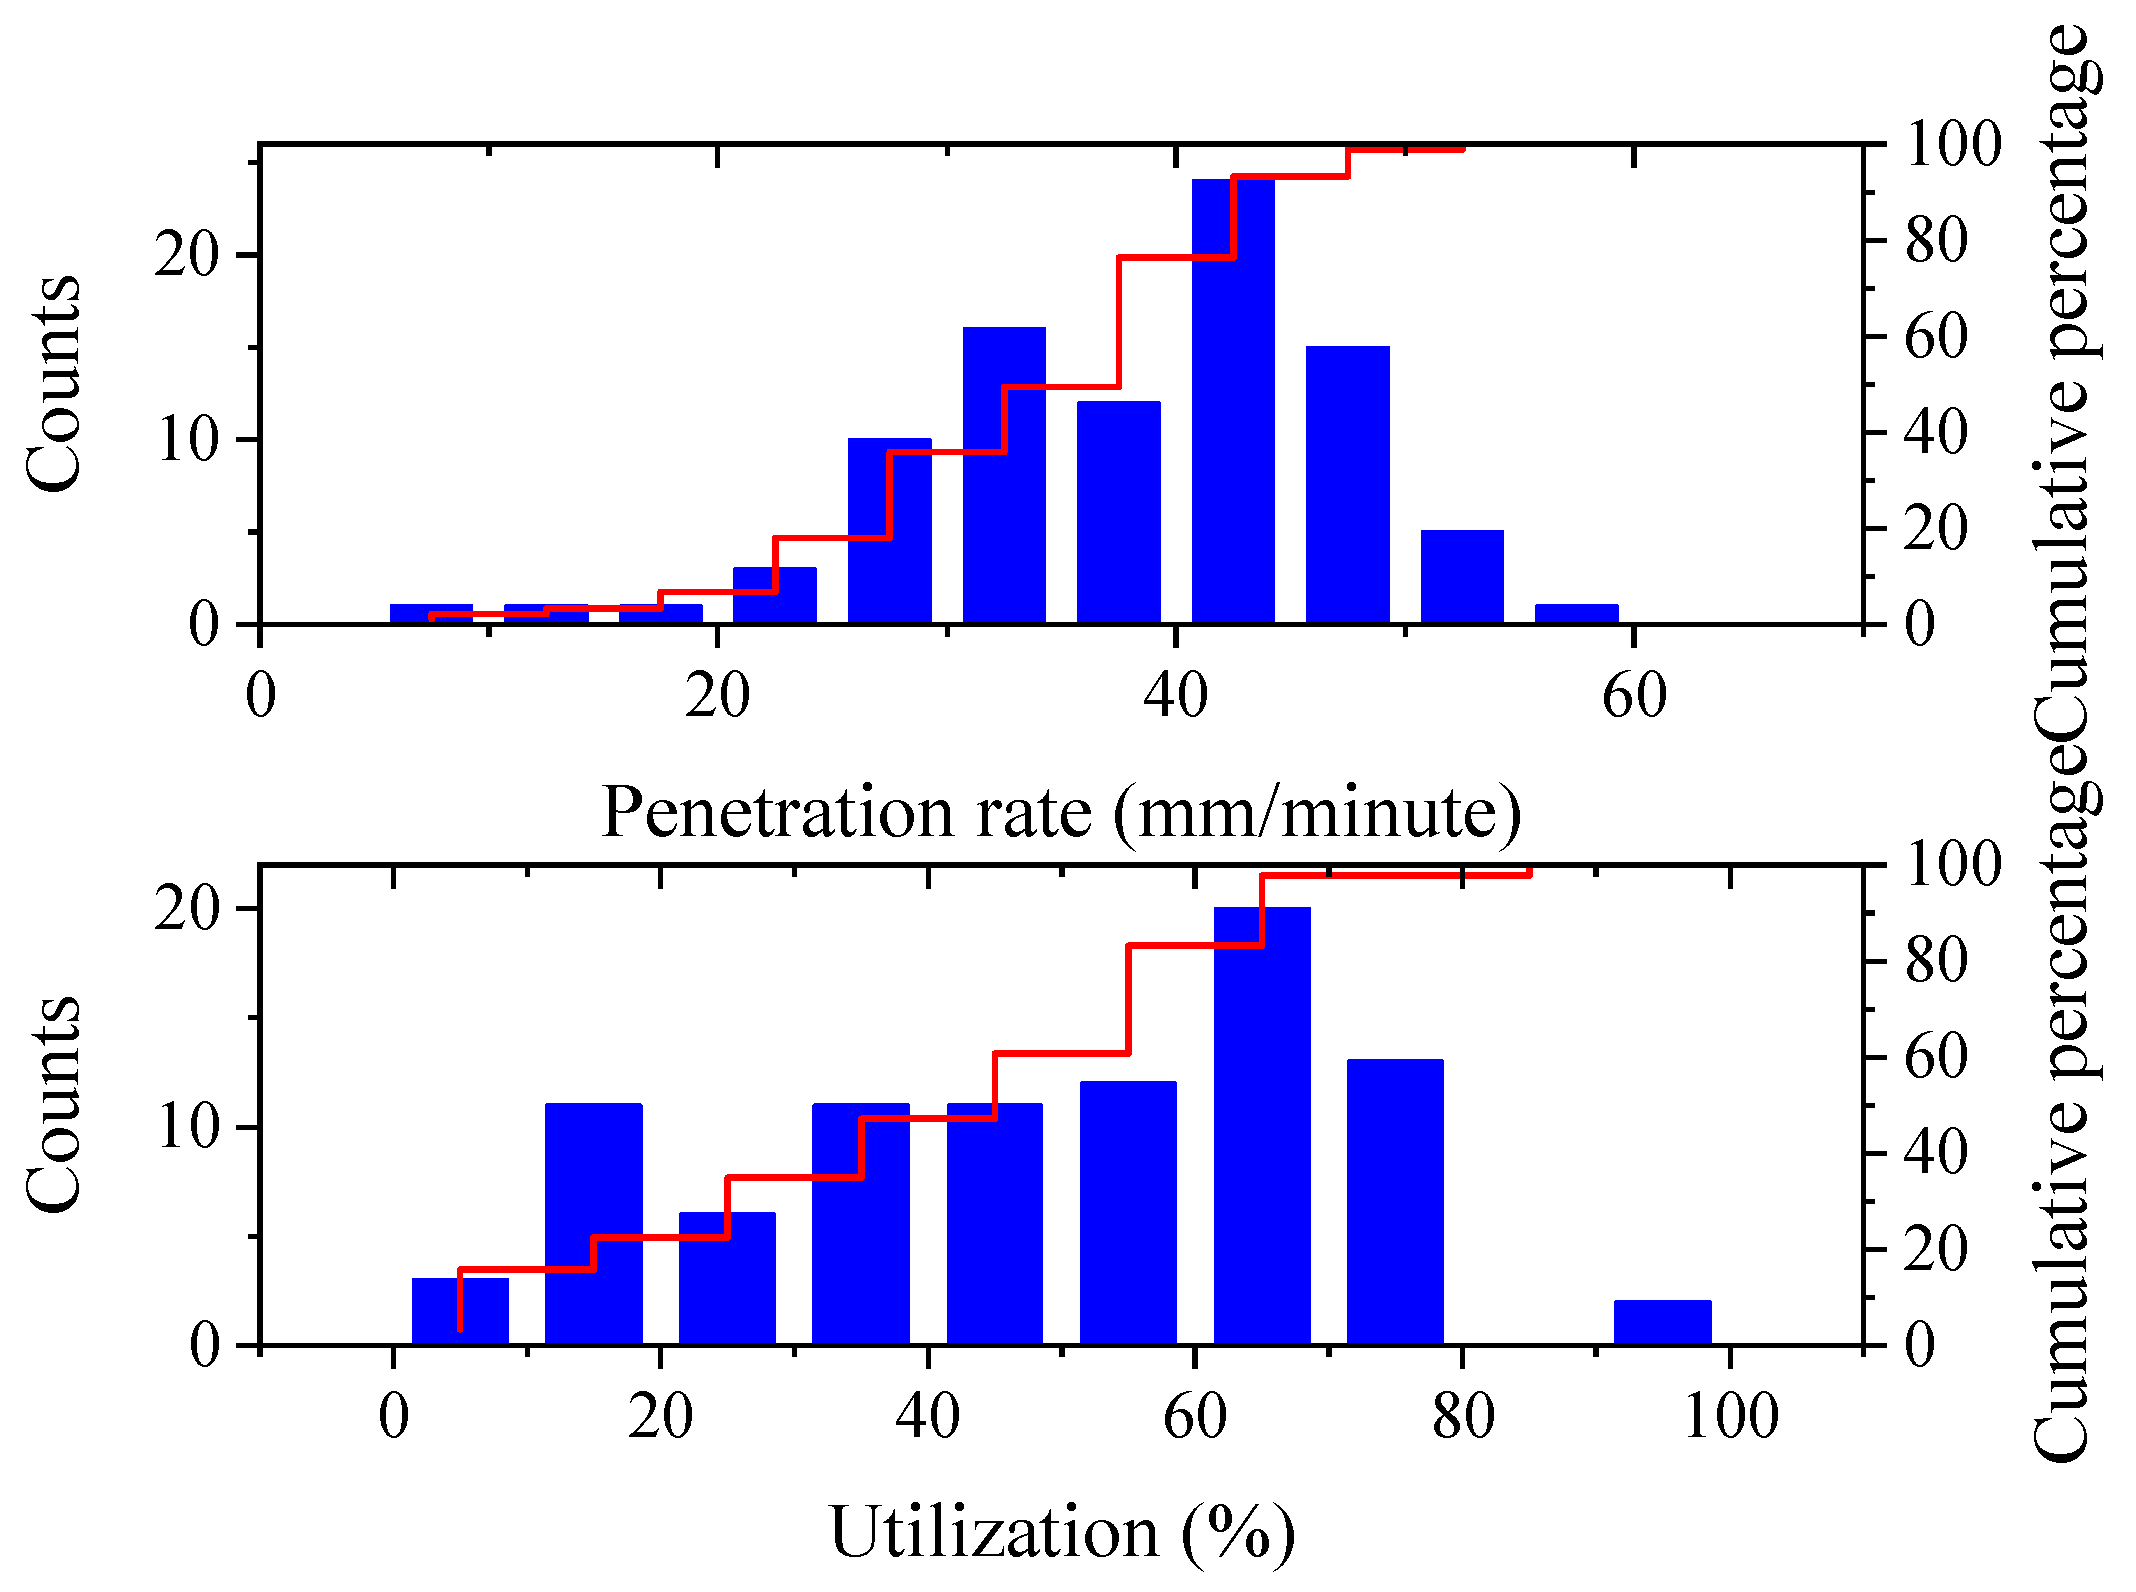
The penetration rate (PR) refers to the distance tunneled by a machine during a unit operation time while it is cutting through the rock. Typically, the penetration rate falls within the range of 25 to 50 (mm·min−1). It is determined by both the cutter’s penetration (p) and its rotation speed. Consequently, PR is closely linked to operational parameters and rock mass properties. Figure 2 presents the research data on penetration rates, which vary from 0 to 60 mm/min with an average value of approximately 35 mm/min.
Utilization is defined as the ratio of tunneling time to total time, where the total time is the sum of TBM downtime and boring time [35], and the typical utilization ranges from 20% to 60%. The downtime primarily encompasses the time required for parameter adjustments, equipment maintenance and overhaul, and surrounding rock support operations, as well as any unplanned interruptions caused by accidents. The utilization can reflect whether the site setup is suitable, and the operation is streamlined. The utilization reflects the adaptability of TBMs to geological conditions.
As we can see from Figure 3, a normal distribution can describe the variability in penetration rate and utilization. The combination of penetration rate and utilization can be used to estimate the daily advancements under different working conditions. The project’s statistical data are categorized into four groups based on daily advancements of 0~10, 10~20, 20~30, and 30~40 m per day. The average value x and standard deviation s of penetration rate and utilization are calculated for each group to determine the fluctuation range {(x − s)~(x + s)}, shown in Table 2 and Table 3. Subsequently, the information is utilized to generate a table predicting daily advancements.
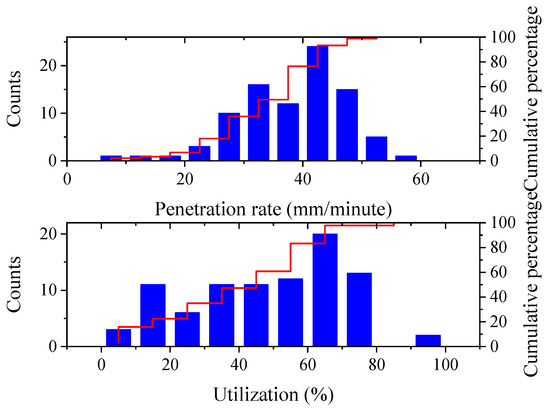
Figure 3.
Statistics of penetration rate and utilization used in this research.
Table 2.
Calculation and prediction table of penetration rate based on daily advancements.
Table 3.
Calculation and prediction table of utilization based on daily advancements.
2.3. TBM Surrounding Rock Boreability Classification
The reflection of TBM surrounding rock classification is the construction velocity. The daily advancements are reflected by the average construction rate. The construction rate is the ratio of the excavation distance to the total construction time, including excavation, overhaul, tool change and support, change step, etc., where the expression for average construction rate v is
According to Formula (1) and Table 2 and Table 3, the average construction rate v interval is calculated for different combinations of penetration rate and utilization levels, and the median value of each prediction interval is used as the prediction value of the average construction rate classification. The fluctuation ranges of the penetration rate for level II and the utilization for level II are 38~41 mm/min and 50~65%, respectively. Consequently, the calculated average construction rate falls within a range of 19~26.65 mm/min. Subsequently, the average construction rate v is determined as the median value from this predicted range, which amounts to 32.868 m/day. The prediction matrix is shown in Table 4.
Table 4.
Prediction value of the average construction rate v.
According to the TBM construction practice, in conjunction with the specific project, the surrounding rock encountered by the TBM is categorized into four levels based on the daily construction rate v: Level I—easy boreability rock: v ≥ 35 m/day, indicating optimal TBM construction conditions; Level II—moderate boreability rock: 25 m/day < v ≤ 35 m/day, suggesting favorable TBM construction conditions; Level III—average boreability rock: 15 m/day < v ≤ 25 m/day, denoting typical TBM construction conditions; and Level IV—poor boreability rock: v ≤ 15 m/day, representing unfavorable TBM construction conditions. This classification is presented in Table 5.
Table 5.
TBM surrounding rock boreability classification matrix.
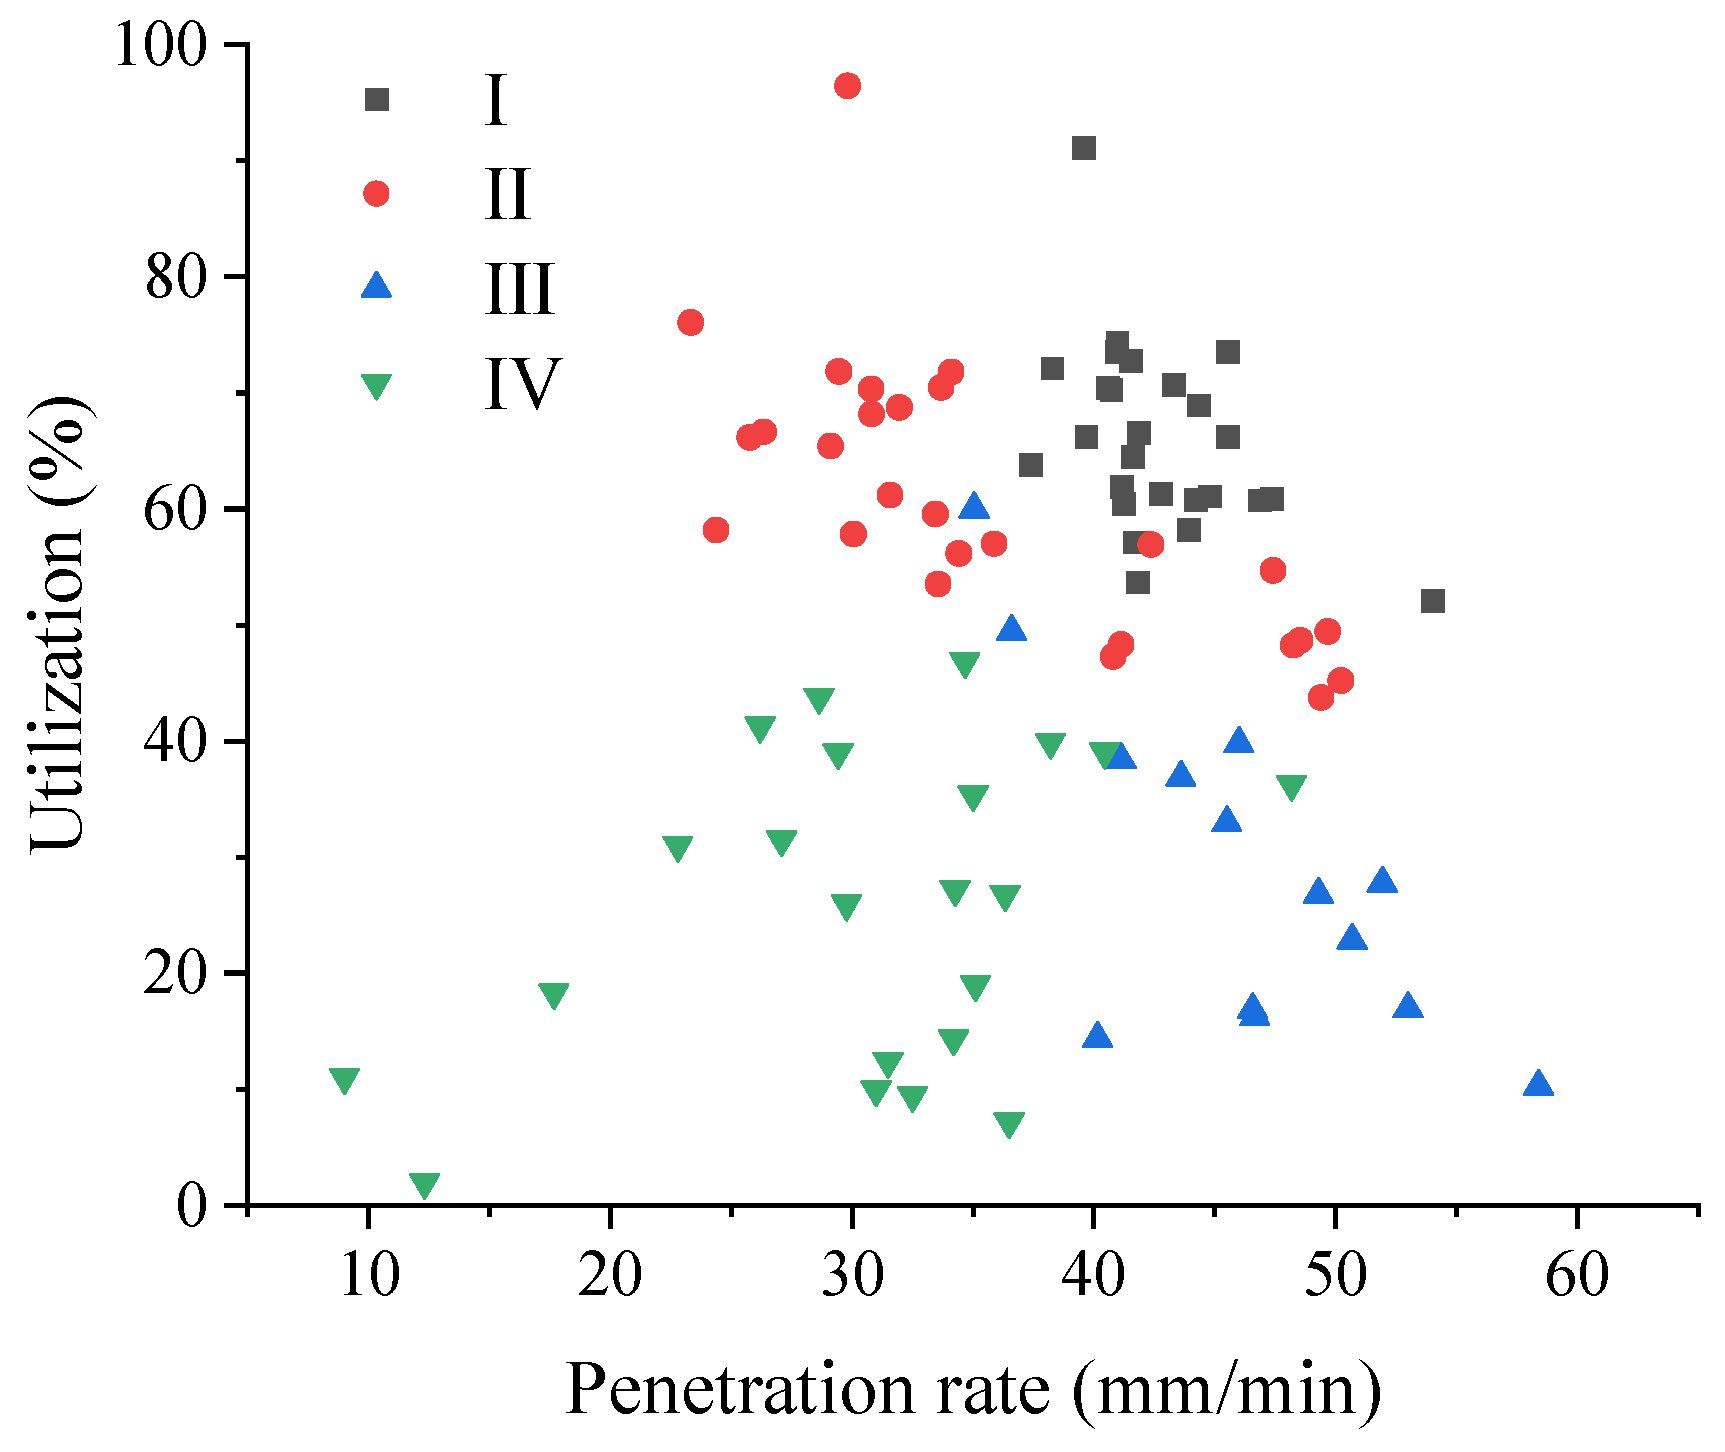
According to the qualitative analysis of the measured data, the penetration rate and utilization during tunneling follow a nearly normal distribution (Figure 4). When the penetration rate reaches approximately 40 mm/minute, the daily utilization reaches its peak. This indicates that machine stoppages are rare during tunneling, resulting in smooth excavation. The statistical chart reveals that cutterhead utilization is somewhat reduced at higher or lower penetration rates. In cases of low penetration rates, hard rock layers pose significant geological constraints on excavation. The high thrust required for excavating such formations often leads to cutterhead damage and subsequent lengthy replacement processes, thereby reducing overall utilization. Conversely, high penetration rates encounter soft rock conditions where excessive mud in the cutterhead frequently hampers excavation progress. Consequently, TBM efficiency becomes restricted by machine-specific working conditions, leading to decreased utilization rates.
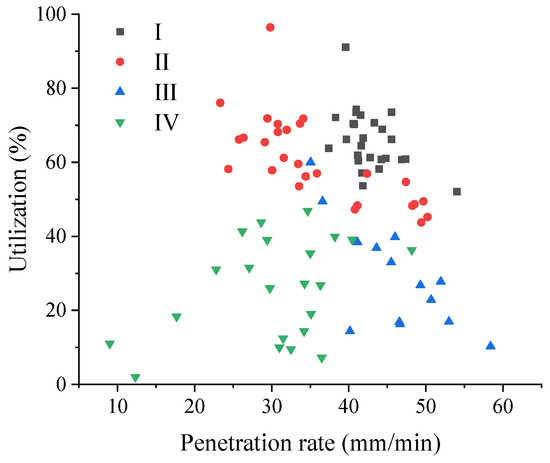
Figure 4.
Data distribution scatter plot of four levels of new boreability classifications.
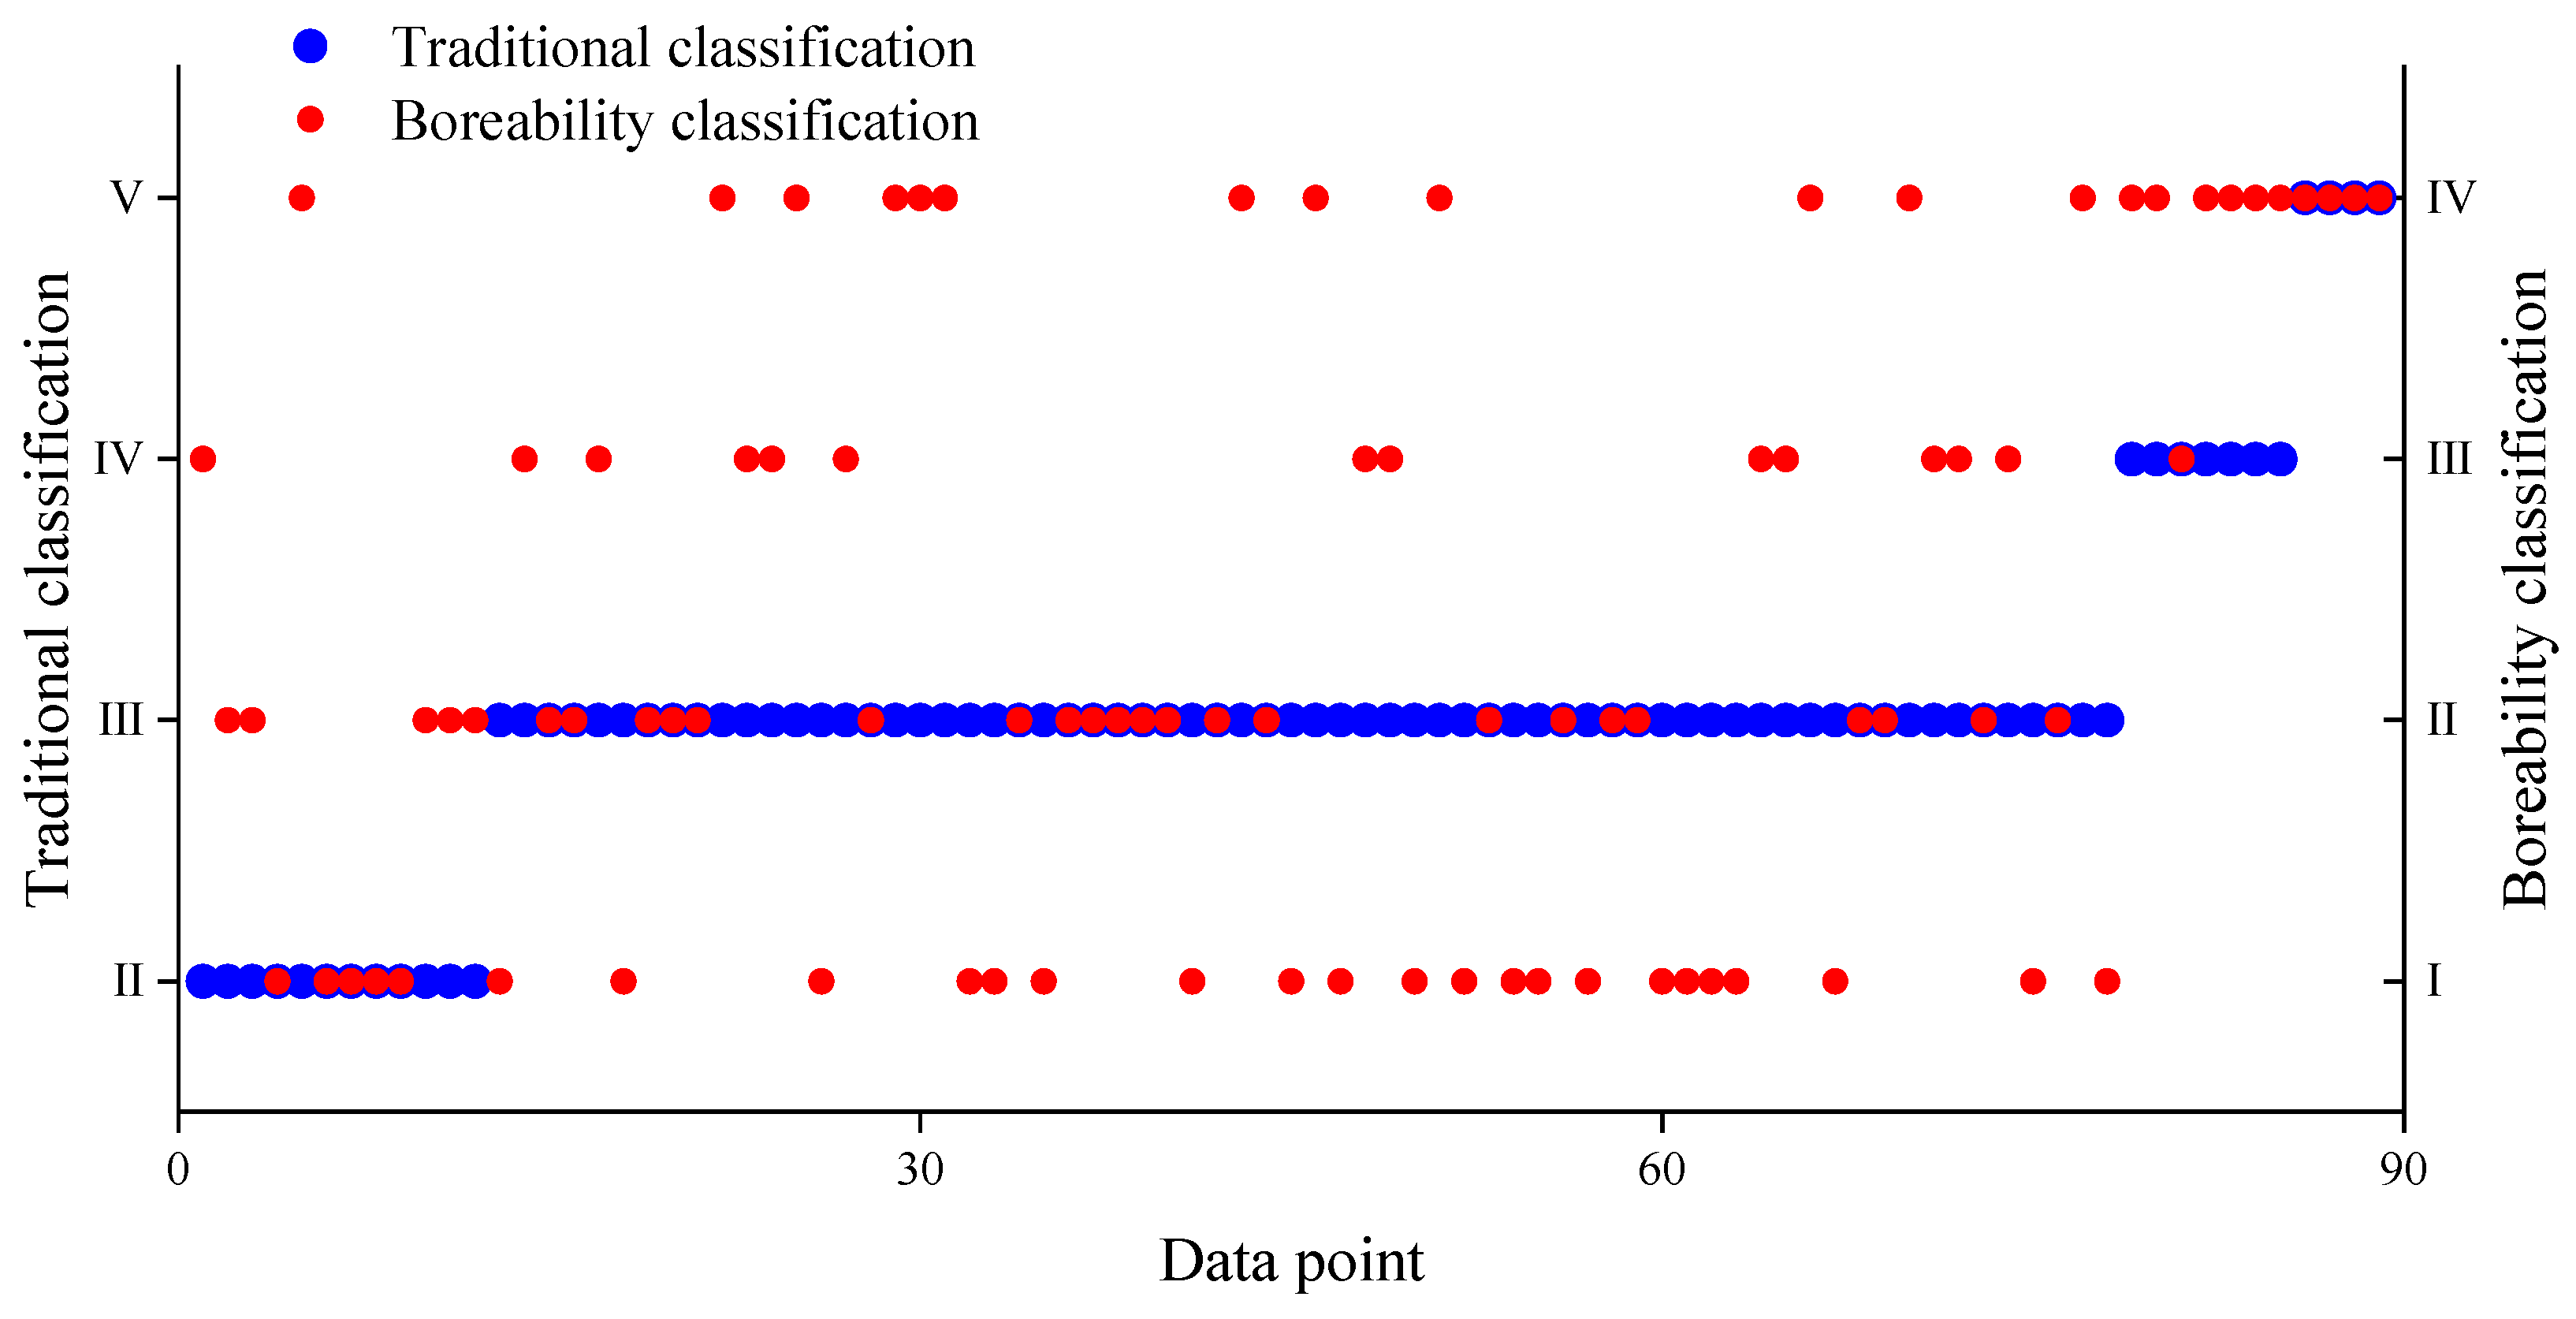
It can be seen from Figure 5 that the boreability classification category is quite different from the traditional one. The classification matrix presented above can be utilized to determine the rock mass classification for excavation purposes; however, obtaining real-time data on penetration rate and utilization during the process is challenging. These parameters can only be indirectly obtained through their relationships with other complex variables that cannot be directly calculated using mathematical models. Therefore, developing a multiparameter prediction model has become the preferred approach for predicting rock mass boreability classification.
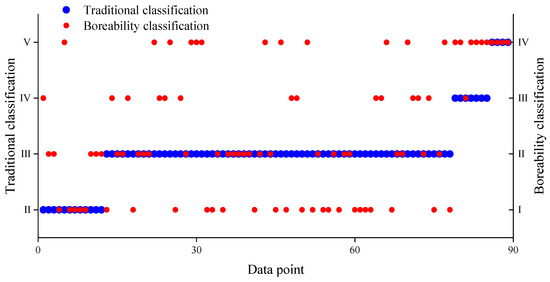
Figure 5.
Comparison between traditional surrounding rock classification and boreability classification.
3. Boreability Prediction Model
3.1. Data Preparation
The factors of TBM machines encompass thrust, torque, rotation speed, cutter size, type and number, cutter spacing, support type, and more. Among these mechanical parameters that affect tunneling efficiency directly are the thrust, torque, and cutterhead of the TBM. This paper selects the thrust (TH), rotation speed (RPM), and torque (TQ) of the cutterhead as indicators for predicting rock mass boreability.
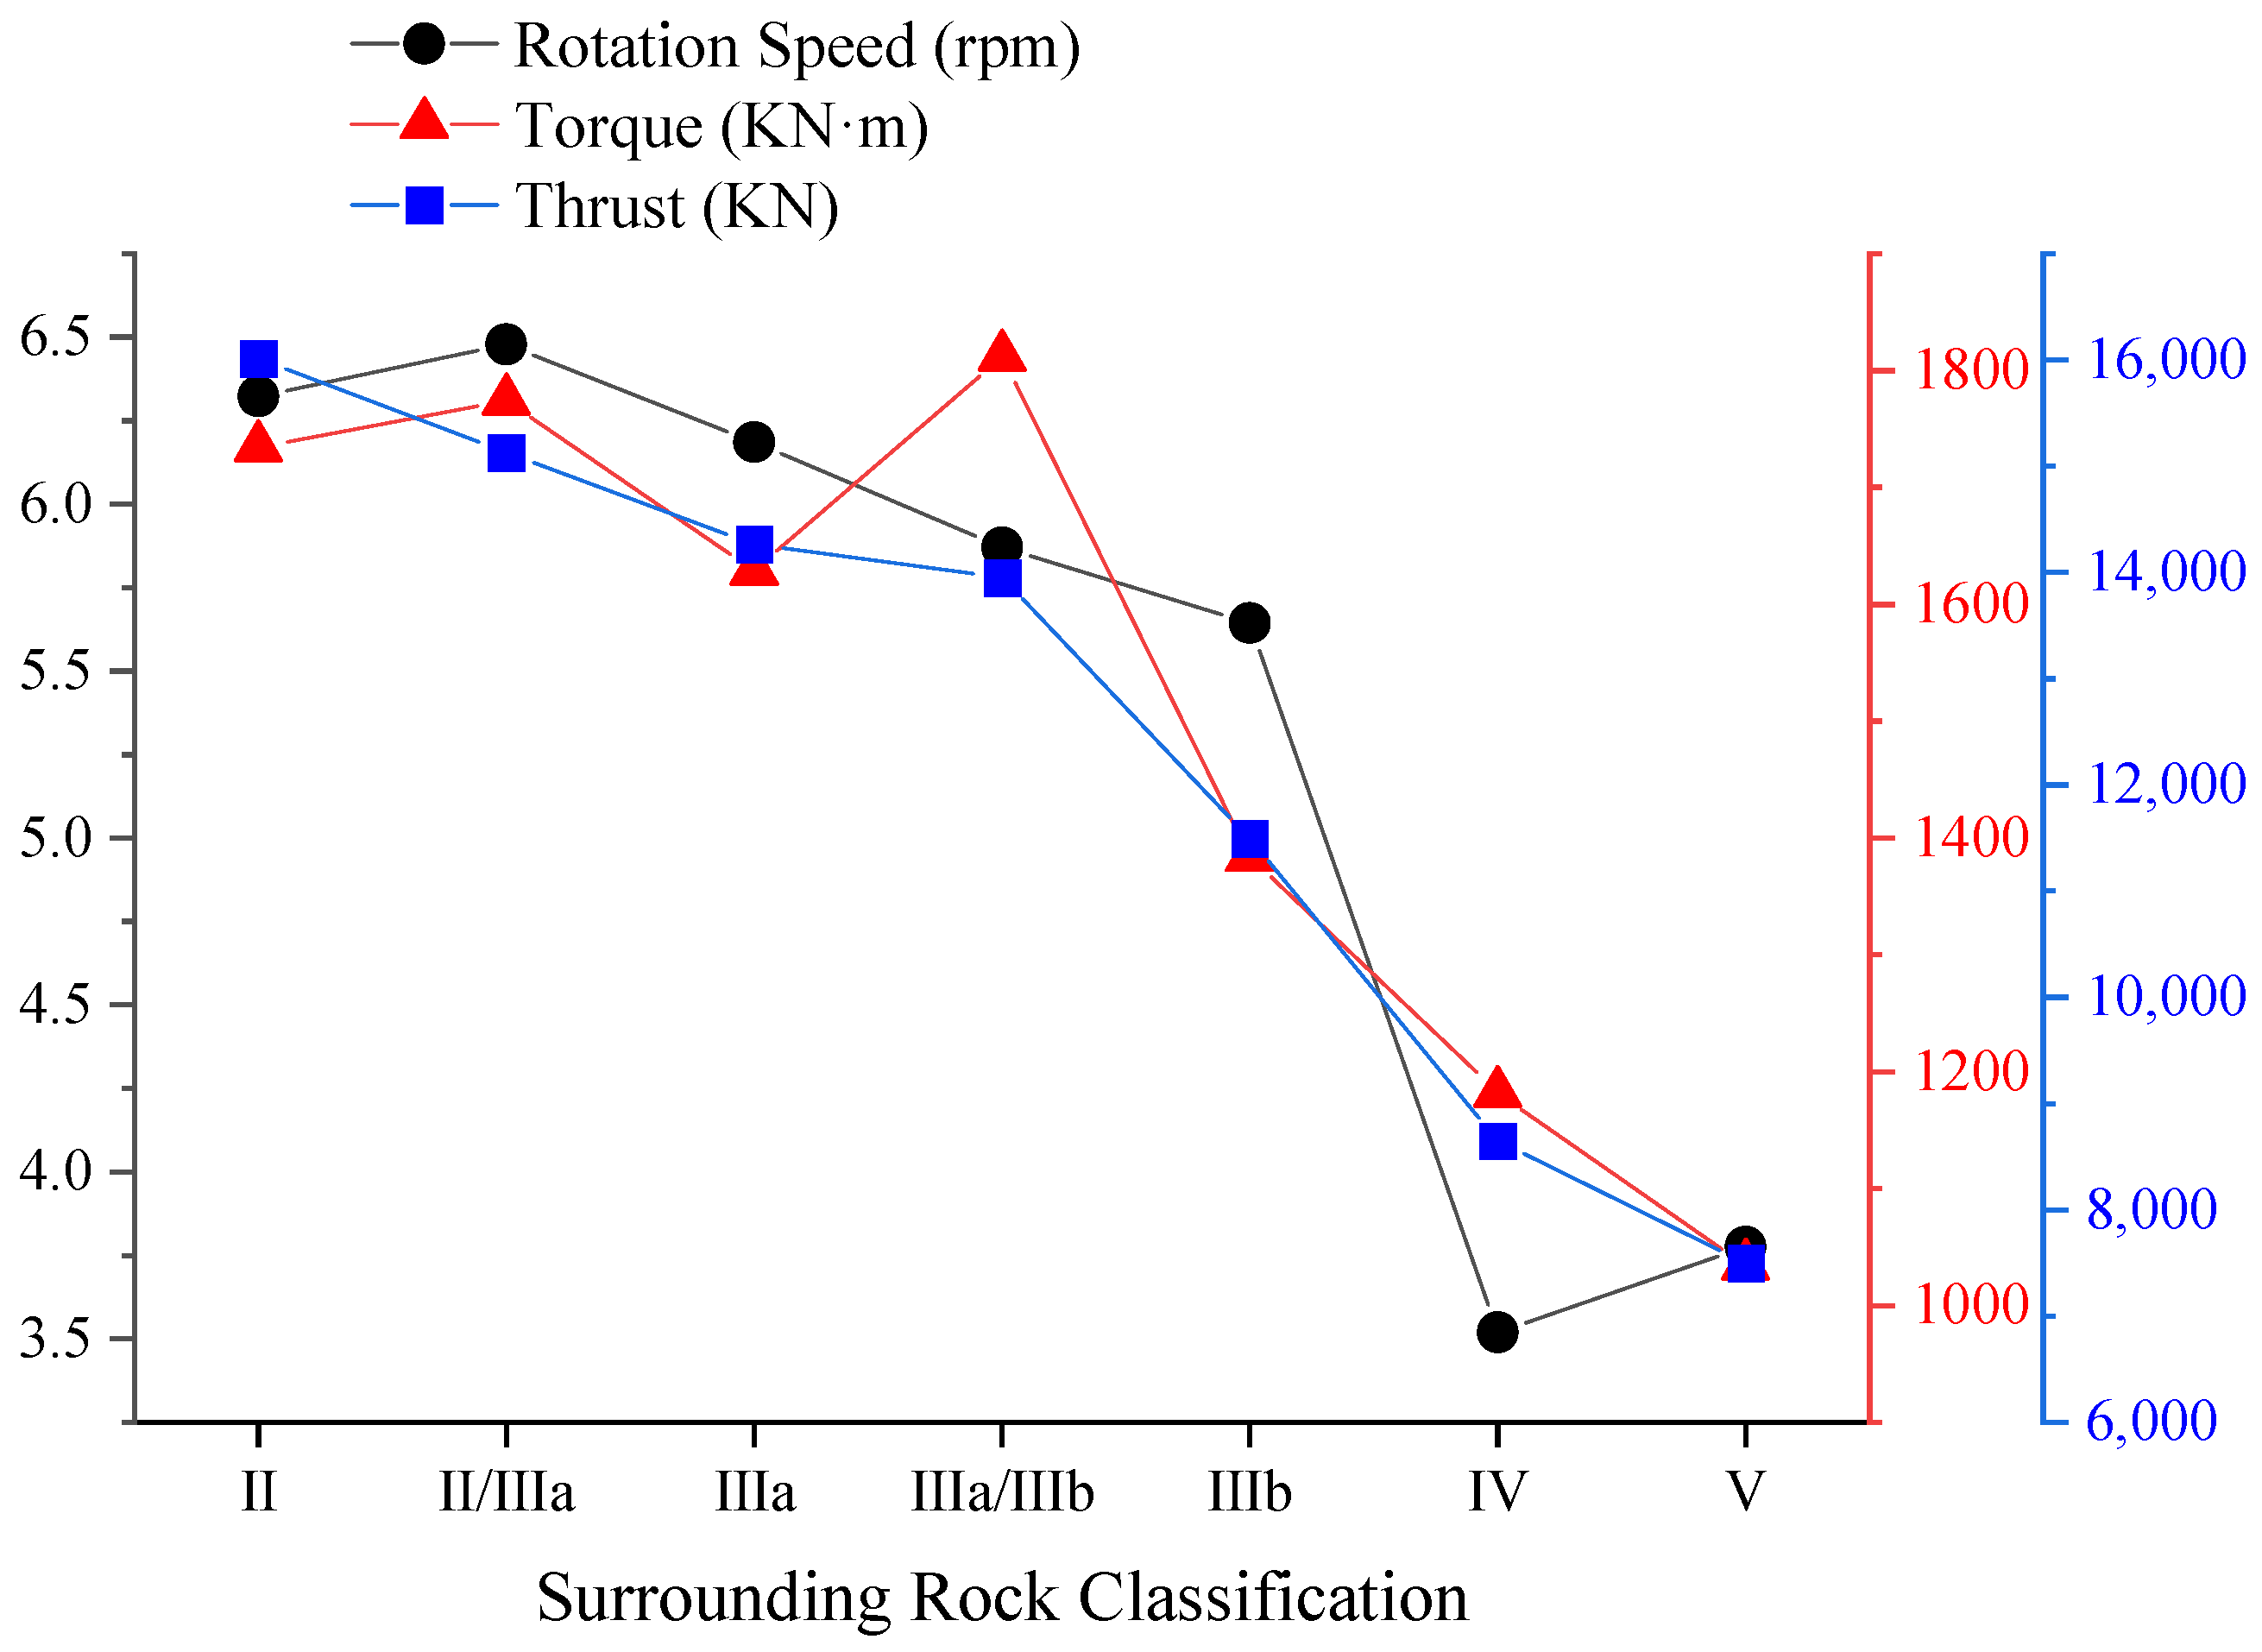
According to the engineering data studied in this paper, the thrust and the rotation speed have a relatively consistent trend with the classification of surrounding rock in traditional underground engineering, but the torque of TBMs is not completely consistent with the traditional classification (Figure 6). According to the above analysis, the three TBM mechanical parameters are selected to predict the boreability of surrounding rock.
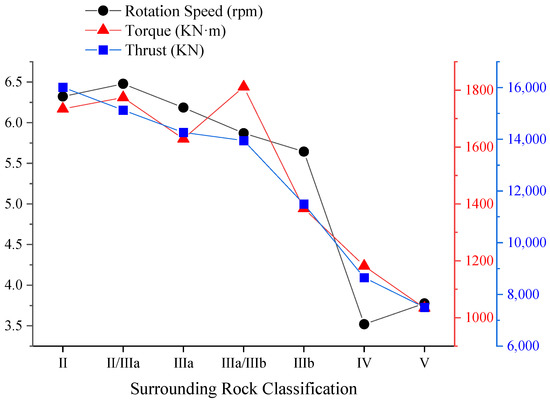
Figure 6.
Machine parameter trend based on traditional rock mass classification.
The rock’s strength is typically quantified by its uniaxial compressive strength (UCS), which serves as a key indicator for the tunneling speed of TBMs. Previous studies have consistently demonstrated a strong correlation between UCS and tunneling speed, where lower UCS values result in faster penetration rates and higher efficiency, while higher UCS values lead to slower penetration rates and reduced efficiency. However, excessively low UCS can compromise the stability of the surrounding rock, increasing surrounding rock support time, prolonging TBM downtime, and significantly impeding tunneling progress.
Boreability classification is closely related to the mechanical parameters and rock parameters. Since the TBM construction tunnel is different from the Drilling–Blasting Tunnel, the tunnel face of the TBM is closed, and it is difficult to obtain the relevant parameters of the surrounding rock during the tunneling process. Therefore, we introduced the Field Penetration Index (FPI) into the prediction model. The expression of the FPI is as follows:
where TH is the single-cutter thrust (kN) and p is the penetration (mm/r).
The FPI represents the thrust required for penetrating the unit depth of the rock and can be used as a measure of the boreability of the rock itself. The larger the FPI value, the greater the thrust required to produce the same depth of cut, indicating that the rock mass is less likely to excavate. The FPI has a good correlation with geological parameters and tunneling parameters and can be used as a link.
3.2. Boreability Classification Prediction Method
As mentioned above, TBM field performance data used in the prediction model establishment include the rotation speed (RPM), the torque (TQ), the thrust (TH), and the Field Penetration Index (FPI), as well as uniaxial compressive strength (UCS). All data suffice for three basic conditions, Data Information Content, Data Quality, and Data Objectivity [36], and they are output from the TBM control system directly.
Tenfold cross-validation is a widely adopted approach for model evaluation, wherein the fundamental procedure is as follows. Data set partitioning: Initially, the original data set is randomly divided into approximately equal subsets of size 10. Training and validation: Subsequently, ten iterations of training and validation are performed. In each iteration, nine subsets are merged to form the training set, while one remaining subset serves as the validation set. Consequently, every subset has an opportunity to be employed as the validation set once. Model assessment: The trained model is utilized to predict outcomes on the validation set and compute corresponding evaluation metrics (e.g., accuracy, loss). Result aggregation: Ultimately, by averaging these evaluation metrics obtained from ten experiments, we evaluate the generalization capability of our model. This method possesses an advantage in that it maximizes utilization of the entire data set for both training and validation purposes while mitigating instability in evaluation results arising from diverse data partitioning methods. We adopted tenfold cross-validation in the establishment of the prediction model to prevent overfitting.
The BP neural network recognition model is established using the newff function:
where P is the input sample, Q is the output sample, S is the number of neurons in the hidden layer, TF is the transfer function, and BTF is the training function.
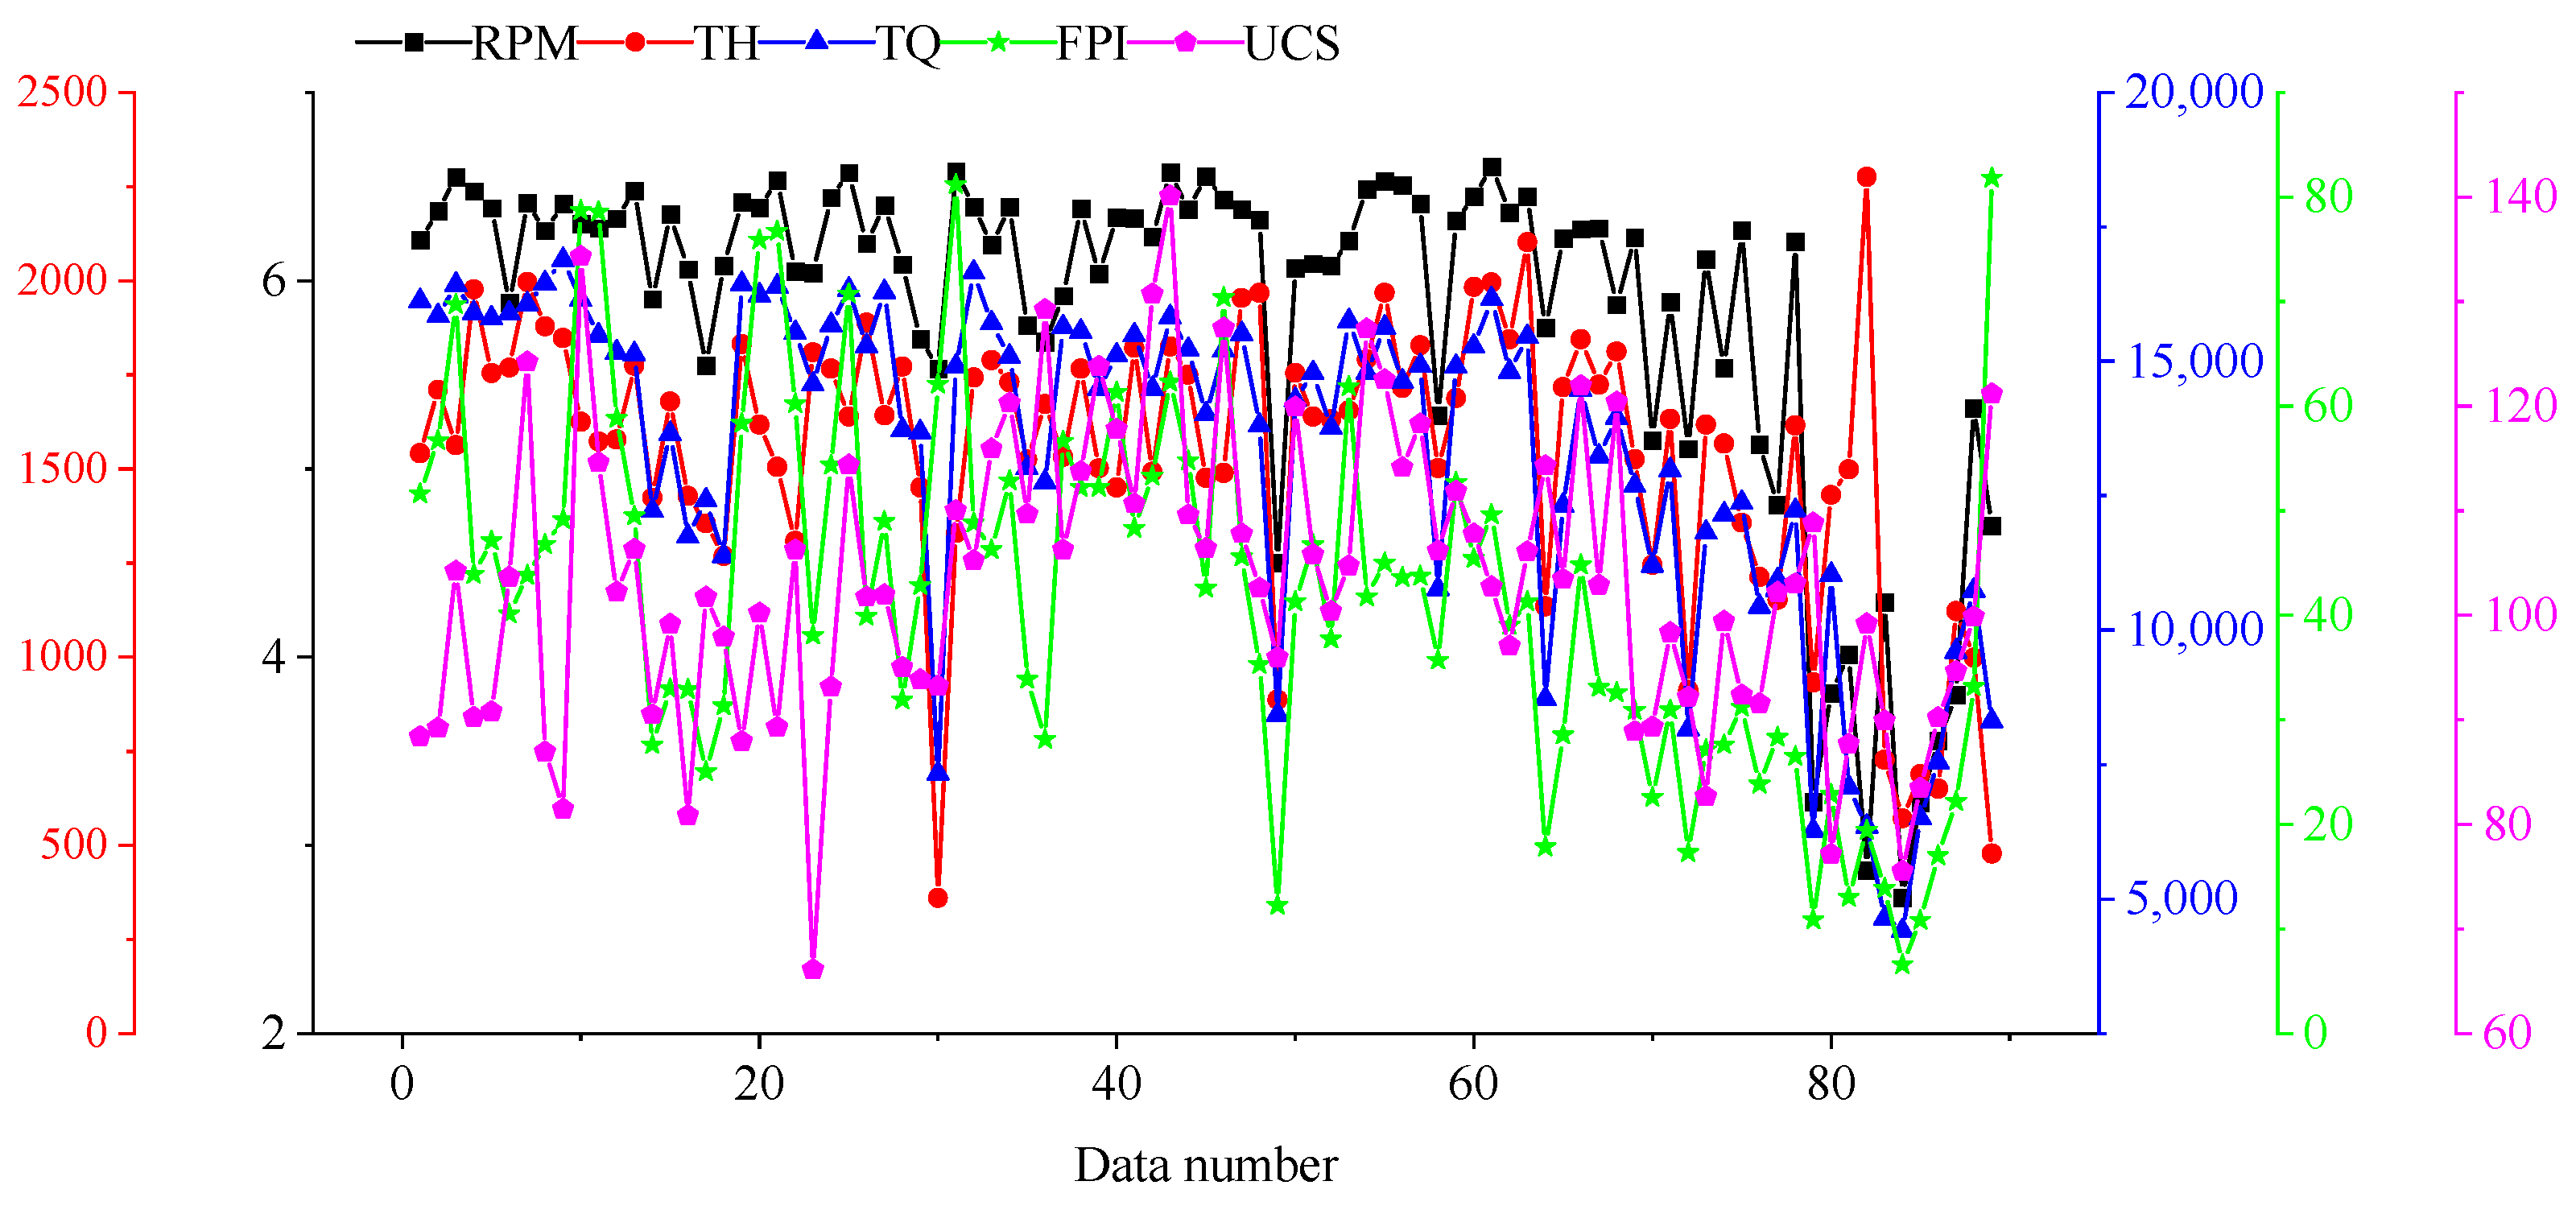
A double hidden layer BP neural network is selected with 11 and 1 hidden layer nodes, respectively. According to the recognition accuracy of the neural network, the TF between the layers is selected as tansig and purein. We compare the effects of each training function and select trainbfg. The input samples are the above five main parameters, namely RPM, TQ, TH, FPI, and UCS. The output sample is the boreability category. We set the network internal parameter learning rate to 0.1, error precision to 0.001, training step size to 50,000, and the remaining parameters to the default values. Table 5 lists part of the data used for BP neural network learning.
The following Figure 7 shows the part of data used for model training.
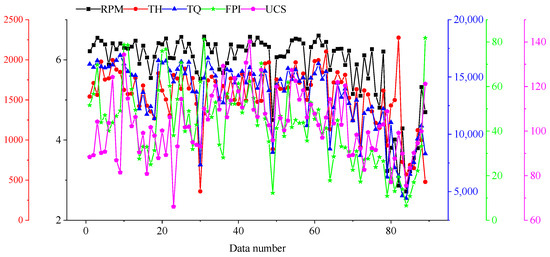
Figure 7.
The data chart used for BP neural network training.
4. Results and Discussion
4.1. Case Validation
We selected 15 excavated sections from the site and determined the actual boreability level based on the penetration rate and utilization of these sections. Subsequently, a comparative analysis was conducted between the predicted results and the observed data to validate the accuracy of the model. Table 6 shows the data for the validation case and the comparison of the actual level with the prediction value.
Table 6.
The validation case data and the comparison of the actual level with the prediction value.
Based on the results above, it can be concluded that the prediction results of the prediction model established in this paper are highly consistent with the actual level.
4.2. Discussions
The prediction result of the No. 5 section is inconsistent with the result revealed by the actual excavation. There are two possible reasons: (a) due to the small number of learning samples, there are more samples of level II and level III, and the level I samples are not enough with other samples; (b) the impact of operators in the tunneling process is large. Actually, the adjustment of tunneling parameters during the tunneling relies heavily on experience, and there is a deviation between the boreability of rock and the matching degree of tunneling parameters.
From Table 5, the specific arrangement of the boreability classification matrix can be analyzed. There is a lot of research on the prediction of TBM performance [6,14,15,19,32], which is the penetration rate in different rock masses. However, we could conclude from this research that the daily construction progress is not linearly related to the penetration rate, it is also influenced by utilization. As Khetwal’s research suggested [35], the utilization of TBMs was influenced by many factors, and the utilization accounts for a large proportion of the boreability classification. This shows that during the TBM tunneling process, the construction progress is largely determined by the operation of the mechanical equipment. The key to improving mechanical construction speed is to improve the utilization of the equipment.
Different from the previous research focus on the relationship between the rock mass and machine [12,34,37], in this research, the classification method is established based on the daily progress, i.e., the penetration rate and the utilization, and the rock mass can be classified according to the boreability classification matrix. Meanwhile, the improvement of the boreability classification matrix needs plenty of tunneling data. The surrounding rock face cannot be directly observed in the TBM construction tunnel, and the actual situation of the surrounding rock cannot be accurately obtained in real time. The research content of this paper can provide some reference for TBM construction. However, the areas of prediction of faults and other unfavorable geological bodies in general need further research.
5. Conclusions
Based on the TBM-related tunneling parameters and the corresponding rock mass parameters, this paper establishes the boreability classification method for the surrounding rock of TBM tunnels. Machine learning methods are used to establish the prediction model of surrounding rock. The classification method and prediction model were applied to a TBM for case validation.
The project’s statistical data are classified into four groups based on daily advancements of 0~10, 10~20, 20~30, and 30~40 m per day. For each group, the average value x and standard deviation s of penetration rate and utilization are calculated to determine the fluctuation range {(x − s)~(x + s)}. The average construction rate interval v is computed for different combinations of penetration rate and utilization levels, with the median value within each prediction interval serving as the predicted average construction rate classification. Based on TBM construction practices and specific project considerations, the surrounding rock encountered by the TBM is categorized into four levels according to the daily construction rate v.
The challenge of this method lies in acquiring real-time data on penetration rate and utilization. Therefore, this research aims to develop a multiparameter prediction model utilizing machine parameters, rock parameters, and comprehensive parameters (TH, RPM, TQ, UCS, and FPI) as predictive input variables. The boreability level is used as the output result for establishing the boreability prediction model using machine learning methods. Fifteen sections were selected for prediction purposes by inputting their respective parameters into the established model to obtain predicted results, which were then compared with actual levels. The findings indicate that while the predicted results of 14 sections align with the actual levels, there was a deviation observed in the predicted results of the 5th section.
In summary, the feasibility of the TBM surrounding rock boreability classification method and the prediction model is verified by engineering examples. The research provides a reference for construction departments and gives them a more visualized sense of the advancements, which helps them to make better preparations.
Author Contributions
Conceptualization, Y.T. and Z.L.; methodology, Y.T.; software, Y.T.; validation, Z.L. and Y.D.; formal analysis, Z.L.; investigation, Y.D.; resources, Y.D. and X.W.; data curation, Y.T.; writing—original draft preparation, Y.T.; writing—review and editing, Z.L. All authors have read and agreed to the published version of the manuscript.
Funding
This work is supported by Shandong Provincial Natural Science Foundation (No. ZR2022QD014) and the China Scholarship Council (201906220135).
Data Availability Statement
Data is contained within the article.
Conflicts of Interest
Author Xinjie Wang was employed by the company Guizhou Provincial Highway Development Group Co., Ltd. The remaining authors declare that the research was conducted in the absence of any commercial or financial relationships that could be construed as a potential conflict of interest.
Nomenclature
| Nomenclature | Paraphrase |
| PR | Penetration rate |
| U | Utilization |
| TH | Thrust |
| TQ | Torque |
| RPM | Round per minute |
| FPI | Field penetration index |
| UCS | Uniaxial Compressive Strength |
| v | average construction rate |
References
- Farrokh, E.; Rostami, J. Effect of adverse geological condition on TBM operation in Ghomroud tunnel conveyance project. Tunn. Undergr. Space Technol. 2009, 24, 436–446. [Google Scholar] [CrossRef]
- Yu, P.; Hu, R.; Zhang, J.; Yang, Q.; Zhao, J.; Cao, L.; Zhu, C. Numerical study on local scour characteristics around submarine pipelines in the Yellow River Delta silty sandy soil under waves and currents. Deep Undergr. Sci. Eng. 2024, 3, 182–196. [Google Scholar] [CrossRef]
- Alber, M. Prediction of Penetration and Utilization For Hard Rock TBMs. In Proceedings of the ISRM International Symposium, Turin, Italy, 2–5 September 1996. [Google Scholar]
- Cassinelli, F.; Cina, S.; Innaurato, N. Power consumption and metal wear in tunnel-boring machines: Analysis of tunnel-boring operation in hard rock. Int. J. Rock Mech. Min. Sci. Geomech. Abstr. 1983, 20, A25. [Google Scholar] [CrossRef]
- Nelson, P.P.; Ingraffea, A.R.; O’Rourke, T.D.; Nelson, P.P.; Ingraffea, A.R.; O’Rourke, T.D. TBM performance prediction using rock fracture parameters. Int. J. Rock Mech. Min. Sci. Geomech. Abstr. 1985, 22, 189–192. [Google Scholar] [CrossRef]
- Hassanpour, J.; Rostami, J.; Khamehchiyan, M.; Bruland, A. Developing new equations for TBM performance prediction in carbonate-argillaceous rocks: A case history of Nowsood water conveyance tunnel. Geomech. Geoengin. 2009, 4, 287–297. [Google Scholar] [CrossRef]
- Hassanpour, J.; Rostami, J.; Khamehchiyan, M.; Bruland, A.; Tavakoli, H.R. TBM Performance Analysis in Pyroclastic Rocks: A Case History of Karaj Water Conveyance Tunnel. Rock Mech. Rock Eng. 2009, 43, 427–445. [Google Scholar] [CrossRef]
- Hassanpour, J.; Rostami, J.; Zhao, J. A new hard rock TBM performance prediction model for project planning. Tunn. Undergr. Space Technol. 2011, 26, 595–603. [Google Scholar] [CrossRef]
- Ribacchi, R.; Fazio, A.L. Influence of Rock Mass Parameters on the Performance of a TBM in a Gneissic Formation (Varzo Tunnel). Rock Mech. Rock Eng. 2004, 38, 105–127. [Google Scholar] [CrossRef]
- Yagiz, S. Utilizing rock mass properties for predicting TBM performance in hard rock condition. Tunn. Undergr. Space Technol. 2008, 23, 326–339. [Google Scholar] [CrossRef]
- Alber, M. Advance Rates of Hard Rock TBM’s and Their Effects on Project Economics. Tunn. Undergr. Space Technol. 2000, 15, 55–64. [Google Scholar] [CrossRef]
- Gong, Q.M.; Zhao, J. Development of a rock mass characteristics model for TBM penetration rate prediction. Int. J. Rock Mech. Min. Sci. 2009, 46, 8–18. [Google Scholar] [CrossRef]
- Mikaeil, R.; Naghadehi, M.Z.; Sereshki, F. Multifactorial fuzzy approach to the penetrability classification of TBM in hard rock conditions. Tunn. Undergr. Space Technol. 2009, 24, 500–505. [Google Scholar] [CrossRef]
- Ghasemi, E.; Yagiz, S.; Ataei, M. Predicting penetration rate of hard rock tunnel boring machine using fuzzy logic. Bull. Eng. Geol. Environ. 2013, 73, 23–35. [Google Scholar] [CrossRef]
- Benato, A.; Oreste, P. Prediction of penetration per revolution in TBM tunneling as a function of intact rock and rock mass characteristics. Int. J. Rock Mech. Min. Sci. 2015, 74, 119–127. [Google Scholar] [CrossRef]
- Fatemi, S.A.; Ahmadi, M.; Rostami, J. Evaluation of TBM performance prediction models and sensitivity analysis of input parameters. Bull. Eng. Geol. Environ. 2016, 77, 501–513. [Google Scholar] [CrossRef]
- Liu, B.; Wang, R.; Guan, Z.; Li, J.; Xu, Z.; Guo, X.; Wang, Y. Improved support vector regression models for predicting rock mass parameters using tunnel boring machine driving data. Tunn. Undergr. Space Technol. 2019, 91, 102958. [Google Scholar] [CrossRef]
- Liu, Q.; Jiang, Y.; Wu, Z.; Xu, X.; Liu, Q. Investigation of the Rock Fragmentation Process by a Single TBM Cutter Using a Voronoi Element-Based Numerical Manifold Method. Rock Mech. Rock Eng. 2017, 51, 1137–1152. [Google Scholar] [CrossRef]
- Zhang, Q.; Hu, W.; Liu, Z.; Tan, J. TBM performance prediction with Bayesian optimization and automated machine learning. Tunn. Undergr. Space Technol. 2020, 103, 103493. [Google Scholar] [CrossRef]
- Fang, Y.; Li, X.; Liu, H.; Hao, S.; Yi, Y.; Guo, Y.; Li, H. Intelligent real-time identification technology of stratum characteristics during slurry TBM tunneling. Tunn. Undergr. Space Technol. 2023, 139, 105216. [Google Scholar] [CrossRef]
- Rostami, J. Performance prediction of hard rock Tunnel Boring Machines (TBMs) in difficult ground. Tunn. Undergr. Space Technol. 2016, 57, 173–182. [Google Scholar] [CrossRef]
- Nilsen, B.; Ozdemir, L. Hard rock tunnel boring prediction and field performance. In Proceedings of the Rapid Excavation and Tunneling Conference, Boston, MA, USA, 13–17 June 1993; pp. 833–852. [Google Scholar]
- Ren, T.; Zhang, H.; Guo, Y.; Tang, Y.; Okubo, S. Real-Time Estimation Method for Tunnel-Excavated Rock Strength Based on TBM Parameters. Int. J. Geomech. 2023, 23, 4023092.1–4023092.10. [Google Scholar] [CrossRef]
- Zhang, K.; Zhao, X.; Zhang, Z. Influences of tunnelling parameters in tunnel boring machine on stress and displacement characteristics of surrounding rocks. Tunn. Undergr. Space Technol. 2023, 137, 105129. [Google Scholar] [CrossRef]
- Zhang, Q.; Yang, B.; Zhu, Y.; Guo, C.; Jiao, C.; Cai, A. Prediction Method of TBM Tunneling Parameters Based on Bi-GRU-ATT Model. Adv. Civ. Eng. 2022, 2022, 3743472. [Google Scholar] [CrossRef]
- Zhang, Q.; Zhu, Y.; Ma, R.; Du, C.; Du, S.; Shao, K.; Li, Q. Prediction Method of TBM Tunneling Parameters Based on PSO-Bi-LSTM Model. Front. Earth Sci. 2022, 10, 854807. [Google Scholar] [CrossRef]
- Qiu, D.; Fu, K.; Xue, Y.; Tao, Y.; Kong, F.; Bai, C. TBM Tunnel Surrounding Rock Classification Method and Real-Time Identification Model Based on Tunneling Performance. Int. J. Geomech. 2022, 22, 4022070.1–4022070.17. [Google Scholar] [CrossRef]
- Innaurato, N.; Mancini, A.; Rondena, E.; Zaninetti, A. Forecasting and Effective TBM Performances in a Rapid Excavation of a Tunnel in Italy. In Proceedings of the 7th ISRM Congress, Aachen, Germany, 16–20 September 1991. [Google Scholar]
- Barton, N.R. TBM performance estimation in rock using Q(TBM). Tunn. Tunn. Int. 1999, 31, 30–34. [Google Scholar]
- Sapigni, M.; Berti, M.; Bethaz, E.; Busillo, A.; Cardone, G. TBM performance estimation using rock mass classifications. Int. J. Rock Mech. Min. Sci. 2002, 39, 771–788. [Google Scholar] [CrossRef]
- Bieniawski von Preinl, Z.T.; Celada Tamames, B.; Galera Fernández, J.M.; Álvarez Hernández, M. Rock mass excavability indicator: New way to selecting the optimum tunnel construction method. Tunn. Undergr. Space Technol. 2006, 21, 237. [Google Scholar] [CrossRef]
- Khademi Hamidi, J.; Shahriar, K.; Rezai, B.; Rostami, J. Performance prediction of hard rock TBM using Rock Mass Rating (RMR) system. Tunn. Undergr. Space Technol. 2010, 25, 333–345. [Google Scholar] [CrossRef]
- Frough, O.; Torabi, S.R.; Yagiz, S. Application of RMR for Estimating Rock-Mass–Related TBM Utilization and Performance Parameters: A Case Study. Rock Mech. Rock Eng. 2014, 48, 1305–1312. [Google Scholar] [CrossRef]
- Salimi, A.; Rostami, J.; Moormann, C.; Hassanpour, J. Examining Feasibility of Developing a Rock Mass Classification for Hard Rock TBM Application Using Non-linear Regression, Regression Tree and Generic Programming. Geotech. Geol. Eng. 2017, 36, 1145–1159. [Google Scholar] [CrossRef]
- Khetwal, A.; Rostami, J.; Nelson, P.P. Investigating the impact of TBM downtimes on utilization factor based on sensitivity analysis. Tunn. Undergr. Space Technol. 2020, 106, 103586. [Google Scholar] [CrossRef]
- Erharter, G.H.; Marcher, T. MSAC: Towards data driven system behavior classification for TBM tunneling. Tunn. Undergr. Space Technol. 2020, 103, 103466. [Google Scholar] [CrossRef]
- Salimi, A.; Rostami, J.; Moormann, C. Application of rock mass classification systems for performance estimation of rock TBMs using regression tree and artificial intelligence algorithms. Tunn. Undergr. Space Technol. 2019, 92, 103046. [Google Scholar] [CrossRef]
Disclaimer/Publisher’s Note: The statements, opinions and data contained in all publications are solely those of the individual author(s) and contributor(s) and not of MDPI and/or the editor(s). MDPI and/or the editor(s) disclaim responsibility for any injury to people or property resulting from any ideas, methods, instructions or products referred to in the content. |
© 2024 by the authors. Licensee MDPI, Basel, Switzerland. This article is an open access article distributed under the terms and conditions of the Creative Commons Attribution (CC BY) license (https://creativecommons.org/licenses/by/4.0/).