Article

The In-Plane Seismic Response of Infilled Reinforced Concrete Frames Using a Strut Modelling Approach: Validation and Applications

by
Abdelghaffar Messaoudi
1,
Rachid Chebili
1,
Hossameldeen Mohamed
2,3,
André Furtado
4 and
Hugo Rodrigues
5,*
1
Laboratory of Research in Civil Engineering, University of Biskra, Biskra 07000, Algeria
2
Faculty of Engineering, Aswan University, Aswan 81528, Egypt
3
Faculty of Engineering, Sakarya University, 54050 Sakarya, Turkey
4
CERIS, Civil Engineering Research and Innovation for Sustainability, Department of Civil Engineering, Instituto Superior Universidade de Lisboa, 1049-001 Lisboa, Portugal
5
RISCO, Department of Civil Engineering, University of Aveiro, 3810-193, Aveiro, Portugal
*
Author to whom correspondence should be addressed.
Buildings 2024, 14(7), 1902; https://doi.org/10.3390/buildings14071902
Submission received: 7 March 2024 / Revised: 3 June 2024 / Accepted: 6 June 2024 / Published: 21 June 2024
(This article belongs to the Collection Advanced Concrete Materials in Construction)

Abstract

:
Reinforced Concrete (RC) buildings often rely on masonry walls to increase their rigidity and strength, distinguishing them from bare frames. Consequently, the lateral capacity of the RC frames is significantly impacted by the presence or absence of these walls. Numerical models are fundamental to understanding this behavior interaction, but the development of robust simplified models is still scarce. Based on this motivation, the reliability of a simplified numerical modelling approach was examined in this study and compared to several experimental tests. An optimized approach was implemented to determine the strut parameters, rather than relying on existing empirical formulae. The reliability of the initial stiffness, maximum strength, and energy dissipation was studied. From the results, the accuracy of the considered modelling strategy can be observed in different types of masonry elements (strong and weak units) with and without openings. The validated simulation approach reveals that the adopted macro-modelling procedure can accurately represent the behavior of infilled masonry frames. The maximum deviation of the prediction of the initial stiffness and maximum strength was found to be around 23% and 14%, respectively. These findings illustrate that the strut model effectively replicates real behavior with a satisfactory level of accuracy. However, using a consistent formula to define the strut can result in significant errors, particularly in strut width.

1. Introduction

A large part of the building stock is made up of Reinforced Concrete (RC) frame structures consisting of beams, columns, and, most often, RC load-bearing walls, distributed, for example, in stairwells or elevator shafts, being complemented in most cases by masonry infill walls. During earthquakes, the building’s components, including the infill walls, are integrated to resist the lateral demand of the earthquake. Such integrity between the RC elements can lead to a significantly different structural behavior [1,2,3,4]. However, until recently, the infill wall was considered to be a non-structural element and, therefore, its lateral contribution on the overall structural behavior was discarded. Nevertheless, the observation of evident integration between the RC frame and infill walls after recent earthquakes (e.g., [5,6], among others) motivated several studies to assess the structural behavior of RC with masonry infills either using experimental tests or numerical models (see e.g., [2,4,7,8,9,10] and references therein).
Even though the experimental tests provided comprehensive information regarding the real behavior of the infill interaction with the RC frame, the high number of resources that were involved limited the number of studies addressing the infill behavior experimentally. On the other hand, the pioneer observation of Polyakov [11], that infill works as lateral bracing for the surrounding RC frame, has promoted the use of strut models for the infill walls. Since then, several models have been proposed to simulate the bracing of the infill walls. These models either use single or multiple strut systems. The latter type was proposed to enhance the capabilities of the numerical model to capture the interaction between the infills and the surrounding frame. Using a single strut element is seen as more effective, particularly in a large-scale model or in high computational demand studies such as probabilistic-wise analysis. The cross-section area and material properties are the essential inputs for the strut elements used for the infill walls [1,10]. However, a wide range of models are found in the literature due to the complex behavior of masonry infills.
The literature offers various methods for simulating the seismic behavior of infill panels, typically falling into two categories: simplified macro-models and detailed micro-modelling approaches. Simplified macro-models rely on a basic understanding of infill panel behavior, employing a limited number of struts to approximate their impact on a building’s structural response to lateral loads. Despite their simplicity, these models effectively capture the overall behavior of the panels and their interaction with the RC elements, all while demanding minimal computational resources.
Conversely, detailed micro-modelling approaches dissect the panels into multiple elements to meticulously account for local effects, including cracking patterns, collapse mechanisms, and ultimate loads. While this approach offers a comprehensive insight into the behavior of infill panels at a granular level, it necessitates substantial computational resources and time investment. Nevertheless, it serves as a valuable tool for refining and calibrating global models. The focus of this research work will be on the use of a strut model and an assessment of its capacity to predict the behavior of infilled RC frames subjected to cyclic loadings.
Polyakov started the strut model concept with the proposal of an equivalent strut model to simulate the infill wall’s behavior [11]. The proposal was based on experimental observation studies of steel frames with a focus on both normal and shear stresses on the infill walls and concluded that the stresses were only transferred by the compression corners of the infill–frame interfaces from the structural to the non-structural elements. Following that work, Holmes improved the previous concept, being the first author to propose a formulation for the diagonal strut [12]. The proposed formula to calculate the equivalent strut width reflected a simplified approach calibrated for steel frames with brickwork and concrete infill walls. It triggered several other studies to define the width more accurately. This simplified model considered the deformation and ultimate strength of the global infill panel. Later, Statford-Smith compared the results from the experimental work developed in infilled steel frame specimens and concluded that the equivalent strut width depends on the infill–frame contact [13]. Later, some studies were developed with the main purpose of calibrating the equivalent strut width and lateral stiffness of infilled frames [13,14]. The consideration of the openings on infill panels was first considered by Abdul-Kadir who proposed an equation to reduce the stiffness provided by the infills [15].
Klingner et al. first introduced the double-strut model concept with a simulation of an infill panel with two equivalent struts [16]. Leuchars et al. proposed a modelling approach able to represent the response of panels to potential shear sliding failure [17].
Thiruvengadam introduced the multi-strut concept, overcoming some of the limitation regarding the inaccuracy of the single-strut models, to compute the bending and shear forces in the RC elements [18]. The author did not propose a limit number to the struts and their configuration; instead, the only criterion was the capability to simulate the effect of the openings. Syrmakezis et al. proposed a model with five parallel struts in each direction to study both the stiffness and strength of the infilled RC frames [19]. Chrysostomou proposed a model comprising three parallel struts in each direction [20]. The length considered for the connection of the struts to the RC elements was assumed equal to their plastic hinge length. This model also predicted the strength and stiffness degradation. More recently, Hamburguer et al. proposed a multi-strut model accounting for openings [21].
In 1995, Saneinejad et al. (1995) proposed a numerical model that consisted of two diagonal and parallel struts in each direction of the infill wall, distributing the loads to the column elements [22].
One of the most well-known numerical models is the one proposed by Crisafulli et al. [23]. It presents an integration of struts and springs to compute two phenomena independently, namely, (i) diagonal cracking and corner crushing; and (ii) shear sliding. The model considers six strut members using the rules of hysteresis. It consists of two diagonal and parallel struts in each direction, which carry the axial loads of the panel, and another pair, which simulate the shear from the top and bottom of the panel. These are activated in either direction, depending on the activation due to the axial compressive loads while the panel is being deformed.
El-Dakhakhni et al. proposed a model with three diagonal struts in each direction, one in the diagonal of the panel and the other two non-parallel in the off-diagonal. According to the researchers, this approach was better suited to compute the wall stiffness and to describe the development of stresses along the frame elements when compared to other models with fewer diagonal struts [24].
Until 2009, the simulation of the infill panels was only performed by considering their IP behavior without any consideration of the OOP response. Kadysiewski et al. proposed the first simplified model capable of simulating both the IP and OOP behavior of the infill walls, with a single diagonal beam–column element with a node at the mid-span having a concentrated mass to trigger the OOP inertia forces [25]. After that, Furtado et al. proposed an equivalent double-strut model comprising four diagonal struts and one central element that simulated the combined IP and OOP behavior [26]. For this, a nonlinear IP uniaxial material model was assumed for the central element. The mass of the panel was distributed into the two central nodes. A linear elastic OOP behavior was assumed by the authors.
Later, other authors proposed different strut model approaches, but none of them focused on the effect of the opening on the strength and stiffness degradation of the walls [27,28].
The developed models include many parameters even for the same masonry typologies [10,29]. On the one hand, such variability can lead to high uncertainties in the overall behavior [8,30], particularly for cases with no reference (that is, blind prediction). On the other hand, a simplified model with a schematic approach for application is essential for design engineers who look toward practical solutions. Furthermore, most existing approaches rely on expressing the strut parameters in a consistent manner, such as defining the strut width as a fraction of its diagonal length. In this context, this paper used the conventional strut model to simulate real experimental tests with different configurations (namely, a bare frame configuration or an infilled configuration with and without openings). Initially, the reliability of the strut model in capturing the overall behavior was evaluated by comparing it with experimental tests by optimizing the input parameters of the strut model. In this context, an optimization method for the input parameters was employed to accurately reflect real behavior. Subsequently, the optimized parameters were analyzed in comparison with the most commonly used models. This comparison revealed that maintaining a consistent strut width can lead to significant errors.

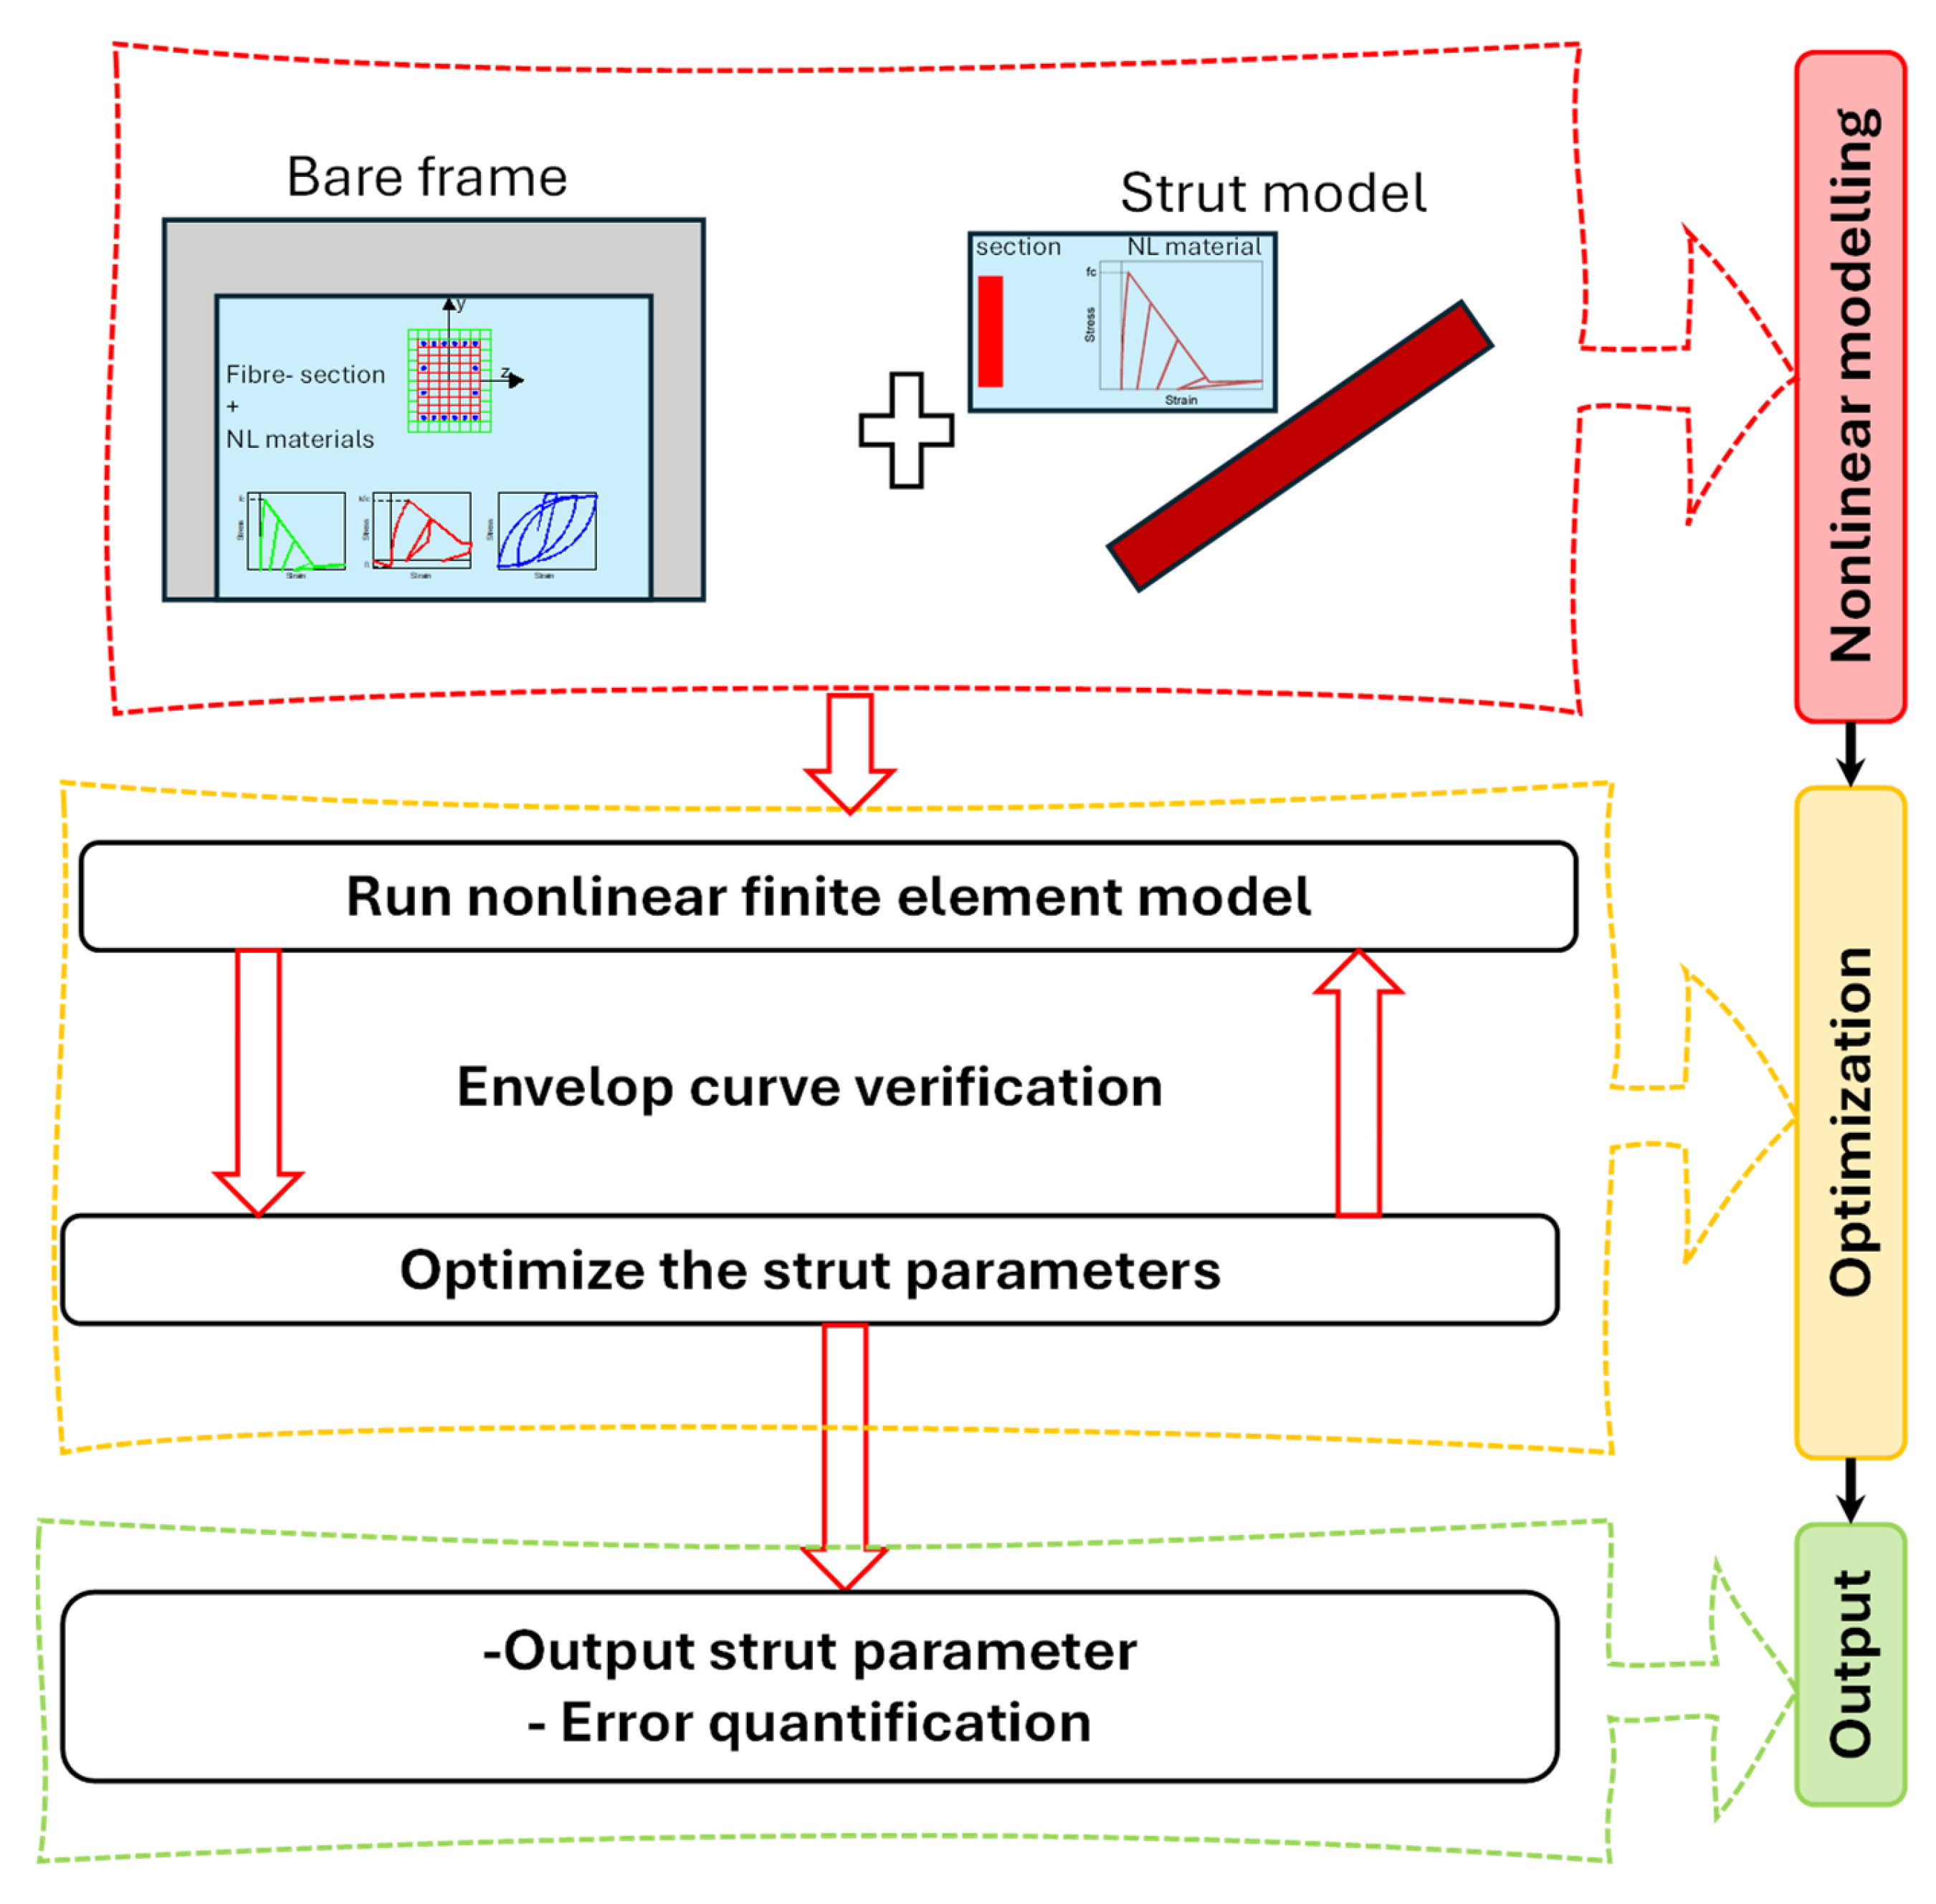
2. Proposed Numerical Modelling Approach

Macro-models, such as strut-type models, are commonly used to computationally represent the overall force–displacement relationship of infilled masonry frames, often in combination with experimental observations. However, the properties of such models can be challenging to determine due to uncertainties in the material properties of the different components used in the experiments. This difficulty can make it challenging to directly compare the model’s behavior with experimental observations during the calibration process. Consequently, researchers have developed micro-models that use finite element analysis tools to capture the complex behavior of infilled masonry frames, including the brittle failure mechanisms in the infill at the mortar joints, as well as the infill–frame interaction. Micro-models offer a cost-effective alternative to experimental tests for the calibration process of macro-models, providing a detailed insight into the response of infilled masonry frames with different configurations. Moreover, these models can potentially represent multiple failure modes that can occur in the infill or the frame, making them a valuable tool for simulating the behavior of infilled masonry frames. The modelling methodology that is adopted in this paper is shown in Figure 1. Generally, the modelling of the bare frame was conducted using a fiber-based modelling strategy, while the strut was modelled using a truss element with concrete-like compression-only behavior. An initial input was used to define the strut area, followed by running the analysis. Consequently, the envelope curve of the infilled RC frame was obtained and compared to the experimental counterpart. Using optimization tools, the final parameters of the strut were identified. It is important to note that the optimization process for the strut parameters focused on comparing the envelope curve, rather than optimizing the loading and unloading stiffnesses of the strut’s constitutive material.

2.1. Description of the Modelling Approach for Infilled RC Frames without Openings

OpenSees software version 1.2 [31] provides a reliable and flexible platform for modelling structural elements [4], with the added benefit of seamless integration with other software for input and postprocessing data. Therefore, numerical models for this study were generated using the OpenSees software. The adopted modelling strategy for the RC elements is shown in Figure 2. The RC elements were modelled using the Beam with Hinges element from the OpenSees element library, which can specify the plastic hinge lengths at the element ends. To accommodate any extended plasticity beyond the hinge zones, fiber sections were also considered in the central part of the element. A modified Radau hinge integration method [3,32] was used, applying two-point Gauss integration over the interior element and two-point Gauss–Radau integration over the lengths of the two hinges. The length of the hinges at the end of each element was quantified using a proposal by [5]:
l p = 0.08 l e + 0.022 d b   f y
The length of the hinges at the end of each element was determined using a formula that took into account the length of the element (le), the diameter of the longitudinal steel rebar (db), and the yield strength of the steel used (fy) in MPa.
Figure 2. The adopted strategy for modelling the RC elements: (a) general description of the beam with a hinge element; and (b) fiber discretization.
Buildings 14 01902 g002
The structure was discretized into three different materials to model the expected behavior of each element of the RC section, as illustrated in Figure 2b. The cover of the structure was modelled using the Concrete01 model, which assumed zero tensile strength and no confinement. However, in the middle region where the steel stirrups were present, the confined ratio was considered to incorporate their effect. The strength of the concrete sections that were confined by the stirrups was modified accordingly. The Concrete02 model in OpenSees was used for the confined concrete, which considered a tensile strength of 10% of the compressive strength. The longitudinal rebars were modelled using the Steel02 model in OpenSees, which incorporated isotropic hardening and followed the Giuffre–Menegotto–Pinto uniaxial model. To model the beam–column connection, a rigid end–offset joint model was utilized, in which the lengths of the rigid parts were set to half the depth of the perpendicular element.
To model the infills, a single compressive strut element was used, and its area was determined using the expression proposed by Hendry [33], based on the constitutive model for masonry that was shaped to match the Concrete01 constitutive model. Hendry’s constitutive model is expressed as follows:
σ m = f m 2 ε m ε c r m ε m ε c r m 2
where ε m and σ m are the compressive strain and the corresponding compressive stress of the masonry, respectively; f m is the maximum compressive strength of the masonry; and εcrm is the compressive strain at the onset of failure, which, according to [7], ranges from 0.0015 to 0.002. In these analyses, the value of εcrm was 0.002 in all the models. An optimized approach was implemented to determine the strut parameters, namely, the strut area, rather than relying on existing empirical formulae. In this context, multiple runs were used to optimize the strut width, which provided the best fit to the experimental data.

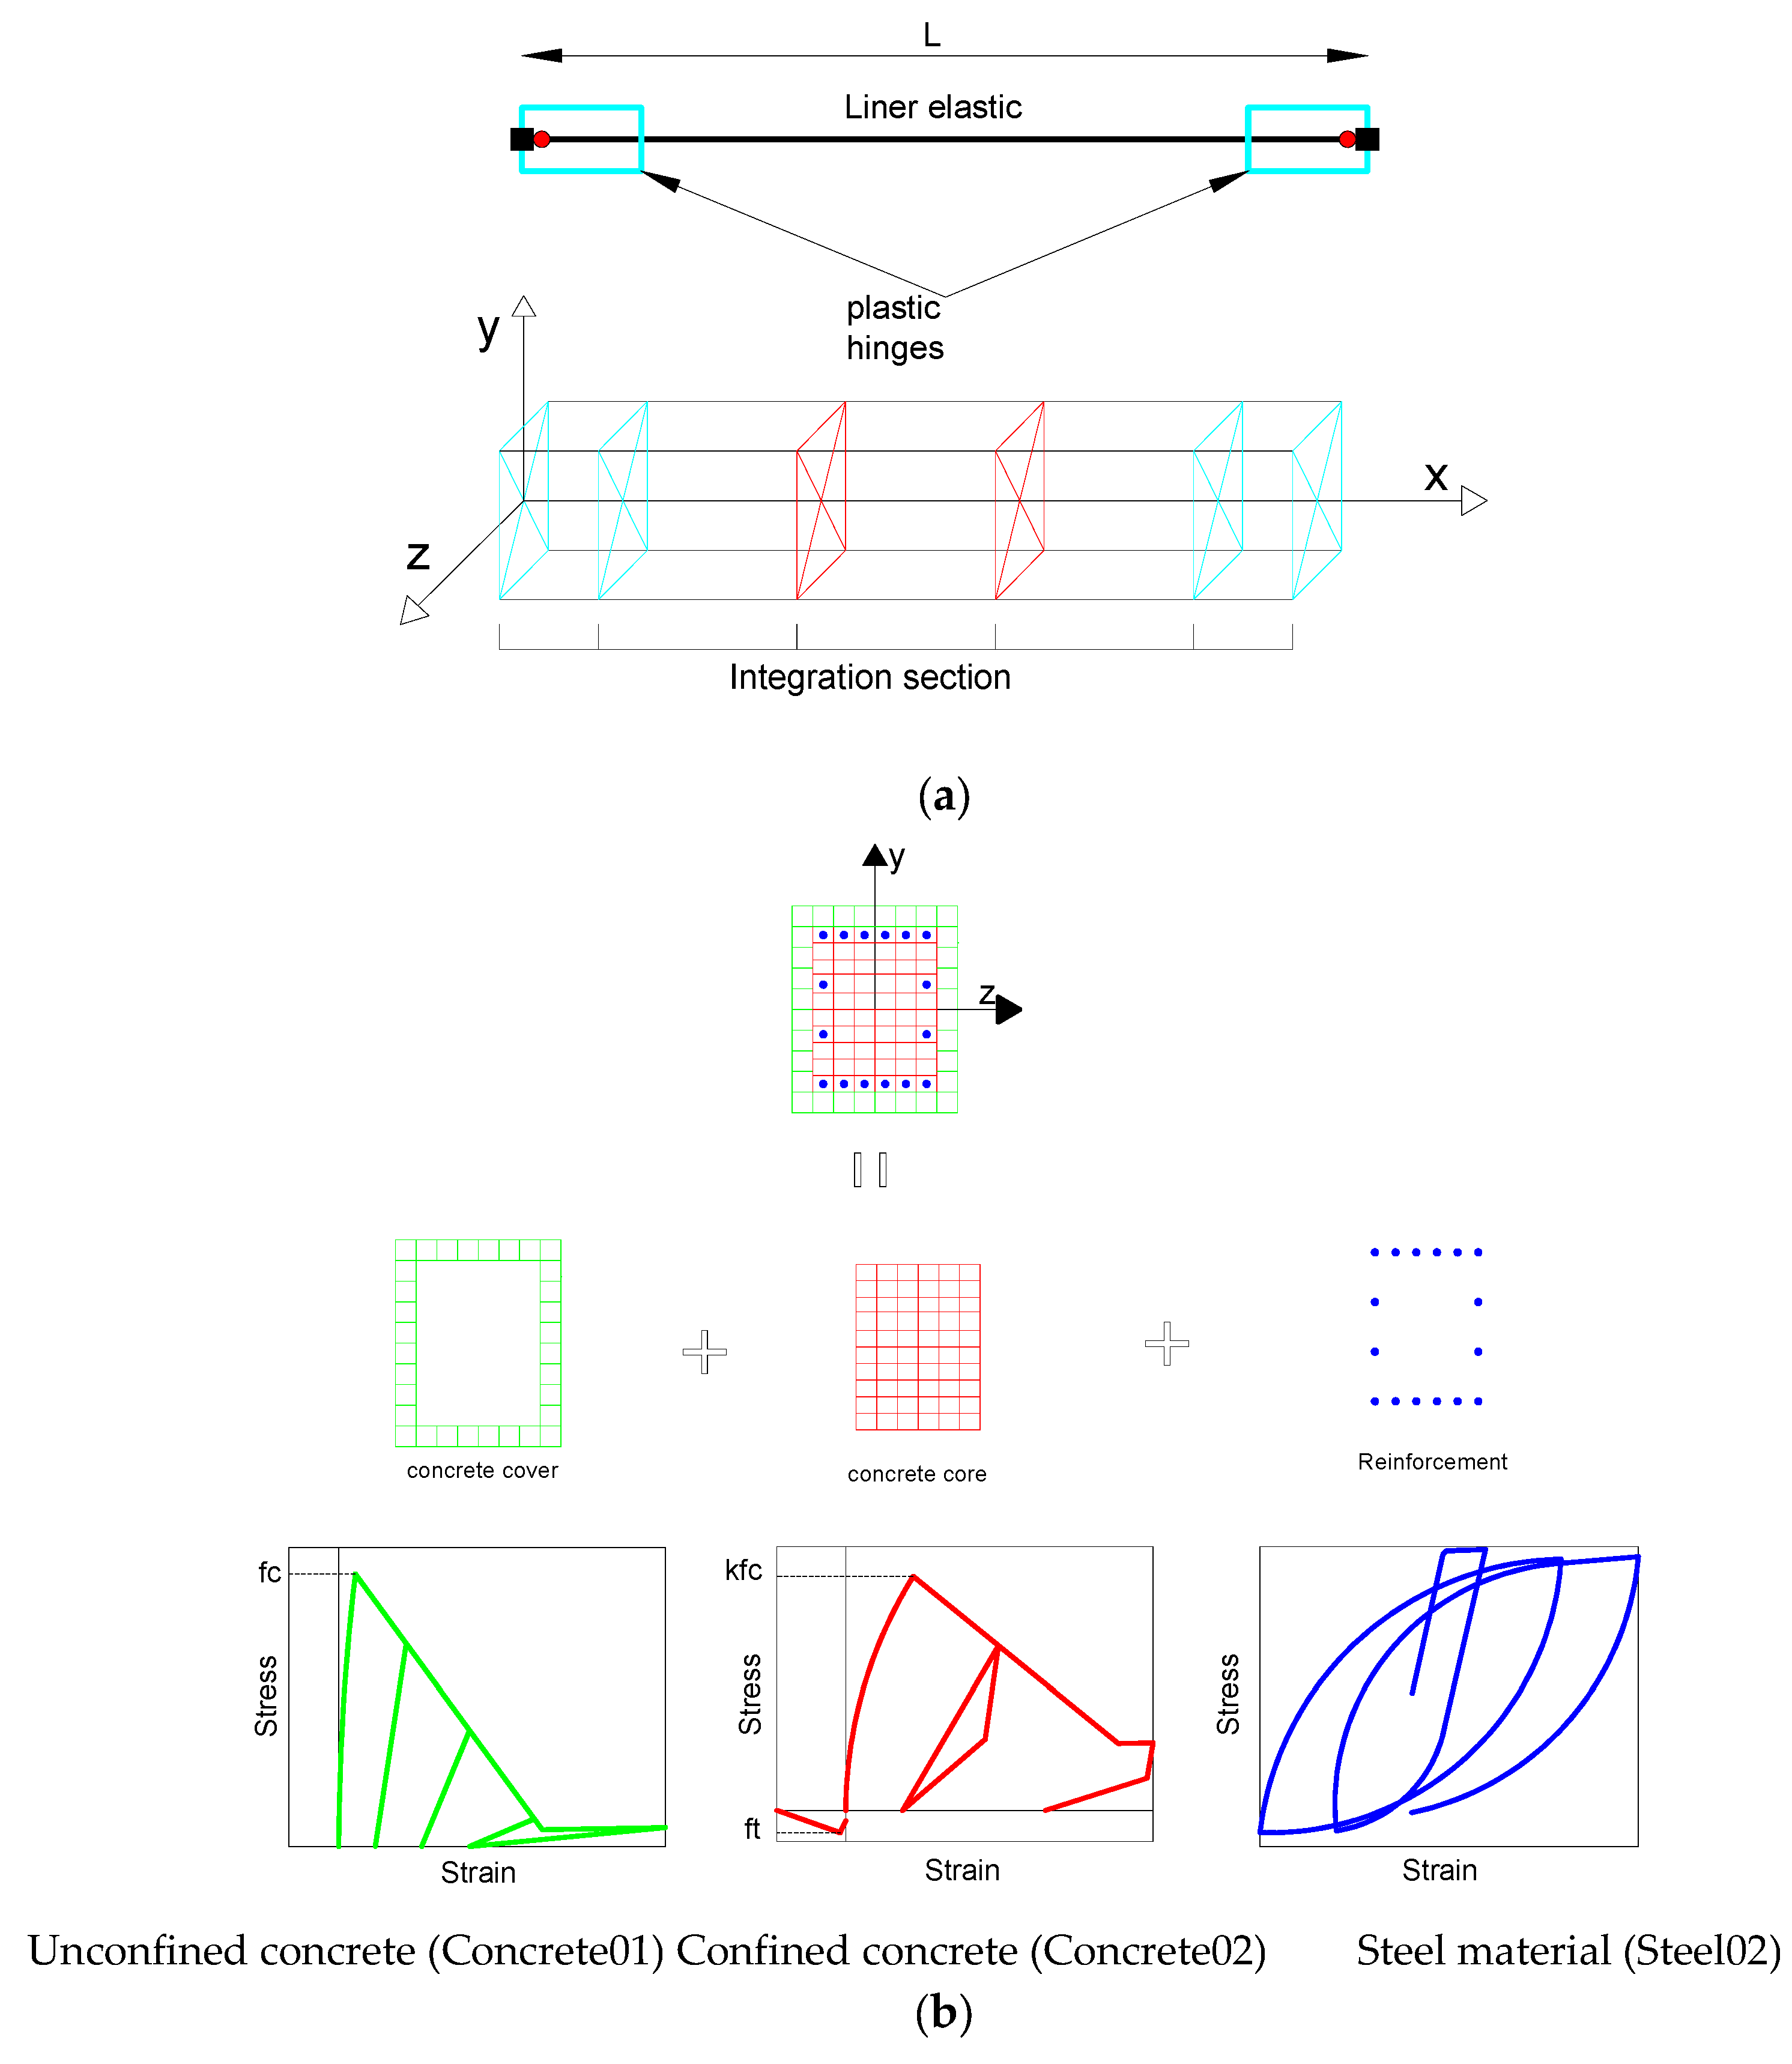
2.2. Description of the Modelling Approach for Infilled RC Frames with Openings

In this section, is discuss how partially infilled RC frames were modelled in this study. Such frames are RC frames with infill walls that have openings such as windows or doors. These openings affect the ability of the infill wall to distribute loads and, therefore, reduce the panel’s stiffness, ultimate strength, and capacity for dissipating energy. To model partially infilled walls, two main strategies for the existing experimental tests have been proposed [8]: the first strategy is to use single/multiple diagonal strut systems with a reduced strength [33,34]; the second strategy involves truss configurations consisting of several crossed struts [21]. However, the latter strategy comes with a high computational cost, making the former strategy more common in the literature [8].
Several proposals have been found in the literature to quantify the reduction factor that accounts for infill walls, considering different opening parameters such as size, aspect ratio, type, and position. To assess the reliability of the existing models, Mohamed and Romão [8] presented a new model that showed an adequacy performance compared to the other models. This model will be used to quantify the reduction factor in this study. As such, the optimized parameters that were derived from the optimization were combined with the reduction factors obtained from the referred expression to accurately model the partially infilled RC frames.

3. Validation of the Modelling Approach

The modelling strategy was validated by simulating the experiments tested in two testing campaigns. The first validation was performed by simulating seven tests that were studied by Kakaletsis and Karayannis [35]. This testing campaign comprised specimens with a single story and with one bay at a scale of 1:3. The second testing campaign was carried out by [36] and comprised three full-scale one-bay and one-story specimens.

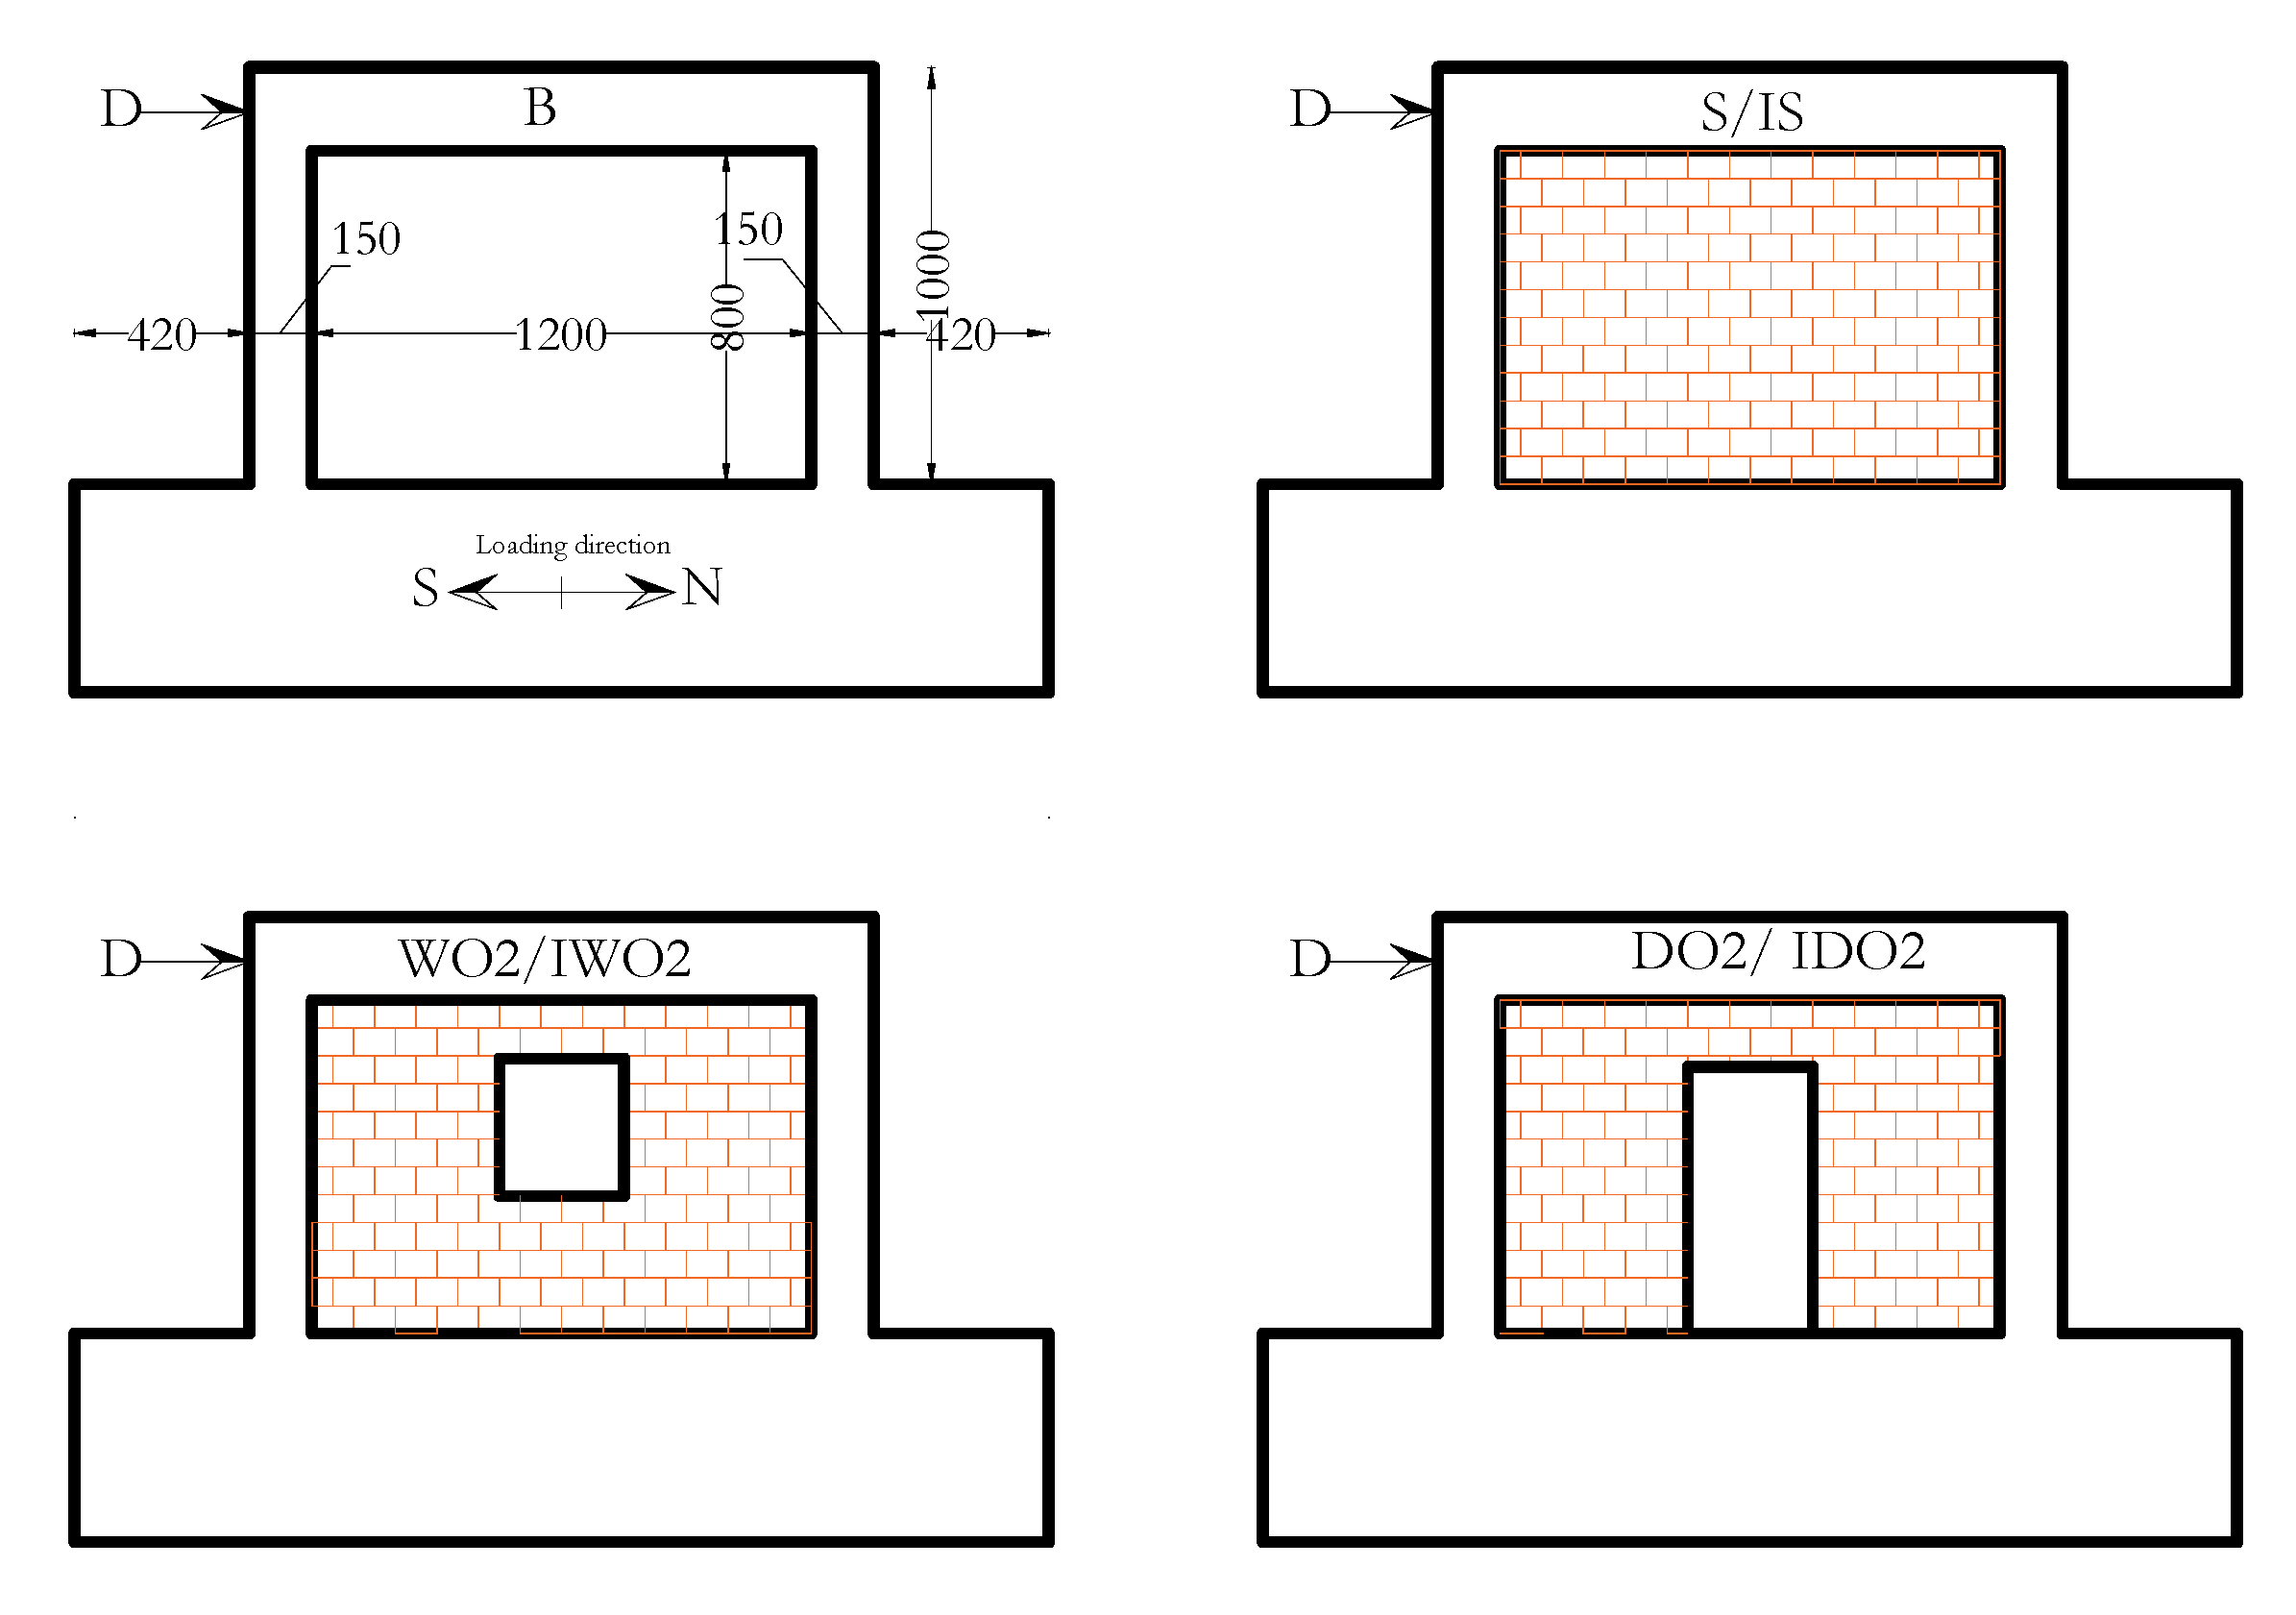
3.1. Scale Specimens

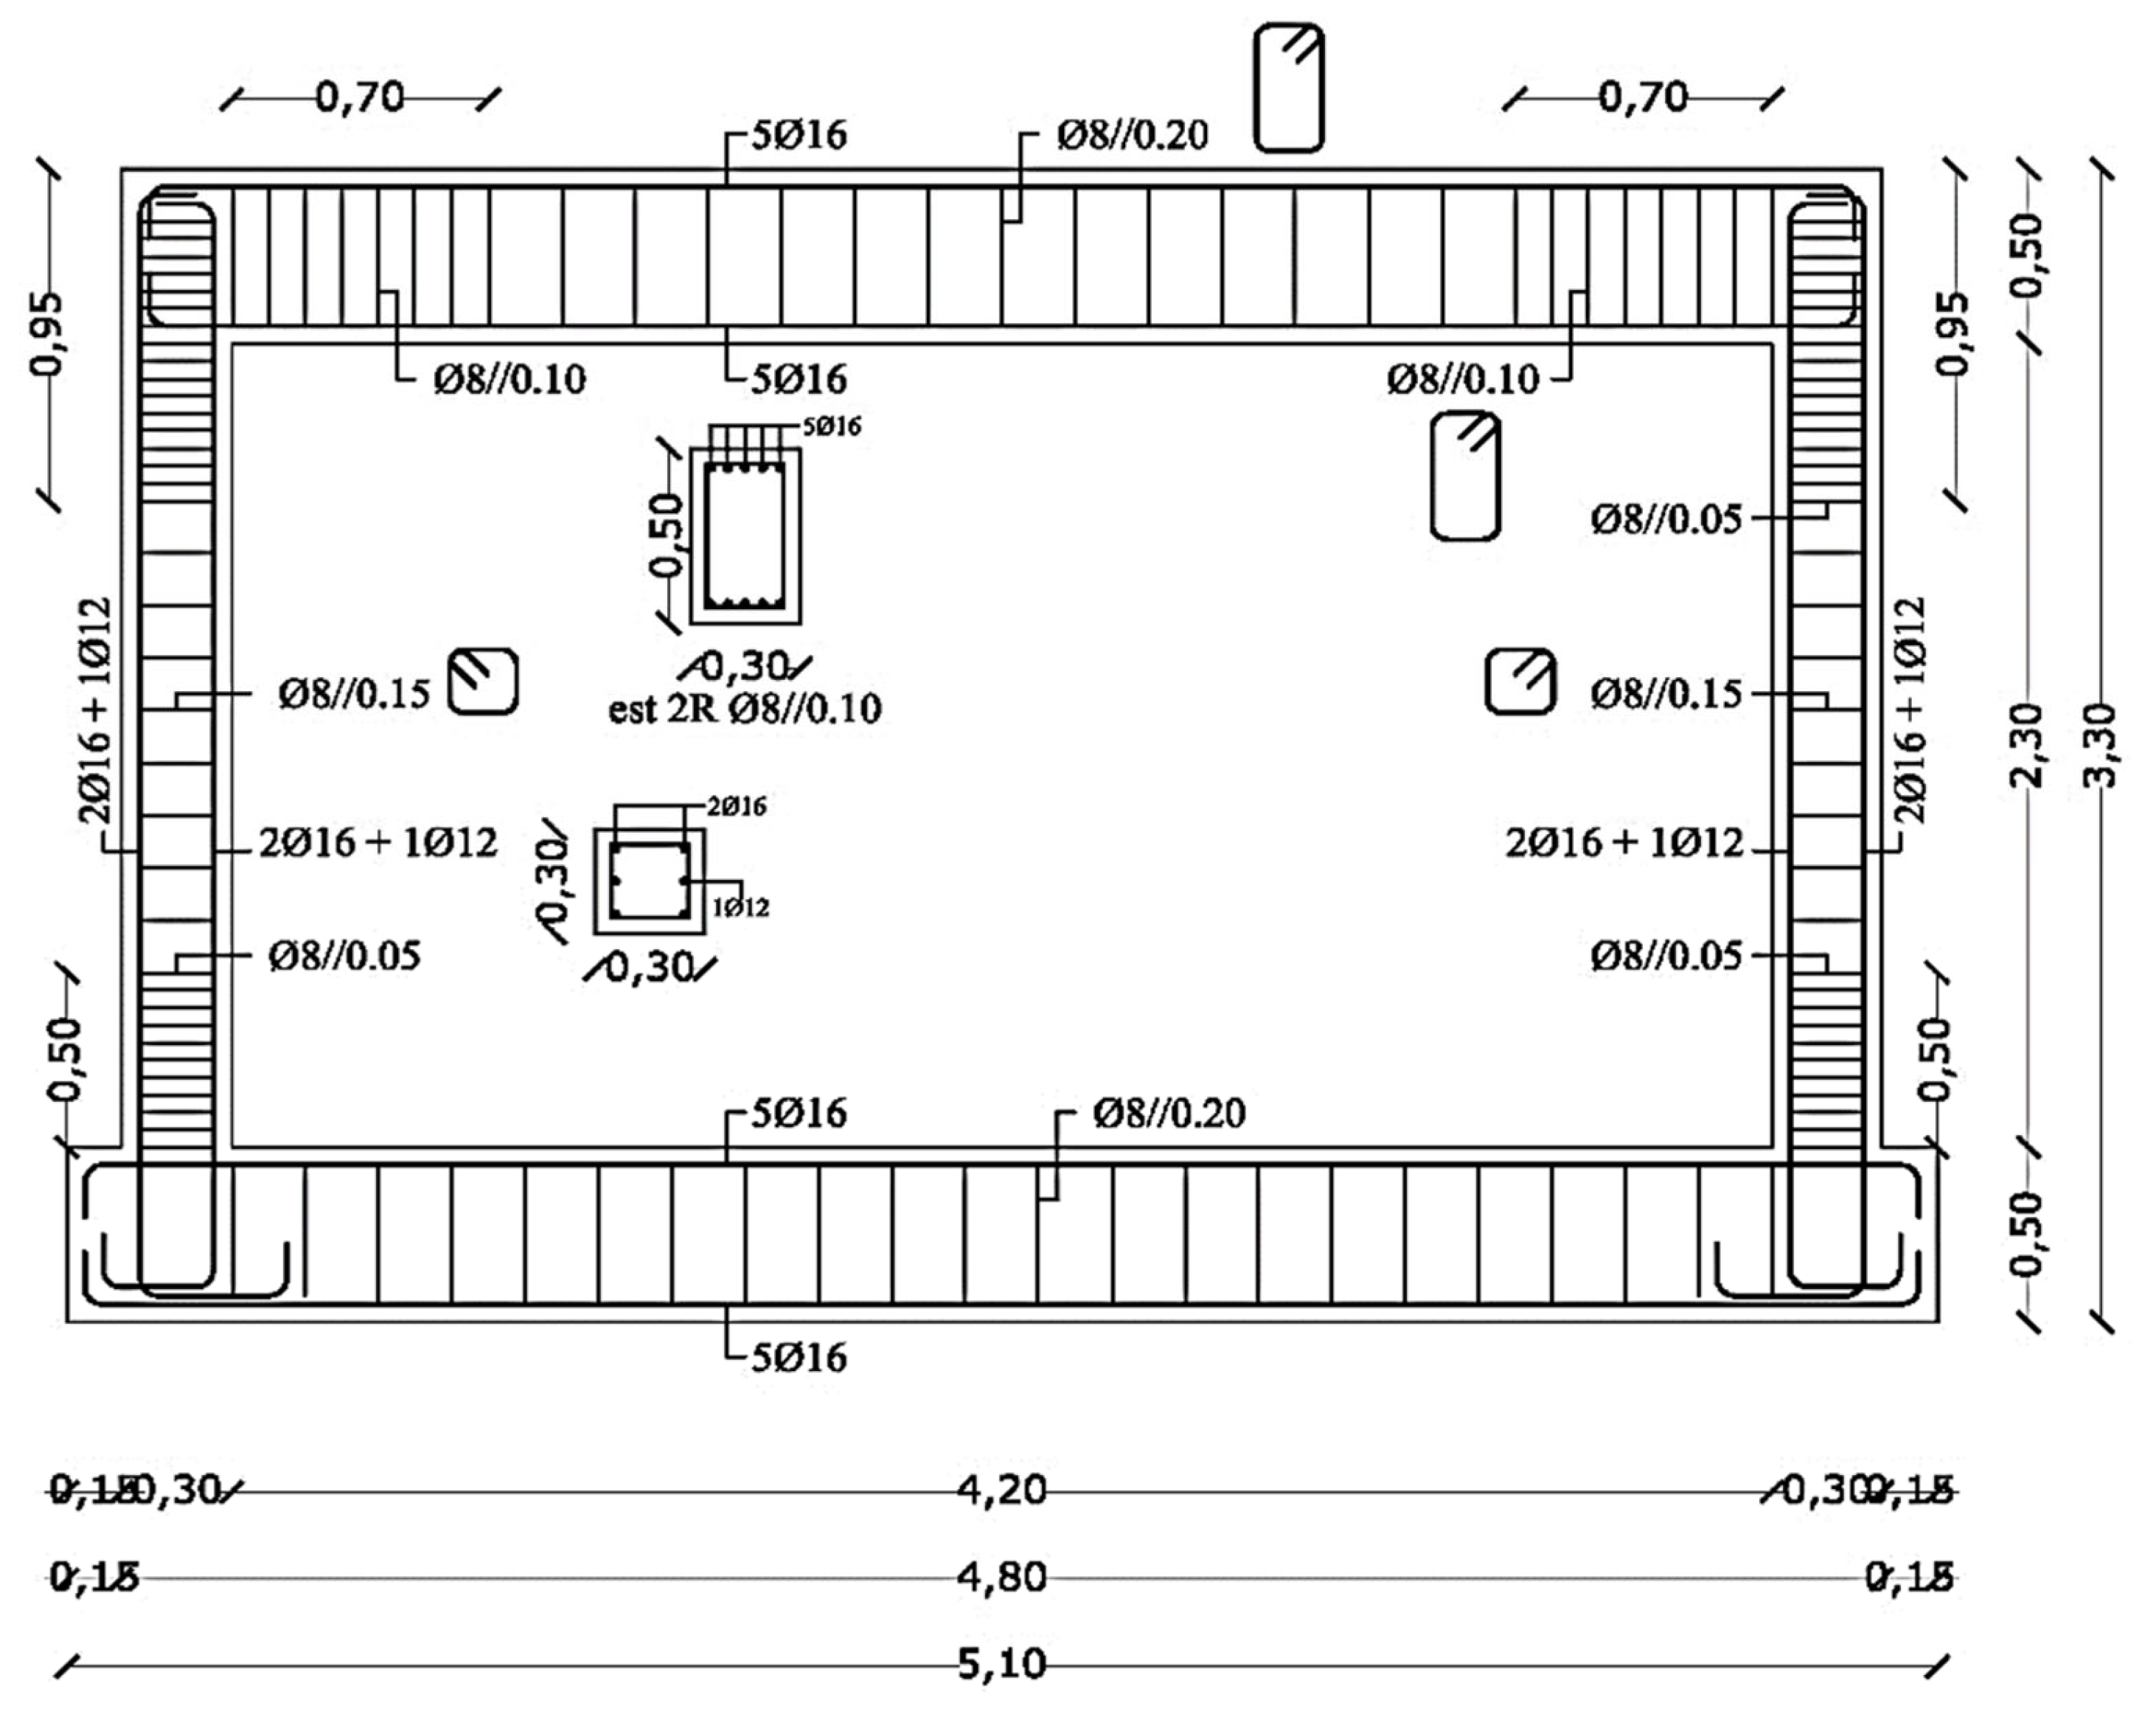
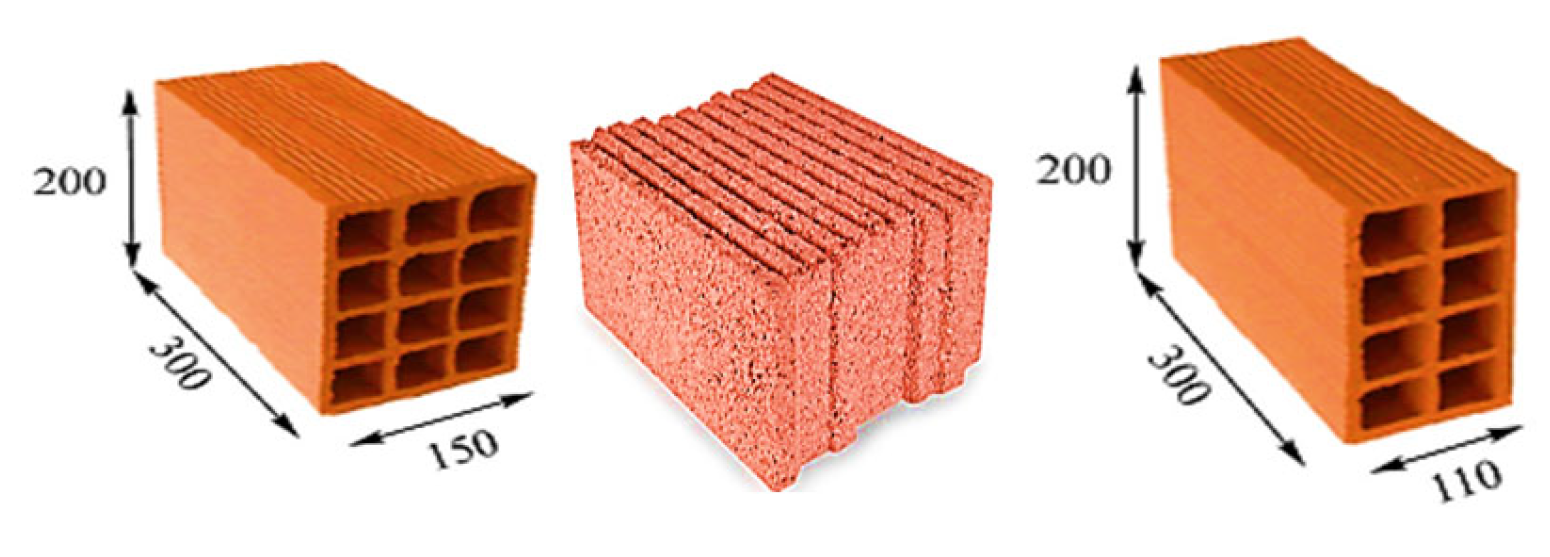
3.1.1. Details of the Geometry and Specimens

Kakaletsis and Karayannis [35] used a total of five specimens, including one bare frame specimen and four infilled specimens with clay brick infills. Among the infilled specimens, only one was fully infilled, while the rest had partially infilled panels with openings of various sizes and aspect ratios. The specimens were one-story and one-bay frames, at a 1:3 scale, and were subjected to reversed cyclic quasi-static horizontal loading until a drift of 4% was reached. This study aimed to investigate the effect of the infill panels with openings on the seismic performance of the RC frames. The details of the specimens are presented in Table 1 and are shown in Figure 3. The dimensions plotted in Figure 2 correspond to the 1:3 scale of the prototype RC frame models built and tested.
The reference frame, which was the bare frame, was designed with specific details, as shown in Figure 4a. The beam cross-section was 100 × 200 mm2, while the column cross-section was 150 × 150 mm2. The scale of these dimensions corresponded to one-third of the prototype frame sections, with the beam and column having dimensions of 300 × 600 mm2 and 450 × 450 mm2, respectively. The column had closer ties along its entire length, while the beam had more shear reinforcement in the critical regions. Each beam-to-column joint had five horizontal stirrups to prevent brittle shear failure. The longitudinal reinforcement diameter was Φ5.60 millimeters, and the stirrup diameter was Φ3 millimeters, corresponding to a 1:3 ratio of Φ18 and Φ10 millimeter reinforcement diameters, respectively. The RC frame was designed to represent a typical ductile concrete construction built in Greece in accordance with the current codes and standards, such as EC8 [37].
To clarify the dimensions of the brick, it was used a standard solid clay brick with dimensions of 250 × 120 × 65 mm3. The mortar joint thickness was kept constant at 10 mm, which is the typical value used in practice. The proportion of the mortar mixture used in the infills was 1:1:6 (cement–lime–sand) by volume, which was found to produce mechanical properties similar to type M1 mortar [38].
The specimen notation presented in Table 1 is B for the bare frame configuration, S for the infilled frame configuration without an opening and with weak masonry, IS for the infilled frame configuration without an opening and with weak masonry, WO2 for the infilled frame configuration with a central window and with weak masonry, IWO2 for the infilled frame configuration with a central window and with strong masonry, DO2 for the infilled frame configuration with a central door and with weak masonry, and IDO2 for the infilled frame configuration with a central door and with strong masonry. The geometric dimensions of the brick units used in these tests are presented in Figure 4b.

3.1.2. Material Properties

In order to evaluate the mechanical properties of the materials used for the construction of the infill panels, a set of supplementary tests was conducted. These tests included compression tests of the mortar cubes, compression tests of the masonry units, compression tests of the horizontal prisms (which were perpendicular to the voids) and vertical prisms (which were parallel to the voids) of the masonry, tests on the angle of internal friction, and tests on the shear strength (that is, the cohesion) with zero pre-compression. Table 2 summarizes the average values of the measured parameters for the infill panel materials.
To evaluate the RC frame materials, the compressive strength of the concrete was evaluated using the standard compression tests. Tensile tests were also conducted on the steel bars to evaluate their tensile strength. The average results obtained from those tests are summarized in Table 3.

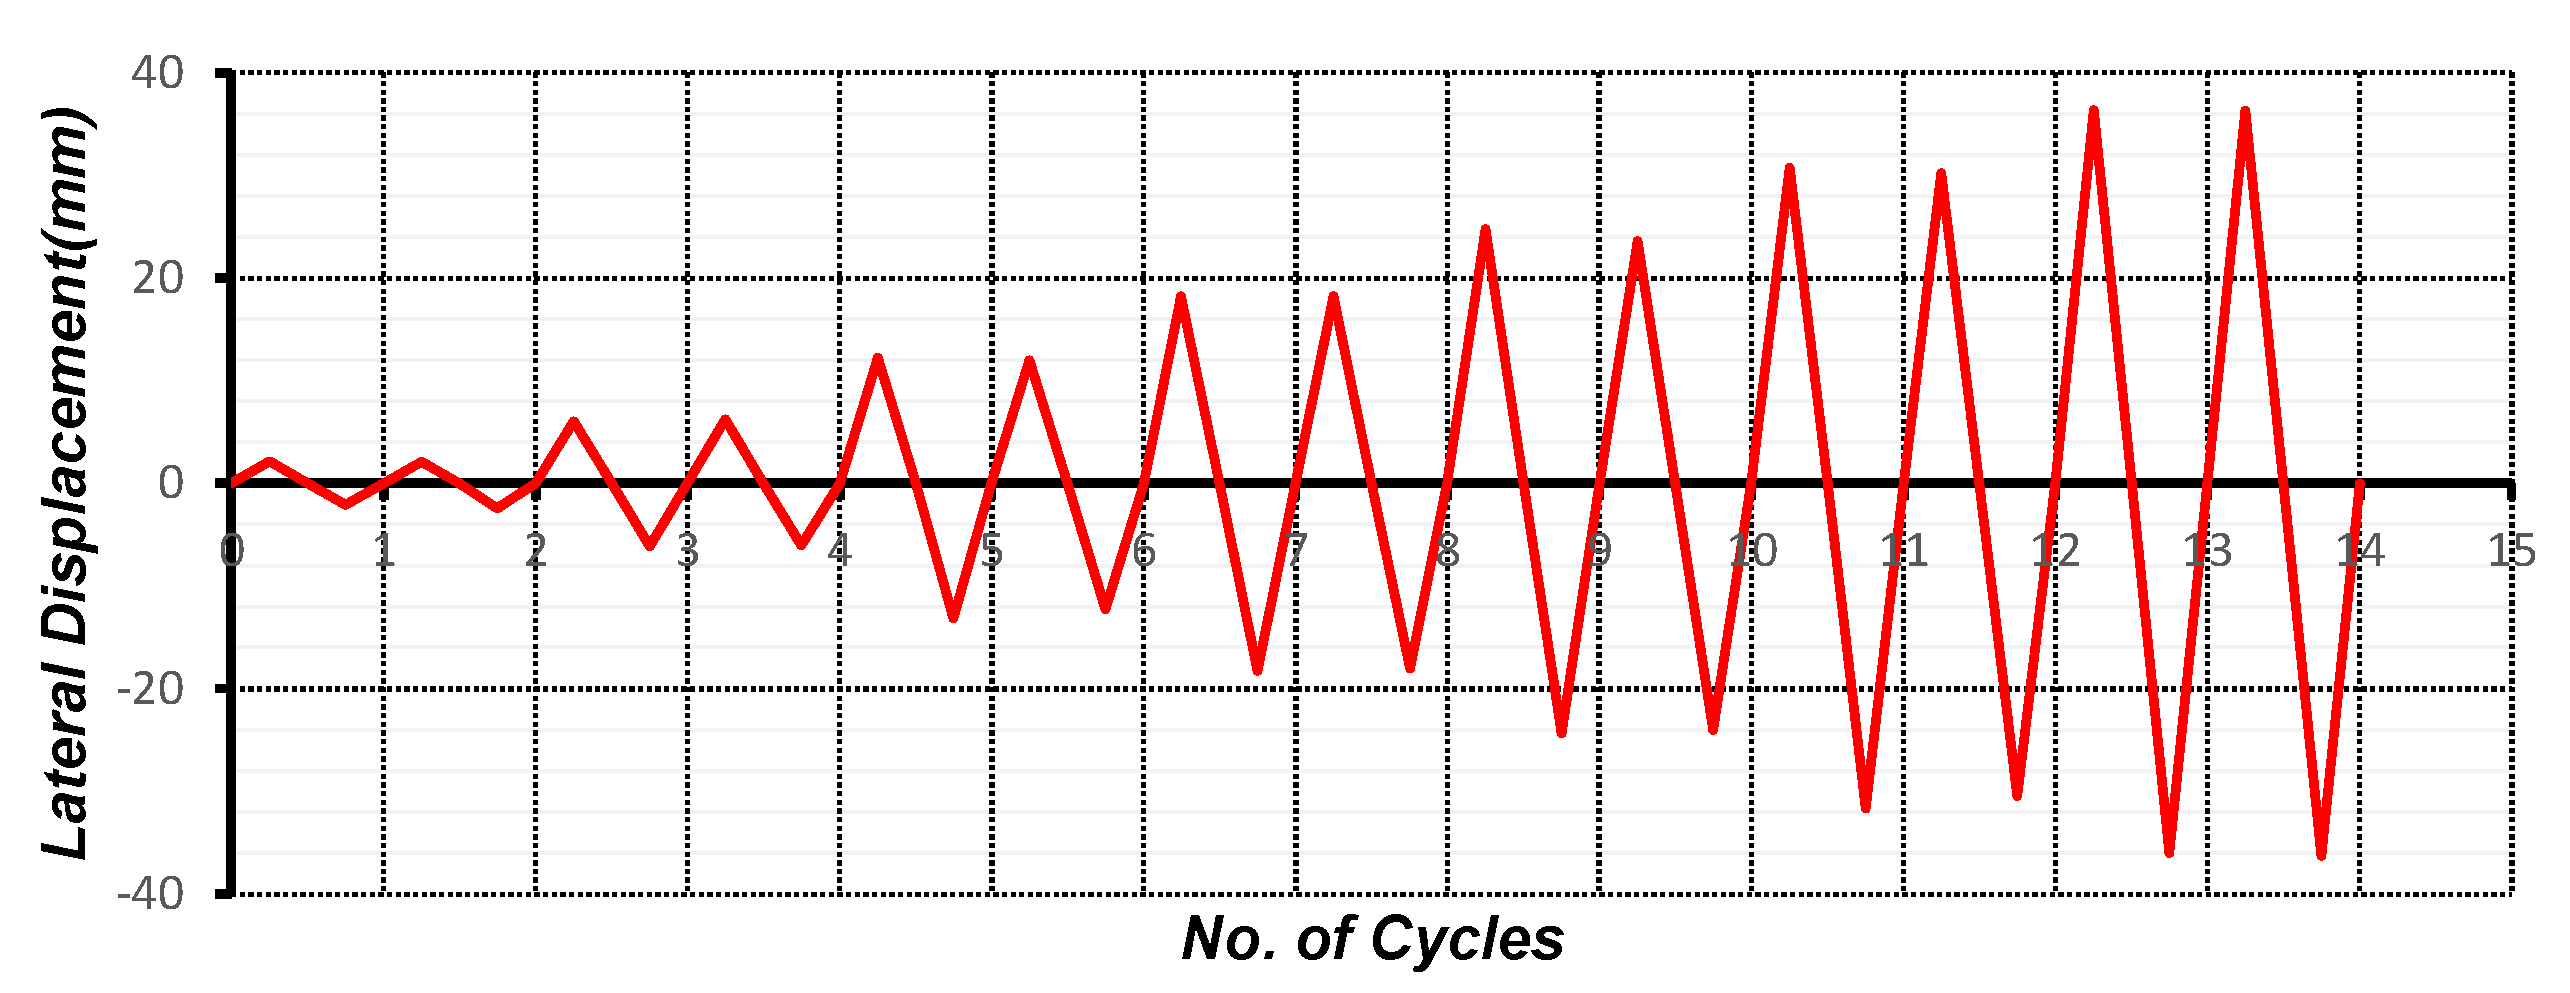
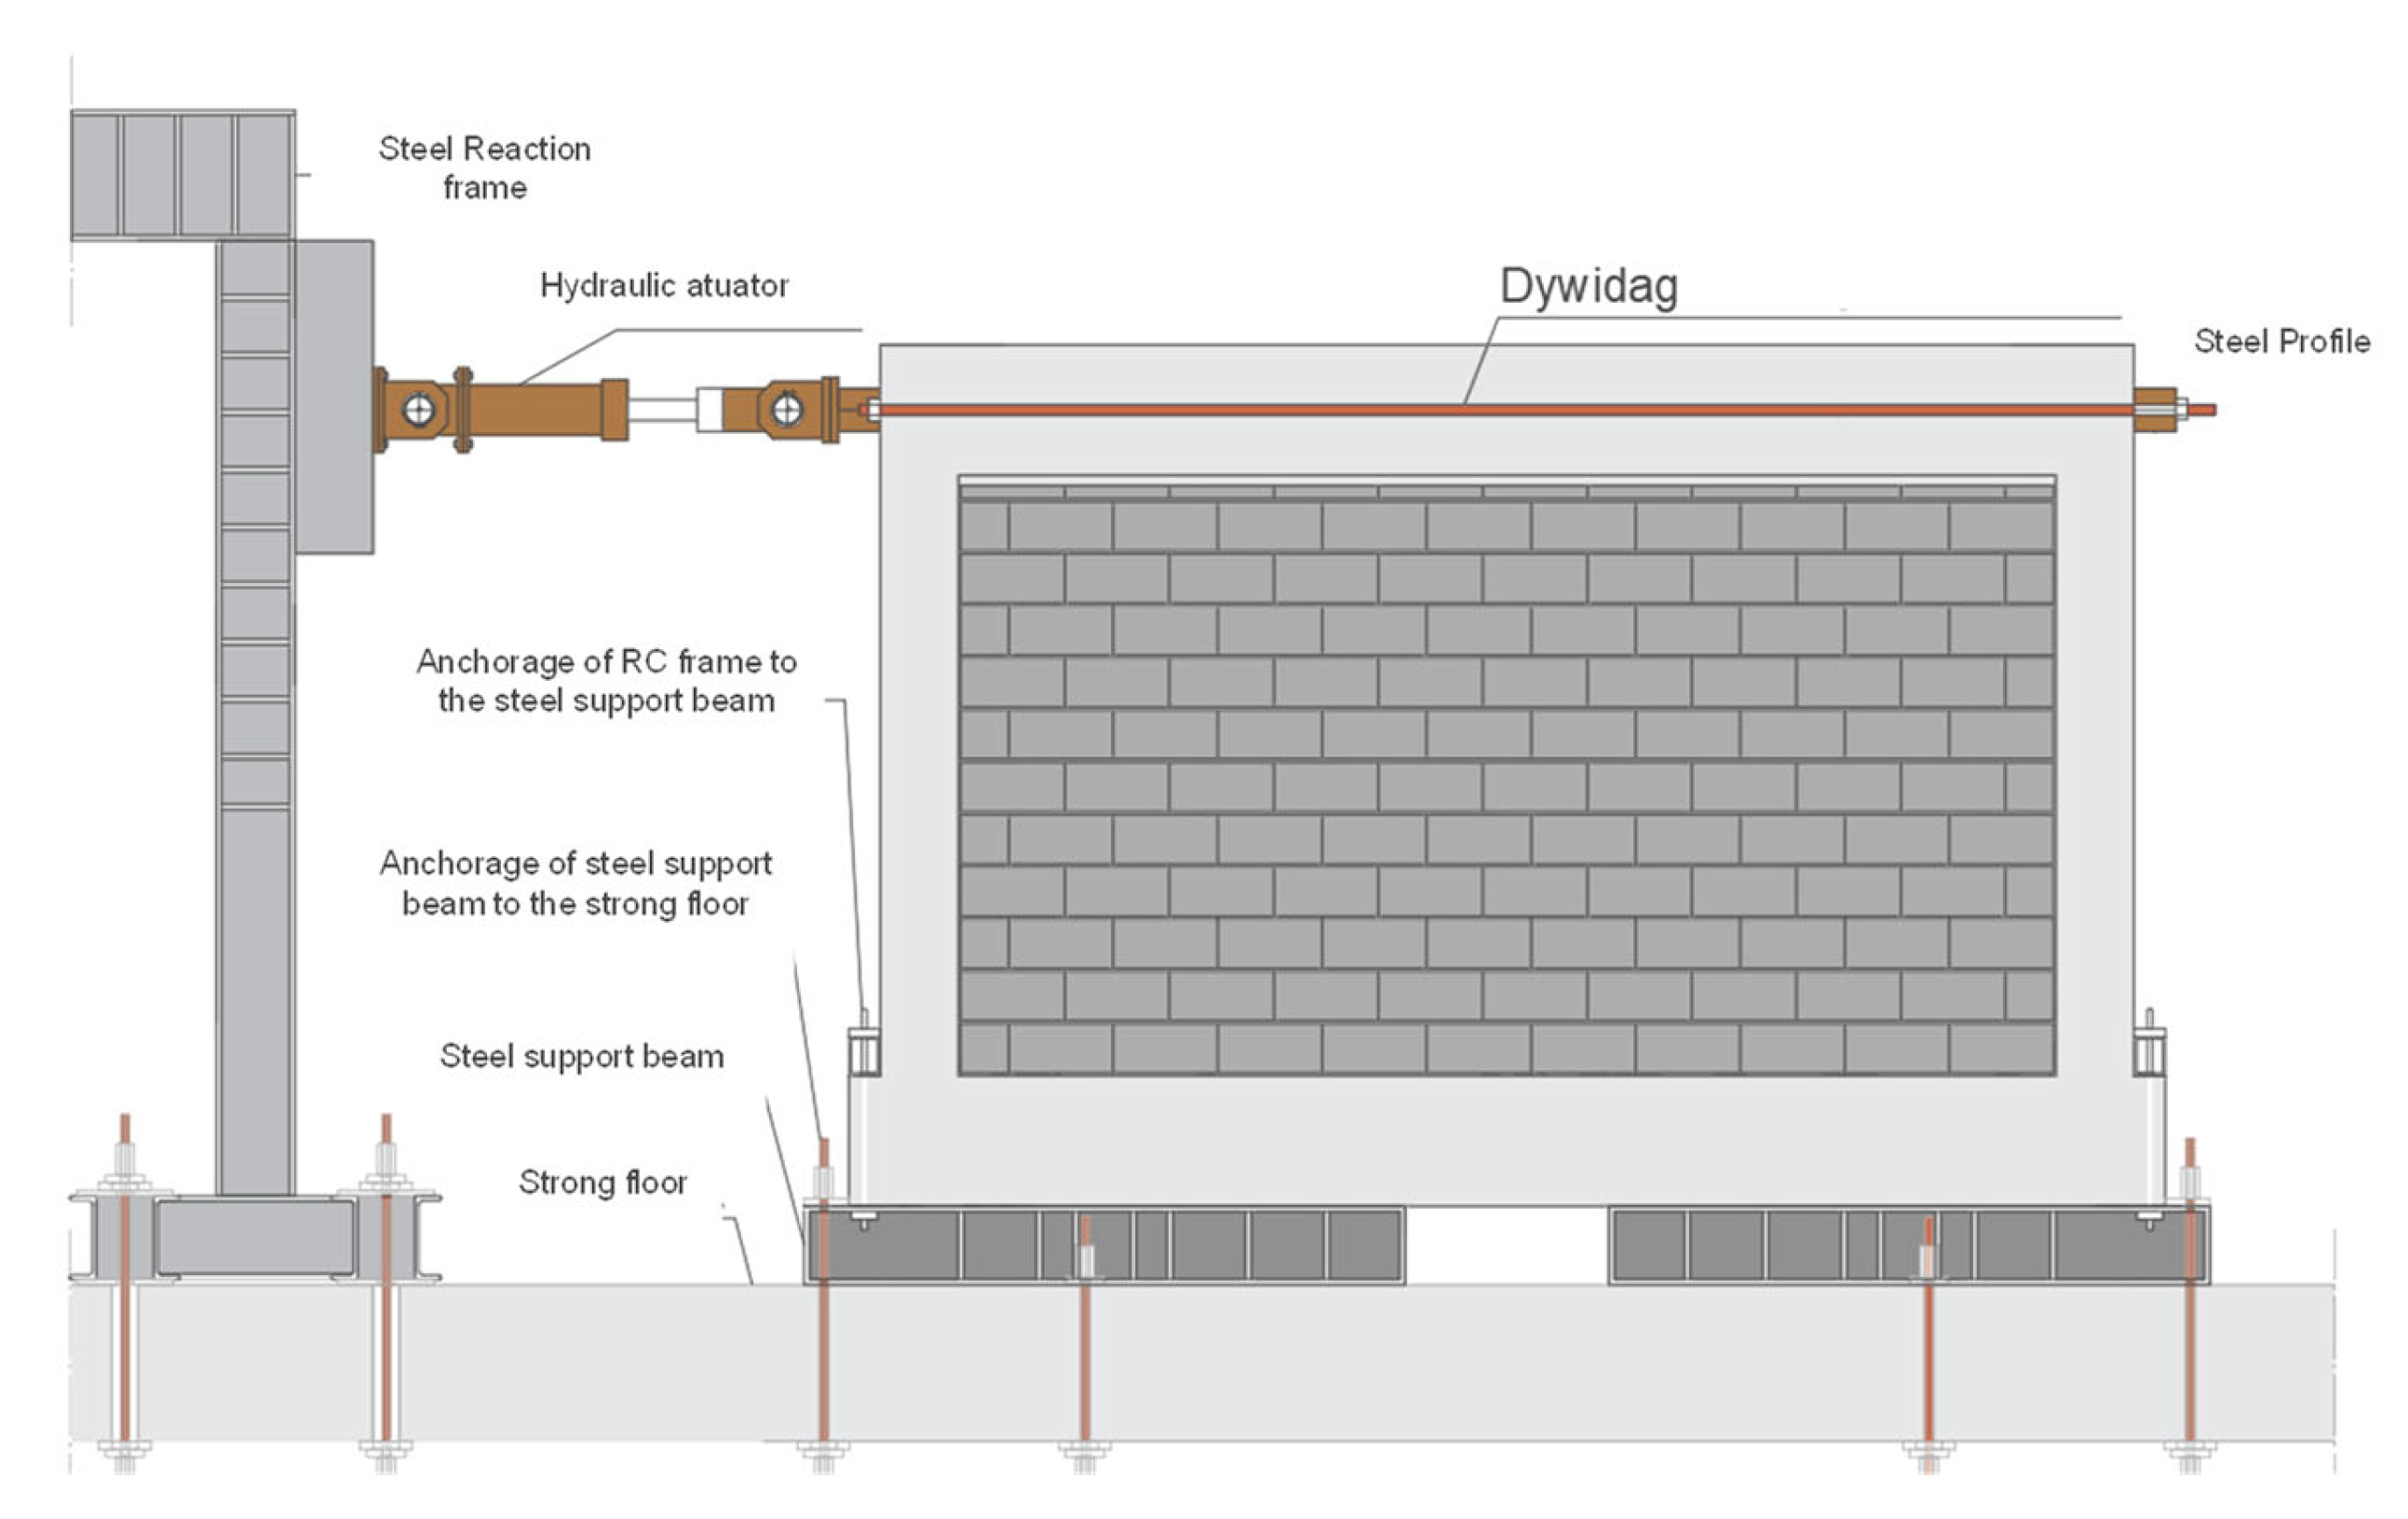
3.1.3. Test Setup and Loading Protocol

During the lateral loading tests, a double action hydraulic actuator was used to apply the lateral load, while hydraulic jacks were used to apply the vertical loads. The jacks were connected to four strands at the top of the column, and the axial compressive load was set to 50 kN per column, which represented 10% of the ultimate load. A Linear Variable Differential Transformer (LVDT) was used to measure the lateral drift of the frame, while a load cell measured the lateral force of the hydraulic actuator. The horizontal loading sequence involved gradually increasing the displacements, as shown in Figure 5, and the full loading cycle was applied at each displacement level.

3.2. Full-Scale Specimens

3.2.1. Details of the Geometry and Specimens

The infill wall dimensions used in this study were set at 4.20 × 2.30 m (length and width, respectively (see Figure 6)), which were chosen to be representative of those found in Portuguese building stock. The RC frame geometry was designed to be in accordance with the current codes and standards. The frame had a length of 4.80 m and a height of 3.30 m. The columns’ and beams’ cross-sections were 0.30 × 0.30 m2, and the longitudinal reinforcement was 4ϕ16 mm + 2ϕ12 mm. The beams’ cross-section was 0.30 × 0.50 m2, and the longitudinal reinforcement was 5ϕ16 mm + 5ϕ16 mm. One wall was built without openings (specimen 11), and the other was built with a central window (Inf_14) with a geometry of 1.40 × 1.25 m2.
Three types of masonry units were studied, namely, hollow clay horizontal brick units with a thickness of 150 mm (specimen LESE_150) and 110 mm (specimen LESE_110) and vertical concrete lightweight blocks with a thickness equal to 315 mm (LESE_315), as shown in Figure 7.

3.2.2. Material Properties

The construction material of the RC frame specimen consisted of regular C20/25 class concrete, with a coefficient of variation of 6.1% and a mean cubic compressive strength of fcm, cyl = 21.4 MPa, with a standard deviation of 1.35 MPa. A mean elastic modulus of 24.3 GPa was identified, with a standard deviation of 0.21 GPa and a coefficient of variation of 0.9%. Three different bar diameters were used for the steel reinforcement from the same lot, namely 6 mm, 10 mm, and 16 mm. From the test results, the yield strength and the young modulus of the steel bars were 444 MPa and 204.2 GPa for the ϕ6 mm bars, 598.9 MPa and 209.7 GPa for the ϕ10 mm bars, and 494.4 MPa and 209.4 GPa for the ϕ16 mm bars, as shown in Table 4.

3.2.3. Test Setup and Loading Protocol

During the quasi-static IP cyclic test of the full-scale specimens, the hydraulic actuator applied a horizontal force at half the height of the upper beam of the RC frame using a capacity of approximately 500 kN and +/−150 mm of travel. The force was transmitted through two steel profiles positioned on the top beam’s extremities linked together by four Dywidag prestressed bars (ø = 27 mm), which resulted in a beam compression of approximately 170 kN, ensuring full-cycle tests were performed. A steel structure was positioned at the back of the RC frame and linked in two points of the frame’s top beam to prevent OOP displacement or rotation of the structure during the test. Figure 8 presents a schematic layout of the quasi-static cyclic test.
The quasi-static IP cyclic loading test involved applying a horizontal load to the RC frame’s upper beam at half-height, in the form of target displacements, until the structure reached a drift of 0.3%. Each cycle began with an increase in loading until the target displacement was reached, followed by unloading to the inverse target displacement, and then unloading again. Three target displacements were used: 2.8 mm, 5.6 mm, and 8.4 mm, which corresponded to drift ratios of 0.1%, 0.2%, and 0.3%, respectively. Each target displacement was repeated three times, resulting in a total of nine complete cycles. In the case of this quasi-static IP cyclic test, the drift was computed as the displacement of the top beam–column joint divided by the distance between the bottom and top beam–column joints. To avoid any effect of the frame sliding, the displacement of the bottom beam–column joint was subtracted from the displacement of the top beam–column joint. This ratio was expressed as a percentage and was used to quantify the structure’s performance under lateral loads.

4. Numerical Results and Discussion

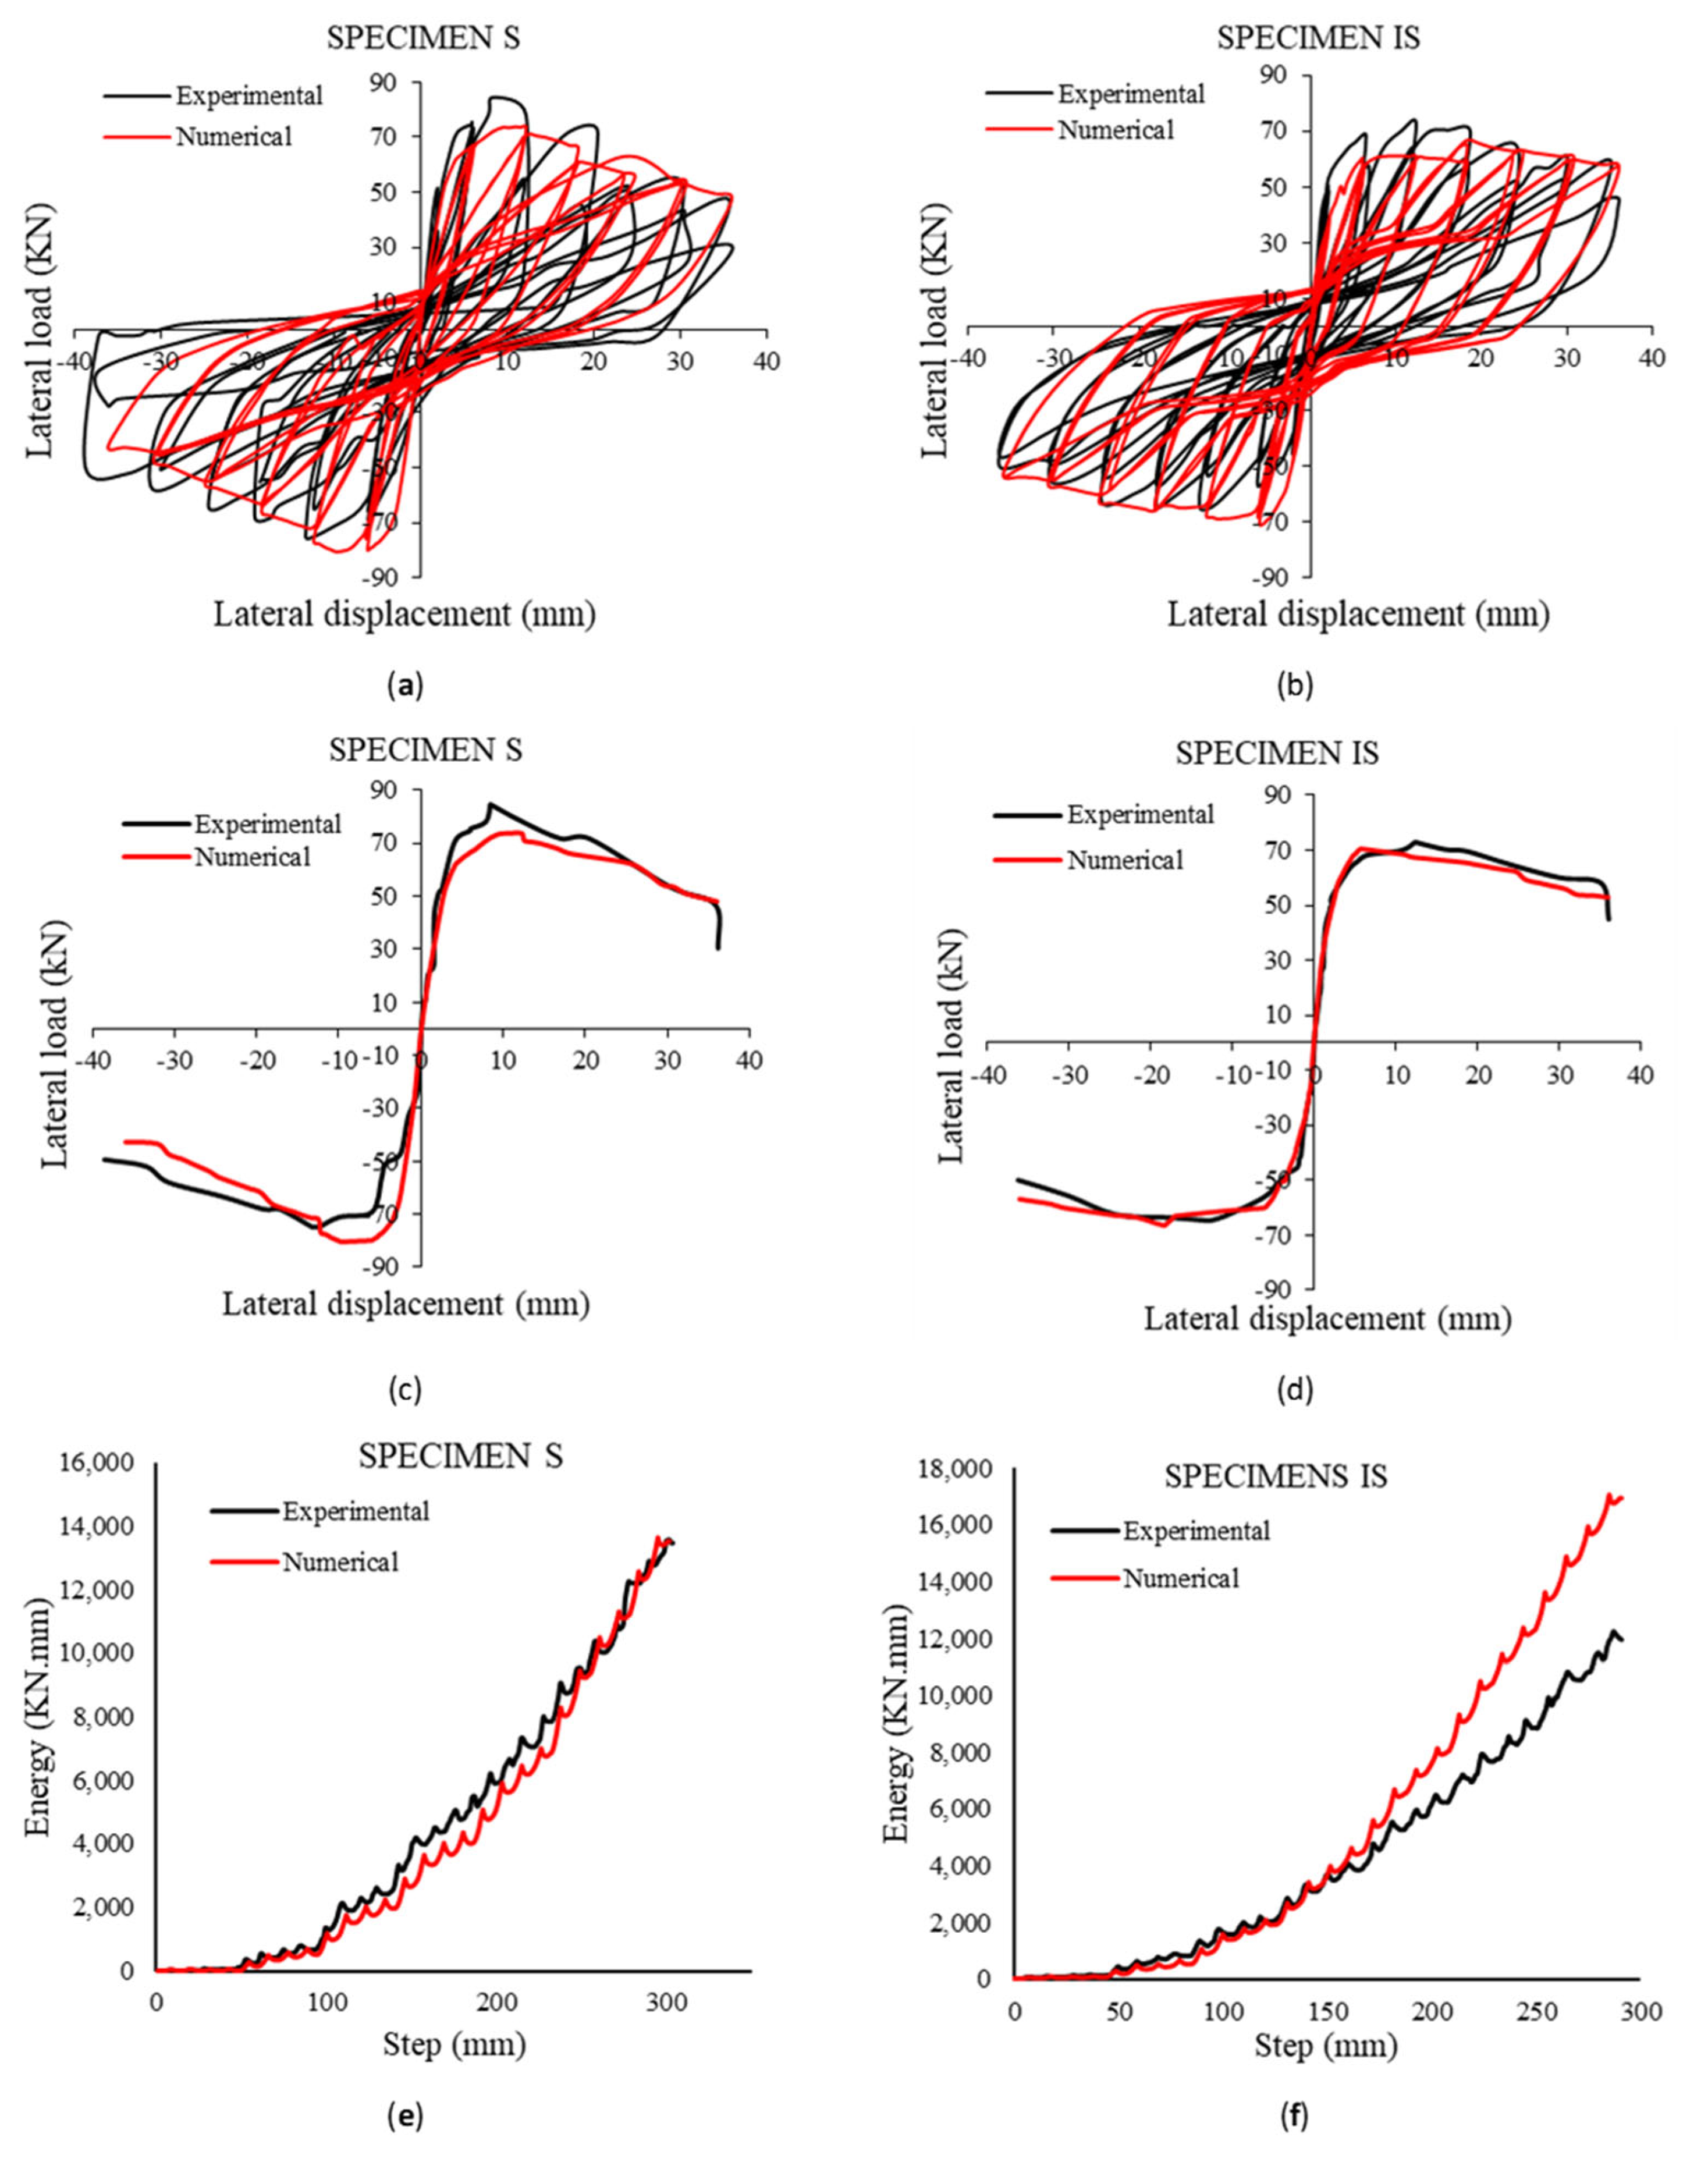
4.1. Scale Specimens without Openings

In order to verify the validity of the proposed modelling approaches for concrete and reinforcing steel, one bare frame specimen was analyzed: specimen B. The configurations and properties of the frames were presented in the explanation above, where the behavior of this frame was analyzed in relation to cyclic loading.
Figure 9 shows the load displacement results obtained for specimen B, along with the corresponding experimental results in terms of the shear of the top displacement (Figure 9a), the shear for of top displacement envelopes (Figure 9b), and the energy dissipated (Figure 9c) for specimen B. The results obtained with the numerical model (OpenSees) are in agreement with the experimental response in terms of the shear of the top displacement and the energy dissipation.
In comparing the numerical results obtained from OpenSees with the experimental results of Kakaletsis and Karayannis [35], five parameters were analyzed: the maximum lateral load, the initial secant stiffness, the secant stiffness, the end loading, and the maximum dissipative energy.
The hysteric curve for the numerical model’s base shear of the top displacement was <4% higher in terms of the maximum lateral load than the experimental results. Furthermore, the base shear of the top displacement envelope in the numerical model was <2% lowest in terms of the initial secant stiffness, <26% higher in terms of the secant stiffness, and <9% higher in terms of the end loading for the same top displacement values compared to the experimental results. The dissipated energy was determined (Figure 9d, and the numerical model shows an acceptable agreement with the experimental response, with <1% of difference for the same step values (125 mm) and <25% in the end loading, which is acceptable because this is a simplified model to model the bare frame. In general, the OpenSees results are in good agreement with the experimental results in the case of specimen B, which demonstrates the ability of the proposed model to simulate the global hysteretic response of bare frames (specimen B). In addition, the uncertainty regarding some of the properties of the materials used in the experimental tests can also be a factor, such as the loading rate which is not able to be represented numerically.
Figure 10 represents the validation of the numerical results with the experimental results in terms of the shear of the top displacement (Figure 10a), the shear of the top displacement envelopes (Figure 10b), and the energy dissipated (Figure 10c) for specimens S and IS. The numerical results obtained are in excellent agreement with the experimental response in terms of the shear of the top displacement response and the energy dissipation.
In comparing the numerical results of specimens S and IS obtained from OpenSees with the experimental results Kakaletsis and Karayannis [35], we relied on five parameters: the maximum lateral load, the initial secant stiffness, the secant stiffness, the end loading, and the maximum dissipative energy.
The hysteric curve of the base shear of the top displacement in the numerical model was <9% and 8% higher in terms of the maximum lateral load than the experimental results for S and IS, respectively. Furthermore, the base shear of the top displacement envelope in the numerical model was <2% higher in terms of the initial secant stiffness for both specimens, <31 higher in terms of the secant stiffness, and <4% and 15% higher in terms of the end loading for the same top displacement values compared to the experimental results of specimens S and IS, respectively. The dissipated energy was also determined (Figure 9c). The numerical model shows an excellent agreement with the experimental response, with <1% of difference for the same step values for specimen S, and an acceptable agreement with the experimental response for specimen IS, with <1% of difference for the same step values (180 mm) and <29% in the end loading.
In general, the results showed a good agreement between the numerical model and the experiment, especially regarding the global behaviors of stiffness and strength. As a result, it can be concluded that this numerical modelling provides a useful alternative to experimental tests in terms of defining the maximum strength and stiffness, since the global behavior envelope is seen to be adequately represented. Furthermore, this type of analysis also provides important information regarding the contact length between the infill panel and the RC frame, which can be used to calibrate the structural parameters of equivalent diagonal strut models.

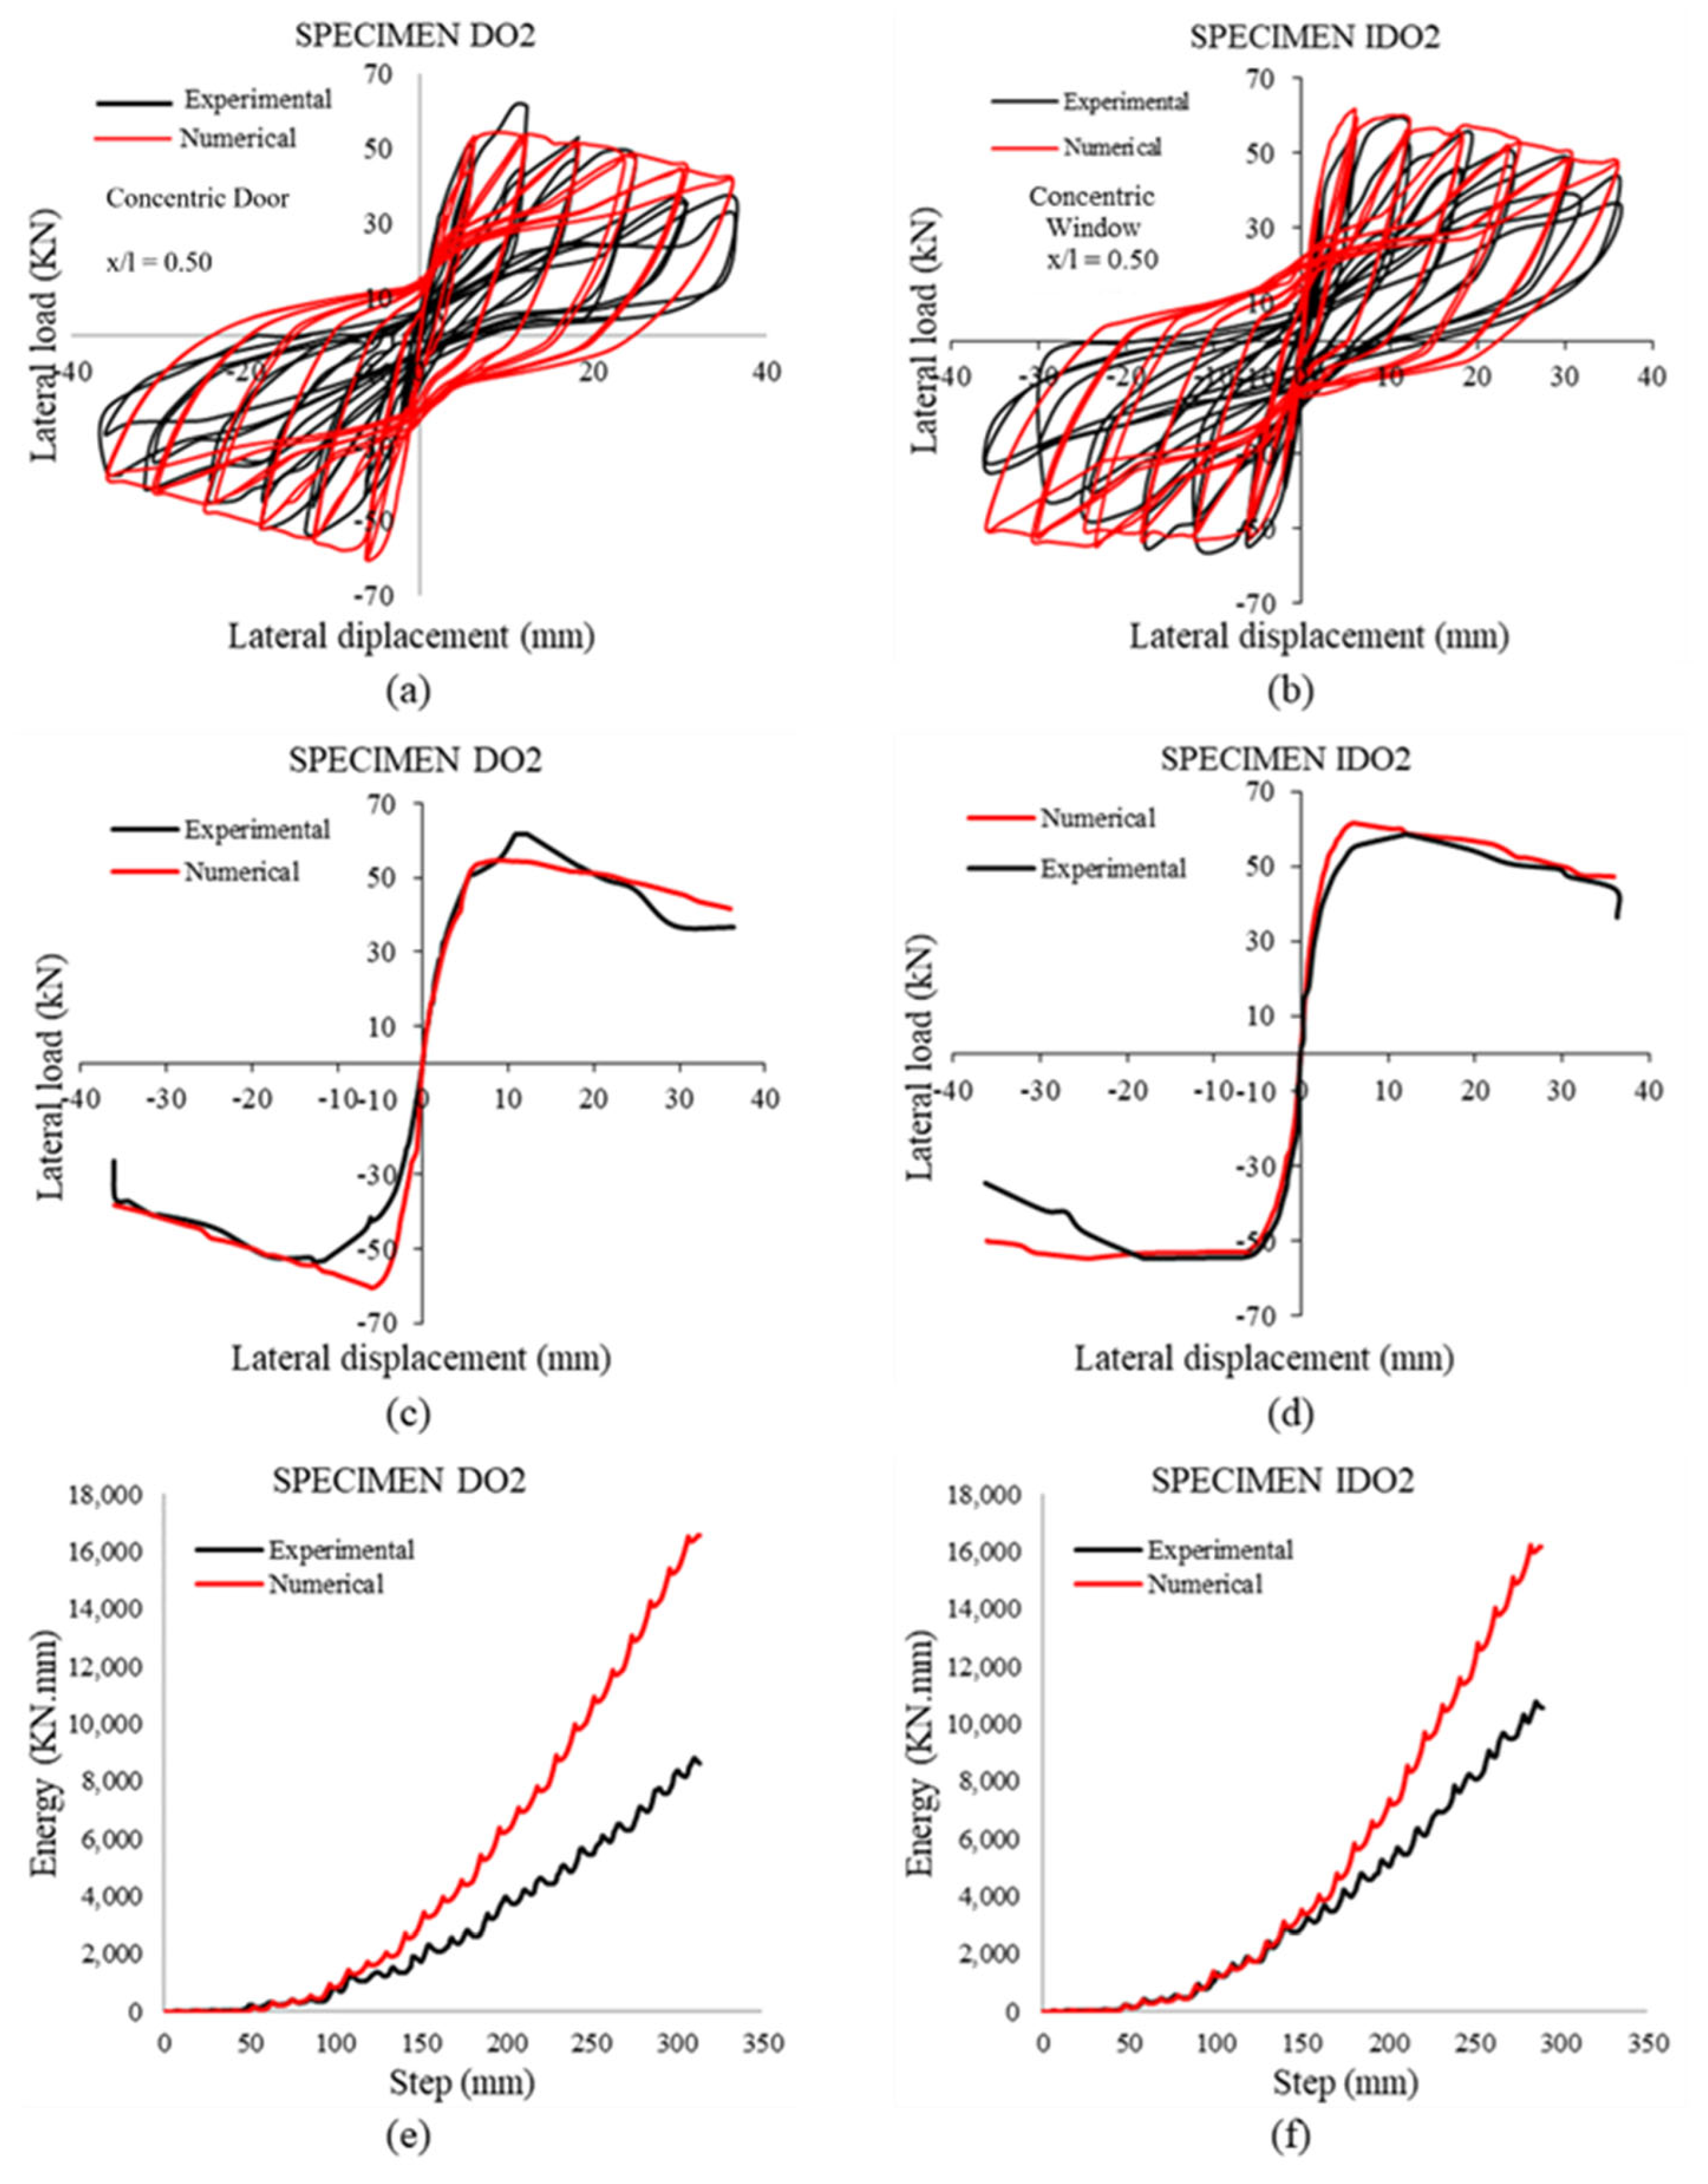
4.2. Scale Specimens with Openings

Two specimens with window openings (WO2 and IWO) were modelled. The results of these analyses are presented in the following window according to the type of masonry wall (weak and strong). The comparison between the load displacement curves of each specimen obtained from the numerical analyses with those obtained from the experimental tests is presented in Figure 10.
Figure 11 represents the validation of the numerical results with the experimental results in terms of the shear of the top displacement (Figure 11a), the shear of the top displacement envelopes (Figure 10b), and the energy dissipated (Figure 11c) for specimens WO2 and IWO2. In terms of the shear of the top displacement response and the energy dissipation, the obtained results with the numerical model (OpenSees) are in excellent agreement with the experimental response.
In comparing the numerical results obtained from OpenSees with the experimental results of Kakaletsis and Karayannis [35] for specimens WO2 and IWO2, we relied on five parameters: the maximum lateral load, the initial secant stiffness, the secant stiffness, the end loading, and the maximum dissipative energy.
The hysteric curve of the base shear of the top displacement in the numerical model was <2% higher in terms of the maximum lateral load than the experimental results for both specimens, WO2 and IWO2. Furthermore, the base shear of the top displacement envelope in the numerical model was <2% higher in terms of the initial secant stiffness, <14% higher in terms of the secant stiffness, and <8% and <14% higher in terms of the end loading for the same top displacement values compared to the experimental results for both specimens, WO2 and IWO2. The dissipated energy was also determined (Figure 10c). The numerical model shows an acceptable agreement with the experimental response, with <1% of difference for the same step values (160 mm and 200 mm for WO2 and IWO2, respectively, and <15% and <25% for the end loading for the two specimens, respectively.
Figure 12 represents the calibration of the numerical results with the experimental results in terms of the shear of the top displacement (Figure 12a), the shear of the top displacement envelopes (Figure 12b), and the energy dissipated (Figure 12c) for specimens DO2 and IDO2. In terms of the shear of the top displacement response and the energy dissipation, the obtained results with the numerical model (OpenSees) are in excellent agreement with the experimental response.
In comparing the numerical results obtained from OpenSees with the experimental results Kakaletsis and Karayannis [35], we relied on five parameters: the maximum lateral load, the initial secant stiffness, the secant stiffness, the end loading, and the maximum dissipative energy.
The hysteric curve of the base shear of the top displacement in the numerical model was <12% and <4% higher in terms of the maximum lateral load than the experimental results for DO2 and IDO2, respectively. Furthermore, the base shear of the top displacement envelope in the numerical model was <1% higher in terms of the initial secant stiffness, <5% higher in terms of the secant stiffness for both specimens, and <11% and <23% higher in terms of the ultimate loading for the same top displacement values compared to the experimental results for DO2 and IDO2, respectively. The dissipated energy was also determined (Figure 11c). The numerical model shows an acceptable agreement with the experimental response, with <1% of the difference for the same step values (180 mm and 1700 mm for DO2 and IDO2, respectively) and <40% and <34% at the ultimate loading stage for the two specimens, respectively.
In general, the OpenSees results are in good agreement with the experimental results for specimens S and IS, because it is a simplified model that is used to model the full infill panel and its surrounding frame elements. This demonstrates the ability of the proposed model to simulate the global hysteretic response of full frames with variations in the mechanical properties (with specimens S and IS) and with openings (specimens WO2, IWO2, DO2, and IDO2).
Figure 13 shows the envelope behavior curves of the two specimens compared with those of the solid and bare frame specimens. It can be seen that the existence of the opening has a clear effect on the overall behavior of the structure (namely, in terms of its strength). Furthermore, the type of masonry wall (weak or strong) appears to have a perceptible effect, which is in agreement with the experimental data.
Figure 13 and Figure 14 compare the envelope curves of the specimens with windows and doors, respectively, where it is possible to see the same tendencies.

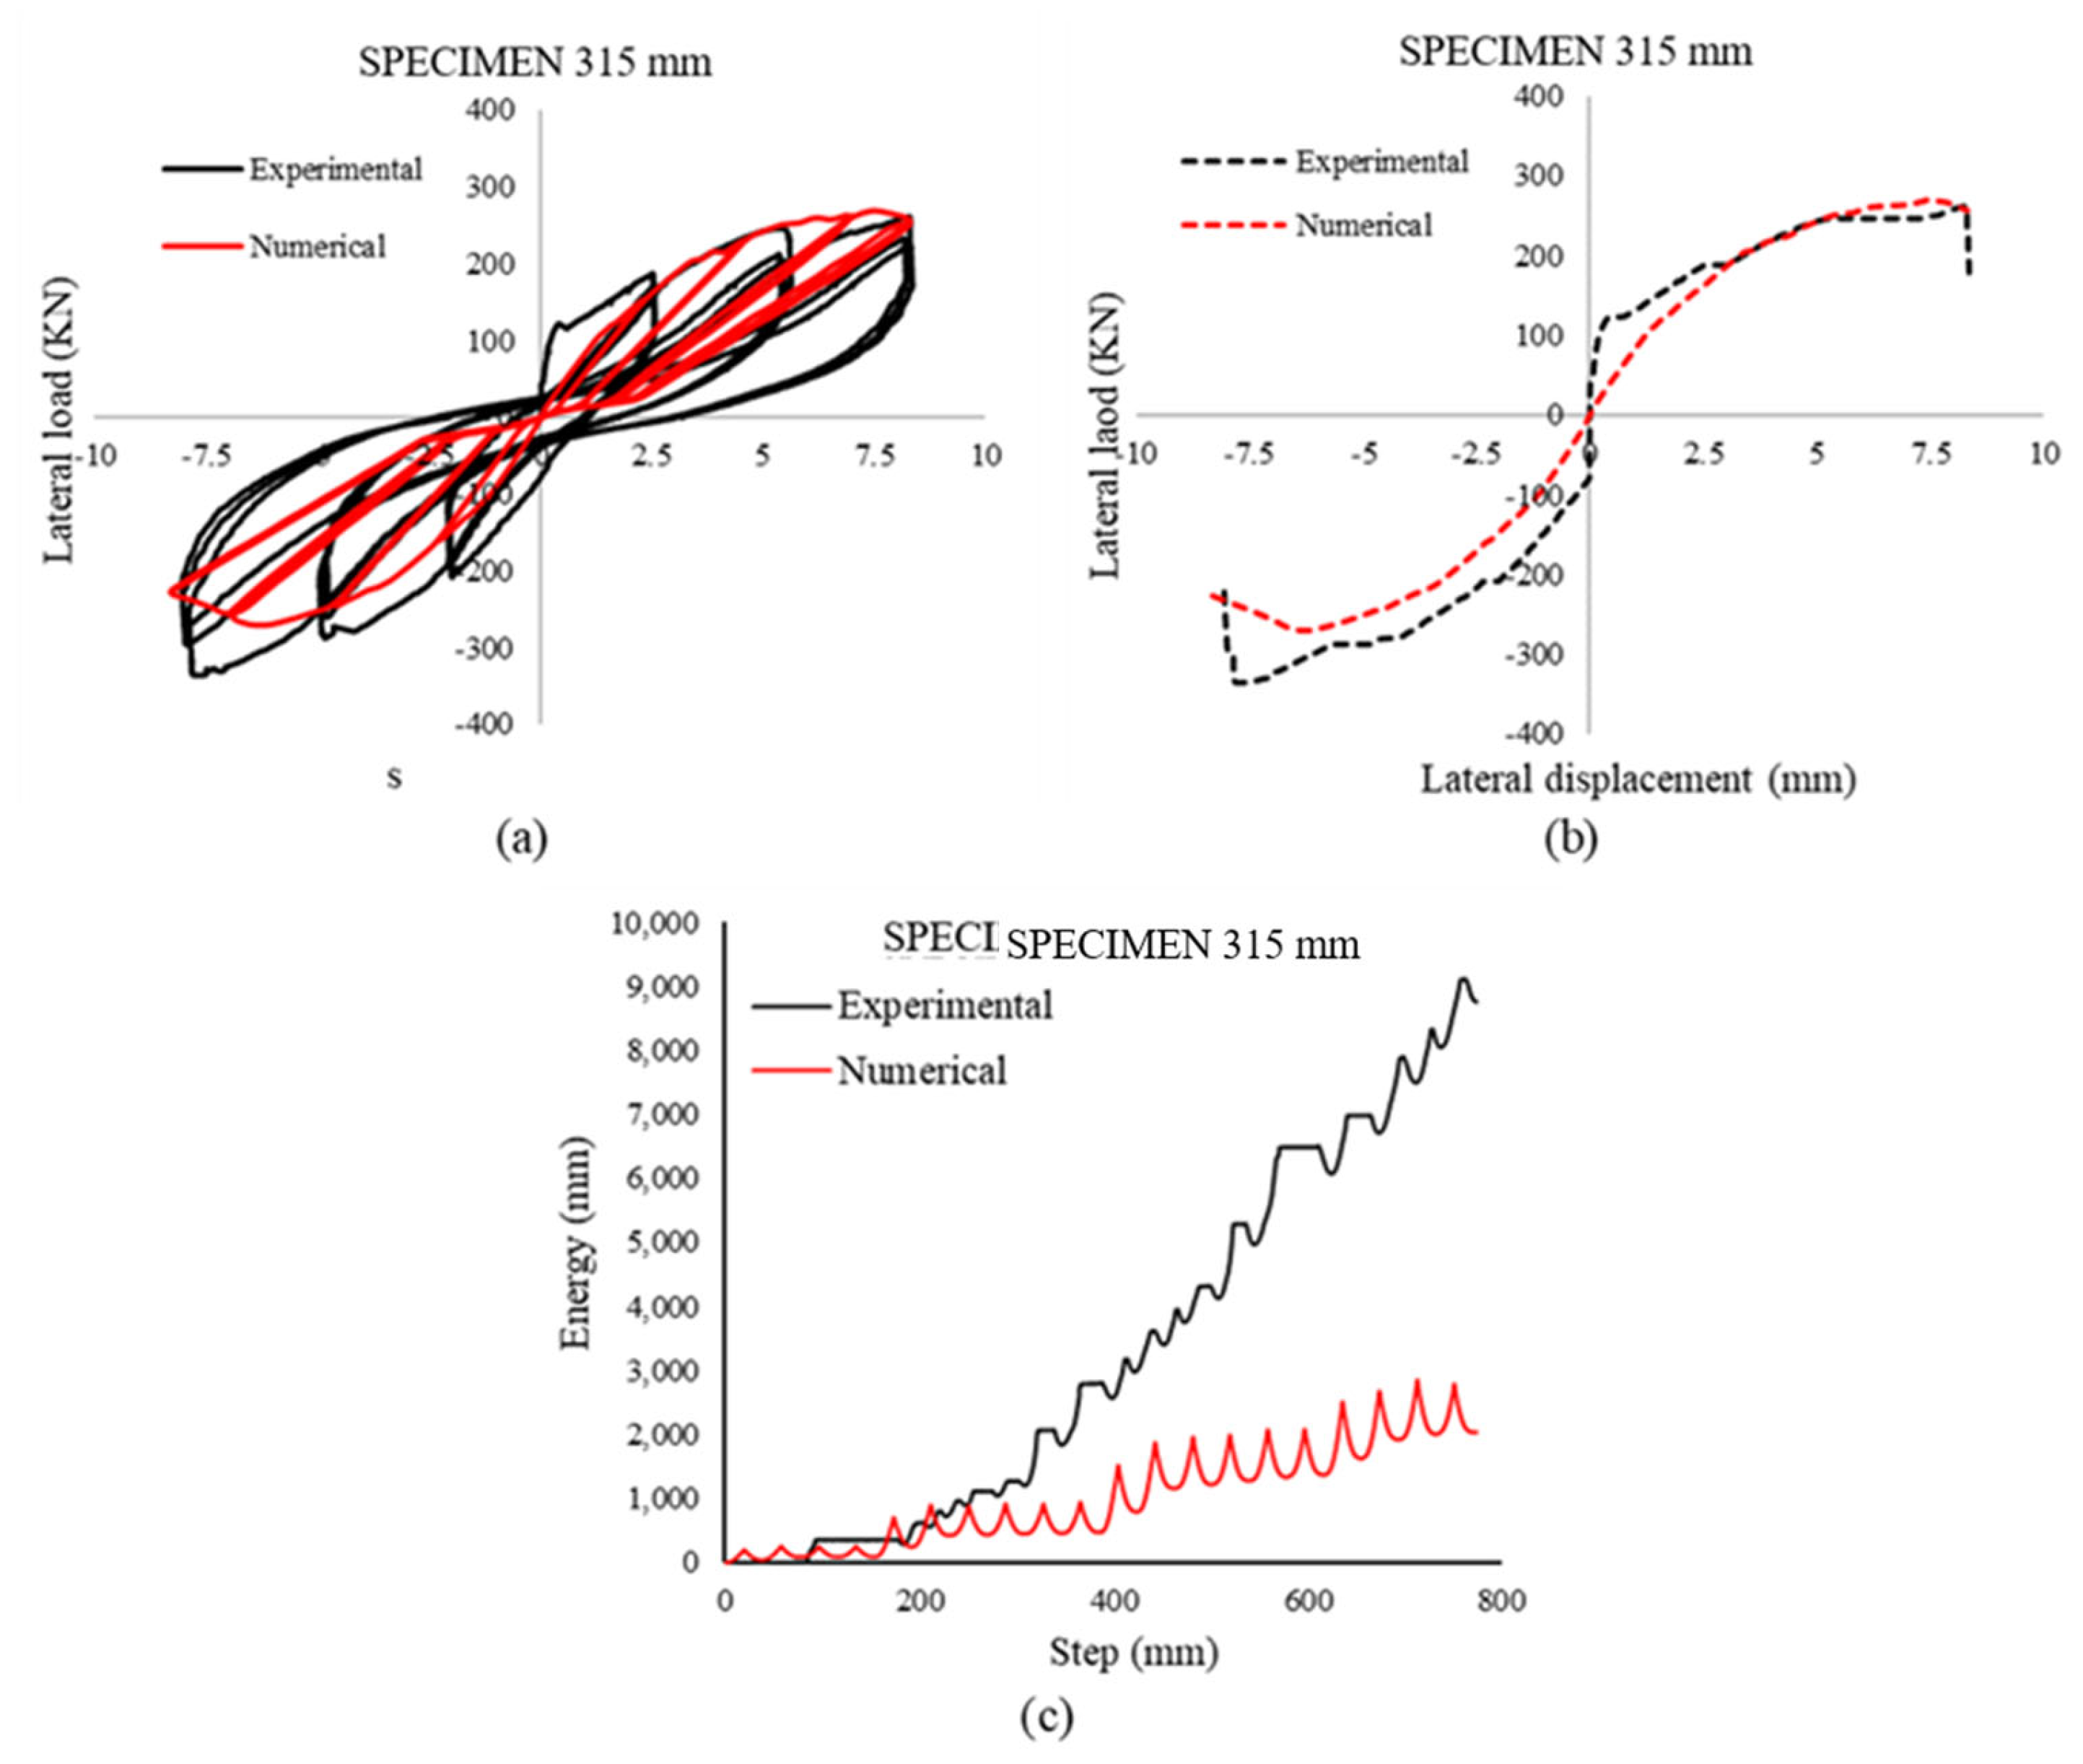
4.3. Full-Scale Specimens without Openings

Figure 15 shows the numerical hysteresis curves, envelope curves, and energy dissipated for the 150 mm bricks, along with the corresponding experimental results. The results show that there is an acceptable agreement between the numerical model (OpenSees) and the experiment at the early loading stage, especially in terms of the global behaviors of stiffness and strength. However, the unloading stiffness of the specimens deviates slightly from the experimental results for large displacements (i.e., when they exceed 7.5 mm). It should be highlighted that the specimens were tested with a low initial in-plane load before the out-of-plane test, which was the main scope of this experiment.
For the dissipated energy (Figure 15c), the numerical results were not too accurate, which was specially related to the low in-plane demand and the lack of accuracy for the unloading/reloading stiffness. Additionally, the optimization process for the strut parameters focused on comparing the envelope curve, which yielded satisfactory results, rather than optimizing the loading and unloading stiffnesses of the strut’s constitutive material. Despite these limitations, this numerical modeling approach offers a valuable alternative to experimental tests. It effectively defines the maximum strength and stiffness, as the global behavior envelope is adequately represented.
Figure 16 shows the numerical hysteresis curves, envelope curves, and energy dissipated for the 315 mm specimen, and the corresponding experimental results. As shown, the numerical model presents the envelope of the experimental tests with a good accuracy; however, it is clear that the initial stiffness is not clearly captured in the numerical model, although the global envelope is captured. As discussed in the previous section, the unloading stiffness is not well captured and the cycle shapes do not reflect the observed experimental results, which is also reflected in the energy dissipated. The numerical model dissipates less energy when compared with the experimental result. However, it should be highlighted that the differences in the type of bricks is well captured with the present model.
Figure 17 shows the numerical hysteresis curves, envelope curves, and energy dissipated for the 110 mm specimen, and the corresponding experimental results. The results show an acceptable agreement between the numerical model (OpenSees) and the experiment, especially in term of the global behaviors of stiffness and strength. However, the unloading stiffness of the specimens deviates slightly from the experimental results for large displacements (i.e., when they exceed 7.5 mm). This is a result of the special configurations in this test. The specimens were tested with a low initial in-plane load in anticipation of the out-of-plane load, which was the main scope of this test. The deviation could also be caused by the unloading stiffness of the materials employed in OpenSees that represent the compressive behavior of concrete and masonry, which have an unloading stiffness with the same value of the initial stiffness.
In addition, the uncertainty regarding some of the properties of the materials used in the experimental tests might also be a factor. Nevertheless, this numerical modelling approach provides a useful alternative to experimental tests in terms of defining the maximum strength and stiffness, since the global behavior envelope is seen to be adequately represented. Furthermore, this type of analysis also provides important information regarding the contact length between the infill panel and the RC frame, which can be used to calibrate the structural parameters of equivalent diagonal strut models.

5. Main Conclusions

This manuscript investigated the efficacy of a numerical modelling approach, using the OpenSees software version 1.2 to simulate the behavior of infilled RC frames subjected to cyclic loading. The reliability of the modelling approach was ensured through multiple experimental tests, leading to realistic findings. The procedure requires only the essential mechanical properties of the materials involved in the structures, without the need to test an entire specimen. The comparison between the numerical results and the experimental data for the scale specimens without openings revealed a promising agreement, especially concerning parameters such as the maximum lateral load, secant stiffness, and energy dissipation. From the simulations, the following conclusions can be drawn:
  • Despite minor discrepancies in the unloading stiffness and dissipated energy, the numerical models adequately represented the global behavior of the specimens.
  • This study confirmed that the model can adequately replicate the experiment’s failure modes, ultimate strength, and stiffness, with a reasonable match to the experimental results.
  • A maximum deviation of the prediction of the initial stiffness and of the maximum strength of around 23% and 14% were found, respectively.
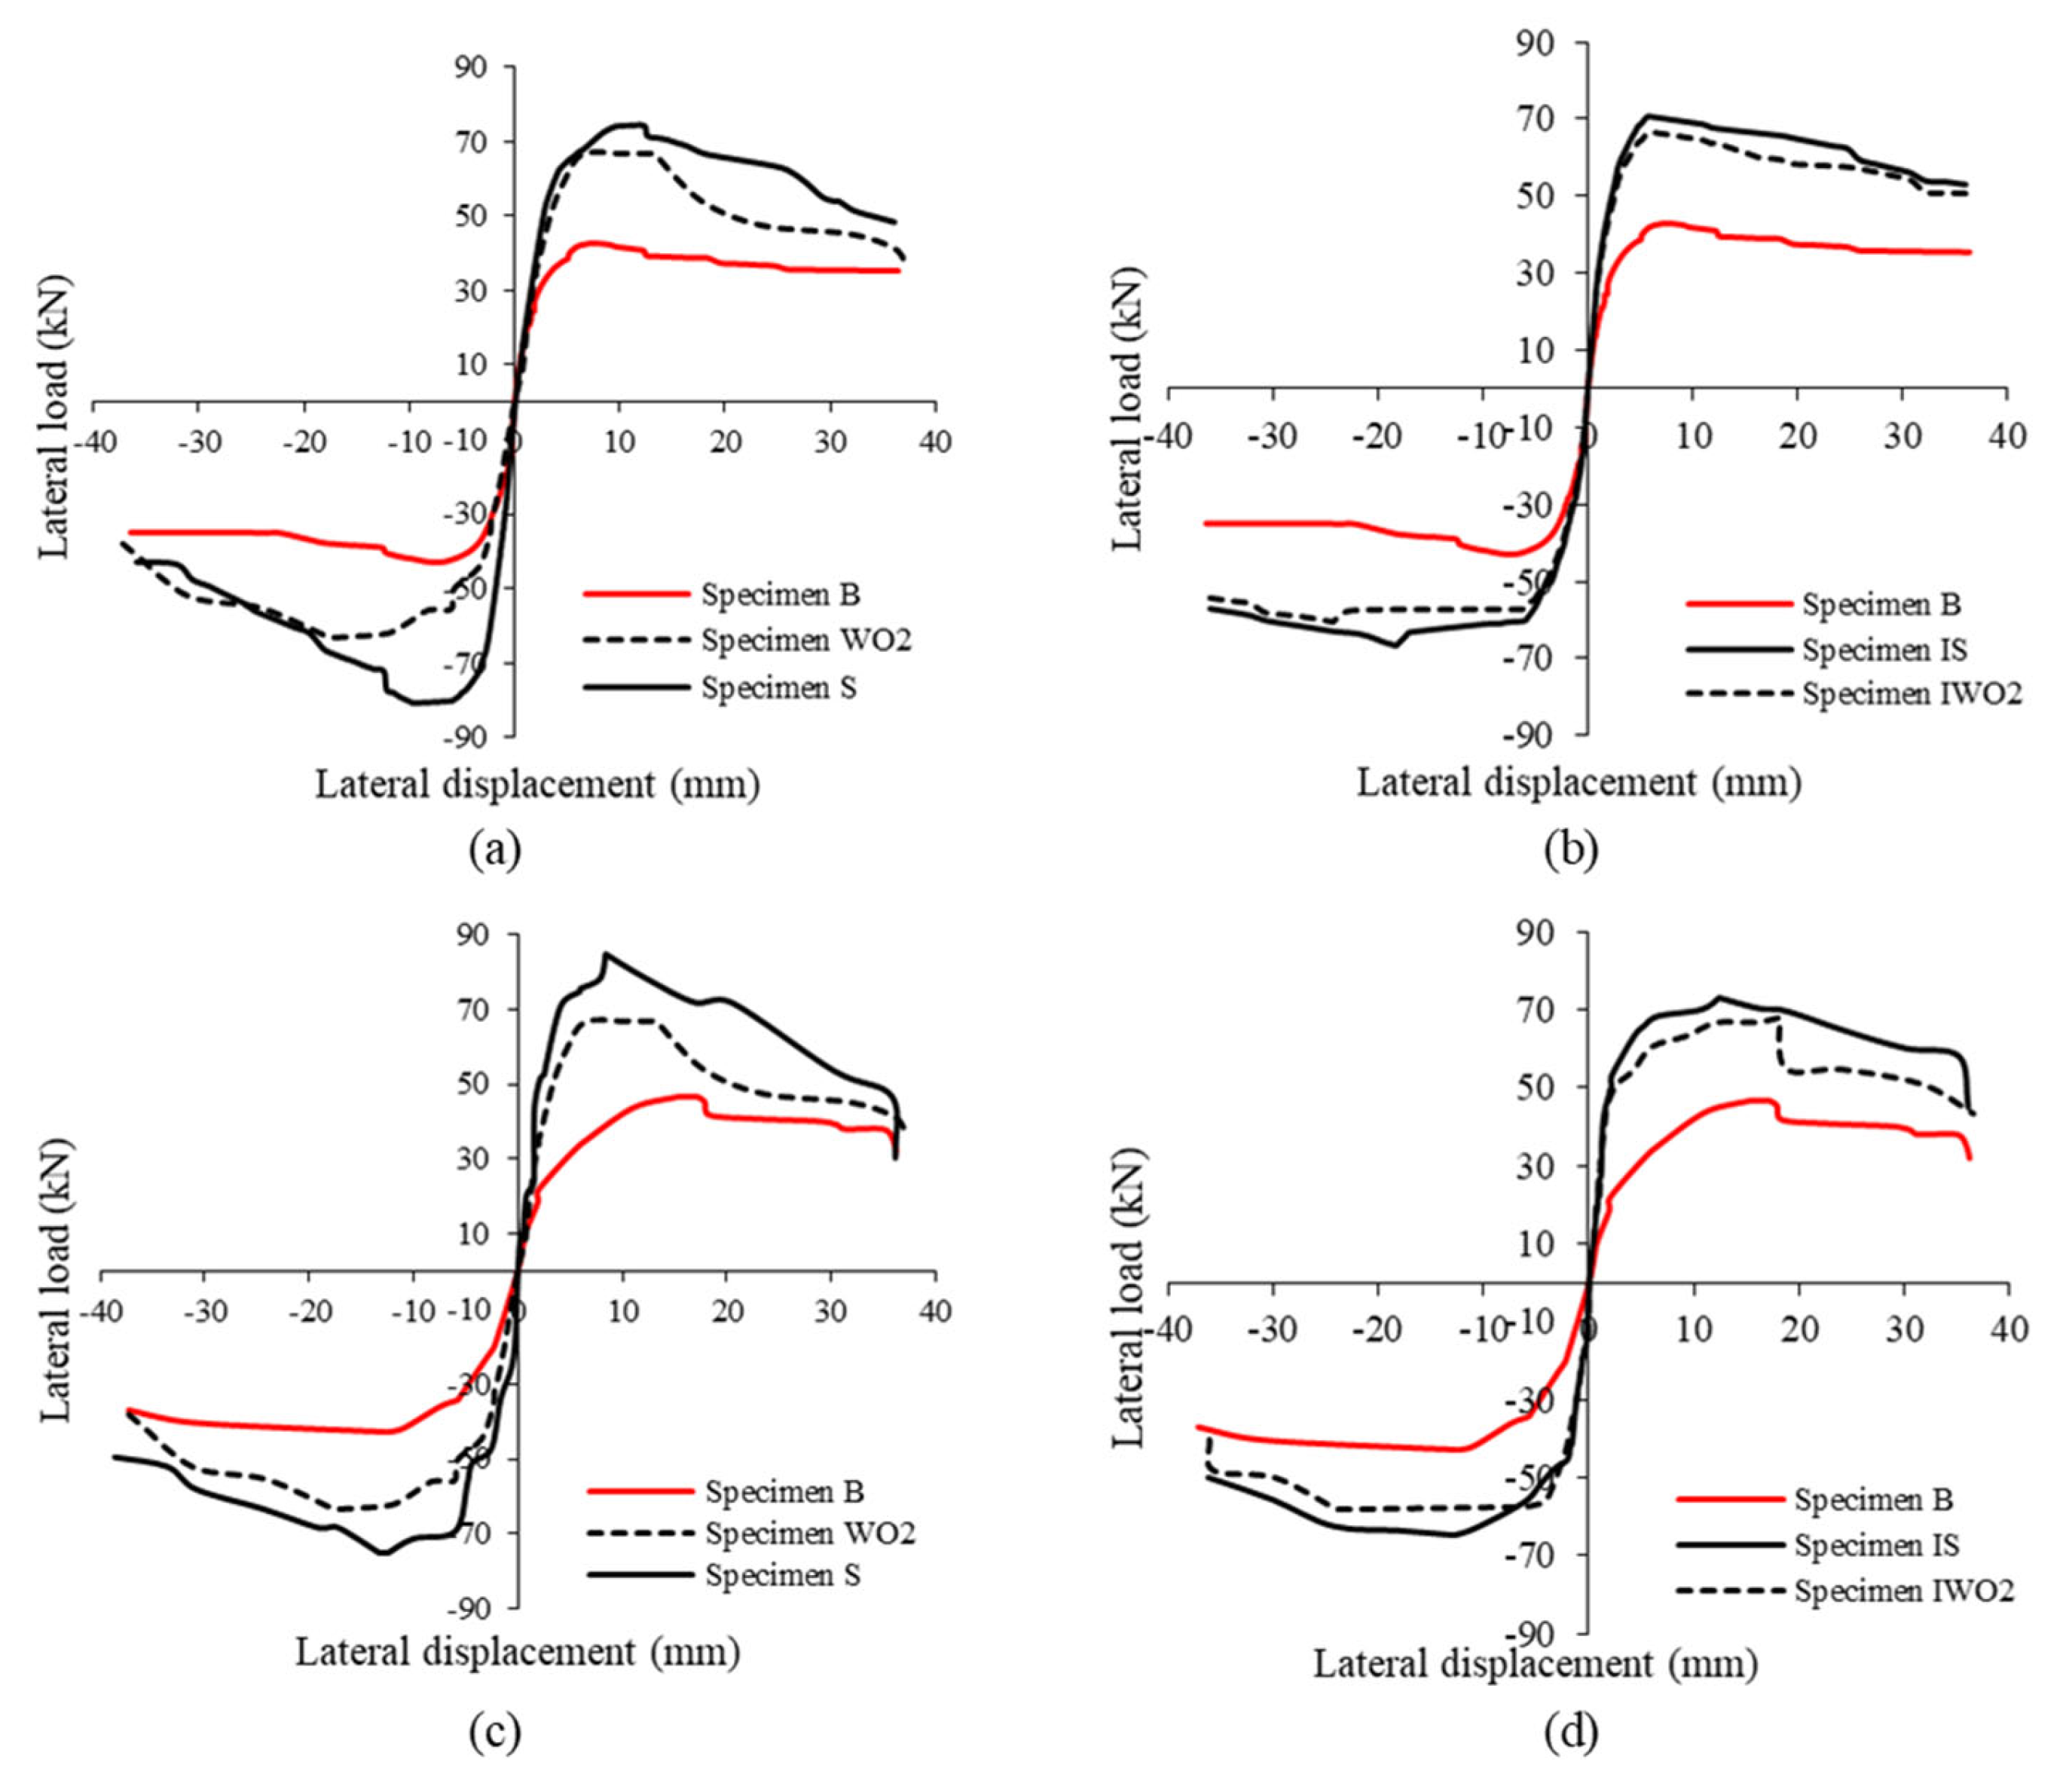
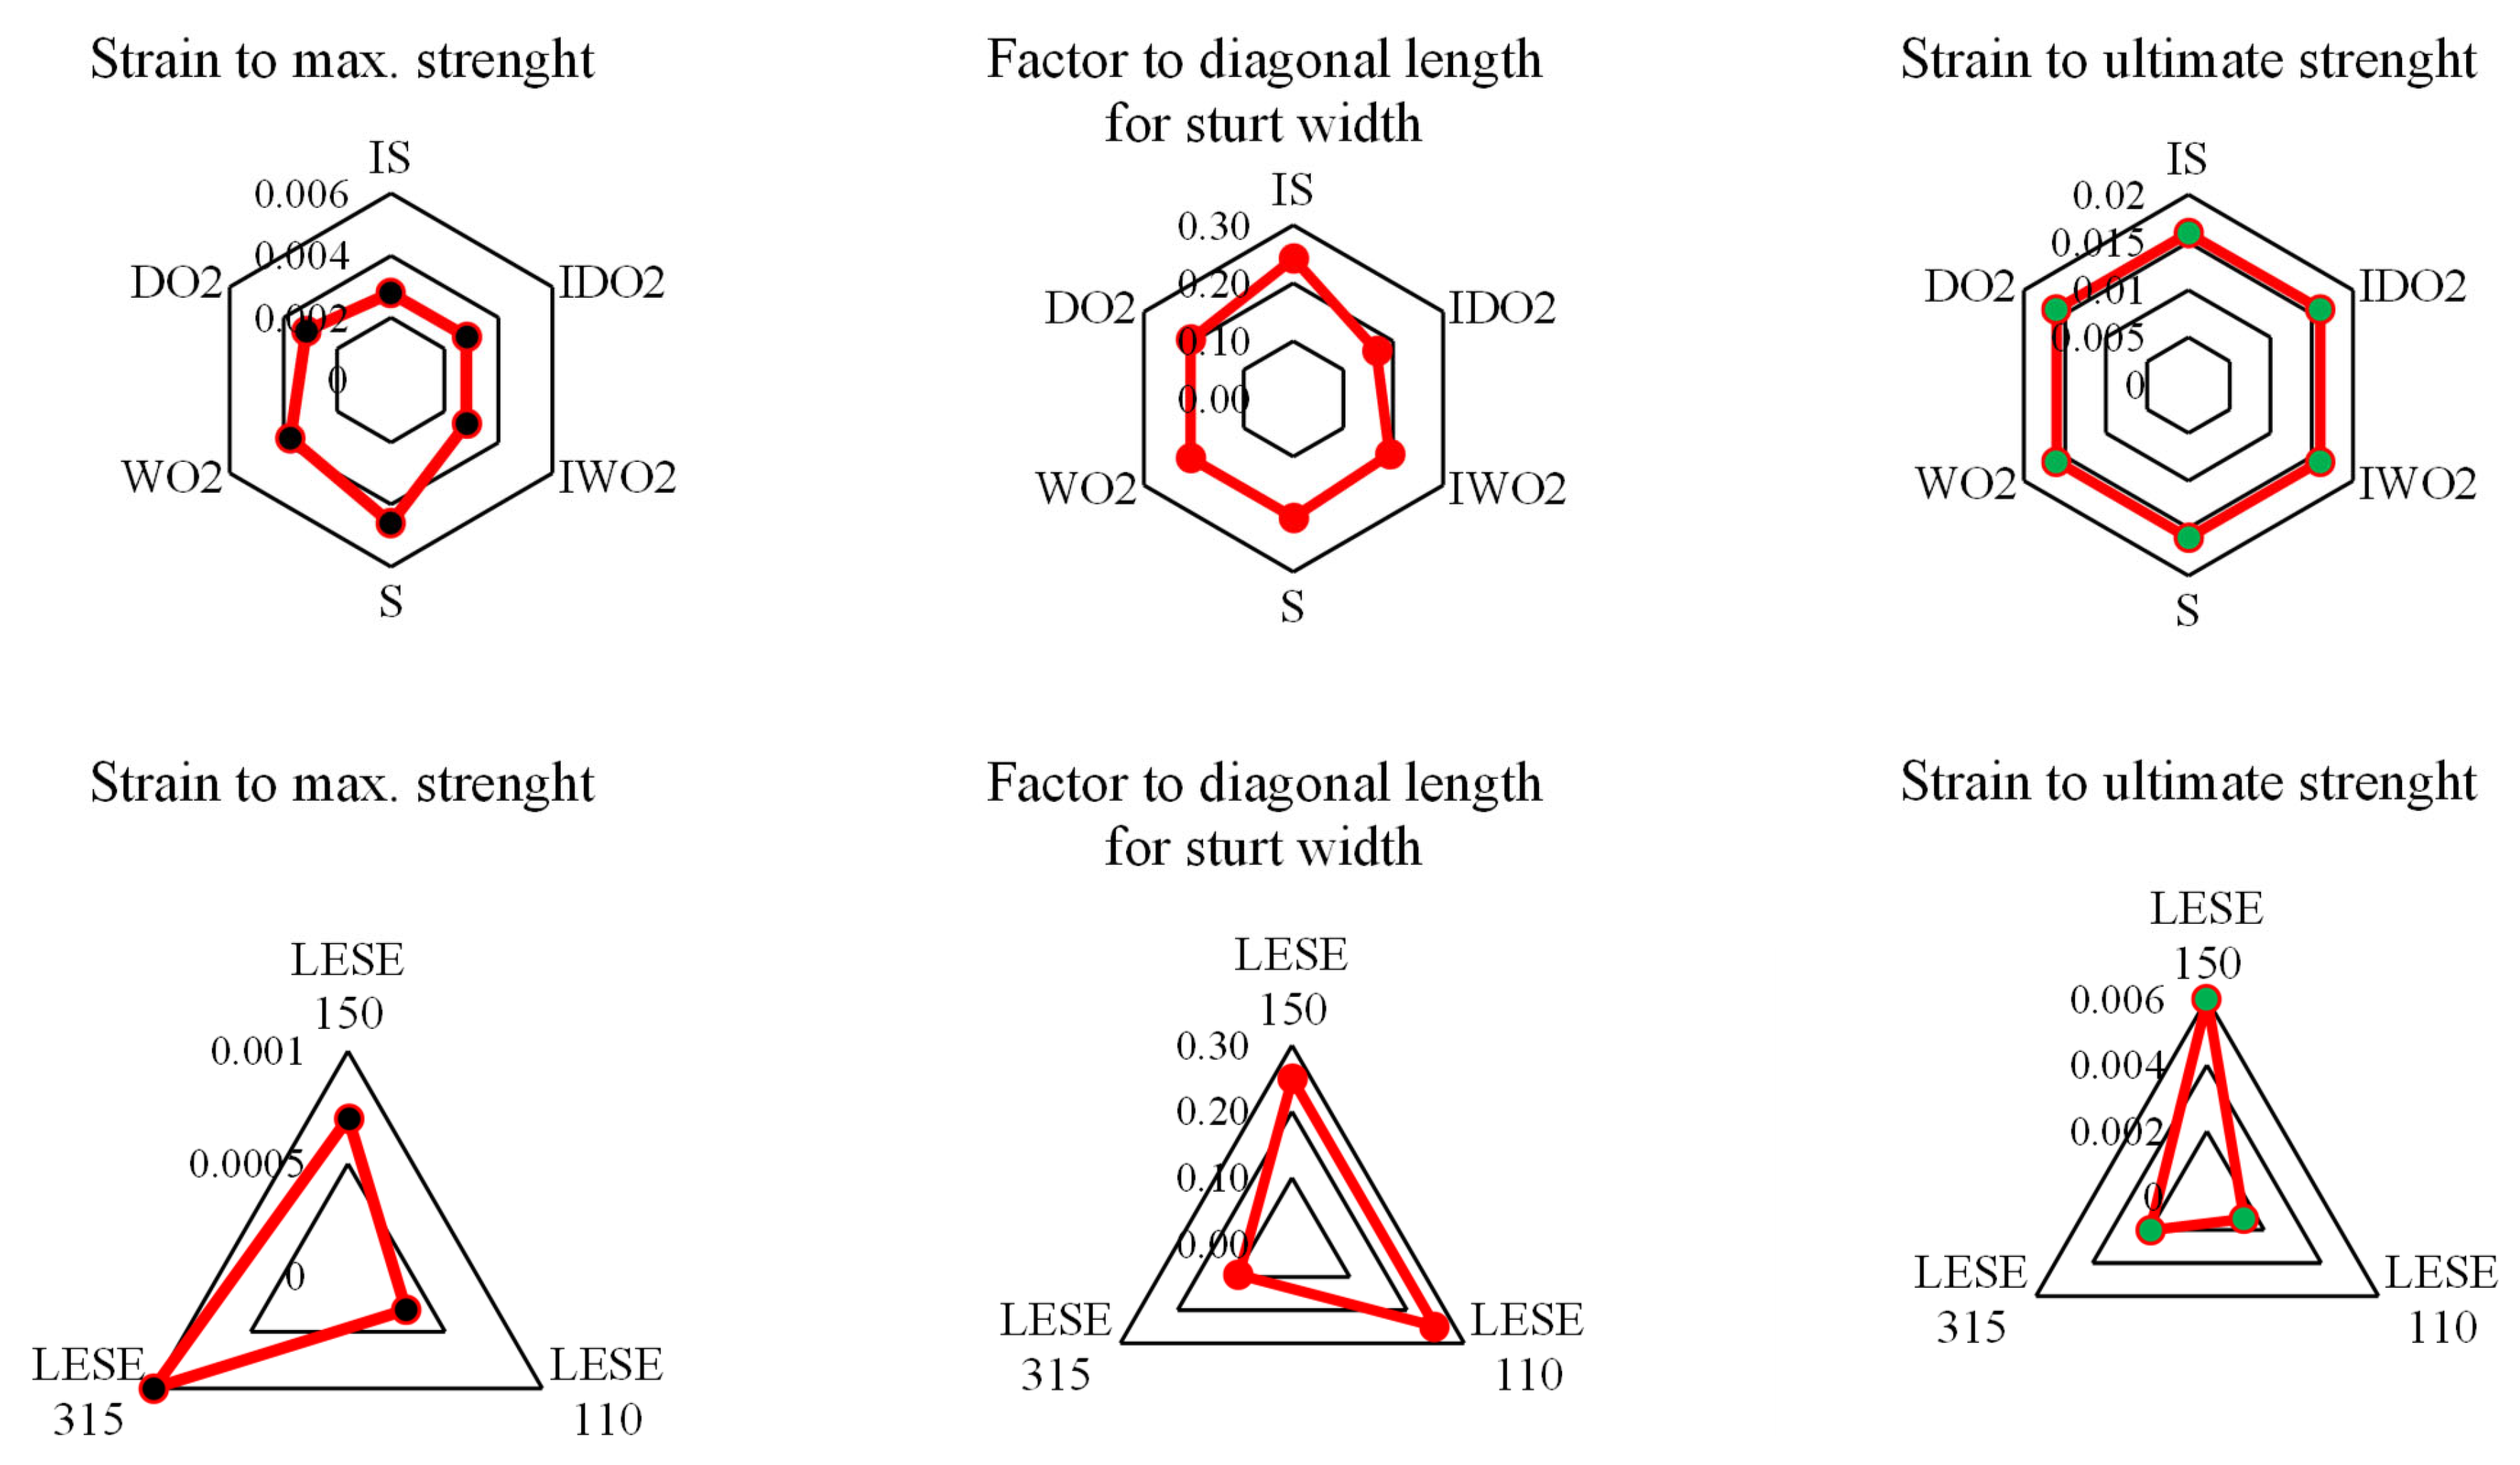
  • However, quantifying the main parameters of the single strut model using the existing model can lead to huge errors; therefore, the mechanical properties shown in Table 5 were defined using the experimental data by tuning the mechanical properties of the strut to get the best fit. By comparing the obtained parameters with those found in the literature, it was found that there are significant differences between the obtained values and the conventional values that depends on the masonry configuration and geometric properties. Figure 18 shows a direct comparison between all the specimens tested in terms of the different performance indicators studied in this work.
Finally, it is essential to acknowledge the limitations encountered during this study, particularly in accurately representing the unloading stiffness and dissipated energy in the numerical models. Future research endeavors could focus on refining the modelling technique to address these discrepancies, potentially by incorporating more intricate material properties or refining the unloading algorithms within OpenSees.
Building upon the findings of this study, several avenues for further investigation emerge. Firstly, conducting additional full-scale experimental tests with meticulous control over the material properties and loading conditions could enhance the validation accuracy of the numerical model, as well as including specimens with different types of openings. Finally, the calibration of the numerical models for combined in-plane and out-of-plane loadings needs to be performed.

Author Contributions

Conceptualization, A.M., R.C., H.M., A.F. and H.R.; methodology, A.M., R.C., H.M., A.F. and H.R.; software, A.M., H.M. and A.F.; validation, A.M., H.M., A.F. and H.R.; formal analysis, A.M., R.C., H.M., A.F. and H.R.; investigation, A.M., R.C., H.M., A.F. and H.R.; writing—original draft preparation, A.M.; writing—review and editing, H.M., A.F. and H.R.; and supervision, R.C. and H.R. All authors have read and agreed to the published version of the manuscript.

Funding

This work was supported by the Foundation for Science and Technology (FCT)—Aveiro Research Centre for Risks and Sustainability in Construction (RISCO), Universidade de Aveiro, Portugal [FCT/UIDB/ECI/04450/2020]. The third author is grateful for the Foundation for Science and Technology’s support through funding UIDB/04625/2020 from the CERIS research unit.

Data Availability Statement

The dataset is available on request from the authors.

Conflicts of Interest

The authors declare no conflicts of interest.

References

  1. McKenna, F.; Fenves, G. The OpenSees Command Language Manual: Version 1.2; 2001. Available online: https://opensees.berkeley.edu/OpenSees/OpenSeesCommands.pdf (accessed on 2 February 2024).
  2. Scott, M.H.; Fenves, G.L.; McKenna, F.; Filippou, F.C. Software Patterns for Nonlinear Beam-Column Models. J. Struct. Eng. 2008, 134, 562–571. [Google Scholar] [CrossRef]
  3. Scott, M.H.; Ryan, K.L. Moment-Rotation Behavior of Force-Based Plastic Hinge Elements. Earthq. Spectra 2013, 29, 597–607. [Google Scholar] [CrossRef]
  4. O’Reilly, G.J.; Sullivan, T.J. Modeling Techniques for the Seismic Assessment of the Existing Italian RC Frame Structures. J. Earthq. Eng. 2019, 23, 1262–1296. [Google Scholar] [CrossRef]
  5. Paulay, T.; Priestley, M.J.N. Seismic Design of Reinforced Concrete and Masonry Buildings; John Wiley & Sons, Inc.: Hoboken, NJ, USA, 1992. [Google Scholar]
  6. Hendry, A.W. Design of Masonry Structures; Third Edition of Load Bearing Brickwork Design; Department of Civil Engineering, University of Edinburgh: Edinburgh, UK, 1997. [Google Scholar]
  7. Dolsek, M.; Fajfar, P. The Effect of Masonry Infills on the Seismic Response of a Four-Storey Reinforced Concrete Frame: A Deterministic Assessment. Eng. Struct. 2008, 30, 1991–2001. [Google Scholar] [CrossRef]
  8. Mohamed, H.; Romão, X. Analysis of the Performance of Strut Models to Simulate the Seismic Behaviour of Masonry Infills in Partially Infilled RC Frames. Eng. Struct. 2020, 222, 111124. [Google Scholar] [CrossRef]
  9. Liberatore, L.; Sorrentino, L.; Liberatore, D.; Decanini, L.D. Failure of Industrial Structures Induced by the Emilia (Italy) 2012 Earthquakes. Eng. Fail Anal. 2013, 34, 629–647. [Google Scholar] [CrossRef]
  10. Asteris, P.G.; Antoniou, S.T.; Sophianopoulos, D.S.; Chrysostomou, C.Z. Mathematical Macromodeling of Infilled Frames: State of the Art. J. Struct. Eng. 2011, 137, 1508–1517. [Google Scholar] [CrossRef]
  11. Polyakov, S.V. Masonry in Framed Buildings (An Investigation into the Strength and Stiffness of Masonry Infilling); Translated from the Russian by Cairns, G.L., Moscow, 1956; National Lending Library for Science and Technology: Boston Spa, Yorkshire, 1963. [Google Scholar]
  12. Holmes, M. Combined Loading on Infilled Frames. Proc. Inst. Civ. Eng. 1963, 25, 31–38. [Google Scholar] [CrossRef]
  13. Stafford Smith, B. Lateral Stiffness of Infilled Frames. Proc. Am. Soc. Civ. Eng. 1962, 88, 183–199. [Google Scholar]
  14. Mainstone, R.J. On the Stiffnesses and Strengths of Infilled Frames. Proc. Inst. Civ. Eng. 1971, IV, 57–90. [Google Scholar]
  15. Abdul-Kadir, M.R. Structural Behaviour of Masonry Infill Panels in Framed Structures. Ph.D. Thesis, University of Edinburgh: Edinburgh, UK, 1974. [Google Scholar]
  16. Klingner, R.E.; Bertero, V.V. Earthquake Resistance of Infilled Frames. J. Struct. Div. 1978, 104, 973–989. [Google Scholar] [CrossRef]
  17. Leuchars, J.M.; Scrivener, J.C. Masonry Infill Panels Subjected to Cyclic In-Plane Loading. Bull. N. Z. Soc. Earthq. Eng. 1976, 9, 122–131. [Google Scholar] [CrossRef]
  18. Thiruvengadam, V. On the Natural Frequencies of Infilled Frames. Earthq. Eng. Struct. Dyn. 1985, 13, 401–419. [Google Scholar] [CrossRef]
  19. Syrmakezis, C.; Vratsanou, V. Influence of Infill Walls to RC Frames Response. In Proceedings of the 8th European Conference on Earthquake Engineering Lisbon, Lisbon, Portugal, 7–12 September 1986. [Google Scholar]
  20. Chrysostomou, C. Effects of Degrading Infill Walls on the Nonlinear Seismic Response of Two-Dimensional Steel Frames. Ph.D. Thesis, Cornell University: Ithaca, NY, USA, 1991. [Google Scholar]
  21. Hamburguer, R.; Chakradeo, A. Methodology for Seismic-Capacity Evaluation of Steel-Frame Buildings with Infill Unreinforced Masonry. In Proceedings of the National Earthquake Conference, Central US Earthquake Consortium, Memphis, TN, USA, 2–5 May 1993. [Google Scholar]
  22. Saneinejad, A.; Hobbs, B. Inelastic Design of Infilled Frames. J. Struct. Eng. 1995, 121, 634–650. [Google Scholar] [CrossRef]
  23. Crisafulli, F.J.; Carr, A.J.; Park, R. Analytical Modelling of Infilled Frames Structures—A General Review. Bull. N. Z. Soc. Earthq. Eng. 2000, 33, 30–47. [Google Scholar]
  24. El-Dakhakhni, W.W.; Elgaaly, M.; Hamid, A.A. Three-Strut Model for Concrete Masonry-Infilled Steel Frames. J. Struct. Eng. 2003, 129, 177–185. [Google Scholar] [CrossRef]
  25. Kadysiewski, S.; Mosalam, K. Modeling of Unreinforced Masonry Infill Walls Considering In-Plane and Out-of-Plane Interaction; PEER 2008/102; University of California: Berkeley, CA, USA, 2009; Volume 144. [Google Scholar]
  26. Furtado, A.; Rodrigues, H.; Arêde, A.; Varum, H. Simplified Macro-Model for Infill Masonry Walls Considering the out-of-Plane Behaviour. Earthq. Eng. Struct. Dyn. 2016, 45, 507–524. [Google Scholar] [CrossRef]
  27. Celarec, D.; Ricci, P.; Dolšek, M. The Sensitivity of Seismic Response Parameters to the Uncertain Modelling Variables of Masonry-Infilled Reinforced Concrete Frames. Eng. Struct. 2012, 35, 165–177. [Google Scholar] [CrossRef]
  28. Di Domenico, M.; De Risi, M.T.; Ricci, P.; Verderame, G.M.; Manfredi, G. Empirical Prediction of the In-Plane/out-of-Plane Interaction Effects in Clay Brick Unreinforced Masonry Infill Walls. Eng. Struct. 2021, 227, 111438. [Google Scholar] [CrossRef]
  29. Dias-Oliveira, J.; Rodrigues, H.; Asteris, P.G.; Varum, H. On the Seismic Behavior of Masonry Infilled Frame Structures. Buildings 2022, 12, 1146. [Google Scholar] [CrossRef]
  30. Puglisi, M.; Uzcategui, M.; Flórez-López, J. Modeling of Masonry of Infilled Frames, Part I: The Plastic Concentrator. Eng. Struct. 2009, 31, 113–118. [Google Scholar] [CrossRef]
  31. McKenna, F. OpenSees: A Framework for Earthquake Engineering Simulation. Comput. Sci. Eng. 2011, 13, 58–66. [Google Scholar] [CrossRef]
  32. Scott, M.H.; Fenves, G.L. Plastic Hinge Integration Methods for Force-Based Beam–Column Elements. J. Struct. Eng. 2006, 132, 244–252. [Google Scholar] [CrossRef]
  33. Hendry, A.W. Structural Masonry; Macmillan: Houndmills Basingstoke, UK, 1990; ISBN 9780333497487. [Google Scholar]
  34. Decanini, L.D.; Liberatore, L.; Mollaioli, F. Strength and Stiffness Reduction Factors for Infilled Frames with Openings. Earthq. Eng. Eng. Vib. 2014, 13, 437–454. [Google Scholar] [CrossRef]
  35. Kakaletsis, D.J.; Karayannis, C.G. Influence of masonry strength and openings on infilled R/C frames under cycling loading. J. Earthq. Eng. 2008, 12, 197–221. [Google Scholar] [CrossRef]
  36. Furtado, A.; Rodrigues, H.; Arede, A.; Varum, H. Experimental investigation on the possible effect of previous damage, workmanship and test setup on the out-of-plane behaviour of masonry infill walls. J. Earthq. Eng. 2022, 26, 5647–5678. [Google Scholar] [CrossRef]
  37. Asteris, P.G.; Cotsovos, D.M.; Chrysostomou, C.Z.; Mohebkhah, A.; Al-Chaar, G.K. Mathematical Micromodeling of Infilled Frames: State of the Art. Eng. Struct. 2013, 56, 1905–1921. [Google Scholar] [CrossRef]
  38. EN 1998-1-3; Eurocode 8. Design of Structures for Earthquake Resistance—Part 1–3: Strengthening and Repair of Buildings, CEN. European Committee for Standardization: Brussels, Belgium, 2005.
Figure 1. Adopted methodology for the numerical modelling of the RC frames with masonry infills.
Buildings 14 01902 g001
Figure 3. Description of the specimens (all dimension in millimeters).
Buildings 14 01902 g003
Figure 4. Description of the specimens: (a) frame reinforcement detailing (all dimensions in millimeters); and (b) masonry units.
Buildings 14 01902 g004
Figure 5. Displacement pattern history.
Buildings 14 01902 g005
Figure 6. Details of the reinforcement of the full-scale specimens (units in meters).
Buildings 14 01902 g006
Figure 7. Detail of the masonry units.
Buildings 14 01902 g007
Figure 8. Test setup of the full-scale specimens.
Buildings 14 01902 g008
Figure 9. (a) Hysteretic behavior of the masonry infill wall; (b) frame damage pattern (c) base shear of the top displacement envelope; and (d) the energy dissipation results of the experimental test and the numerical model B specimens.
Buildings 14 01902 g009
Figure 10. (a,b) Hysteretic response, (c,d) base shear of the top displacement envelope, and (e,f) the energy dissipation results of the experimental test and the numerical model for specimens S and IS.
Buildings 14 01902 g010
Figure 11. (a,b) Hysteretic response, (c,d) base shear of the top displacement envelope, and (e,f) the energy dissipation results of the experimental test and the numerical model for specimen WO2.
Buildings 14 01902 g011
Figure 12. (a,b) Hysteretic response, (c,d) the base shear of the top displacement envelope, and (e,f) the energy dissipation results of the experimental test and the numerical model for specimens DO2 and IDO2.
Buildings 14 01902 g012
Figure 13. Lateral load displacement envelopes for specimens with window openings with different type of infill wall compared with those with solid and bare frames: (a) numerical model’s weak units and (b) strong units; and (c) experimental data’s strong units and (d) weak units.
Buildings 14 01902 g013
Figure 14. Lateral load displacement envelopes for specimens with door openings with different type of infill wall compared with those with solid and bare frames: (a) numerical model’s weak units and (b) strong units; and (c) experimental data’s strong units and (d) weak units.
Buildings 14 01902 g014
Figure 15. Numerical and experimental hysteresis and envelope curves for the 150 mm specimen: (a) hysteresis curve, (b) envelope curve, and (c) energy dissipated.
Buildings 14 01902 g015
Figure 16. Numerical and experimental hysteresis and envelope curves for the 315 mm specimen: (a) hysteresis curve, (b) envelope curve, and (c) energy dissipated.
Buildings 14 01902 g016
Figure 17. Numerical and experimental hysteresis and envelope curves for the 110 mm specimen: (a) hysteresis curve, (b) envelope curve, and (c) energy dissipated.
Buildings 14 01902 g017
Figure 18. Radar plot of the best output parameters used in this calibration.
Buildings 14 01902 g018
Table 1. Characteristics of the test specimens.
Specimen NotationOpening ShapeOpening Size
Opening Width (La)/Wall Width (L) = 0.25
Opening Location
Distance to Opening Centre (X)/Wall Width (L) = 0.5
Masonry Type
WindowDoorWeakStrong
BBare frameBare frame-----------
SSolidSolid-----------
ISSolidSolid----------
WO2
IWO2
DO2
IDO2
Table 2. Average values of the material parameters of the infill panels.
Mechanical PropertiesValues per Type of Masonry
WeakStrong
Mortar
Compressive strength f m (MPa)1.531.75
Brick units
Compressive strength f b c (MPa)3.1026.4
Masonry walls
Compressive strength perpendicular to voids f c (MPa)2.6315.18
Elastic modulus perpendicular to voids E c (MPa)660.662837.14
Compressive strength parallel to voids f c 90 (MPa)5.1117.68
Elastic modulus parallel to voids E c 90 (MPa)670.30540.19
Friction coefficient μ 0.7700.957
Shear modulus G (MPa)259.39351.37
Table 3. Average values of the material properties of the RC frame.
Mechanical PropertiesValues (unit)
Frame
Compressive strength f c 28.51 (MPa)
Steel bars
Yield tensile strength of longitudinal steel f y 390.47 (MPa)
Ultimate tensile strength of longitudinal steel f u 516.27 (MPa)
Yield tensile strength of transverse steel f y 212.20 (MPa)
Ultimate tensile strength of transverse steel f u 321.07 (MPa)
Table 4. Mechanical properties of the RC frame and wall components.
ComponentMaterial PropertiesSpecimen 150 mmSpecimen 315 mmSpecimen 110 mm
Average
Value
(MPa)
CoV
(%)
SD
(MPa)
Average
Value
(MPa)
CoV
(%)
SD
(MPa)
Average
Value
(MPa)
CoV
(%)
SD
(MPa)
ConcreteCompressive strength22.856.10.8822.856.10.8822.856.10.88
Steel rebarsElastic modulus24,3000.921024,3000.921024,3000.9210
Elastic
modulus
Φ8 mm198,0005.410,69219,8005.410,692198,0005.410692
ϕ12 mm192,0006.211,904192,0006.211,904192,0006.211,904
ϕ16 mm187,0002.13927187,0002.13927187,0002.13927
Yielding stress
Φ8 mm5352.211.85352.211.85352.211.8
ϕ10 mm5263.518.45263.518.45263.518.4
ϕ16 mm5323.217.15323.217.15323.217.1
Masonry
wallets
Compressive strength parallel to the vertical hollows0.80612.810.141.825.10.090.6619.680.131
Elastic modulus parallel to the vertical hollows197536.7719325110.9355183730.6563
Diagonal tensile strength0.64522.20.1430.2045.70.010.56535.20.199
Shear straining9968.9188.7138936.1501114111.8135
Flexural strength parallel to the bed joints0.13912.630.0180.0814.20.010.1174.260.005
Flexural strength perpendicular to the bed joints0.32218.10.0580.1725.20.040.27130.30.083
Table 5. Output of the best parameters used in this calibration.
SpecimensArea of Strut
(m2)
fm
(kPa)
ε0
(%)
εu
(%)
fres
(kPa)
Diagonal Length
(m)
Wall ThicknessFactor to Diagonal Length
IS0.018922480.00280.016142063.167261.50.052156000.24
IDO20.012922480.00280.016142063.167261.50.052156000.17
IWO20.015022480.00280.016142063.167261.50.052156000.19
S0.018529250.00460.01673225.025641.50.0626000.21
WO20.01852086.80.003750.01641119.695231.50.0626000.21
DO20.018514420.003170.0161077.420251.50.0626000.21
Specimen 1500.180010900.00070.00627224.954134.80.1510900.25
Specimen 1100.132010200.00030.0013102104.80.1110200.25
Specimen 3150.139018000.0010.002180104.80.3118000.09
Disclaimer/Publisher’s Note: The statements, opinions and data contained in all publications are solely those of the individual author(s) and contributor(s) and not of MDPI and/or the editor(s). MDPI and/or the editor(s) disclaim responsibility for any injury to people or property resulting from any ideas, methods, instructions or products referred to in the content.

