

Evaluation of Maximum Shear Strength of Prestressed Concrete (PSC) Hollow Core Slab (HCS)


Abstract
1. Introduction
2. Major Structural Design Criteria of PS-HCSs
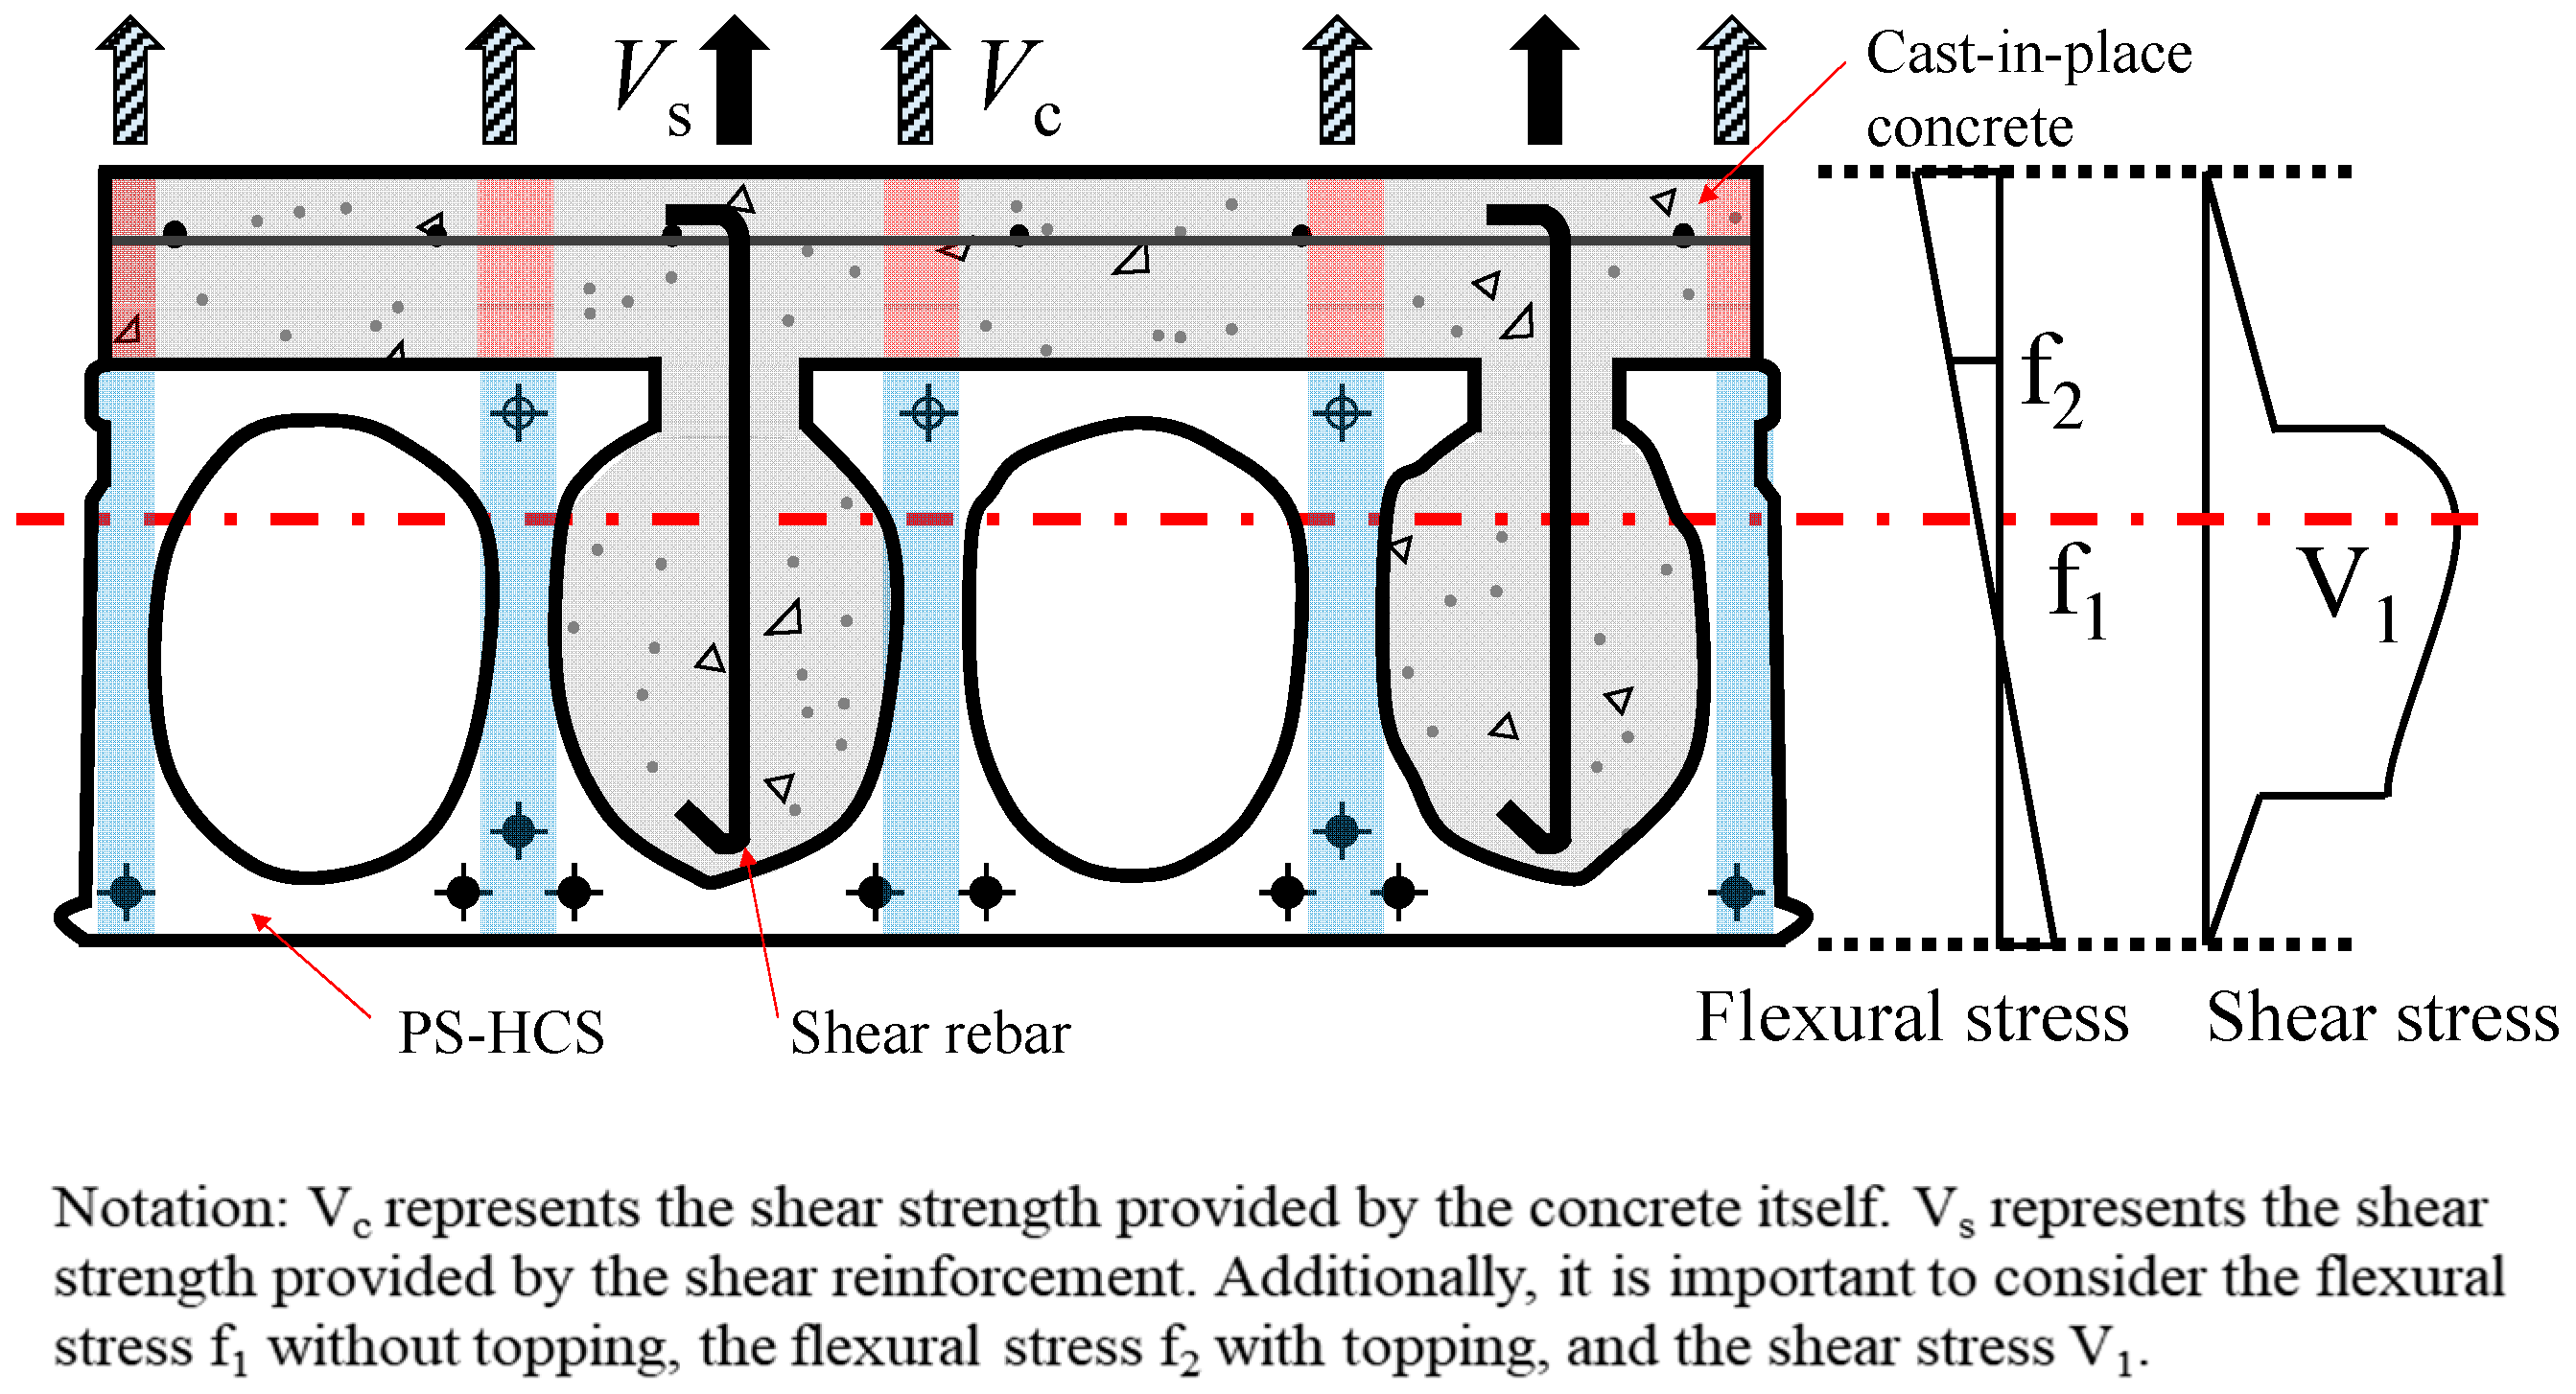
Shear Strength
3. Test Program
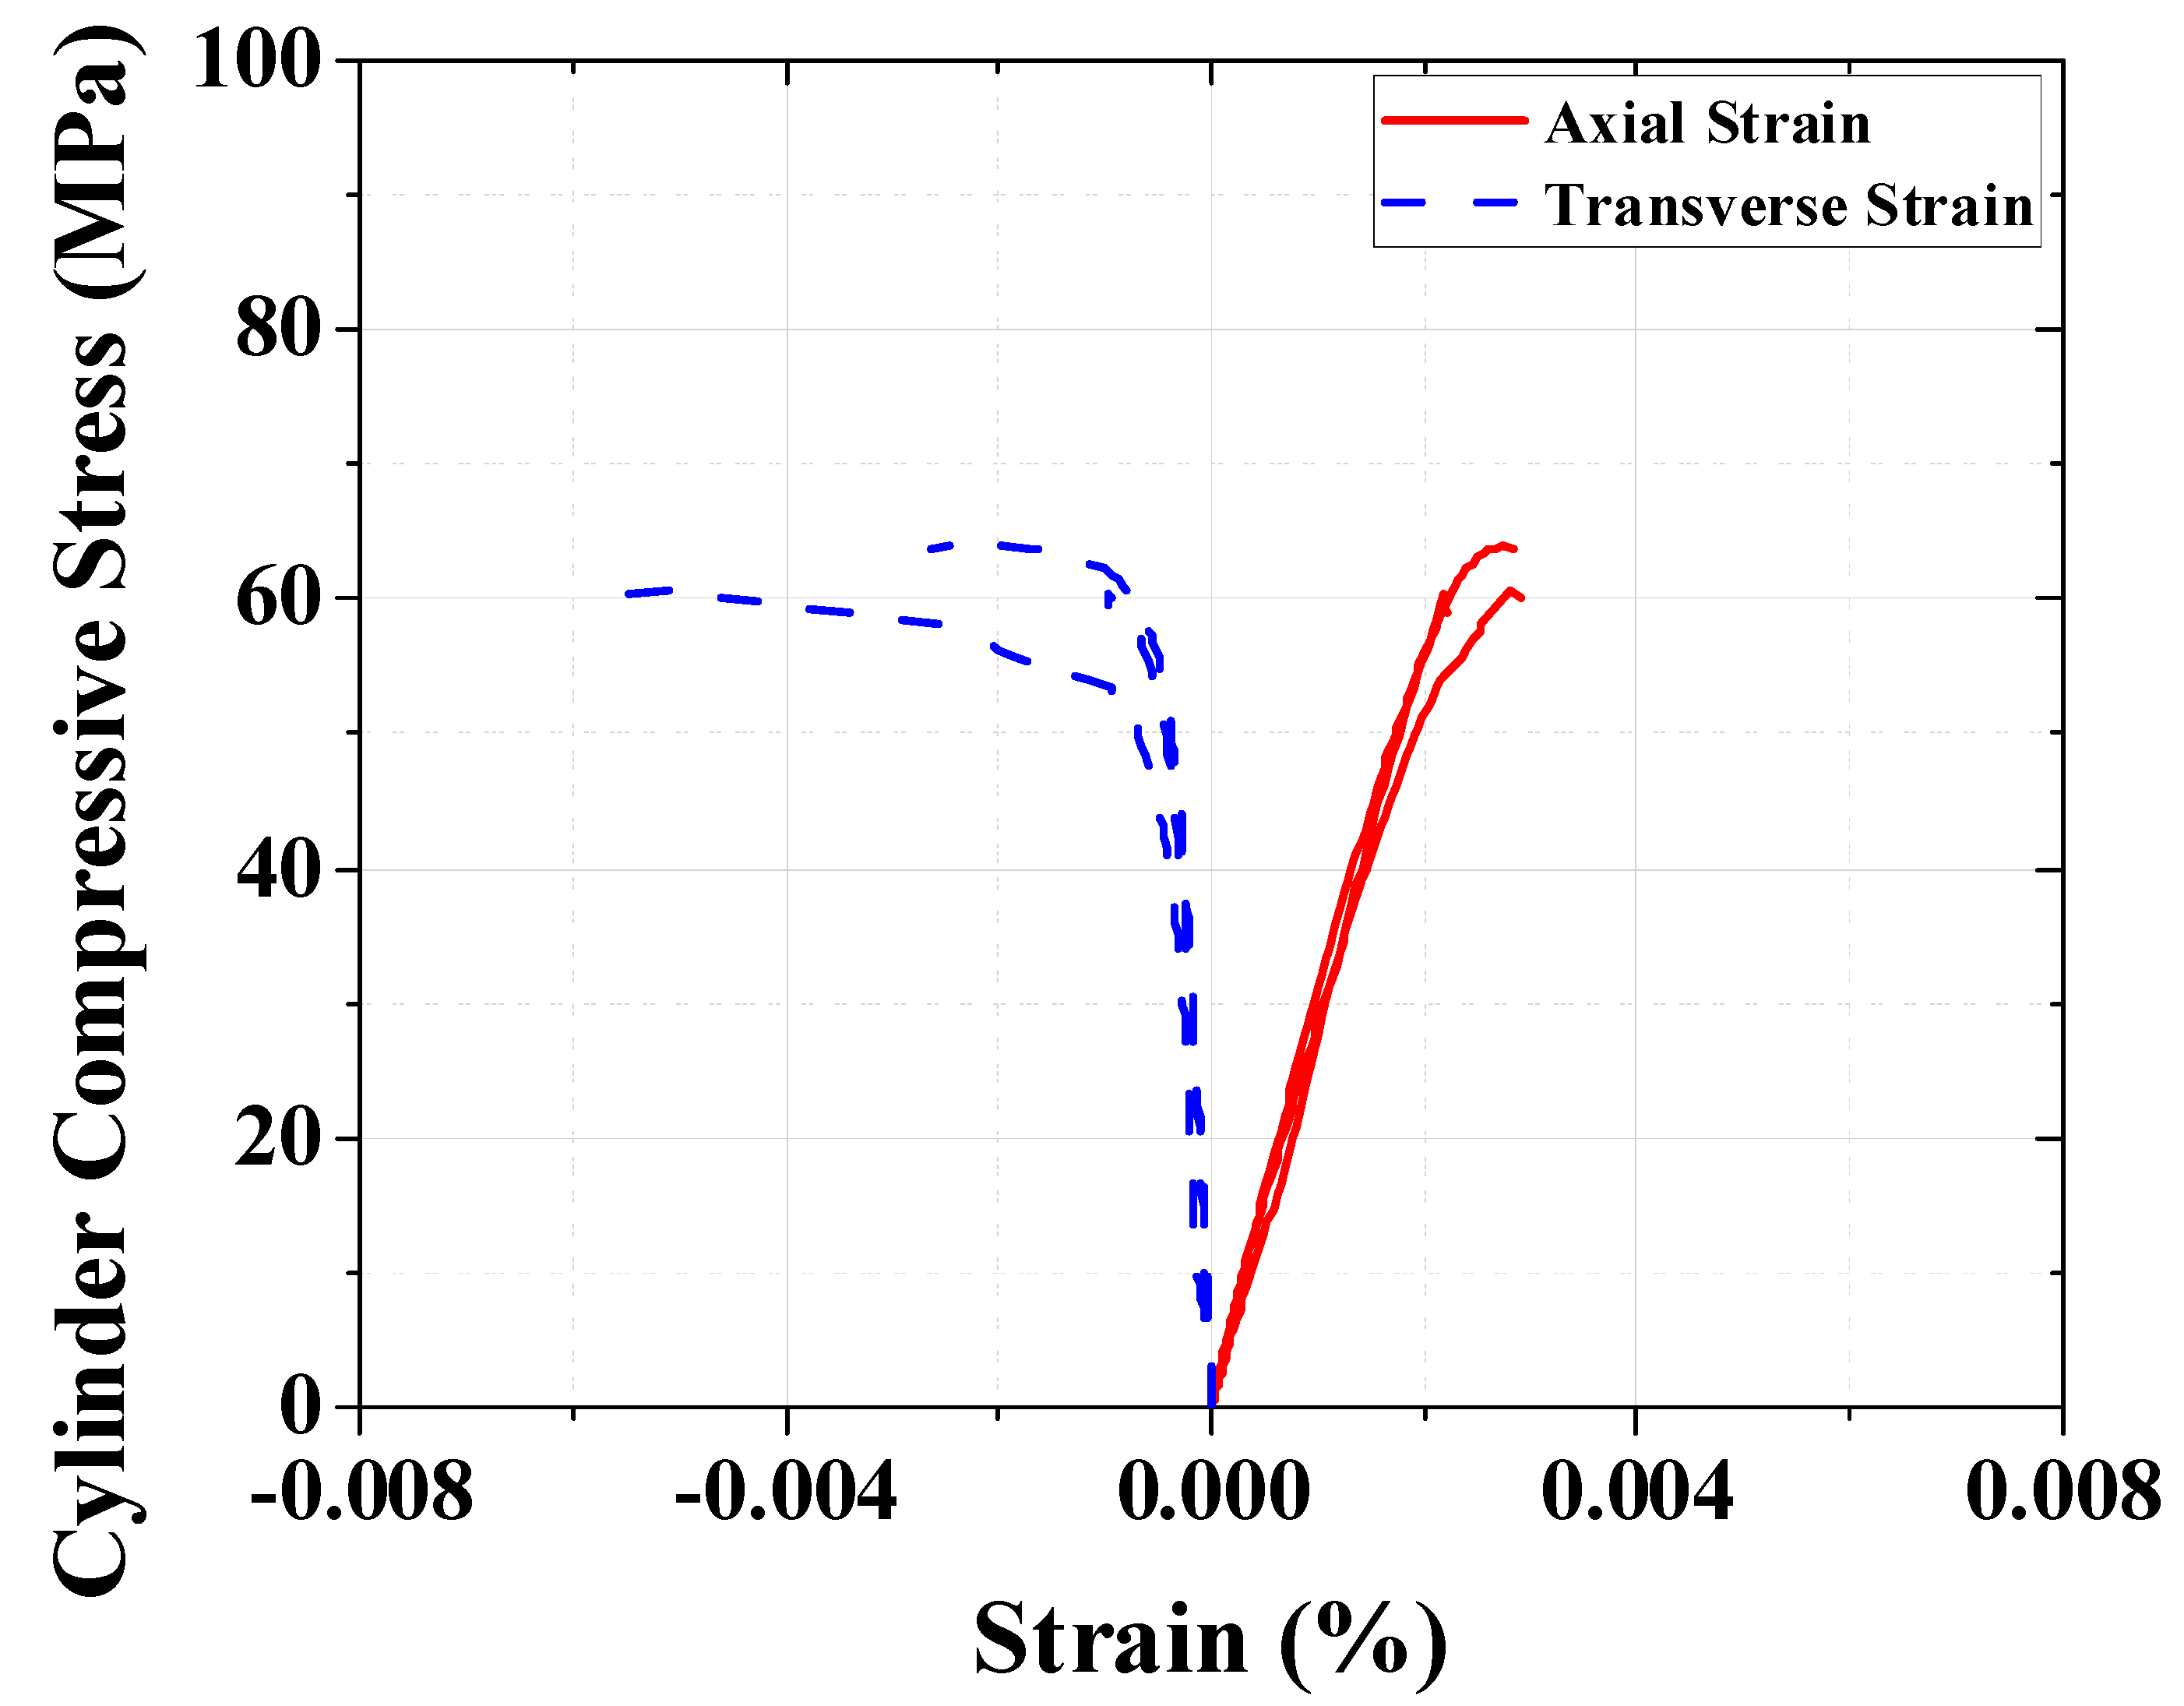
3.1. Materials
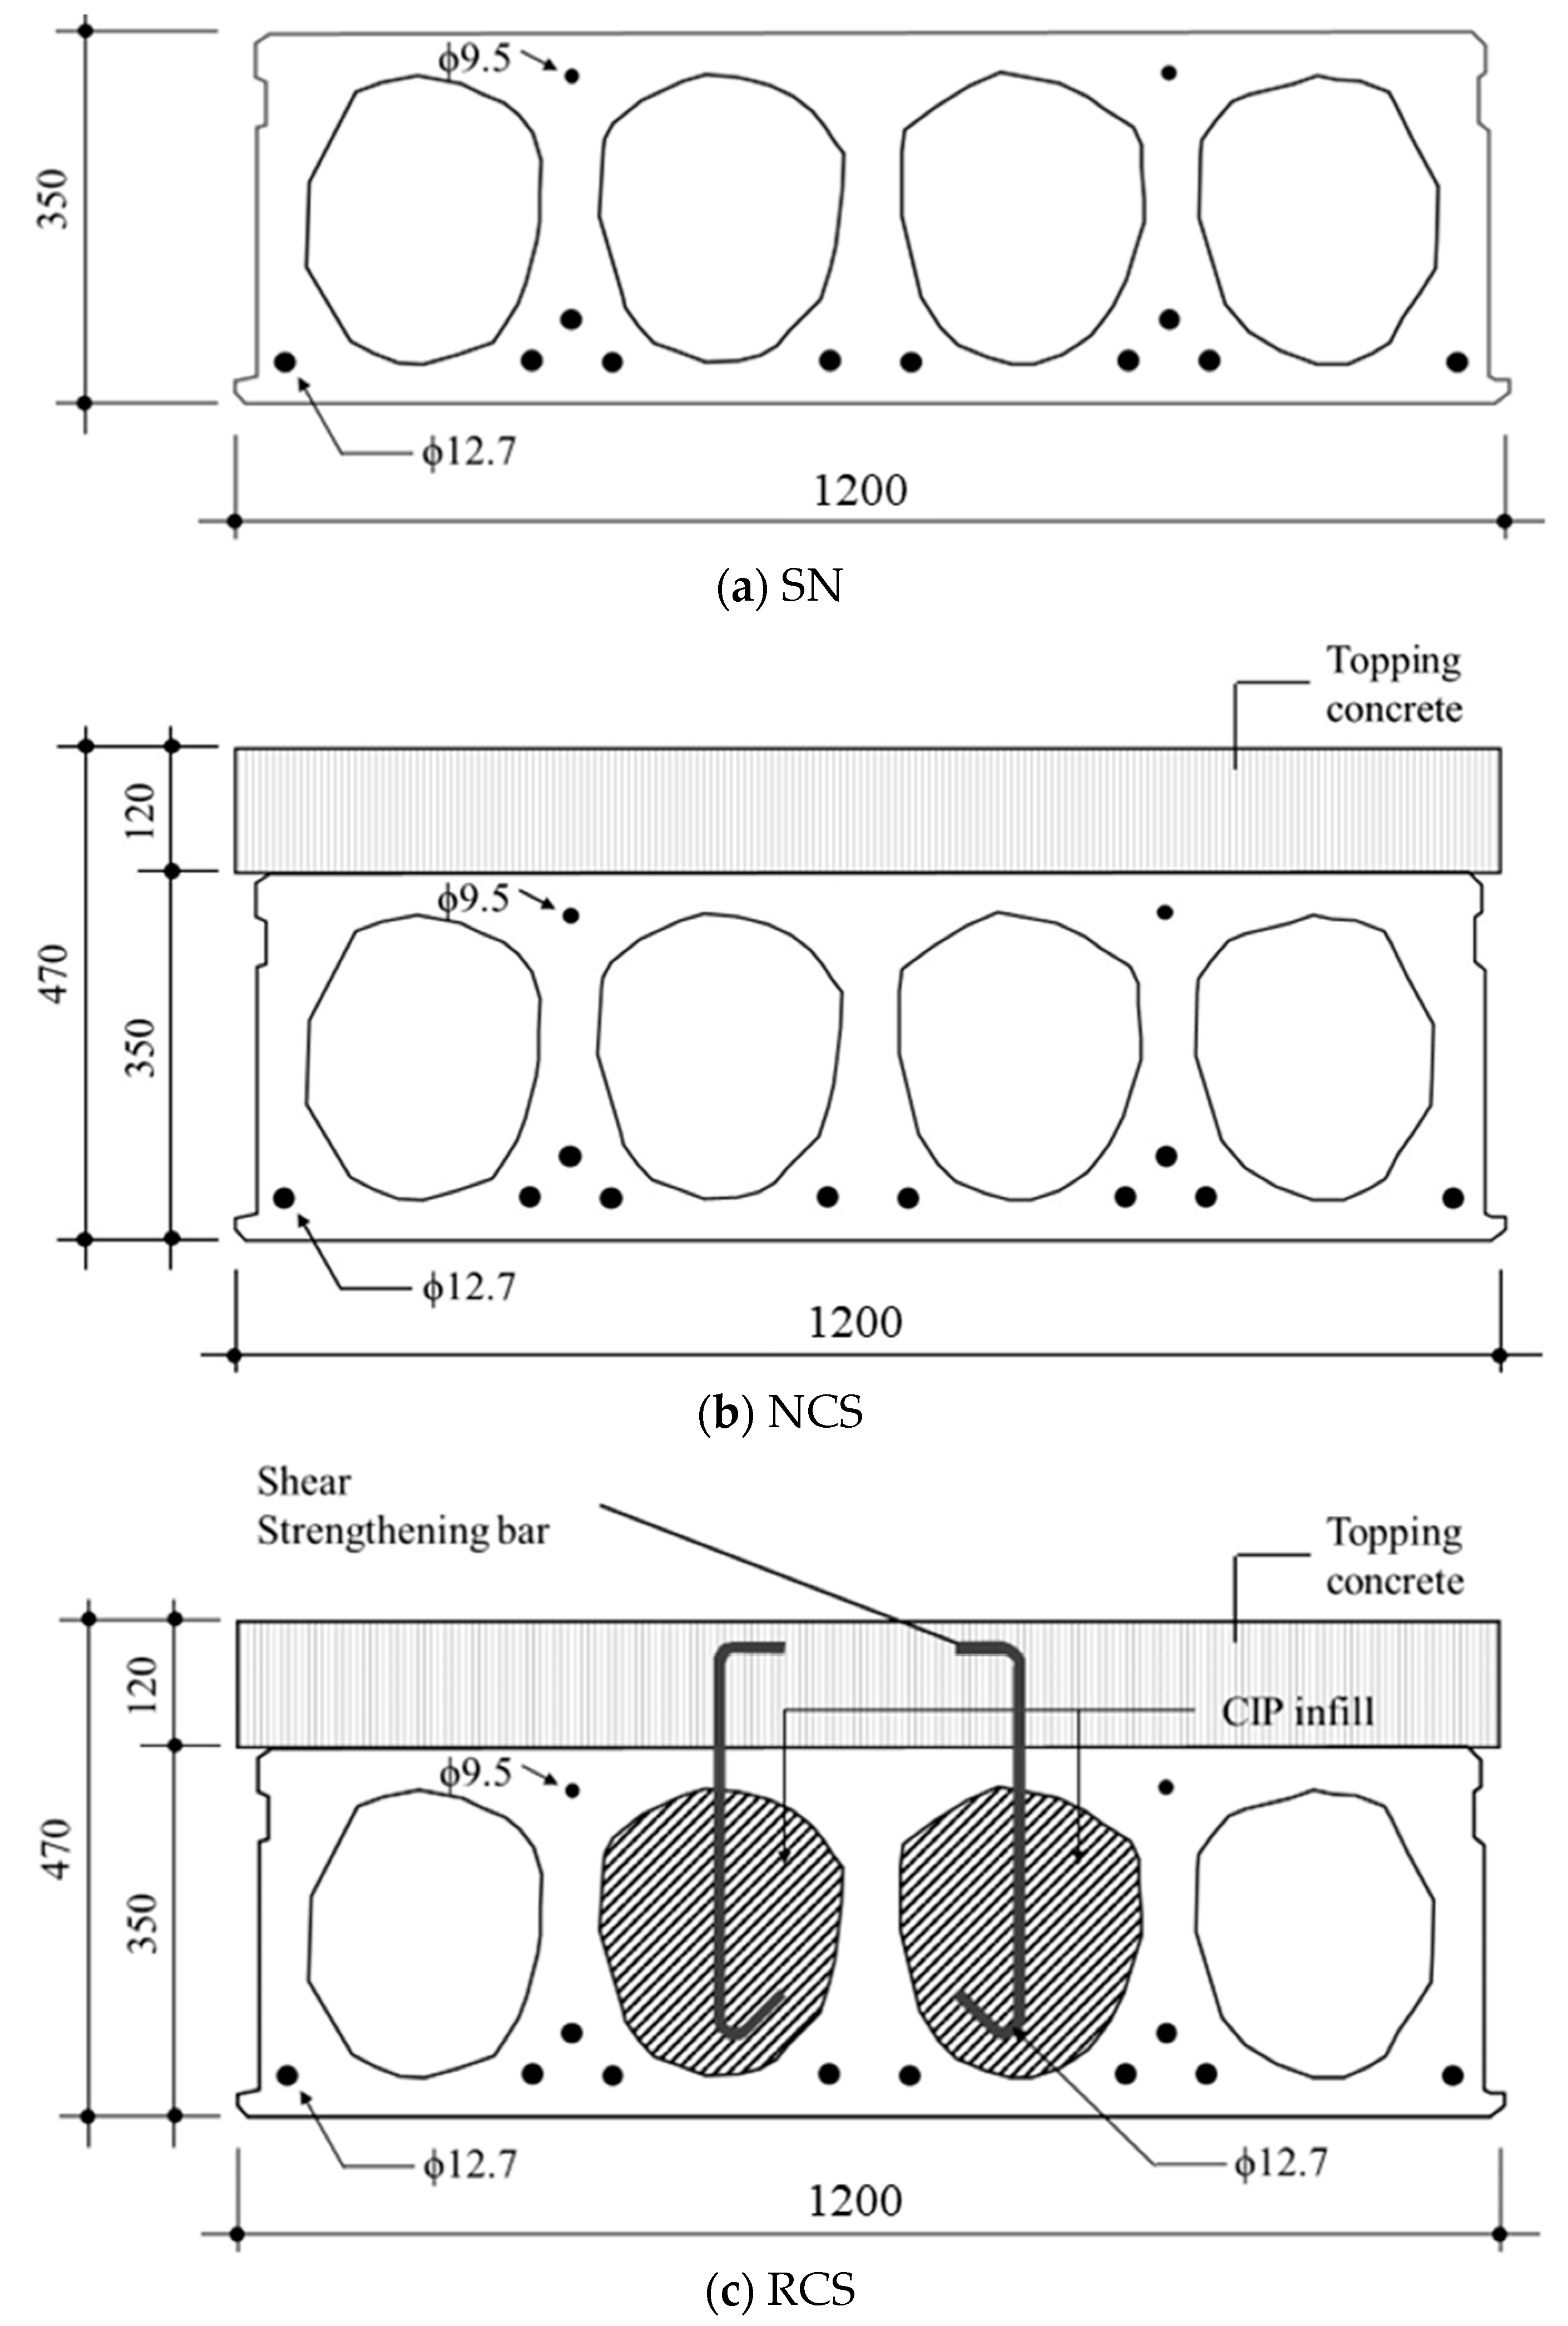
3.2. Design of Specimens
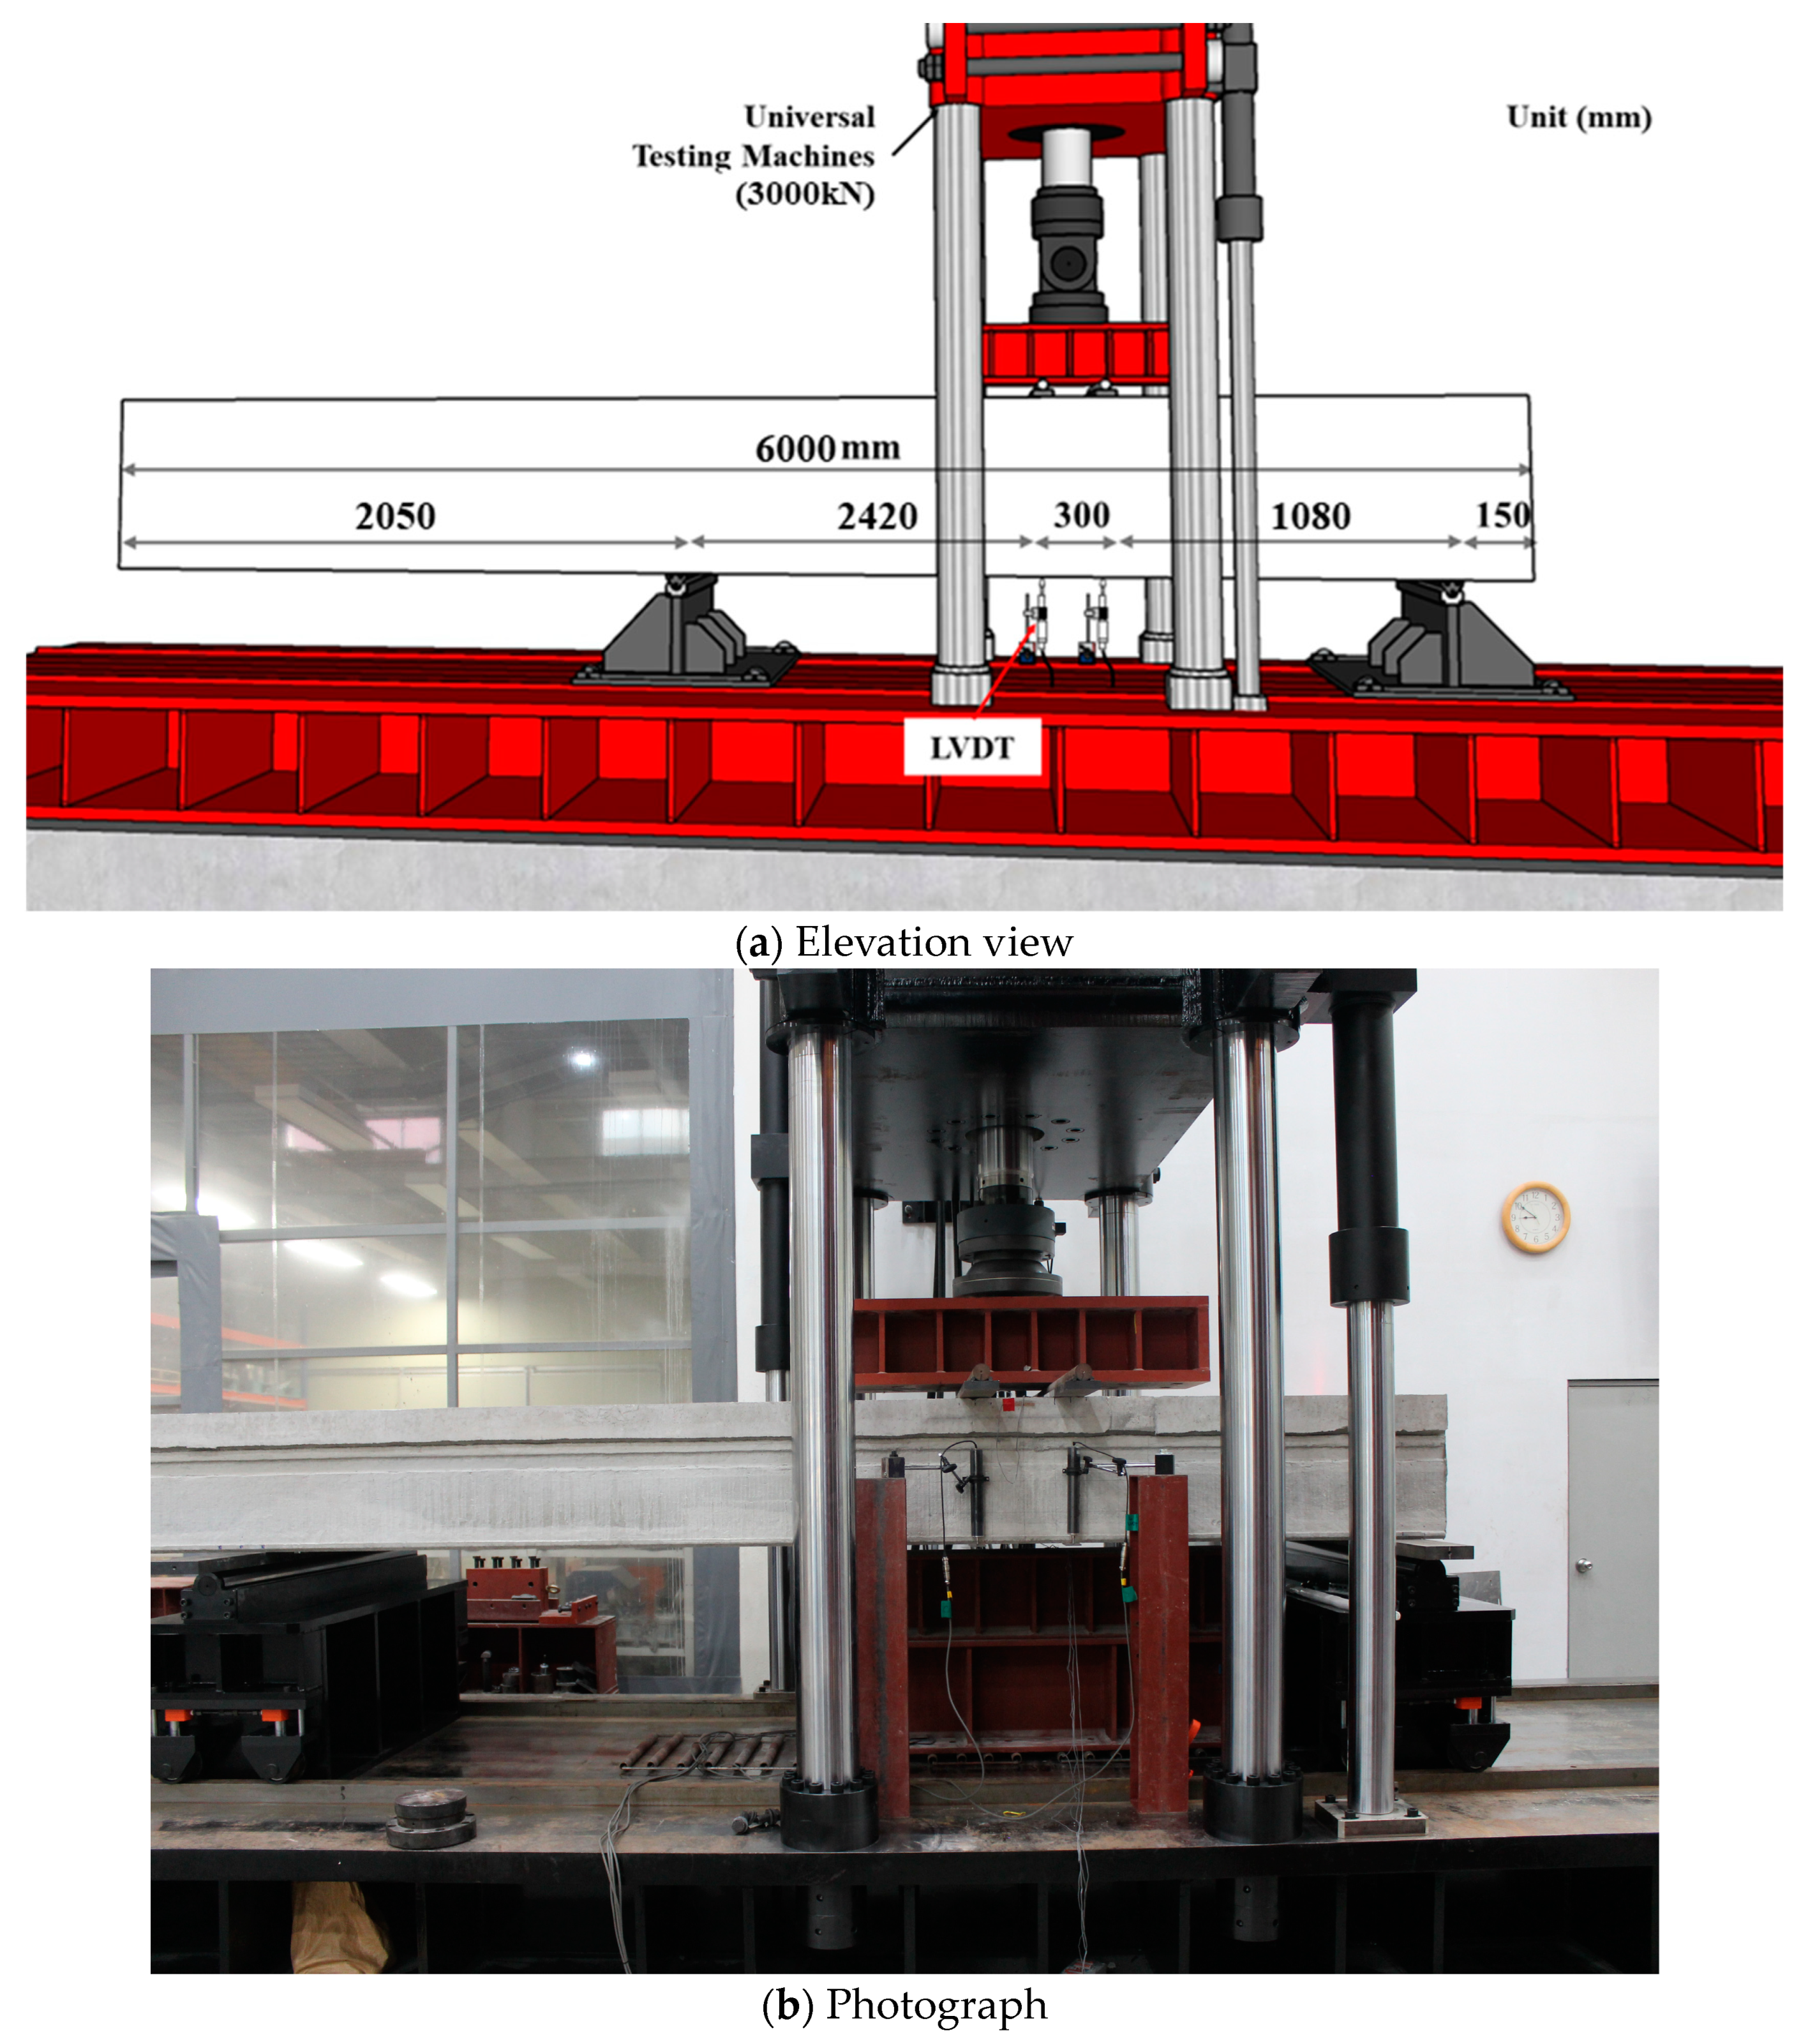
3.3. Test Setup
4. Results and Discussion
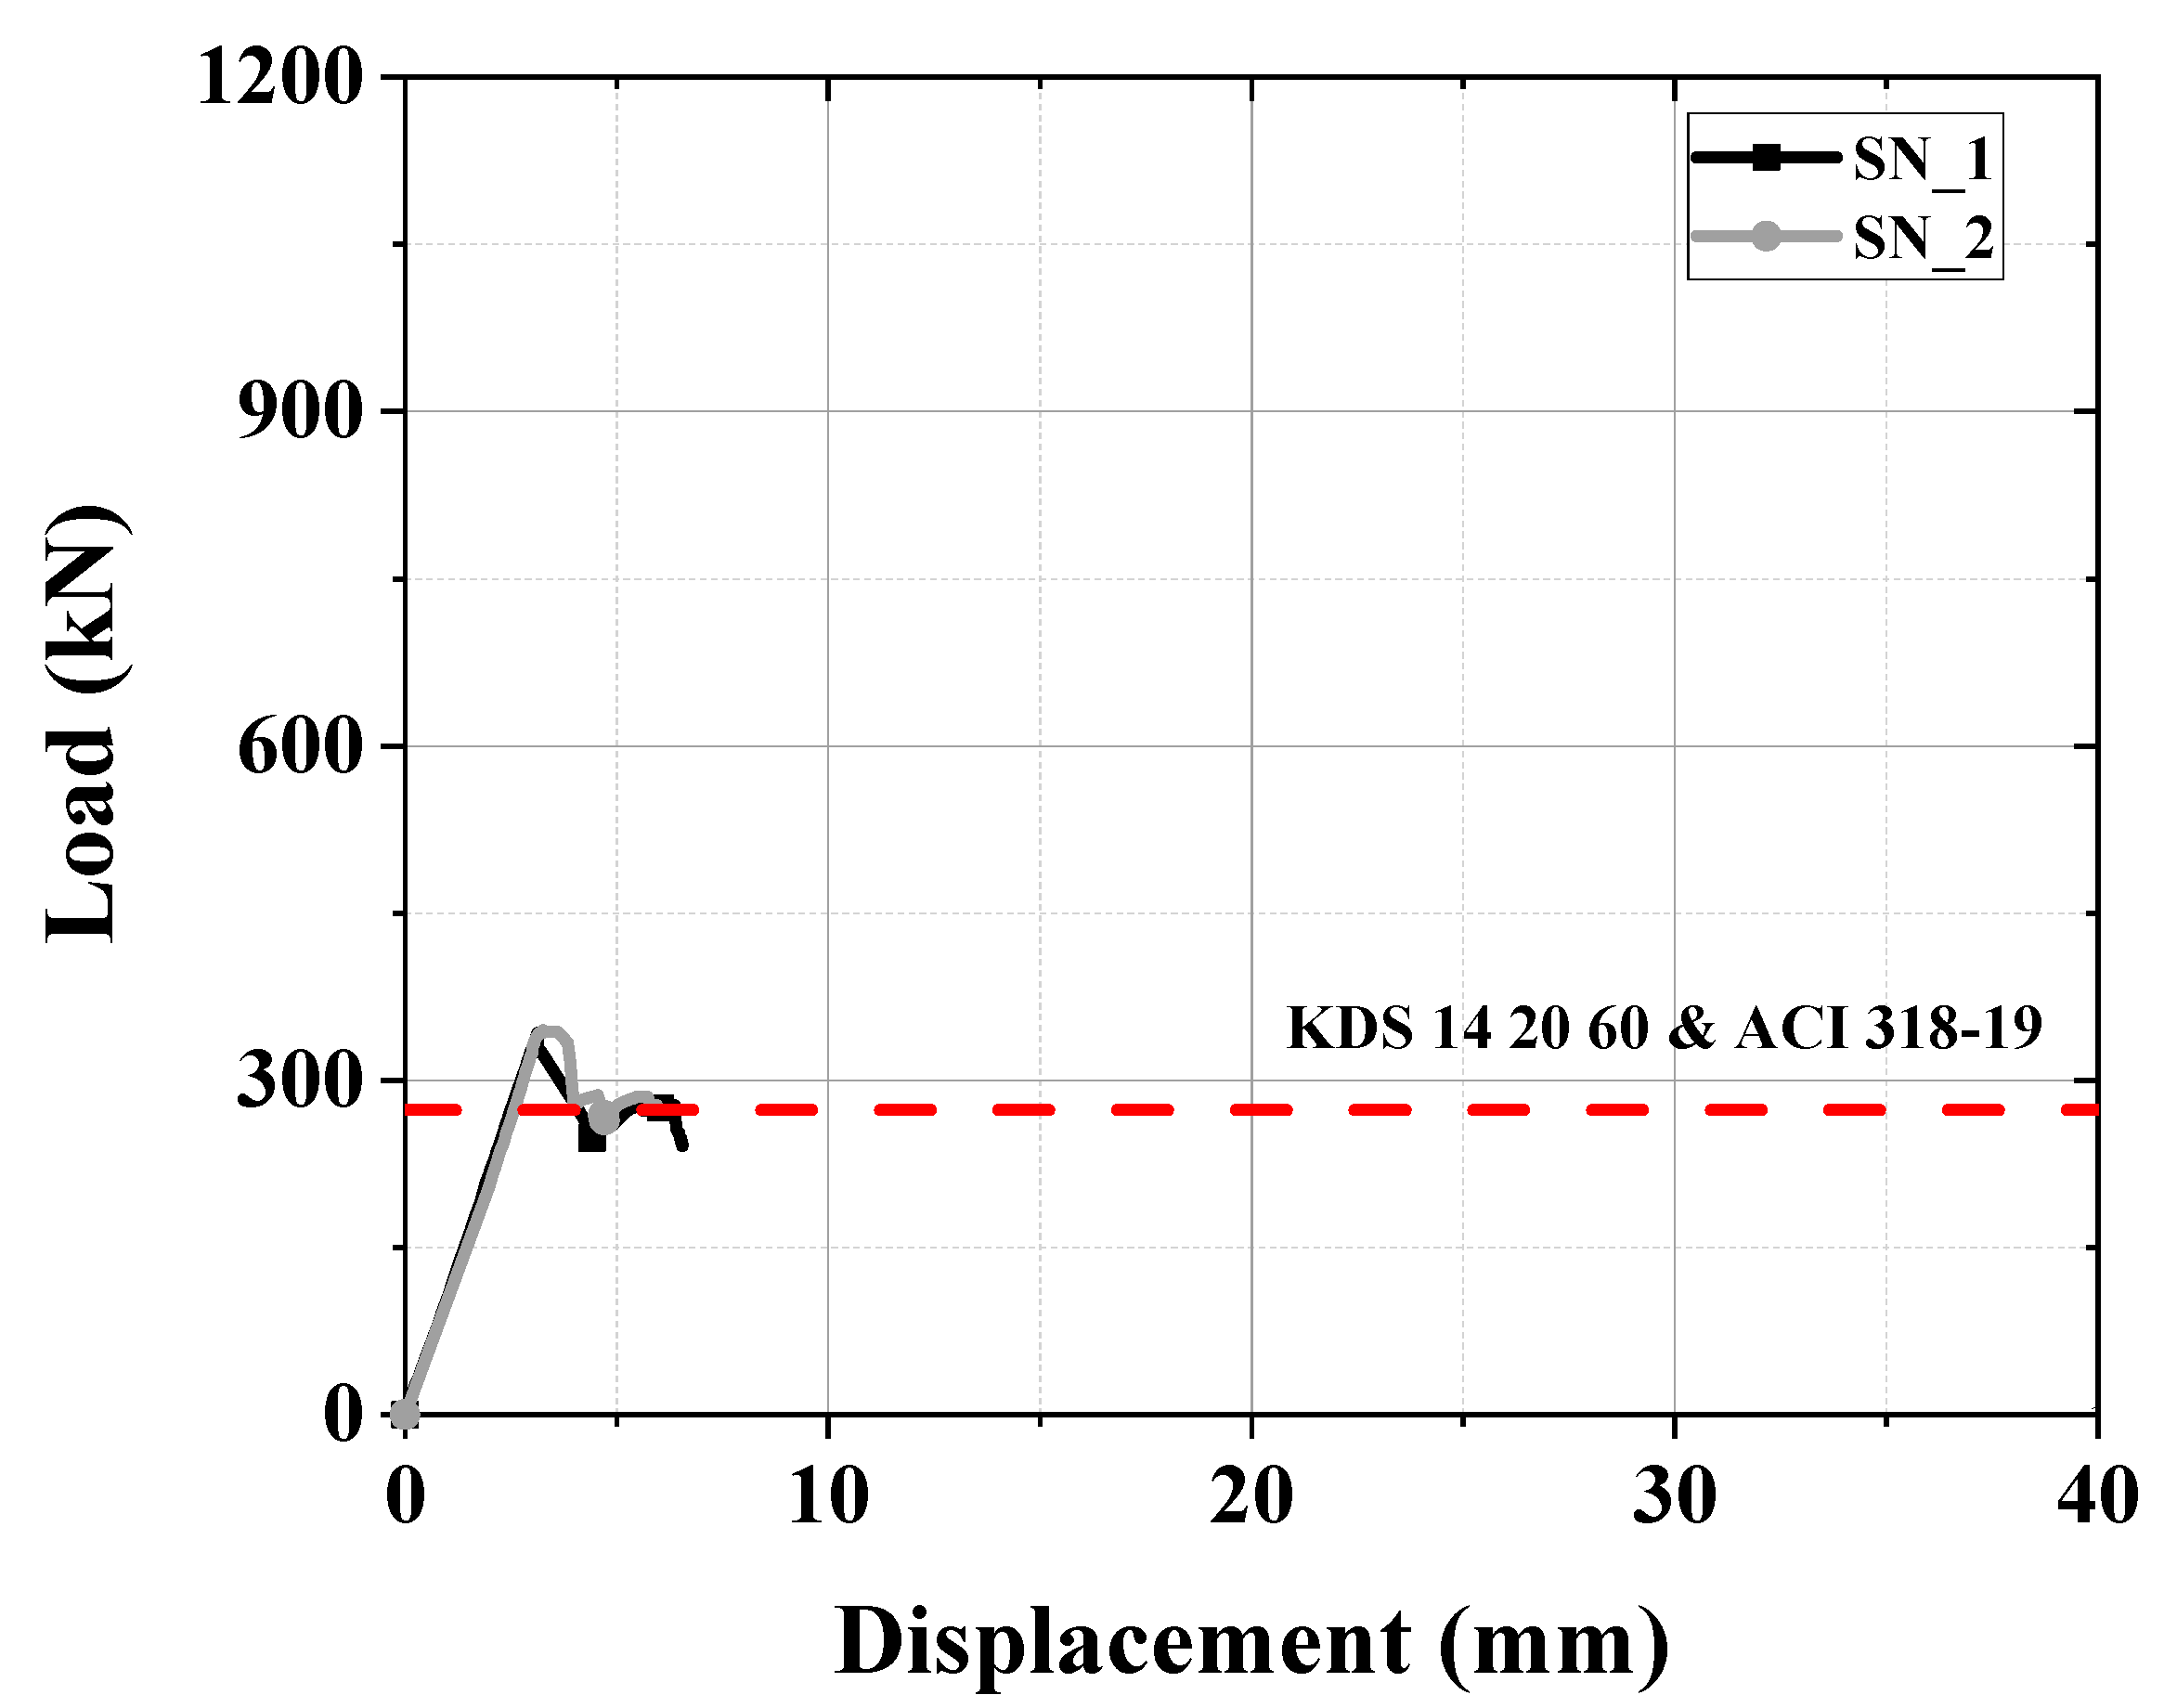
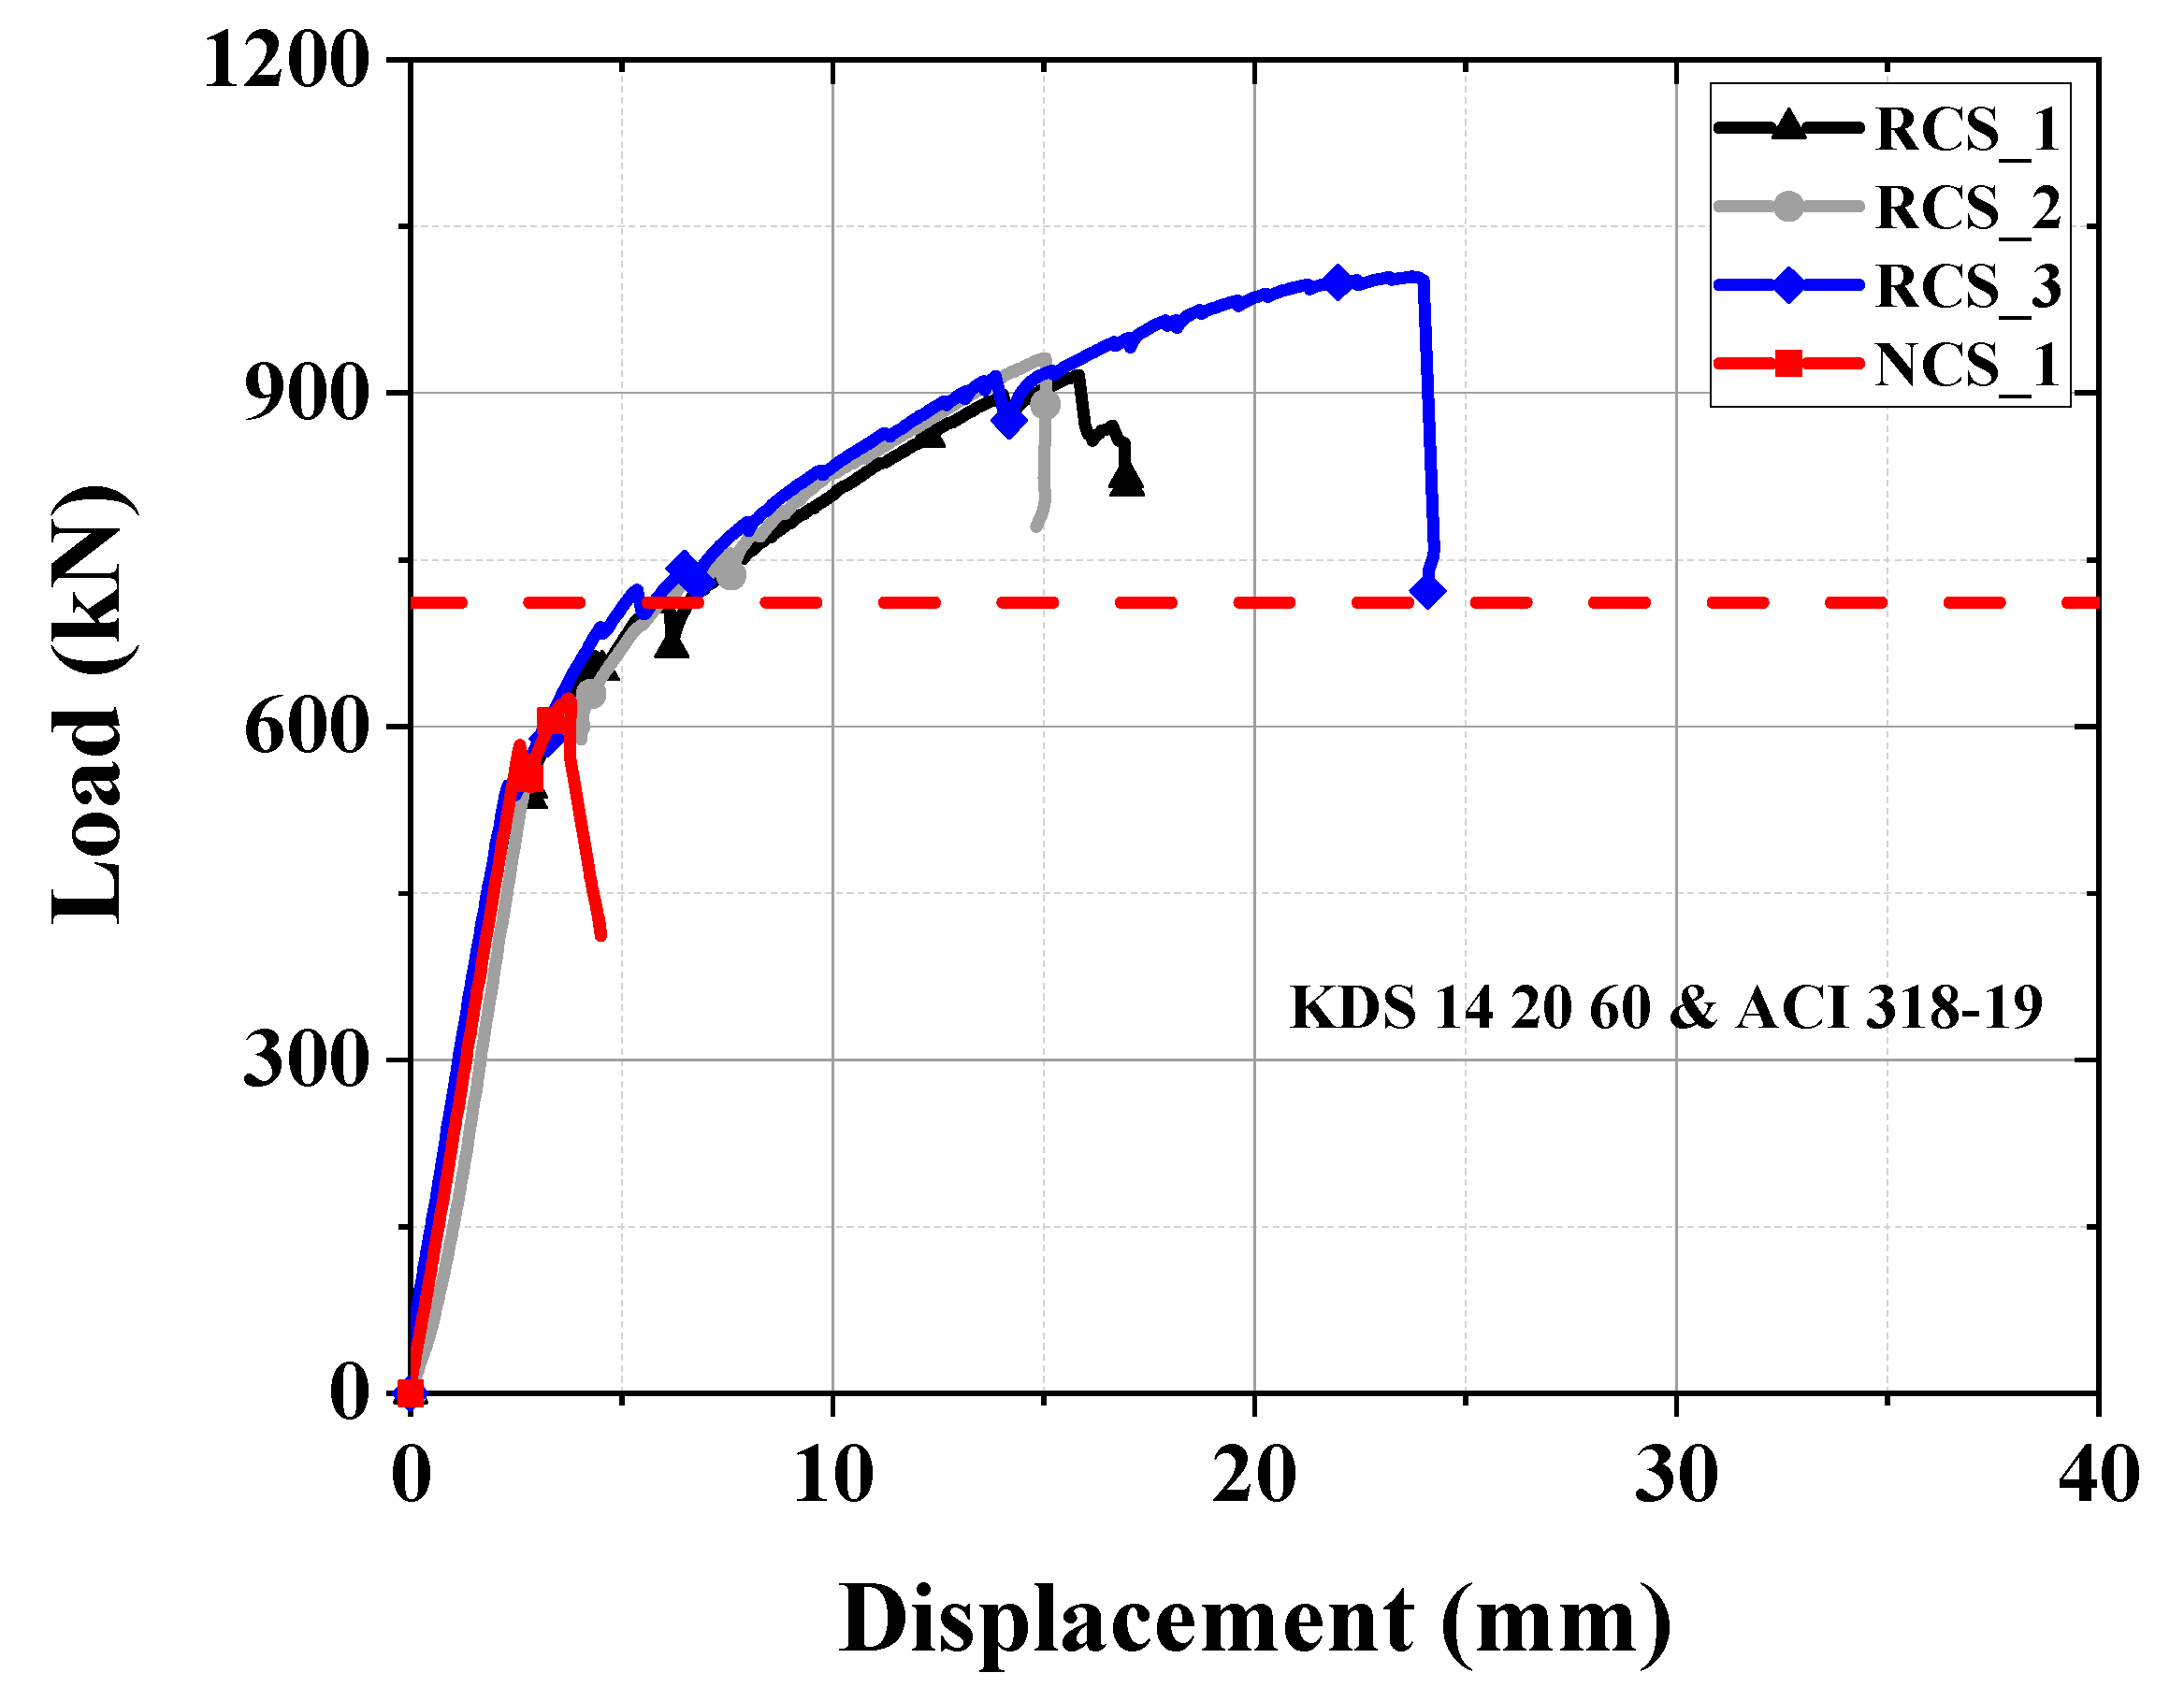
4.1. Load–Displacement Relationship
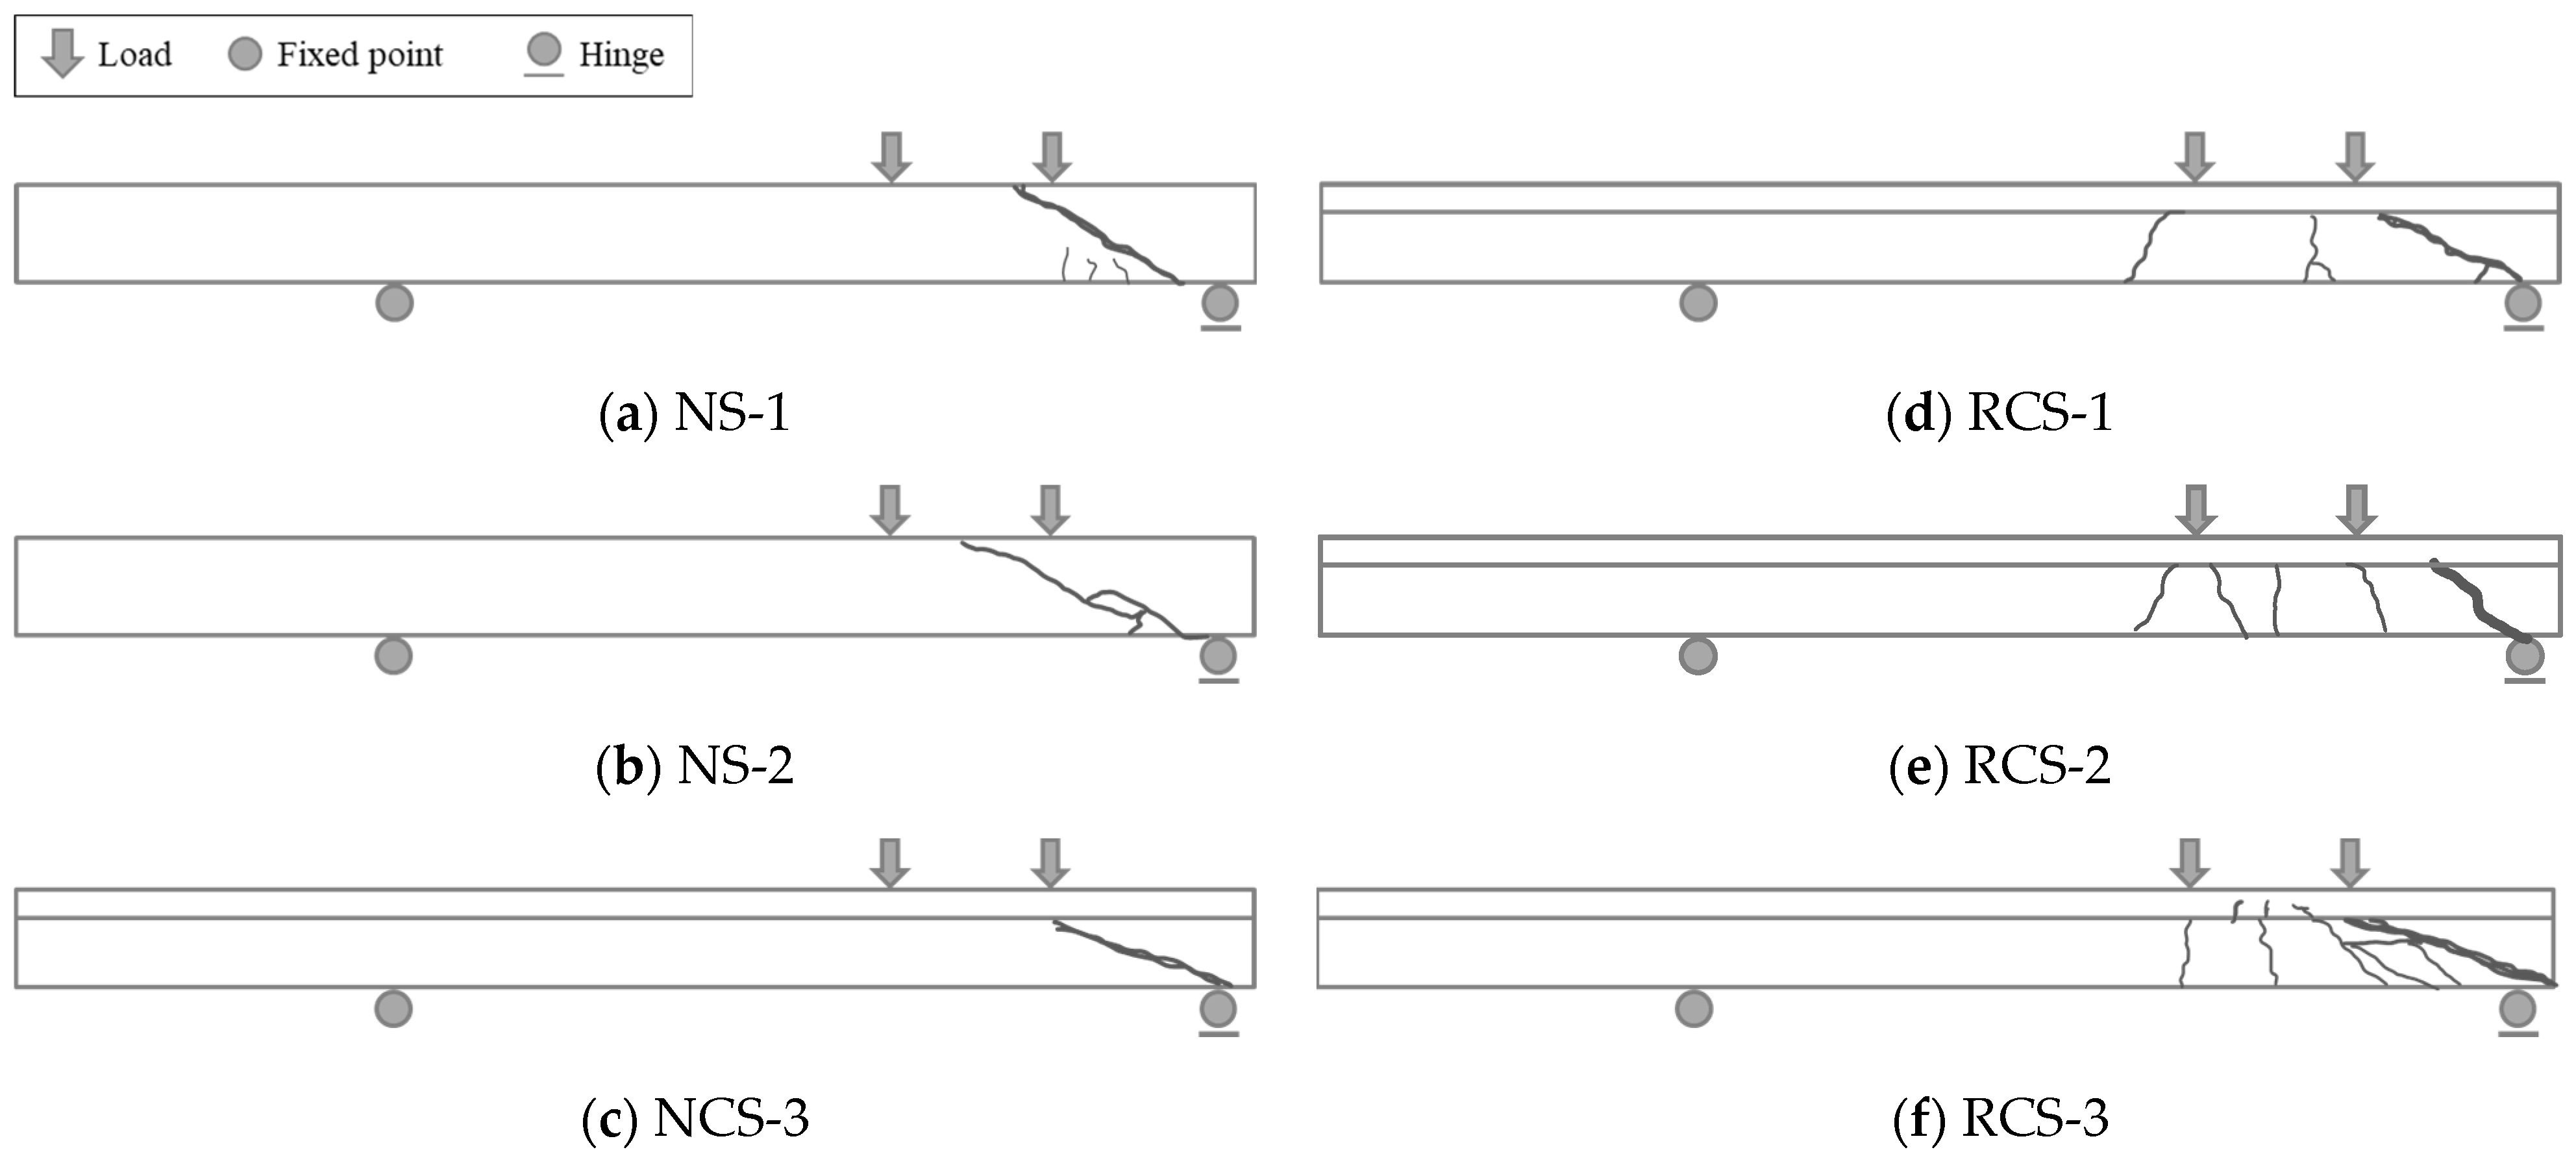
4.2. Crack Pattern
4.3. Shear Strength
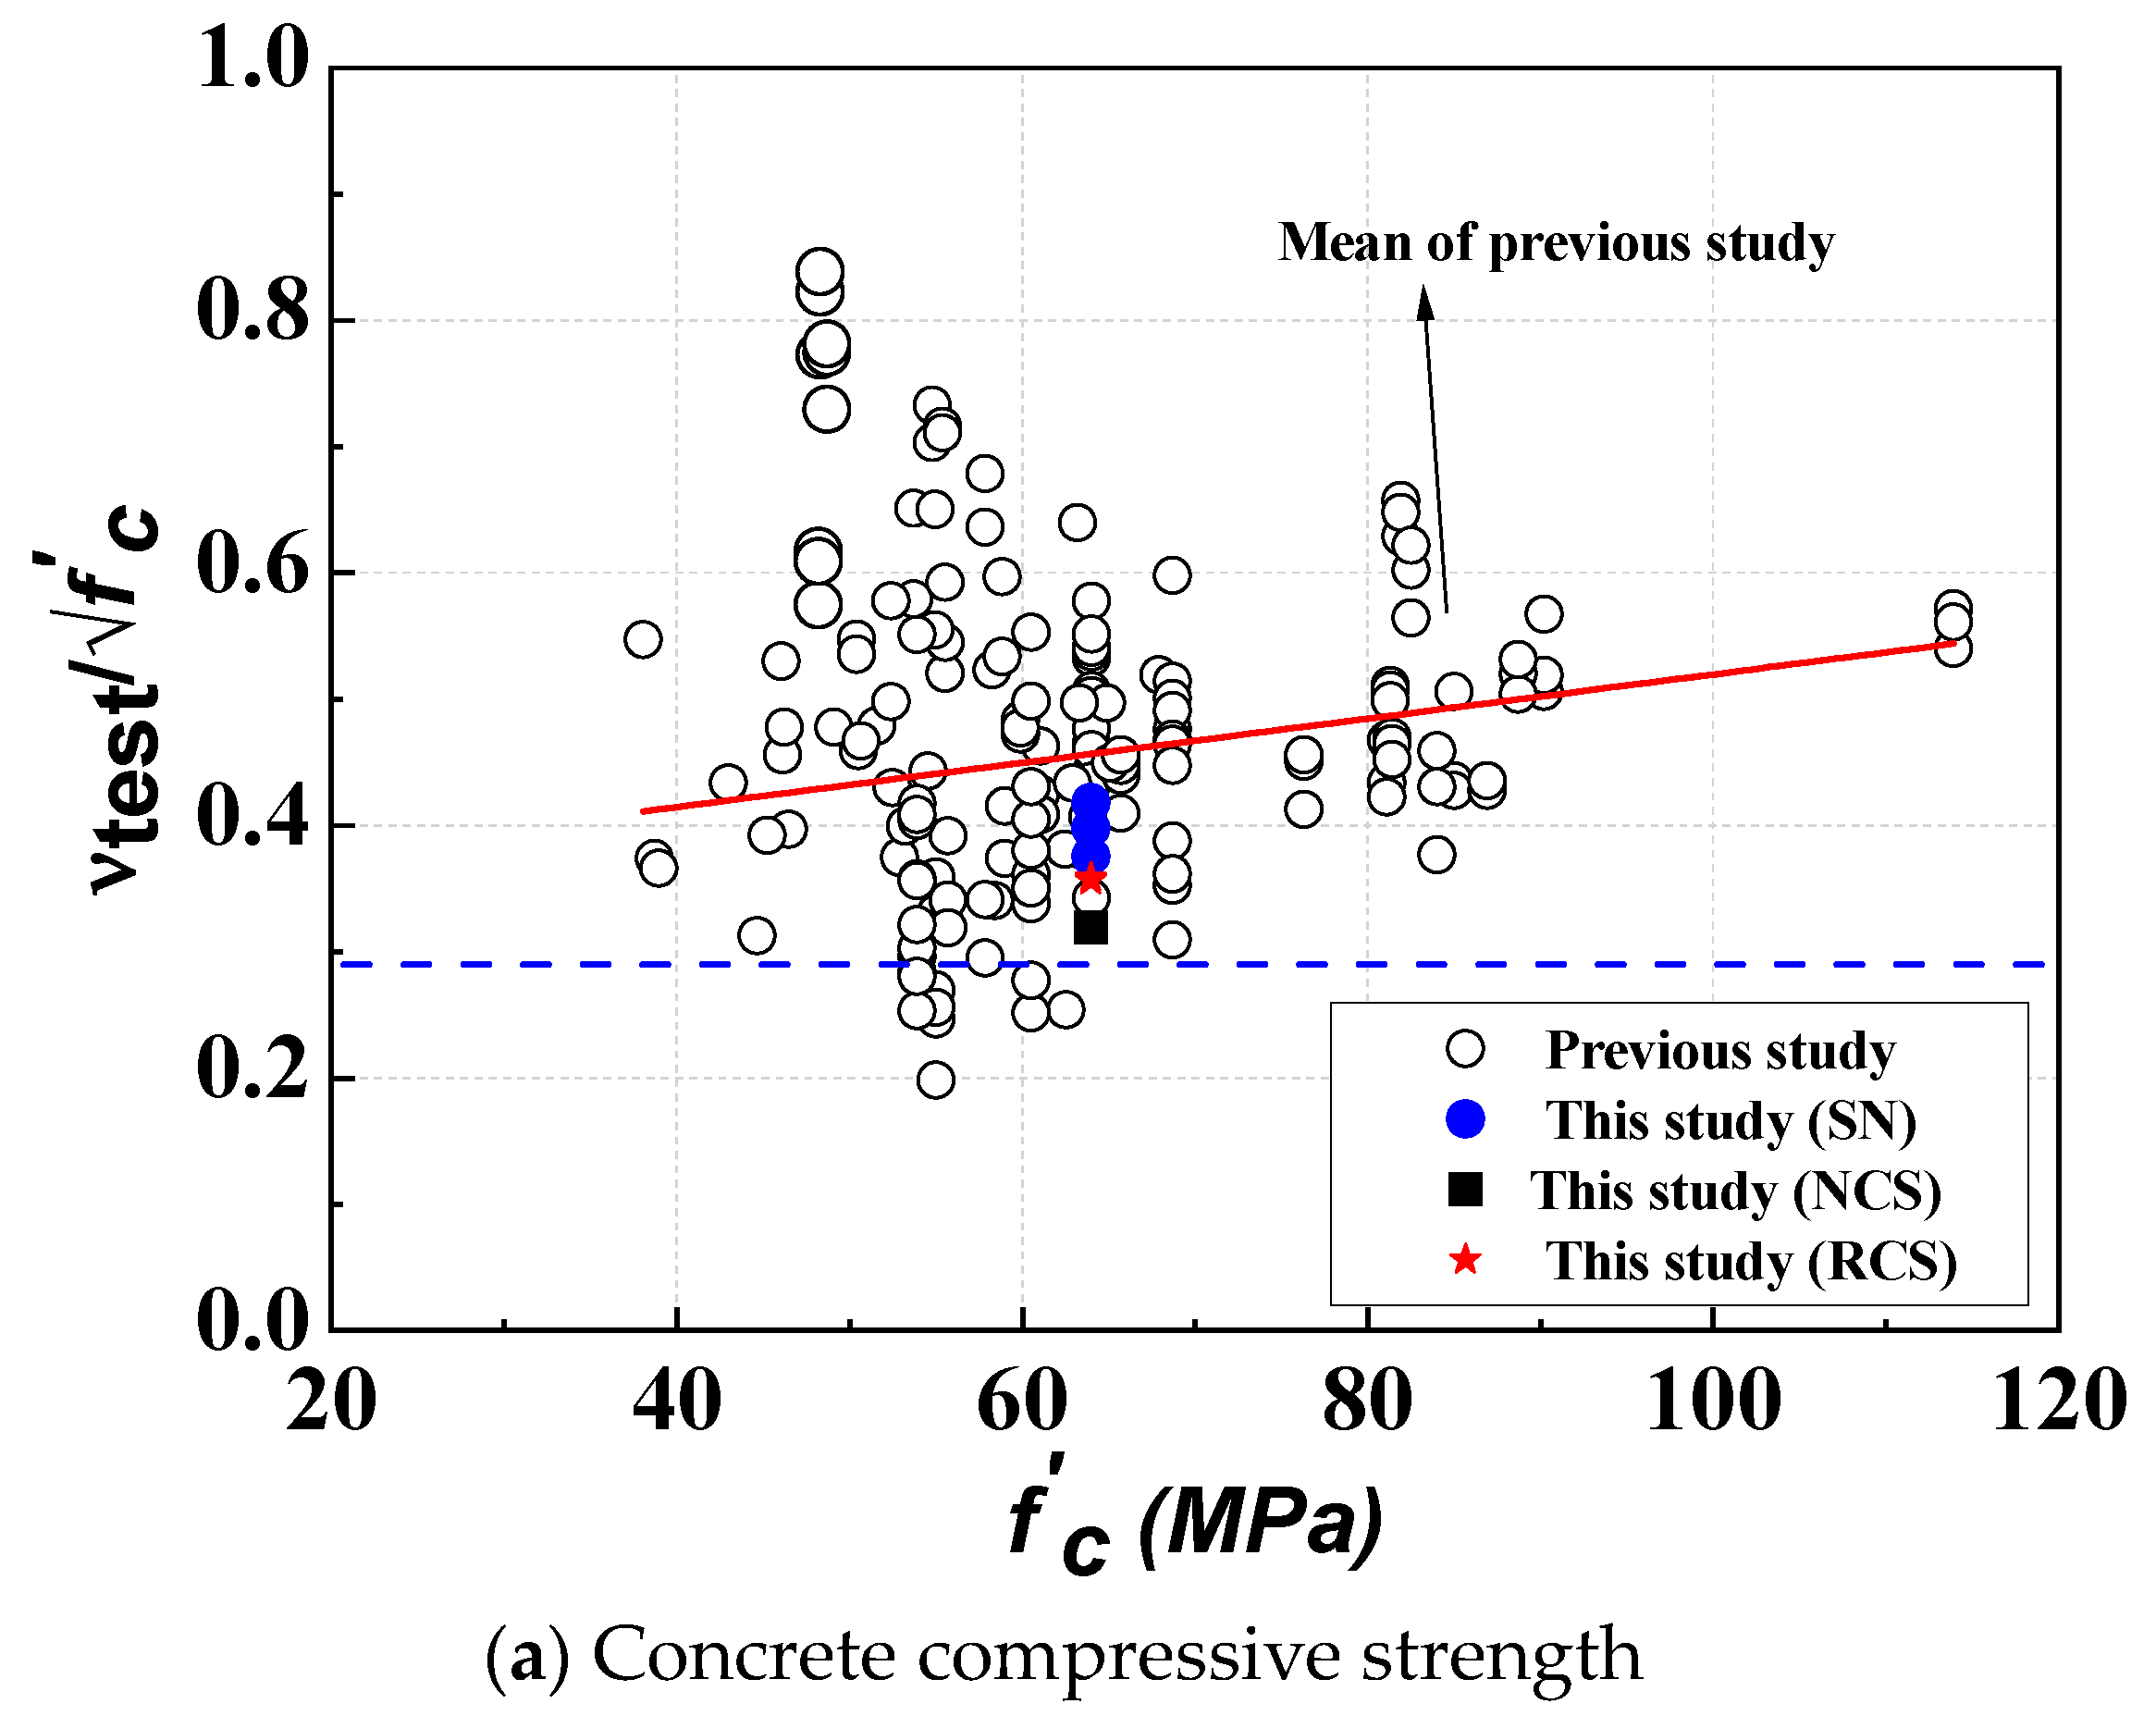
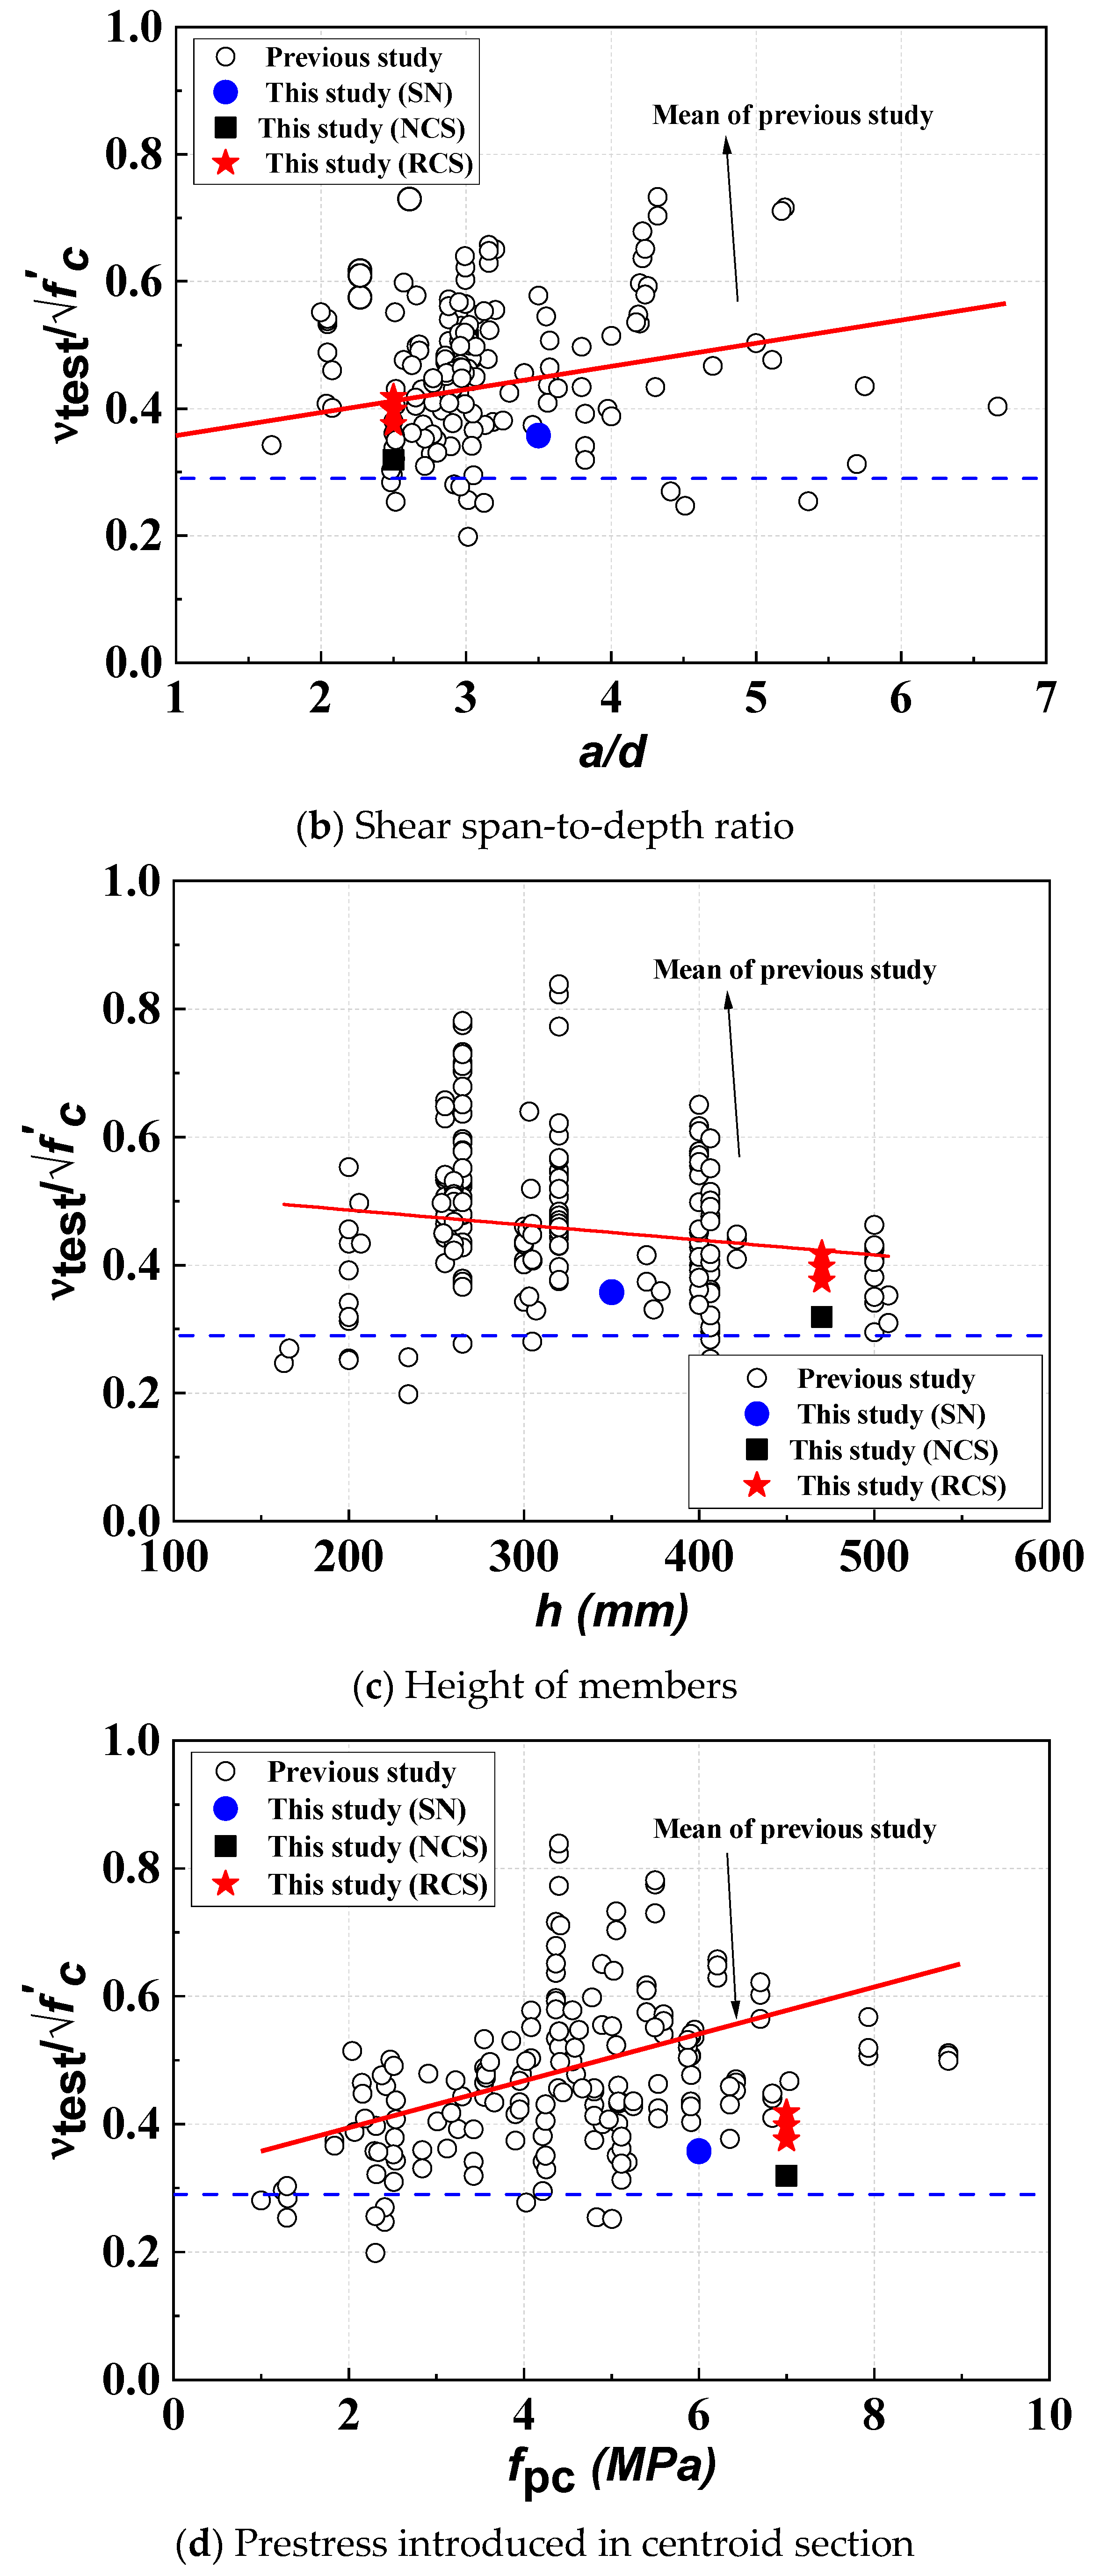
4.4. Analysis of Influence Factors on the Web-Shear Capacity
5. Conclusions
- The PS concrete hollow slab (HCS) specimens with shear reinforcement exhibited increased strength and ductile behavior compared to specimens without shear reinforcement. After the occurrence of diagonal shear cracks, the shear reinforcement effectively resisted these cracks. For the unreinforced N-series specimens, the ratios of the nominal shear strength to peak shear strength were 1.02, 1.00, and 1.04, respectively. In contrast, for the reinforced RCS specimens, the ratios were 1.06, 1.07, and 1.06, demonstrating the enhanced strength and ductile behavior due to the shear reinforcement.
- The nominal shear strength of the PS concrete hollow slab exceeded the design values considering the hollow section, with experimental results showing ratios ranging from 1.26 to 1.87. This indicates that the required performance was met, largely due to the effects of shear reinforcement, topping concrete, and the compressive stress induced by prestressing at the section’s centroid, resulting in improved web shear performance.
- According to the design criteria, the shear reinforcement length should be increased. However, even the RCS specimens that did not meet the minimum shear reinforcement criteria exceeded the nominal shear strength. Therefore, the expected shear performance degradation for hollow slabs thicker than 315 mm, as restricted by the standard, was not observed in this experiment. The 350 mm section hollow slab verified in this study satisfied the current shear performance standards despite not meeting the minimum shear reinforcement criteria. While the concrete compressive strength and the shear span-to-depth ratio had some influence on web shear strength, the effect of size was found to be minimal.
Author Contributions
Funding
Data Availability Statement
Acknowledgments
Conflicts of Interest
References
- Girhammar, U.A.; Pajari, M. Tests and Analysis on Shear Strength of Composite Slabs of Hollow Core Units and Concrete Topping. Constr. Build. Mater. 2008, 22, 1708–1722. [Google Scholar] [CrossRef]
- Bertagnoli, G.; Mancini, G. Failure Analysis of Hollow-Core Slabs Tested in Shear. Struct. Concr. 2009, 10, 139–152. [Google Scholar] [CrossRef]
- Palmer, K.D.; Schultz, A.E. Factors affecting web-shear capacity of deep hollow-core units. PCI J. 2010, 55, 123–146. [Google Scholar] [CrossRef]
- Walraven, J.C.; Mercx, W.P.M. The bearing capacity of prestressed hollow-core slabs. Heron 1983, 28, 1–46. [Google Scholar]
- Yang, L. Ein Haufwerksthe Oretisches Model der Restfestigkeit Grschadigter Betone. Ph.D. Thesis, The Technical University of Braunschweig, Braunschweig, Germany, 1978. (In German). [Google Scholar]
- Pajari, M. Design of Prestressed Hollow Core Slabs; Research Reports 657; Technical Research Centre of Finland (VTT): Espoo, Finland, 1989. [Google Scholar]
- Pajari, M. Resistance of Prestressed Hollow Core Slabs against Web Shear Failure; Technical Research Centre of Finland (VTT): Espoo, Finland, 2005. [Google Scholar]
- Becker, R.J.; Buettner, D.R. Shear tests of extruded hollow-core slabs. PCI J. 1985, 30, 40–54. [Google Scholar] [CrossRef]
- Mones, R.M.; Breña, S.F. Hollow-core slabs with cast-in-place concrete toppings: A study of interfacial shear strength. PCI J. 2013, 58, 124–141. [Google Scholar] [CrossRef]
- Pajari, M. Web shear failure in prestressed hollow core slabs. J. Struct. Eng. 2009, 42, 83–104. [Google Scholar]
- Im, J.H.; Park, M.K.; Lee, D.H.; Seo, S.Y.; Kim, K.S. Evaluation of horizontal shear strength of prestressed hollow-core slabs with cast-in-place topping concrete. J. Korea Concr. Inst. 2014, 26, 741–749. (In Korean) [Google Scholar] [CrossRef]
- Moon, J.H. Structural Performance for the Extruded Hollow Core Slabs with Prestressed Concretes; Hansung PCC & Hannam University Research Report; Hansung PCC & Hannam University: Daejeon, Republic of Korea, 2017. (In Korean) [Google Scholar]
- Lee, Y.J.; Kim, H.K.; Kim, M.J.; Lee, J.S.; Kim, K.H. Evaluation of structural performance for prestressed concrete hollow core slabs. J. Korea Concr. Inst. 2019, 31, 505–512. (In Korean) [Google Scholar] [CrossRef]
- Jang, H.J.; Ryu, J.H.; Kim, S.M.; Ju, Y.K.; Kim, S.D. An evaluation on the flexural capacity of void slabs with prestressed half PC. J. Archit. Inst. Korea 2012, 28, 11–18. (In Korean) [Google Scholar]
- Lee, Y.J.; Kim, H.K.; Kim, M.J.; Kim, D.H.; Kim, K.H. Shear Performance for Prestressed Concrete Hollow Core Slabs. Appl. Sci. 2020, 10, 1636. [Google Scholar] [CrossRef]
- Khalil, A.A.; El Shafiey, T.F.; Mahmoud, M.H.; Baraghith, A.T.; Etman, A.E. Shear Behavior of Innovated Composite Hollow Core Slabs. In Proceedings of the International Conference on Advanced in Structural and Geotechnical Engineering (ICASGE), Hurghada, Egypt, 25–28 March 2019; pp. 1–12. [Google Scholar]
- Araujo CA, M.; Loriggio, D.D.; Da Camara, J.M.M.N. Anchorage Failure and Shear Design of Hollow-core Slabs. Struct. Concr. 2011, 12, 109–119. [Google Scholar] [CrossRef]
- ACI Committee 318. Building Code Requirements for Structural Concrete (ACI 318-19) and Commentary (ACI 318R-19); American Concrete Institute (ACI): Farmington Hills, MI, USA, 2019; 623p. [Google Scholar]
- KDS 14 20 22; MOLIT Shear and Torsion Design Code for Concrete Structures. Ministry of Land, Infrastructure and Transport, MOLIT: Sejong, Republic of Korea, 2021. (In Korean)
- Precast/Prestressed Concrete Institute. PCI Manual for the Design of Hollow Core Slabs; PCI Hollow Core Slab Producers Committee: Chicago, IL, USA, 2017. [Google Scholar]
- Hawkins, N.M.; Ghosh, S.K. Shear strength of hollow-core slabs. PCI J. 2006, 51, 110–114. [Google Scholar]
- ISO 1920-3; Testing of Concrete-Part 3: Making and Curing Test Specimens. International Organization for Standardization: Geneva, Switzerland, 2019.
- ISO 1920-4; Testing of Concrete-Part 4: Strength of Hardened Concrete. International Organization for Standardization: Geneva, Switzerland, 2020.
- Kim, D.H.; Kim, M.J.; Jo, M.S.; Kim, H.G.; Yoon, Y.J.; Kim, K.H. Evaluation of Flexural Behavior of Prestressed Concrete (PSC) Hollow-Core Slabs (HCSs). Buildings 2023, 13, 2869. [Google Scholar] [CrossRef]
- Palmer, K.D.; Schultz, A.E. Experimental investigation of the web-shear strength of deep hollow-core units. PCI J. 2011, 56, 83–104. [Google Scholar] [CrossRef]
- TNO Building and Constructions Research. TNO Report: Standard Shear Tests on Prestressed Hollow Core Slabs According to EN 1168; TNO Building and Constructions Research: Hague, The Netherlands, 2005. [Google Scholar]
- Celal, M.S. Shear Behavior of Precast/Prestressed Hollow-Core Slabs. Master’s Thesis, University of Manitoba, Winnipeg, MB, Canada, 2011. [Google Scholar]
- Park, M.K.; Lee, D.H.; Han, S.J.; Kim, K.S. Web-shear capacity of thick precast prestressed hollow-core slab units produced by extrusion method. Int. J. Concr. Struct. Mater. 2019, 13, 19–32. [Google Scholar] [CrossRef]


| Hollow Core Slab (N/mm)2 | Topping Concrete (N/mm)2 | Note | ||||
|---|---|---|---|---|---|---|
| Design | Test | Ave | Design | Test | Ave | |
| 49 | 60.21 | 61.57 | 27.0 | 30.20 | 30.51 | Cylinder (φ100 × 200) |
| 60.56 | 30.10 | |||||
| 63.96 | 31.24 | |||||
| Specimens | f’c (MPa) | Size (mm) | Prestressing Strand | a/d (%) | H (mm) | ||||
|---|---|---|---|---|---|---|---|---|---|
| HCS | Topping | h | b | l | Bottom | Top | |||
| SN-1 | 57.6 | - | 350 | 1200 | 6000 | 10ϕ12.7 | 2ϕ9.5 | 3.5 | 350 |
| SN-2 | |||||||||
| NCS-1 | 30.5 | 470 | 2.5 | 470 | |||||
| RCS-1 | |||||||||
| RCS-2 | |||||||||
| RCS-3 | |||||||||
| Specimens | Experimental Results | Analytical Results | Exp./Ana. | |||||
|---|---|---|---|---|---|---|---|---|
| VCr (kN) | δCr (mm) | VPeak (kN) | δPeak (mm) | VCr (kN) | VPeak (kN) | VCr | VPeak | |
| SN-1 | 177.0 | 11.4 | 322.7 | 120.0 | 181.3 | 317.4 | 0.98 | 1.02 |
| SN-2 | 176.3 | 10.4 | 318.5 | 101.5 | 0.97 | 1.00 | ||
| NCS-1 | 184.4 | 10.8 | 330.2 | 100.7 | 277.9 | 426.0 | 1.02 | 1.04 |
| RCS-1 | 216.9 | 7.1 | 451.4 | 80.1 | 0.78 | 1.06 | ||
| RCS-2 | 241.4 | 7.0 | 453.8 | 75.1 | 0.87 | 1.07 | ||
| RCS-3 | 229.7 | 7.0 | 449.8 | 78.4 | 0.83 | 1.06 | ||
| Researchers | f’c (MPa) | h (mm) | bw (mm) | d p (mm) | Ag (cm)2 | Aps (mm)2 | a/d | fpc (MPa) | Vtest (kN) |
|---|---|---|---|---|---|---|---|---|---|
| Bertagnoli and Mancini [2] (14 specimens) | 55.0 ~65.7 | 163.0 ~421.5 | 335.0 ~444.0 | 133.0 ~378.5 | 1120.0 ~2380.0 | 278.8 ~1435.0 | 2.8 ~4.5 | 2.3 ~6.8 | 97.0 ~478.0 |
| Walraven and Mercx [4] (19 specimens) | 64.0 | 255.0 ~300.0 | 250.0 ~294.0 | 225.0 ~265.0 | 1710.0 ~1990.0 | 470.0 ~940.0 | 1.7 ~6.7 | 2.5 ~5.9 | 181.6 ~286.3 |
| Pajari [7] (50 specimens) | 38.1 ~63.7 | 200.0 ~500.0 | 215.0 ~335.0 | 160.0 ~453.0 | 1190.0 ~3000.0 | 372.0 ~1953.0 | 2.7 ~5.7 | 1.8 ~7.0 | 80.4 ~528.0 |
| Lee et al. [16] | 48.2 ~28.7 | 265.0 ~400.0 | 252.0 ~275.0 | 158.0 ~214.0 | 1625 ~2055 | 162.5 ~216.3 | 1.5 ~2.6 | 4.0 ~5.5 | 295.1 ~815.5 |
| Palmer and Schultz [25] (24 specimens) | 53.9 ~68.7 | 304.8 ~508.0 | 299.5 ~438.9 | 256.5 ~448.8 | - | 954.8 ~1587.1 | 2.5 ~4.0 | 1.0 ~5.5 | 221.2 ~609.7 |
| TNO [26] (39 specimens) | 55.9 ~113.9 | 255.0 ~400.0 | 241.0 ~449.0 | 202.0 ~350.0 | 1720.0 ~2610.0 | 853.7 ~1684.4 | 2.9 ~3.2 | 3.6 ~8.8 | 224.0 ~652.0 |
| Celal [27] (8 specimens) | 62.9 ~67.9 | 206.0 ~305.0 | 229.0 ~313.0 | 158.0 ~255.0 | 1501.4 ~2069.9 | 502.5 ~888.3 | 3.0 ~3.8 | 3.6 ~5.0 | 163.0 ~297.0 |
| Park et al. [28] (10 specimens) | 60.5 | 200.0 ~500.0 | 242.0 ~300.0 | 168.0 ~452.0 | 1215.9 ~2554.1 | 504.8 ~899.6 | 2.5 ~3.1 | 4.0 ~5.1 | 81.9 ~454.4 |
Disclaimer/Publisher’s Note: The statements, opinions and data contained in all publications are solely those of the individual author(s) and contributor(s) and not of MDPI and/or the editor(s). MDPI and/or the editor(s) disclaim responsibility for any injury to people or property resulting from any ideas, methods, instructions or products referred to in the content. |
© 2024 by the authors. Licensee MDPI, Basel, Switzerland. This article is an open access article distributed under the terms and conditions of the Creative Commons Attribution (CC BY) license (https://creativecommons.org/licenses/by/4.0/).
Share and Cite
Kim, D.-H.; Jo, M.-S.; Lim, S.-A.; Kim, H.-G.; Kang, S.-W.; Kim, K.-H. Evaluation of Maximum Shear Strength of Prestressed Concrete (PSC) Hollow Core Slab (HCS). Buildings 2024, 14, 1925. https://doi.org/10.3390/buildings14071925
Kim D-H, Jo M-S, Lim S-A, Kim H-G, Kang S-W, Kim K-H. Evaluation of Maximum Shear Strength of Prestressed Concrete (PSC) Hollow Core Slab (HCS). Buildings. 2024; 14(7):1925. https://doi.org/10.3390/buildings14071925
Chicago/Turabian StyleKim, Dong-Hwan, Min-Su Jo, Su-A. Lim, Hyeong-Gook Kim, Seong-Won Kang, and Kil-Hee Kim. 2024. "Evaluation of Maximum Shear Strength of Prestressed Concrete (PSC) Hollow Core Slab (HCS)" Buildings 14, no. 7: 1925. https://doi.org/10.3390/buildings14071925
APA StyleKim, D.-H., Jo, M.-S., Lim, S.-A., Kim, H.-G., Kang, S.-W., & Kim, K.-H. (2024). Evaluation of Maximum Shear Strength of Prestressed Concrete (PSC) Hollow Core Slab (HCS). Buildings, 14(7), 1925. https://doi.org/10.3390/buildings14071925