Abstract
The construction supply chain confronts interruption risks that raise significant concerns regarding industry safety and stability. Consequently, exploring risk management strategies from both enterprise and supply chain network perspectives is crucial. This study employs complex network theory and the cascade failure model to propose a methodology tailored to the unique characteristics of the construction supply chain, facilitating the identification of key risk nodes and the conduct of invulnerability analyses. By evaluating the importance of construction enterprise nodes and their risk propagation ability during cascade failures, this method enables the comprehensive identification of key risk node enterprises within the construction supply chain network. Furthermore, this study examines and discusses strategies for enhancing network invulnerability by taking into account node capacity, load, and resilience. Empirical results indicate that the key nodes and risk nodes in the construction supply chain network are mainly located upstream and downstream, displaying specific distribution patterns. In addition to core enterprises, key risk nodes comprise some strong suppliers at the intermediary and lower tiers of the supply chain. Adjustments to node enterprise parameters like capacity, load, and resilience have diverse impacts on the invulnerability of the construction supply chain network. This study clarifies the distribution patterns of key risk nodes within the construction supply chain network and the variations in network invulnerability under particular conditions, providing valuable insights for risk management decision-making.
1. Introduction
As the construction industry evolves, a complex supply chain network has emerged, with the general contractor positioned at its core. This network encompasses various entities, such as material suppliers, engineering subcontractors, labor subcontractors, equipment lessors, design units, owners, and other node enterprises. The construction supply chain manages multiple functions, including raw material procurement, sub-project production, and final product completion and delivery, by controlling information flow, logistics, and capital flow [1]. However, it is important to note that supply chain disruptions have become increasingly common in recent years, significantly impacting the global economy. Events like the 2020 COVID-19 outbreak, the 2021 Suez Canal blockage, the 2022 Russian–Ukrainian conflict, and other major incidents have posed unprecedented challenges to the global supply chain network, potentially leading to a broken chain [2]. Various industries, including food, energy, industrial manufacturing, and construction, are vulnerable to such disruptions. The adverse effects on the construction industry supply chain are particularly pronounced and concerning. For instance, in 2020, the COVID-19 epidemic caused significant disruptions in transportation and logistics, prompting some countries and regions to impose restrictions on product imports and exports, affecting numerous building materials and construction firms. Consequently, construction activities and production were halted. In 2021, the Suez Canal blockage resulting from the grounding of the Ever-Given ship led to a spike in the market price of aluminum metal, subsequently increasing the costs of aluminum alloy plates, window frames, protective railings, and other products in the international building materials market. This disruption in the supply and demand of aluminum products within the construction industry supply chain had severe repercussions. The supply–demand imbalance for aluminum products in the construction sector created several challenges in the supply chain. In 2022, media reports indicated that the Russian–Ukrainian conflict and other factors caused price surges in concrete, steel, and other raw materials. Economic sanctions hindered the normal delivery of construction materials, leading to a disruption in capital flow and the closure of nearly 10,000 construction companies in Turkey. Given the construction industry’s crucial role in the global economy, it is imperative to enhance the security level of the construction supply chain [3]. This study examines the contradictions arising from the uncertainty in both the internal and external environments of the construction industry and the complexity and vulnerability of the construction supply chain. It initiates the discussion by presenting two perspectives: the node and the chain. This study addresses two primary scientific concerns: the identification of key risk nodes and the analysis of the invulnerability of the construction supply chain network. By conducting a systematic analysis and summarization of the distribution characteristics of key risk nodes within the construction supply chain and the evolution of network invulnerability under the influence of various parameters, the aim is to advance the scientific understanding of disruptions in the construction supply chain among node enterprises, industry associations, and other pertinent entities. Moreover, this study can provide valuable insights and assistance for management personnel and decision-makers in construction enterprises to implement preventive measures against supply chain disruptions. Ultimately, this study can contribute to the sustainable, secure, and steady progress of the construction supply chain.
The identification of key nodes and the analysis of network invulnerability are essential elements of complex network research. The effective identification of key risk enterprises within the construction supply chain, particularly in the context of interruption risk, is of great significance. This, in turn, allows for the formulation of network destructive enhancement strategies that can contribute to the safe and stable development of construction supply chain networks [4]. However, at present, construction supply chain risk-related research is primarily focused on risk evaluation, early warning, and influencing factors. Notable studies include those of Koc K., who investigated the supply chain risk in construction projects throughout their life cycle and stakeholders, contributing to the supply chain risk indicator system [5]. Alamdari A.M. addressed the risk characteristics of the green building supply chain and systematically constructed a seven-layer risk factor influence through explanatory structural modeling (ISM) relationship structure [3]. Liu J. highlighted that small and medium-sized enterprises (SMEs) upstream of the construction supply chain exhibit a strong demand for financing and assessed the credit risk in the process of online supply chain financing [6]. Malik A. emphasized that the construction supply chain is particularly vulnerable to pandemics, budget overruns, poorly coordinated information, inadequate management supervision, and decision-making errors by stakeholders [7]. While this kind of research certainly provides a valuable theoretical basis and decision-making reference for construction supply chain risk management, the exploration of key nodes in the construction supply chain and network invulnerability remains an underexplored area [8].
With the ongoing advancement of the economy, the product supply chain has become intricately interconnected and integrated, leading to a progressively complex and networked construction supply chain. The relevance of significant theoretical frameworks, such as complex network theory, has been on the rise. As early as 2000, Dubois A. highlighted the network effect within the construction industry in his research [9]. Subsequently, numerous scholars have conducted studies related to construction supply chain networks. For instance, Oludare S.O. investigated the substantial influence of construction material supply chain networks on project delivery [10]. Dudziak G. examined the application of complex network models in construction and logistics supply chain networks [11]. Haikal M. S. focused on the construction supply chain network and reviewed the advancements in sustainability-related research [12]. The integration of complex network theory into construction supply chain risk management has garnered widespread recognition and support from scholars, enabling a broader exploration from a “network” perspective. However, the existing research on the identification of key risk nodes and network invulnerability analysis has predominantly concentrated on networks such as goods transport, disease transmission, power distribution, and urban transport, rather than specifically on the construction supply chain network. For example, Li X. examined the critical role of key nodes in the stability of global supply chains within maritime corridors [13]. Crescio M. I. identified key nodes in the Italian swine fever contagion network [14]. Zhang W. emphasized the significant impact of key nodes in the electricity distribution network on network security, economy, and structural stability [15]. Wu P. simulated the disruption of transport stations within an urban agglomeration by targeting nodes to evaluate the resilience of transport networks against disruptions [16]. Therefore, to address the existing research gaps in identifying key risk nodes and analyzing network invulnerability in construction supply chain risk management and to effectively tackle the two critical “scientific problems” outlined in the preceding section within the current context, it is imperative to explore the identification of key nodes and methods to enhance the invulnerability of the construction supply chain based on complex network theory. This study aligns with the characteristics and requirements of the supply chain in the contemporary construction industry.
In the context of selecting specific research methods, the current study summarizes the research methods for identifying key nodes and assessing the invulnerability of undirected and unweighted networks similar to the construction supply chain. These methods can be categorized into three main groups based on their characteristics [17]. Firstly, the network characteristic analysis method determines the importance of nodes by assigning and aggregating network centrality indices [9]. Secondly, the system science analysis method involves deleting network nodes to observe changes in network connectivity and assessing the importance of nodes based on the degree of change in network connectivity, which is a common approach in the cascade failure model [2]. Thirdly, the information search analysis method evaluates the importance of nodes based on information flow within the network [6]. Considering the complex structure of the construction supply chain network, involving numerous participating enterprises and unspecified information flow, it is evident that the network characteristic analysis method and the system science analysis method are more suitable for this study, demonstrating stronger applicability. Consequently, this study introduces a method for identifying key risk nodes in the construction supply chain and analyzing their invulnerability. It is based on the characteristics and principles of the aforementioned two applicable methods, in conjunction with the specific characteristics of the example construction supply chain network. To underscore the value and significance of this study, a systematic comparison is conducted with studies related to the topic of this study, focusing on research methodology, content, and object. This comparative analysis highlights the distinctions between this study and similar research endeavors, as presented in Table 1.

Table 1.
Comparative analysis of the related studies.
In conjunction with Table 1 and the preceding assertions, the primary research gaps in construction supply chain risk management are evident in the failure to transition the research focus from “chain” to “network”. In contrast to other fields, there is a deficiency in scientific methods that can identify the key risk nodes and analyze the invulnerability of the network. This makes it difficult for relevant decision-makers to recognize which enterprises are more worthy of attention in the process of risk management in the construction supply chain and which types of strategies are more likely to play an obvious role in improving the overall security and stability of the supply chain network, which is not conducive to taking targeted and efficient risk management measures. To fill the research gap, this study introduces a complex network theory and a cascade failure model simultaneously. It makes corresponding improvements to the research method according to the characteristics of the construction supply chain, such as the selection of node importance, risk propagation, and other indicators, and the setting of rules for the parameters of load, capacity, and resilience of the cascade failure model. Secondly, this study fully considers the close relationship between the risk status of node enterprises and supply chain network invulnerability in the research process and realizes the unification of the methods by setting network invulnerability evaluation indexes based on node risk propagation force indexes. Finally, utilizing the example network, this study systematically analyzes the distribution characteristics of key risk nodes in the construction supply chain network and the fluctuation trend of network invulnerability under the key parameter change. Overall, the necessity and importance of this study are mainly reflected in the following: under the current research status in the same field and the background of industry development, it can comprehensively consider the unique characteristics of the construction supply chain, introduce, improve, and apply the methods of complex network theory and cascade failure model, and systematically come up with a series of important conclusions on the maintenance of a safe and stable development of the construction supply chain network, which can provide scientific and practical solutions for the relevant decision-makers in risk management.
The research idea and work process are depicted in Figure 1. The main tasks include the following: (1) Section 2 focuses on establishing a model to evaluate the importance of nodes in a construction supply chain network from the perspectives of business, resources, and information flow. The TOPSIS method is utilized to comprehensively rank network centrality indexes, identifying hub node enterprises in the static network topology. (2) Section 3 develops a model to evaluate the propagation force of risks in the construction supply chain based on the load–capacity–elasticity cascade failure process, considering the impact of enterprise disruptions from network loss due to intentional attacks. (3) Section 4 outlines the methodology for identifying key nodes and analyzing network invulnerability in construction supply chain networks based on node importance, risk propagation force, network invulnerability indexes, and the cascading failure model. (4) Section 5 uses the construction supply chain network of China Beijing Urban Construction Group as an example to analyze the distribution of key risk nodes and propose strategies to enhance network invulnerability by considering node capacity, load, and resilience. This analysis aims to offer insights for decision-making in construction supply chain security and risk management.
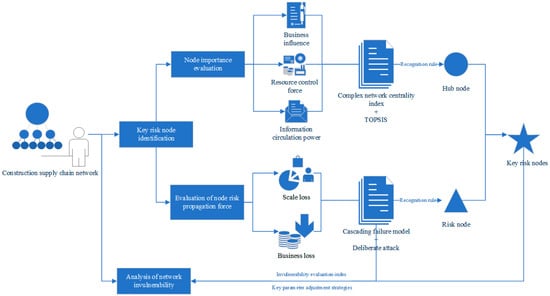
Figure 1.
Main research ideas and work process.
2. Construction Supply Chain Network Node Importance Evaluation
2.1. Construction Supply Chain Network Structure
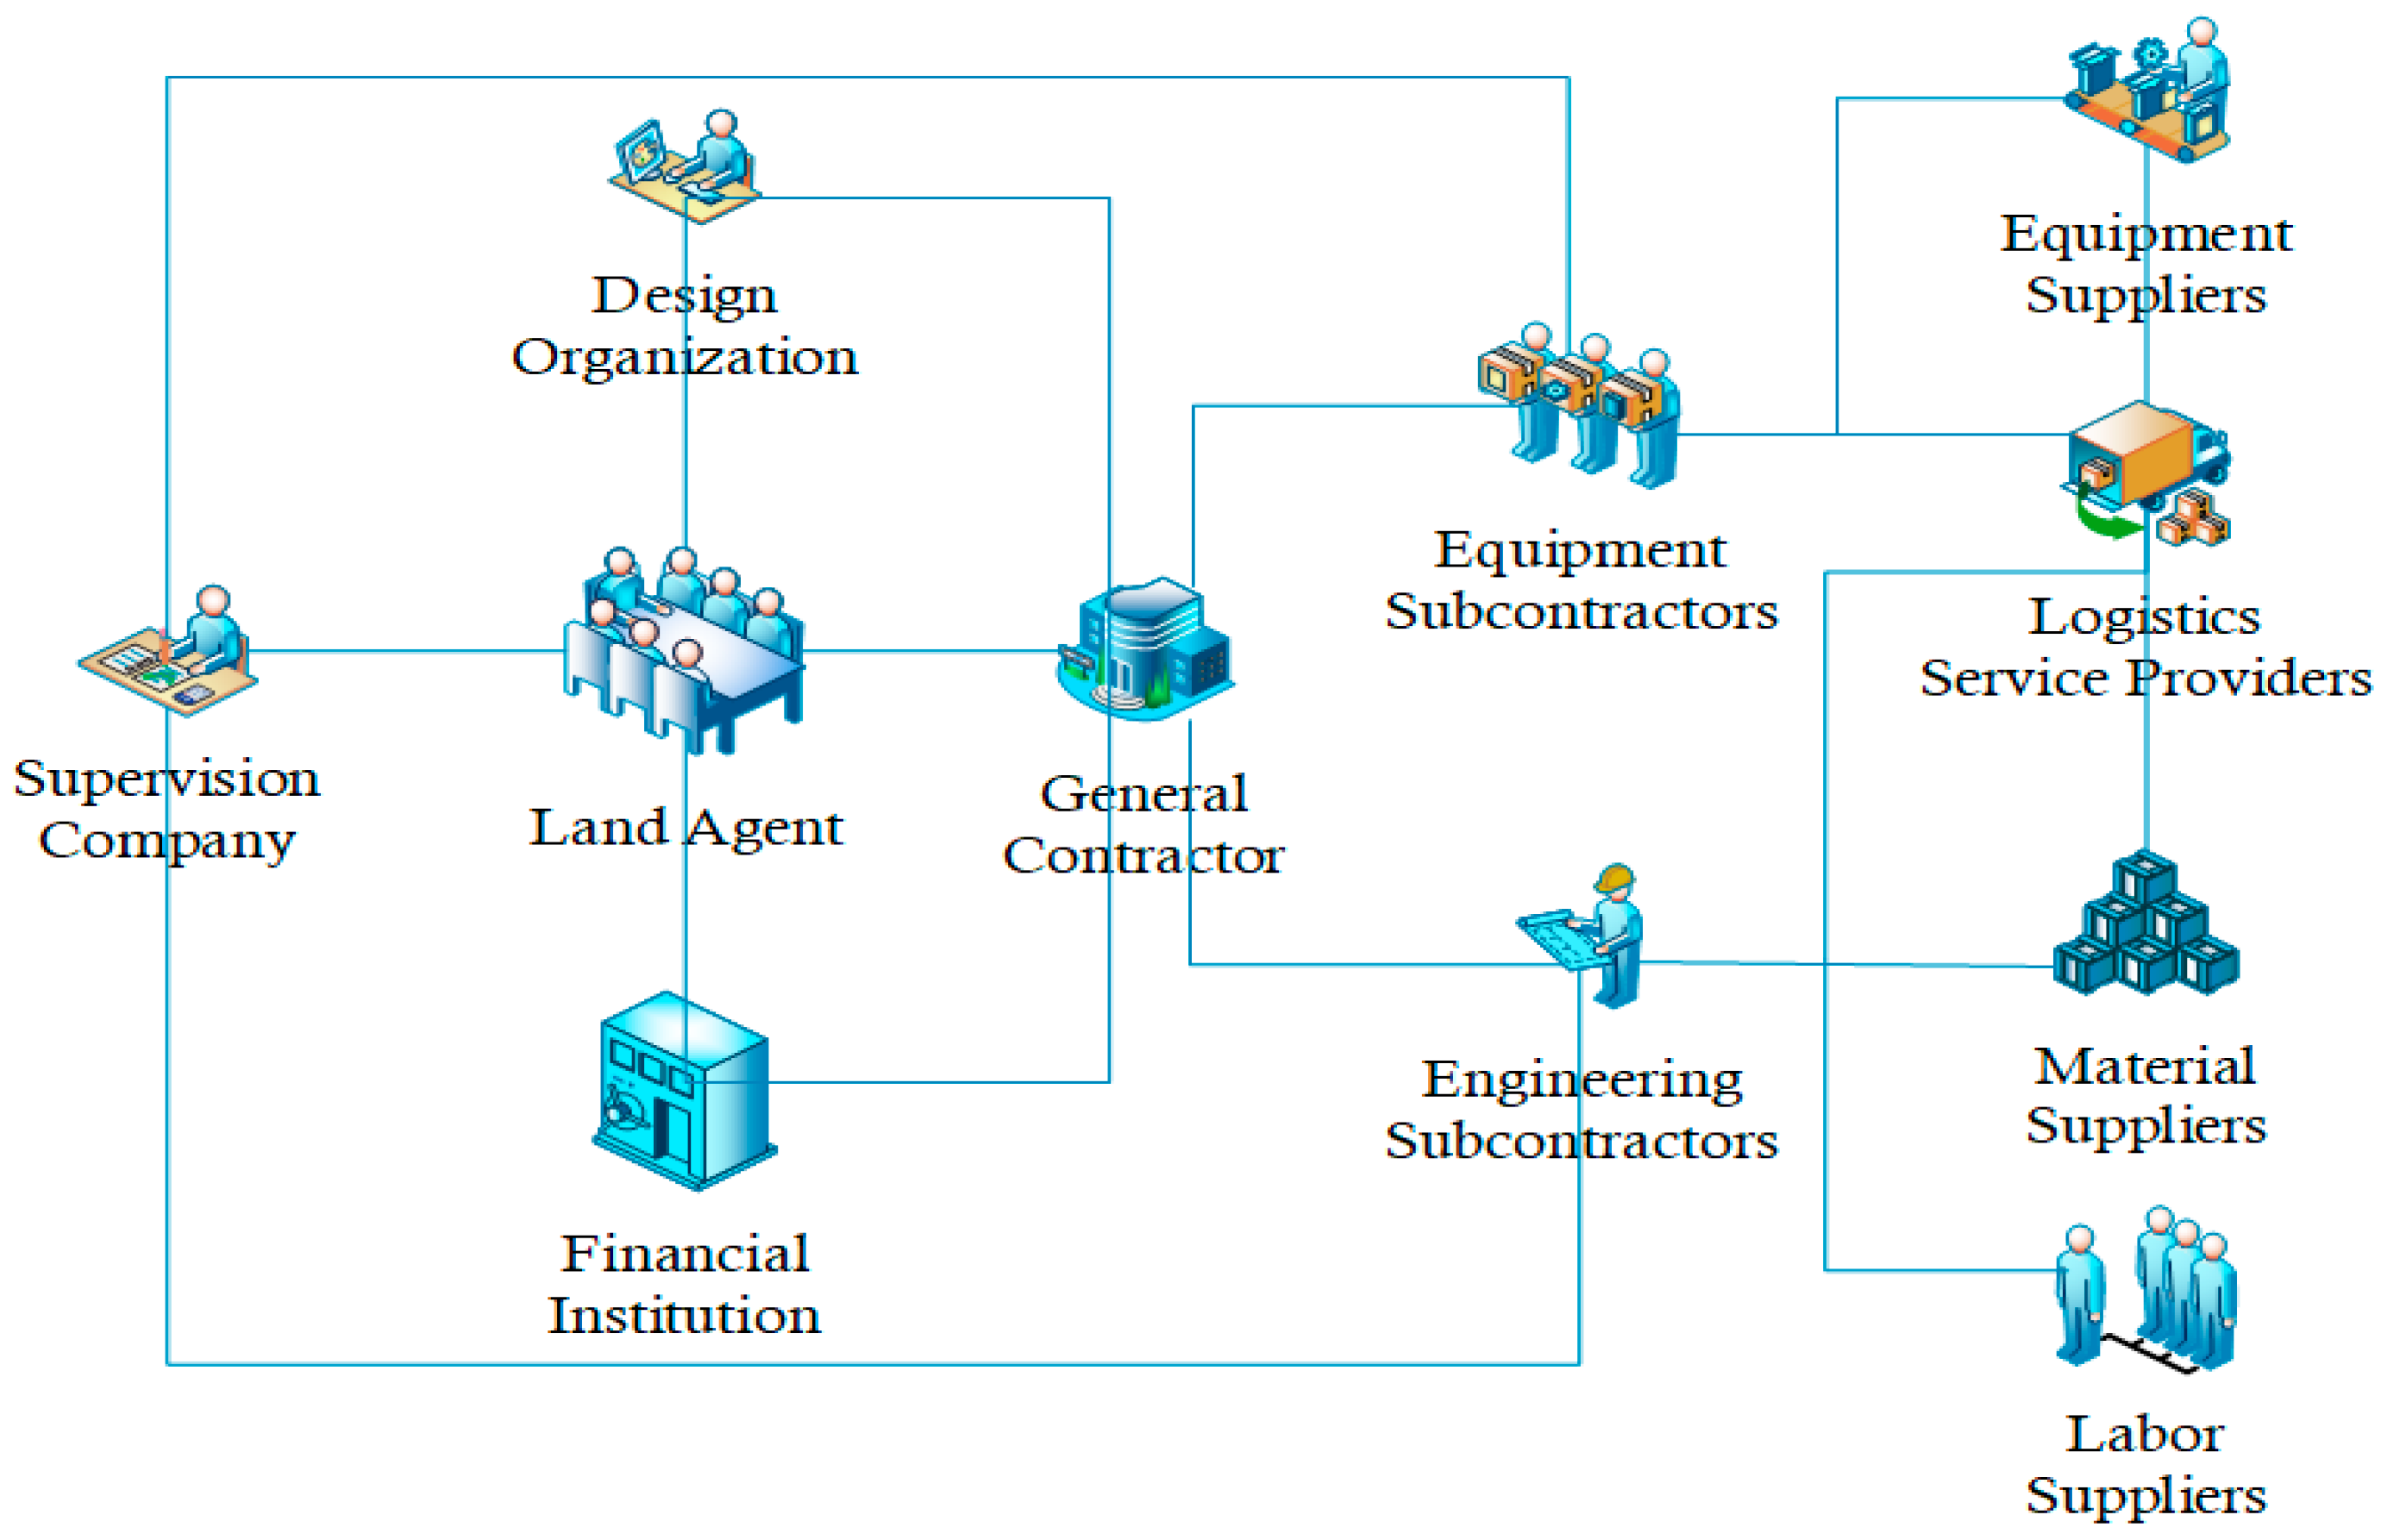
The construction supply chain network encompasses the general contractor as the primary entity, which includes project subcontractors, equipment subcontractors, labor suppliers, material suppliers, equipment suppliers, and other types of node enterprises. These entities are interconnected through inter-enterprise business relationships, managing information flow, logistics, and capital flow control. This network structure supports various stages of the construction process, from project demand assessment to project definition, construction, maintenance, expansion, and demolition. Drawing from relevant research findings [18], the fundamental components of a typical construction supply chain network are illustrated in Figure 2, reflecting the operational processes. In practice, the construction supply chain network comprises diverse node enterprise segments with intricate interconnections to facilitate business operations [18]. From the perspective of graph theory, this study takes the enterprises as the network nodes, the business relationships between enterprises as the edges, and adopts V to denote the set of construction supply chain node enterprises and E to denote the set of business relationships between enterprises in the network. It represents the construction supply chain network as a graph; considering the bidirectional nature of business relationships, all edges in the network are undirected edges. Meanwhile, the adjacency matrix of the construction supply chain network topology containing N firms is denoted by , , where represents that firms i and j have a business relationship and represents that i and j have no business relationship.
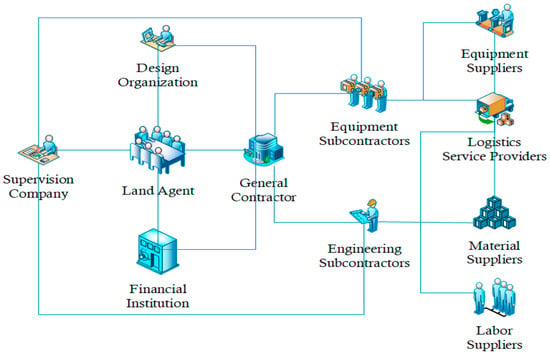
Figure 2.
Schematic diagram of a common construction supply chain network.
2.2. Importance Evaluation of Construction Supply Chain Hub Nodes
The significance of business, resources, information flow, and other elements within the construction supply chain network has long been a focal point for construction enterprise managers. It serves as a crucial guiding factor for enterprise advancement [17]. This study integrates the fundamental definition and computation of various centrality indicators in complex network theory [19]. Specifically, degree centrality, betweenness centrality, and closeness centrality are chosen as assessment metrics to determine the importance of nodes in the construction supply chain network concerning business, resources, and information circulation. This study employs the TOPSIS model to holistically rank the nodes’ importance in the construction supply chain network, following steps 1–4 [20].
Step 1: The centrality index value for each node in the network is calculated according to Table 1. are the centrality index values of node i. As in Table 2, in the table is the degree of the node; is all the shortest paths from node x to node y; is the number of shortest paths from node x to node y through node i; is the number of nodes that can be reached from node i (not counting i); and denotes the sum of the distances from node i to all the reachable nodes.
Table 2.
Definition of central indicators.
Step 2: Calculating the ideal optimal index value and worst indicator values ;
Step 3: Calculating the approximation of the nodes to the optimal and worst indicator values ;
Step 4: Calculating the node posting progress k and normalizing the value of posting progress as node importance K. Subsequently, the nodes are sorted based on the magnitude of their node importance, K. A higher value of K indicates a greater importance of the node within the construction supply chain network.
3. Evaluation of the Risk Propagation Ability of Construction Supply Chain Nodes Based on the Load–Capacity–Resilience Cascade Model
3.1. Node Initial Service Load and Capacity
In previous research, the determination of the node load in the cascade failure model has typically been based on the node degree size. Degree, as a local metric of node importance, is straightforward to compute but may overlook more pertinent information in practical scenarios [19]. The initial operational load of a node enterprise within the construction supply chain network is intricately linked to the enterprise’s business impact, control over resources, information dissemination, and other capabilities [1]. Consequently, this study incorporates a comprehensive evaluation of a node’s importance by considering the degree of K. The method for defining the initial business load L has been enhanced, as illustrated in Equation (7), where β represents a load parameter with β > 0. A value closer to 0 indicates a smaller disparity in initial load among nodes in the supply chain network.
In the context of the construction supply chain network’s operational process, it is common for the enterprise’s business load to be smaller than the maximum business processing capacity. To address this, a capacity parameter α is introduced to adjust the node’s load capacity P, where α > 0. This adjustment ensures that the initial load of a normal node remains below its capacity, as depicted in Equation (8). Notably, the presence of L in Equation (8) causes α to approach 0, indicating a smaller disparity in the enterprise’s load-handling capacity among the construction supply chain nodes.
3.2. Load Redistribution Rules
When a node within a construction supply chain network experiences a failure, the service load originally assigned to the failed node will be redistributed throughout the network. Previous research on cascade failure models has commonly employed the concept of “merit allocation” [21]. This principle suggests that the redistributed load should be primarily assigned to the node connected to the failed node with a higher load capacity. In the context of a construction supply chain network, if the failure of a node enterprise triggers a cascade failure, its load will be preferentially reassigned to the node enterprise that maintains a robust business relationship with it. The strength of this business relationship is contingent upon the load-handling capacity of the enterprise, as enterprises tend to partner with those possessing superior load-handling capabilities. Consequently, the principle of “merit allocation” governs the redistribution of loads within the construction supply chain network. In the subsequent discussion, the node load capacity P is utilized to denote the business load processing capacity of an enterprise, as shown in Equation (9). When node j fails, the neighboring node i will receive an additional load () based on its load capacity during the load redistribution process, where del represents the set of neighboring nodes of the failed node.
3.3. Node Load State and Resilience
In the construction supply chain network, when an enterprise’s business load exceeds its business capacity significantly, it indicates a demand risk, making it challenging to meet downstream enterprise demands. Conversely, if an enterprise’s business load is significantly lower than its business capacity, it signifies a supply risk, making it difficult for upstream suppliers to meet the enterprise’s operational demand [21]. Both the demand risk and supply risk of the enterprise can potentially lead to node interruption and network cascade failure. Therefore, the nodes in the construction supply chain network are categorized into overload, underload, and normal states. Overload signifies downstream demand risk, while underload represents upstream supply risk, both of which can result in node interruption failure, triggering the load redistribution process of cascade failure [22]. Furthermore, in the operational process, each node enterprise in the construction supply chain typically implements various remedial measures to mitigate risks when facing or having already encountered them. These measures may include seeking emergency assistance from partners through the exchange of benefits such as order upsells, cooperative commitments, and others [23]. Enterprises adopt risk remediation measures to enhance the enterprise load capacity with a certain degree of elasticity. Therefore, the introduction of the enterprise risk remediation input cost γ (γ > 0) serves as a risk load resilience parameter to identify the enterprise load state Load_S. The identification method is as follows: 1 represents the overloaded state, 0 represents the normal state, and −1 represents the underloaded state.
3.4. Node Risk Propagation Ability Evaluation Indicators
Disruptions of firms within a construction supply chain network can lead to detrimental consequences for the supply chain, affecting its scale and business operations [24]. This section aims to evaluate the risk propagation ability of a node within a supply chain network when facing intentional attacks. Specifically, it quantifies the node’s ability to generate losses within the supply chain network due to disruptions caused by risky shocks. The evaluation includes evaluating the network scale loss and business losses resulting from node disruption failures.
(1) Scale loss: the number of nodes within a complex network serves as a crucial metric indicating the network’s scale. In this context, the disparity in the number of node enterprises present in the construction supply chain network before and after cascade failure is used to signify the scale loss (S) resulting from the disruption and failure of a node enterprise on the overall construction supply chain network. This is illustrated in Equation (11), where n represents the count of nodes within the revised network after the cascade failure.
(2) Business loss: this study examines the construction supply chain as a complex network topology, where the node degree can indicate the business relationships between node enterprises and the total node degrees represent the intensity of business relationships within the network. Therefore, the variance in the total node degrees of the construction supply chain network before and after cascade failure is used to indicate the business loss (U) incurred by the entire network due to the disruption of a node enterprise. The calculation formula is presented in Equation (12).
where is the degree of the node in the new network resulting from the cascading failure process; it determines the node’s importance. Furthermore, the node risk propagation ability (R) is calculated using the weighted sum of S and U, reflecting the impact of node failure on the network, as described in Equation (13). Weights (w1, w2) are assigned based on the criticality of scale and business operations to the resilience of the supply chain.
3.5. Construction Supply Chain Network Invulnerability Evaluation Index
In the realm of complex network studies, network invulnerability typically refers to the capacity of a network to sustain or recover its functionality to an acceptable degree when confronted with random or intentional attacks [25]. This study introduces a metric for the risk propagation force (R) of node firms within the construction supply chain under deliberate attack, focusing on network loss. Network loss measures the impact of disrupting a single node firm on the scale and operations of the entire supply chain. Consequently, a high level of R among nodes suggests a greater destructive potential following node failure. This directly reflects the network’s invulnerability, as it is achieved by minimizing the overall network loss. Thus, a negative correlation between R and network invulnerability is established in this study. Subsequently, network invulnerability (V) is further delineated in terms of network loss, with its calculation detailed in Equation (14).
4. Key Risk Node Identification and Invulnerability Analysis Steps
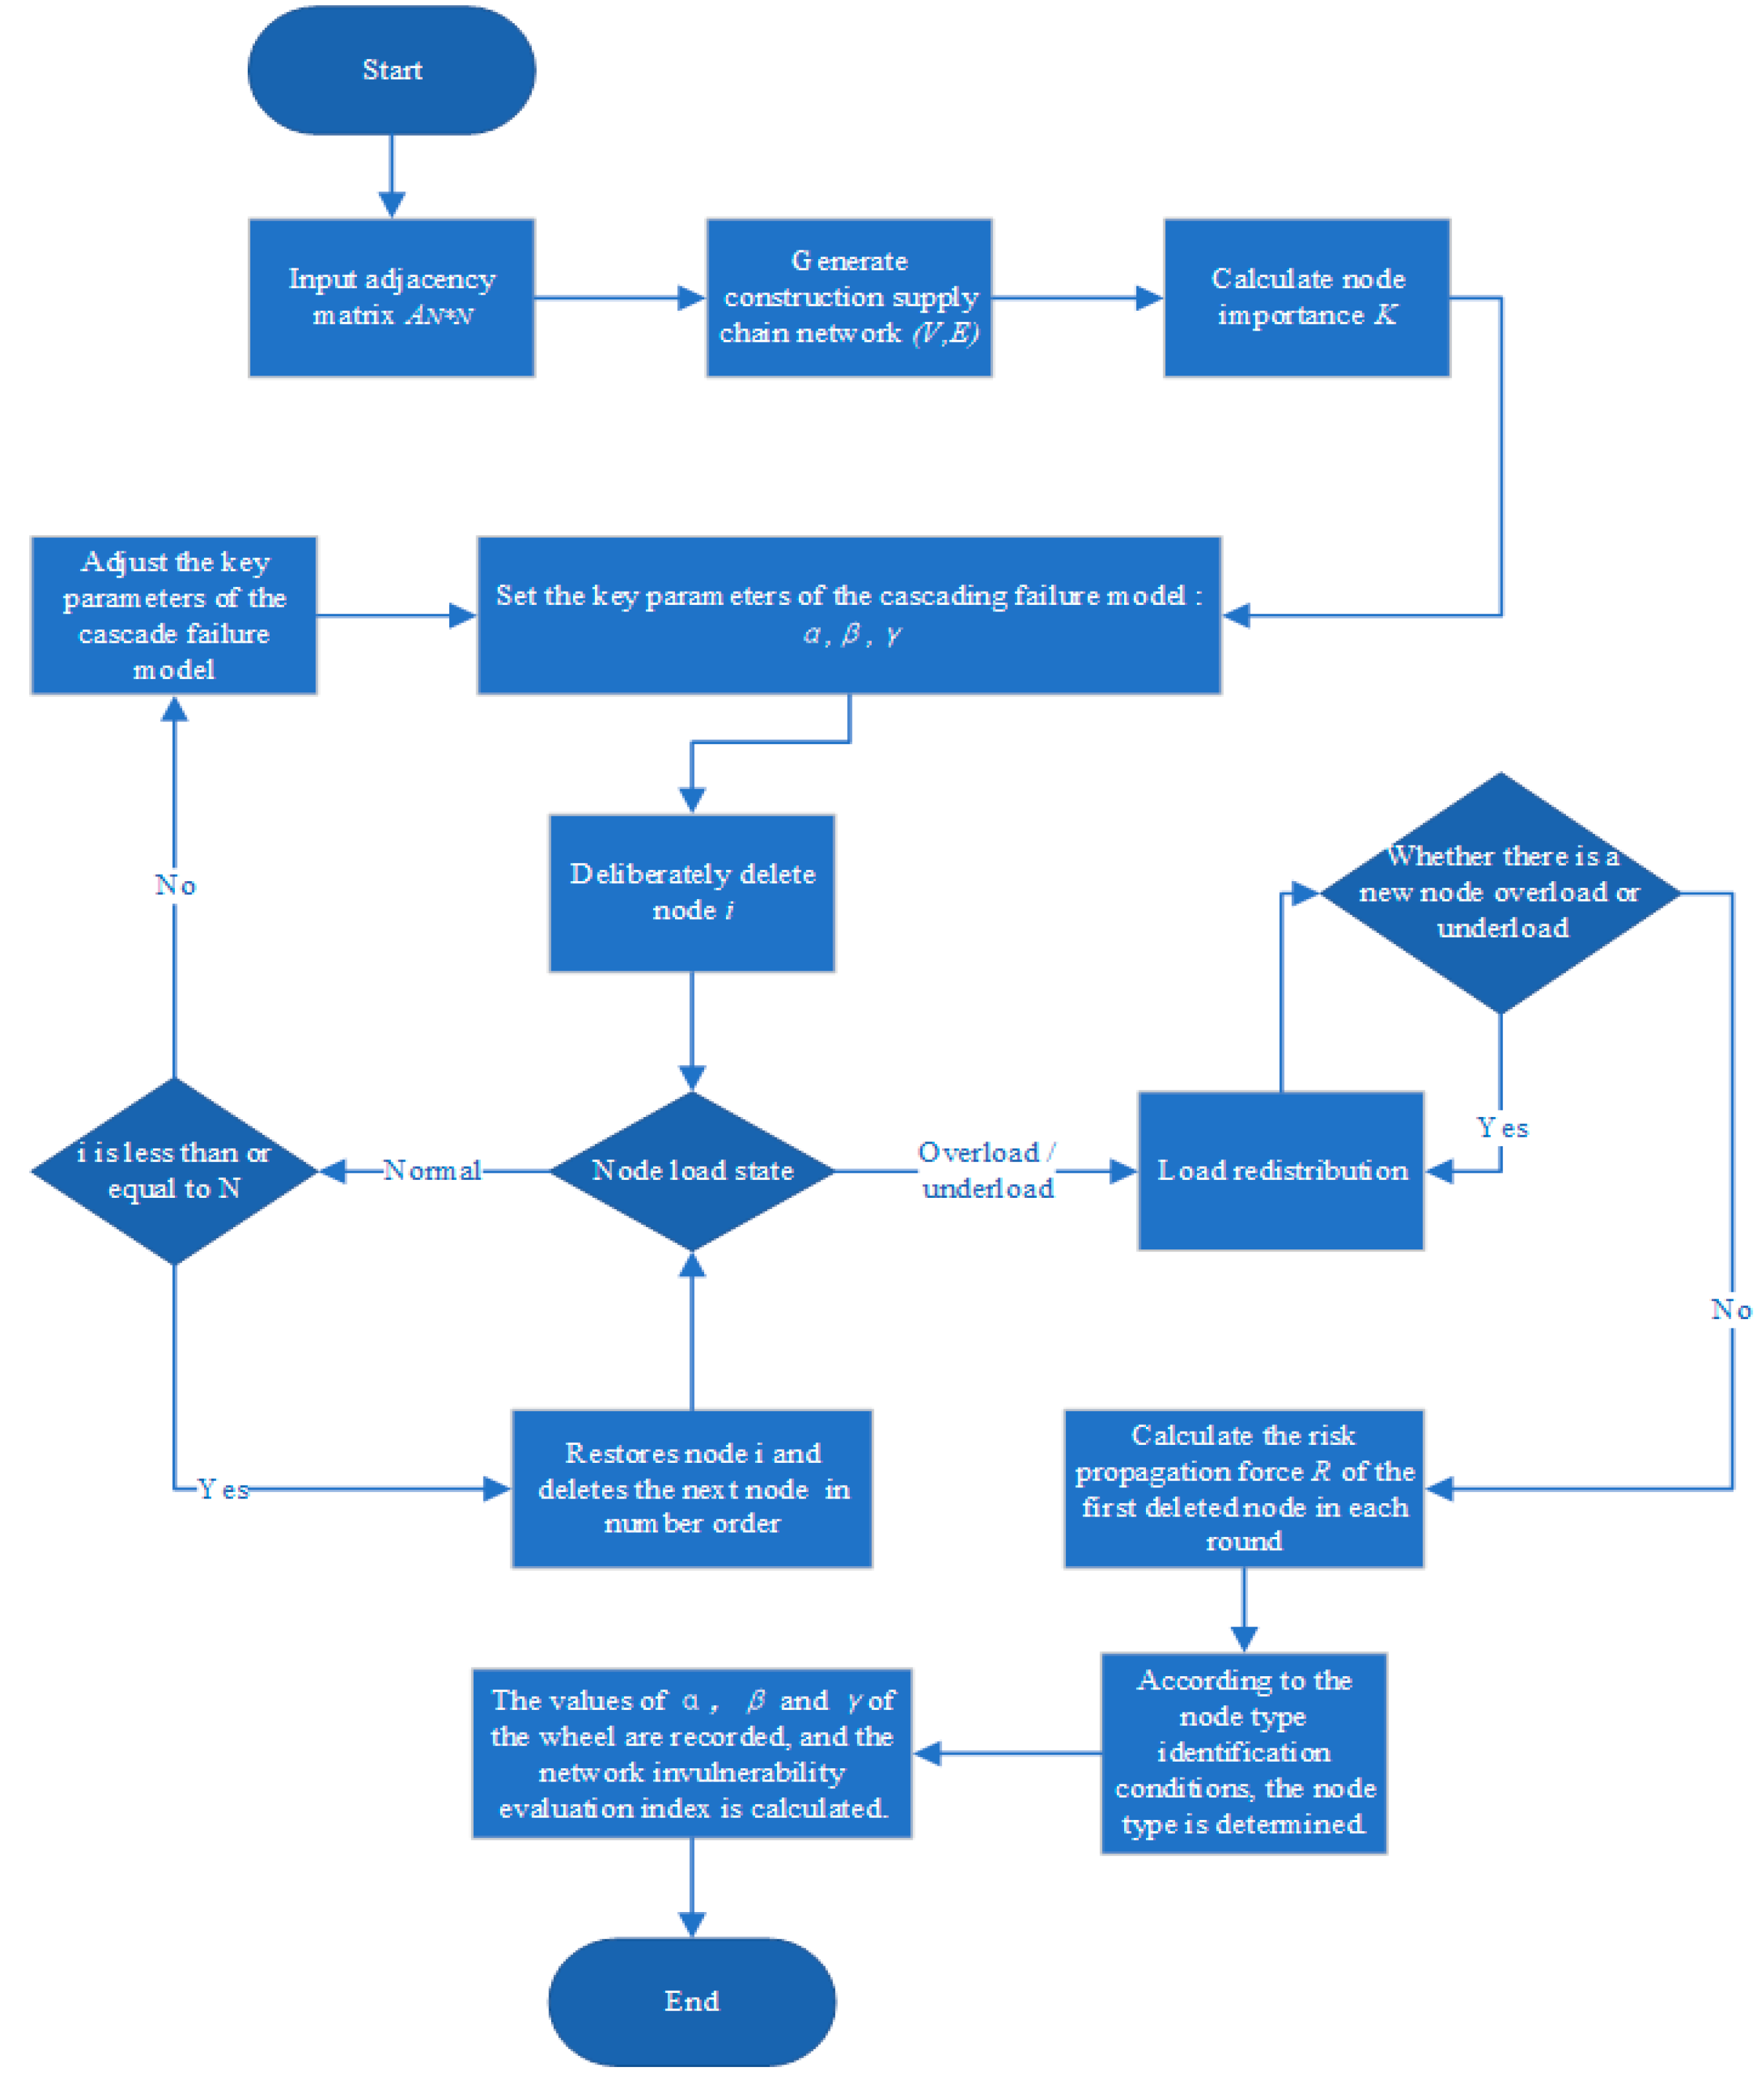
Taking a construction supply chain network with N-node enterprises as an example, this study follows Figure 3 to illustrate the process of identifying key risk nodes and analyzing the invulnerability of the construction supply chain network.

Figure 3.
Flowchart for identification of key risk nodes and invulnerability analysis.
The implementation process of the key risk node identification and network invulnerability analysis method for the construction supply chain, as proposed in this study, involves several steps. Initially, it is essential to create and input the adjacency matrix of the construction supply chain network based on the actual business relationships of the enterprise. This leads to the generation of the construction supply chain network (V, E) comprising nodes and edges and the calculation of node importance K using the complex network centrality indicators (D, B, C) as defined earlier. Subsequently, after determining the importance of each node, the initial service load, node capacity, and other relevant parameters are set based on Equations (7), (8) and (10). Following this, nodes are systematically removed to simulate intentional destruction, triggering the cascading failure process of the network as per Equations (9) and (10). The state of the node is assessed according to Equation (9), and the load of the failed node is redistributed among neighboring nodes using Equation (10). If the neighboring nodes meet the failure criteria post-allocation, the cascading failure process continues until no new failure nodes emerge in the network. Finally, Equations (11) and (12) are utilized to compute the node scale loss, business loss indicators (S, U), and the risk propagation force R for each node. By considering the hub node threshold q and the risk node threshold w, the key risk nodes are identified. Here, q represents the sum of the mean and standard deviation of K, while w denotes the sum of the mean and standard deviation of R. The node type and identification criteria are specified in Table 3.
Table 3.
Node types and identification conditions.
Furthermore, to examine the variability in the resilience of the construction supply chain network under varying values of critical parameters, following the aforementioned procedure, the model parameters such as node capacity (α), node load (β), and node elasticity (γ) are adjusted independently. Subsequently, the aforementioned steps are repeated to calculate and document the invulnerability (V) of the construction supply chain network under different parameter configurations as per Equation (14).
5. Example Analysis of Key Risk Node Identification and Network Invulnerability
5.1. Construction Supply Chain Network Example Presentation
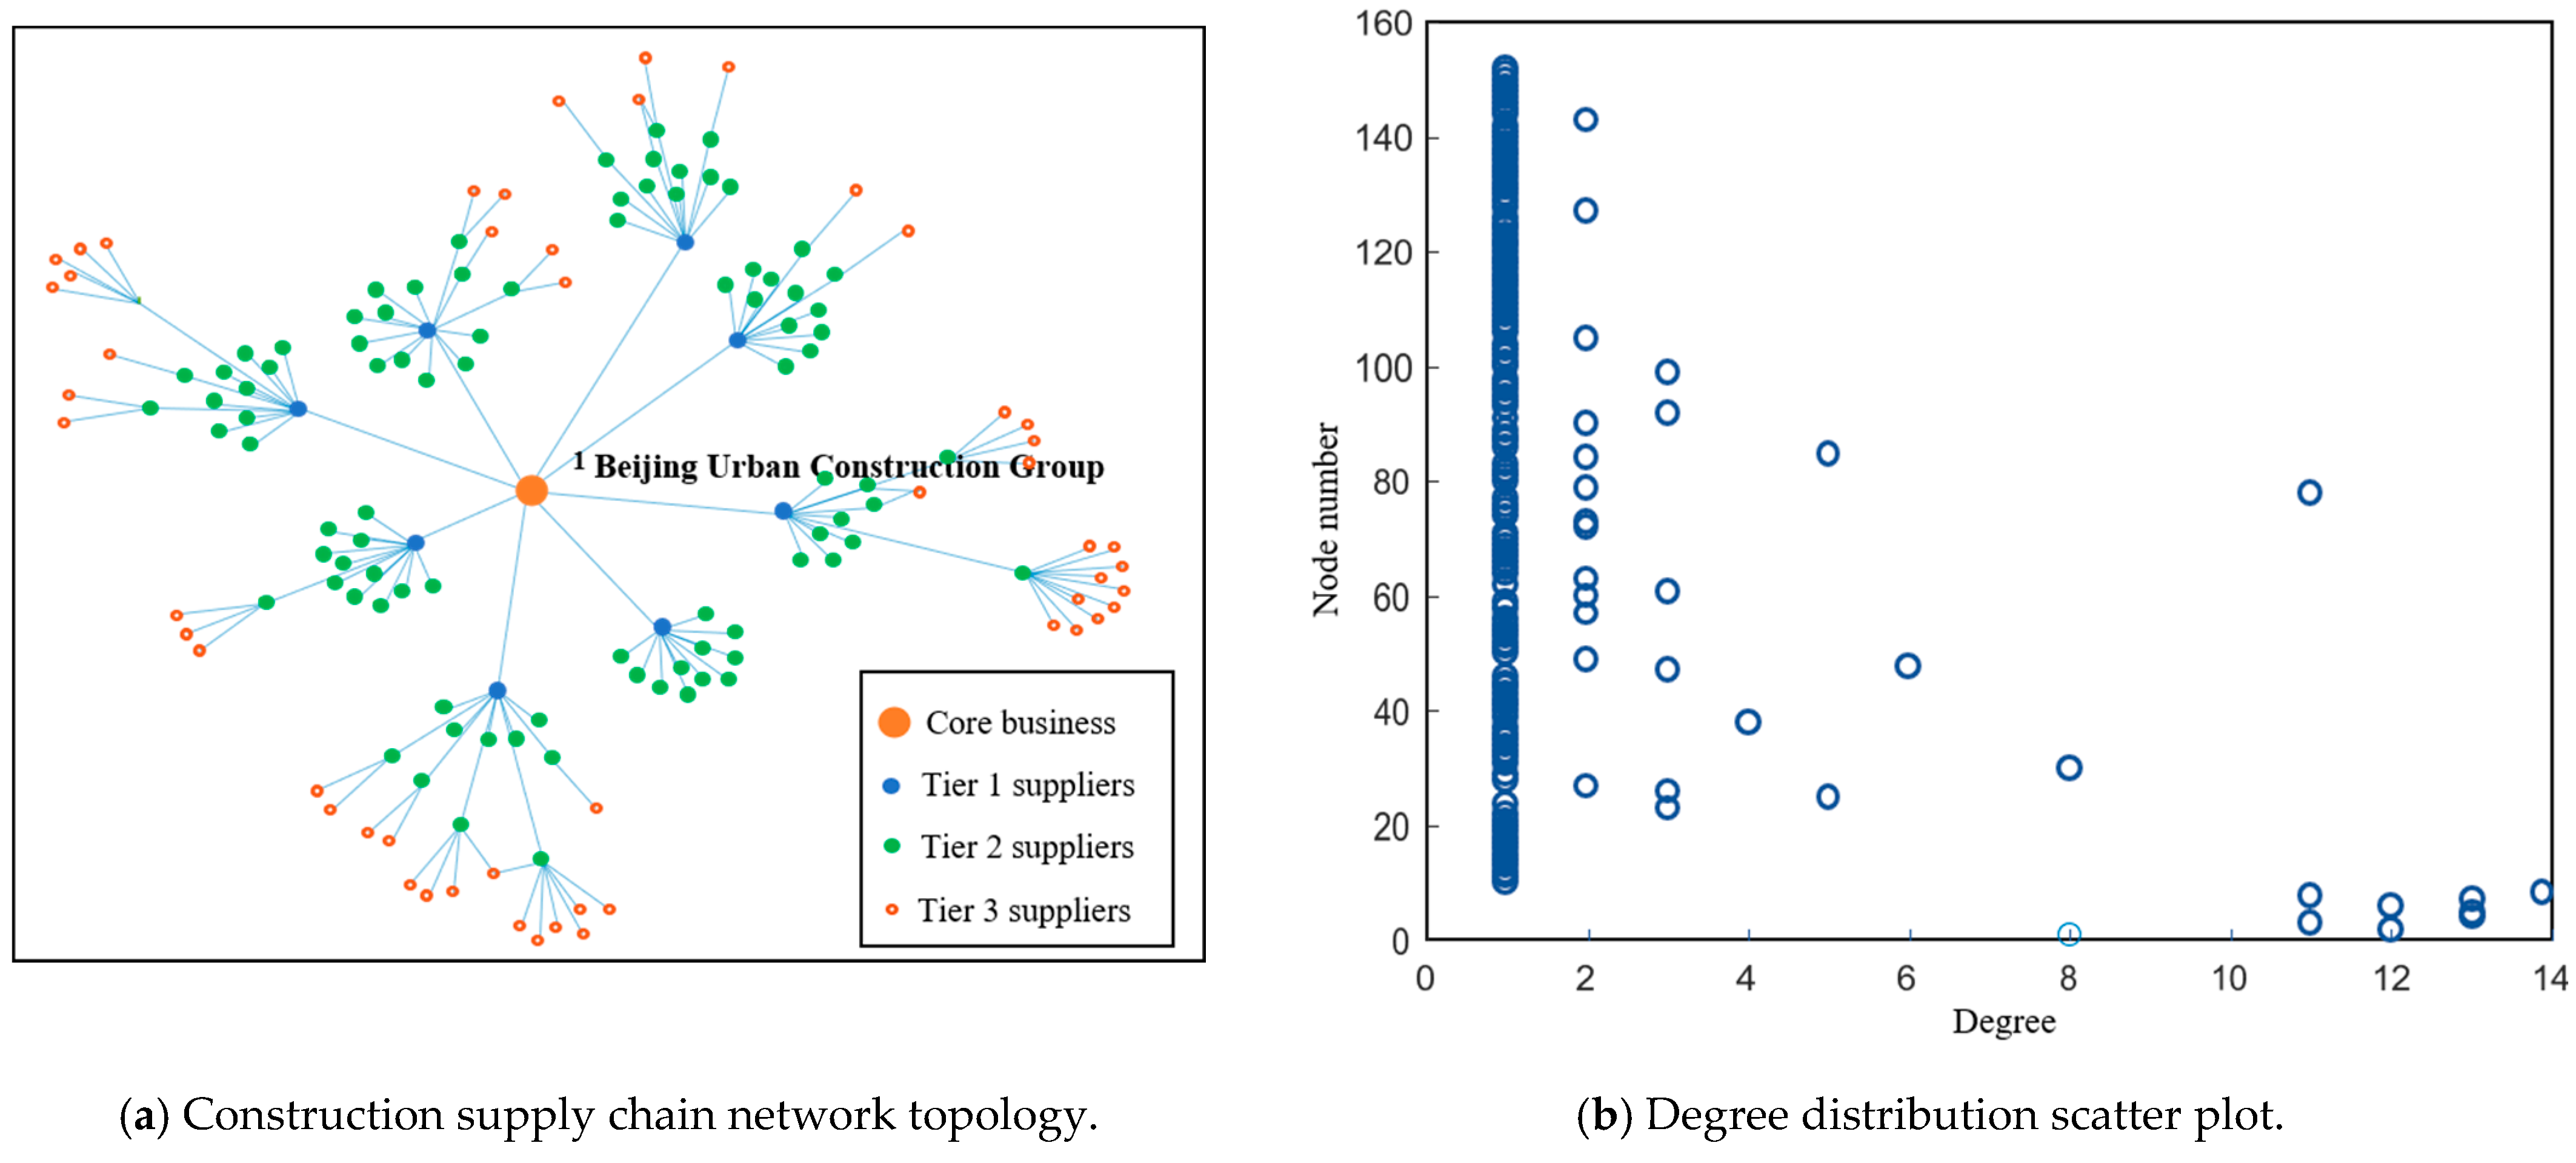
To verify the feasibility and effectiveness of the model, the construction supply chain network of Beijing Urban Construction Group in China is analyzed as an example [25]. Utilizing the QIXINBAO enterprise relationship public data (https://www.qixin.com, accessed on 2 November 2023), a total of 152 enterprises within this construction supply chain are sequentially numbered. Specifically, the enterprises are categorized as follows: node 1 represents Beijing Urban Construction Group, nodes 2–9 represent the first-tier suppliers, nodes 10–100 represent the second-tier suppliers, and nodes 101–152 represent the third-tier suppliers. Subsequently, a four-tier supply chain adjacency matrix is formulated. The network topology diagram and degree distribution scatter plot are generated by inputting the data in MATLAB R2022a. Figure 4 illustrates that the sample supply chain network adheres to the scale-free degree distribution characteristics observed in complex networks [22]. The overall topology indicates a decentralized structure, with the general contractor serving as the core.
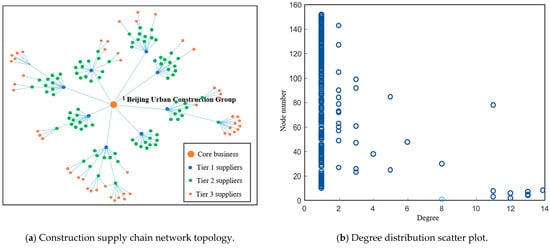
Figure 4.
Example of the construction supply chain of Beijing Urban Construction Group.
5.2. Evaluation and Analysis of Network Node Importance
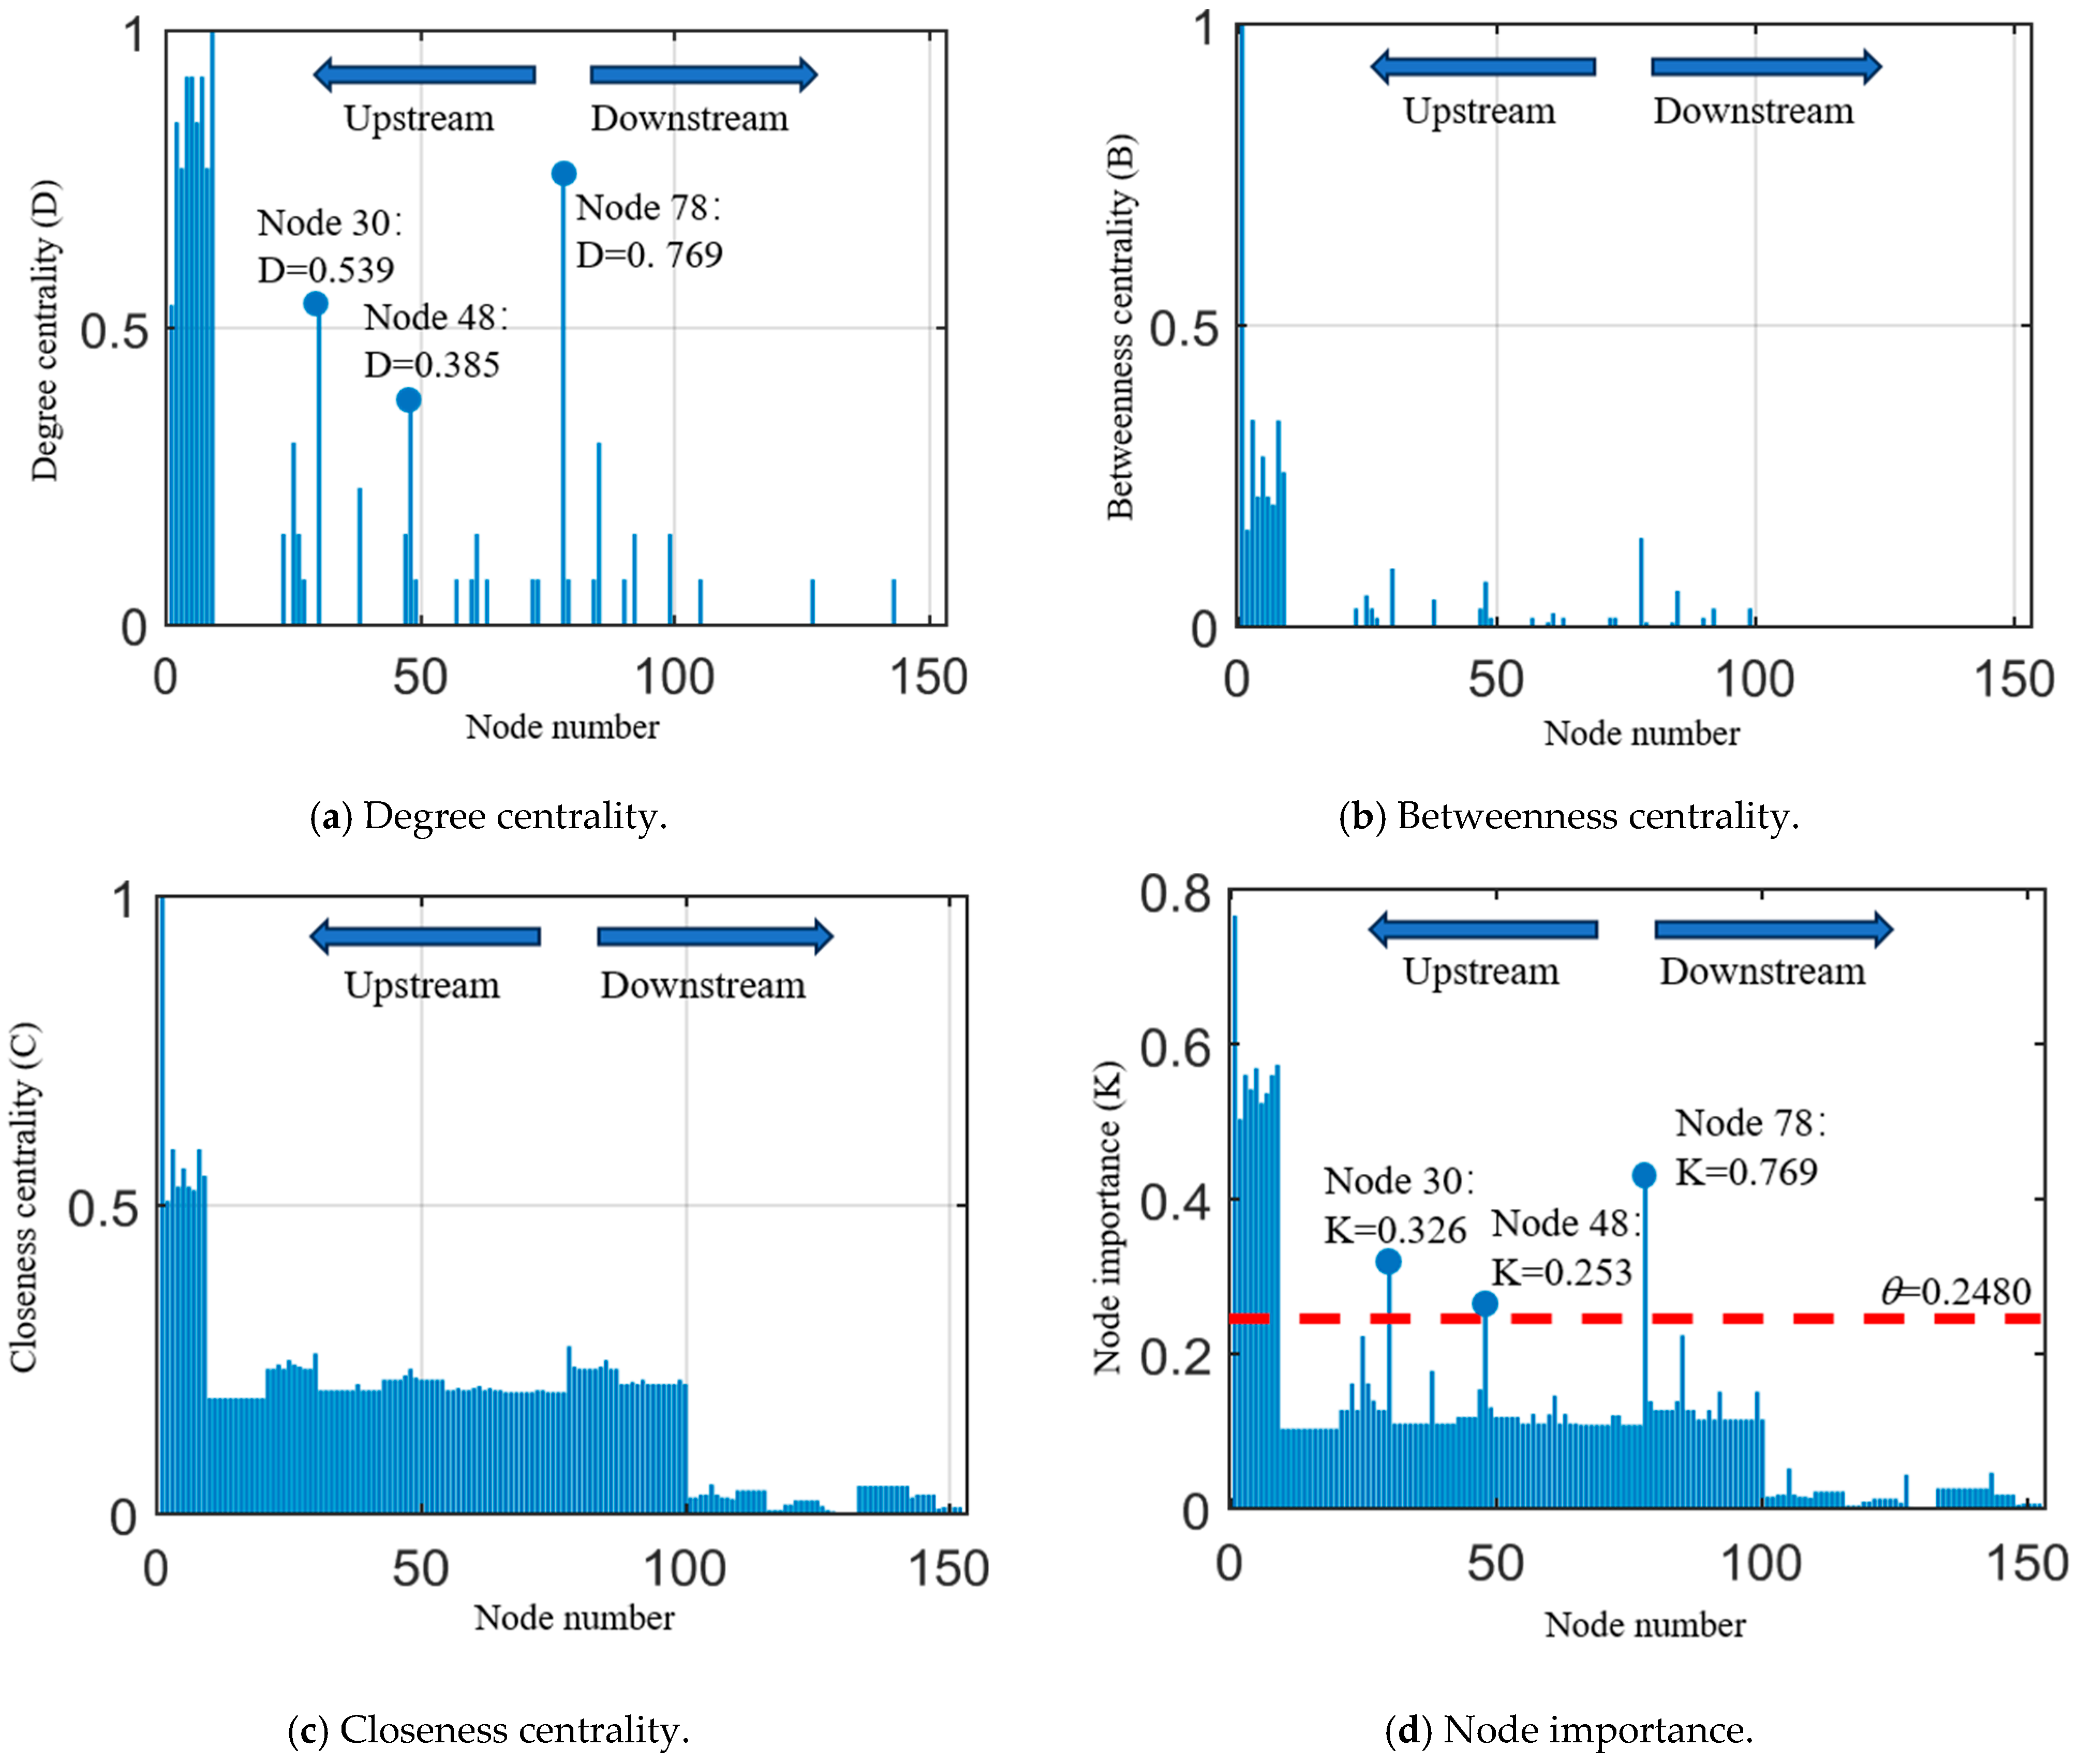
According to the network node importance evaluation method proposed in Section 2.2, degree centrality, betweenness centrality, and closeness centrality are used as metrics for evaluating importance. The scores for various node importance evaluation metrics of the enterprises within the construction supply chain are calculated and presented in Figure 5.
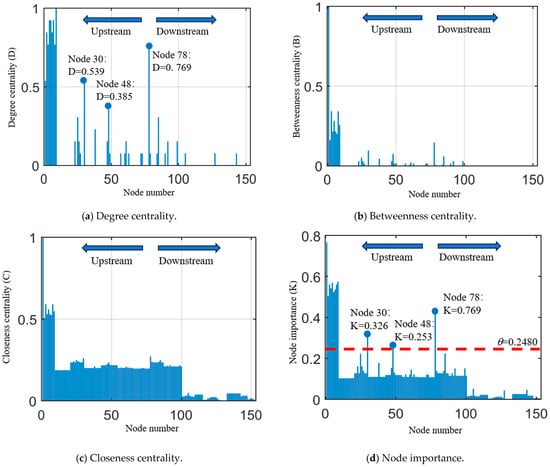
Figure 5.
The score of the network node importance evaluation index.
Upon examining Figure 5, it is evident that within the construction supply chain, the node importance (K) demonstrates a decreasing trend from the upstream (core enterprises) to the downstream (tertiary suppliers). This trend, in conjunction with the centrality index, signifies that in the construction supply chain network, the core enterprise, typically represented by the general contractor, holds a dominant position concerning business, resources, and information. Enterprises that can establish a more direct business relationship with the core enterprise tend to possess stronger comprehensive capabilities and higher levels of importance. The mean value of K is calculated to be 0.1161, with a standard deviation of 0.1319. Consequently, the hub node threshold is determined to be 0.2480. It is observed that the construction supply chain network comprises 12 hub node enterprises, with node importance exceeding this threshold. The hub node primarily consists of the general contractor and its first-tier suppliers, along with some second-tier suppliers exhibiting a high degree of numerical centrality, as detailed in Table 4.
Table 4.
The importance score and hierarchy of hub node enterprises.
5.3. Network Node Risk Propagation Ability Evaluation and Analysis
Based on the load–capacity–resilience cascade model, a series of trial-and-error experiments were conducted to establish an independent and deliberate attack on the nodes in a manner that ensures the representativeness of the simulation results. This attack was executed following the order of node numbering to induce cascade failure through node interruption [2]. Subsequently, the impact on scale loss, business loss, and risk propagation ability of each node post-failure was analyzed. The results are illustrated in Figure 6.
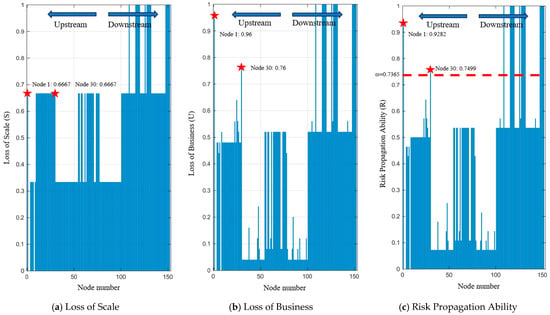
Figure 6.
The score of the risk propagation ability evaluation index of network nodes.
Following the completion of statistical analysis, the mean value of R was determined to be 0.4584, with a standard deviation of 0.2782. Consequently, the threshold for the risk node is calculated as 0.7365, leading to the identification of 19 enterprises exhibiting a higher risk propagation ability. Moreover, based on the earlier assessment of node importance, it was observed that two enterprises are categorized as both hub nodes and risk nodes. As indicated by the nodes marked by red stars in Figure 6, these enterprises are the No. 1 general contractor node (Beijing Urban Construction Group, S = 0.6667, U = 0.96, R = 0.9282) and the No. 30 secondary supplier node (S = 0.6667, U = 0.76, R = 0.7499). Additionally, notable performers in terms of risk propagation ability include 17 tertiary supplier enterprises situated downstream in the construction supply chain (node numbers: 109, 116, 117, 118, 119, 120, 126, 128, 129, 130, 131, 132, 148, 149, 150, 151, 152).
Through the evaluation of risk propagation ability at the network nodes mentioned above, it is evident that within this construction supply chain, certain third-tier supplier enterprises located downstream exhibit notably robust risk propagation capabilities. Additionally, some second-tier suppliers in the midstream display significant variations in their risk propagation capacities, while first-tier supplier enterprises upstream demonstrate an average overall risk propagation ability. Moreover, the primary general contractor node exhibits heightened risk propagation ability. This observation is both highly pragmatic and comprehensible, affirming the validity of the assessment outcomes [26].
(1) The downstream tertiary supplier enterprises in the construction supply chain typically include material suppliers, labor suppliers, and equipment suppliers, among others, who play fundamental roles in the construction process [27]. Consequently, their occasional failures can significantly affect the entire supply chain, with a higher risk propagation ability.
(2) The upstream enterprises within the supply chain, including first-tier suppliers and certain second-tier suppliers, possess significant advantages in terms of business, resources, and information. Consequently, they are frequently capable of resolving risks internally or passing them on to downstream enterprises, thereby limiting their risk propagation potential. Nevertheless, in certain cases, there may exist redundant second-tier suppliers within the supply chain, leading to notable variations in risk propagation abilities among enterprises at the same level [28].
(3) The absolute advantages of core enterprises, represented by general contractors, in business, resources, and information form the foundation of the construction supply chain [29]. It is challenging for midstream and downstream enterprises within the supply chain to withstand the risks and losses resulting from the interruption and failure of core enterprises. As a result, the risk propagation abilities of these core enterprises exceed those of their first-tier and second-tier suppliers.
5.4. Results of Key Risk Node Identification
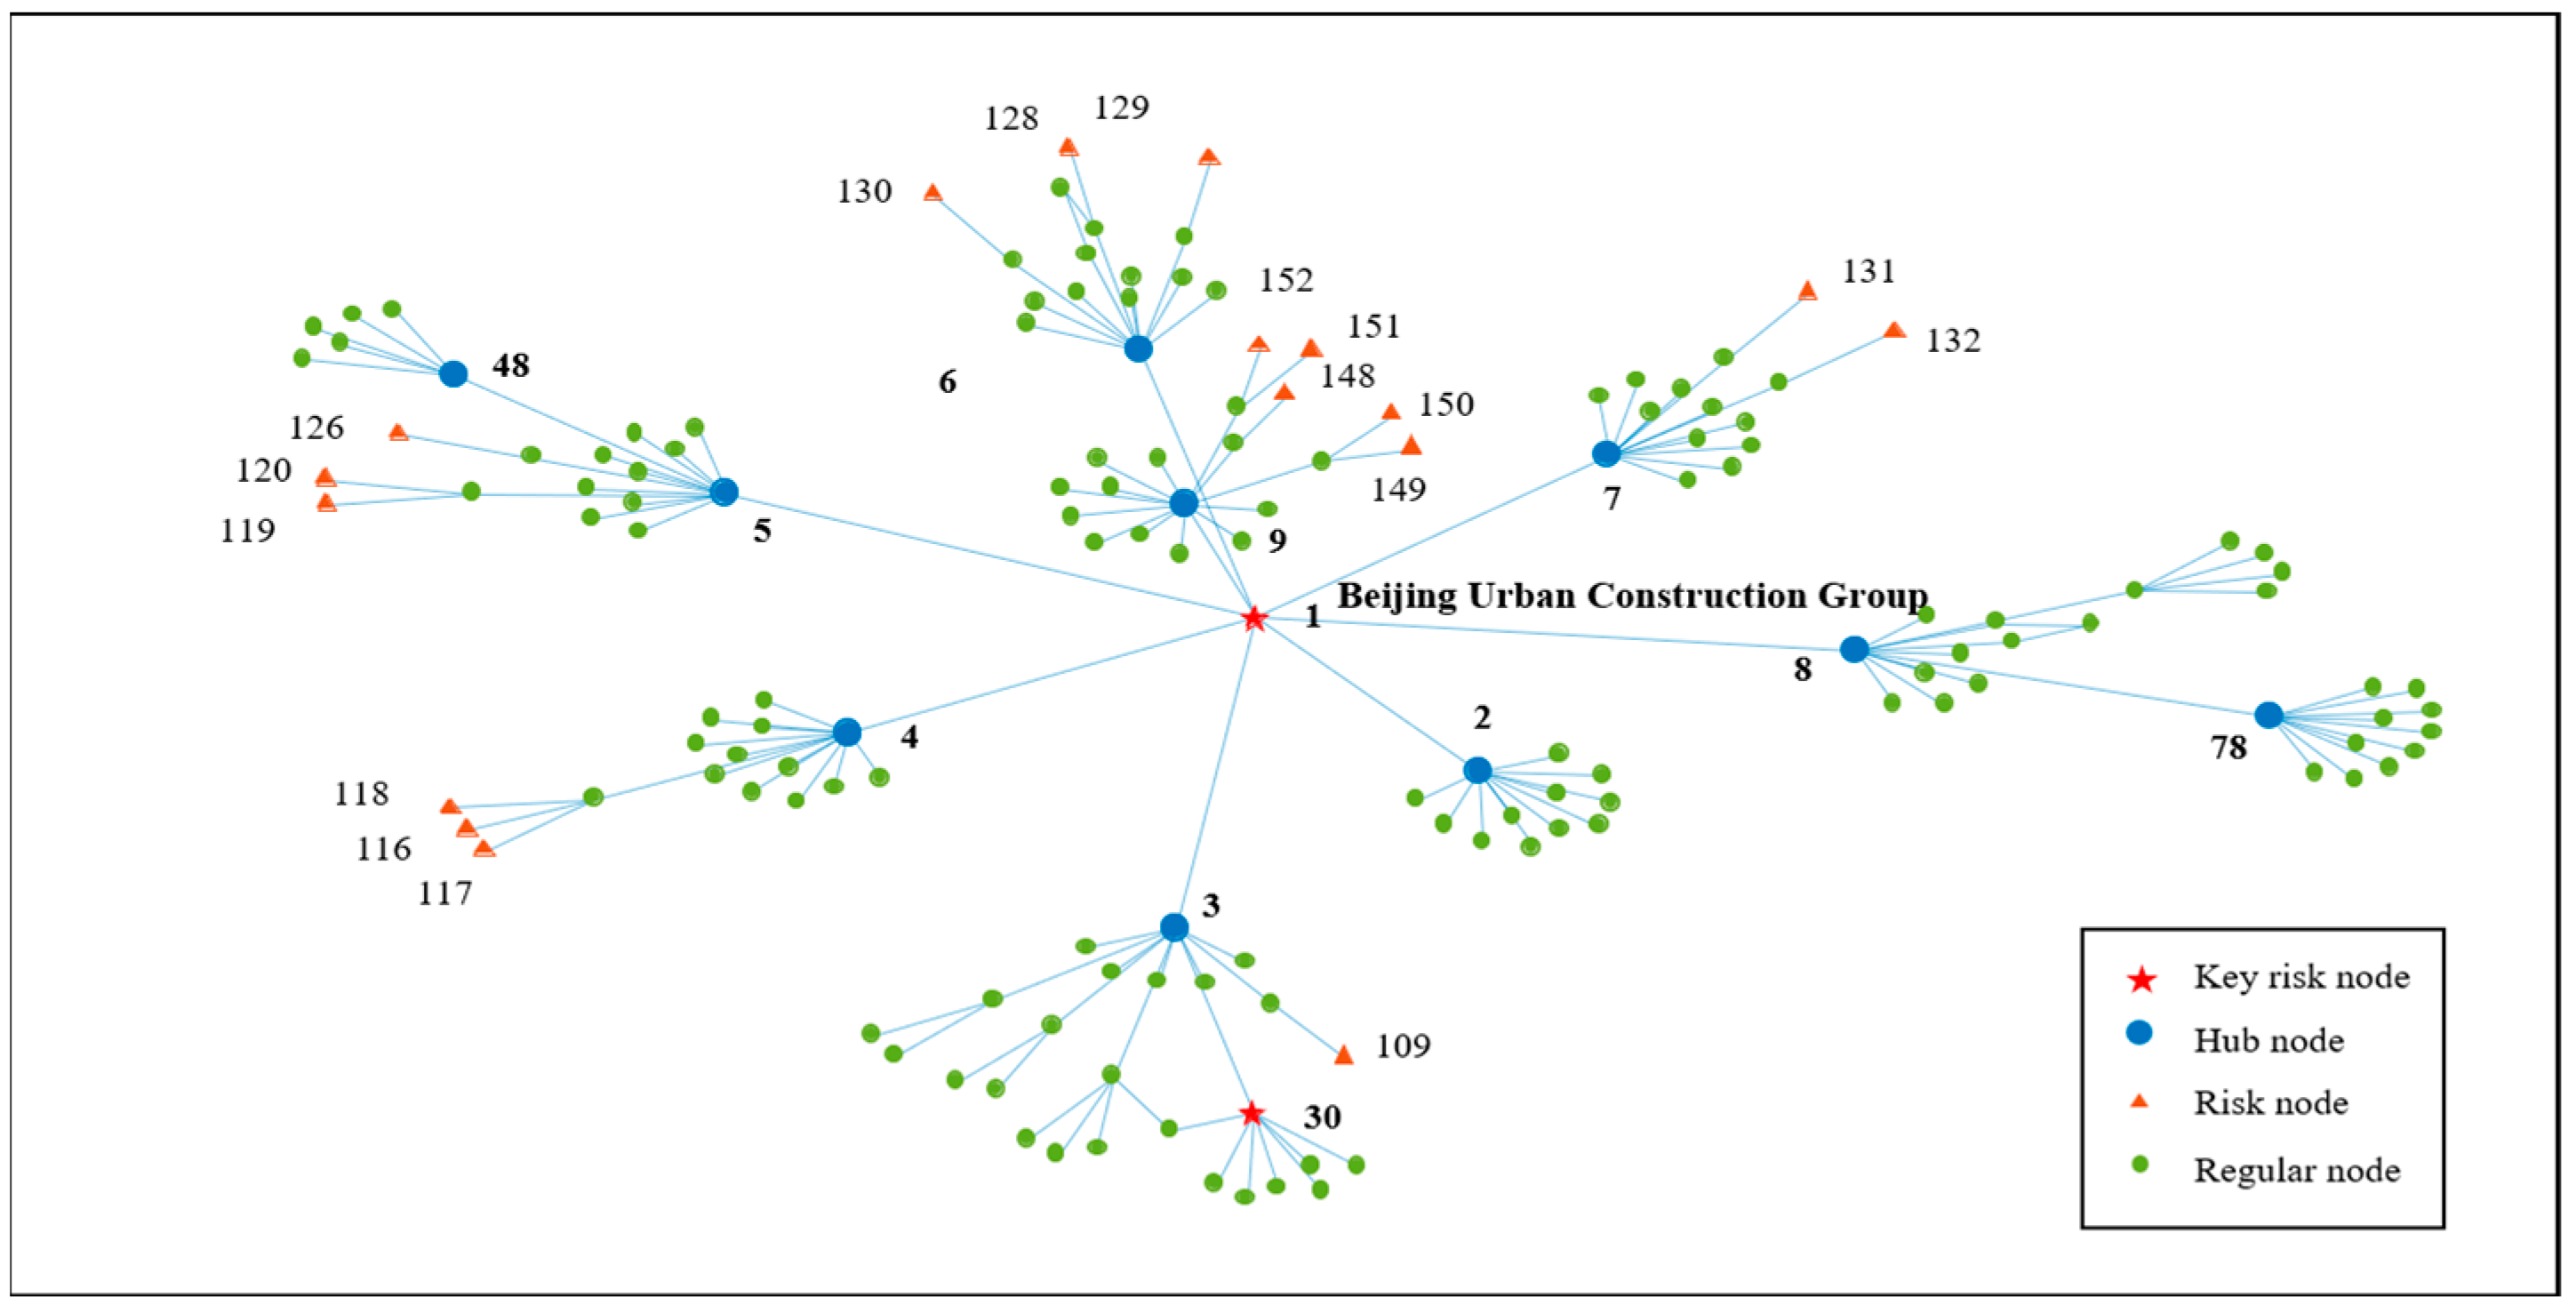
According to the classification of node types and the criteria for identifying nodes within the construction supply chain network as outlined in Table 3, the analysis revealed the presence of 2 key risk node enterprises, 10 hub node enterprises, and 17 risk node enterprises. Subsequently, a distribution map highlighting the key risk nodes was generated based on the identification outcomes, as depicted in Figure 7.
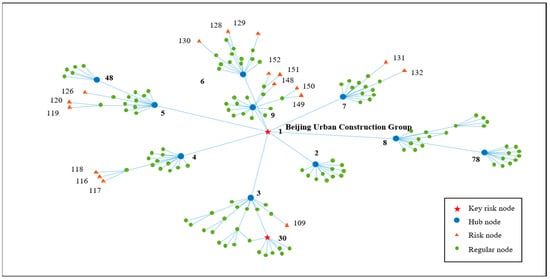
Figure 7.
Distribution of key risk nodes.
Analyzing Figure 7 in conjunction with the actual scope of business and inter-firm partnerships.
Firstly, the hub nodes within the construction supply chain network consist of general contractors (1) and all Tier 1 suppliers that directly offer various services to them, including supply chain management (2), building intelligence technology (3, 5, 7), assembly building product manufacturing (6, 9), building design and construction (8), and real estate empowerment (4). Additionally, there are a few strong Tier 2 suppliers that provide key services to the Tier 1 suppliers, such as supply chain management (30) and building construction (78). These Tier 2 suppliers are mainly located upstream in the supply chain. The presence of a select group of suppliers in the upstream segment of the supply chain suggests that upstream enterprises in the construction supply chain network hold a significant advantage in terms of business operations, resources, and information flow [30].
Secondly, the risk nodes within this construction supply chain encompass various entities, including general contractors (1), second-tier supply chain service providers (30), and specific enterprises engaged in information technology (109, 126, 132, 149, 150), system development (116, 118), e-commerce procurement (117), as well as material and equipment research and development (R&D) and manufacturing (119, 128, 129, 130, 151, 152). Additionally, entities involved in advertising and promotion (120), engineering contract management (131, 148), and other fundamental service components of robust tertiary suppliers are identified as critical risk nodes. These entities are predominantly situated downstream in the construction supply chain, signifying that downstream enterprises in the construction supply chain face heightened levels of interruption risk and possess greater vulnerability in inter-firm business relationships.
Thirdly, the key risk nodes in this construction supply chain include the general contractor (1) and the secondary supply chain service provider (30). The supply chain service provider (30), acknowledged as the top supply chain enterprise in China and listed among Forbes China’s top companies, provides comprehensive supply chain services covering business, logistics, information, and capital flows within this construction supply chain. This has substantial business implications and robust interconnections [31]. This shows that, in addition to the core enterprise, there are some suppliers that could result in significant losses in the supply chain network in the event of disruption failures.
5.5. Invulnerability Analysis of the Construction Supply Chain Network
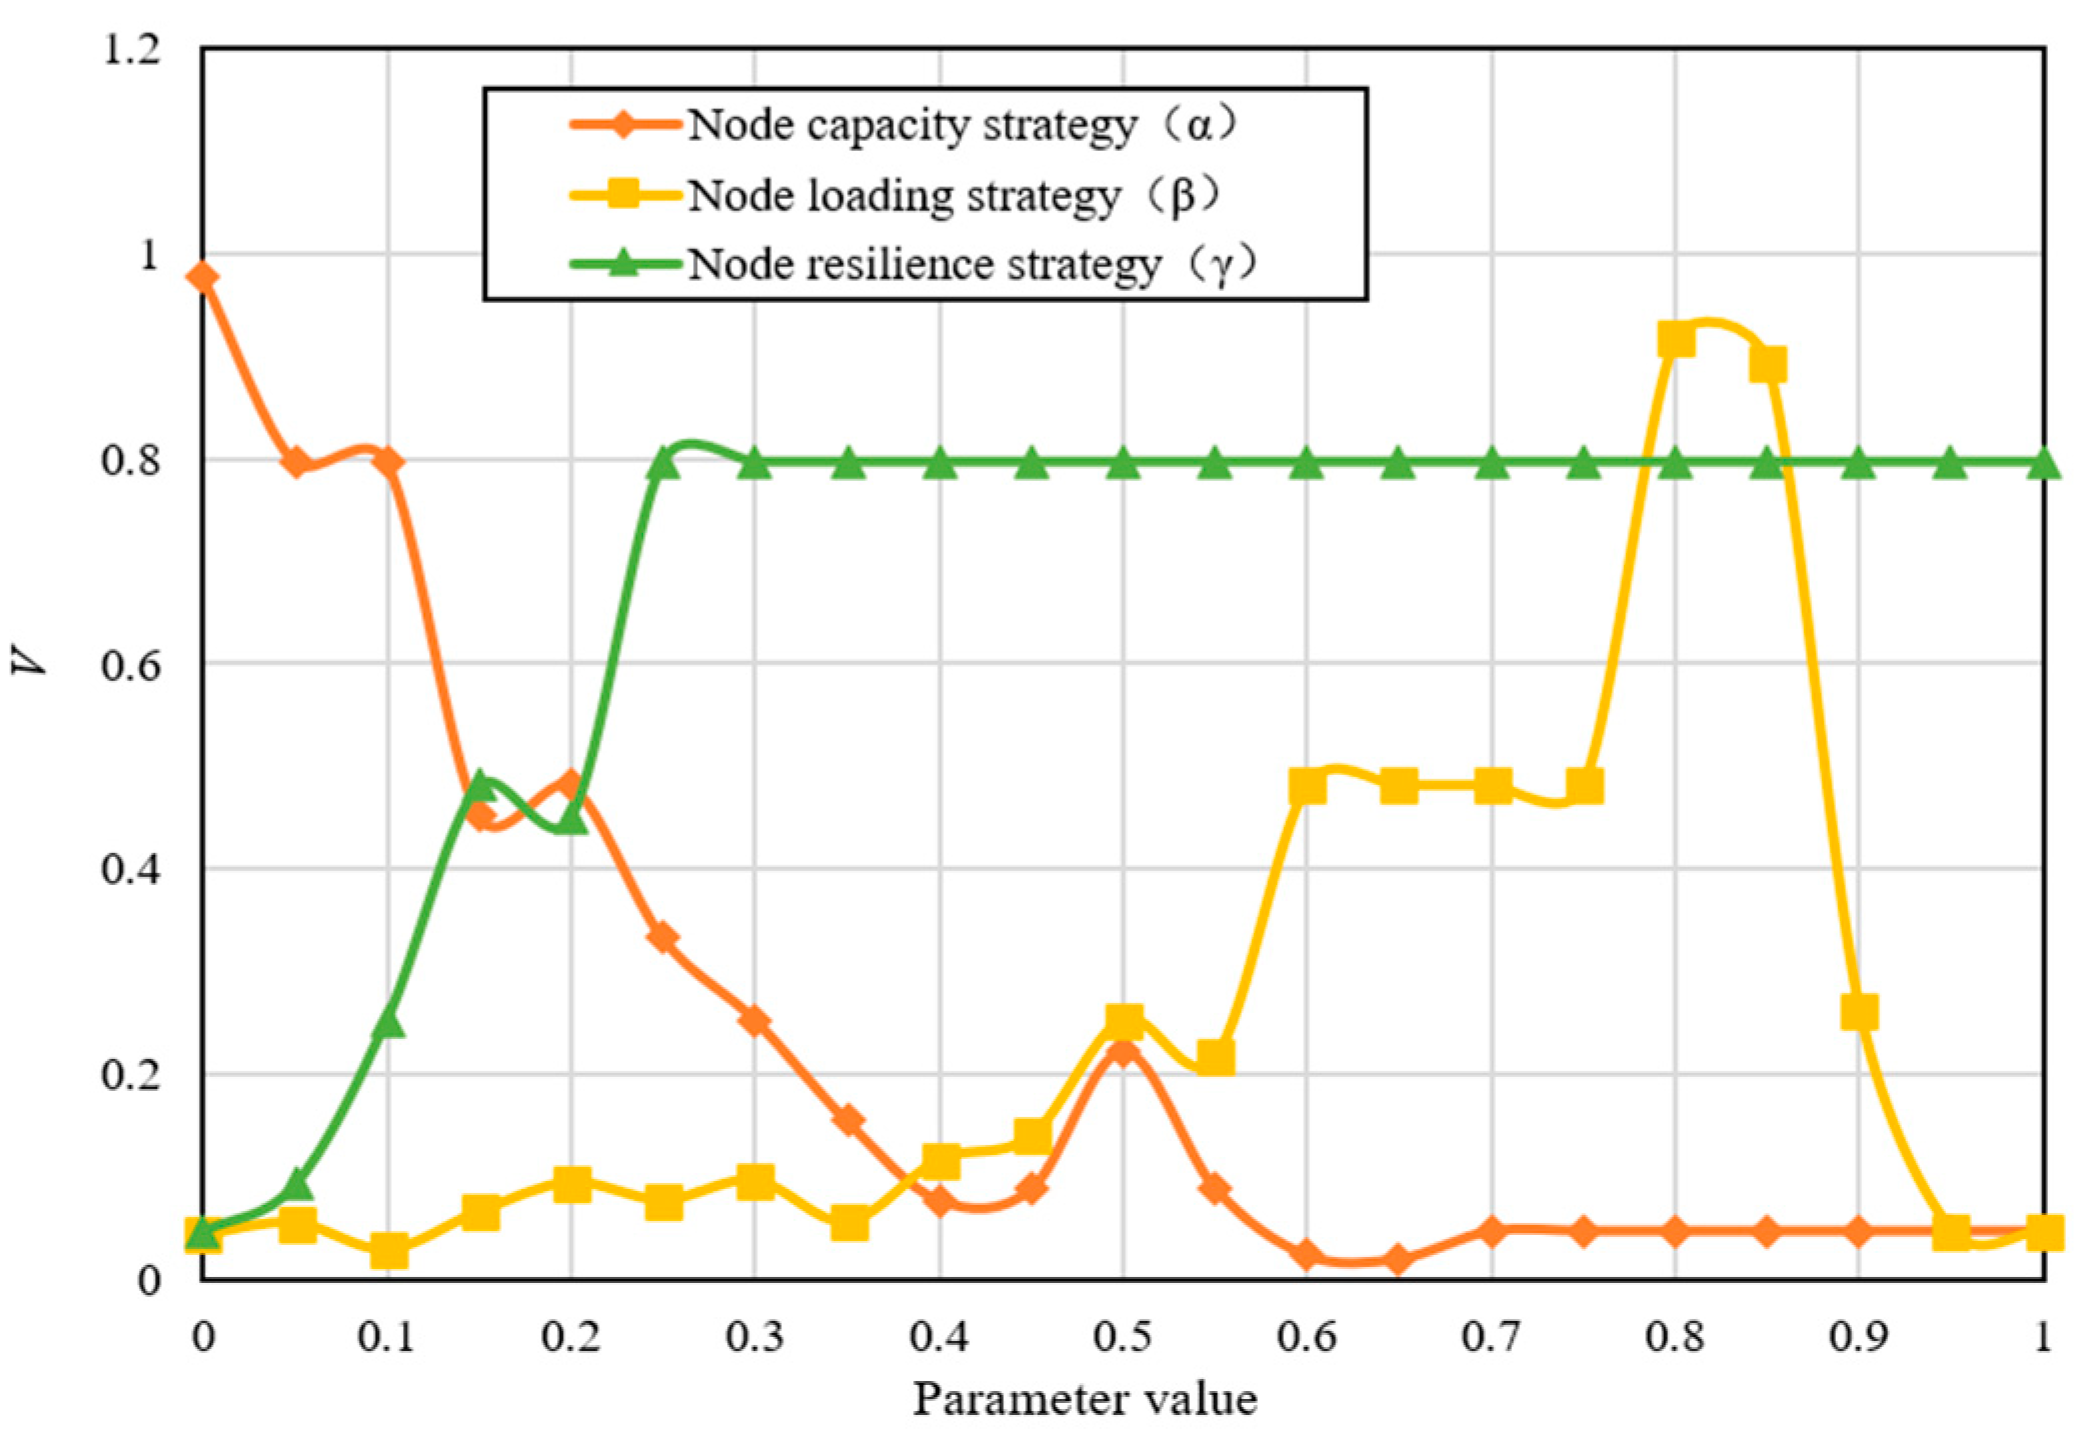
This section examines the effectiveness of various invulnerability optimization strategies through an analysis of the influence of parameter adjustments on network invulnerability. The analysis focuses on three aspects: node capacity (α), node load (β), and a resilience-related indicator for nodes (γ). This study employs a control variable method, where one parameter is modified while keeping the others at default values (α = 0.3, β = 0.5, γ = 0.1) [32]. By setting the variable change increment to a fixed step size of 0.05, starting from 0, a total of 21 adjustments are made for each parameter. Subsequently, deliberate attacks are conducted independently on each node enterprise within the construction supply chain network under each parameter value. The resulting trend in the construction supply chain network invulnerability (V) concerning changes in each parameter is illustrated in Figure 8.

Figure 8.
The invulnerability of the construction supply chain network under parameter changes.
(1) Node capacity strategy: as shown in Figure 8, the overall trend of network invulnerability (V) decreases as the parameter α increases gradually. By definition, a higher value of α corresponds to a greater disparity in node capacities and a more pronounced variation in business load handling capabilities. This suggests that a significant gap in business load capacities among firms within the construction supply chain can lead to reduced network invulnerability. Therefore, enterprises with superior business capacities in the supply chain should proactively implement measures such as business training to enhance the business processing capabilities of downstream firms with comparatively weaker capacities, thereby enhancing network invulnerability.
(2) Node load strategy: as shown in Figure 8, the network invulnerability V demonstrates a general increasing trend when β falls within the range of [0, 0.8]. However, when β exceeds 0.85, there is a notable decrease in network invulnerability V. Considering the definition of β, it is evident that a higher β corresponds to a greater disparity in service load among nodes. This suggests that implementing a node load balancing strategy can effectively enhance network invulnerability, particularly when β approaches 0.8. Therefore, it is advisable to implement measures for adjusting business loads to harmonize differences in node business volumes within the supply chain. By maintaining these variances within a specific threshold, network invulnerability can be enhanced.
(3) Node resilience strategy: as shown in Figure 8, the overall trend of network invulnerability (V) demonstrates an upward trajectory as γ values increase. It is noteworthy that once γ exceeds 0.25, V stabilizes at around 0.8, indicating reduced susceptibility to variations in γ. In this context, γ represents the cost of enterprise risk mitigation efforts, suggesting that such investments can effectively enhance network invulnerability within a specific range. However, it is crucial to acknowledge that increasing the investment beyond a certain threshold may not necessarily result in a proportional increase in network invulnerability. Instead, it could result in a waste of resources. Therefore, to enhance invulnerability, enterprises should maintain a moderately high level of investment in risk mitigation measures.
6. Conclusions
This study presents a methodology for identifying key risk nodes and analyzing the invulnerability of the construction supply chain based on a complex network theory and a cascading failure model. The approach initially employs TOPSIS to evaluate node importance based on complex network centrality indices. Subsequently, each node enterprise is intentionally targeted to gauge its risk propagation ability when disrupted, considering network loss. The integrated performance of node importance and risk propagation ability is quantitatively assessed to pinpoint key risk nodes. Furthermore, network invulnerability is analyzed by considering node capacity, load, resilience, and the effectiveness of invulnerability enhancement strategies. This research focuses on the construction supply chain of Beijing Urban Construction Group in China, comprising 152 enterprises, as a case study. By identifying key risk nodes and conducting network invulnerability analysis under a multi-class strategy, this study derives key findings and managerial implications:
(1) The hub nodes of the construction supply chain network are predominantly situated upstream of the supply chain, encompassing general contractors and their primary suppliers. Consequently, it is evident that upstream core enterprises, such as general contractors, possess distinct advantages within the construction supply chain network. To foster the stable progression of the construction supply chain network, governmental bodies and market regulators should prioritize initiatives aimed at safeguarding and augmenting the operational capacity of core enterprises, as exemplified by general contractors. Simultaneously, there is a need to intensify risk oversight concerning core enterprises like general contractors.
(2) The risk nodes within the construction supply chain network are predominantly situated downstream, encompassing general contractors and their tertiary suppliers. Consequently, the overall level of interruption risk for downstream enterprises in the construction supply chain network is elevated. Each enterprise node within the construction supply chain is advised to facilitate the development of a robust and dependable partner selection system. They should proactively implement strategies such as diversifying their sources of supply to enhance the stability of the supply reserve for essential services. Furthermore, efforts should be made to enhance the capacity to prevent and mitigate supply risks at the end of the construction supply chain.
(3) The distribution of hub nodes and risk nodes within the construction supply chain network varies, with key risk nodes comprising core enterprises and a select few strong suppliers. Consequently, aside from focusing on core enterprises within the supply chain, the entire supply chain should also actively consider the strong suppliers located at these key risk nodes. Governments, market regulators, and industry associations can facilitate the establishment of a supplier risk evaluation system and establish market entry criteria that factor in enterprise risk. This approach can effectively mitigate the potential widespread adverse effects resulting from disruptions to such enterprises.
(4) The adjustment of business capacity, load, resilience, and other parameters of node enterprises has a differentiated impact on the invulnerability of the construction supply chain network. From the perspective of the construction supply chain as a whole, enterprises can actively engage in activities such as business training and business transfer to reduce disparities in business load capacity and manage variations in business volume among node enterprises. Simultaneously, risk mitigation expenses can be determined in collaboration with the risk management and finance departments to ensure that the enterprise can allocate an appropriate and substantial amount towards risk mitigation costs to enhance the invulnerability of the construction supply chain network.
This research conclusion summarizes the distribution characteristics of key risk nodes in the construction supply chain network and the changing trend of network invulnerability under various strategies. It can be utilized to propose corresponding policy recommendations from different perspectives, including government entities, market management departments, industry associations, inter-enterprise, and stakeholders. It also offers methodological support and strategic guidance for risk management in the construction supply chain, which holds practical significance. Nevertheless, it is important to acknowledge that this study has certain limitations. The process of load redistribution primarily relies on enterprise load capacity and overlooks the weighted impact of actual business volume on the strength of business relationships and its potential influence on network load redistribution. Future research could delve deeper into empirical investigations to provide more comprehensive insights for the secure and steady advancement of the construction supply chain.
Author Contributions
Conceptualization, H.W. and Z.Z.; methodology, H.W. and Z.Z.; software, Z.Z.; validation, H.W.; formal analysis, Z.Z.; investigation, H.W. and Z.Z.; resources, H.W. and Z.Z.; data curation, Z.Z.; writing—original draft preparation, H.W. and Z.Z.; writing—review and editing, H.W. and Z.Z.; visualization, Z.Z.; supervision, H.W.; project administration, H.W.; funding acquisition, H.W. All authors have read and agreed to the published version of the manuscript.
Funding
This research was funded by the National Natural Science Foundation of China “Research on Collaborative Regulation of Urban Logistics Supply Chain Based on Network Theory”, grant number 61772062, and the National 14th Five-Year Key Research and Development Plan Project “Multi-Layer Complex Network Pinning Coordination Mechanism of Large-scale Parts Supply Chain”, grant number 2022YFB3305600.
Data Availability Statement
The original contributions presented in the study are included in the article, further inquiries can be directed to the corresponding author.
Conflicts of Interest
The authors declare no conflicts of interest.
References
- Chen, Z.; Hammad, A.W.A.; Waller, S.T.; Haddad, A.N. Modelling supplier selection and material purchasing for the construction supply chain in a fuzzy scenario-based environment. Automat. Constr. 2023, 150, 104847. [Google Scholar] [CrossRef]
- Bai, H.; Ran, W. Analysis of the Vulnerability and Resilience of the Tourism Supply Chain under the Uncertain Environment of COVID-19: Case Study Based on Lijiang. Sustainability 2022, 14, 2571. [Google Scholar] [CrossRef]
- Alamdari, A.M.; Jabarzadeh, Y.; Samson, D.; Sanoubar, N. Supply chain risk factors in green construction of residential mega projects—Interactions and categorization. Eng. Constr. Archit. Manag. 2023, 30, 568–597. [Google Scholar] [CrossRef]
- Fu, X.; Yang, M.; Liu, H.; Wang, L.; Li, Q. Risk Analysis and Simulation of Large Bridge Construction Based on System Dynamics. Buildings 2024, 14, 1488. [Google Scholar] [CrossRef]
- Koc, K.; Gurgun, A.P. Stakeholder-Associated Life Cycle Risks in Construction Supply Chain. J. Manag. Eng. 2021, 37, 4020101–4020107. [Google Scholar] [CrossRef]
- Liu, J.; Liu, S.; Li, J.; Li, J. Financial credit risk assessment of online supply chain in the construction industry with a hybrid model chain. Int. J. Intell. Syst. 2022, 37, 8790–8813. [Google Scholar] [CrossRef]
- Malik, A.; Khan, K.I.A.; Qayyum, S.; Ullah, F.; Maqsoom, A. Resilient Capabilities to Tackle Supply Chain Risks: Managing Integration Complexities in Construction Projects. Buildings 2022, 12, 1322. [Google Scholar] [CrossRef]
- Han, Y.; Yan, X.; Piroozfar, P. An overall review of research on prefabricated construction supply chain management. Eng. Constr. Archit. Manag. 2023, 30, 5160–5195. [Google Scholar] [CrossRef]
- Dubois, A.; Gadde, L. Supply strategy and network effects—Purchasing behaviour in the construction industry. Eur. J. Purch. Supply Manag. 2000, 6, 207–215. [Google Scholar] [CrossRef]
- Oludare, S.O.; Oluseye, O. Influence of Construction Materials Supply Chain Network Structures and Strategies on Project Delivery in Obafemi Awolowo University, Ile-Ife, Nigeria. Civ. Environ. Res. 2015, 7, 10–17. [Google Scholar]
- Dudziak, G.D.; Juszczyszyn, K. Complex networks modelling of supply chains in construction and logistics. AIP Conf. Proc. 2019, 2116, 180007. [Google Scholar] [CrossRef]
- Haikal, M.S.; Rahim, A.M.; Meilita, T. Sustainability assessment in construction industry supply network: A review. IOP Conf. Ser. Mater. Sci. Eng. 2020, 725, 012032. [Google Scholar] [CrossRef]
- Xiao, L.; Chen, S.; Xiong, S.; Qi, P.; Wang, T.; Gong, Y.; Liu, N. Security risk assessment and visualization study of key nodes of sea lanes: Case studies on the Tsugaru Strait and the Makassar Strait. Nat. Hazards 2022, 114, 21–25. [Google Scholar] [CrossRef]
- Crescio, M.I.; Mastrantonio, G.; Bertolini, S.; Maurella, C.; Adkin, A.; Ingravalle, F.; Simons, R.R.L.; DeNardi, M.; Stark, K.; Estrada-Peña, A.; et al. Using network analysis to identify seasonal patterns and key nodes for risk-based surveillance of pig diseases in Italy. Transbound. Emerg. Dis. 2020, 68, 3541–3551. [Google Scholar] [CrossRef]
- Zhang, W.; Liu, K.; Sheng, W.; Du, S.; Jia, D. Critical node identification in active distribution network using resilience and risk theory. IET Gener. Transm. Distrib. 2020, 14, 2771–2778. [Google Scholar] [CrossRef]
- Wu, P.; Li, Y.; Li, C. Invulnerability of the Urban Agglomeration Integrated Passenger Transport Network under Emergency Events. Int. J. Environ. Res. Public Health 2023, 20, 450. [Google Scholar] [CrossRef]
- Chen, Q.; Hall, D.M.; Adey, B.T.; Haas, C.T. Identifying enablers for coordination across construction supply chain processes: A systematic literature review. Eng. Constr. Archit. Manag. 2021, 28, 1083–1113. [Google Scholar] [CrossRef]
- Kim, S.Y.; Nguyen, V.T. An AHP Framework for Evaluating Construction Supply Chain Relationships. KSCE J. Civ. Eng. 2018, 22, 1544–1556. [Google Scholar] [CrossRef]
- Li, H.; Wang, Z.; Liu, R.; Hou, J.; Dong, Z.; Xie, T. Cascading failure invulnerability analysis of chemical material network considering failure propagation capability. Can. J. Chem. Eng. 2023, 101, 7031. [Google Scholar] [CrossRef]
- Ekanayake, E.M.A.C.; Geoffrey, Q.; Shen, P.; Mohan, M.K. A fuzzy synthetic evaluation of capabilities for improving supply chain resilience of industrialised construction: A Hong Kong case study. Prod. Plan. Control 2023, 34, 623–640. [Google Scholar] [CrossRef]
- Zhang, D.; Jia, L.; Ning, J.; Ye, Y.; Sun, H.; Shi, R. Power Grid Structure Performance Evaluation Based on Complex Network Cascade Failure Analysis. Energies 2023, 16, 990. [Google Scholar] [CrossRef]
- Dui, H.Y.; Zhang, C.; Xu, X. Failure analysis of network nodes and edges in scale-free networks. Commun. Stat. Theory Methods 2020, 49, 3635–3649. [Google Scholar] [CrossRef]
- Sun, H.; Mao, W.; Dang, Y.; Xu, Y. Optimum path for overcoming barriers of green construction supply chain management: A grey possibility DEMATEL-NK approach. Comput. Ind. Eng. 2022, 164, 107833. [Google Scholar] [CrossRef]
- Zhang, Z.; Srivastava, P.R.P.; Eachempati, Y.Y. An intelligent framework for analyzing supply chain resilience of firms in China: A hybrid multicriteria approach. Int. J. Logist. Manag. 2023, 34, 443–472. [Google Scholar] [CrossRef]
- Cao, X.; Li, C.; Chen, W.; Li, J.; Lin, C. Research on the invulnerability and optimization of the technical cooperation innovation network based on the patent perspective—A case study of new energy vehicles. PLoS ONE 2020, 15, e0238541. [Google Scholar] [CrossRef] [PubMed]
- Panova, Y.; Hilletofth, P. Managing supply chain risks and delays in construction project. Ind. Manag. Data Syst. 2018, 118, 1413–1431. [Google Scholar] [CrossRef]
- Ghufran, M.; Khan, K.I.A.; Ullah, F.; Alaloul, W.S.; Musarat, M.A. Key Enablers of Resilient and Sustainable Construction Supply Chains: A Systems Thinking Approach. Sustainability 2022, 14, 11815. [Google Scholar] [CrossRef]
- Le, P.L.; Nguyen, N.T.D. Prospect of lean practices towards construction supply chain management trends. Int. J. Lean Six Sigma 2022, 13, 557–593. [Google Scholar] [CrossRef]
- Shahbaz, M.S.; Chandio, A.F.; Oad, M.; Ahmed, A.; Ullah, R. Stakeholders’ Management Approaches in Construction Supply Chain: A New Perspective of Stakeholder’s Theory. Int. J. Sustain. Constr. Eng. Technol. 2018, 9, 16–26. [Google Scholar] [CrossRef]
- Mei, T.; Qin, Y.; Li, P.; Deng, Y. Influence Mechanism of Construction Supply Chain Information Collaboration Based on Structural Equation Model. Sustainability 2023, 15, 2155. [Google Scholar] [CrossRef]
- Hou, L.L.; Lu, K.; Bi, G.B. Predicting the credit risk of small and medium-sized enterprises in supply chain finance using machine learning algorithms. Manag. Decis. Econ. 2024, 45, 2393–2414. [Google Scholar] [CrossRef]
- Zokaee, M.; Tavakkoli-Moghaddam, R.; Rahimi, Y. Post-disaster reconstruction supply chain: Empirical optimization study. Autom. Constr. 2021, 129, 103811. [Google Scholar] [CrossRef]


Disclaimer/Publisher’s Note: The statements, opinions and data contained in all publications are solely those of the individual author(s) and contributor(s) and not of MDPI and/or the editor(s). MDPI and/or the editor(s) disclaim responsibility for any injury to people or property resulting from any ideas, methods, instructions or products referred to in the content. |
© 2024 by the authors. Licensee MDPI, Basel, Switzerland. This article is an open access article distributed under the terms and conditions of the Creative Commons Attribution (CC BY) license (https://creativecommons.org/licenses/by/4.0/).