Article

Seismic Performance of Drop-In Anchors in Concrete under Shear and Tension

1
Civil Engineering Dept., Toronto Metropolitan University, 350 Victoria St., Toronto, ON M5B 2K3, Canada
2
WSP Group, Calgary, AB T2P 4K3, Canada
3
Centre for Infrastructure Monitoring and Protection, School of Civil and Mechanical Engineering, Curtin University, Kent Street, Bentley, WA 6102, Australia
4
Civil Engineering Dept., Faculty of Engineering, Kafrelsheikh University, Kafrelsheikh 6860404, Egypt
*
Author to whom correspondence should be addressed.
Buildings 2024, 14(7), 2021; https://doi.org/10.3390/buildings14072021
Submission received: 30 May 2024 / Revised: 28 June 2024 / Accepted: 1 July 2024 / Published: 2 July 2024
(This article belongs to the Special Issue Sustainable Development of Concrete and Composite Structures)

Abstract

:
This paper presents an experimental study conducted on the behavior of drop-in anchors in uncracked concrete slabs. Both seismic (cyclic) load tests and static load tests to collapse are performed on drop-in anchors subjected to tension or shear forces. Three different anchor sizes are subjected to seismic qualification testing, followed by a static load test to collapse. The test results confirm the capability of the tested anchors to sustain simulated pulsating seismic tension and shear loading with frequency ranges between 0.1 and 2.0 Hz. It was observed that no tension failure occurred at the end of the cyclic load tests for all the tested anchors, and their residual inelastic maximum displacement at the end of the cyclic tension test was relatively small. Moreover, the experimental results show that the anchors’ ultimate capacities are higher than those specified by the anchor manufacturer. Finally, the anchors’ experimental pullout shear capacities are compared with the failure prediction equations in the literature and design codes. It is found that the theoretical models provide a conservative prediction of the concrete breakout of anchors in tension compared to the experimental ultimate loads. The coefficient for pry-out strength (kcp) equal to 2 or slightly smaller than 2 is likely to predict a better pry-out capacity with the experimental results compared to the application of the high conservative value of kcp equal to 1, as given in the code.

1. Introduction

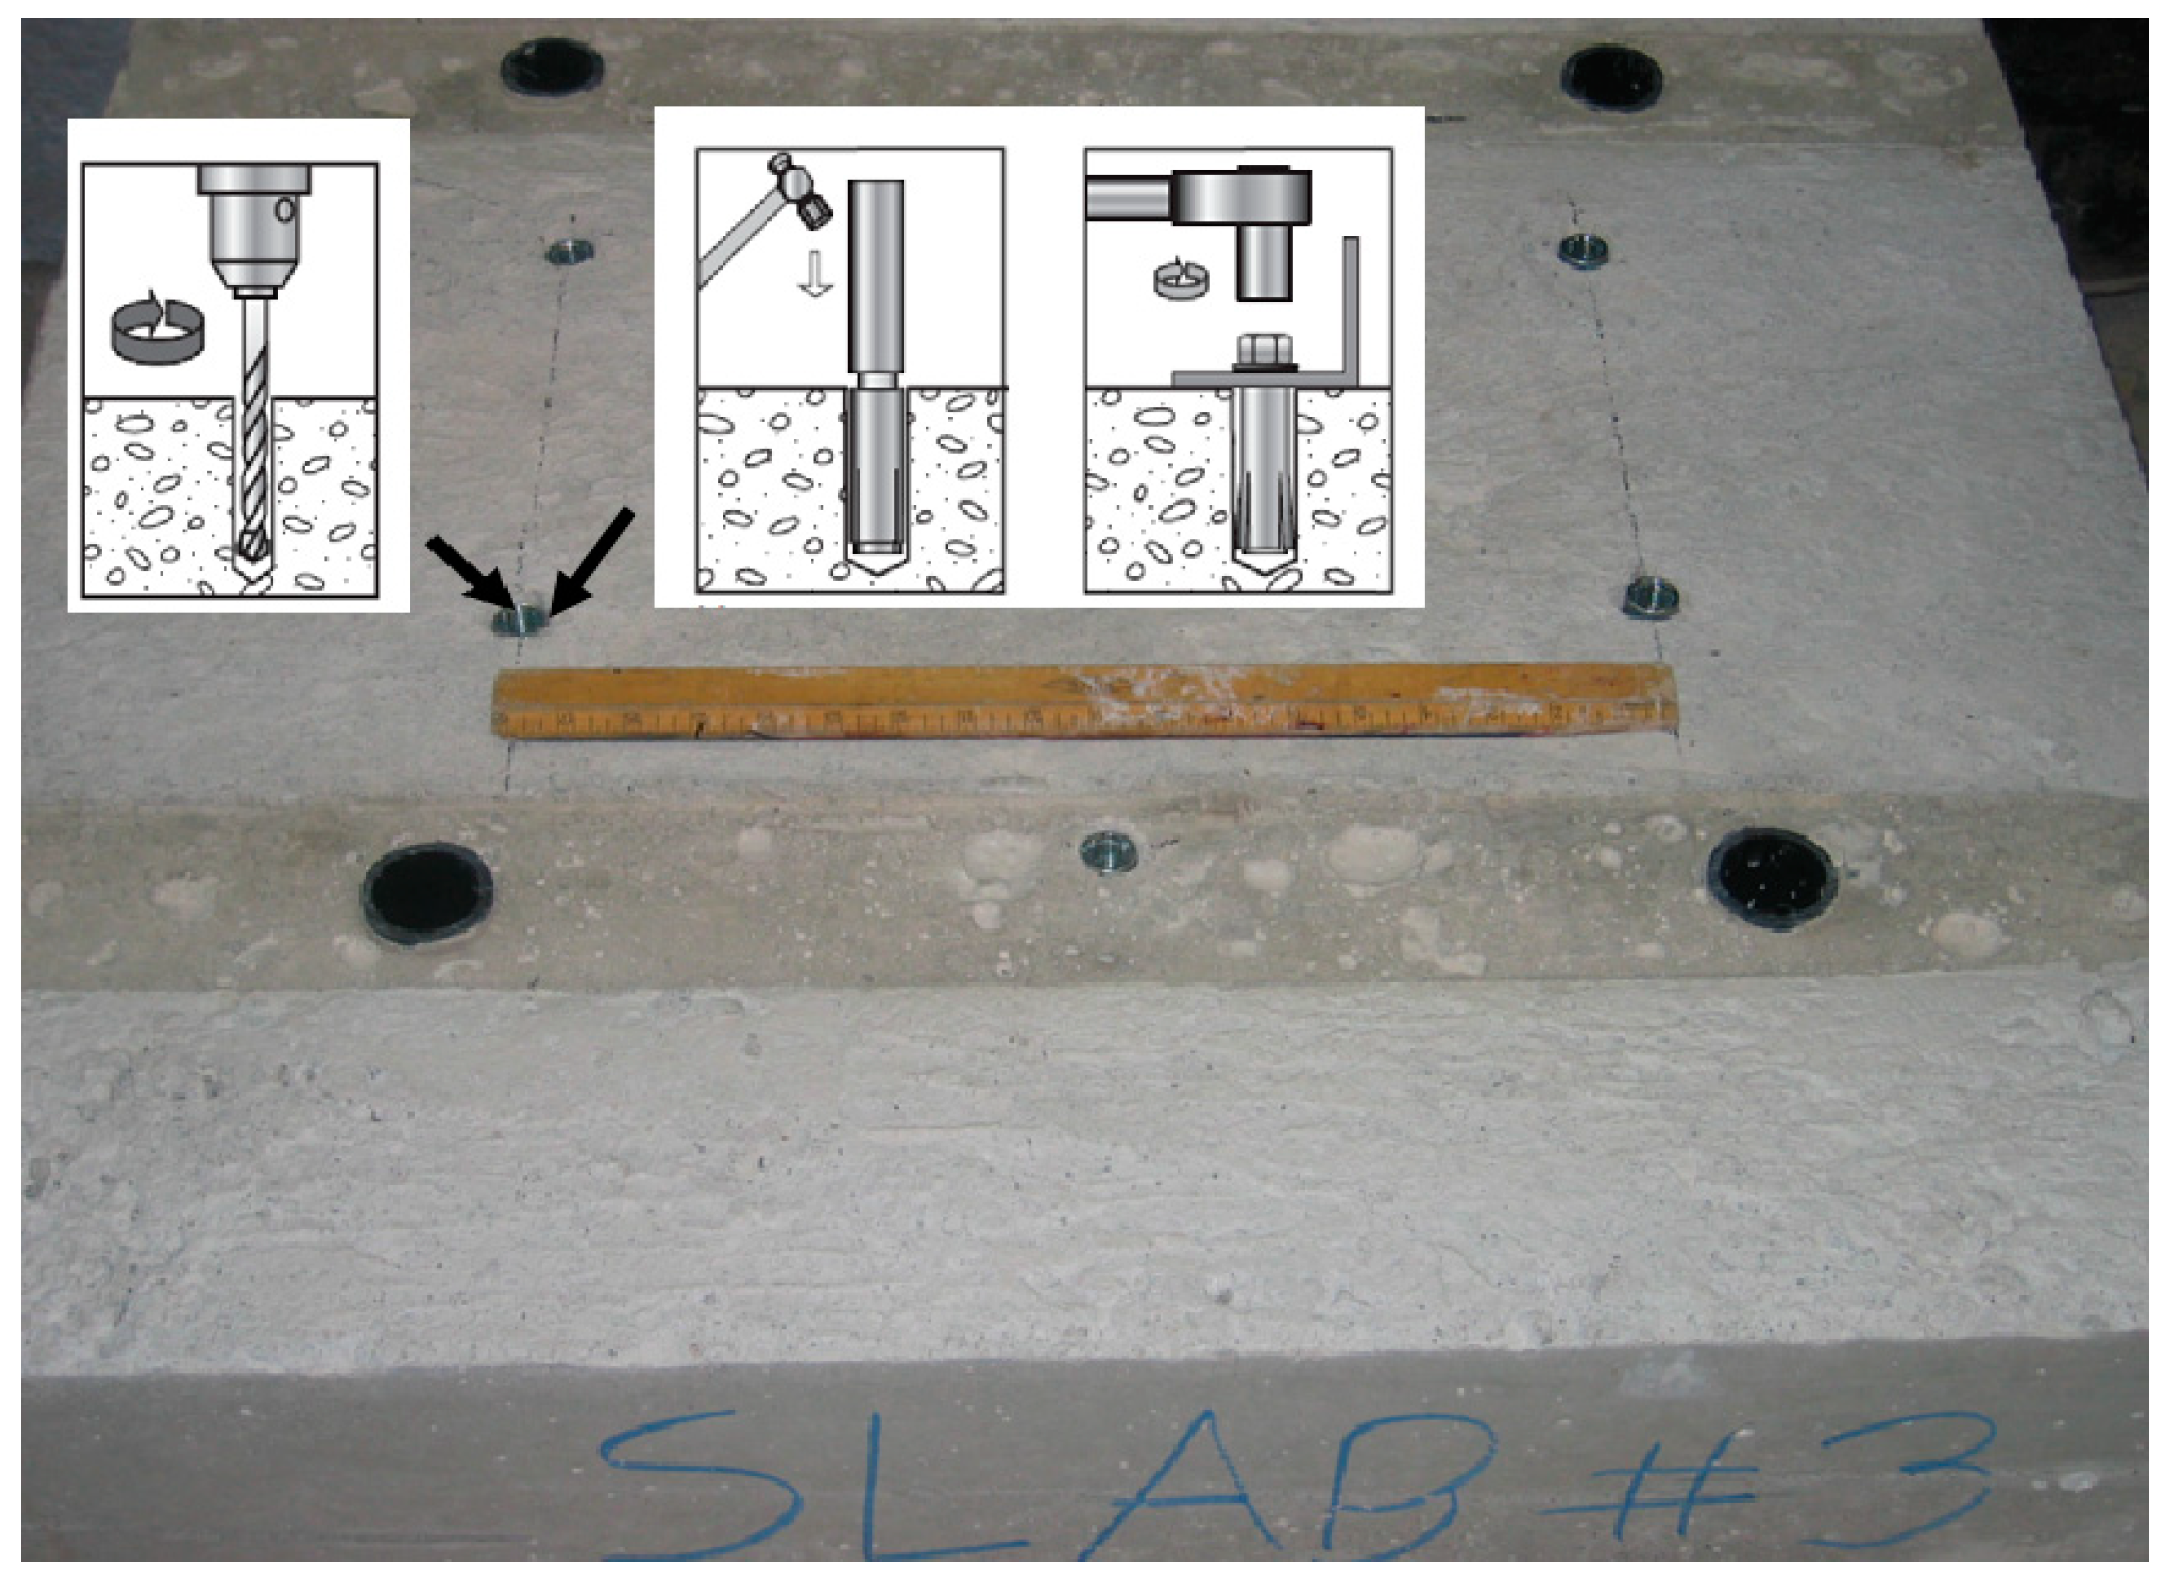
Various anchor types, such as cast-in, post-installed mechanical, bonded, or bonded anchors, are often used to facilitate attachment to concrete structures [1,2,3,4]. The load transfer mechanisms for various anchors to concrete differ from each other. The tensile load is transferred into concrete by bearing and/or friction at the anchor head in the cast-in and post-installed anchors. In contrast, the adhesive layer transfers the tensile load along its entire bonded length to concrete in bonded anchors. However, the prior installation of cast-in anchors in the formwork enhances their anchorage properties compared to bonded anchors [5]. Nonetheless, special care should be considered when deciding on their location in concrete elements, because they are non-adjustable. Therefore, post-installed anchors are considered more flexible due to the flexibility of placing them in any location by drilling into hardened concrete. Post-installed mechanical anchors are available in torque-controlled and displacement-controlled expansion anchors and are installed by anchoring with concrete via a mechanical connection. An example of displacement-controlled expansion anchors is the drop-in anchor, as shown in Figure 1 [6]. The anchor is internally threaded and pre-assembled with an internal expansion plug. Such anchors are usually fire-resistant and available in carbon steel and stainless steel, where the carbon steel anchor can be zinc plated to improve corrosion protection [6]. The installation procedure/tools shown in Figure 2 are based on the manual of the anchor manufacturer to ensure that the correct anchor setting can be found in UCAN [6].
Much research has been undertaken on the seismic studies of concrete and composite structures. Wei et al. [7] conducted tests to study the seismic performance of concrete-filled steel tubular columns with ultra-high-performance concrete plates. The test parameters included the ground motion characteristics, axial pressure ratio, plate material, and mainshock–aftershock sequences. It was reported that the ground motion characteristics significantly influence the seismic performance of CFST columns. However, the axial pressure ratio has an insignificant influence on the stiffness of the columns. Huang et al. [8] investigated the seismic performance of reinforced concrete columns, examining the effects of different loading and strengthening methods. It was reported that the strengthened columns exhibited a better structural performance than the control column. Under a combined compression–bending load, the load-bearing capacity of the columns was reduced due to eccentricity. Yao et al. [9] proposed a novel steel PEC spliced beam and studied their seismic performance. The test variables include concrete strength, the length of the stub beam, and the length of flange plates. It was found that higher-strength concrete resulted in the better seismic performance of the system. Zhang et al. [10] analyzed the seismic performance of concrete-filled steel tube frames made of recycled aggregates using a displacement-based analytical method. Yang et al. [11] numerically studied the mechanical properties of a displacement-amplified mild steel bar joint damper. It was found that the increase in the diameter and the number of mild steel bars in the damper increased the energy dissipation effect of the damper. Huang et al. [12] investigated the seismic performance of a novel friction-type artificial plastic hinge to replace the beam-end plastic hinge region in prefabricated concrete members. It was found that compared to the concrete connection cast in situ, the proposed system resulted in better hysteresis performances in terms of higher energy dissipation, bearing capacity, and ductility. Huang et al. [13] investigated the seismic performance of precast concrete frames with replaceable artificial, controllable plastic hinges. It was found that the proposed system exhibited a better seismic performance. Zhang and Zhang [14] carried out an analytical model to investigate the effectiveness of viscoelastic materials in reducing the pounding between adjacent buildings during earthquakes. The influences of inter-story drift of the adjacent buildings, pounding force, and the amplification of the acceleration were studied. It was reported that buildings’ impact force and acceleration can be reduced significantly using the proposed viscoelastic materials.
The behavior of anchors in concrete under fatigue and/or seismic effects was investigated by a few researchers as early as the 1980s [15,16,17,18]. Significant research has been undertaken on this topic since 2000 [19,20,21,22,23,24,25,26,27,28,29,30,31]. Most previous anchor studies were dedicated to anchors in uncracked concrete, while few authors addressed the influence of cracked concrete and/or high-moment regions on the anchor tension capacity [30,32,33,34,35]. Rodriguez et al. also investigated the dynamic behaviors of cast-in-place and post-installed anchors embedded in concrete at relatively shallow depths [36,37]. These studies indicated that anchors designed for ductile failure under static loading in uncracked concrete could maintain the same ductile failure mode if subjected to less dynamic loading in cracked concrete. Lotze et al. [24] investigated the static behavior of anchors under combined tension and shear loads. The study covered undercut and sleeve anchors, either single or multiple, in uncracked concrete. Force–displacement interaction design diagrams were developed, and the applicability of elastic and plastic theories to design multiple-anchor connections was also addressed. Ghobarah and Aziz [22] studied the seismic qualification of expansion anchors according to Canadian nuclear standards. Hashimoto and Takiguchi [38] conducted an experimental program to investigate the pullout strength of anchor bolts with a relatively shallow embedment in concrete under high temperatures. Muratli et al. [39] and Shirvani et al. [40] investigated the breakout capacities of tensile and shear anchors in concrete under static and dynamic loading. Such investigations established specific factors to accommodate the dynamic/cracking effects into the nominal anchor capacity under static loading and uncracked concrete conditions. Abdul-Hamid et al. [41] studied the influences of impact loads on mechanical screw anchors with three different diameters in concrete. It was reported that the screw anchors exhibited higher capacities under a high strain rate. Hoehler et al. [23] tested different types of anchors in cracked concrete subjected to rapid tension loading. The aim of the study was to examine the influence of the loading rate on the anchor’s load-bearing behavior. It was concluded that the testing anchors subjected to rapid load rates are not essential for seismic applications. Neupane et al. [42] reviewed the challenges and prospects of developing finite element models for the performance analysis of post-installed anchors in concrete. Ahmed and Braimah [19] numerically studied the performances of undercut anchors subjected to high strain rates. It was found that the tensile capacity of the anchors increased with an increase in the strain rate.
Mahrenholtz and Wood [43] discussed the enhanced C2 requirements for the seismic category introduced by European design codes and compared them with the existing design specifications of ACI 355 [1,2]. It was reported that the strength reduction from C1 to C2 requirements mainly relies on the anchor category and diameter. Gallo et al. [21] proposed high-performance post-installed anchors incorporating supplemental damping to reduce the acceleration suffered by nonstructural components. The performance of the proposed anchors was investigated experimentally using unidirectional shake table tests. It was found that the proposed anchors had an improved seismic response compared to traditional anchors. Tarawneh et al. [25,26] conducted pullout tests on screw and adhesive anchors embedded in sandwich panels to evaluate the effects of the anchor diameter, embedment depth, concrete thickness, and anchor brand on their mechanical behavior. Tarawneh et al. [27] also examined the accuracy of the design procedure proposed for adhesive anchors in thin concrete members under tensile and shear loads. They proposed strength reduction factors for anchors with different classes. Chen et al. [20] carried out tests on torque-controlled expansion anchors of three diameters with two different effective embedment depths to investigate the pullout (PO) and pull-through (PT) failure modes. It was found that the failure modes and ultimate tensile strength are influenced by the embedded depth and the diameter of the anchors. Liu et al. [44] investigated the effects of threads/grooves in drilled holes in the adhesive anchor installation process. It was found that before the injection of adhesives, creating threads/grooves in drilled holes increased the tensile capacities of the anchors compared to conventional adhesive anchors.
The ACI 355.2-04 [2], AC01 [45], and ASTM E 488-96 [46] specify test procedures for the seismic qualification of anchors in uncracked concrete. However, the ACI 355.2-04 standard requires the testing of anchors in cracked concrete as well to ensure that the anchors are serviceable for a long time, during which time the concrete may experience cracking. As such, the standard requirement is to permit these anchors only with substantially reduced capacities with concrete cracks.

2. Research Significance

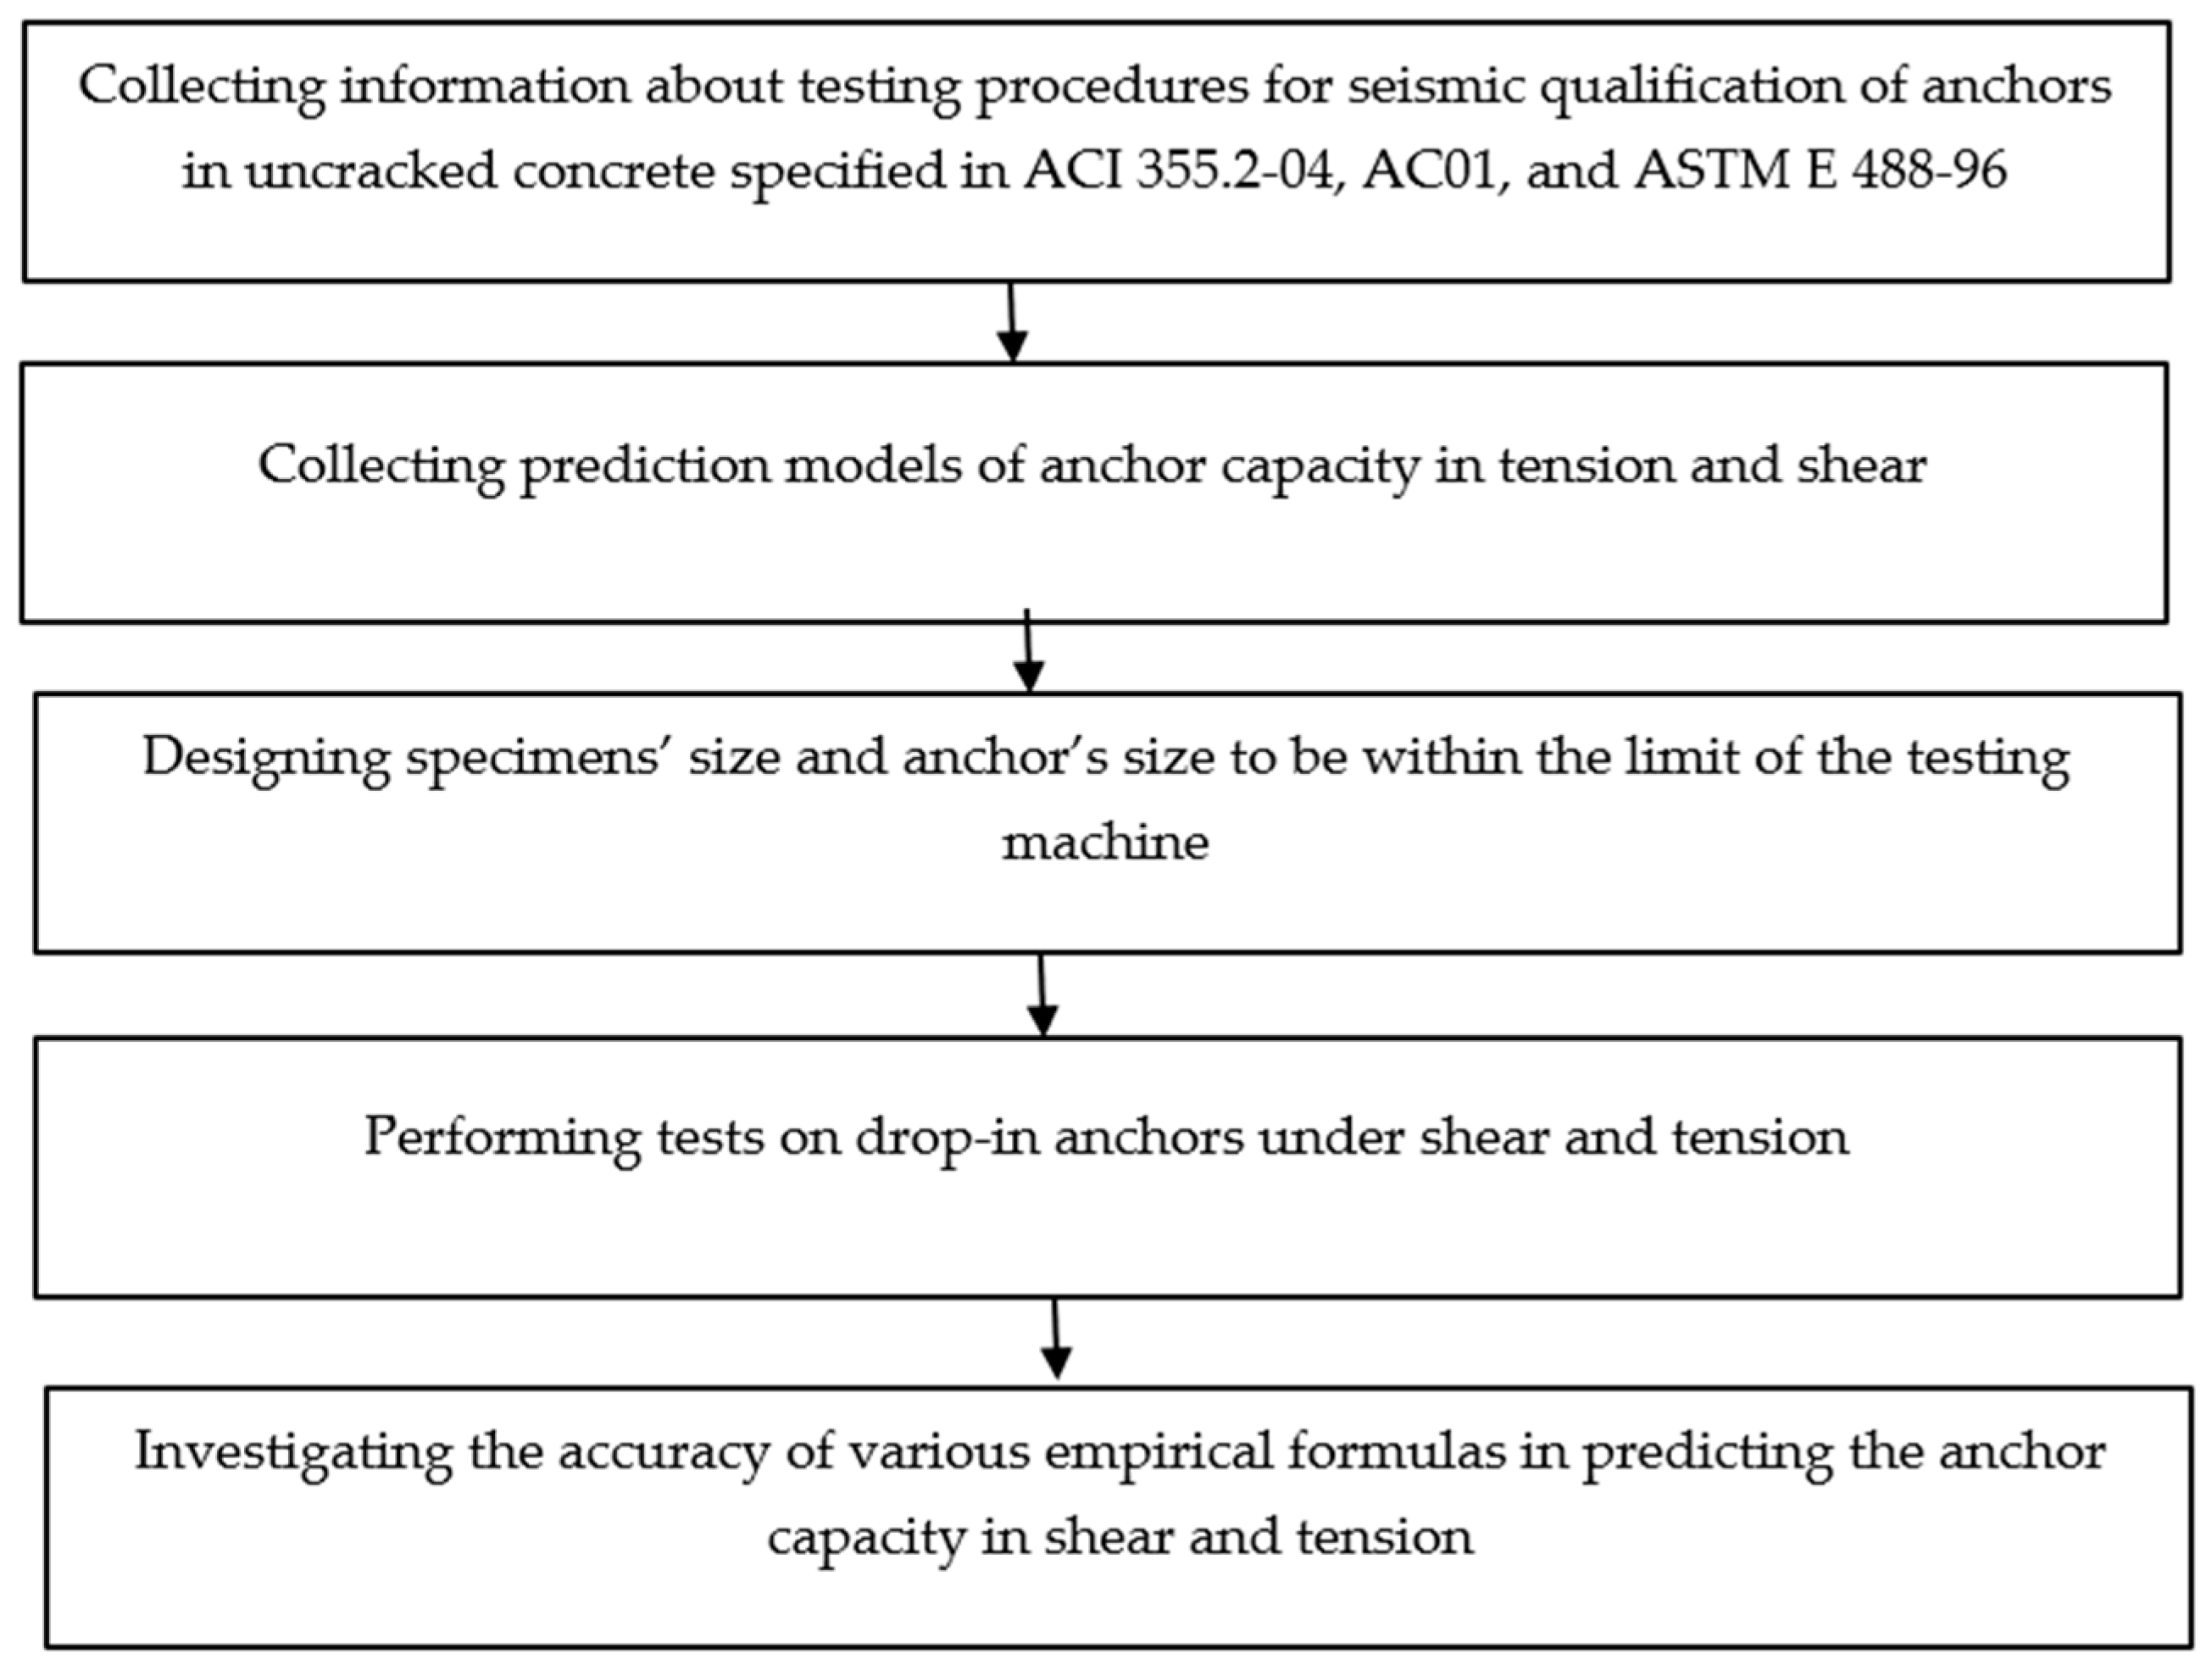
The seismic capabilities of drop-in anchors have been a topic of interest, since they rely on friction to develop tension resistance. Also, the bearing strength of concrete will affect the shear capacity of these anchors. The resistance of drop-in anchors to applied loading depends on several parameters, such as the concrete strength, hole size, embedment depth, edge distance, and installation procedure. Therefore, the present study fills this knowledge gap by investigating the seismic performance of drop-in anchors under shear and tension through the experimental setup according to the ACI 355.2-04 [2] and ASTM E 488-96 [46]. In this study, tests were conducted on single anchors, as shown in Figure 1, with three different sizes, namely 9.5 mm, 12.7 mm, and 15.9 mm, with lengths of 38 mm, 50 mm, and 64 mm, respectively, that were manufactured by UCAN [6]. These anchors were designed to deliver consistent holding power at shallow embedment. Although some research has already been performed on other types of mechanical anchors subjected to seismic loading, limited investigations on the seismic performance of drop-in anchors have been carried out to date. The research methodology, outlined in Figure 3, emphasizes using tested drop-in anchors in locations of uncracked concrete on concrete floors. These locations are typically near columns in concrete flat slab and flat plate floor systems. In this system, drop-in anchors are installed on the bottom surface of the slab (compression side) adjacent to the columns, primarily to support lifting HVAC equipment and placing pipes.

3. Prediction Models of Anchor Capacity in Tension and Shear

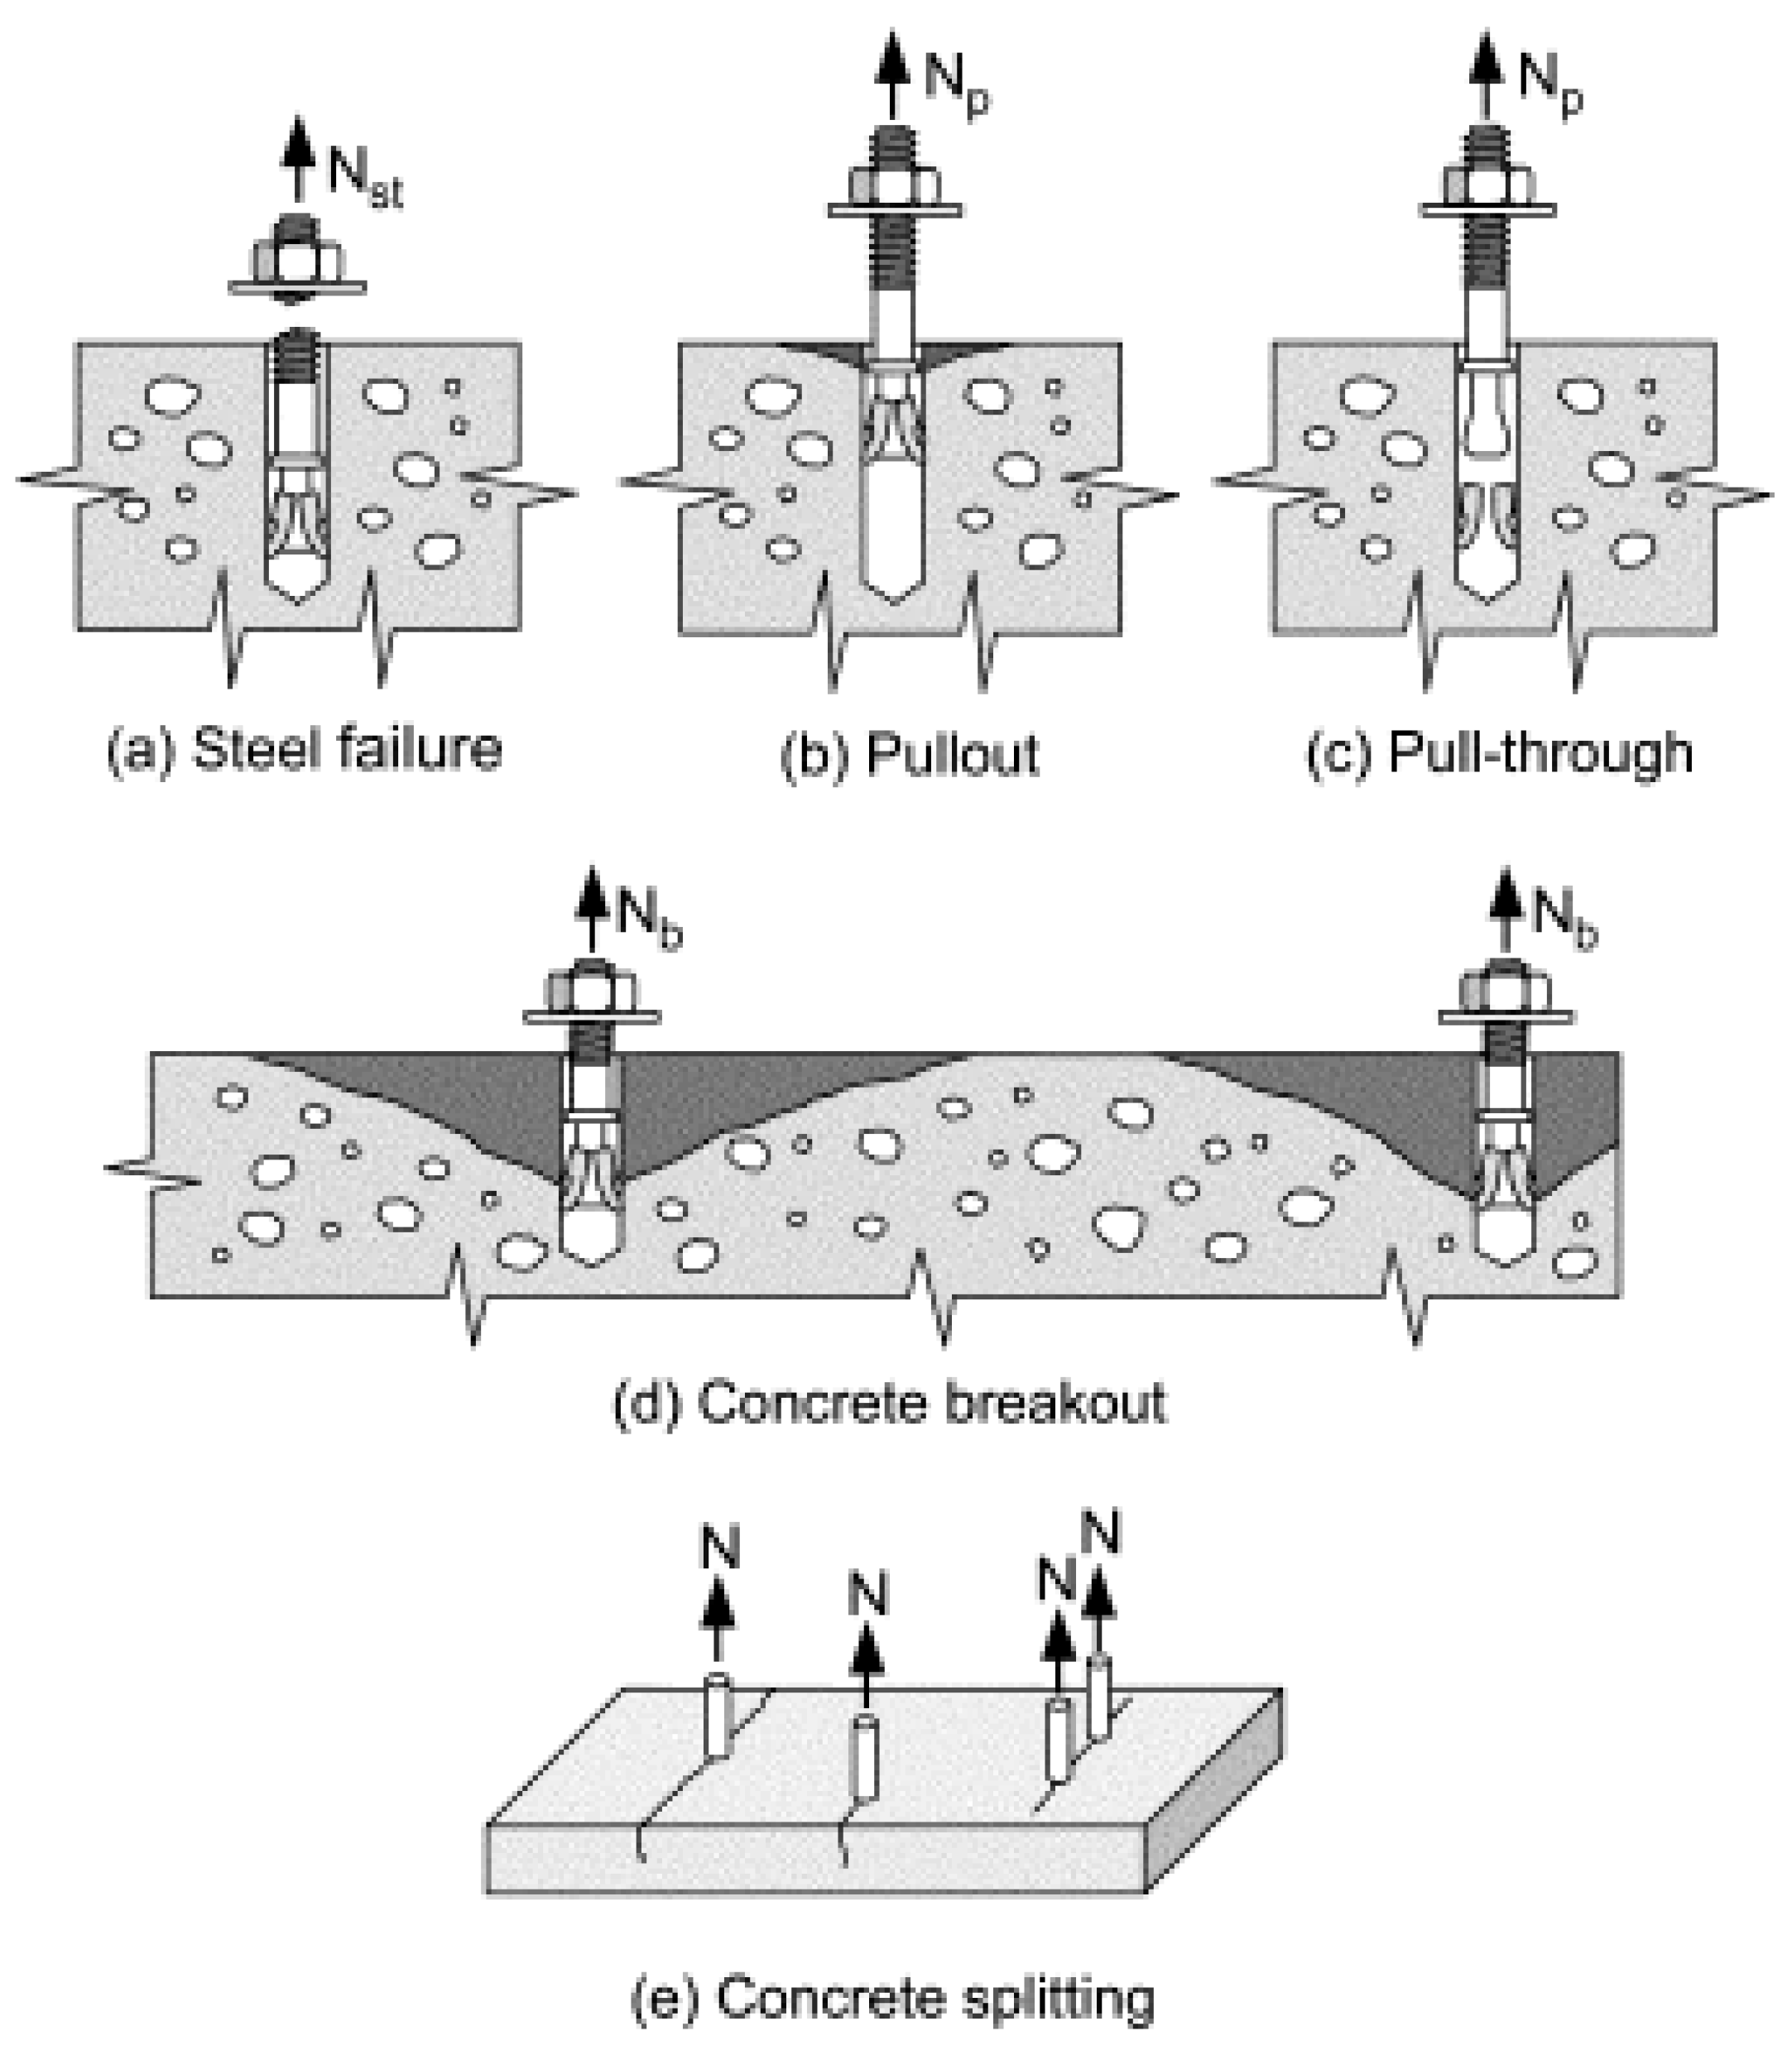
There are five modes of failure for anchors in tension, as shown in Figure 4, namely steel failure, concrete breakout, pull-through, pullout, and concrete splitting failure. Steel failure occurs when the anchor is fastened to the base concrete with an embedment depth that is enough to develop the full capacity of the anchor. Pullout failure takes place when there is a bond failure between the anchor and the surrounding concrete, usually accompanied by small concrete conic failure at the concrete surface. Pull-through failure mode can also be observed if the anchor significantly loses its bond with the concrete, such as by crushing the mechanical head of an expansion anchor. Concrete breakout is one of the main modes of anchor failure mainly due to the relatively small embedment depth used. Concrete splitting could also be observed if the size or thickness of the concrete member that the anchor is attached to is small. Among the aforementioned recognized failure modes, ACI 318-19 [47] only provides models to predict the anchor’s capacity for concrete breakout failure and steel failure. Although there are models for the pullout capacity of cast-in-place and adhesive post-installed anchors, the experimental results are only allowed to be used for mechanical expansion anchors.
For an anchor under direct shear, there are three modes of failure, as shown in Figure 5: steel failure proceeded by concrete spalling, concrete pry-out, and concrete breakout. Steel failure occurs if the anchor is embedded at a long depth and sufficiently far from the concrete edge. If the anchor is far from the edge but has shallow depth, pry-out failure may be observed, while for those placed close to the concrete edge, a concrete breakout may occur.
Most formulas were taken from Eligehausen et al. [48], where a comprehensive literature review is presented. In the early studies by Eligehusen and Pusill-Wachtsmuth [49] and Pusill-Wachtsmuth [50] shown in Table 1 for anchor tension breakout, the power of concrete compressive strength, f’c, was obtained as 2/3 from regression analysis but was later modified to 1/2 by Eligehausen et al. [51], which was also used by ACI 349-90 [52] and ACI 318-19 [47]. For concrete breakout strengths of anchors subjected to shear, Paschen and Schonhoff [53] recommended a power of 2/3 for f’c, while other models used 1/2 instead.
The nominal shear strength of anchors failed by concrete for uncracked concrete, Vn, i.e., concrete breakout capacity in shear at anchors, is expressed as follows [25,26]:
V n =   1.0   ( d o f c ) 0.5 l d o 0.2   c 1 1.5   A v A v o   ψ 4   ψ 5   ψ 6   N ,   mm   units
A v =   π π   θ 180 + Sin θ   c 1 2 2
θ =   2 cos 1 h c 1
where Av refers to the actual projected area (base) of the concrete fracture-cone-adjacent side of the concrete member; Avo refers to the idealized projected area (base) of the concrete fracture cone as a half pyramid that equals 3c1 times 1.5c1, in which c1 is the edge distance in the loading direction (equals the greater of c2/1.5 and h/1.5 for anchors in concrete member with c2 < 1.5c1 and h < 1.5c1); c2 is the edge distance perpendicular to the loading direction; h is the thickness of the concrete member; do stands for the outside diameter of the anchor; fc is the concrete compressive strength; l is the activated bearing length of an anchor ≤ 8do (l equals anchor effective embedment for anchors with constant overall stiffness, and 2do is for expansion anchors with separated spacing and expansion sleeves); ψ4 refers to the modification factor accounts for eccentrically loaded groups of anchors (considered, herein, 1.0 for single loaded anchor); ψ5 refers to the modification factor accounts for the disturbance of stress distribution at the concrete member corners (equals 1.0 if c2 ≥ 1.5c1 and 0.7 + 0.3(c2/1.5c1) if c2 ≤ 1.5c1); and ψ6 refers to the modification factor accounts for the absence or control of cracking (considered, herein, 1.0 for uncracked concrete).
Also, the nominal tensile strength of anchors failed by concrete for uncracked concrete, Nn, is expressed as follows [40,47,52]:
N n =   k   f c   h e f 2 1 + h e f 50   N , mm units
where hef refers to the anchor’s effective embedment; and k is 2.75 and 2.5 for undercut and cast-in-place anchors, and wedge and sleeve expansion anchors, respectively.

4. Experimental Program

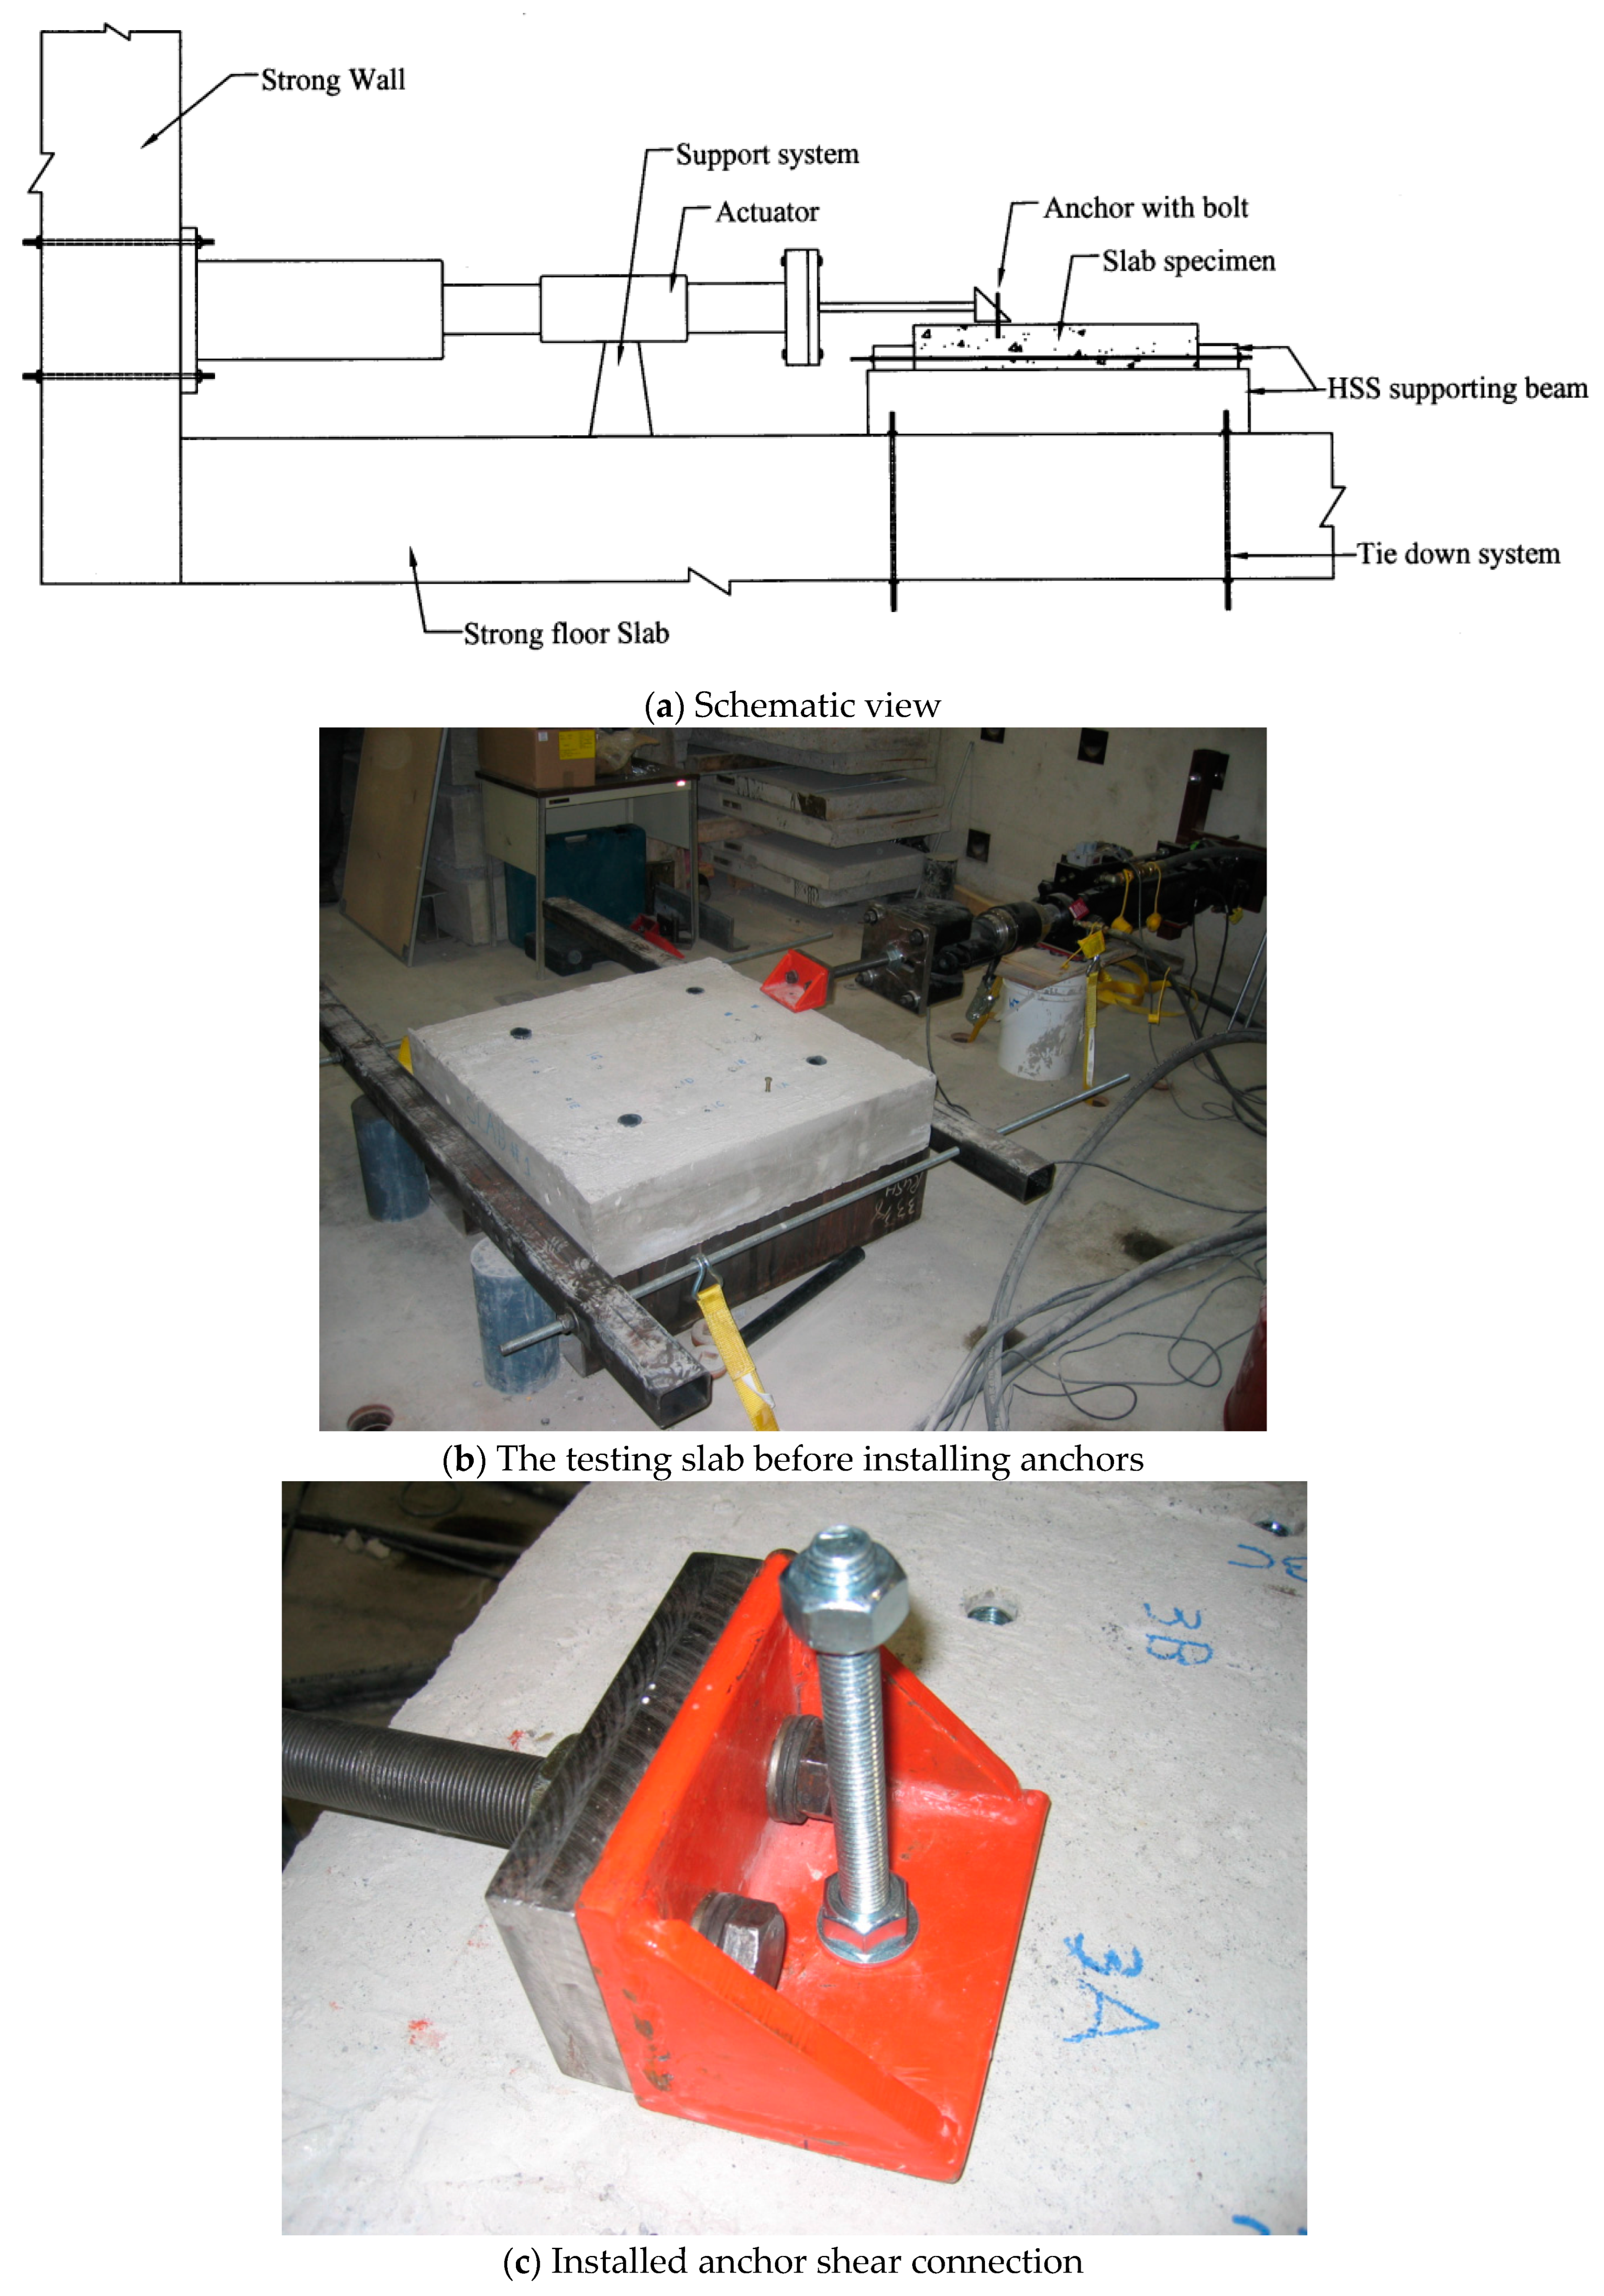
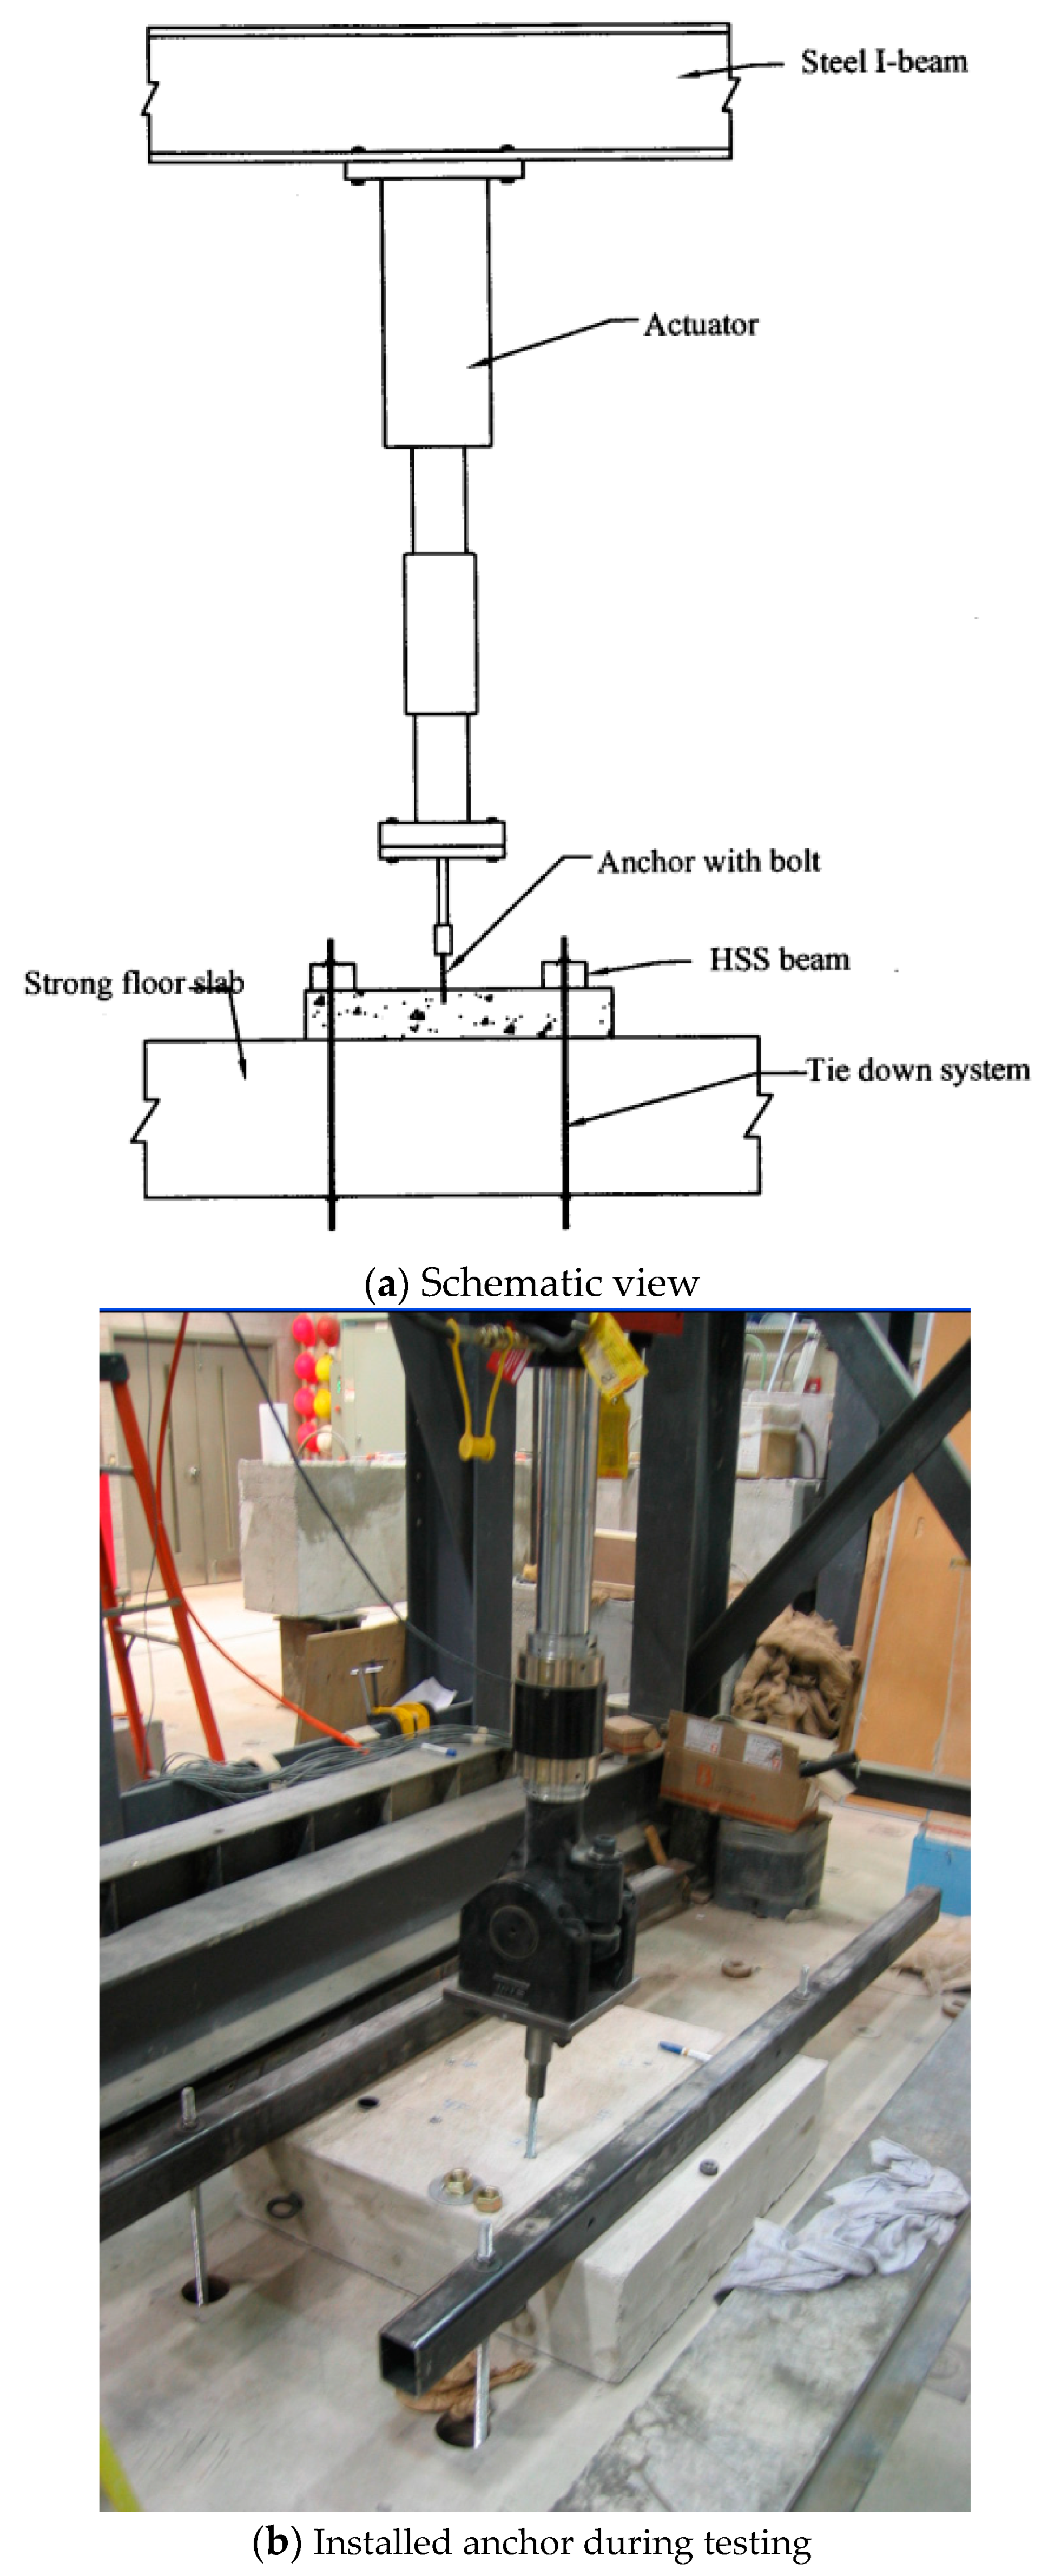
Tests were conducted on single anchors with three different sizes, namely 9.5 mm, 12.7 mm, and 15.9 mm, with lengths of 38 mm, 50 mm, and 64 mm, respectively, as shown in Figure 1. Six square un-reinforced concrete slab specimens were constructed for anchor installation, with a 900 mm length and 200 mm thickness. The average concrete compressive strength of concrete was recorded as 26 MPa. Figure 6 shows the setup for both ultimate and cyclic shear loading tests. An HSS steel framing system was constructed to tie the specimens horizontally against actuator movements. Also, a tie down system was used to fix the system to the structural laboratory floor for the tension tests, as shown in Figure 7.
The anchors were installed in slab specimens having a minimum edge distance of 200 mm following the manufacturer’s instructions [6]. Preliminary static load tests were carried out to determine the anchor’s reference ultimate load-carrying capacity, the loading amplitude for cyclic tests, and the test setup. Then, cyclic (reversed) load tests were carried out to determine the seismic capacity of the anchors, followed by ultimate load testing. Two types of cyclic tests were conducted for each anchor size, namely, the cyclic shear test and the cyclic tension test. According to the American standards [2,45,46], the following testing protocols were considered through the conducted experimental work:
  • Anchors are subjected to simulated pulsating sinusoidal seismic cycles, as detailed in Figure 8a for shear, and simulated alternating sinusoidal seismic cycles, as detailed in Figure 8b for tension. For the present testing, the full shear load was applied through the half-sine cycles.
  • The loading frequency is to be in the range of 0.1 to 2.0 Hz.
  • Each seismic cycle test must consist of at least 5 identical anchors.
  • A reference ultimate static load for shear and tension is to be established to determine the loading amplitude for cyclic tests.
  • After the seismic cycles are completed, each anchor is loaded in tension and shear, as applicable, to its ultimate capacity.
As per the anchor manufacturer’s technical manual UCAN [6], the ultimate load-carrying capacities of the anchors, in shear and tension, Vu and Nu, respectively, were determined based on the concrete strength of 26 MPa. The load level for the first 10 cycles was 50% of the ultimate load, while the load level for the following 30 cycles was 37.5% of the ultimate load. The load level of the last 100 cycles was taken as 25% of the ultimate load. For the tension tests, each anchor was tested under two load frequency values of 0.1 Hz and 2.0 Hz. For the shear tests, the 9.5 mm anchor was tested at frequencies of 0.1 and 2.0, while the 12.7 mm and 15.9 mm anchors were tested at frequencies of 0.1 and 1.2 Hz. During the test, the applied load and the axial displacement of the actuator as either shear or tensile displacement of the anchor were recorded.

5. Experimental Results

5.1. Cyclic Shear Load Test Results

A total of 27 cyclic shear load tests were performed. For the 9.5 mm anchors, five tests were conducted at a 0.1 Hz load frequency, and the other five tests were conducted at a 2.0 Hz load frequency. For the 12.7 mm anchors, six tests were conducted at a 0.1 Hz load frequency, and the other four tests were conducted at a 1.2 Hz load frequency. For the 15.9 mm anchors, four tests were conducted at a 0.1 Hz load frequency, and the other three tests were conducted at a 1.2 Hz load frequency. Table 2 summarizes the load data for cyclic shear tests. One may observe that the 15.9 mm anchor achieved the highest cyclic shear test load compared to other anchors. The cyclic shear test load of the 15.9 mm anchor at 10 cycles is 117% and 67% higher than 9.5 mm and 12.7 mm anchors, respectively. Similarly, at 30 and 100 cycles, the 15.9 mm anchor obtained 126% and 141% higher cyclic shear test loads than the 9.5 mm anchor, respectively.
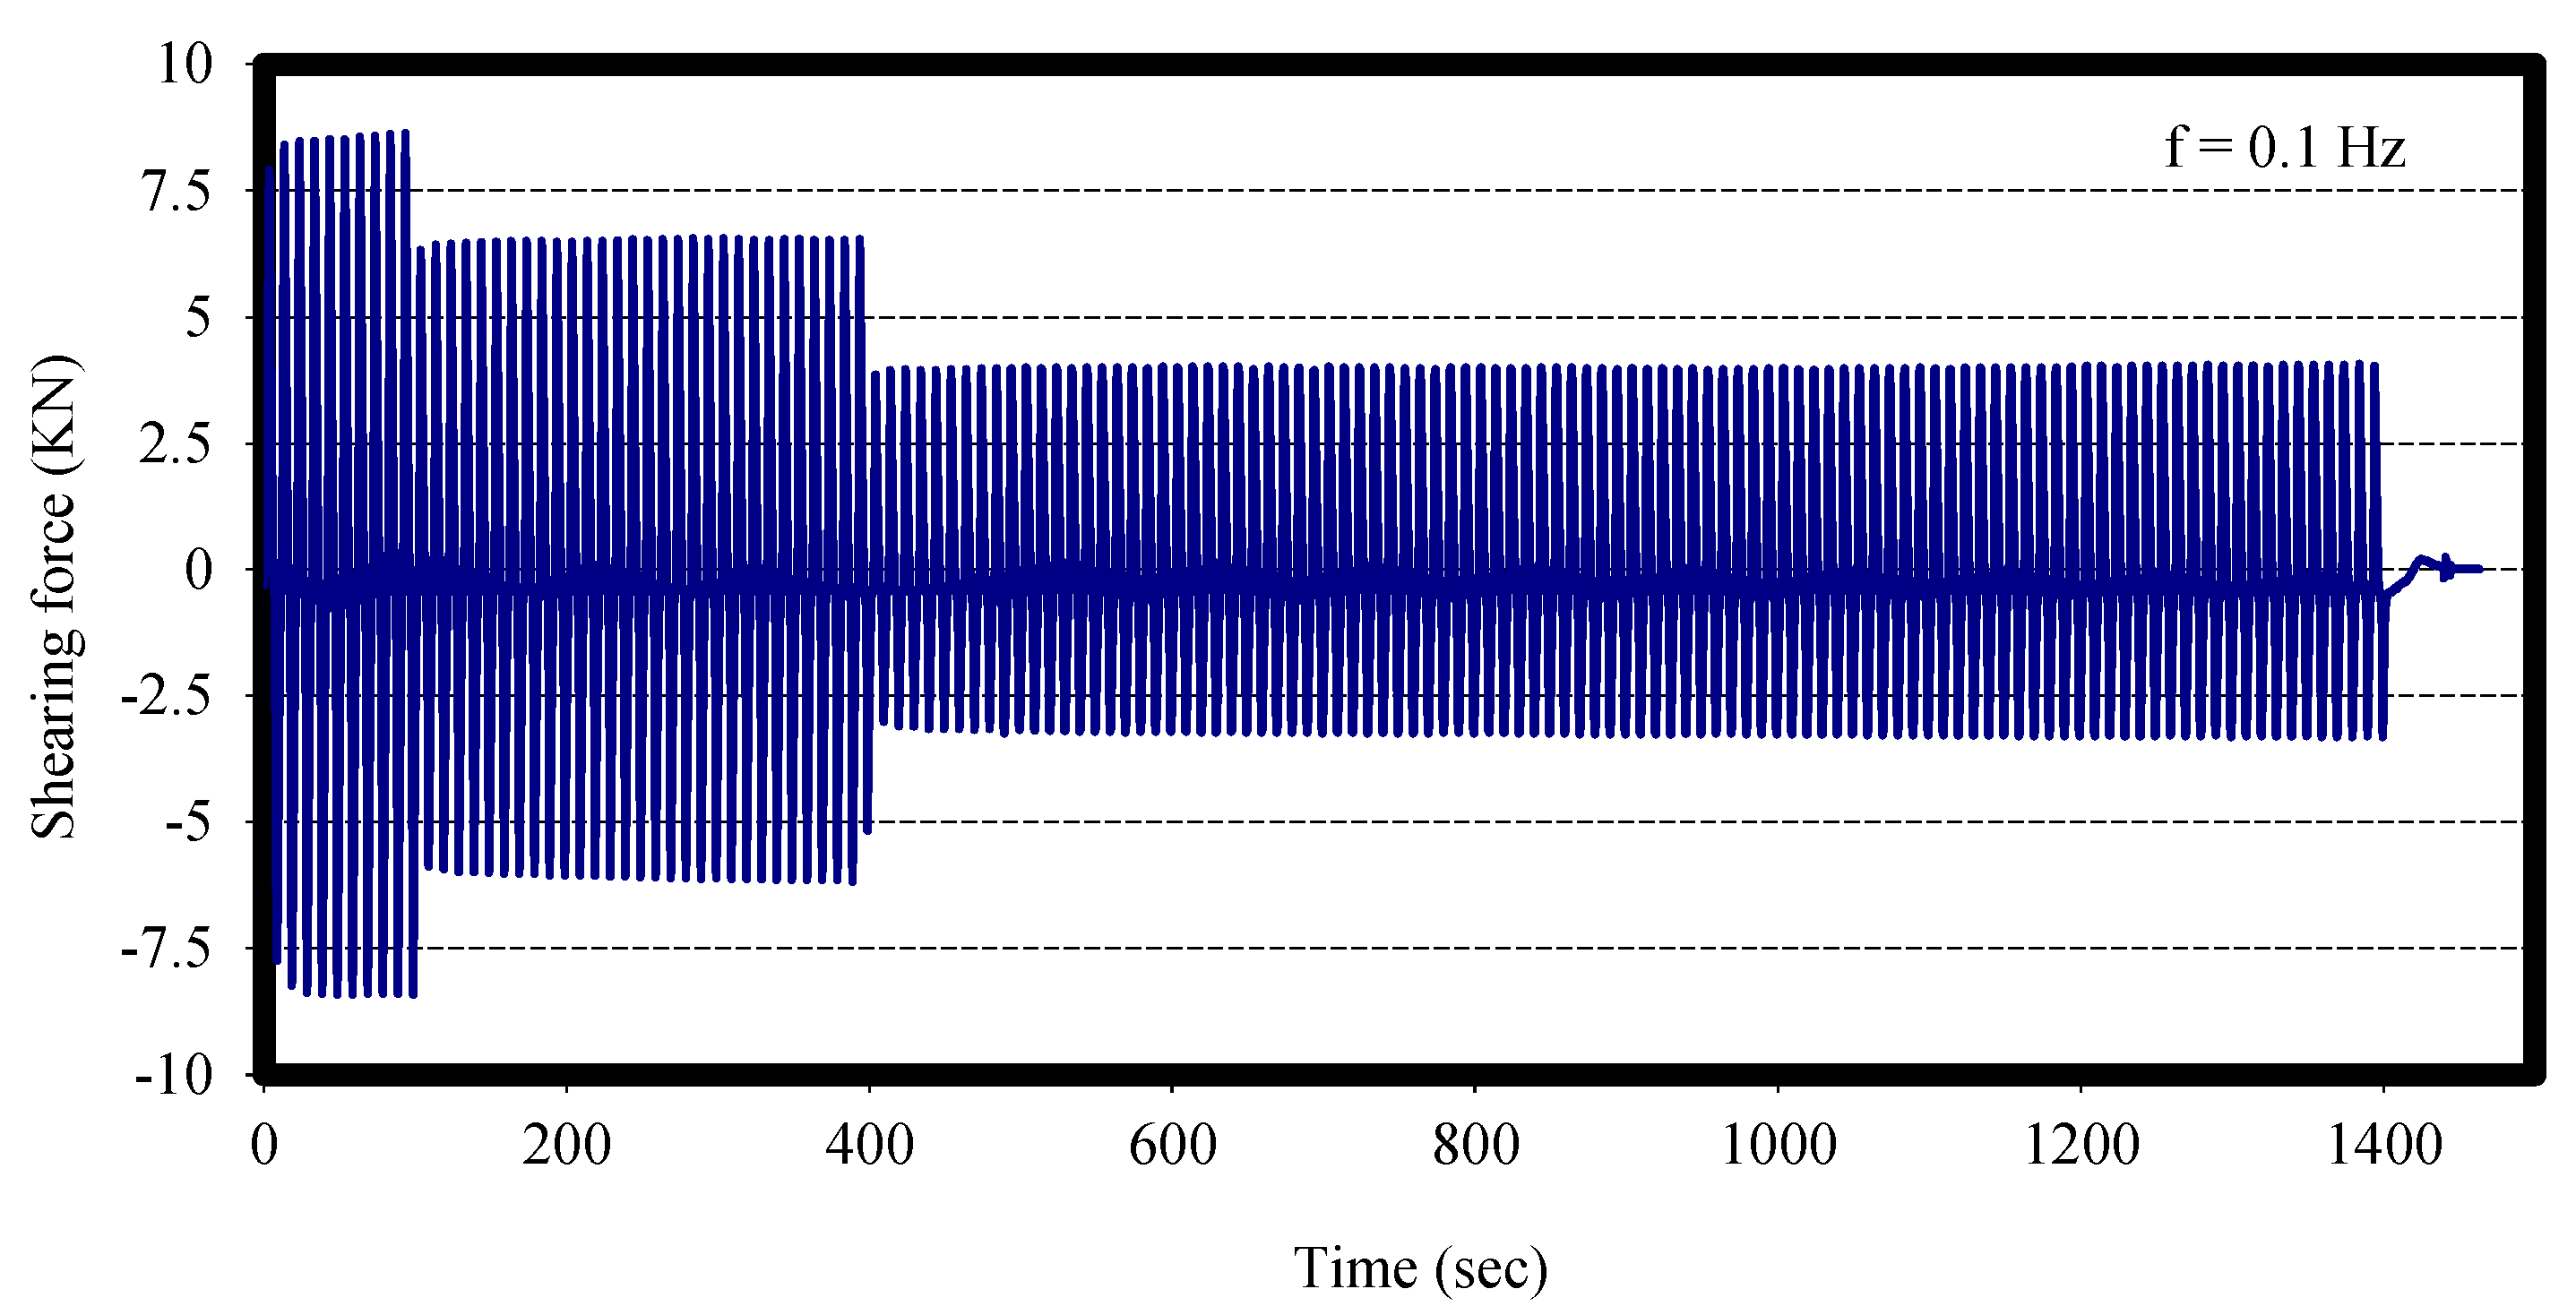
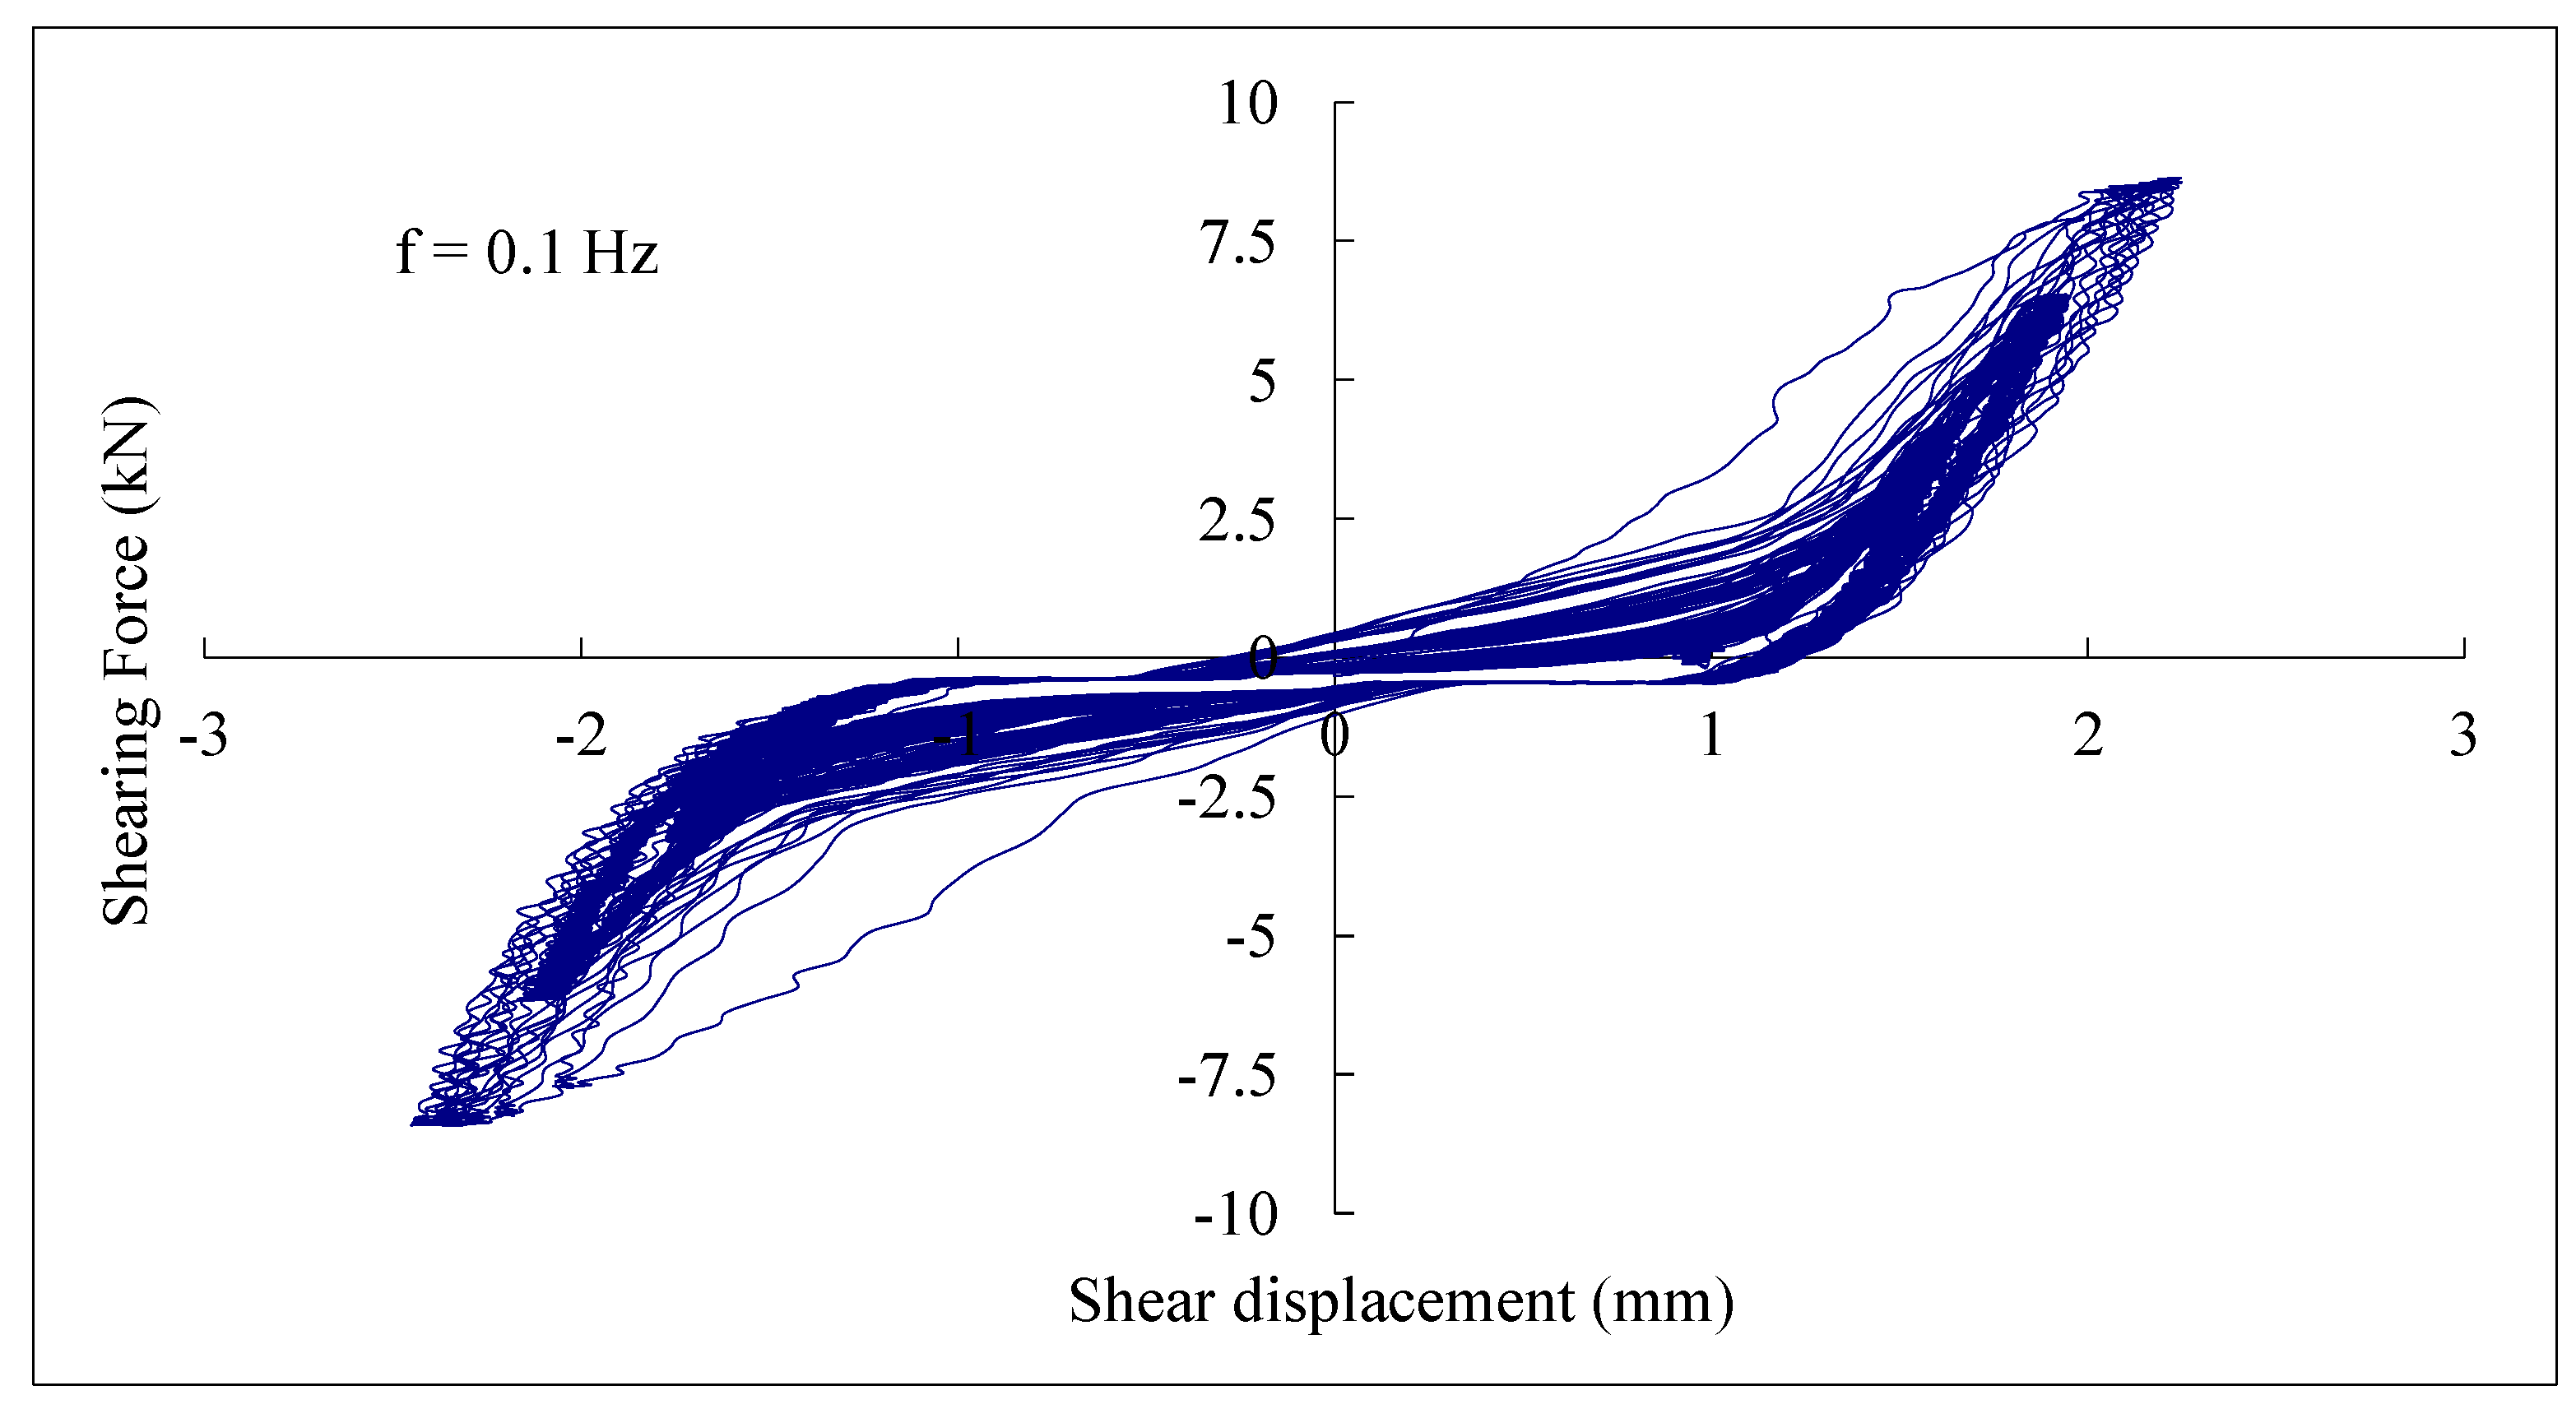
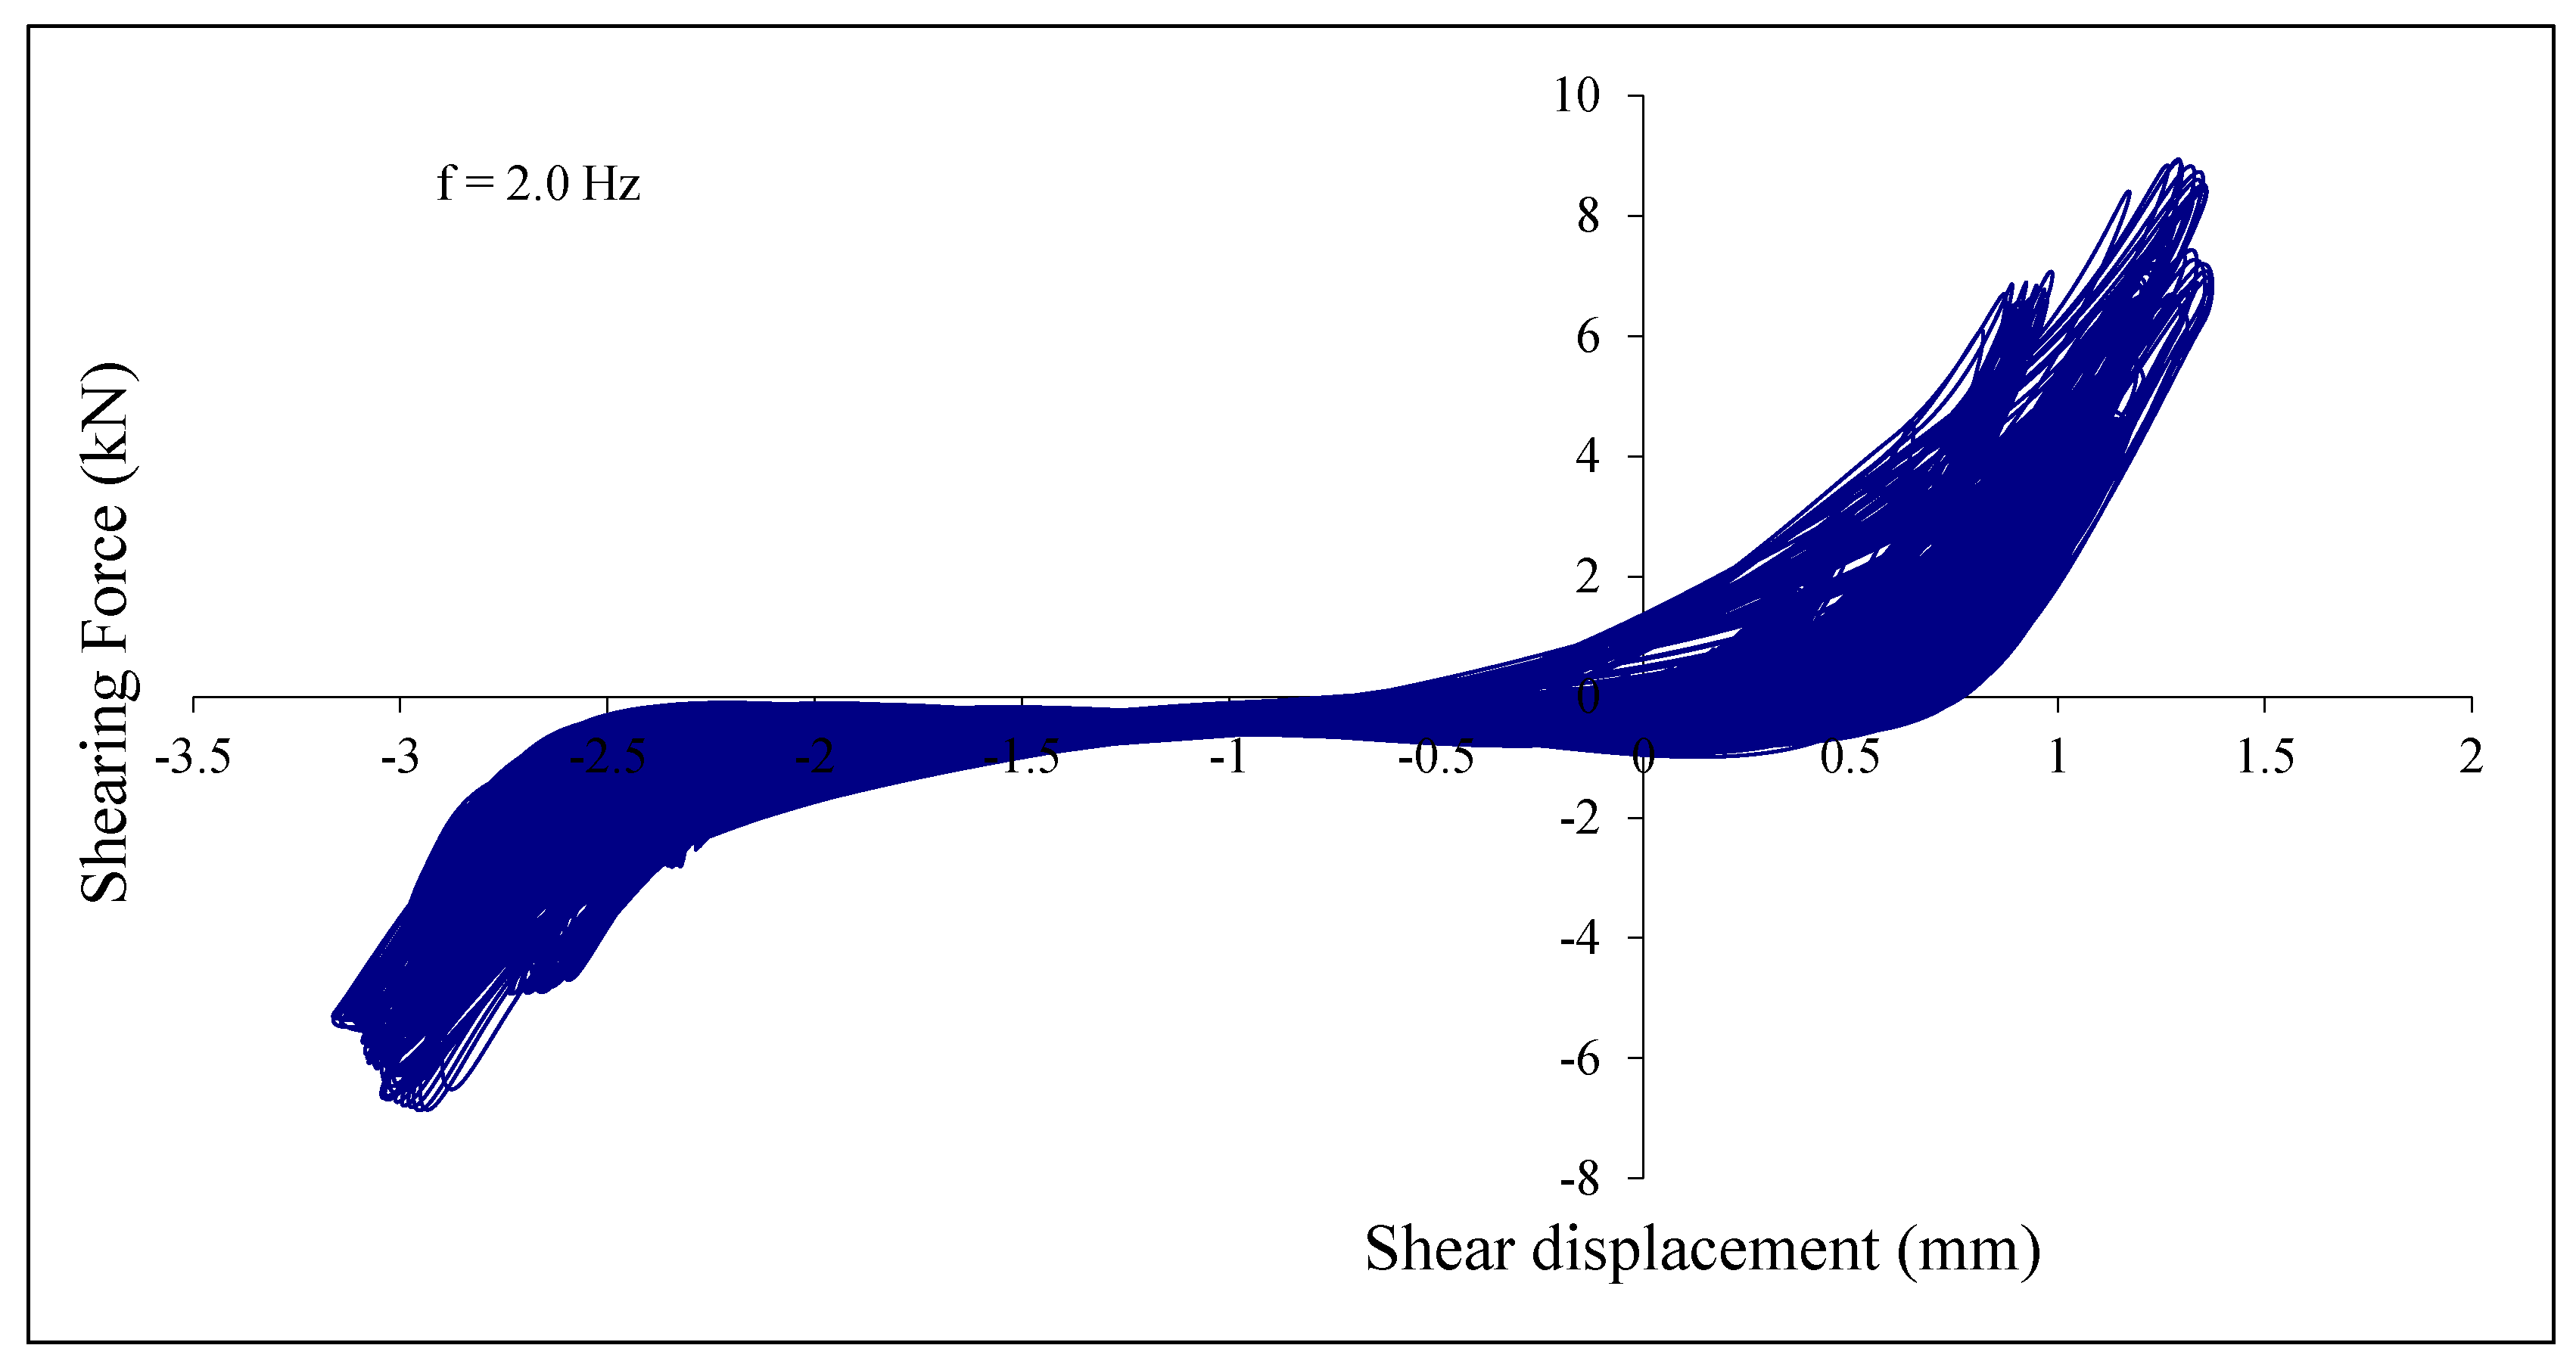
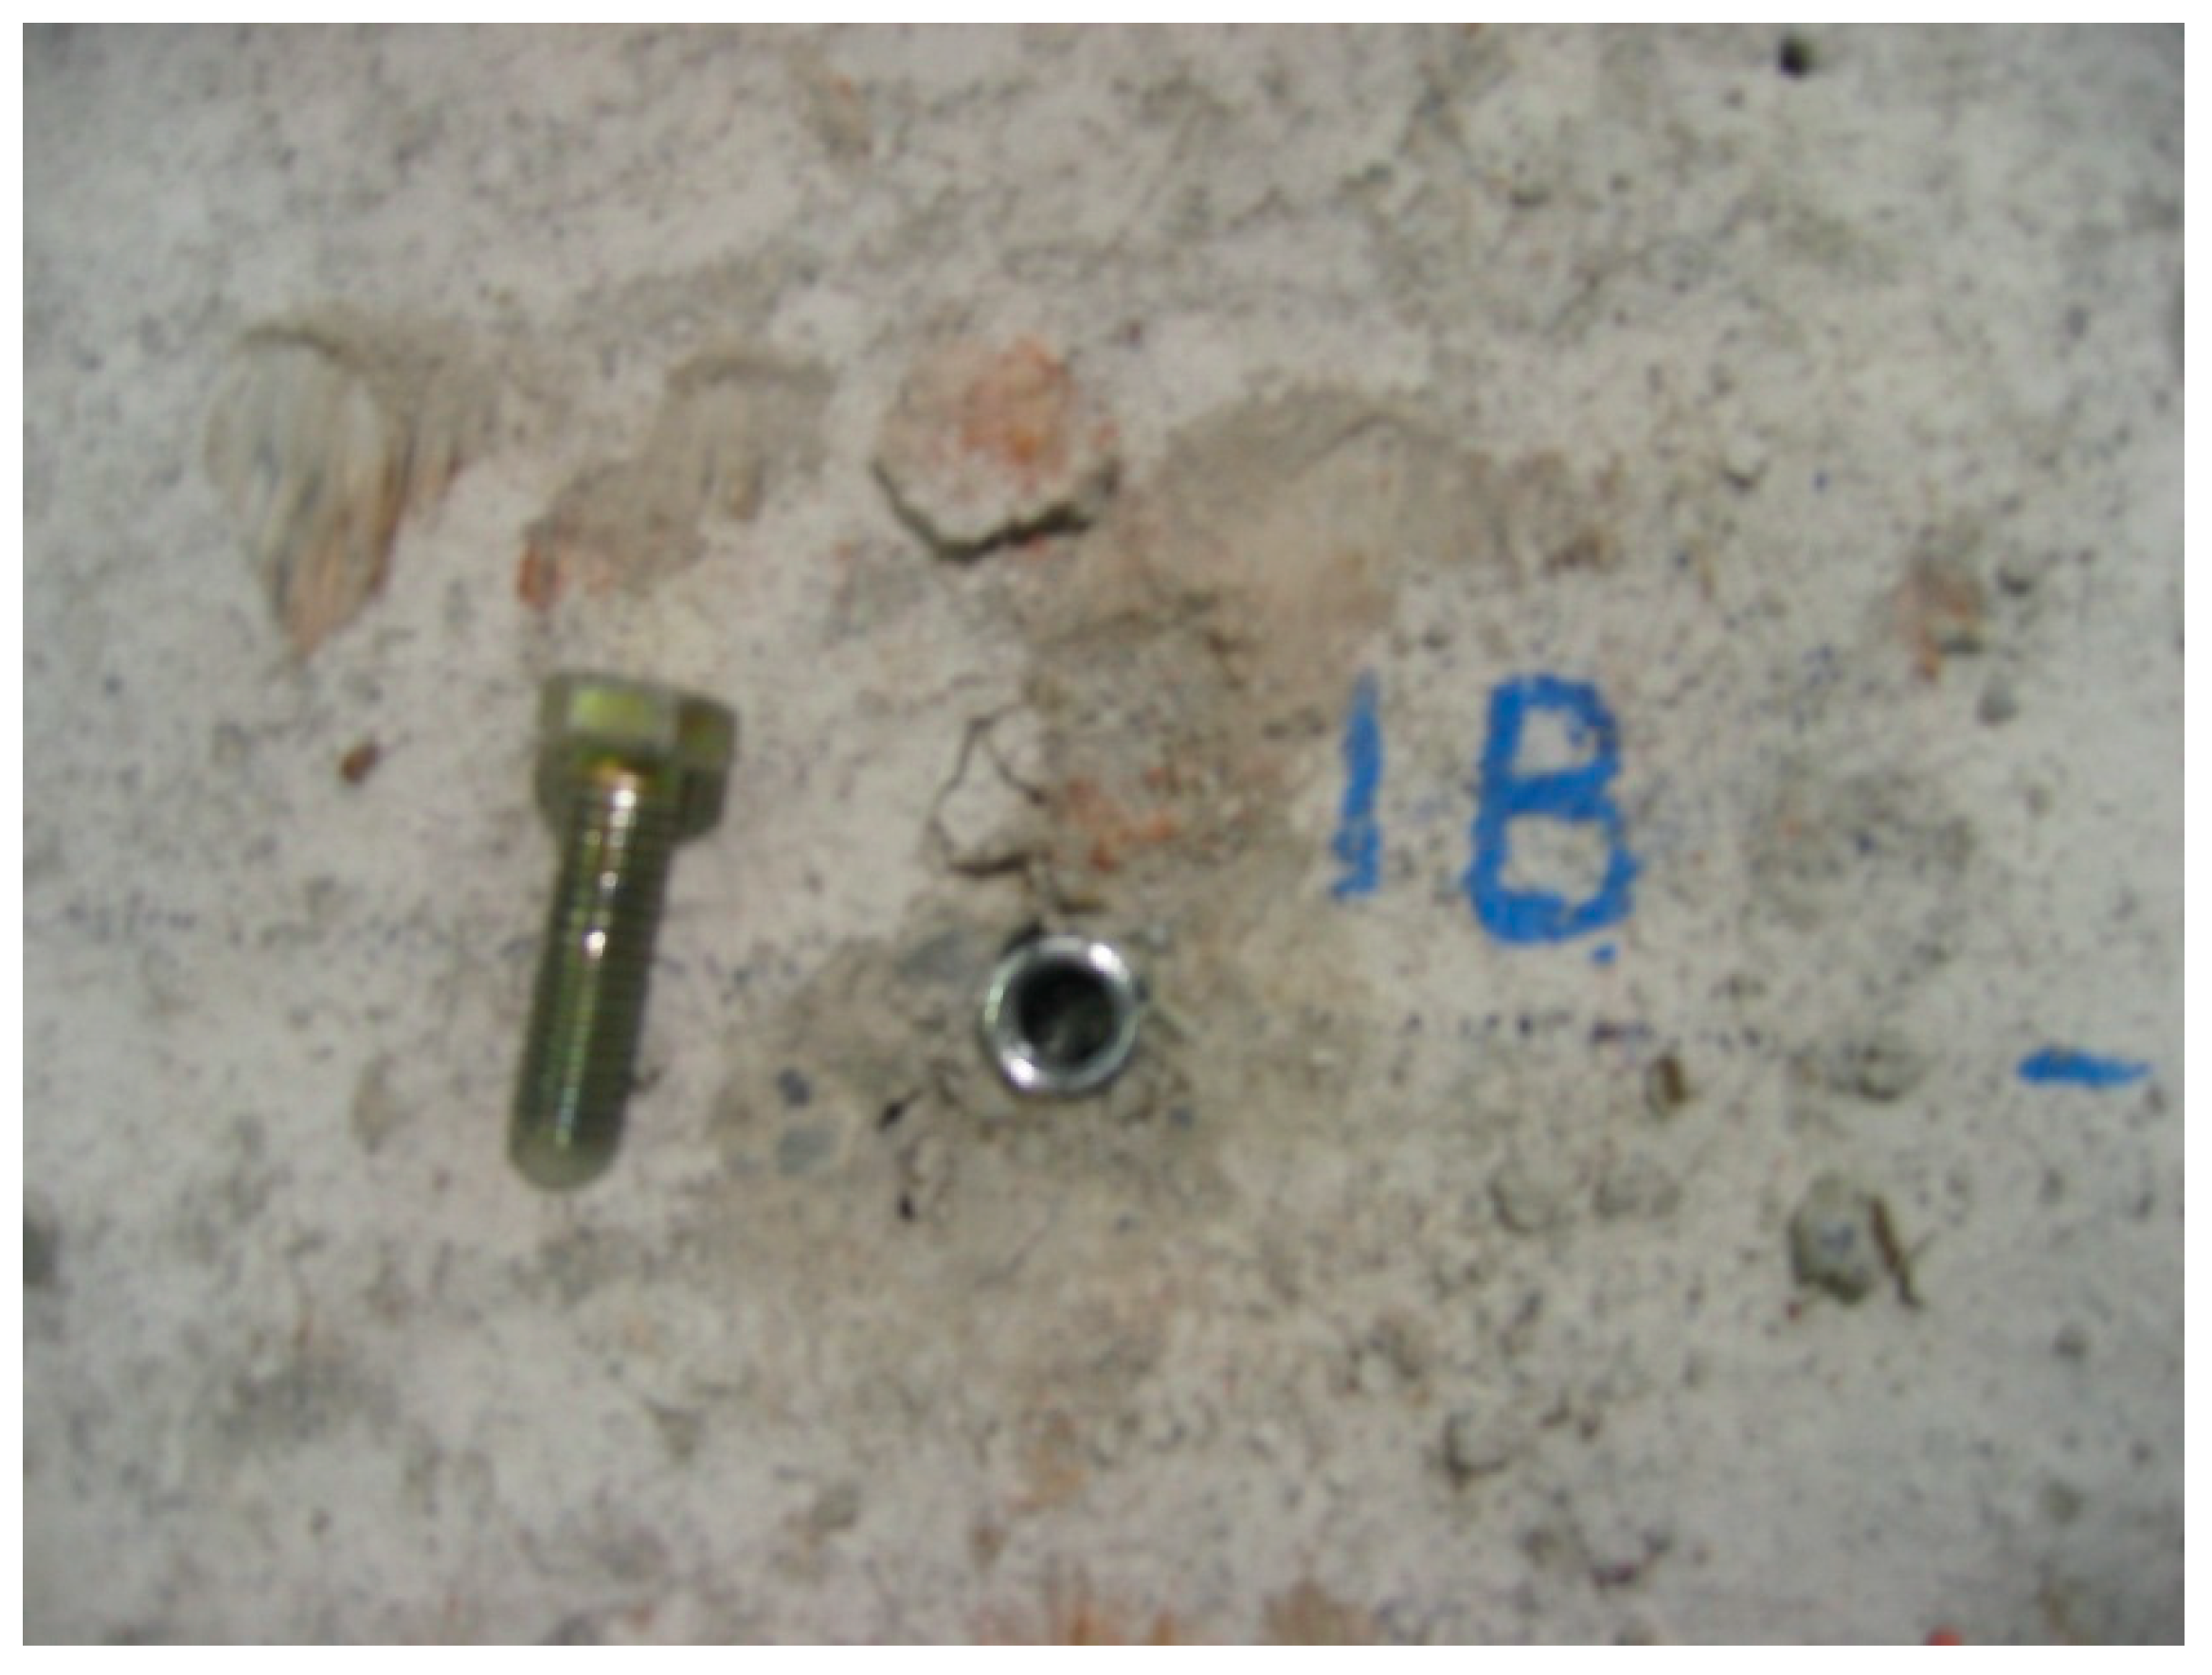
Figure 9 depicts the cyclic shear load-time history, where it can be seen that the tested anchors showed a stable response over time. The shear force decreased from approximately 8.2 kN at 95 s to 6.2 kN and remained stable until 394 s, when the shear force decreased to 3.9 kN and remained constant until the end of the test. Figure 10 and Figure 11 (the Y-axis is shifted by 0.75 mm along the X-axis) represent the load–shear displacement relationship for a tested 9.5 mm anchor at 0.1 Hz and 2.0 Hz, respectively. It is seen that the load–shear displacement relationship changed from symmetric to asymmetric as the load intensity increased from 0.1 Hz to 2 Hz. The typical failure modes of the anchors after cyclic shear tests are shown in Figure 12 and Figure 13. The typical failure mode of concrete was concrete breakout close to the anchor zone, similar to the one predicted by ACI 355.2-04. It was observed that the 9.5 and 12.7 mm anchors maintained their shear capacity at the end of the cyclic load tests; no shear failure was observed. However, for the 15.9 mm anchors, some tests did not pass successfully, as a fracture occurred in the threaded bar connecting the anchor to the actuator’s fixture. However, this needs to be verified again in the future.

5.2. Cyclic Tension Test Results

Fifteen cyclic tension load tests were carried out on drop-in anchors. For each anchor size, two tests were conducted at a 0.1 Hz load frequency, and the other three were conducted at 2.0 Hz. Table 3 summarizes the load data for cyclic tension tests. It is seen that the 15.9 mm anchor exhibited an increase in the tension test load by 119% and 39% compared to the 9.5 mm and 12.7 mm anchors, respectively. Also, the cyclic tension test load of the 15.9 mm anchor at 100 cycles is 130% and 40% higher than 9.5 mm and 12.7 mm anchors, respectively.
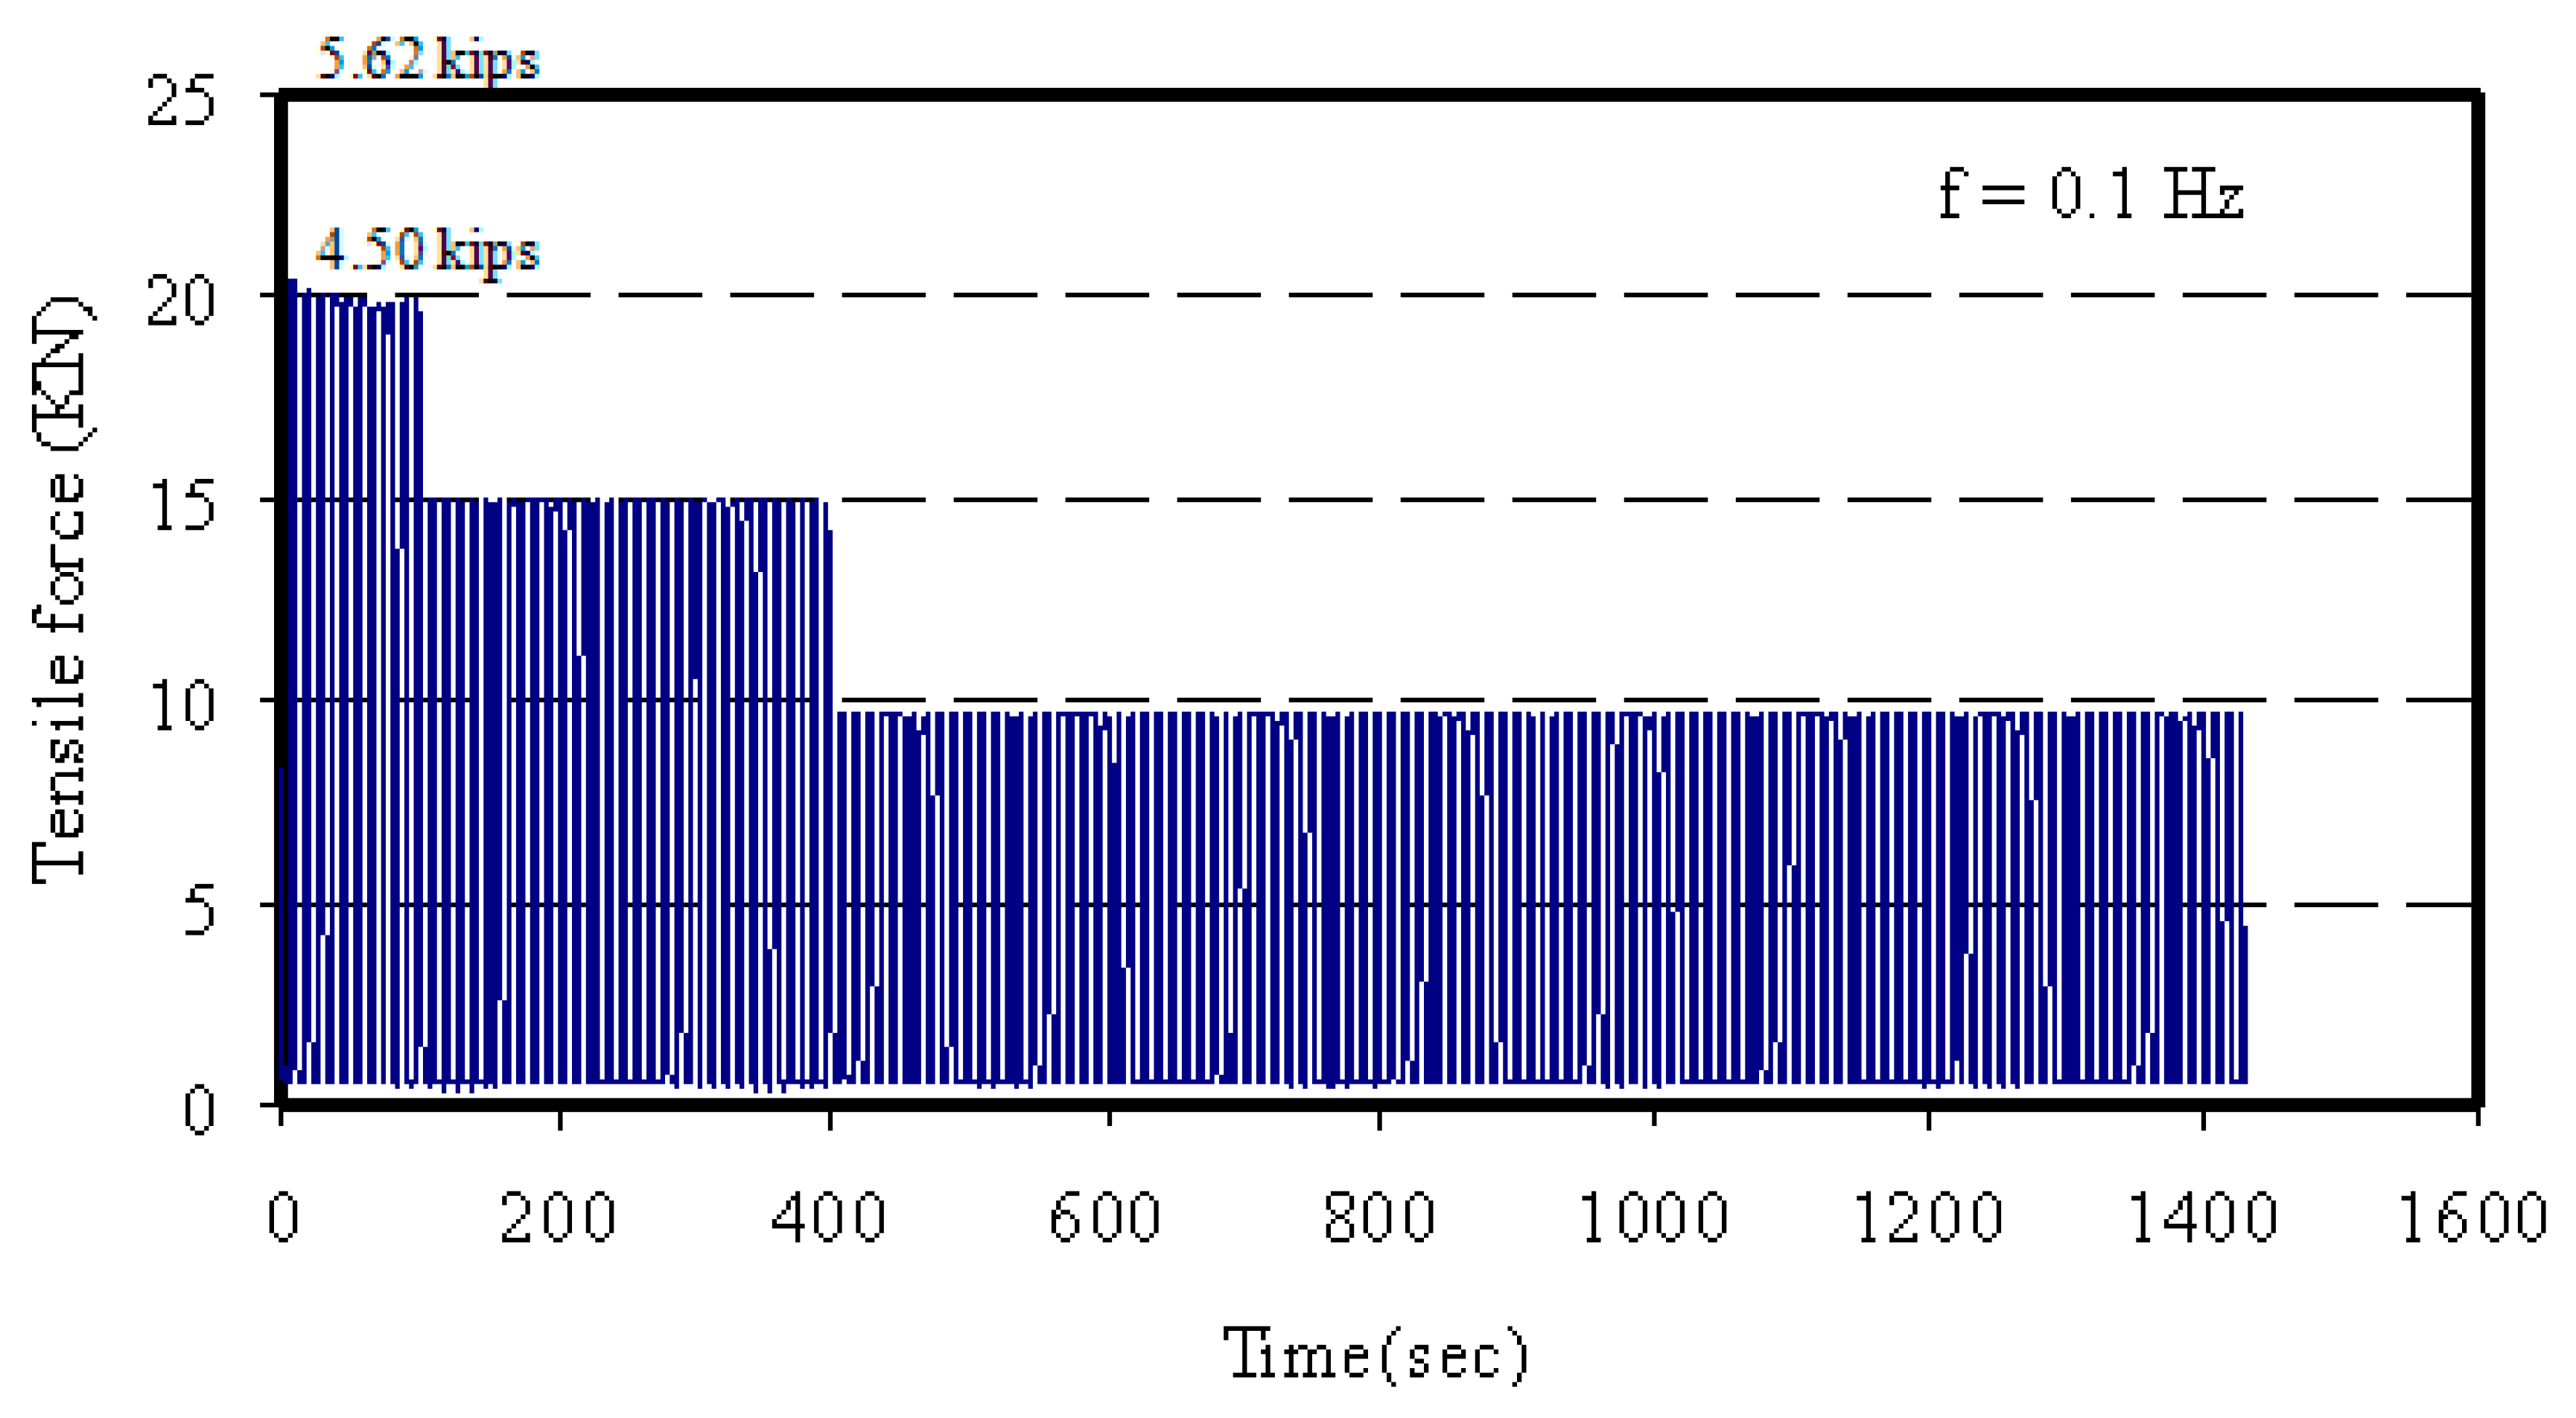
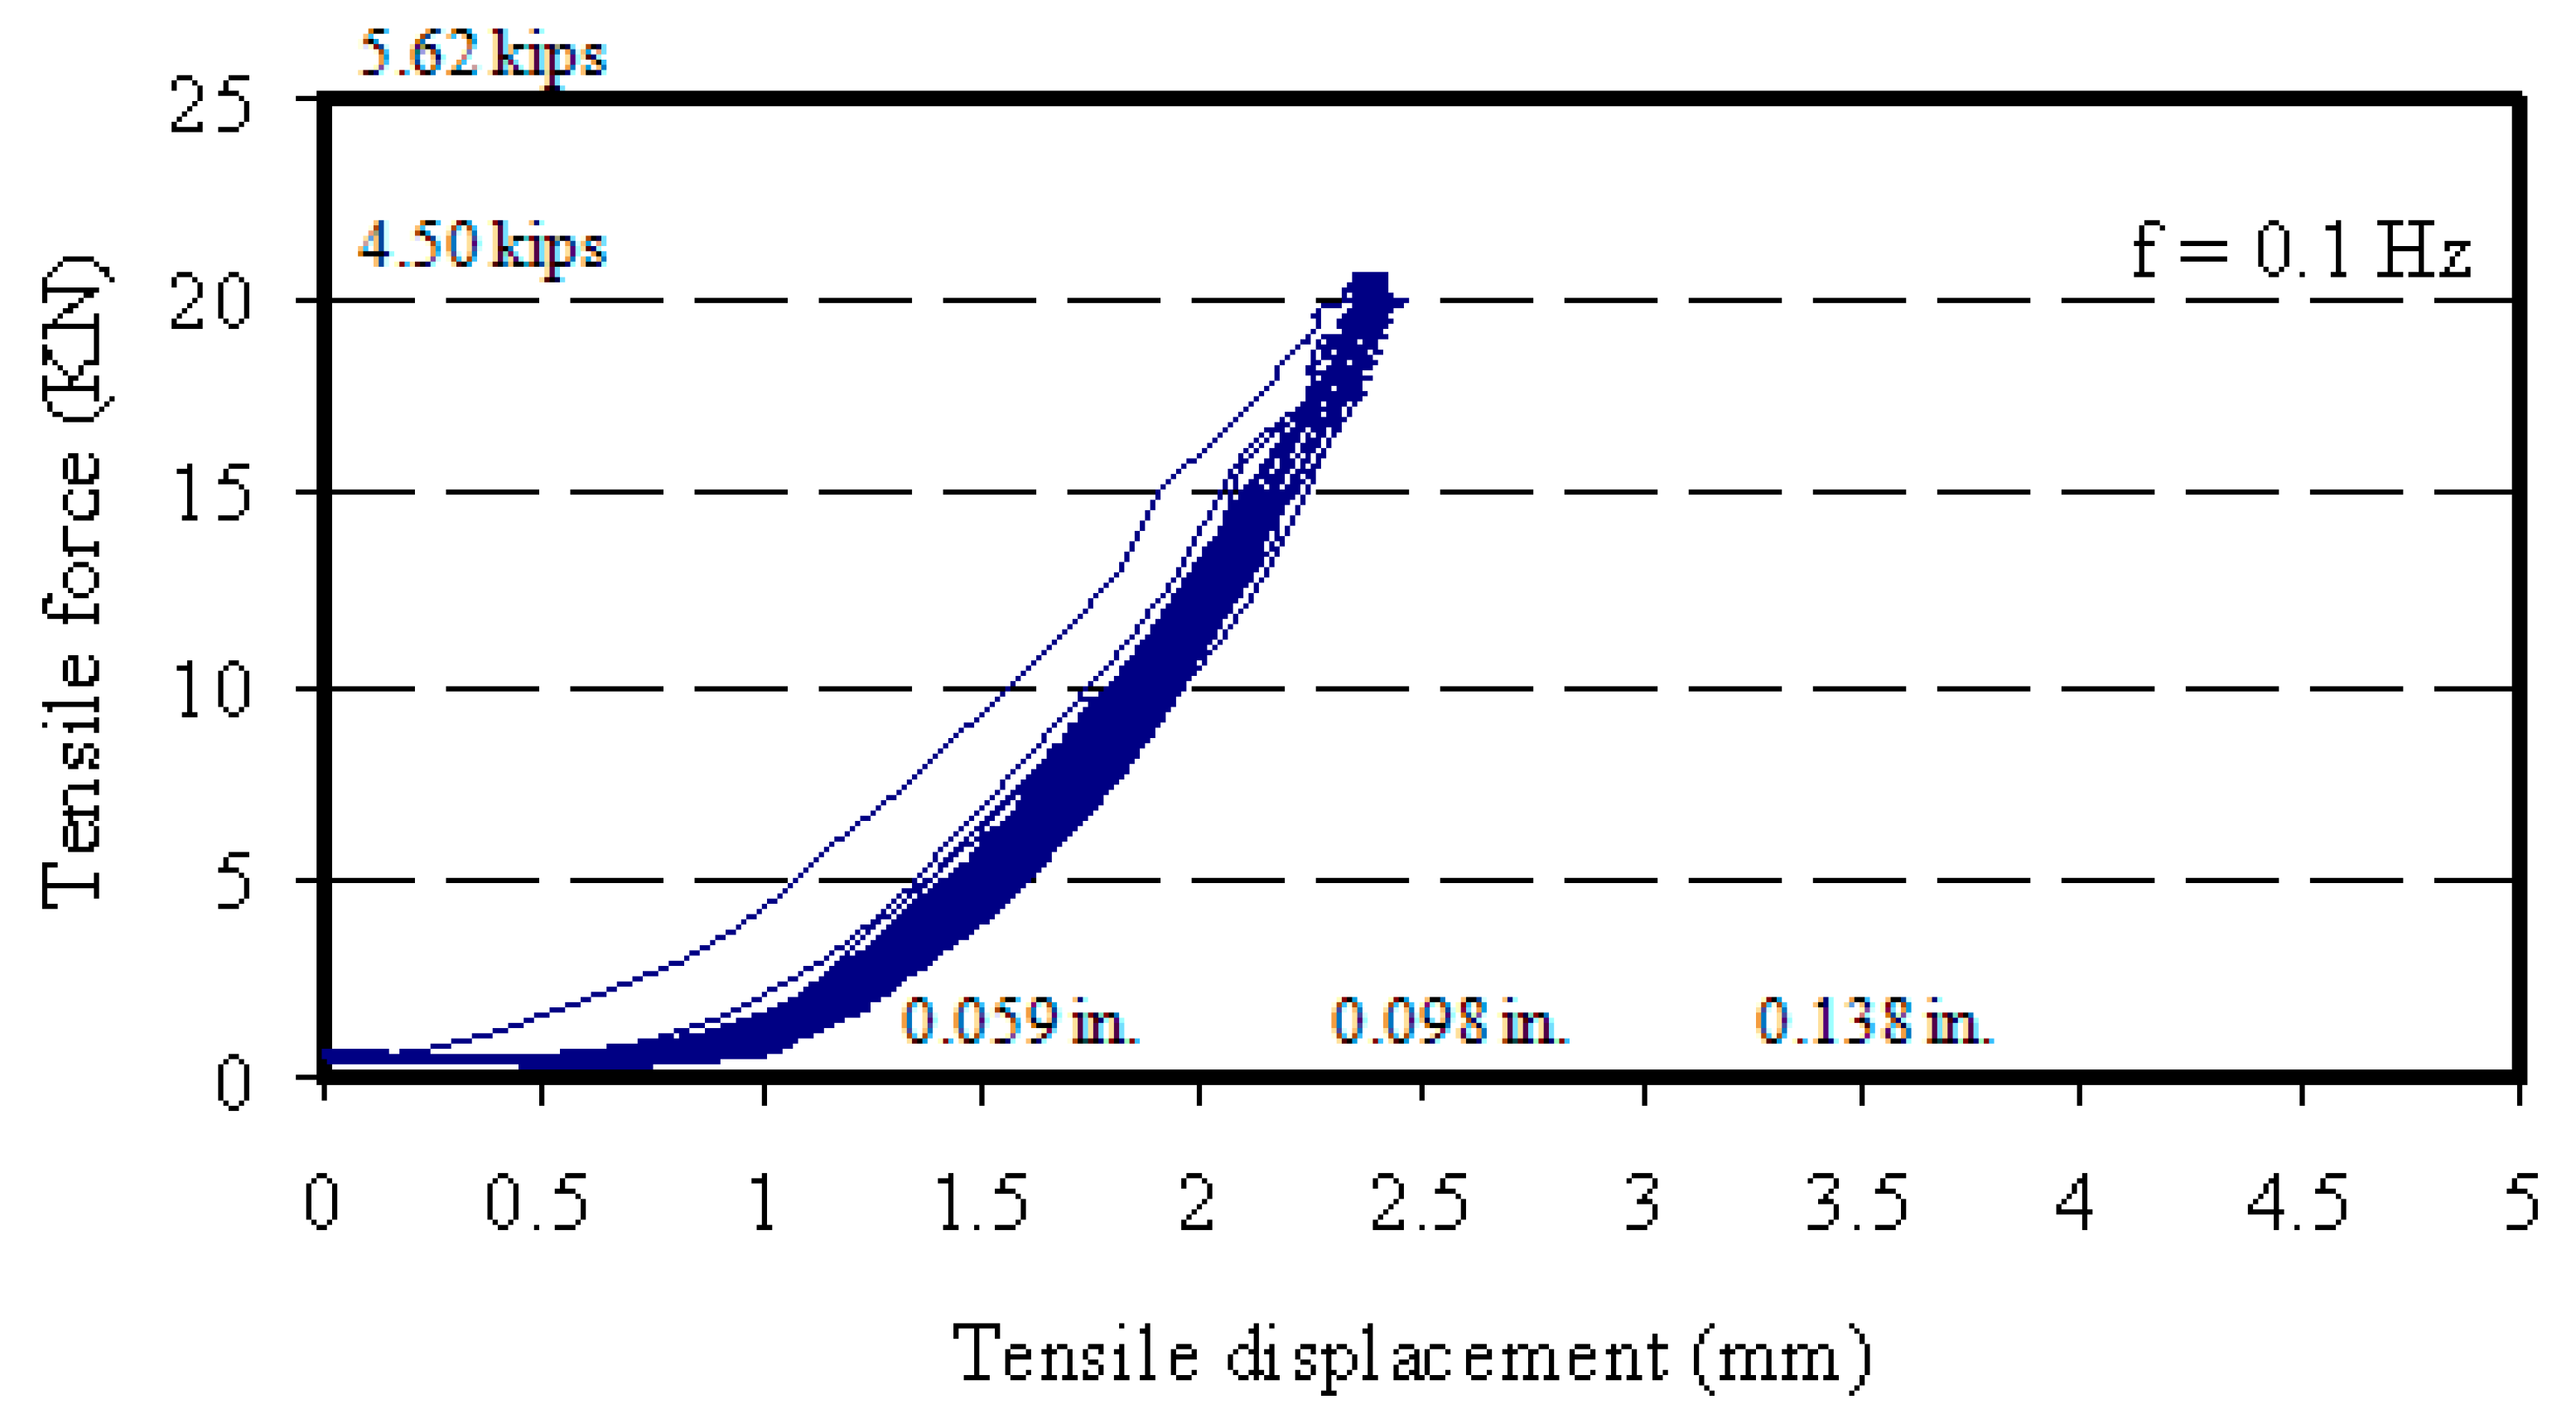
Figure 14 and Figure 15 show the cyclic load history applied on a 15.9 mm anchor at a frequency of 0.1 Hz and the corresponding load–axial displacement relationship, respectively. A considerable degradation of force–response for all anchors was observed, as shown in Figure 14. The tensile force decreased to 15 kN at the 100th s and then to 10 kN at the 200th s and remained constant until the end of the test. As shown in Figure 15, about a 0.5 mm slip took place at the beginning of the test to ensure the full engagement of the testing machine with the tested anchor before applying the load cycles. The force–displacement relationship obtained during the test represents a typical sample’s behavior under such loading conditions. It was observed for all the tested anchors that no tension failure occurred at the end of the cyclic load tests, i.e., all anchors maintained their tension capacity. Also, each anchor’s residual inelastic maximum displacement at the end of the cyclic tension test was relatively small.

5.3. Ultimate Load Test Results

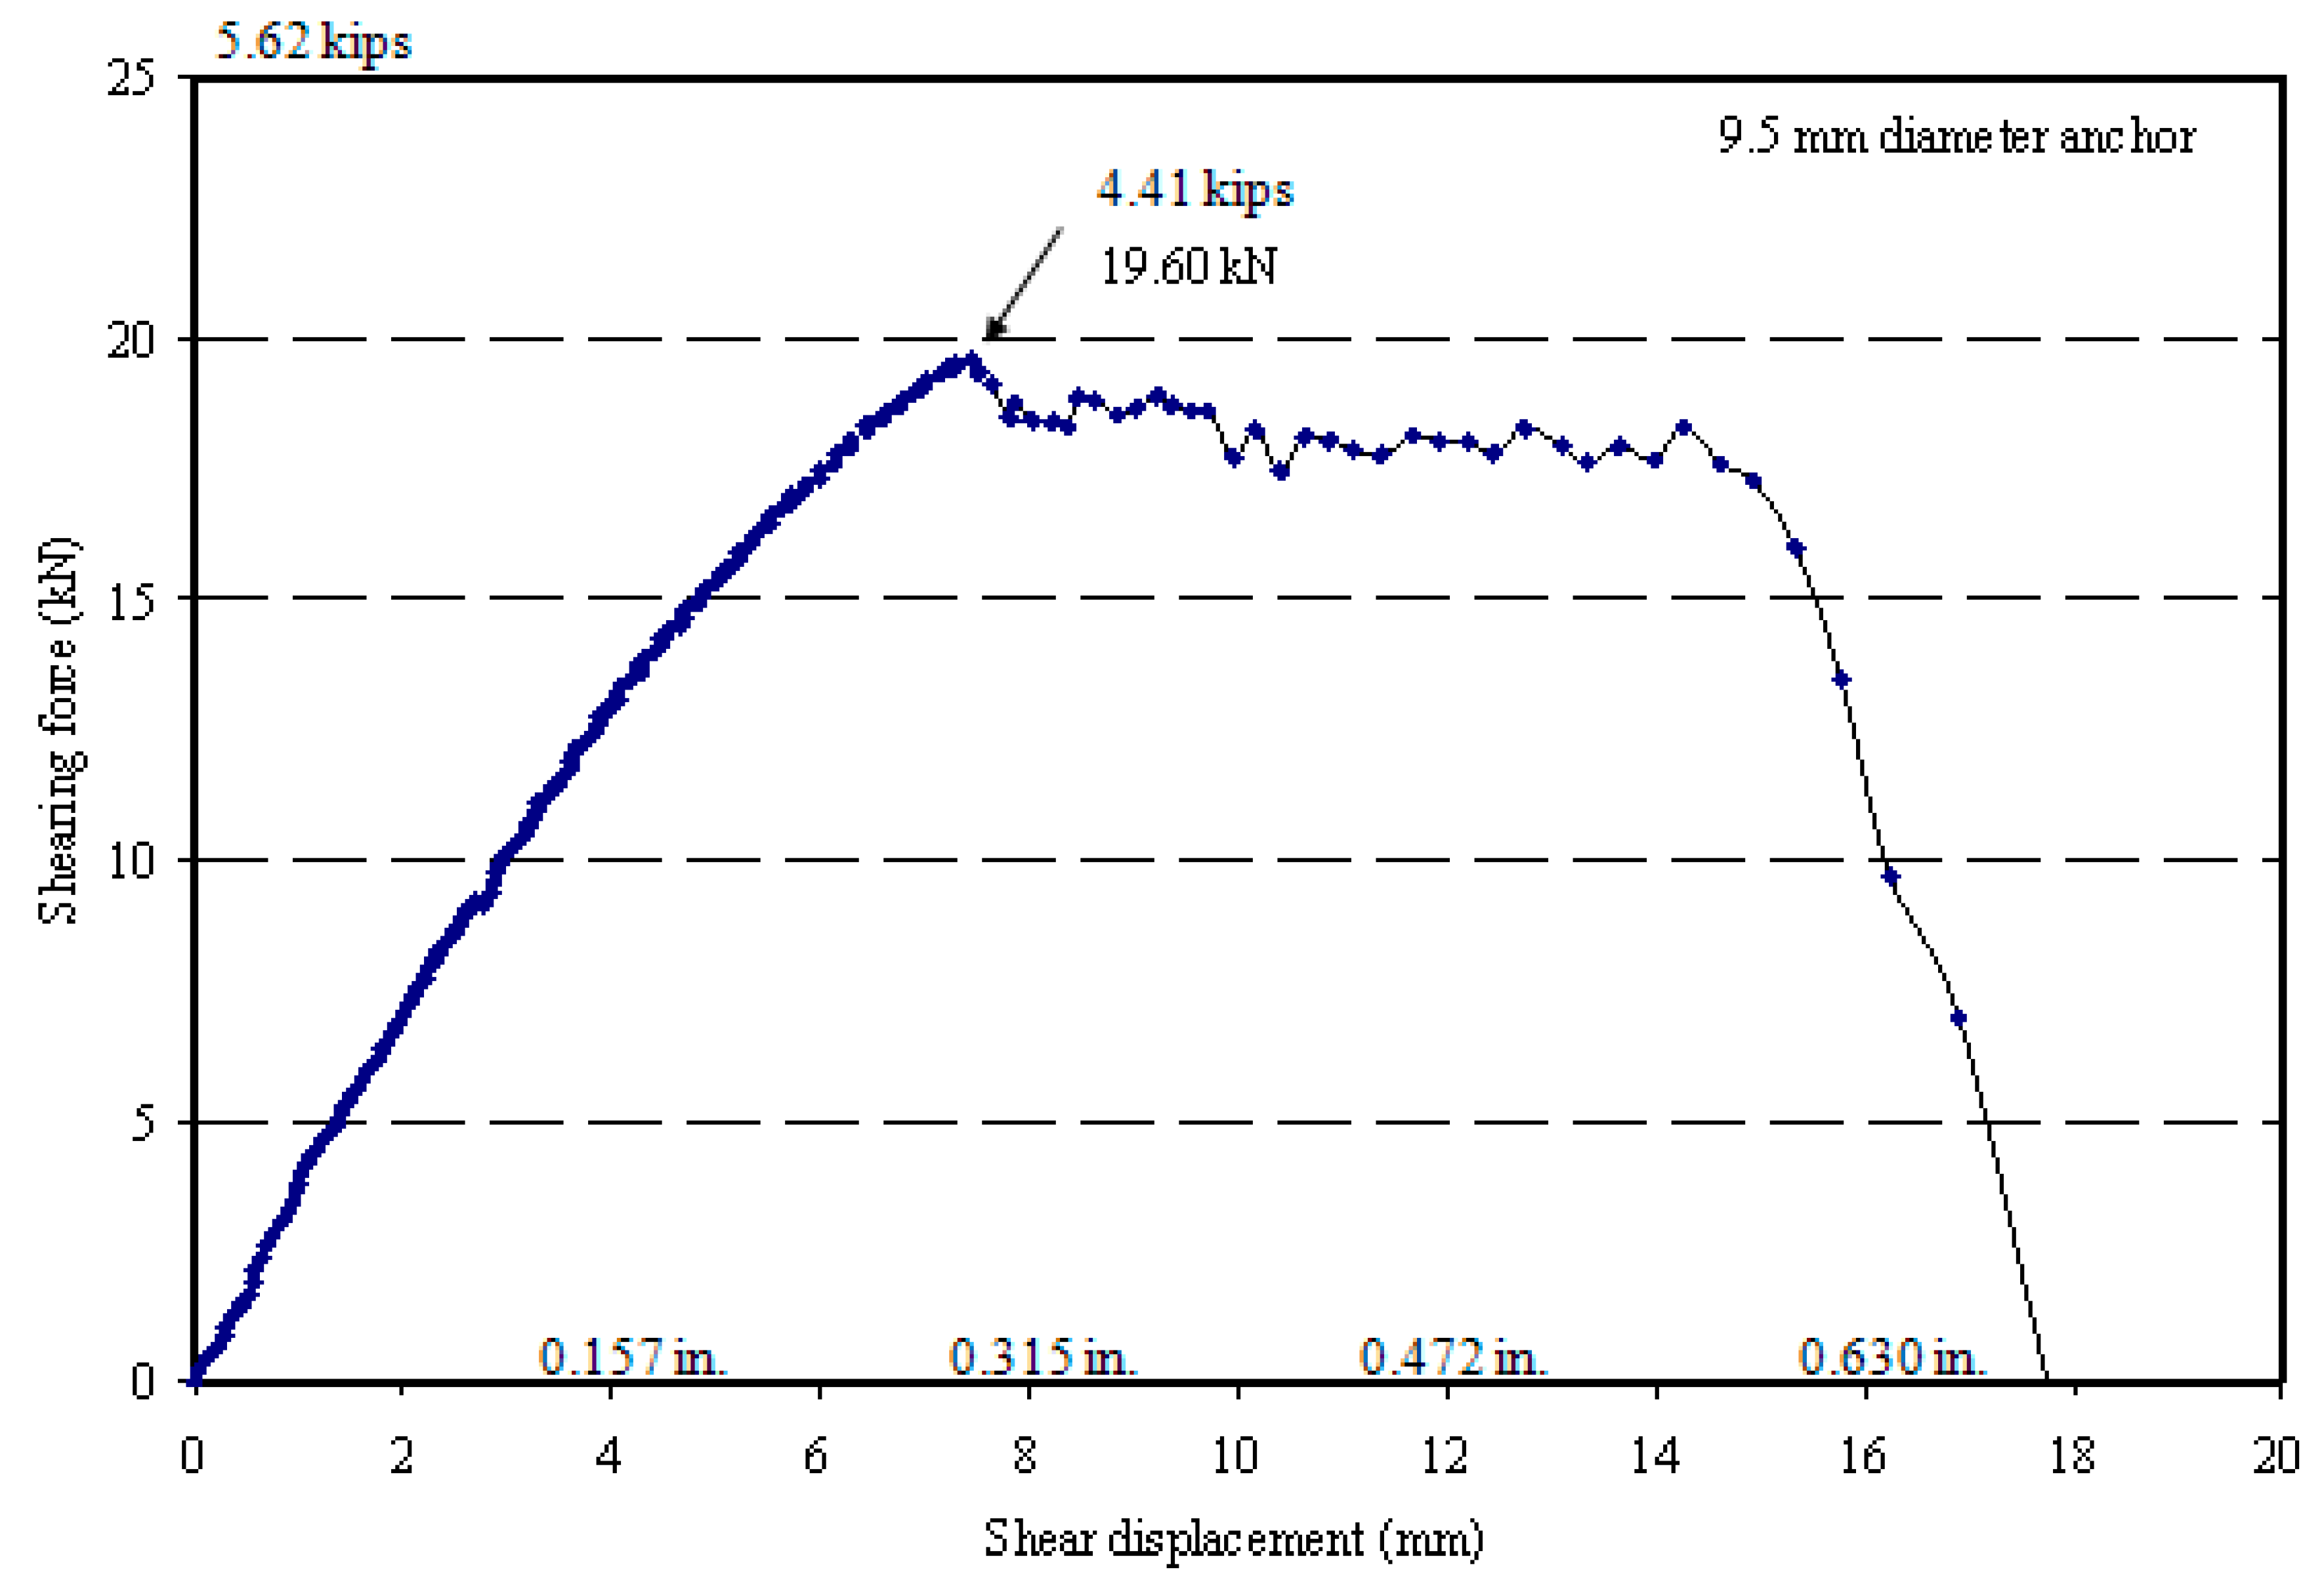
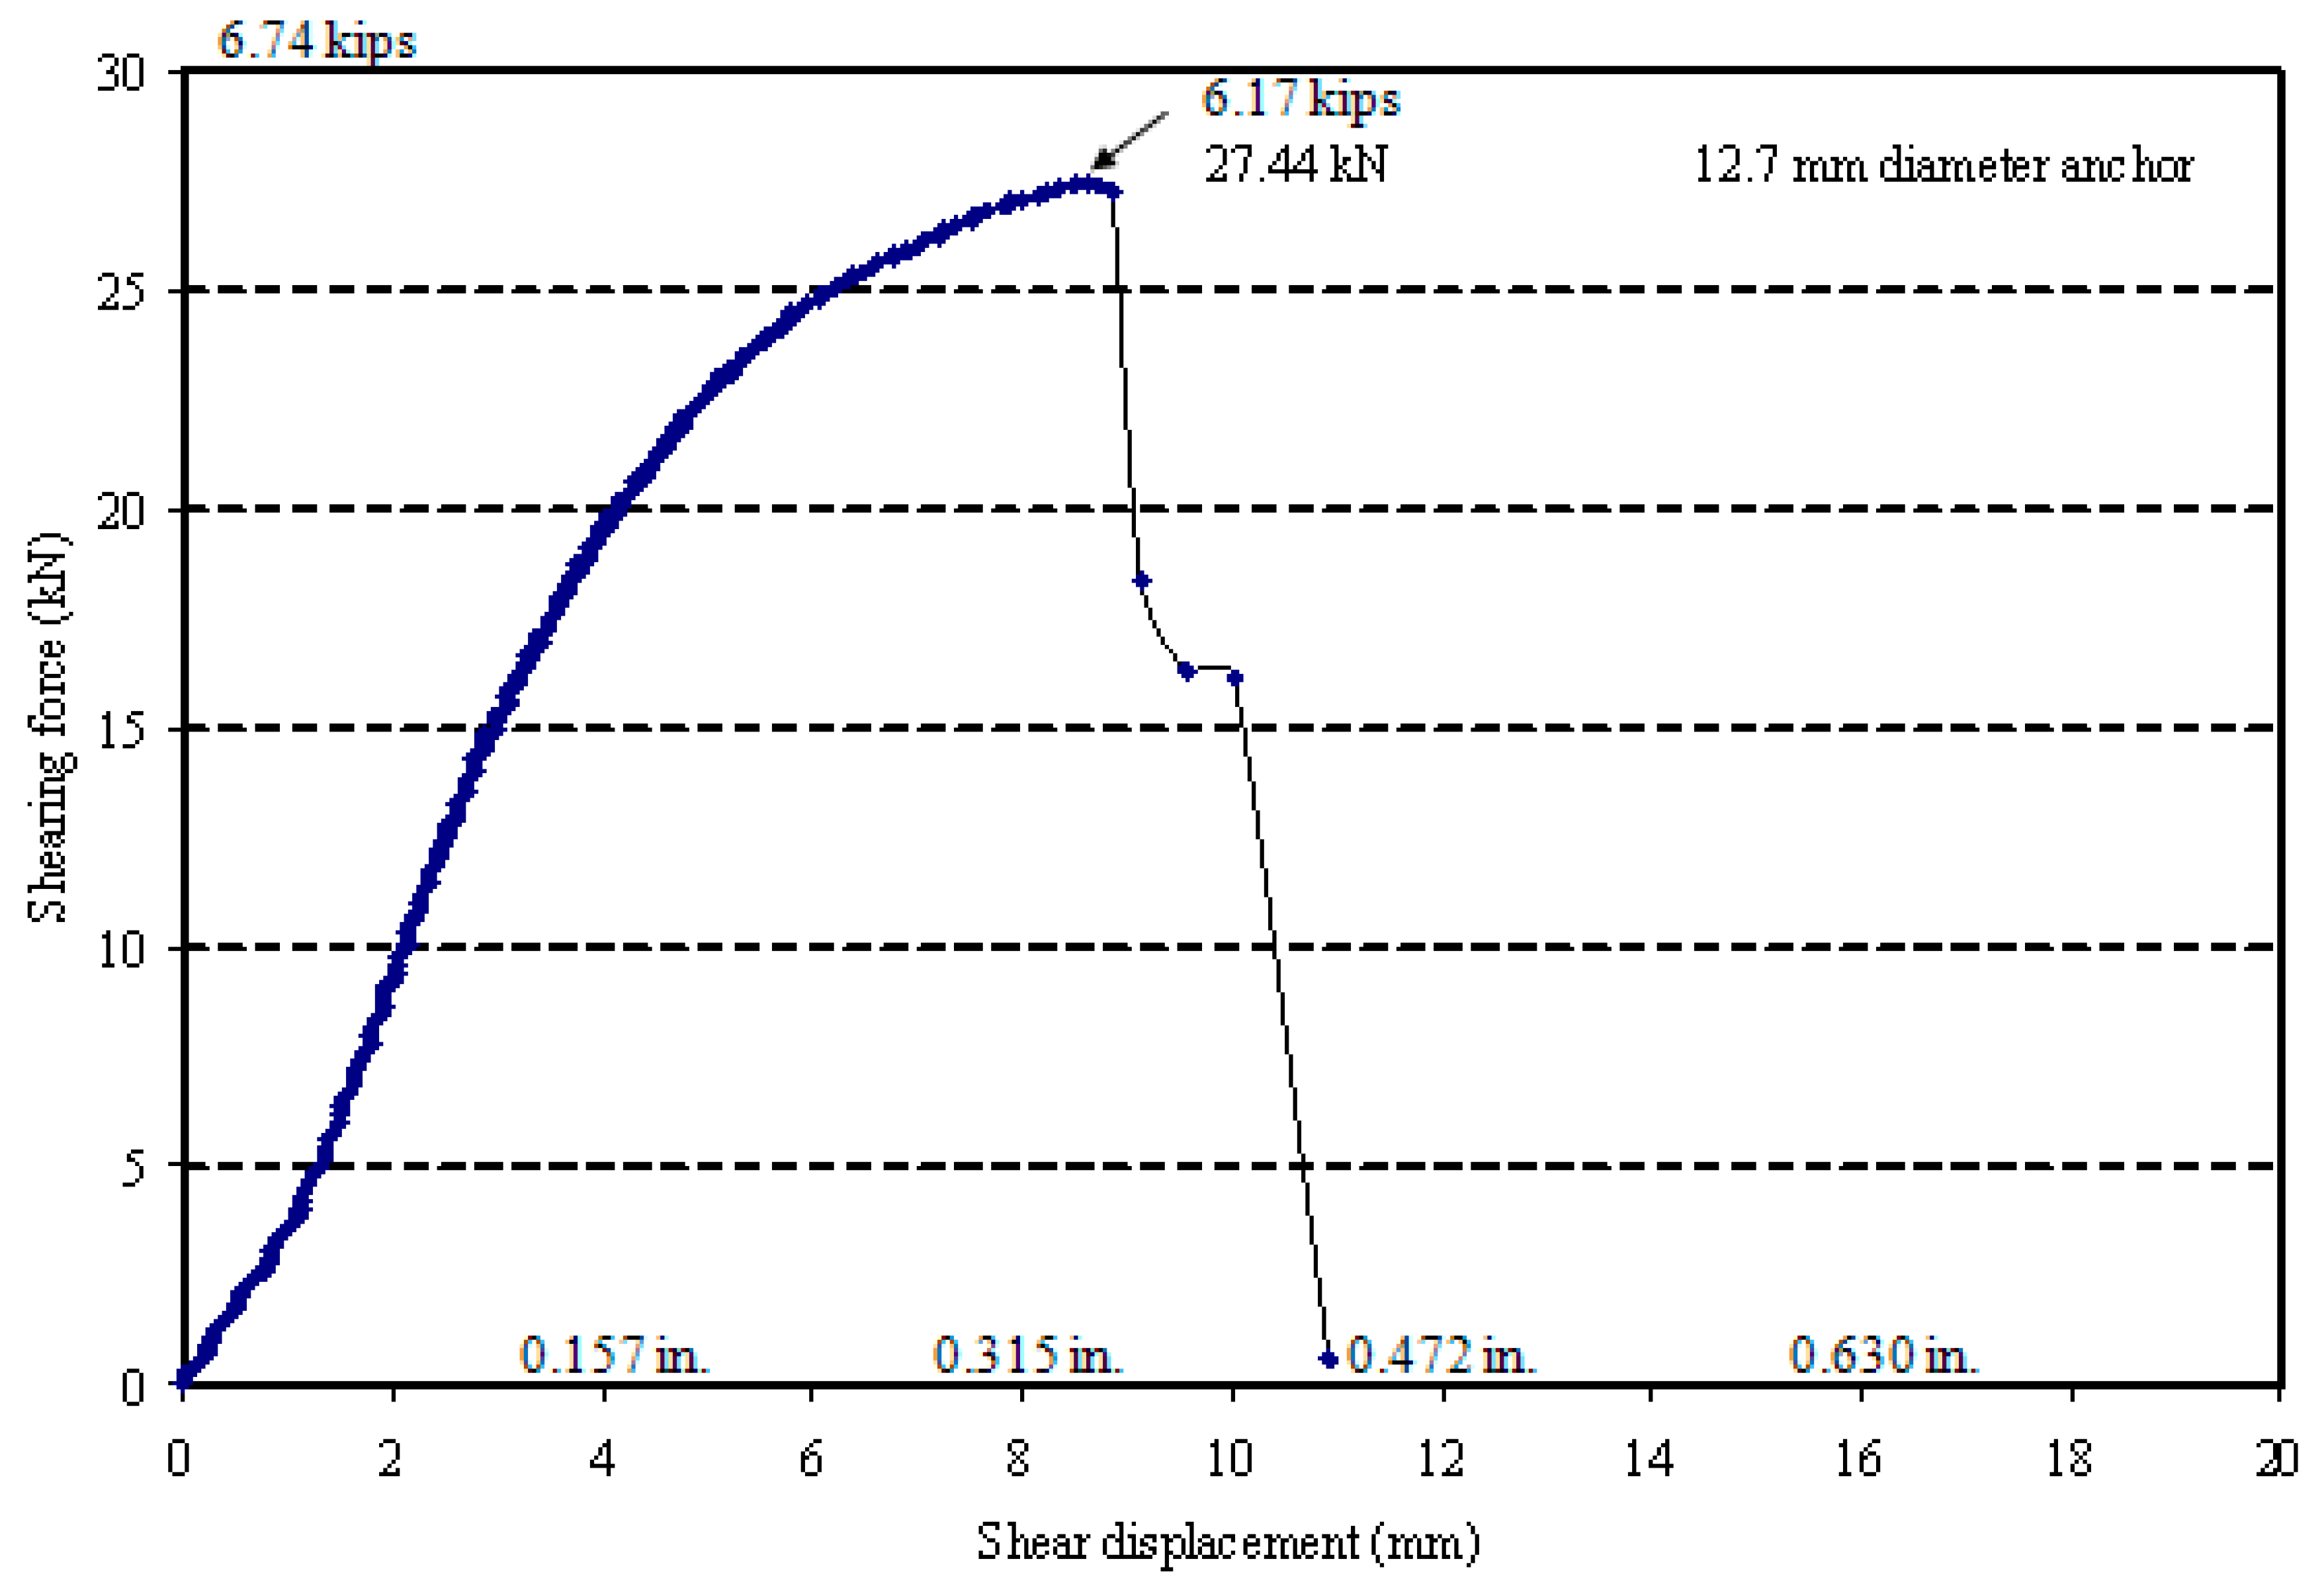
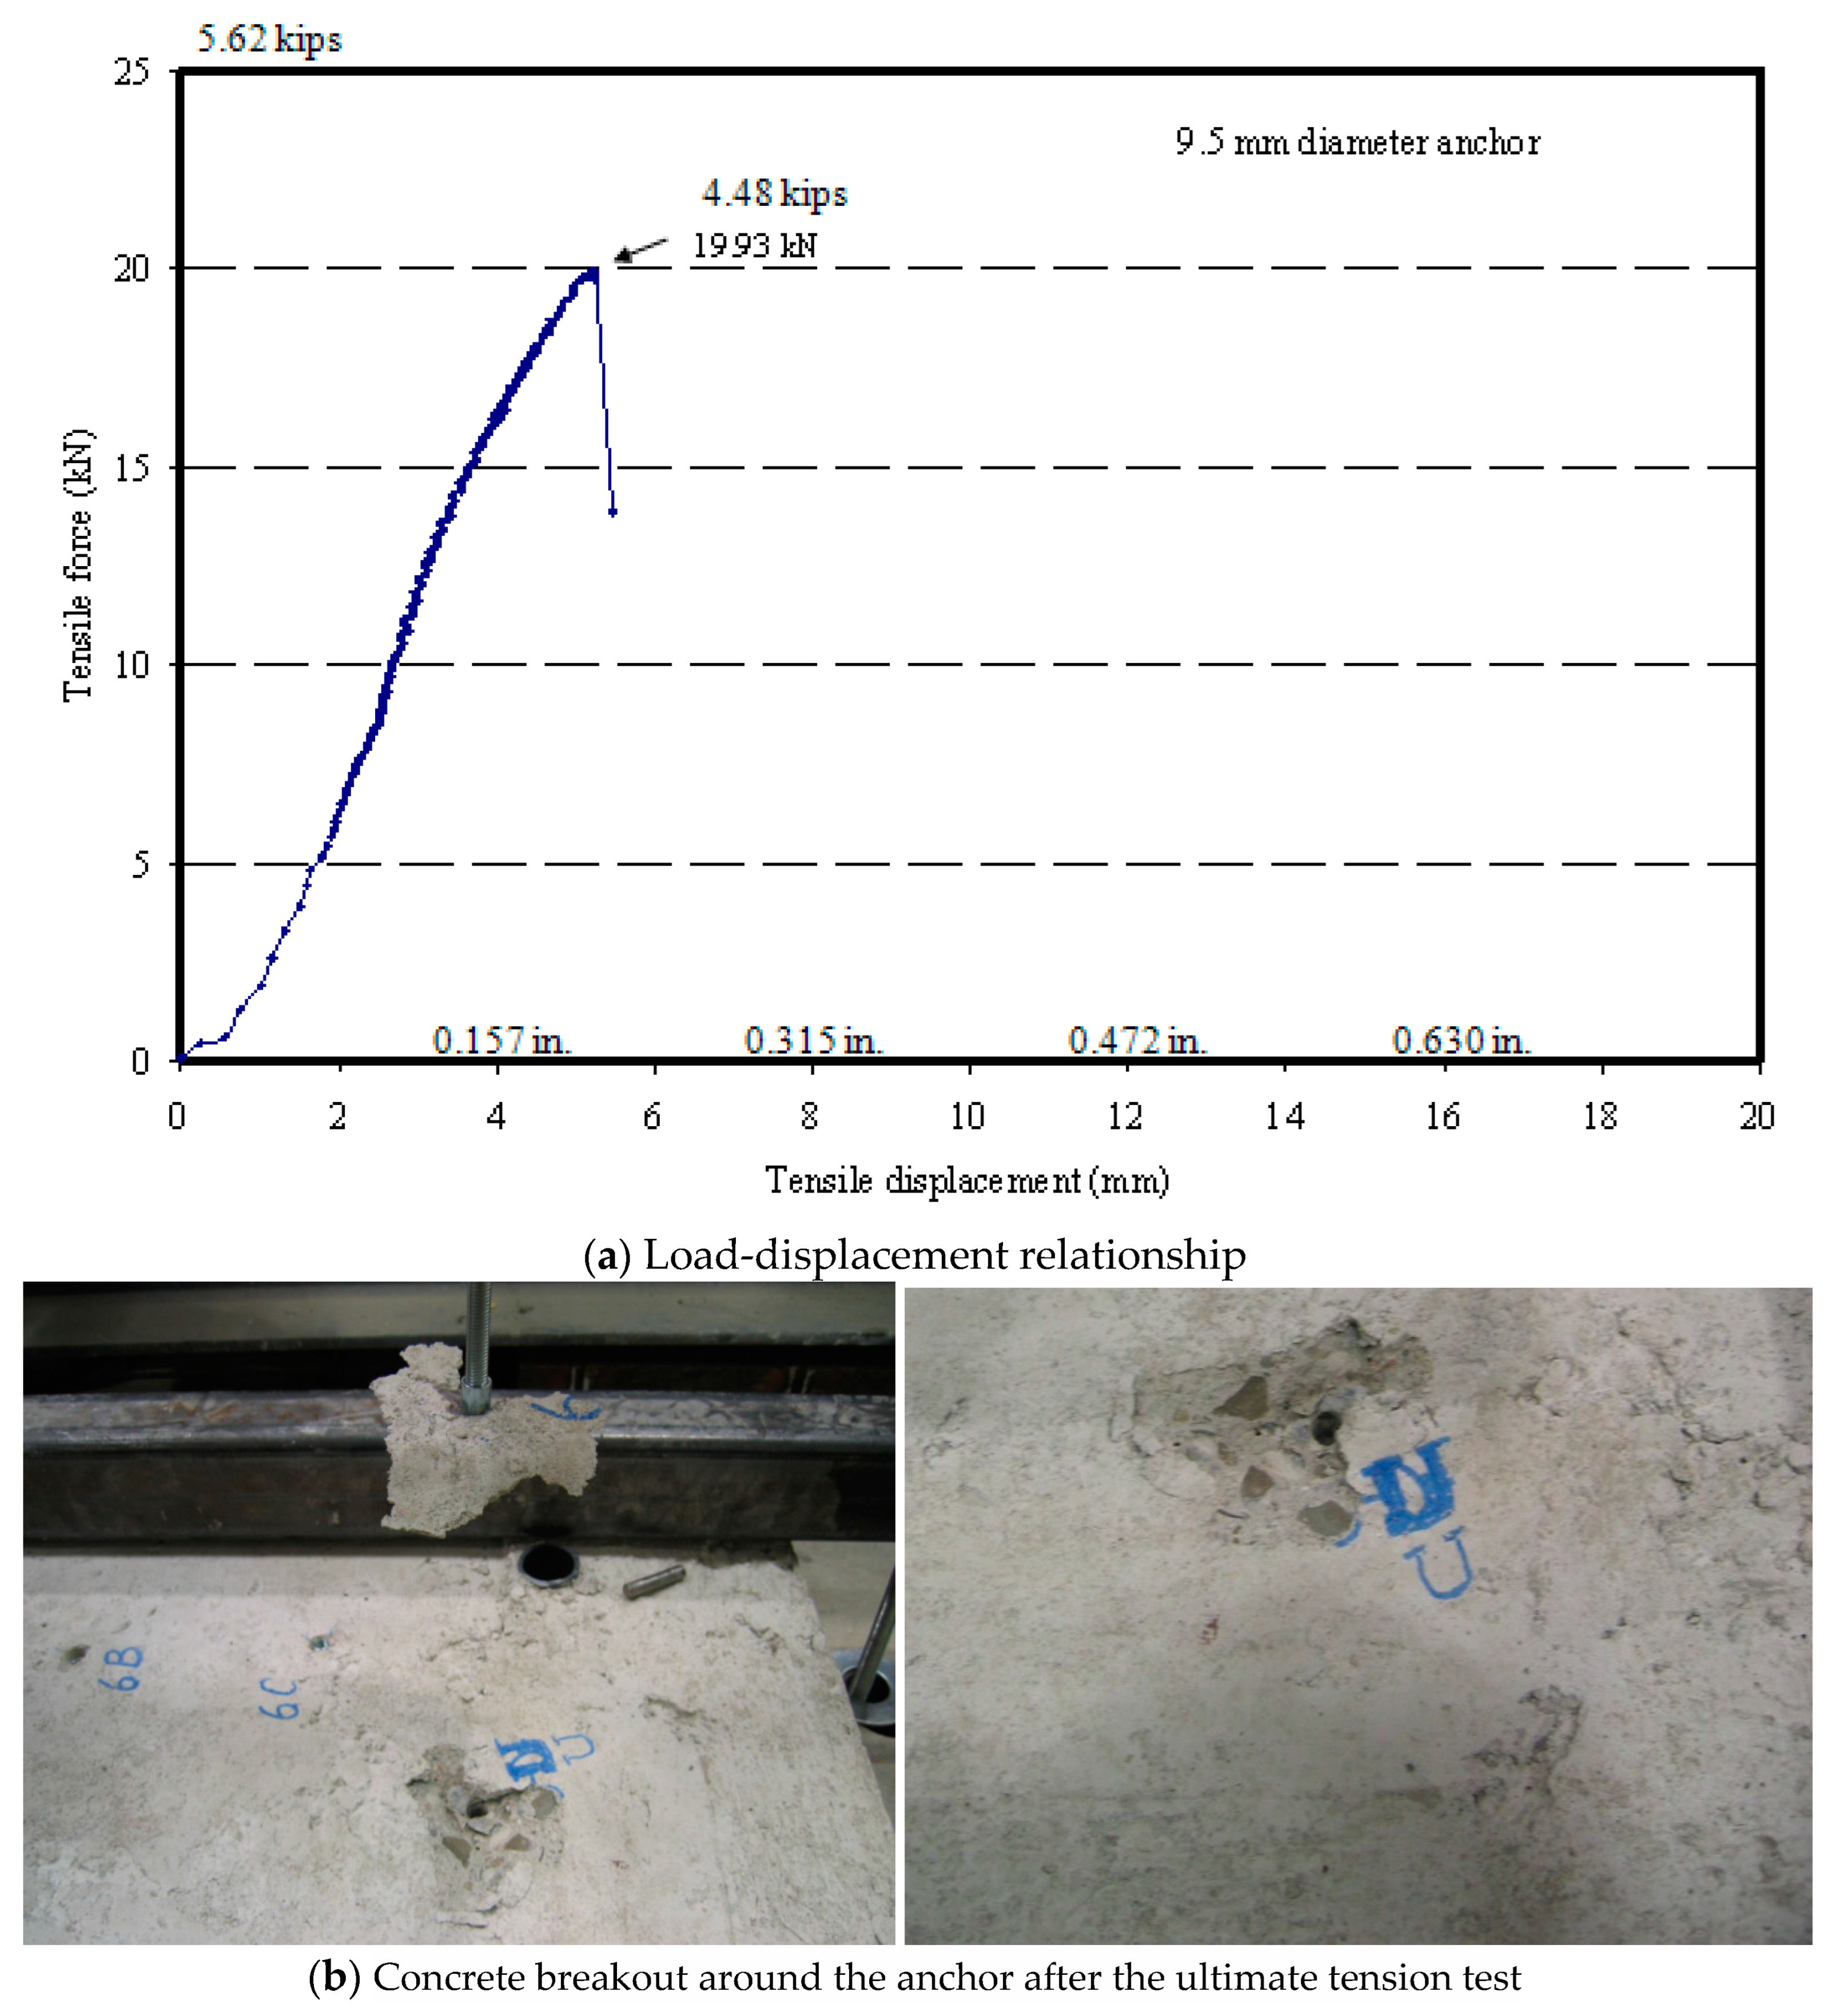
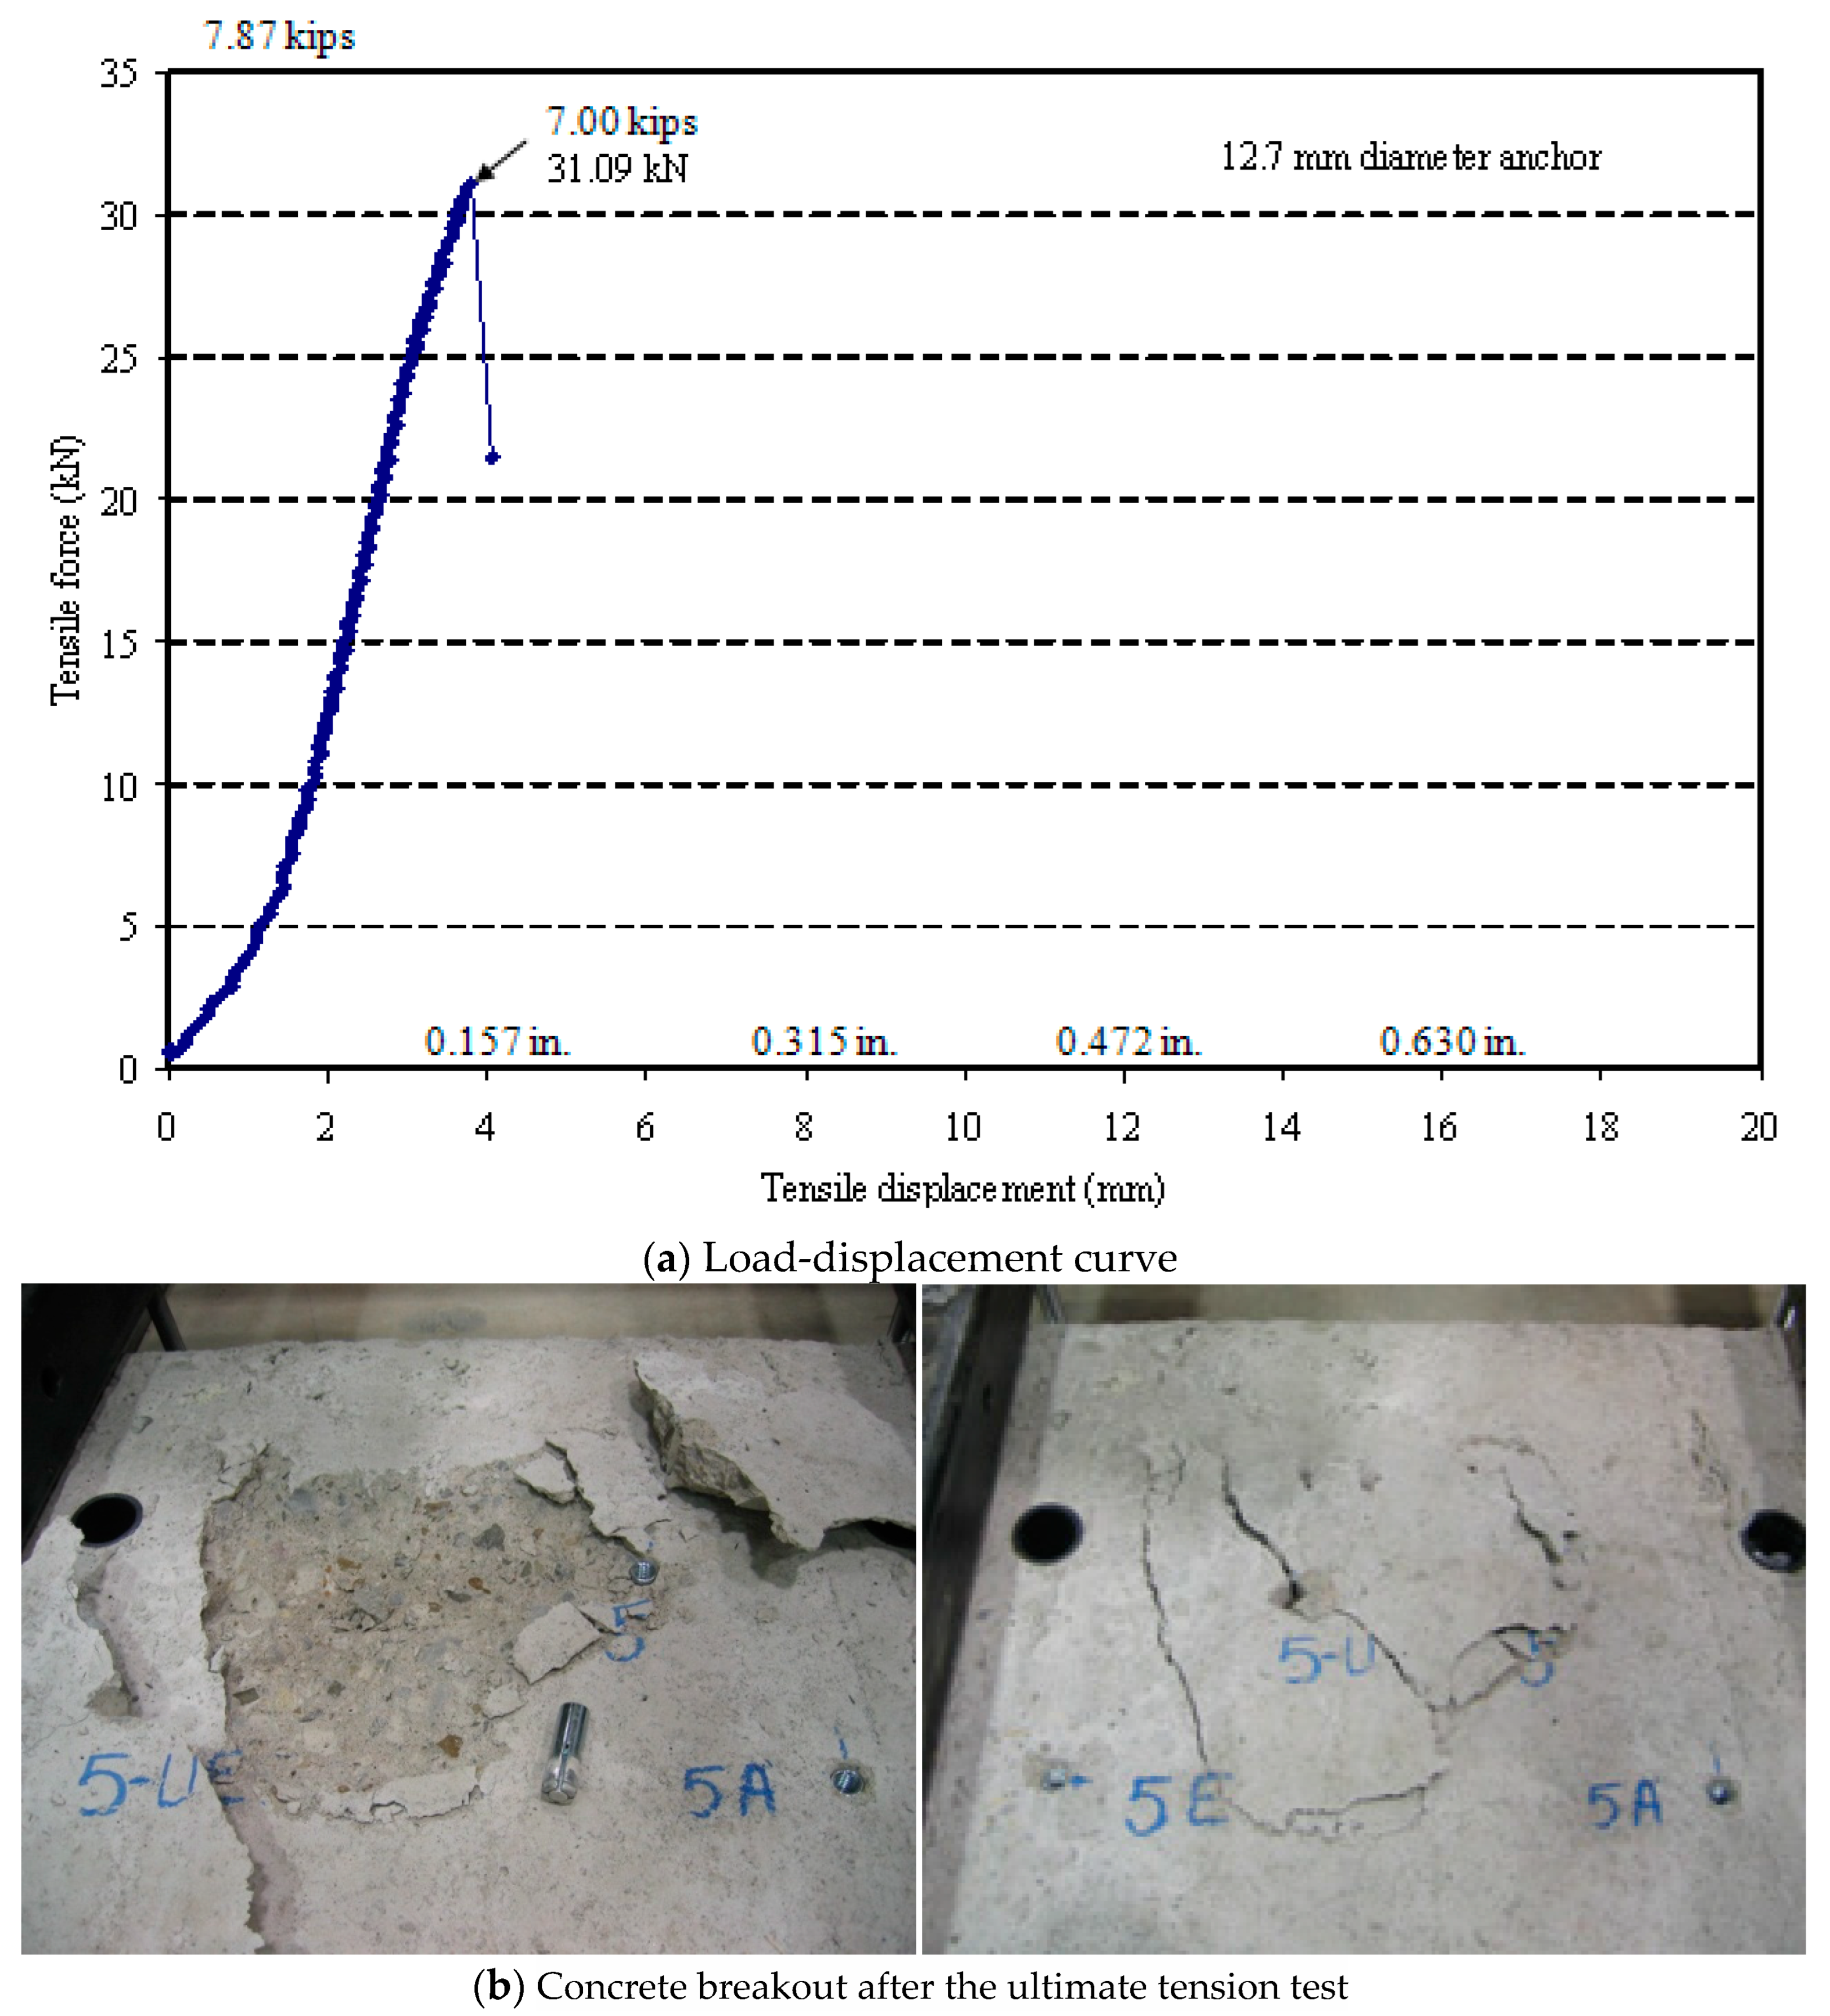
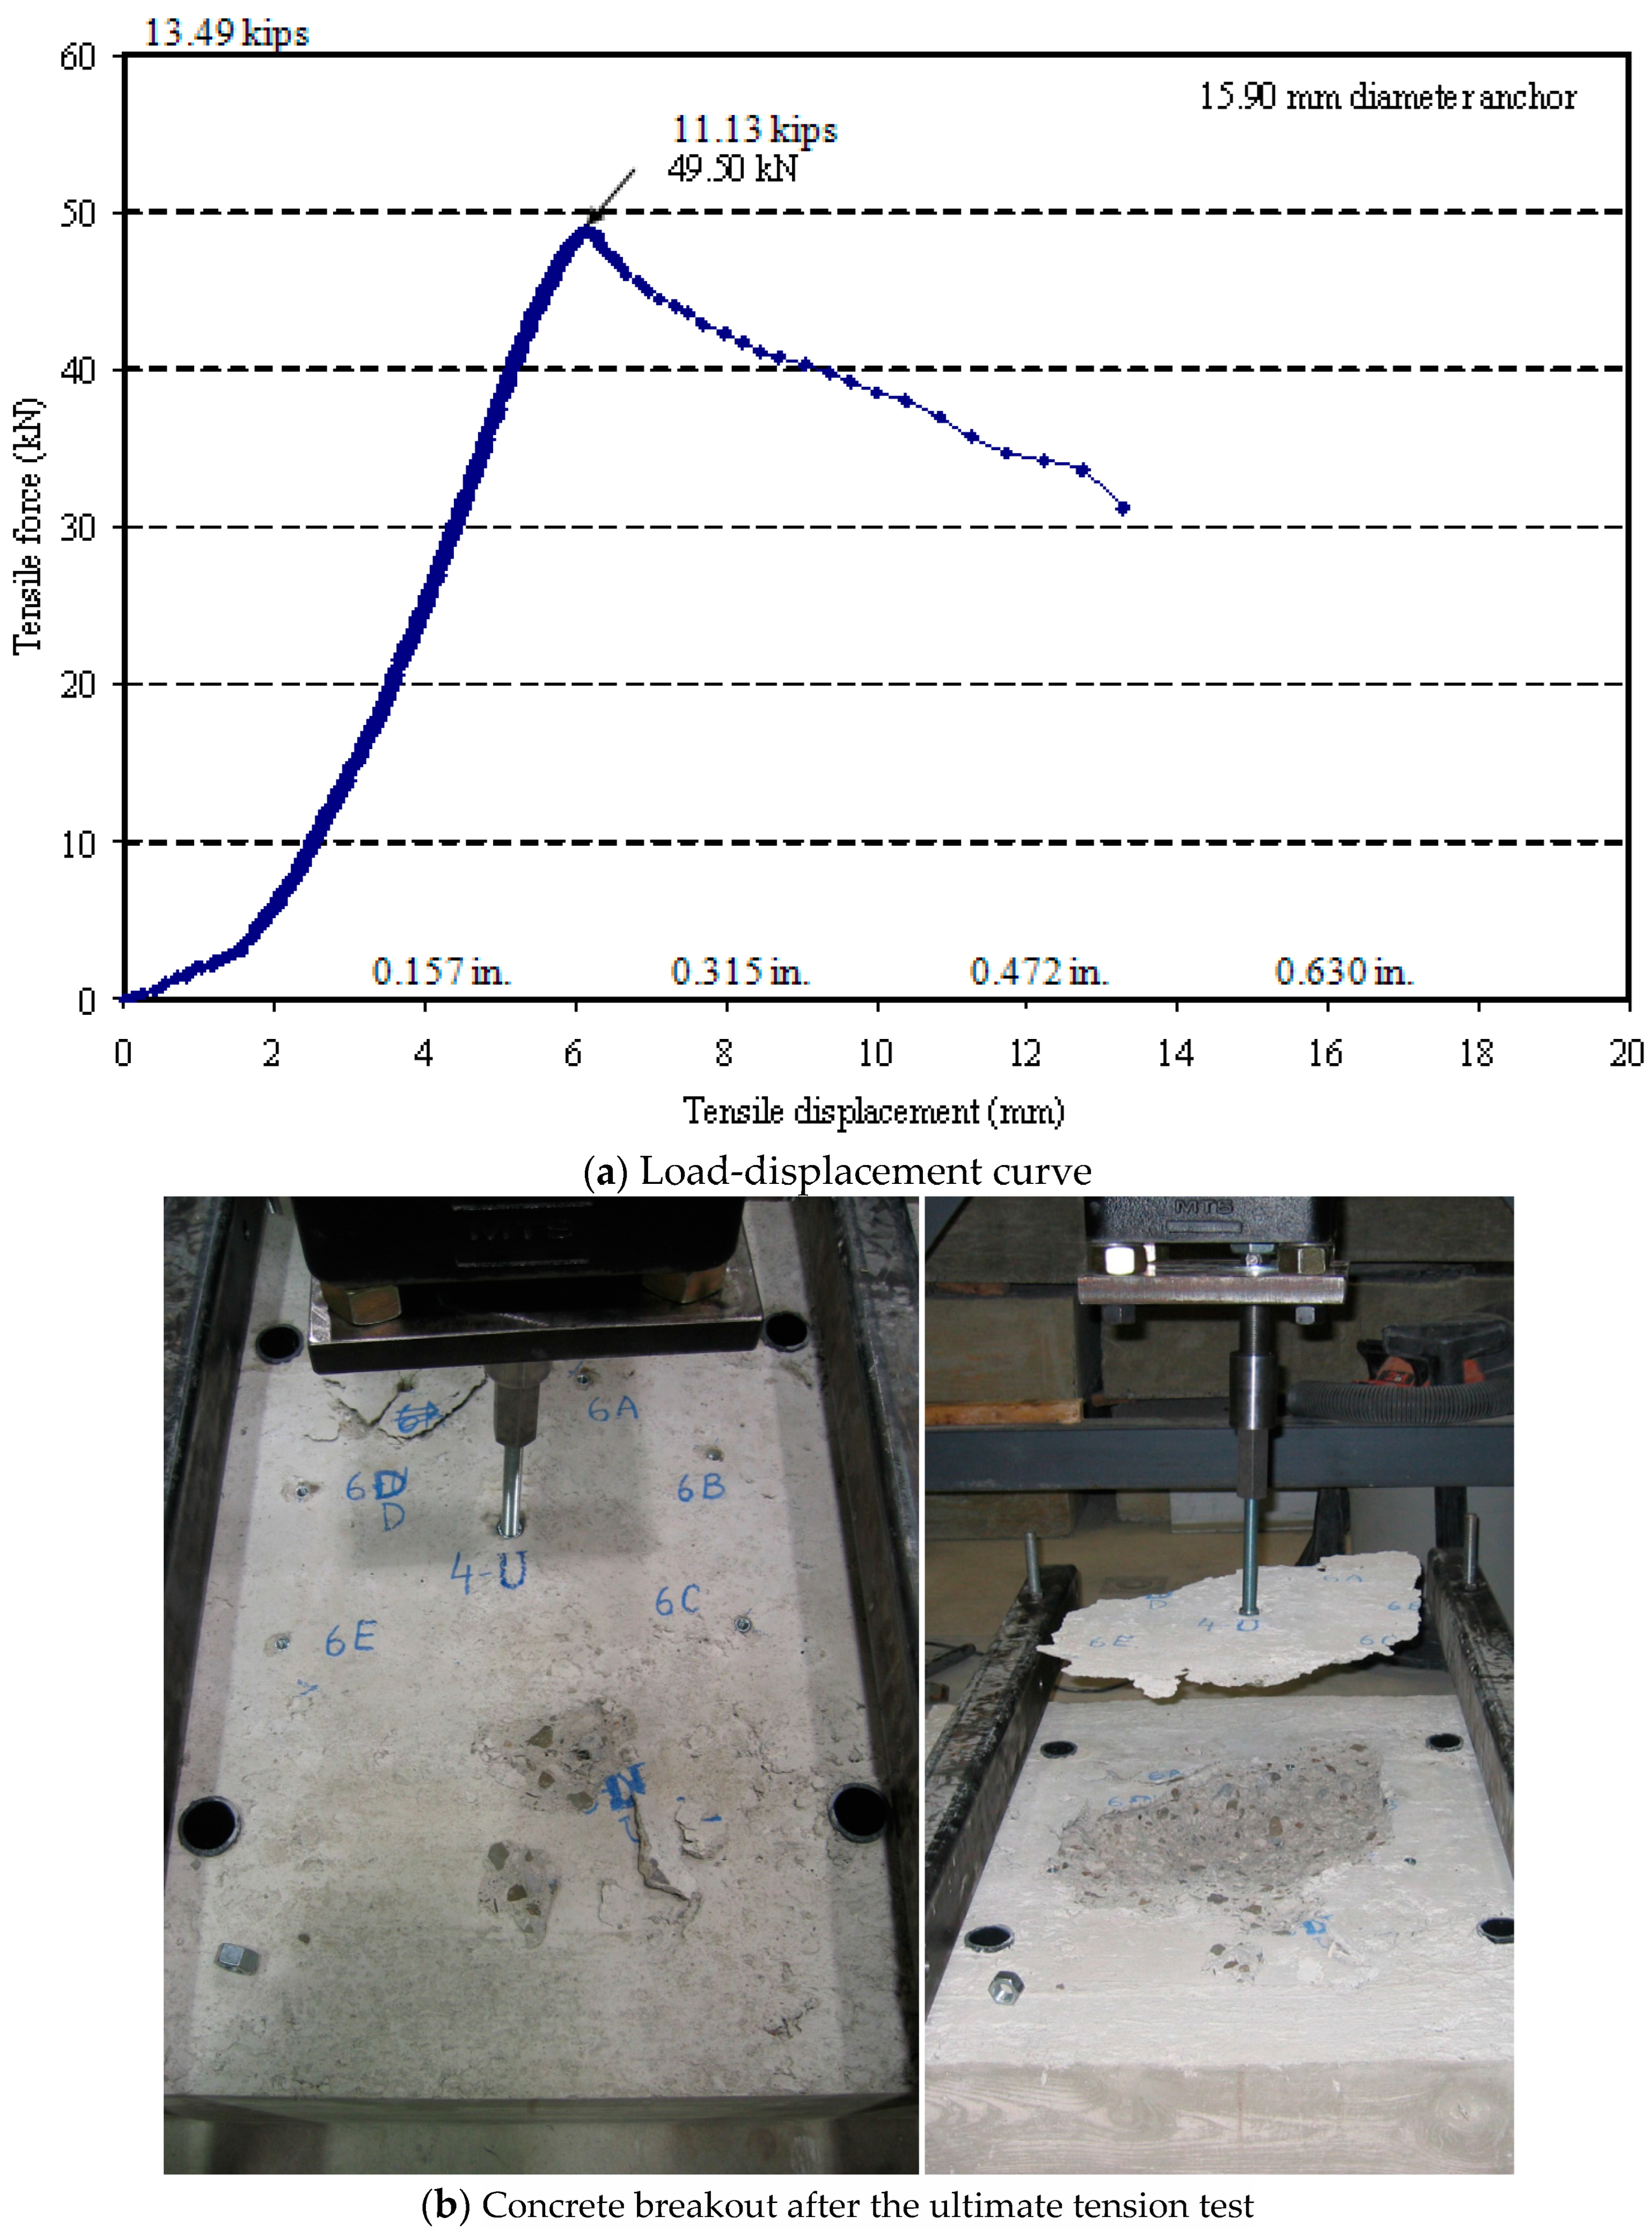
The ultimate load carrying capacity, total displacement at failure, and mode of failure obtained from the ultimate load tests for each anchor size are shown in Table 4. The typical failure modes of anchors tested for ultimate shear loads are presented in Figure 16. The failure of the anchors was due to the shear failure and concrete pry-out after the ultimate shear test. The load–displacement relationships of the ultimate shear test for 9.5 mm, 12.7 mm, and 15.9 mm anchors are shown in Figure 17, Figure 18 and Figure 19, respectively. The anchors subjected to increasing shear forces failed in shear fracture proceeded by concrete spall. It is seen that the 15.9 mm anchor exhibited a large shear displacement capacity compared to other tested anchors. However, the 12.7 mm anchor exhibited a brittle type of shear failure. Figure 20, Figure 21 and Figure 22 show the load–displacement relationships of the ultimate tension test for 9.5 mm, 12.7 mm, and 15.9 mm anchors, respectively, along with the observed failure mode. The anchors subjected to increasing tension forces failed due to concrete breakout failure (concrete spall cone in tension). Compared to the 9.5 mm and 12.7 mm anchors, the 15.9 mm anchors exhibited a ductile type of tensile failure, as can be seen in Figure 22. Therefore, a 15.9 mm anchor can be used to achieve a ductile failure mode in applications.
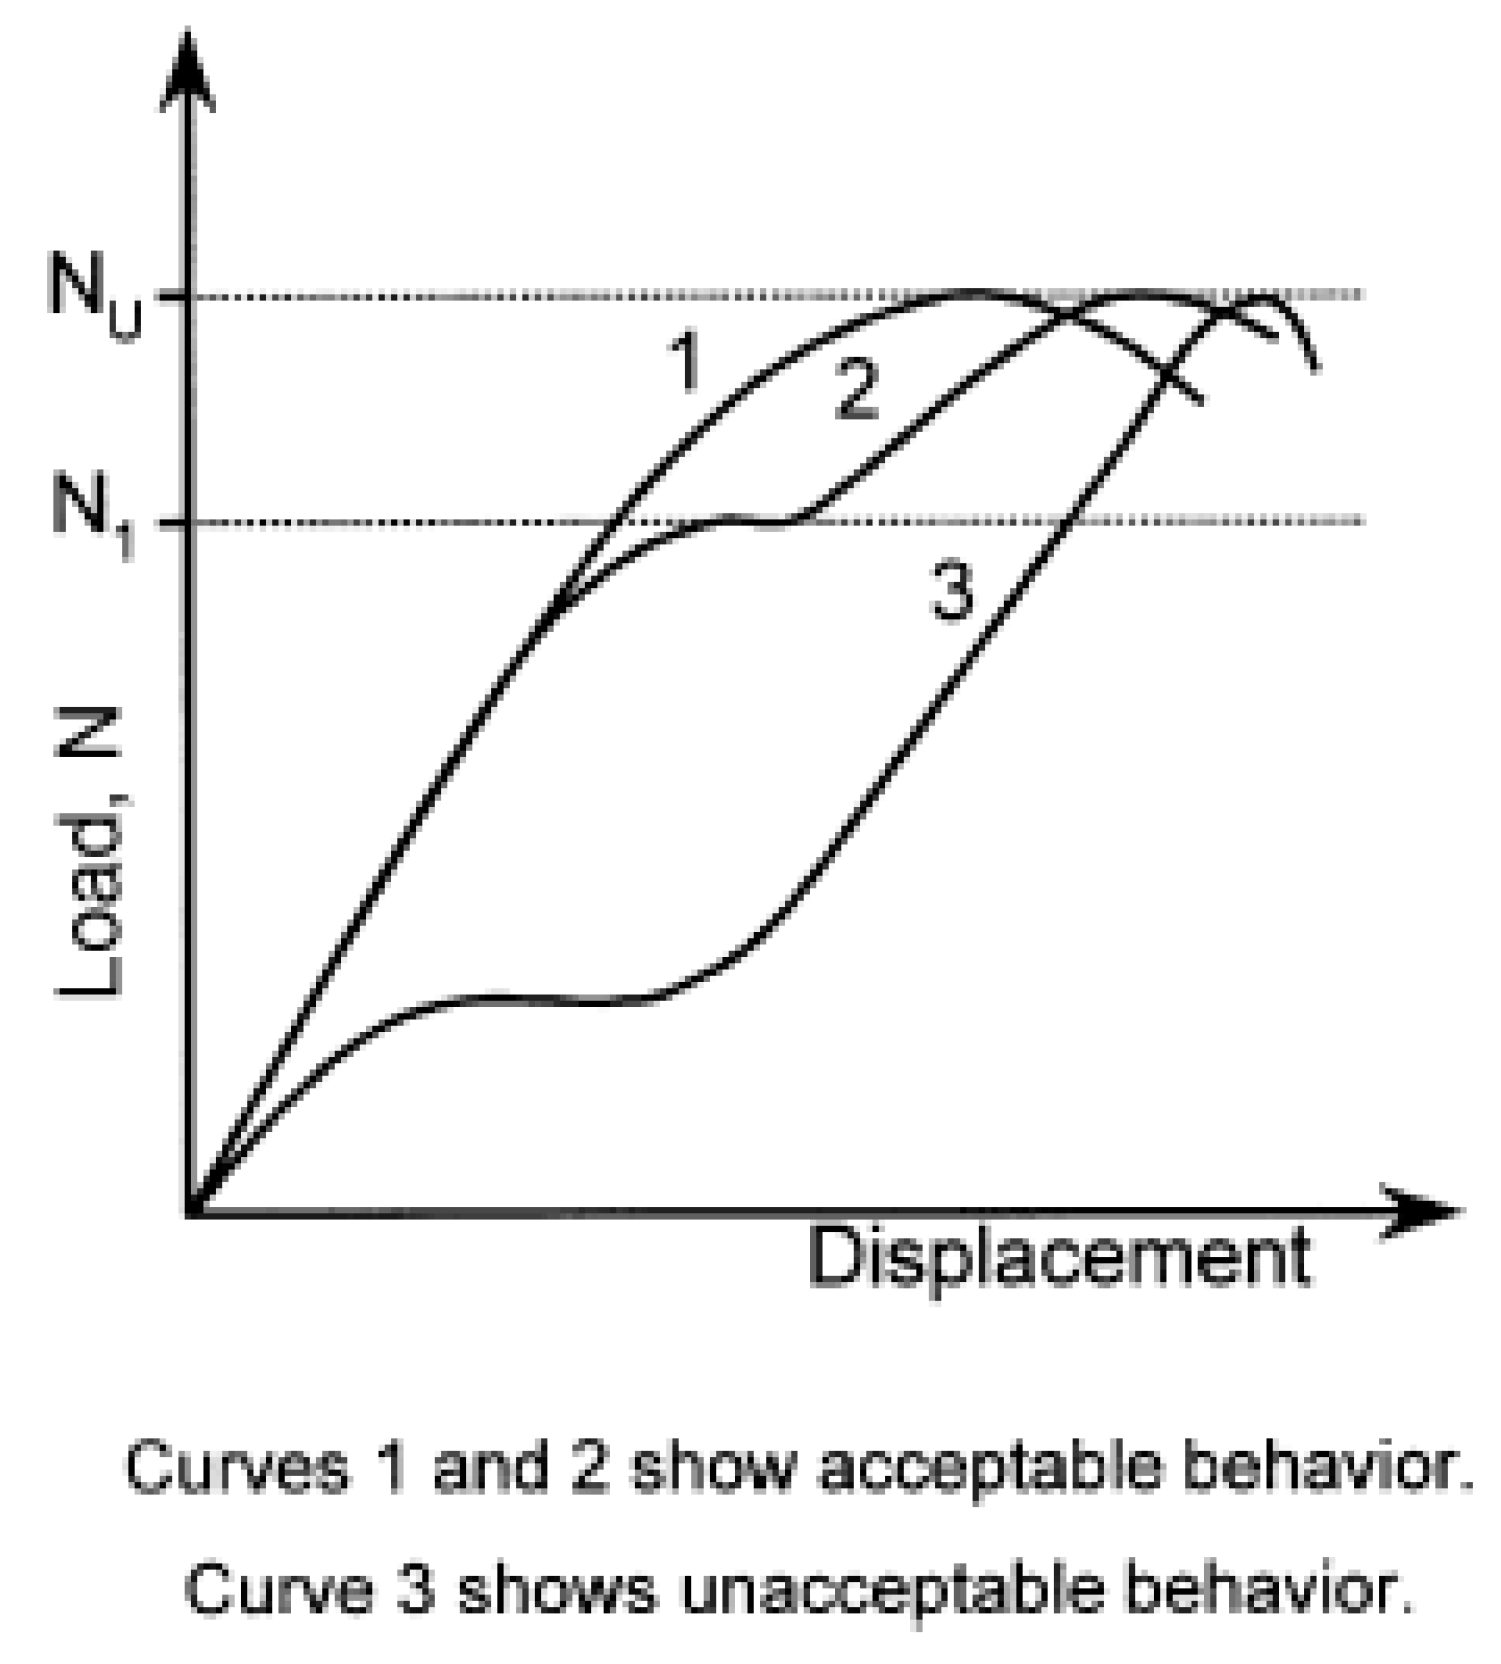
The classification of anchors according to their tensile load–displacement behavior as per the standard ACI 355.2-04 is illustrated in Figure 23. It can be seen that the corresponding relationships obtained for the tested anchors (represented by Figure 20, Figure 21 and Figure 22) match curves 1 and 2 of Figure 23, i.e., they satisfy the standard requirements for an acceptable tested anchor behavior. The values listed in Table 4 show that the experimental ultimate load was always more than that which was specified in the manufacturer’s technical manual (given in Table 5). Furthermore, the comparison of the failure loads estimated using analytical methods (Equations (1)–(4)) and the corresponding ones obtained from testing shows an overall factor of safety that ranges from 1.77 to 3.35 in shear and from 1.85 to 2.16 in tension.

6. Accuracies of Various Empirical Formulas in Predicting the Anchor Capacity in Shear and Tension

Table 5 provides the results obtained from ultimate load tests, those recommended by the manufacturers, and those calculated using the available models given in Table 1. The experimental results were all greater than the manufacturer’s recommended values. All the available models predicted a smaller capacity for the resistance of anchors in tension compared to those obtained experimentally. The closest model to the experimental results that also produced the largest capacity among other models was Eligehausen et al. [51]. That model resulted in 17.5, 26.4, and 38.2 kN for anchor diameters of 9.5, 12.7, and 15.9 mm, respectively, compared to experimental results of 19.9, 31.1, and 49.5 kN. On the other hand, the model proposed by ACI 349-90 was proven to be the most conservative among others, with tensile capacities of 7.7, 13.3, and 21.7 kN, respectively, about 40% of those obtained experimentally. For the most recent ACI code (ACI 318-19), kc = 7 is recommended for post-installed anchors, which could be taken greater than 7 upon the availability of experimental results but should not, in any case, be taken more than 10. The results presented in Table 5 show that even if kc is taken as its upper bound limit of 10, the results will be much smaller than the experimental results.
For the resistance of anchors in shear, since the anchors were located with relatively large edge distances of a minimum of 200 mm, the concrete breakout was not observed in the tests, and the failure mode was shear failure proceeded by spalling. The shear capacities predicted by ACI 318-19 were 17.9, 31.9, and 50.0 kN for anchor sizes of 9.5, 12.7, and 15.9 mm, respectively, compared to the experimental results of 19.6, 27.4, and 48.2 kN. As can be observed, the experimental-to-predicted-results ratios are 1.09, 0.86, and 0.96, respectively, where 0.86 and 0.96 show non-conservative predicted results obtained using ACI 318-19. Since the concrete breakout did not occur during the experiment, the predicted values in Table 5 are significantly larger than the experimental results, particularly for anchors with 9.5 and 12.7 mm diameters.
Another possible failure mode in shear is concrete pry-out. However, this did not occur during the experiment. The formula ACI 318-19 recommended is based on a factor kcp multiplied by the concrete breakout strength in tension. Eligehausen et al. [48] recommend the application of kcp = 2 for anchors with a minimum embedment depth of 60 mm and kcp < 2 to be used otherwise, without specifying any values. On the other hand, ACI 318-19 specifies kcp to be taken as 1 for embedment depths smaller than 65 mm and to be taken as 2 otherwise. Since the embedment depths used for the experiments were all smaller than 65 mm, kcp =1 according to ACI 318-19, shown in Table 5 to be significantly conservative. The failure of anchors did not occur in a pry-out mode, meaning that the pry-out capacity was higher than those obtained experimentally. With the comparison of the experimental results with those obtained by ACI 318-19 with kcp =1 and 2, the value of kcp equal to 2 or slightly smaller than 2 is likely to predict a better pry-out capacity with the experimental results compared to the application of the high conservative value of kcp =1.

7. Conclusions

The study reports a series of tests on drop-in anchors in uncracked concrete slabs to investigate their mechanical performance. Both seismic (cyclic) load tests and static load tests to collapse were performed subject to tension or shear forces according to the ACI 355.2-04 and ASTM E 488 test standards. The accuracies of various empirical formulas to predict the anchor capacity under shear and tension are evaluated by comparing them against the test results. The following conclusions can be drawn from this study:
  • No tension failure occurred at the end of the cyclic load tests for all the tested anchors. The anchors sustained the cyclic tension loading with minimal residual inelastic axial displacement.
  • The drop-in anchors resisted seismic tension and shear loading with frequency ranges between 0.1 and 2.0 Hz.
  • Inconsistency in cyclic shear test results was observed in the case of the greater anchor sizes due to a fracture in the connecting threaded bar to the actuator’s fixture.
  • The anchors subjected to increasing shear forces failed in shear fracture proceeded by concrete spall. In contrast, those subjected to increasing tension forces failed due to concrete breakout failure.
  • The experimental ultimate loads obtained from static shear and tension tests were generally greater than those specified in the manufacturer’s technical manual.
  • The corresponding failure modes were consistent with the typical ones predicted by the standard ACI 355.2-04. The tensile load–displacement behaviors of all the tested anchors satisfied the standard requirements for an acceptable tested anchor behavior as per the standard ACI 355.2-04.
  • The theoretical models to predict the concrete breakout of anchors in tension were all found to predict a lower capacity than experimental ultimate loads, which are conservative in design. The model recommended by Eligehausen et al. [51] predicted the closest results to the experimental values.
  • It was found that the factor kcp equal to 1 was significantly conservative in predicting the pry-out shear resistance of anchors recommended by ACI 318-19. A value of kcp equal to 2 or slightly smaller than 2 is likely to predict a better pry-out capacity with the experimental results. On the other hand, the steel shear resistance theoretical model prescribed by ACI 318-19 could closely predict the resistance of the anchors that failed under steel shear proceeded by concrete spall.
The present study only focuses on the seismic performance of drop-in anchors in uncracked concrete. However, future study should investigate their seismic performance in cracked concrete. Furthermore, the seismic performance of anchors was assessed under load cycling only. However, future studies should focus on their seismic performance under simulated crack cycling.

Author Contributions

Conceptualization, K.S.; Methodology, K.S.; Validation, H.A.; Formal analysis, H.A.; Investigation, H.A.; Resources, K.S.; Data curation, H.A.; Writing—original draft, H.A.; Writing—review & editing, K.S., M.A. and A.H.; Visualization, H.A., M.A. and A.H.; Supervision, K.S.; Project administration, K.S.; Funding acquisition, K.S. All authors have read and agreed to the published version of the manuscript.

Funding

This research received no external funding.

Data Availability Statement

The original contributions presented in the study are included in the article, further inquiries can be directed to the corresponding authors.

Acknowledgments

The authors thank the Ontario Centre of Excellence: Materials and Manufacturing Ontario (MMO) and UCAN Fastening Products Inc., especially Paul Mariai, for supporting this research. Also, the efforts of Nidal Jaalouk, the Graduate Program Technologist, and Adrian Sluga of Trow Associates Inc., in conducting the experimental work are greatly appreciated.

Conflicts of Interest

Author Hossein Azimi was employed by the company WSP Group. The remaining authors declare that the research was conducted in the absence of any commercial or financial relationships that could be construed as a potential conflict of interest.

Abbreviations

ANcFailure area of concrete with a single/group of anchors; for the calculation of concrete breakout strength subjected to tension
ANcoFailure area of concrete with a single anchor; for the calculation of concrete breakout strength subjected to tension when not limited by spacing or edge distance
AVcActual projected area (base) of the concrete fracture-cone-adjacent side of the concrete member
AVcoIdealized projected area (base) of the concrete fracture cone as a half pyramid that equals 3c1 times 1.5c1
AseCross-sectional area of the anchor
c1Edge distance in the loading direction (equals the greater of c2/1.5 and h/1.5 for anchors in concrete members with c2 < 1.5c1 and h < 1.5c1)
c2Edge distance perpendicular to the loading direction
daAnchor diameter
fcConcrete compressive strength
f’ccConcrete cube compressive strength = 0.85 f c
futTensile strength of anchor steel
hThickness of the concrete member
hefAnchor effective embedment depth
kcCoefficient for basic concrete breakout strength subjected to tension
kcpCoefficient for pry-out strength
leActivated bearing length of anchor ≤ 8da (le equals anchor effective embedment for anchors with constant overall stiffness, and 2da is for expansion anchors with separated spacing and expansion sleeves)
NbBasic concrete breakout strength of single anchor subjected to tension
NcbConcrete breakout strength of anchors in tension
NeqThe maximum seismic tension test load, equal to 50% of the mean tension capacity in cracked concrete from reference tests
NiEquals (Neq + Nm)/2
NmOne-quarter of the mean tension capacity in cracked concrete
Vb1, Vb2Basic concrete breakout strength of single anchor subjected to shear
VcbConcrete breakout strength of anchors subjected to shear
VcpConcrete pry-out strength of a single anchor
VeqMaximum seismic shear load calculated as one-half of the mean capacity in cracked concrete from calculated shear capacity or shear tests
ViEquals (Veq + Vm)/2
VmOne-quarter of the mean shear capacity in cracked concrete calculated from steel capacity or from test results
VsaShear strength of a single anchor
λaModification factor for the type of concrete used
ψcModification factor accounting for the presence or absence of concrete cracks
ψcpModification factor of the tensile strength of post-installed anchors
ψedModification factor accounting for the effect of proximity to edges of concrete member
ψhModification factor for the shear strength of anchors located in concrete members with h < 1.5ca1

References

  1. ACI 355.1R-91; State-of-the-Art Report on Anchorage to Concrete. American Concrete Institute: Detroit, MI, USA, 1997.
  2. ACI 355.2-04; Qualification of Post-Installed Mechanical Anchors in Concrete. American Concrete Institute: Detroit, MI, USA, 2004.
  3. He, J.; Yao, L. Experimental Study on Mechanical Properties of Reinforced Soil and Frame Beam Anchor Combination System. Buildings 2024, 14, 1372. [Google Scholar] [CrossRef]
  4. Hosseini, S.; Astaraki, F.; Imam, S.M.R.; Chalabii, J.; Movahedi Rad, M. Investigation of Shear Strength Reduction Method in Slope Stability of Reinforced Slopes by Anchor and Nail. Buildings 2024, 14, 432. [Google Scholar] [CrossRef]
  5. Matsunaga, K.; Takase, Y.; Abe, T. Modeling of dowel action for cast-in and post-installed anchors considering bond property. Eng. Struct. 2021, 245, 112773. [Google Scholar] [CrossRef]
  6. UCAN. Drop-in Anchor Technical Manual; UNCAN Fastening Products Inc.: Toronto, ON, Canada, 2005. [Google Scholar]
  7. Wei, J.; Ying, H.; Yang, Y.; Zhang, W.; Yuan, H.; Zhou, J. Seismic performance of concrete-filled steel tubular composite columns with ultra high performance concrete plates. Eng. Struct. 2023, 278, 115500. [Google Scholar] [CrossRef]
  8. Huang, H.; Guo, M.; Zhang, W.; Huang, M. Seismic behavior of strengthened RC columns under combined loadings. J. Bridge Eng. 2022, 27, 05022005. [Google Scholar] [CrossRef]
  9. Yao, Y.; Huang, H.; Zhang, W.; Ye, Y.; Xin, L.; Liu, Y. Seismic performance of steel-PEC spliced frame beam. J. Constr. Steel Res. 2022, 197, 107456. [Google Scholar] [CrossRef]
  10. Zhang, X.; Liu, X.; Zhang, S.; Wang, J.; Fu, L.; Yang, J.; Huang, Y. Analysis on displacement-based seismic design method of recycled aggregate concrete-filled square steel tube frame structures. Struct. Concr. 2023, 24, 3461–3475. [Google Scholar] [CrossRef]
  11. Yang, L.; Ye, M.; Huang, Y.; Dong, J. Study on mechanical properties of displacement-amplified mild steel bar joint damper. Iran. J. Sci. Technol. Trans. Civ. Eng. 2023, 48, 2177–2190. [Google Scholar] [CrossRef]
  12. Huang, H.; Li, M.; Zhang, W.; Yuan, Y. Seismic behavior of a friction-type artificial plastic hinge for the precast beam–column connection. Arch. Civ. Mech. Eng. 2022, 22, 201. [Google Scholar] [CrossRef]
  13. Huang, H.; Li, M.; Yuan, Y.; Bai, H. Experimental research on the seismic performance of precast concrete frame with replaceable artificial controllable plastic hinges. J. Struct. Eng. 2023, 149, 04022222. [Google Scholar] [CrossRef]
  14. Zhang, J.; Zhang, C. Using viscoelastic materials to mitigate earthquake-induced pounding between adjacent frames with unequal height considering soil-structure interactions. Soil Dyn. Earthq. Eng. 2023, 172, 107988. [Google Scholar] [CrossRef]
  15. Klingner, R.; Mendonca, J.; Malik, J. Effect of reinforcing details on the shear resistance of anchor bolts under reversed cyclic loading. J. Proc. 1982, 79, 3–12. [Google Scholar]
  16. Tang, J.H.K.; Deans, J.J. Test criteria and method for seismic qualification of concrete expansion anchors. In Proceedings of the Fourth Canadian Conference on Earthquake Engineering, Vancouver, BC, Canada, 15–17 June 1983; pp. 58–69. [Google Scholar]
  17. Collins, D.M.; Klingner, R.E.; Polyzois, D. Load-Deflection Behavior of Cast-in-Place and Retrofit Concrete Anchors Subjected to Static, Fatigue, and Impact Tensile Loads; CTR 1126-1; Center for Transportation Research, University of Texas at Austin: Austin, TX, USA, 1989. [Google Scholar]
  18. Klingner, R.E.; Graves, H.L. Anchor Bolt Behavior and Strength During Earthquakes; US Nuclear Regulatory Commission (NRC): Washington, DC, USA, 1994. [Google Scholar]
  19. Ahmed, L.T.; Braimah, A. Behaviour of undercut anchors subjected to high strain rate loading. Procedia Eng. 2017, 210, 326–333. [Google Scholar] [CrossRef]
  20. Chen, Z.; Nassiri, S.; Lamanna, A.; Cofer, W. Investigation of pull-through and pullout failure modes of torque-controlled expansion anchors. ACI Struct. J. 2020, 117, 17–27. [Google Scholar] [CrossRef]
  21. Gallo, P.Q.; Moghaddasi, M.; Pampanin, S.; Bergmeister, K. Shake table tests of post-installed anchors with supplemental damping. ACI Struct. J. 2018, 115, 595–606. [Google Scholar] [CrossRef]
  22. Ghobarah, A.; Aziz, T. Seismic qualification of expansion anchors to Canadian nuclear standards. Nucl. Eng. Des. 2004, 228, 377–392. [Google Scholar] [CrossRef]
  23. Hoehler, M.S.; Mahrenholtz, P.; Eligehausen, R. Behavior of Anchors in Concrete at Seismic-Relevant Loading Rates. ACI Struct. J. 2011, 108, 238–247. [Google Scholar]
  24. Lotze, D.; Klingner, R.E.; Graves, H.L., III. Static behavior of anchors under combinations of tension and shear loading. In Proceedings of the International Symposium on Connections between Steel and Concrete, Stuttgart, Germany, 10–12 September 2001; pp. 118–128. [Google Scholar]
  25. Tarawneh, A.N.; Ross, B.E.; Cousins, T.E. Tensile behavior and design of adhesive anchors embedded in thin concrete members. PCI J. 2020, 65, 51–64. [Google Scholar] [CrossRef]
  26. Tarawneh, A.N.; Ross, B.E.; Cousins, T.E. Tensile Behavior and Design of Screw Anchors in Thin Concrete Members. ACI Struct. J. 2020, 117, 91–102. [Google Scholar] [CrossRef]
  27. Tarawneh, A.N.; Saleh, E.; Dwairi, H.M.; Majdalaweyh, S.A. Design and strength reduction factors calibration of adhesive anchors embedded in thin concrete members. Structures 2022, 40, 213–222. [Google Scholar] [CrossRef]
  28. Bang, J.S.; Kwon, Y.; Ahn, J.-H.; Yim, H.J. Pull-out behavior evaluation of torque-controlled expansion anchors under various installation conditions of concrete. Case Stud. Constr. Mater. 2022, 16, e00796. [Google Scholar] [CrossRef]
  29. Bokor, B.; Sharma, A. Numerical investigations on non-rectangular anchor groups under shear loads applied perpendicular or parallel to an edge. CivilEng 2021, 2, 692–711. [Google Scholar] [CrossRef]
  30. Nilforoush, R.; Nilsson, M.; Elfgren, L.; Ožbolt, J.; Hofmann, J.; Eligehausen, R. Tensile capacity of anchor bolts in uncracked concrete: Influence of member thickness and anchor’s head size. ACI Struct. J. 2017, 114, 1519–1530. [Google Scholar] [CrossRef]
  31. Obayes, O.; Gad, E.; Lee, J.; Pokharel, T.; Abdouka, K. Assessment of the tensile behaviour of cast-in headed anchors with void formers in early age concrete. Constr. Build. Mater. 2022, 317, 125851. [Google Scholar] [CrossRef]
  32. Cannon, R.W. Expansion anchor performance in cracked concrete. ACI Struct. J. 1981, 78, 471–479. [Google Scholar]
  33. Copley, J.D.; Burdette, E.G. Behavior of steel-to-concrete anchorages in high moment regions. J. Proc. 1985, 82, 180–187. [Google Scholar]
  34. Eligehausen, R.; Fuchs, W.; Mayer, B. Load bearing behavior of anchor fastenings in tension. Betonw. Fert. 1987, 12, 826–832. [Google Scholar]
  35. Eligehausen, R.; Balogh, T. Behavior of fasteners loaded in tension in cracked reinforced concrete. ACI Struct. J. 1995, 92, 365–379. [Google Scholar]
  36. Rodriguez, M. Behavior of anchors in uncracked concrete under static and dynamic tensile loading. Master’s Thesis, University of Texas at Austin, Austin, TX, USA, 1995. [Google Scholar]
  37. Rodriguez, M.; Lotze, D.; Gross, J.H.; Zhang, Y.-G.; Klingner, R.; Graves, H. Dynamic behavior of tensile anchors to concrete. Struct. J. 2001, 98, 511–524. [Google Scholar]
  38. Hashimoto, J.; Takiguchi, K. Experimental study on pullout strength of anchor bolt with an embedment depth of 30 mm in concrete under high temperature. Nucl. Eng. Des. 2004, 229, 151–163. [Google Scholar] [CrossRef]
  39. Muratli, H.; Klingner, R.E.; Graves, H.L., III. Breakout capacity of anchors in concrete—Part 2: Shear. Struct. J. 2004, 101, 821–829. [Google Scholar]
  40. Shirvani, M.; Klingner, R.E.; Graves, H.L., III. Breakout capacity of anchors in concrete part 1: Tension. Struct. J. 2004, 101, 812–820. [Google Scholar]
  41. Abdul-Hamid, A.; Braimah, A.; Tai, F. Impact load effects on screw anchors in concrete. Eng. Struct. 2022, 251, 113491. [Google Scholar] [CrossRef]
  42. Neupane, C.C.; Lee, J.; Pokharel, T.; Tsang, H.-H.; Gad, E. Development and challenges in finite element modelling of post-installed anchors in concrete. Struct. Infrastruct. Eng. 2023, 1–22. [Google Scholar] [CrossRef]
  43. Mahrenholtz, P.; Wood, R.L. European Seismic Performance Categories C1 and C2 for Post-Installed Anchors. ACI Struct. J. 2020, 117, 31. [Google Scholar]
  44. Liu, H.; Zhao, J.; Davis, T. Novel adhesive anchoring system through engineered adhesive-concrete interface. Structures 2021, 33, 947–956. [Google Scholar] [CrossRef]
  45. AC01–Acceptance Criteria for Expansion Anchors in Concrete and Masonry Elements; ICC Evaluation Service Inc.: Whittier, CA, USA, 2010.
  46. ASTM E 488-96; Standard Test Methods for Strength of Anchors in Concrete and Masonry Elements. American Society for Testing and Materials (ASTM): West Conshohocken, PA, USA, 1996.
  47. ACI 318-19; Building Code Requirements for Structural Concrete and Commentary. ACI: Farmington Hills, MI, USA, 2019.
  48. Eligehausen, R.; Mallée, R.; Silva, J.F. Anchorage in Concrete Construction; John Wiley & Sons: Berlin, Germany, 2006. [Google Scholar]
  49. Eligehausen, R.; Pusill-Wachtsmuth, P. State-of-the-Art: Fixing Technology for Reinforced Concrete; IVBH Report S-19/82; IABSE: Berlin, Germany, 1982. (In German) [Google Scholar]
  50. Pusill-Wachtsmuth, P. Load-Bearing Behaviour of Metal Expansion Anchors under Axial Tension for Concrete and Splitting Failure. Ph.D. Thesis, Universität Stuttgart, Stuttgart, Germany, 1982; pp. 1992–1994. (In German). [Google Scholar]
  51. Eligehausen, R.; Fuchs, W.; Mayer, B. Load-bearing behaviour of fastenings with anchors under tension loading. Beton + Fert.-Tech. 1987, 12, 826–832. (In German) [Google Scholar]
  52. ACI 349–90; Code Requirements for Nuclear Safety Related Concrete Structures, Appendix B–Steel Embedments. American Concrete Institute: Farmington Hills, MI, USA, 1990.
  53. Paschen, H.; Schönhoff, T. Investigation on Shear Bolts in Concrete Made from Concrete Steel; Deutscher Ausschuss für Stahlbeton: Berlin, Germany, 1983; pp. 105–149. (In German) [Google Scholar]
  54. Eligehausen, R.; Mallée, R.; Rehm, G. Befestigungstechnik (Fastening Technique) Betonkalender 1997; Part II; Ernst Sohn: Berlin, Germany, 1997; pp. 609–753. [Google Scholar]
  55. Eligehausen, R.; Hofmann, J. Experimentelle und Numerische Untersuchungen an Befestigungen am Bauteilrand unter Querlast; Institut für Werkstoffe im Bauwesen, Universität Stuttgart, for the Deutsche Forschungsgemeinschaft: Berlin, Germany, 2003. [Google Scholar]
  56. Shaikh, A.F.; Yi, W. In-place strength of welded headed studs. PCI J. 1985, 30, 56–81. [Google Scholar] [CrossRef]
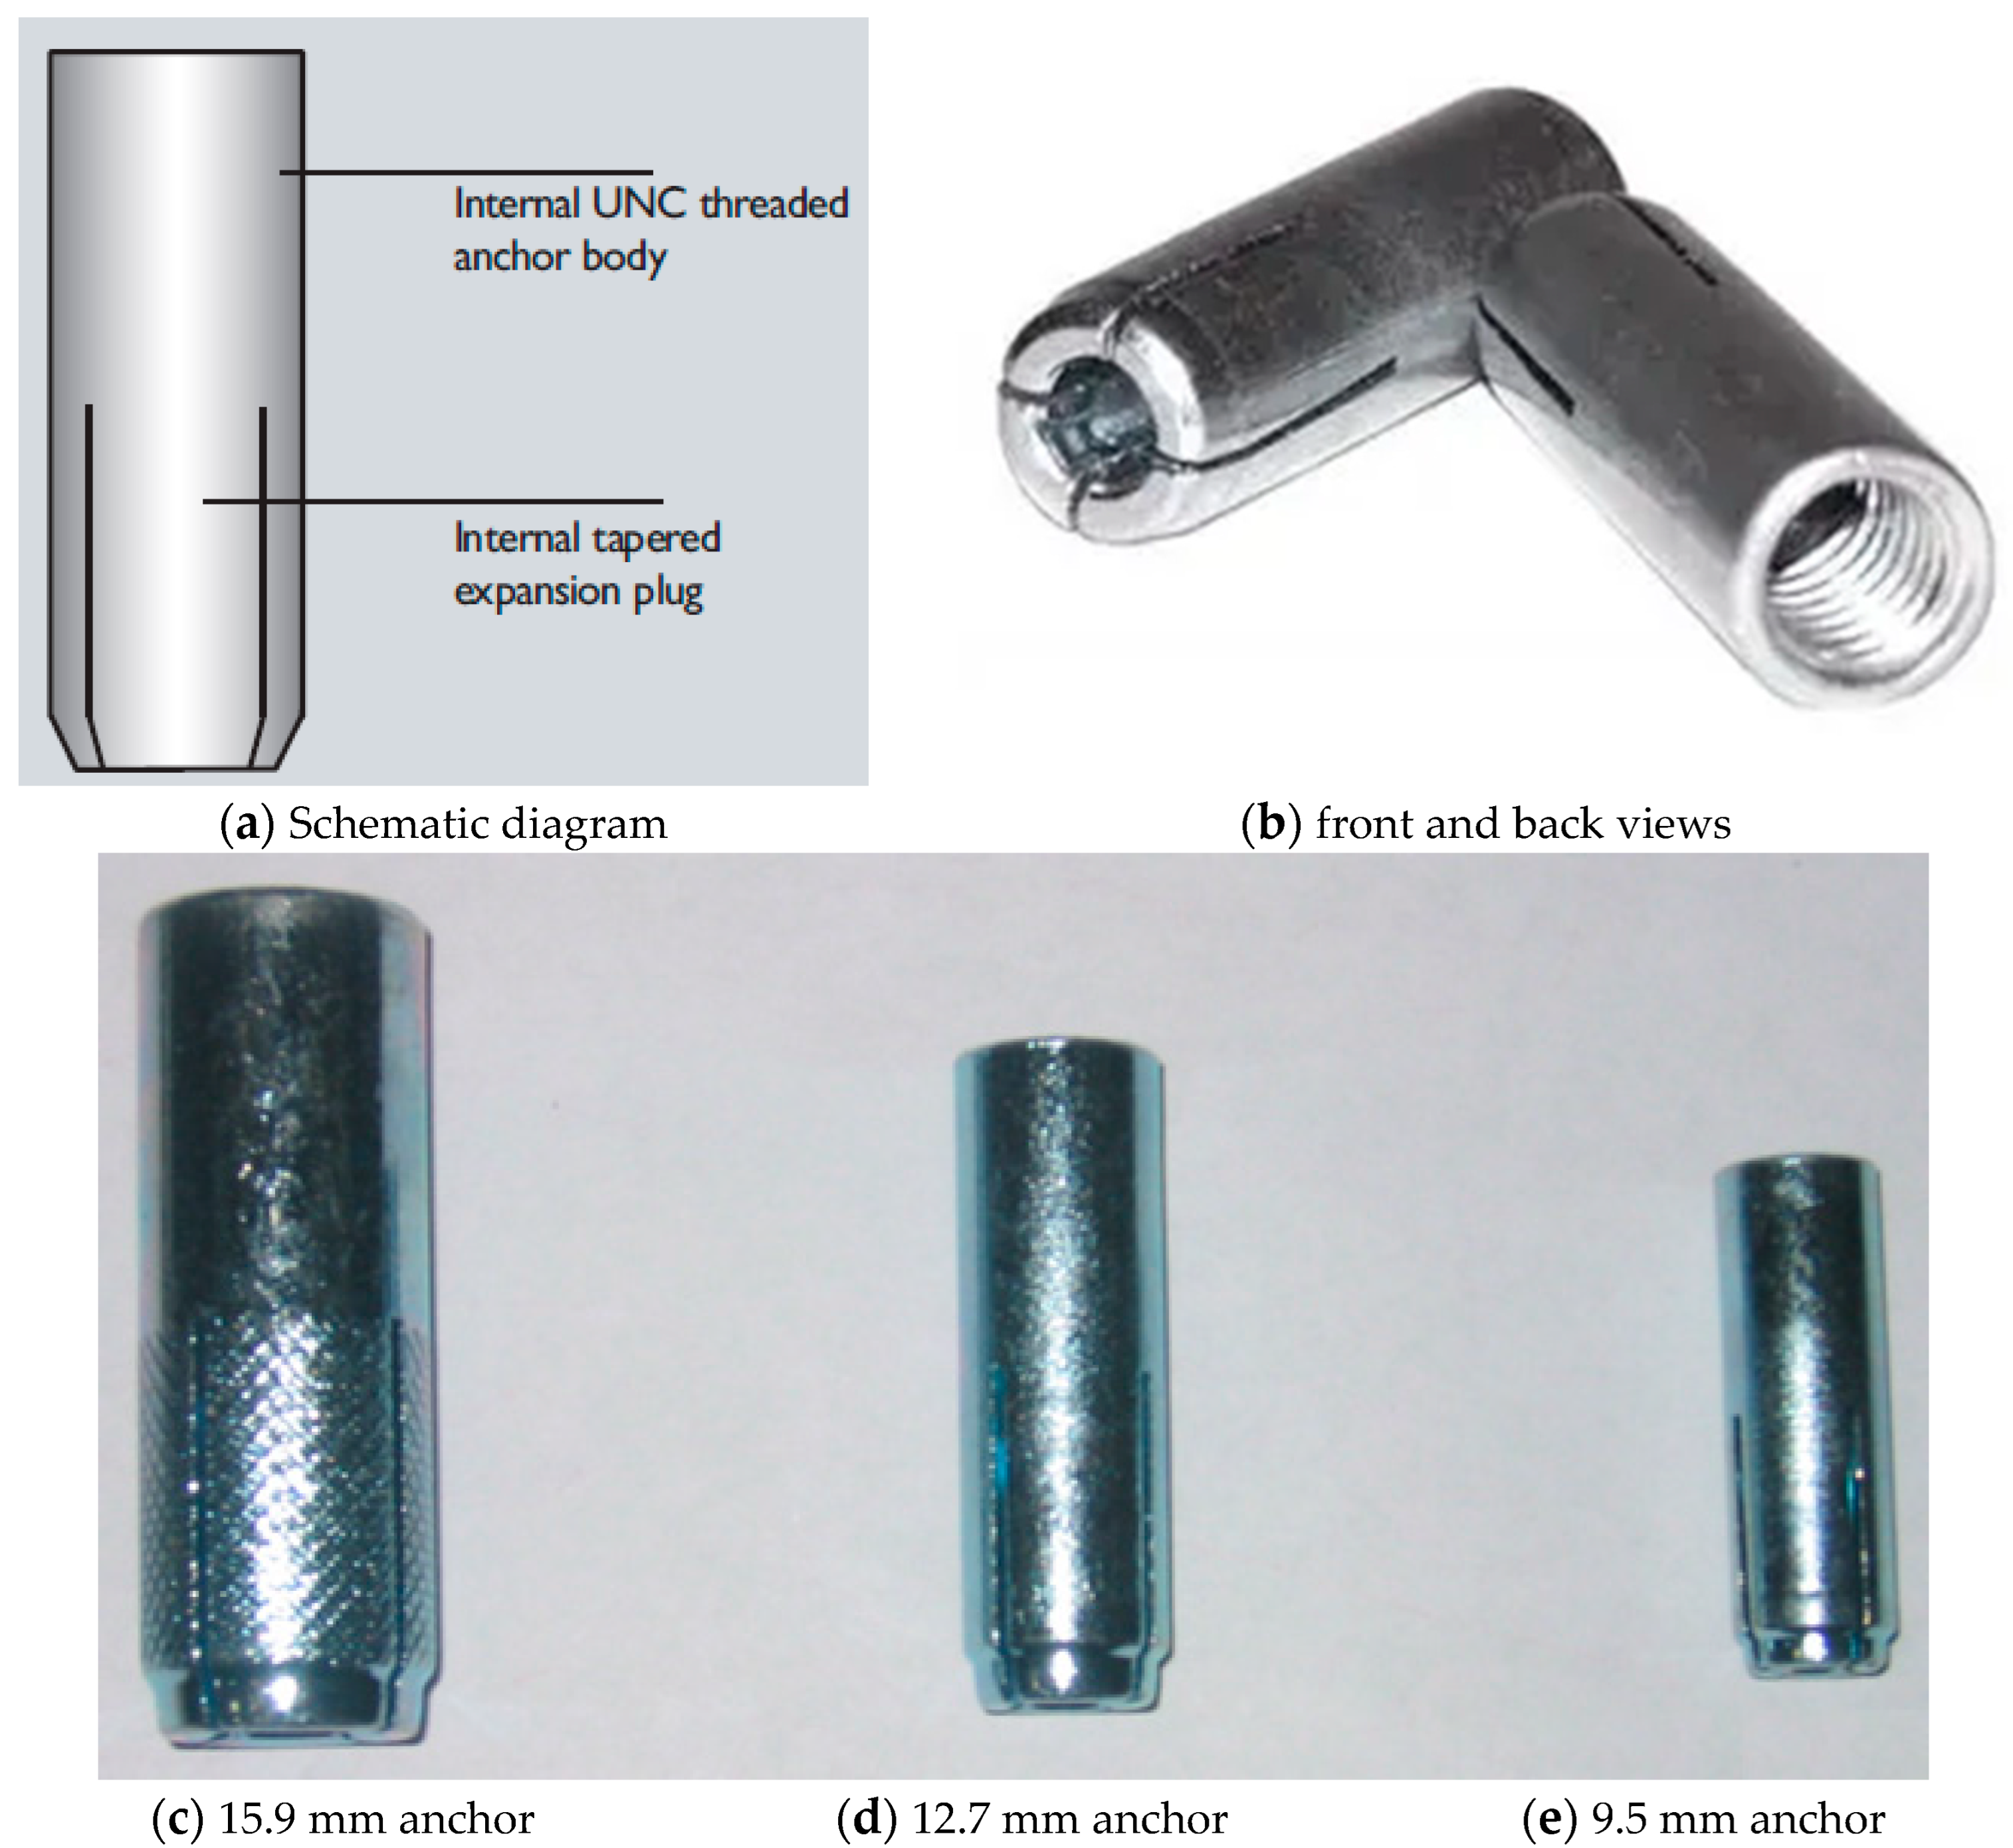
Figure 1. Example of drop-in anchors as per UCAN [6].
Buildings 14 02021 g001
Figure 2. Installation process of drop-in anchors.
Buildings 14 02021 g002
Figure 3. Research methodology adopted in this study.
Buildings 14 02021 g003
Figure 4. Failure modes of anchors under tension loading as per ACI 355.2-04 [2].
Buildings 14 02021 g004
Figure 5. Failure modes of anchors under shear loading as per ACI 355.2-4 [2].
Buildings 14 02021 g005
Figure 6. The shear test setup.
Buildings 14 02021 g006
Figure 7. The tension test setup.
Buildings 14 02021 g007
Figure 8. Loading pattern as per ACI 355.2-4 [2].
Buildings 14 02021 g008
Figure 9. Load vs. time for the cyclic shear test of a 9.5 mm anchor at 0.1 Hz.
Buildings 14 02021 g009
Figure 10. Load vs. displacement for the cyclic shear test of a 9.5 mm anchor at 0.1 Hz.
Buildings 14 02021 g010
Figure 11. Load vs. displacement for the cyclic shear test of a 9.5 mm anchor at 2 Hz.
Buildings 14 02021 g011
Figure 12. A 9.5 mm anchor after cyclic shear tests at 0.1 and 2 Hz (no shear failure).
Buildings 14 02021 g012
Figure 13. View of the 15.90 mm diameter anchor after a cyclic shear test at 0.1 Hz (no shear failure).
Buildings 14 02021 g013
Figure 14. Cyclic tensile load history for a tested 15.9 mm anchor.
Buildings 14 02021 g014
Figure 15. Cyclic tensile load vs. axial displacement for a tested 15.9 mm anchor.
Buildings 14 02021 g015
Figure 16. View of the 12.7 mm diameter anchor shear failure and concrete pry-out after ultimate shear test.
Buildings 14 02021 g016
Figure 17. Load vs. displacement for the ultimate shear test of a 9.5 mm anchor.
Buildings 14 02021 g017
Figure 18. Load vs. displacement for the ultimate shear test of a 12.7 mm anchor.
Buildings 14 02021 g018
Figure 19. Load vs. displacement for the ultimate shear test of a 15.9 mm anchor.
Buildings 14 02021 g019
Figure 20. Ultimate tension test of a 9.5 mm anchor.
Buildings 14 02021 g020
Figure 21. Ultimate tension test of a 12.7 mm anchor.
Buildings 14 02021 g021
Figure 22. The ultimate tension test of a 15.9 mm anchor.
Buildings 14 02021 g022
Figure 23. Classification of tensile load–displacement behavior as per ACI 355.2-04 [2].
Buildings 14 02021 g023
Table 1. Available models to predict anchor capacities of various failure modes.
Main FormulasDefinition of Parameters
Concrete breakout strength of anchor subjected to tension
ACI 318-19
N c b =   N b A N c / A N c o ψ e d   ψ c   ψ c p
where:
N b =   k c   λ a f c h e f 1.5
ACI 349-90
N c b =   0.96 h e f 2 f c c
Eligehausen et al. [51]
N c b =   k h e f 1.5 f c c
Eligehusen and Pusill-Wachtsmuth [49]
N c b =   6.4 h e f 1.5 f c c 2 / 3
Pusill-Wachtsmuth [50]
N c b =   0.64 h e f 2 f c c 2 / 3 1 + 1.45 d a / h e f
ψ e d   = 1.0   ( no   edge   effect ) ;   ψ c   = 1.4   ( uncracked   concrete ) ;   ψ c p   = 1.0   ( no   critical   edge   effect )
λ a   = 1.0 (normal concrete)
k c   = 7 (for post-installed anchors)
k c   = 10 (for cast-in anchors, upper limit)
A N c o = 9 h e f 2
A N c = A N c o (for single anchors far from the edge)
h e f = effective embedment depth
k = 13.5 for expansion anchors
d a = anchor diameter
l e = 2 d a for torque-controlled expansion anchor
c 1 = anchor edge distance along the force
h = thickness of the concrete member that anchors are attached to
A V c o = 4.5 c 1 2
A V c = 2 1.5 c 1 h   If   h < 1.5 c 1
ψ h = 1.5 c 1 / h 1.0
A s e = cross-sectional area
f u t = ultimate tensile strength
k c p = 1.0   for   h e f < 65   m m
k c p = 2.0   for   h e f 65   m m
k = 13.5 for expansion anchors
f c c = concrete cube compressive strength
= 0.85   f c (Eligehausen et al. [48])
f c = concrete cylinder compressive strength
Note: in all formulas, the parameters are in SI units of mm or MPa
Concrete breakout strength of anchor subjected to shear
ACI 318-19
V c b =   min V b 1 , V b 2 A V c / A V c o ψ e d   ψ c   ψ h
where:
V b 1 =   0.6 l e / d a 0.2 d a λ a f c c 1 1.5
V b 2 =   3.7 λ a f c c 1 1.5
Eligehausen et al. [54]
V b =   0.9 d a f c c l e / d a 0.2 c 1 1.5 A V c / A V c o
Eligehausen and Hofmann [55]
V b =   3 d a α l e β f c c c 1 1.5 A V c / A V c o
where:
α =   0.1 l e / c 1 0.5 ;   and   β =   0.1 d a / c 1 0.2
Paschen and Schonhoff [53]
V b =   f c c 2 / 3 190 + 0.23 c 1 2 A V c / A V c o
ACI 349-90
V b =   0.48 f c c c 1 2 A V c / A V c o
Shaikh and Whayong [56]
V b =   4.8 f c c c 1 1.5 A V c / A V c o
Nominal shear strength
ACI 318-19
V s a =   0.6 A s e f u t
Concrete pry-out strength of anchor subjected to shear
ACI 318-19
V c p =   k c p N c b (for cast-in and expansion anchors)
Table 2. Shear test load data.
Anchor
Size,
mm
Ultimate Load Allowable Load 1.33× Allowable LoadCyclic Shear Test Loads
Vu
(kN)
Va
(kN)
Vre
(kN)
Veq
(kN)
Vi
(kN)
Vm
(kN)
10 Cycles30 Cycles100 Cycles
9.518.404.606.129.206.904.60
12.724.006.007.9812.009.306.70
15.940.0010.0013.3020.0015.6011.10
Table 3. Tension test load data.
Anchor
Size,
mm
Ultimate Load Allowable Load 1.33× Allowable Load Cyclic Tension Test Loads
Nu
(kN)
Na
(kN)
Nre
(kN)
Neq
(kN)
Ni
(kN)
Nm
(kN)
10 Cycles30 Cycles100 Cycles
9.517.604.405.858.806.604.20
12.727.806.959.2413.9010.406.90
15.938.609.6512.8319.3014.509.70
Table 4. Results from ultimate load tests for selected specimens.
Anchor
Size,
mm
Test TypeTest Failure Load,
kN
Displacement at Failure,
mm
Failure Mode *
9.5Shear19.60 7.52 SF&CS
12.7Shear27.44 8.70 SF&CS
15.9Shear48.20 15.54 SF&CS
9.5Tension19.93 5.22 CB
12.7Tension31.09 3.79 CB
15.9Tension49.50 6.20 CB
* SF&CS: shear failure preceded by concrete spall; CB: concrete breakout.
Table 5. Comparison of experimental results with available models.
Action under ConsiderationMode of Failure and the Associated Available ModelsFor Anchor Size of 9.5 mm
(kN)
For Anchor Size of 12.7 mm
(kN)
For Anchor Size of 15.9 mm
(kN)
TensionConcrete breakout strength of anchors in tension
Average experimental load19.931.149.5
Manufacturer’s listed failure load19.627.448.2
          ACI 318-19, if kc = 711.717.725.6
          ACI 318-19, if kc = 1016.725.236.5
          Eligehausen et al. [51]17.526.438.2
Eligehusen and Pusill-Wachtsmuth [49]14.722.132.0
Pusill-Wachtsmuth [50]12.321.434.9
          ACI 349-907.713.321.7
ShearNormal shear strength
          ACI 318-1917.931.950.0
Concrete breakout strength of anchors in shear
Average experimental load19.627.448.2
Manufacturer’s listed failure load18.424.040.0
          ACI 318-1935.040.545.3
          Eligehausen et al. [54]33.238.443.0
          Eligehausen and Hofmann [55]39.441.343.0
          Paschen and Schonhoff [53]61.261.261.2
                 ACI 349-9070.870.870.8
          Shaikh and Whayong [56]50.150.150.1
Concrete pry-out strength of anchors in shear
          ACI 318-19, if kcp = 111.717.725.6
          ACI 318-19, if kcp = 223.435.351.2
Disclaimer/Publisher’s Note: The statements, opinions and data contained in all publications are solely those of the individual author(s) and contributor(s) and not of MDPI and/or the editor(s). MDPI and/or the editor(s) disclaim responsibility for any injury to people or property resulting from any ideas, methods, instructions or products referred to in the content.