Article

Damage Evaluation of Fabricated Shear Wall Reinforced with Angle Steel Using Acoustic Emission Technology

by
Ruiqing Han
1,2,
Shengli Li
2,* and
Guangming Wu
2
1
School of Civil Engineering, Central South University, Changsha 410083, China
2
School of Civil Engineering, Zhengzhou University, Zhengzhou 450001, China
*
Author to whom correspondence should be addressed.
Buildings 2024, 14(7), 2038; https://doi.org/10.3390/buildings14072038
Submission received: 25 May 2024 / Revised: 18 June 2024 / Accepted: 2 July 2024 / Published: 4 July 2024
(This article belongs to the Section Building Structures)

Abstract

:
The fabricated shear wall with a grouting sleeve is used widely in structural engineering. The damage characteristics of a fabricated shear wall reinforced with angle steel of inadequate grouted material strength were investigated using acoustic emission (AE) technology under a horizontal repeated load. The results showed that evaluation of the AE energy and Ib value exposed the crack expansion and damage evolution of the fabricated shear walls; the sudden rise in the energy level predicted the occurrence of micro-cracks in the shear wall. The trends of the AE accumulated energy and accumulated hysteretic energy of the specimens had a good correlation. The AE Ib value results illustrated that the destruction was most serious inside the shear wall with an inadequate grouted material strength at the failure stage. The trends of AE HI and Sr could better characterize the crack propagation of the shear walls. The AE damage model was proposed based on the Park–Ang damage model incorporating fractal energy density, which could effectively evaluate the damage degree of shear walls under repeated loading.

1. Introduction

Fabricated shear walls are used extensively in practical projects owing to their good mechanical properties and environmental performance [1,2,3]. The main connecting modes of fabricated structures mainly include a pre-hole grouted anchor, bolt, and grouting sleeve [3]; among them, the grouting sleeve connection is adopted worldwide because of its advantages such as its economy rate and convenient detection [4,5]. However, the fabricated shear wall was not properly monitored during the construction process, and the strength of the grouted material could not reach the related criteria [3]; thus, it is essential to reinforce the connecting nodes of a fabricated shear wall with angle steel when the strength of the grouted material in the grouting sleeve is inadequate [6,7]. The information obtained from accelerometers, displacement gauges, and strain gauges provide some of the surface information during the destruction of specimens [8,9,10,11]; the effective evaluation of shear walls should concentrate on the internal damage evolution of the structure, which could provide some technological support for the seismic capability assessment of shear walls.
Acoustic emission (AE) is a passive dynamic non-destructive testing method, which is utilized to describe different damage patterns [12,13,14,15]. The information contained in AE signals could effectively indicate the damaged development of structures during the loading process. Relevant researchers have conducted wide research on the damage assessment of structures relying on the AE technique [16,17,18]. Zhang et al. [17] employed the AE technology on a squat concrete wall under cyclical loading and the result showed the crack expansion of the specimen correlated well with the variation trend of the AE signals. However, the damage evaluation of fabricated shear walls under horizontal low-cycle repeated loads relying on AE technology has rarely been studied. The characteristics of the AE signal could reflect crack propagation and are widely used in the damage assessment of reinforced concrete structures [19,20,21]. The improved b value (Ib value) method could better illustrate the damage evolution of a structure during the failure process, which considers the amount of AE events and the amplitude range [22]. Zhang et al. [23] evaluated the failure of concrete beam–column joints based on the Ib value method, and the results showed that the trend of the Ib value with loading has good correspondence with the crack expansion. The AE intensity analysis could efficiently excavate valuable messages indicating structural damage [24]. Shahidan et al. [25] studied the damaged degree of reinforced concrete beams using AE technology and discovered that the damage of specimens was classified effectively by relying on the intensity analysis. Thus, the damage evolution of shear walls was investigated relying on AE technology under a horizontal low cyclic load. The quantitative assessment of the damage of shear walls under loading was conducive to understanding better the serviceability of reinforced concrete. Park and Ang [26,27] established the seismic damage model based on a large number of concrete structures, which considered both structural deformation and energy dissipation. However, the damage index is inadequate in that the damage value exceeds the theoretical limit value of destroyed structures. Thus, it is significant to investigate the association between AE data and the Park–Ang damage index.
To investigate the crack expansion and damage characteristics of a fabricated shear wall reinforced with angle steel of inadequate strength under horizontal and low-cycle repeated loads, five fabricated shear walls connected with a grouting sleeve were designed, and the AE technology was used to monitor the damage behavior of the specimens. The damage evolution of shear walls was investigated relying on the AE energy method, Ib value method, and intensity analysis method, and finally, the AE damage model of shear walls with repeated loads was proposed relying on the Park–Ang damage model, incorporating fractal energy density, each of which provide some technological support for the seismic capability assessment of shear walls.

2. Experimental Program

2.1. Test Specimens

The dimensions of the shear wall were 1400 mm × 200 mm × 2530 mm (b × t × h) according to the standard [28]. The rebars of the fabricated shear walls are shown in Figure 1. The mechanical properties of the rebars of the shear walls are illustrated in Table 1. Five working conditions of shear walls were designed, including a shear wall with a high strength of grouted material, a shear wall with inadequate strength, and shear walls reinforced with three different angle steels, with one specimen designed for each working condition [2,6]. Cement slurry was utilized in the specimens of inadequate strength, and the compressive strength was 38.6 MPa. The strength of the grouted material with high strength exceeded 90 MPa, which met the requirements of the standards [29,30].
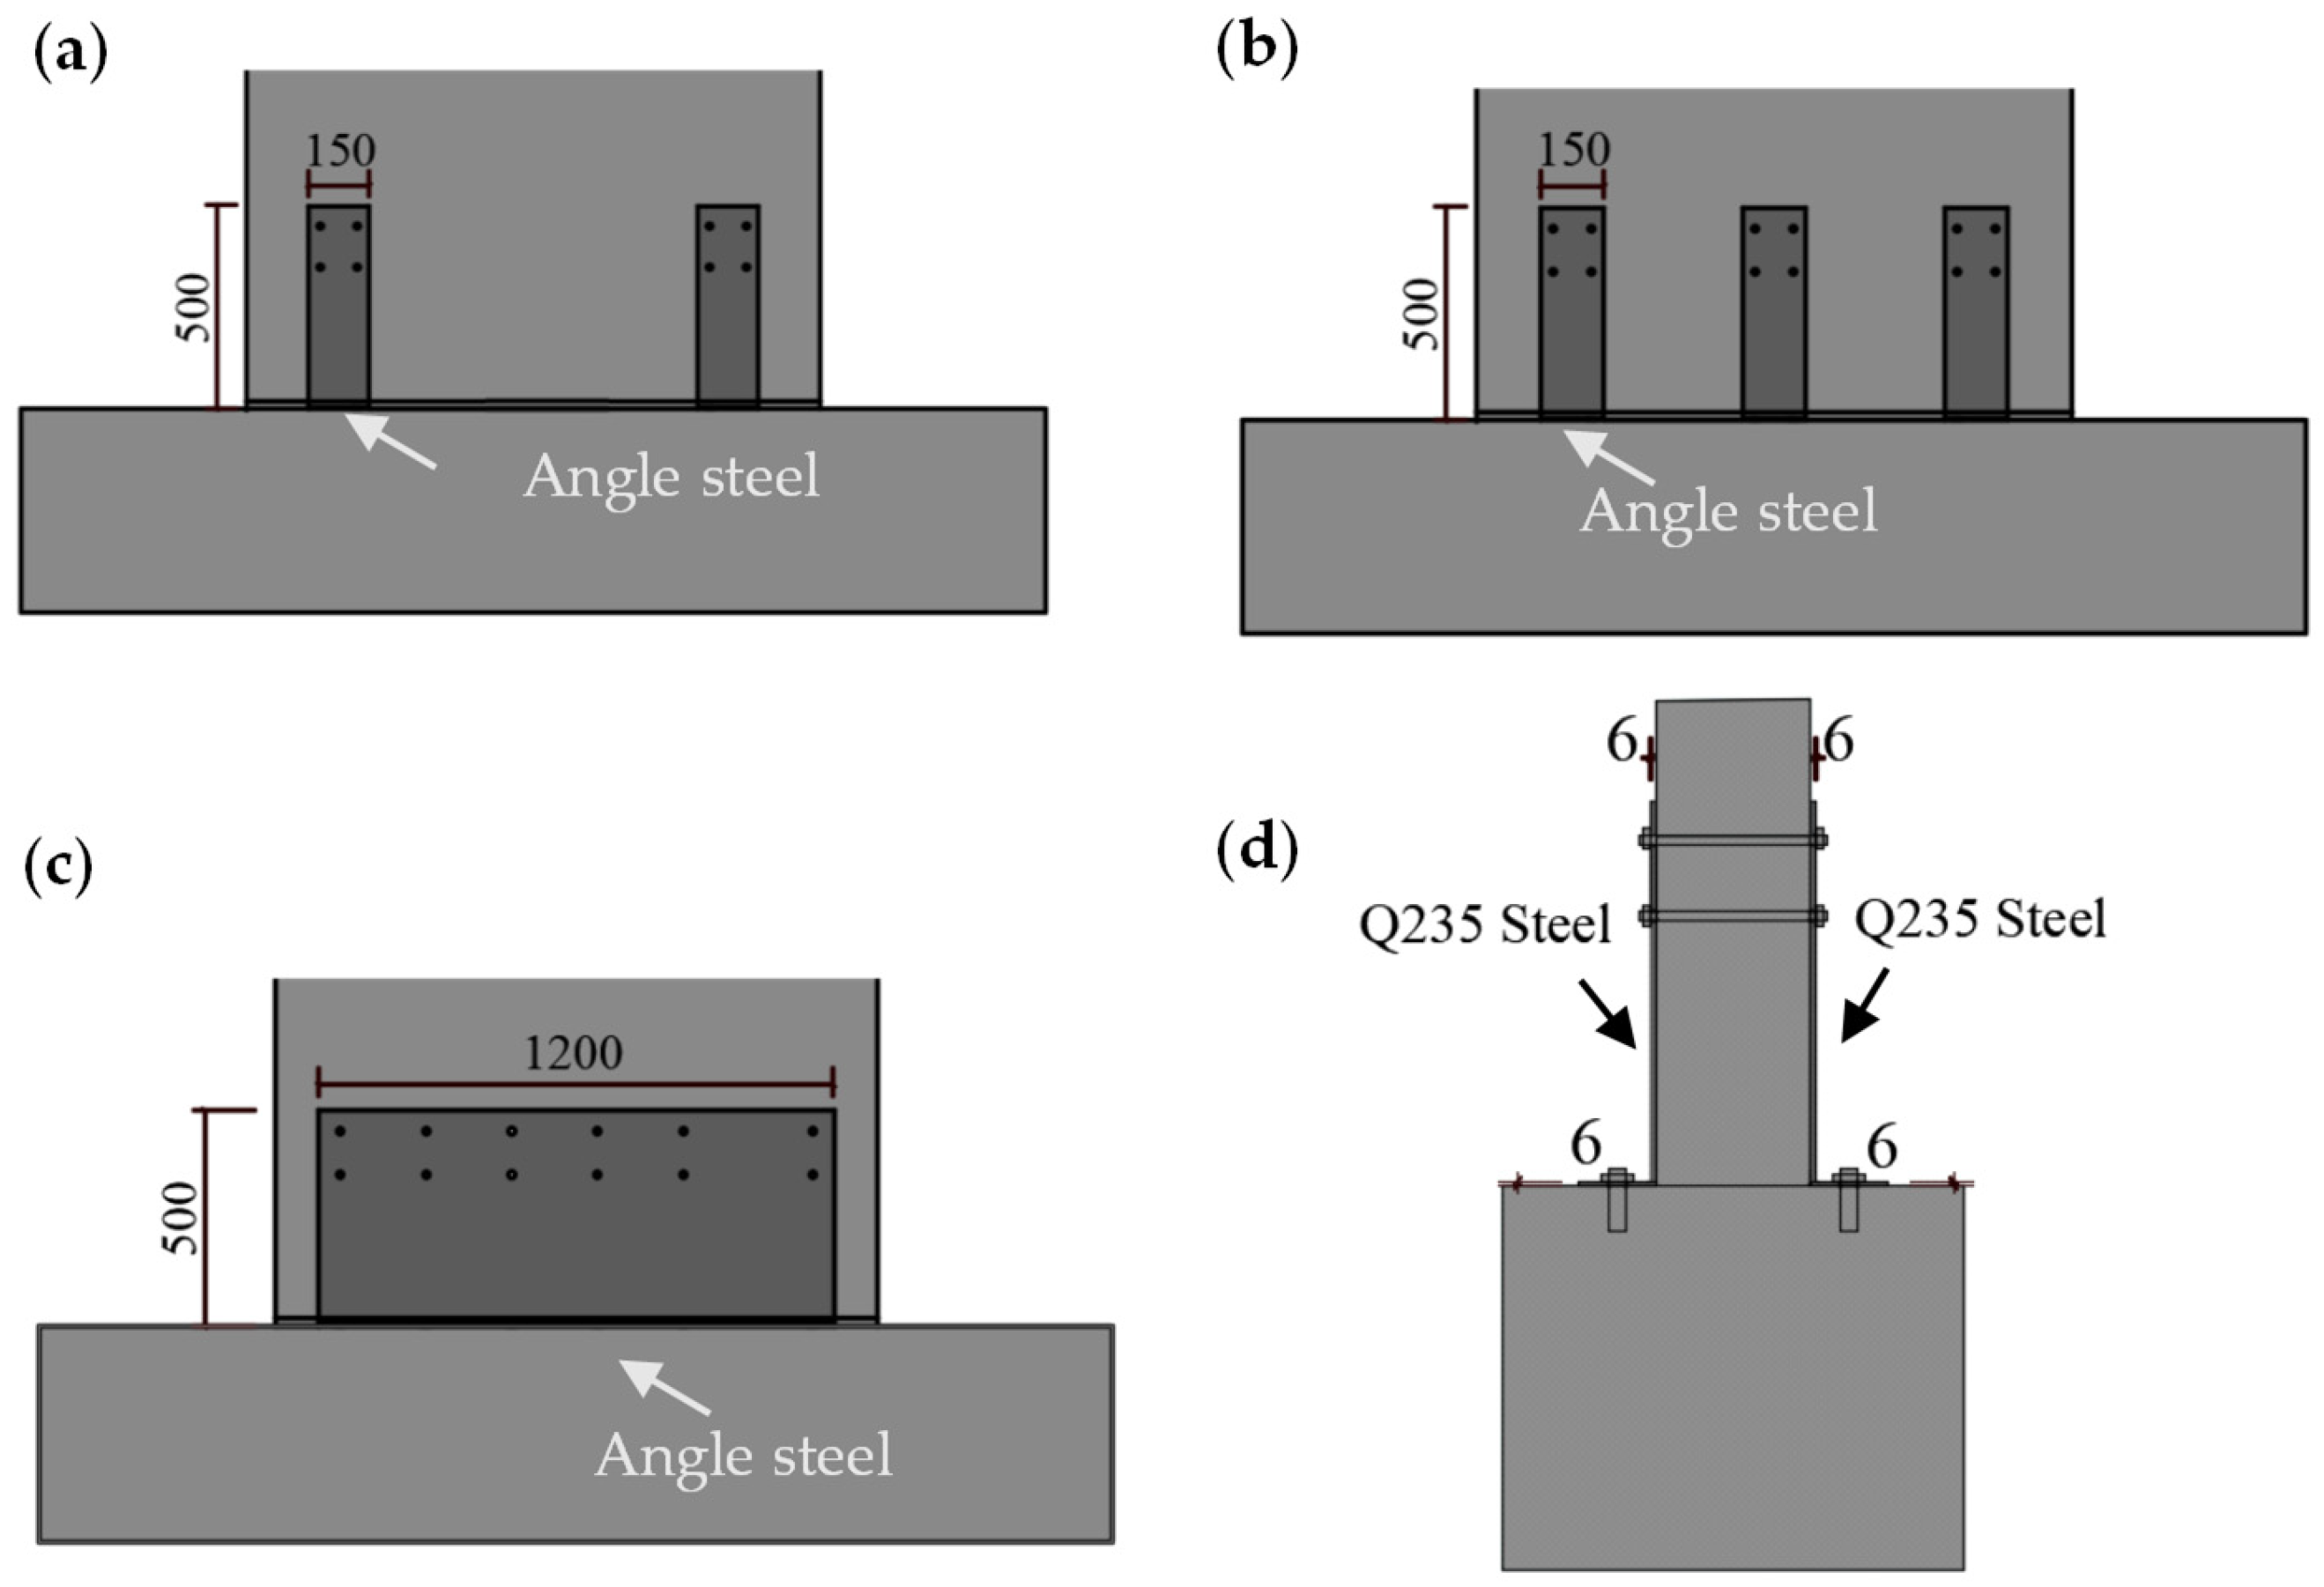
The angle steels were connected to the shear walls and ground beam using adhesives and screws. The shape of the angle steel was L-shaped as shown in Figure 2. The first strengthening method was that two angle steels were laid out at the edges of the shear wall, the second method was that the angle steels were laid out at the edges and middle of the specimen, and the third method was to lay out angle steel with a length of 1200 mm on the shear wall. The specimens were named GPW, CPW, CPW-S1, CPW-S2, and CPW-S3, respectively. The rules for the naming of the specimens are shown below: G stands for normal grouted material, C stands for cement grout, and the numbers 1, 2, and 3 represent the ordinal numbers of the reinforcing methods.

2.2. Loading Schedule and AE System

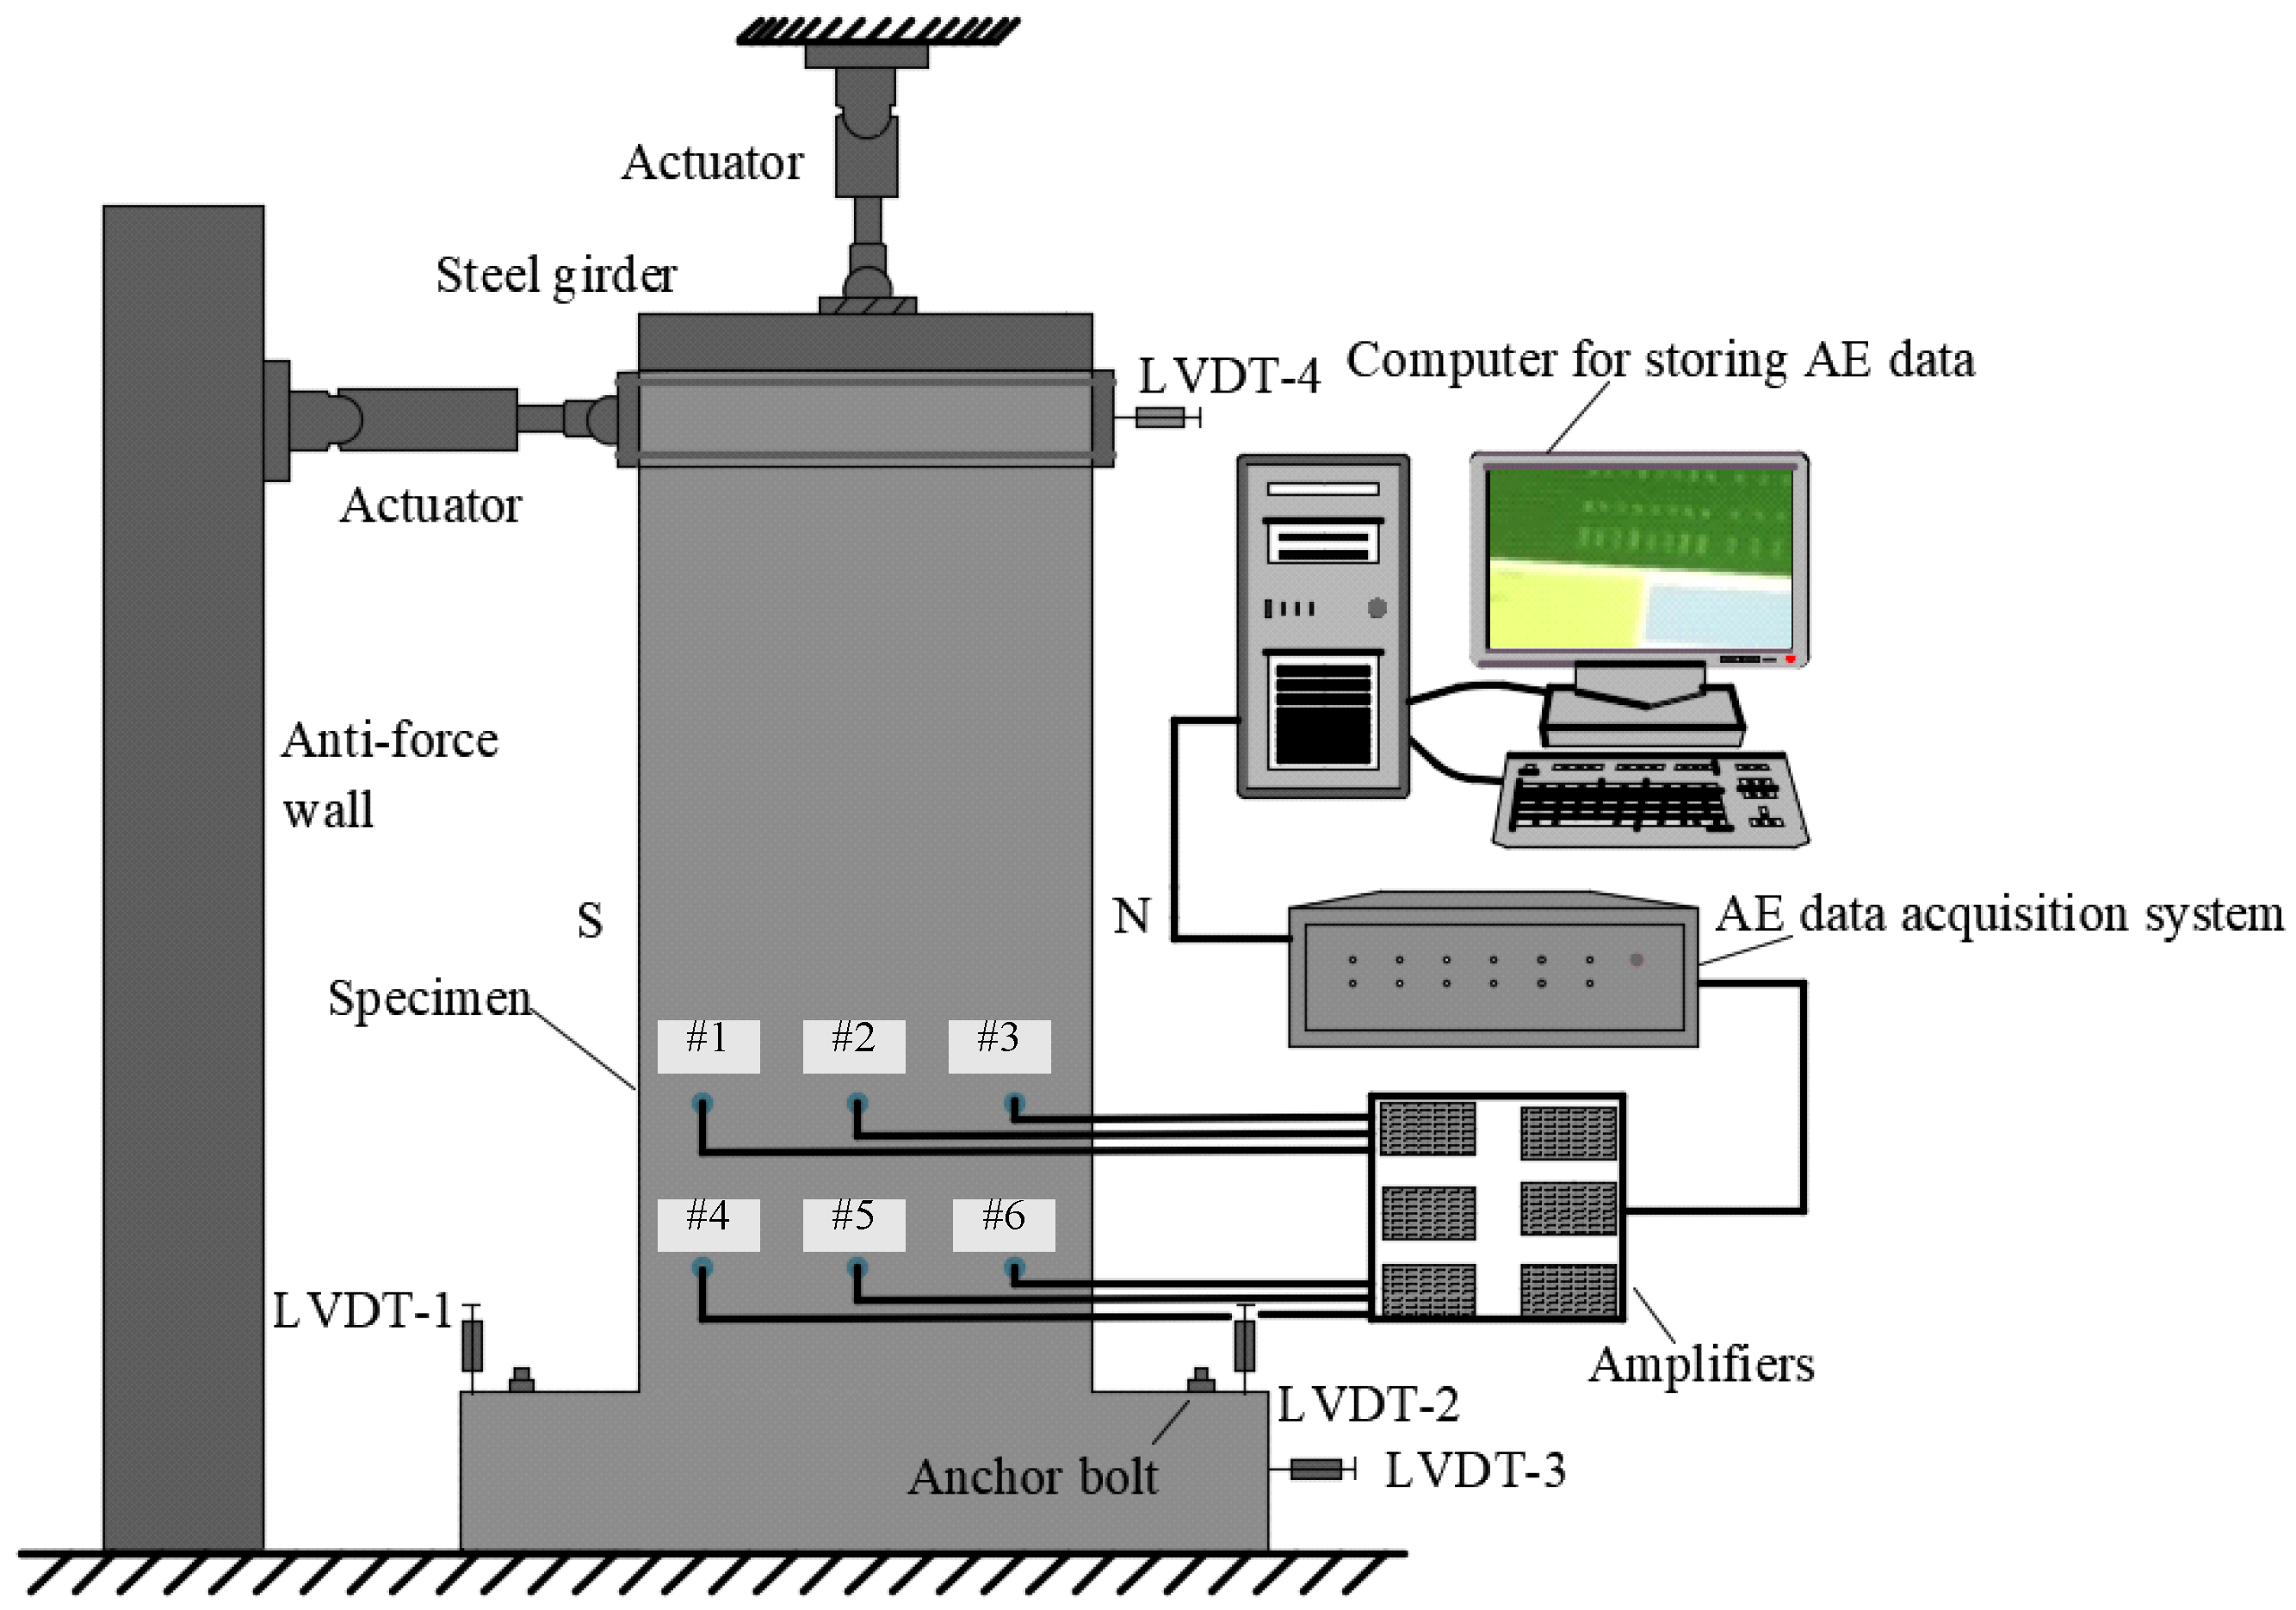
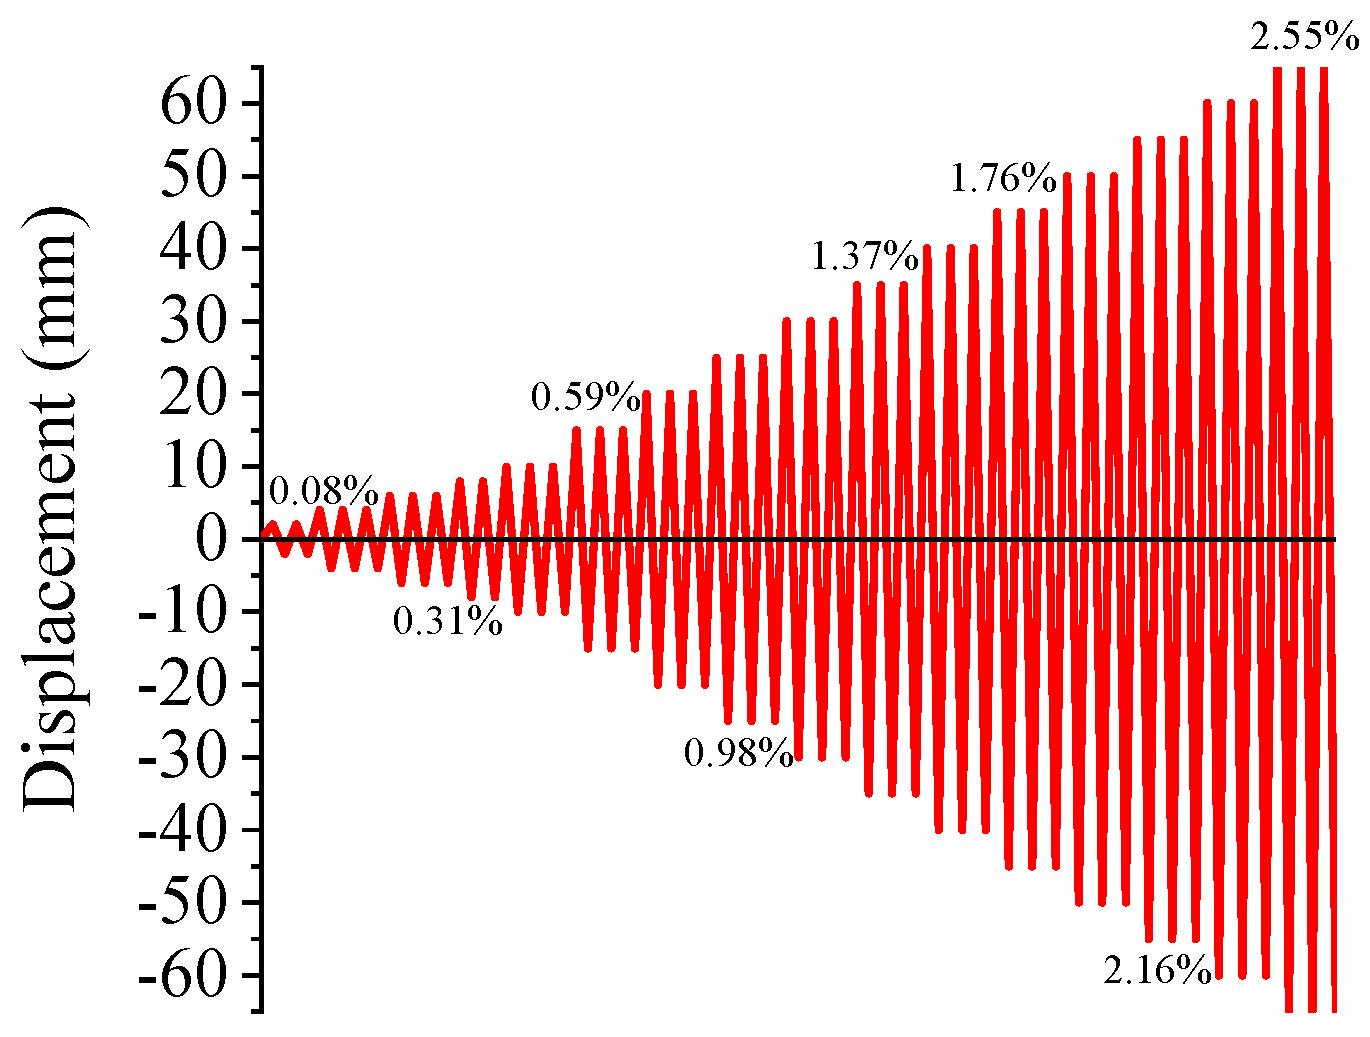
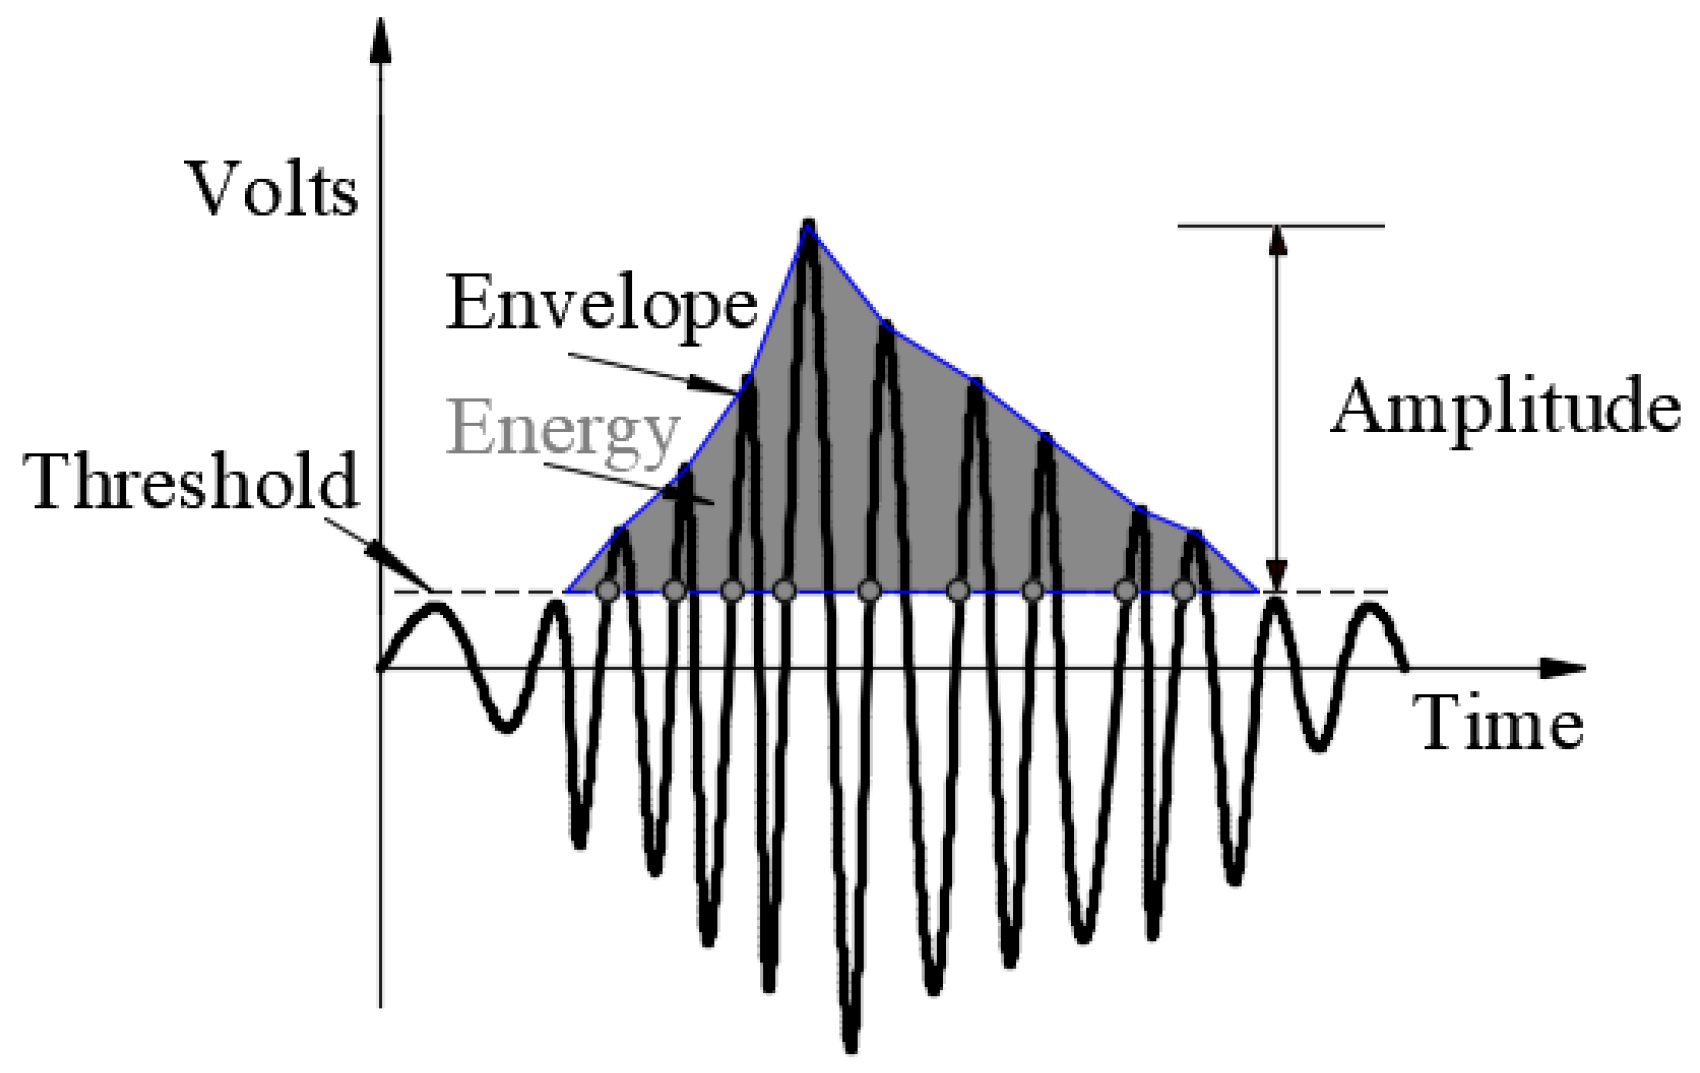
The loading device included the horizontal and vertical load systems, as illustrated in Figure 3. The loading pattern used in the experiment was a quasi-static load, and the loading regime of horizontal force was displacement controlled [31,32]; the loading scheme is shown in Figure 4, and the drift ratio was increased from 0.08% to 2.55%. The AE data acquisition system included an RS-2A sensor, AE analyzer, and preamplifier, as shown in Figure 3. It is worth noting that it is necessary to select a suitable AE sensor according to the propagation characteristics of the AE signal in the shear wall. The propagation characteristics of the AE signal generated by the crack extension were evaluated, and the main frequency of the AE signal was about 50 kHz. To minimize the effect of ambient noise signals on the AE signals, the AE signals ought to be filtered. The ambient noise signals were gathered prior to the experiment. The threshold of the AE signal was identified based on the noise signal waveform, then the noise signals were analyzed with the spectrum approach to acquire the dominant frequency of the noise signals, and the noise signal was filtered with high-pass filtering. Based on the noise situation of the experimental site, the triggering threshold value was 30 dB and the AE sample frequency was 2.5 MHz. The PDT value was 60 µs, the HDT value was 120 µs, and the HLT value was 200 µs. Considering that the damage area of shear walls is mainly distributed in the bottom [32], the AE probes were placed underneath the specimen. The AE parameter energy is the region under the detection envelope, and the AE amplitude is the maximum magnitude value for the waveform of the signal, as illustrated in Figure 5.

3. Results and Discussion

3.1. Destruction of Shear Wall

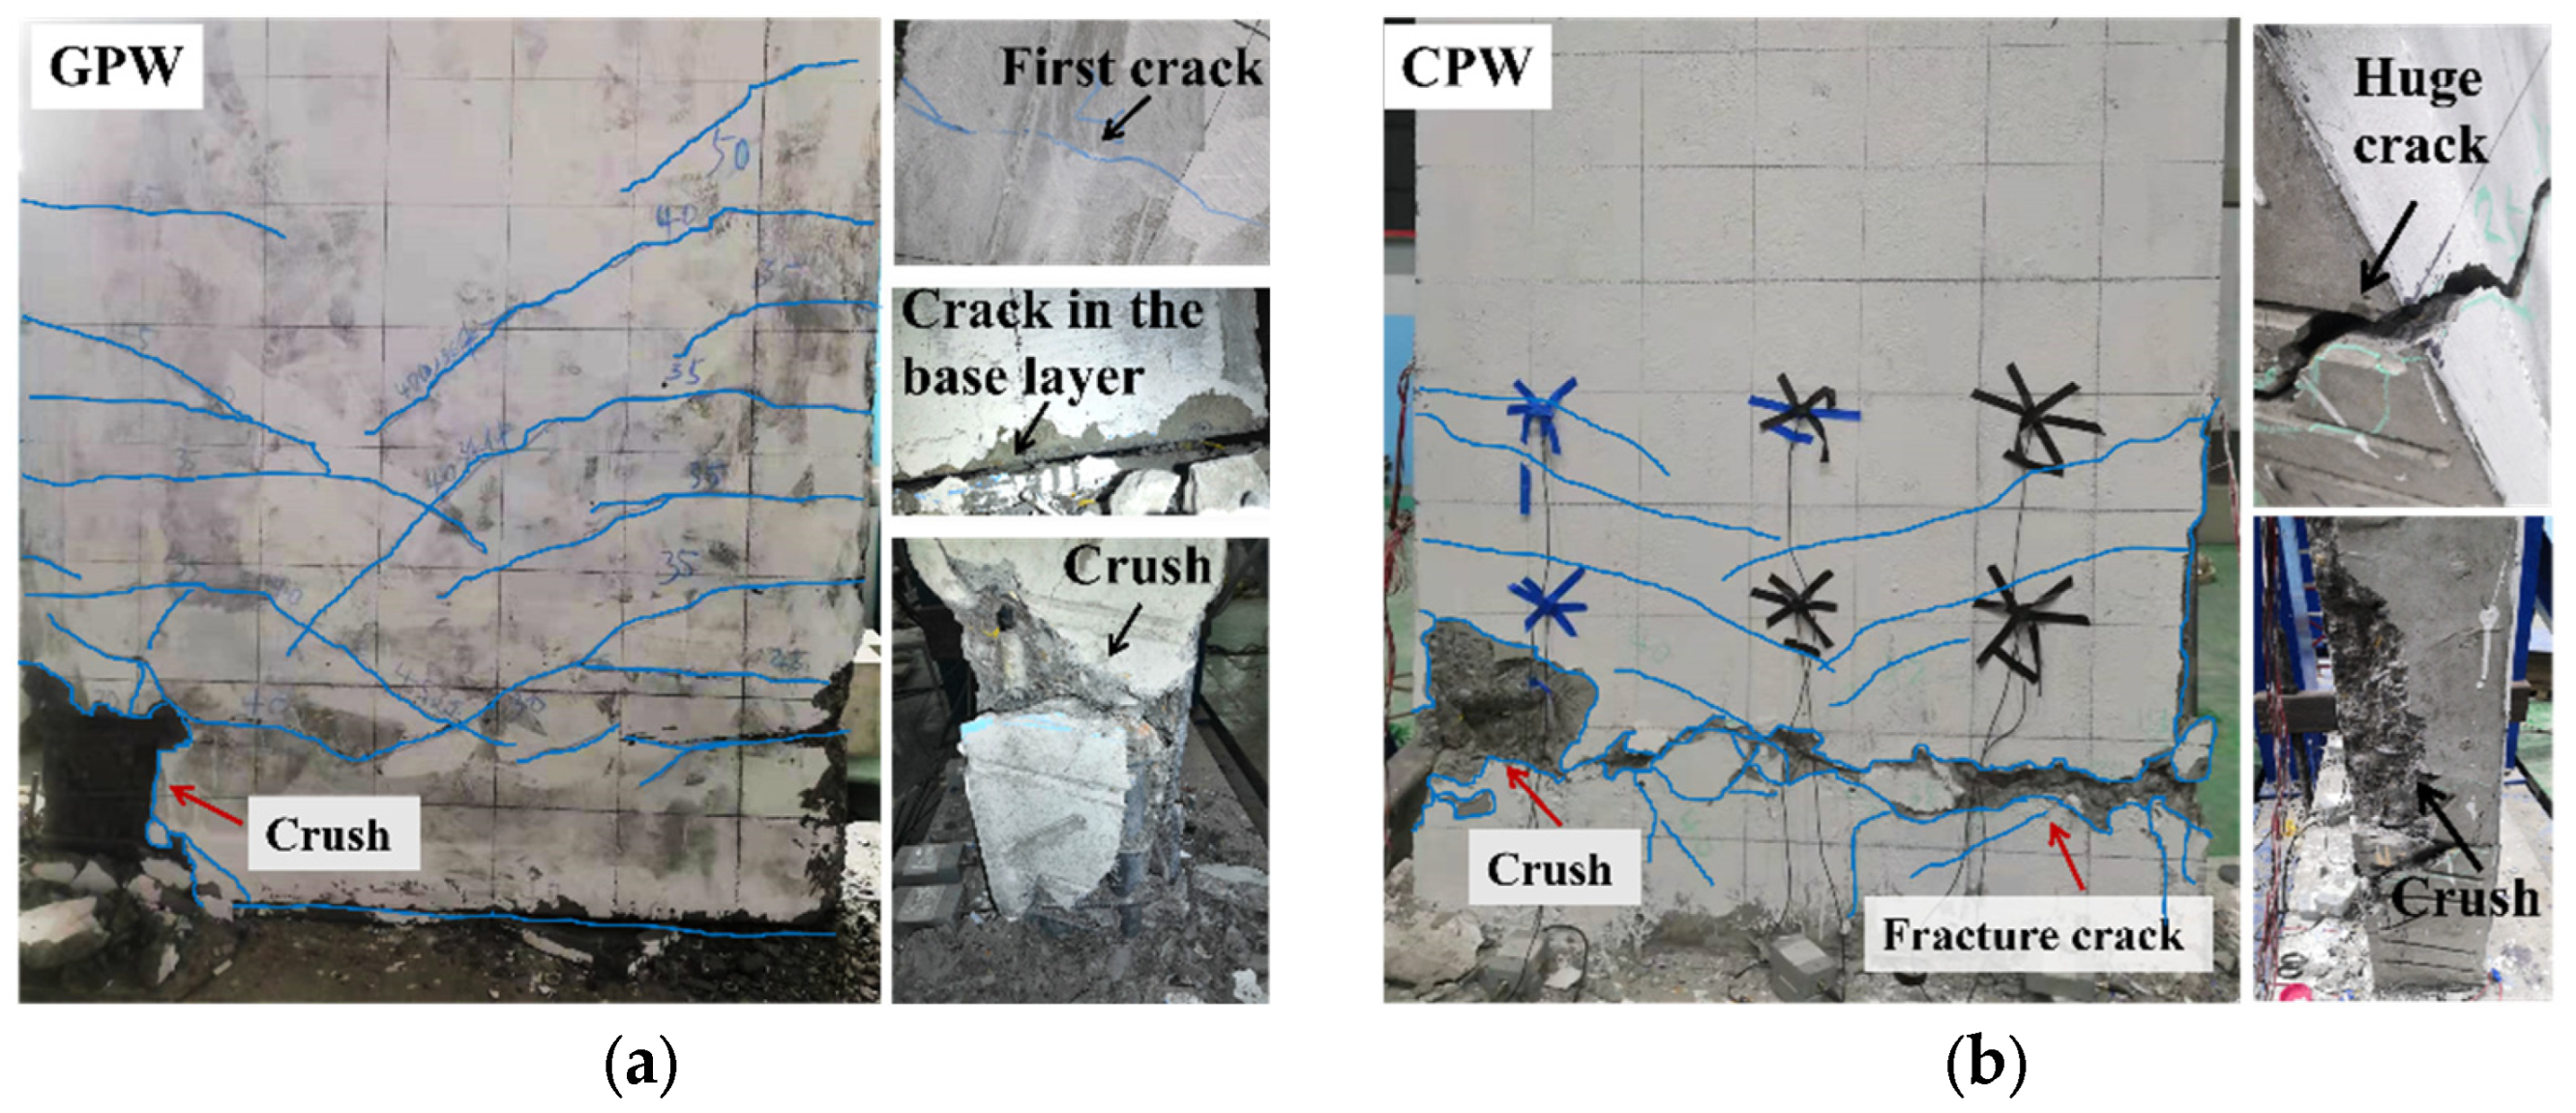
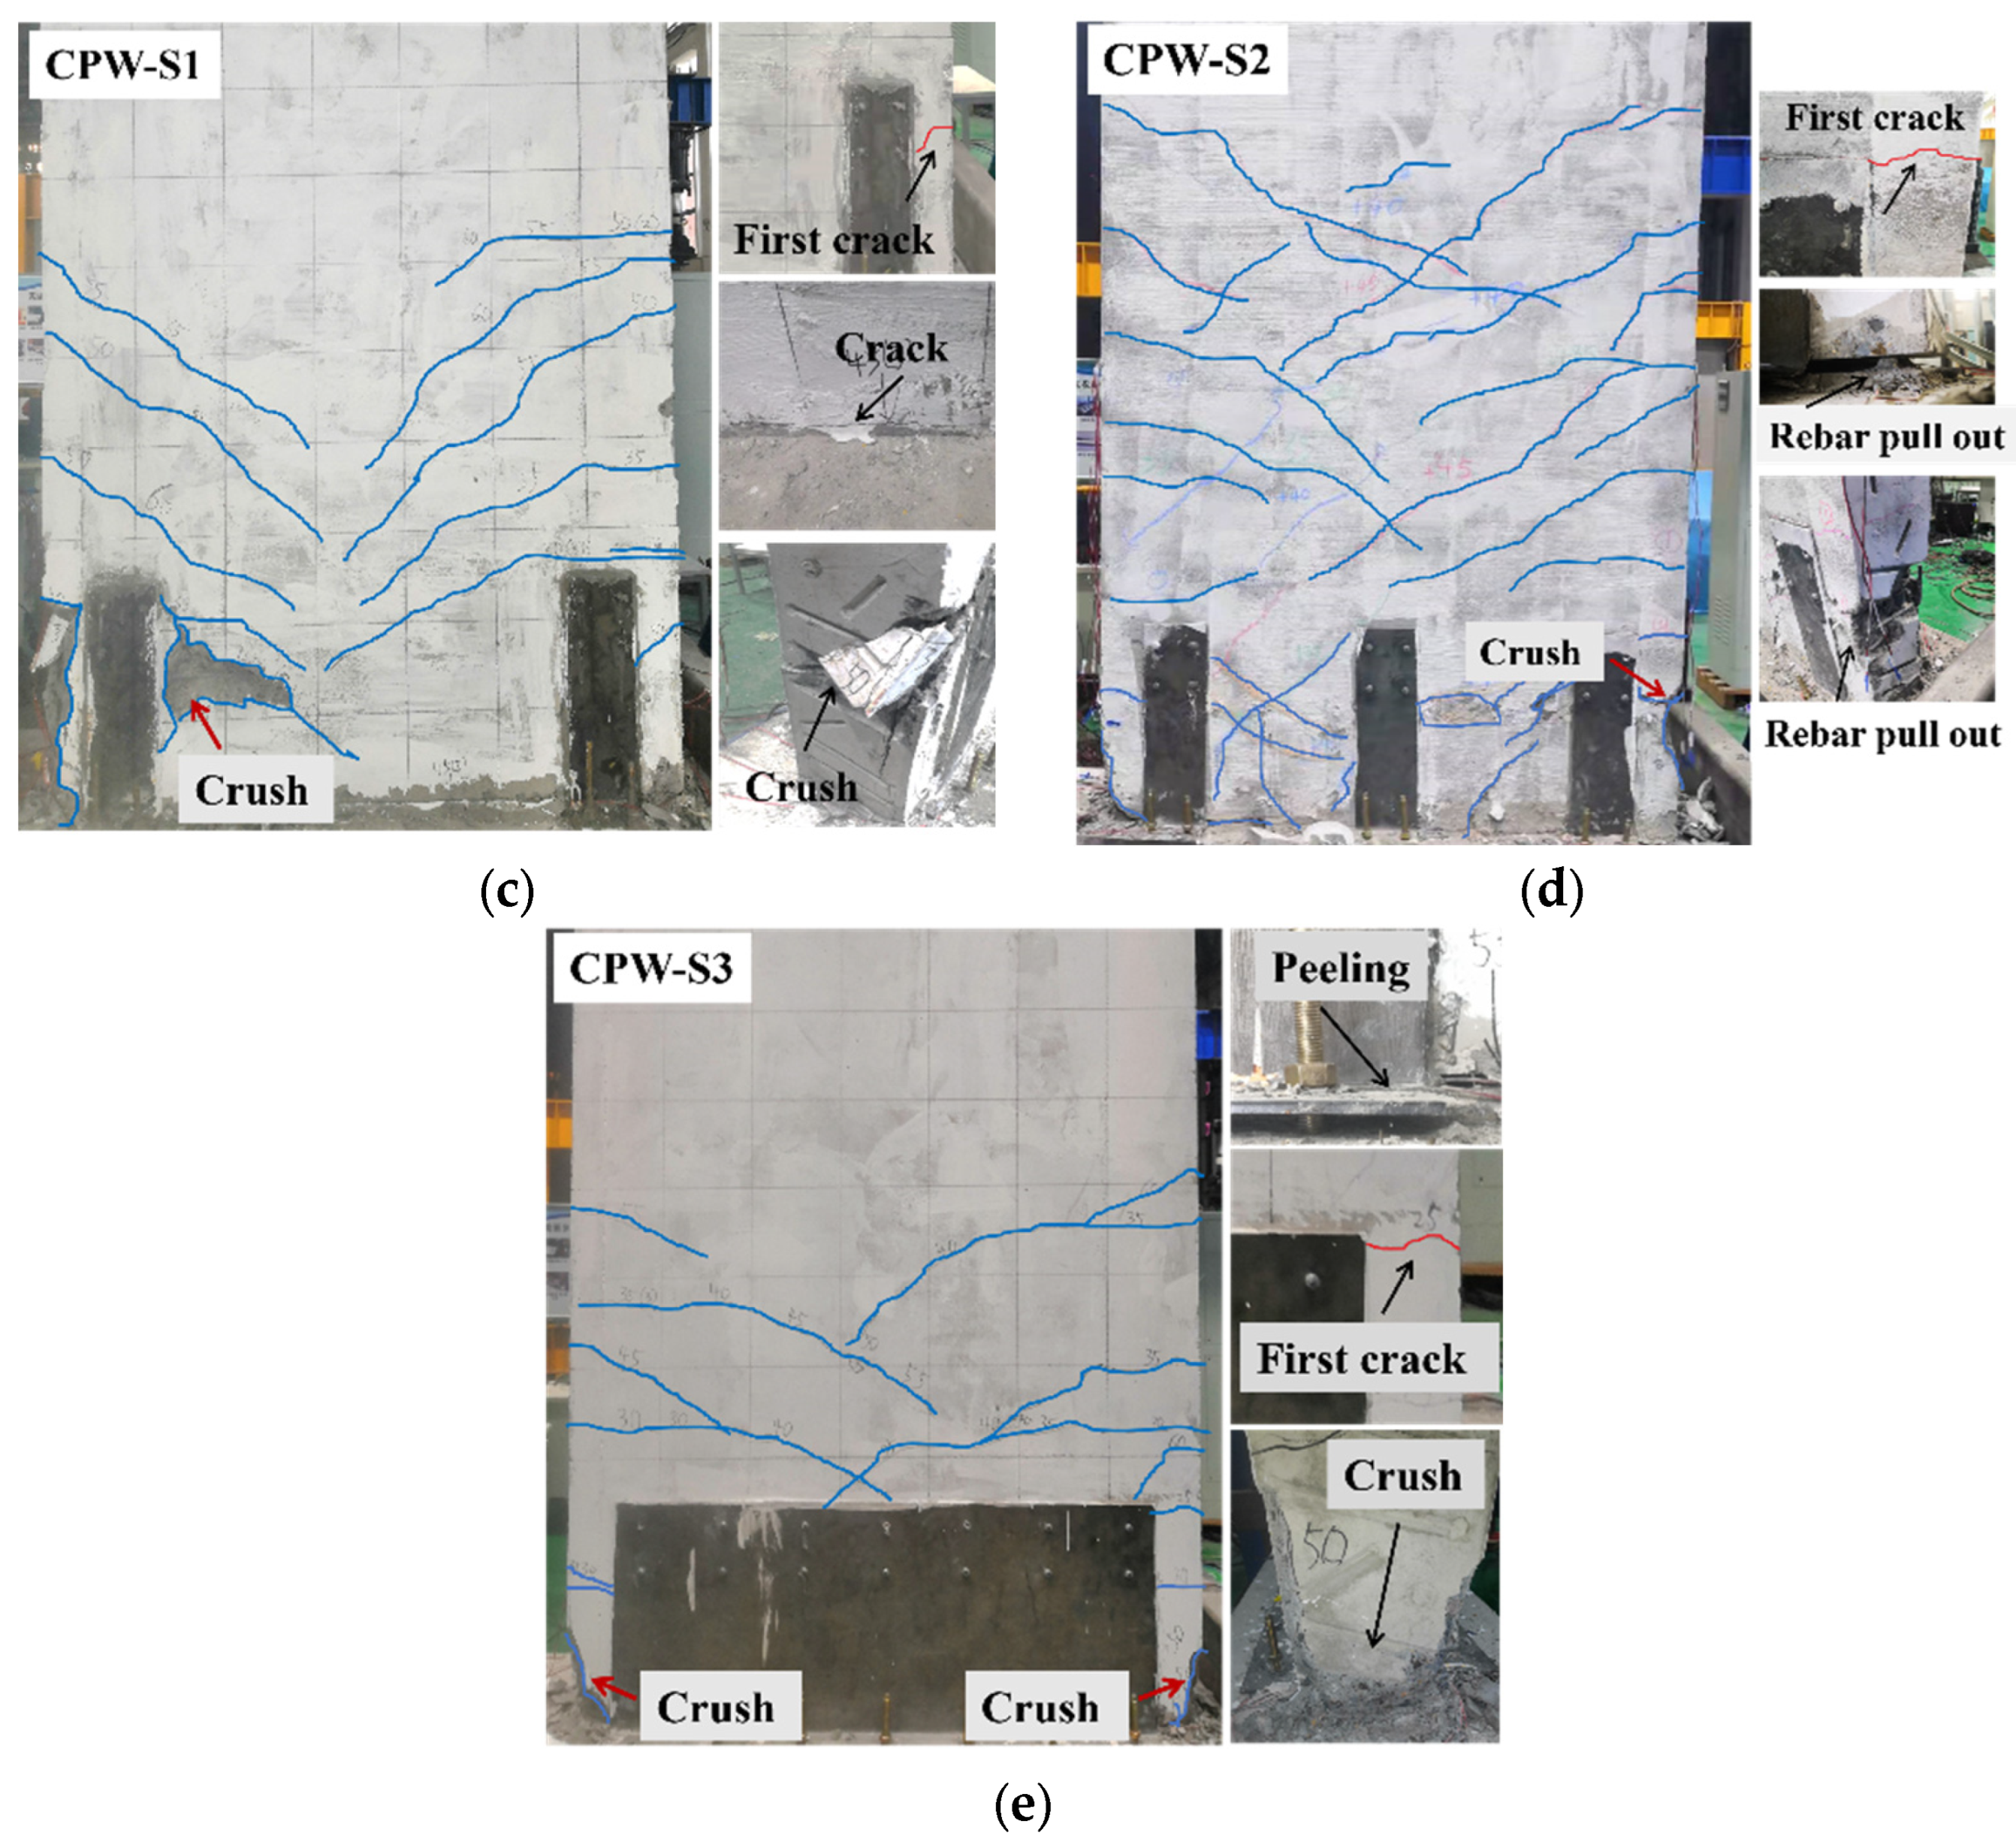
The damage modes of the shear walls were flexure-dominated failure, indicating that the damage modes of the shear wall were not impacted by inadequate grouting strength and the reinforcement with angle steel. The crack distributions of various shear walls are shown in Figure 6; the destruction degree of the shear wall CPW was the most serious, which showed a nearly fractured crack in the top location of the grouting sleeve. In contrast, the destruction degree of the specimens reinforced with angle steel was significantly reduced, which indicates that the method of reinforcement with angle steels could decrease significantly the destruction degree of the shear wall with inadequate grouting strength. The peak load of specimen CPW was 83.75% that of specimen GPW because the adhesive force between the rebar and the grouting sleeve exceeded the ultimate adhesive force earlier before the specimen entered the failure stage. The crack load and peak load of the reinforced specimens CPW-S1, CPW-S2, and CPW-S3 were enhanced greatly and recovered to the ultimate loading capacity of the shear wall GPW. The main reasons were as follows: (1) the angle steel was attached firmly to the shear wall, which reduced the generation of cracks; (2) the angle steel was bolted to the ground beam, which equates to enhancing the bonding between the rebar and grouted material to a certain extent, thus improving the ultimate loading capacity of the shear walls.

3.2. AE Energy

The damage evolutions of shear wall specimens GPW, CPW, CPW-S1, CPW-S2, and CPW-S3 were monitored based on the AE technology under a horizontal and low-cycle repeated load, respectively. The position of the AE sensors’ arrangement has a significant effect on the validity and reliability of the damage evaluation of the reinforced concrete structure [33,34,35]. Although the values of the AE parameters collected from various sensors are distinct, there is significant similarity between the various characteristics of the AE parameters [36,37]. In addition, previous research on the position of the AE sensors’ arrangement has shown that AE sensors at the medial part of the structures could characterize the whole failure process of the structures [21,38,39,40]; therefore, AE sensor 5 arranged at the medial part of specimens was selected in this study.
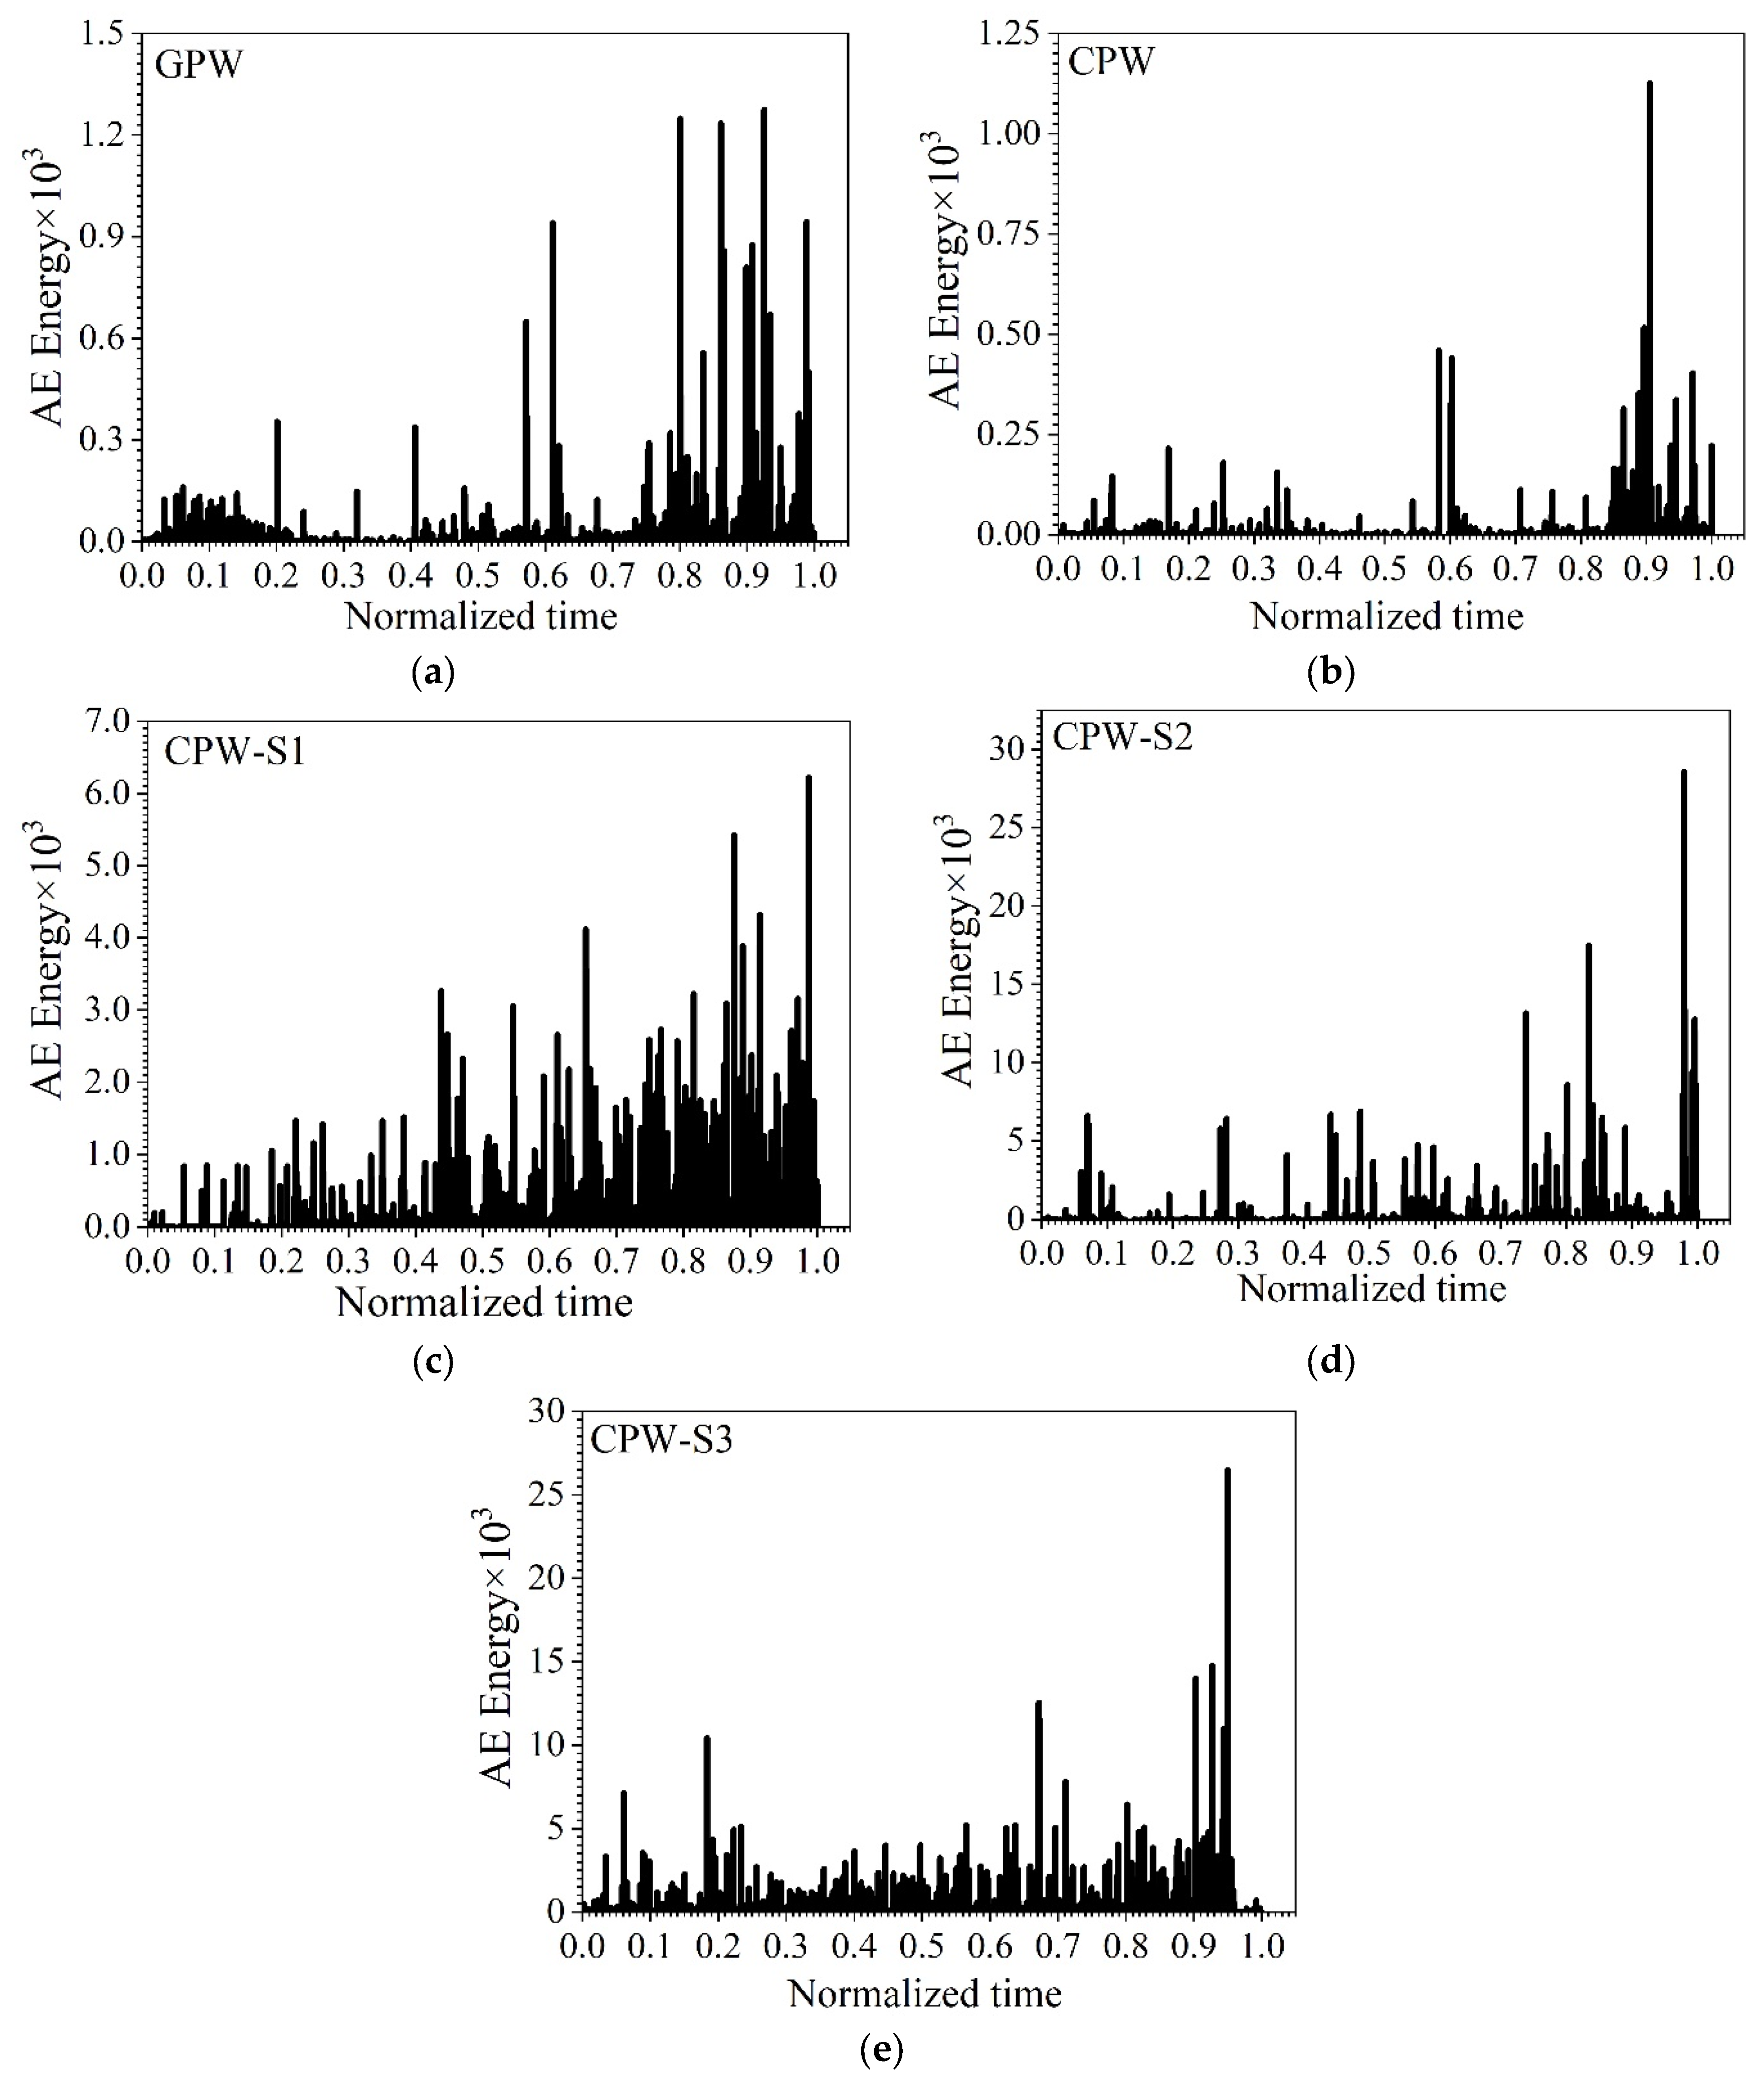
The AE energy is highly susceptible to crack propagation and damage evolution in concrete structures, and could effectively predict and characterize the damage characteristics of structure status under loading [20,21]. To better compare the trend of the AE parameter characteristics of the different specimens with loading time, the loading time was normalized in this study. Figure 7 illustrates the variation trend of the AE energy of the specimens with loading. The AE energy was relatively low in the early phase of loading, and increased slowly with the increase in the load, reaching the maximum value at the final phase. The main cause was that there were only a few micro-cracks inside the shear wall during the early loading stage, which were susceptible to generating AE events of low energy, and the macroscopic cracks were generated gradually with the increase in the destruction severity of the specimen under loading, which tend to generate AE events with a high energy level. The trend of the AE energy with loading had a good corresponding relationship with the damage evolution of the specimen, and could better characterize the crack propagation of the shear wall during the loading process. The variation in the characterization of the AE energy with the crack extension in the shear wall specimens is consistent with the literature [3,15], and this characterization was not affected by the strengthening with angle steel. This provides a novel insight into the damage evaluation and damage status monitoring of a shear wall under horizontal low circumferential repeated loading. For example, during the monitoring process of the fabricated shear walls reinforced with the angle steel, when the phenomenon of a sudden increase in AE energy is observed, it indicates that crack expansion is occurring inside the structure. It is worth noting that it is also meaningful to quantitatively evaluate the damage evolution of shear walls by the variation trend of AE energy with loading, which is not within the scope of the present work.
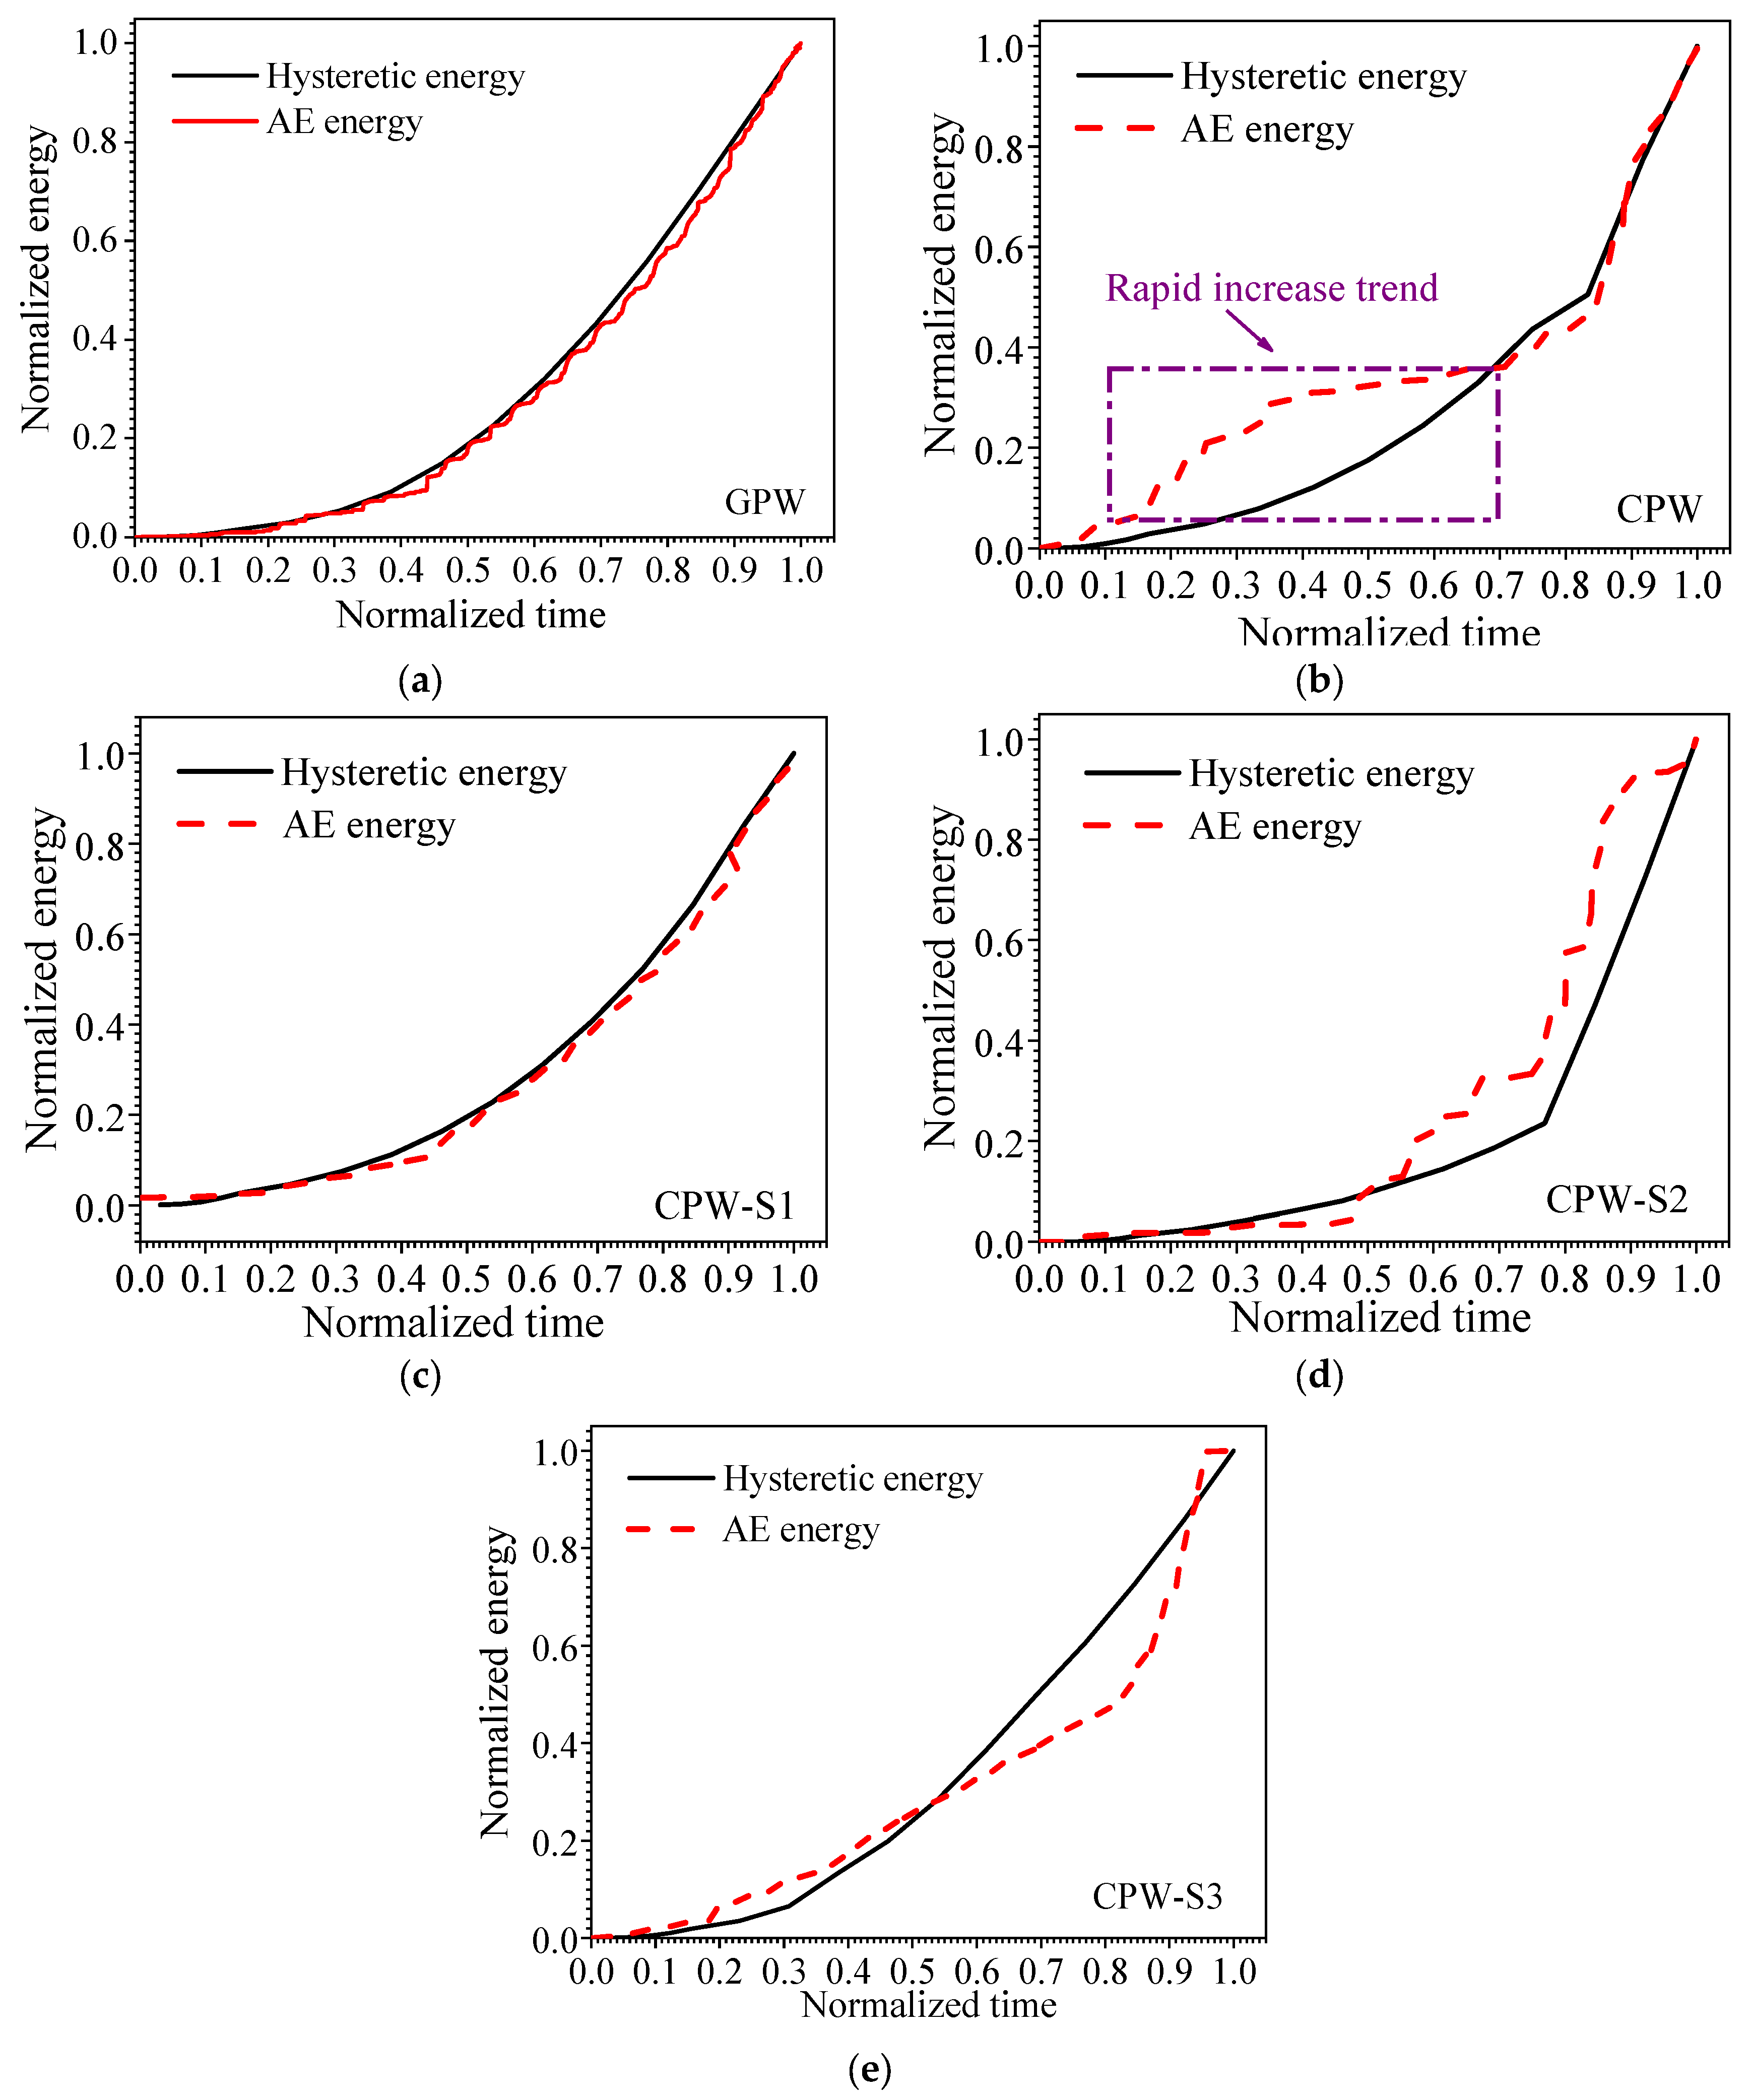
The region surrounded by the load-displacement hysteretic loop of the structure could reflect the entire energy dissipative capacity [2], the accumulated hysteretic energy Whys of the shear wall could be obtained through the summing of the hysteretic loop areas of the shear walls in the damage process, and the accumulated AE energy E e n d A E of the shear walls could be obtained through the summing of the energy of the AE events. The trend of cumulative hysteretic energy and accumulated AE energy generated inside the shear wall is illustrated in Figure 8. To compare effectively the trend of hysteretic energy and AE energy with loading time, the hysteretic energy and AE energy were normalized. The variation trends of the accumulated hysteretic energy and accumulated AE energy of shear walls were basically consistent; that is, both of them increased linearly with the increasing of the load, and the trends of the accumulated hysteretic energy and the AE energy of shear walls had a good correlation under horizontal and low-cycle repeated loads, indicating that the trend of AE accumulated energy could reflect the energy dissipation capacity of specimens during the damage process, and this phenomenon is consistent with the literature [23]. This provides a new insight for the assessment of the energy dissipation capacity of a shear wall with a horizontally low circumferential repeated load. Moreover, Figure 8b illustrates that the accumulated energy for specimen CPW increased rapidly compared with other shear wall specimens at the beginning of loading. The major cause was that more cracks were generated in the interior of CPW due to the deficiency in the inadequate grouting strength at the beginning of loading, which generated more AE events.

3.3. Ib Value Analysis

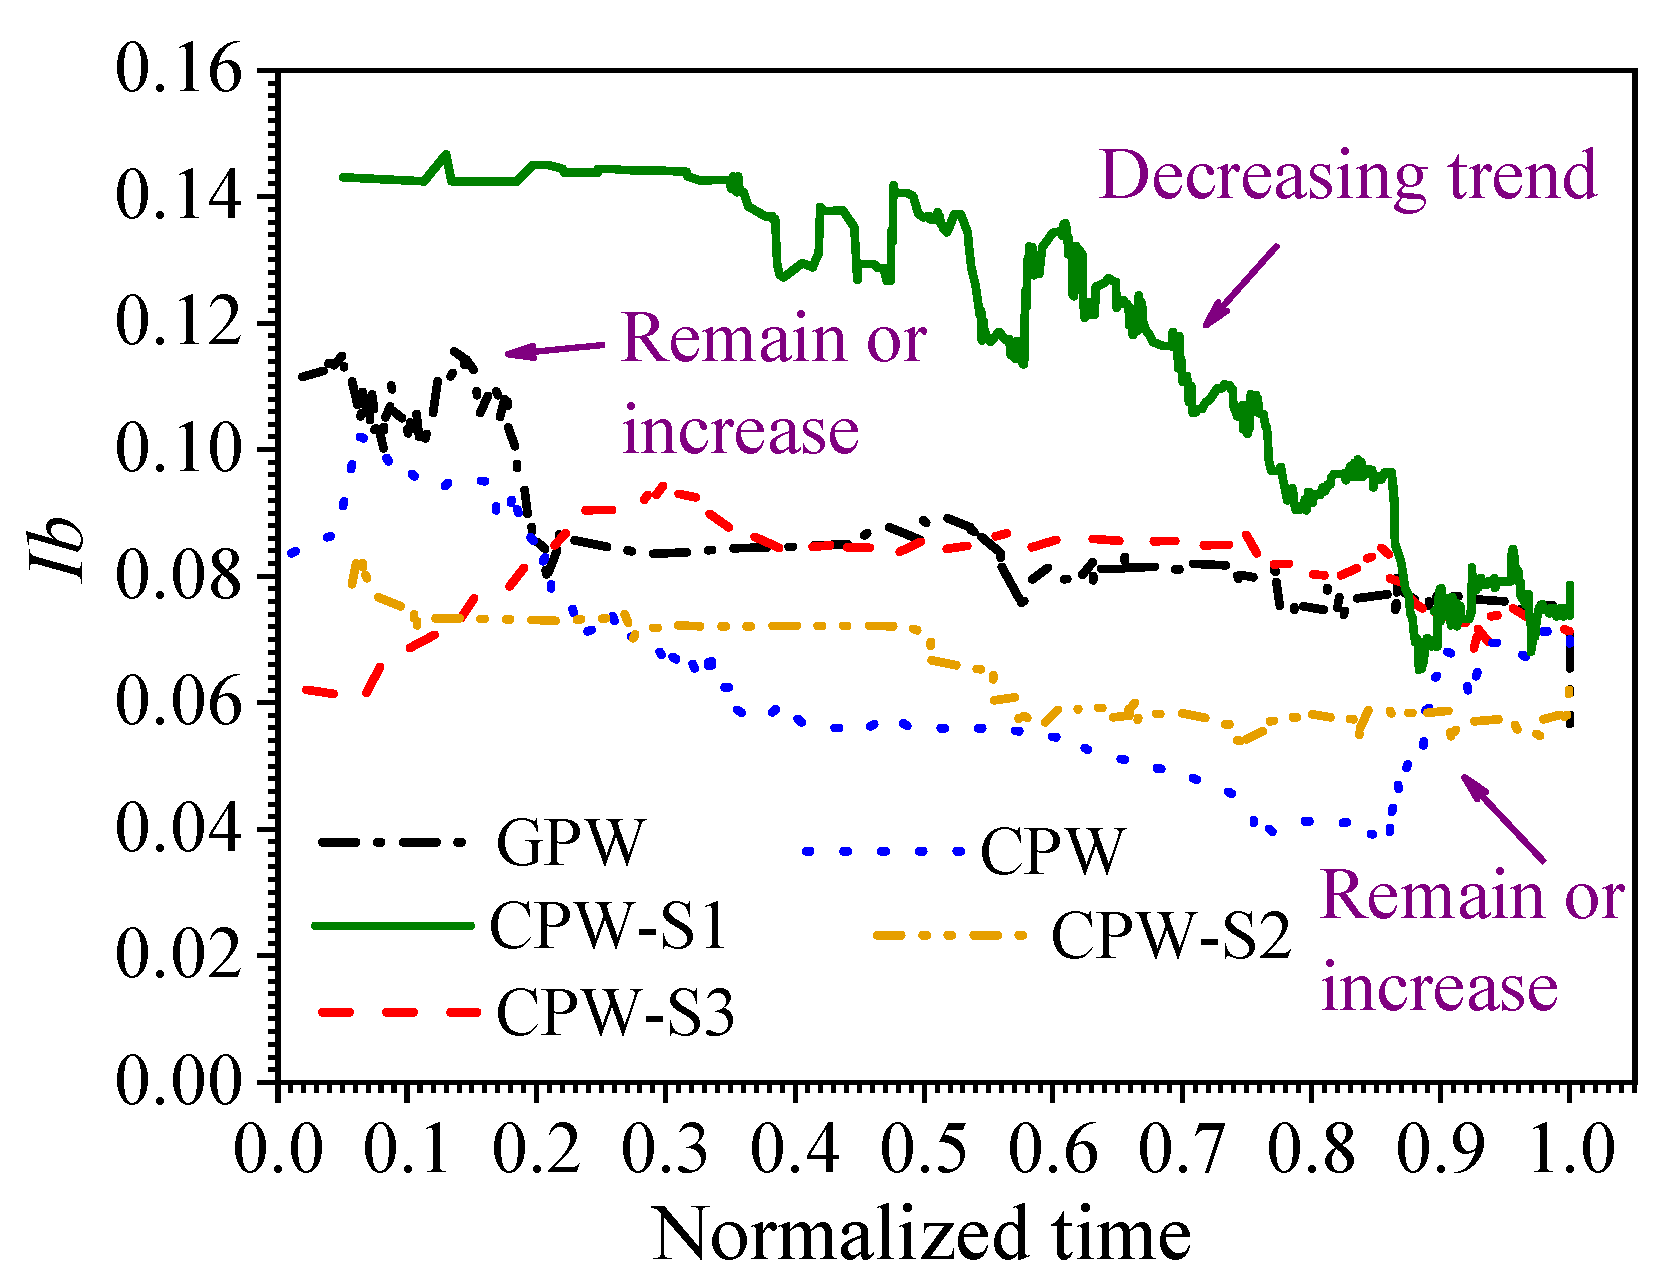
The analysis and evaluation based on the individual AE parameter are not convincing when the damage evaluation of a shear wall is performed, and it is necessary to adopt a multiparameter analysis method. The AE Ib value method, which considers the amount of AE events and the amplitude range [22,41], is defined as,
I b = log 10 N μ α 1 σ log 10 N μ + α 2 σ α 1 + α 2 σ
where μ and σ refer to the mean and standard deviation of amplitude, N μ α 1 σ and N μ + α 2 σ are the amount of events with amplitudes greater than μ α 1 σ and μ + α 2 σ , respectively, and α 1 and α 2 are user-defined constants. Figure 9 illustrates the trend of the Ib value of various shear walls with loading time. At the beginning of the loading of the shear wall, the Ib values increased or remained the same with the increase in loading; the major cause was that there were a few micro-cracks inside the shear walls, and the micro-cracks tend to produce AE events of low amplitude. The Ib value decreased gradually with the increase in load because the damage degree of the shear walls was aggravated and macro-cracks were produced gradually, and were susceptible to producing AE events of high amplitude. During the final phase of loading, the trends of the Ib value remained constant or increased because the damage to the shear walls was more serious, the number of micro-cracks and the proportion in the total number of cracks increased dramatically, and the proportion of AE events of low amplitude compared to the total number of events increased sharply. The variation characterization of the AE Ib value with the crack extension in shear wall specimens is consistent with the literature [12]. In addition, the Ib value of the shear wall CPW showed an obvious trend of increase during the final phase of loading because the damage to CPW was more serious and more micro-cracks were generated inside specimens during the final stage of loading. The trend of the Ib value was in good correspondence with the actual damage status of shear walls, which is effective for the assessment of the damage of shear walls under horizontal and low-cycle repeated loads. Moreover, this phenomenon provides a novel insight into damage monitoring of shear walls. For example, during the monitoring process of fabricated shear walls reinforced with angle steel, when the decrease in the AE Ib value is observed, it indicates that crack expansion is occurring inside the shear wall.

3.4. Intensity Analysis

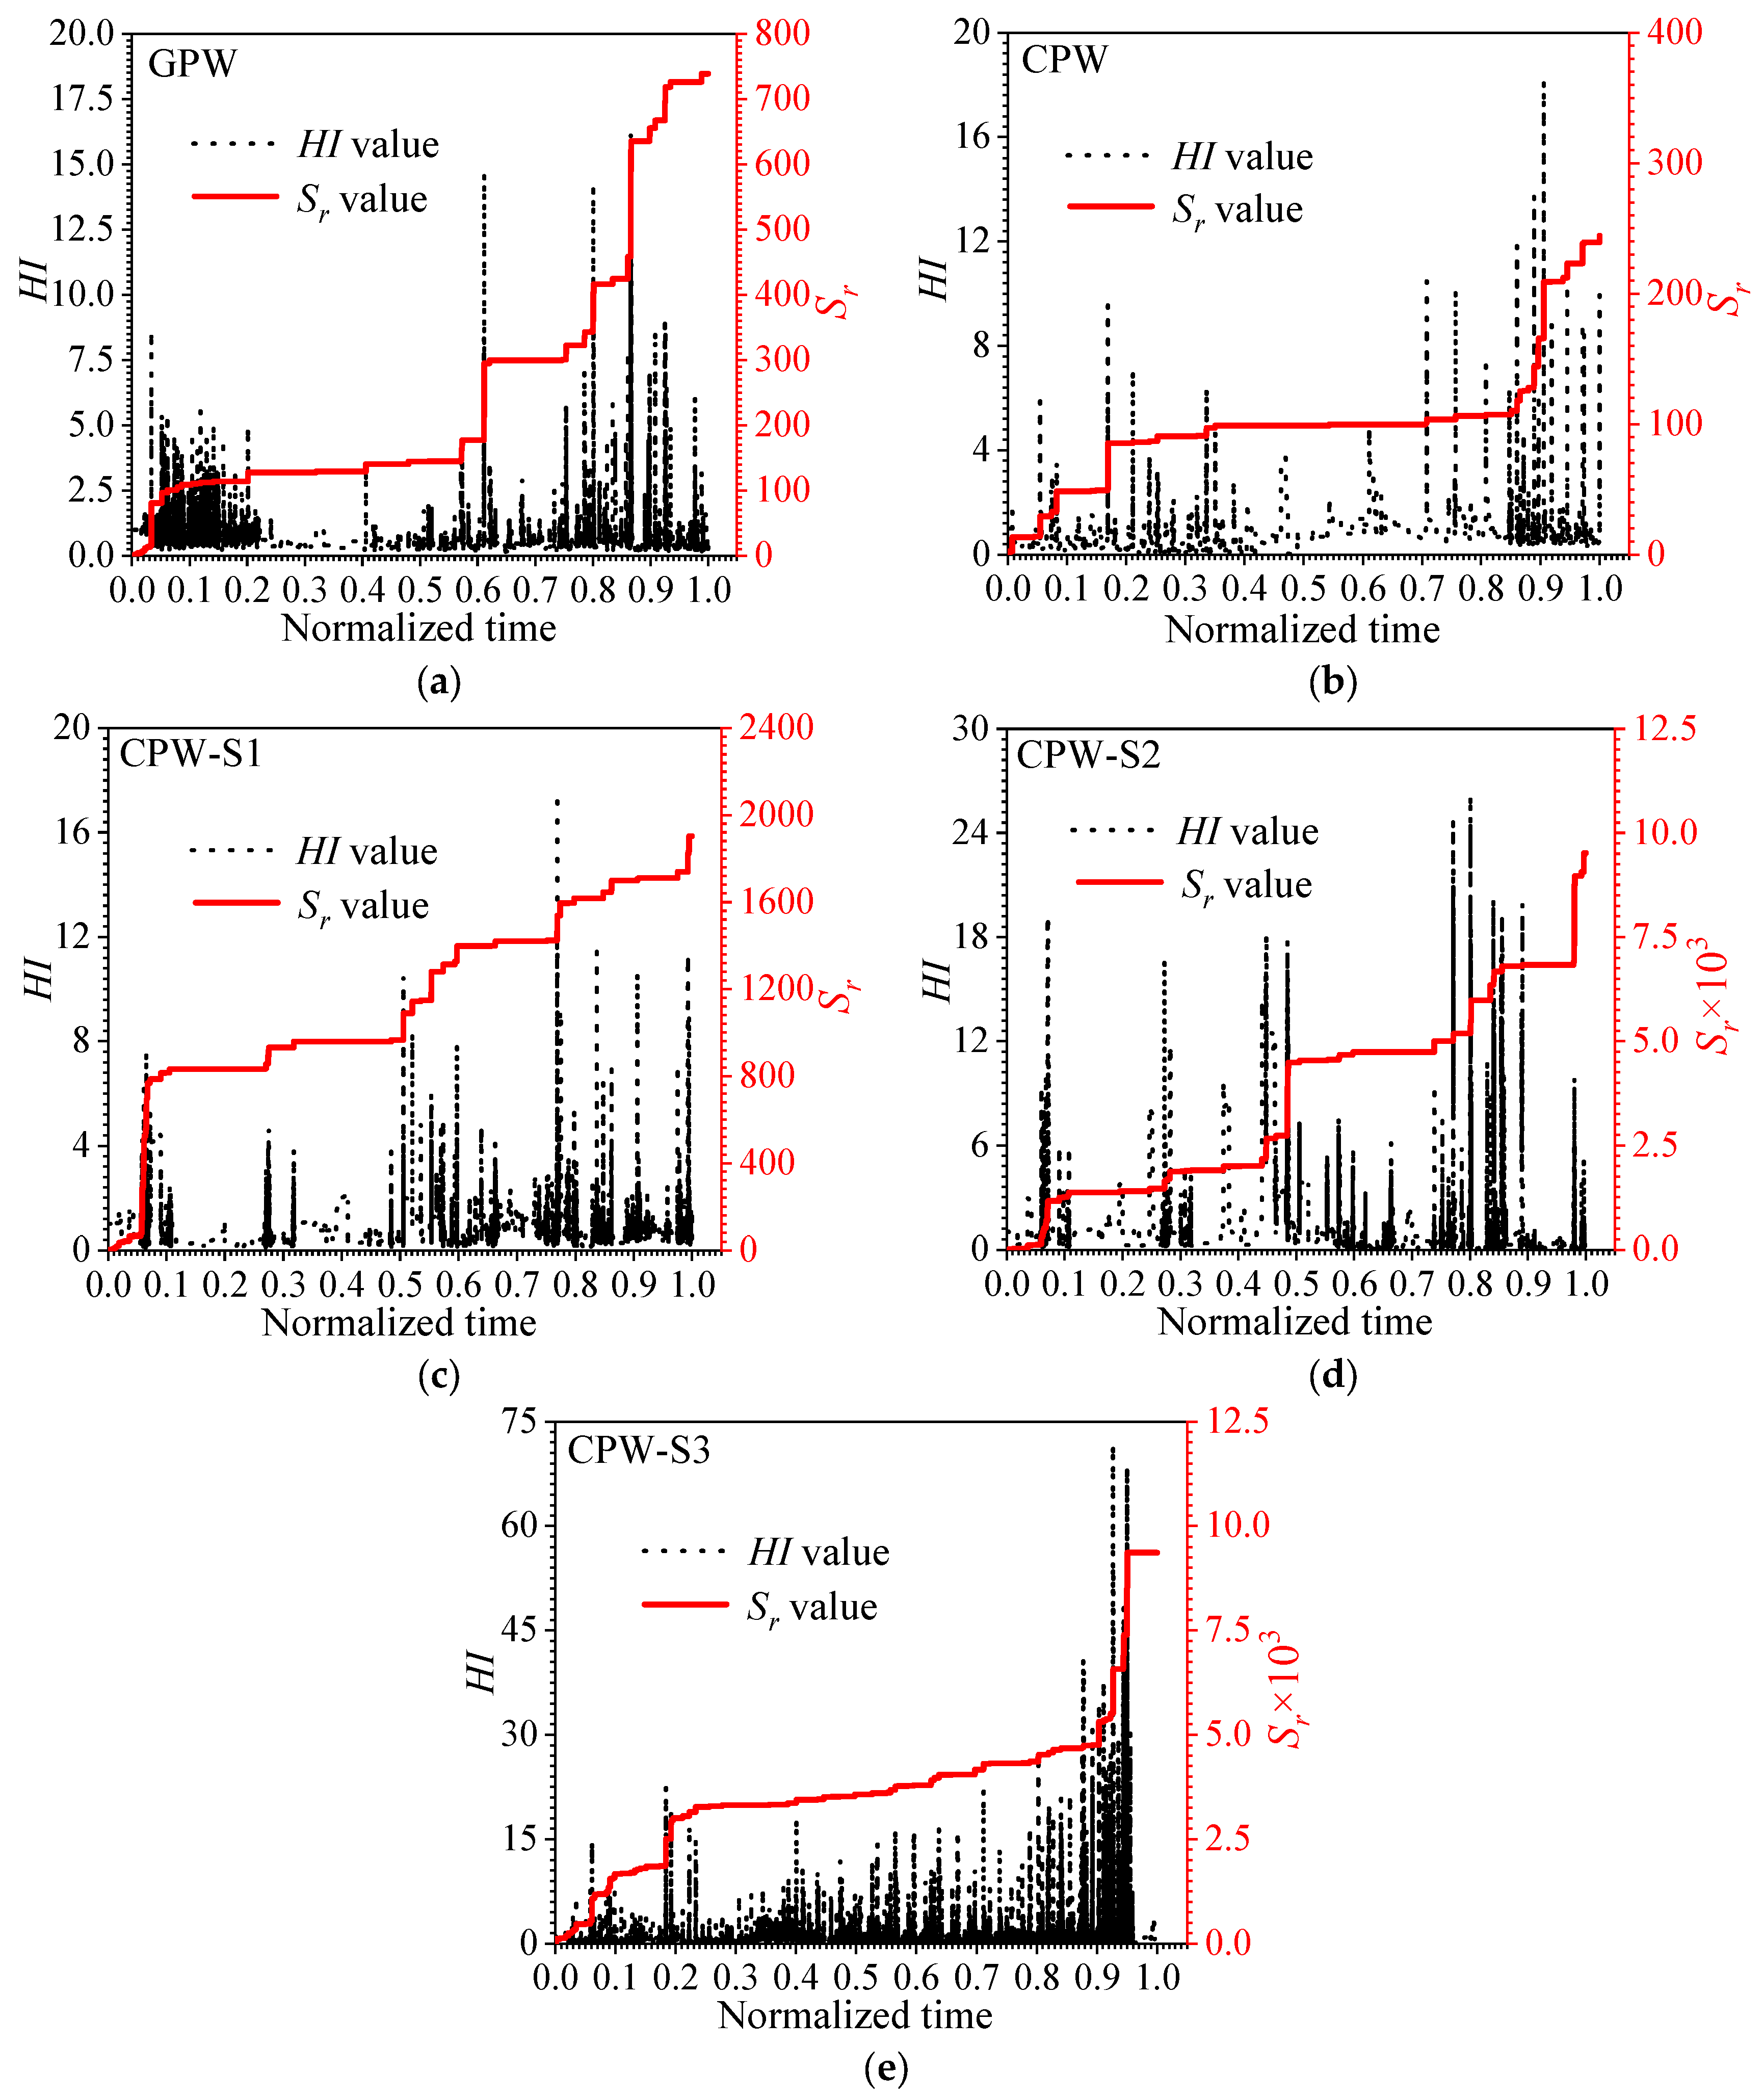
AE intensity analysis could mine significantly valuable messages indicating the damage degree of structures [24], consisting of the history index (HI) and severe index (Sr), and the HI is the ratio of the mean intensity of the last K events to the mean intensity of all events before a particular point, which is defined as Equation (2) [42],
H ( t ) = N N K i = K + 1 N S o i i = 1 N S o i
where N refers to the amount of AE events up to a particular moment, Si and Sj refer to the signal strengths of the i-th and j-th events, respectively, and K refers to a material-dependent empirical constant.
The severe index Sr is the mean of the first J maximum strength up to a particular moment, which is defined as shown in Equation (3),
S r = 1 J i = 1 J S o i
where J is the material-dependent empirical constant, Soi refers to the signal with the i-th largest intensity, and it is ranked in descending order of signal strength. As can be seen in Equations (2) and (3), a larger proportion of the high signal intensity of AE events results in higher HI values and Sr values. Figure 10 shows the variation in the HI and Sr values of shear walls with loading time. The variation trends of the Sr levels of shear walls were similar; that is, the Sr levels were increasing, which corresponded to the phenomenon that the damage degree of shear walls was increasing with the increase in load, which indicated the variation trend of Sr levels could qualitatively represent the damage of shear walls with repeated loads. The HI levels fluctuated several times with the increase in load, and the HI levels at the peak of each fluctuation showed an increasing trend. The major cause was the generation of more macroscopic cracks and further expansion of the damage inside the shear walls. In addition, the trend of the HI and Sr levels of shear walls showed an intense consistency with the increase in the load; that is, the point of fluctuation of HI level corresponded to the point of increase in the Sr level. The variable characteristics of both parameters mutually verified the applicability of the AE intensity analysis for damage evaluation of shear walls, and this phenomenon is consistent with the literature [3,14]. During the monitoring process of fabricated shear walls reinforced with angle steel, when the increase in the AE HI and Sr values is observed, it indicates that crack expansion is occurring inside the shear wall. It is worth noting that it is also valuable to reflect the damage feature of the peeling of steel plates and shear walls through the variation characteristics of the AE HI and Sr values with loading time, which is not within the scope of the present work.

3.5. AE Damage Model

The quantitative assessment of the damage status of shear walls with horizontal and low-cycle repeated loads is helpful to understand effectively the service state of concrete structures, and thus provides a reliable basis for the life prediction and maintenance of the structures. To quantitatively evaluate the damage state of concrete structures under a load, Park and Ang proposed the two-parameter seismic damage index that considered both structural deformation and energy dissipation [26,27], which is defined by Equation (4),
D I = δ m δ u + β d E Q y δ u
where δ m is the largest deformation of the structure in earthquake situations, δ u is the deformation of the component with a load, Q y refers to yield strength, d E refers to the accumulated hysteretic energy, and β refers to the energy dissipation coefficient, which is defined by Equation (5),
β = 0.447 + 0.073 λ + 0.24 n 0 + 0.314 ρ 1 × 0.7 ρ v
where the value range of β is 0 ≤ β 0.85, λ refers to the shear span ratio of the component, n 0 refers to the axial compression ratio of the structure, ρ 1 is the rebar ratio of the component, and ρ v is the hoop ratio of the structure’s volume.
The Park–Ang damage model is generally recognized and adopted in civil engineering; however, the expression contains the following inadequacies: (1) the damage index calculated by this expression may exceed 1 of the theoretical maximum value of damage when the component is destroyed or collapsed; and (2) the values calculated by the damage index are often large in the elastic stage of the component. The coefficient α (α < 1) was added to the part regarding deformation in the Park-Ang damage model, and the expression is expressed as Equation (6),
D I = α δ m δ u + β d E Q y δ u
where α is relevant to the deformation capacity of the component. The variation trends of the accumulated hysteretic energy and the AE energy of shear walls correlated well with the increase in the loading from the previous analysis. Based on the Park––Ang index, the component of the energy dissipation in Equation (6) was replaced by E A E E e n d A E , and the damage index could be expressed as follows:
D I = α δ m δ u + β E A E E e n d A E
where E A E is the accumulated energy of the shear walls at the end of each cycle level from the beginning of the load, and E e n d A E is the accumulated energy of the shear walls in the whole load process. The value E A E E e n d A E of the destroyed specimen was equal to 1; therefore, when α was set to 1 β in Equation (7), the maximum value of the damage index was 1, and Equation (8) could be obtained,
D I = ( 1 β ) α δ m δ u + β E A E E e n d A E
In addition, it has been indicated in previous studies that the total energy in the process of micro-crack propagation could be evaluated by Equation (9) [43],
E e n d A E = Γ V D / 3
where Γ refers to the critical value of the fractal energy density, V is the specimen volume, and D is the fractal exponent, where the fractal exponent D could be calculated by the equation [43],
D = 3 log N max log V
where Nmax is the critical number of AE events, and the specimen volume V is obtained from Equation (11),
V = b b × h b × l p
where b b is the width of the component, h b is the height of the component, and l p is the plastic hinge length. Pauley and Priestley [44] discovered that the plastic hinge could be calculated by Equation (12),
l p = 0.08 l + 0.022 d b f y
where l is the length of the specimen, d b is the diameter of the longitudinal rebar, and f y is the yield strength of the longitudinal rebar. Carpinteri et al. [43] found that the value of D was 2.3, although the amount of AE events generated from different specimens varied, the slope of the bilogarithmic plot of specimens was the same, and the value of D was taken as 2.3. Thus, the AE damage index incorporating fractal energy density was proposed on the basis of the Park–Ang damage model, shown as follows:
D I = ( 1 β ) δ m δ u + β E A E Γ V 0.77
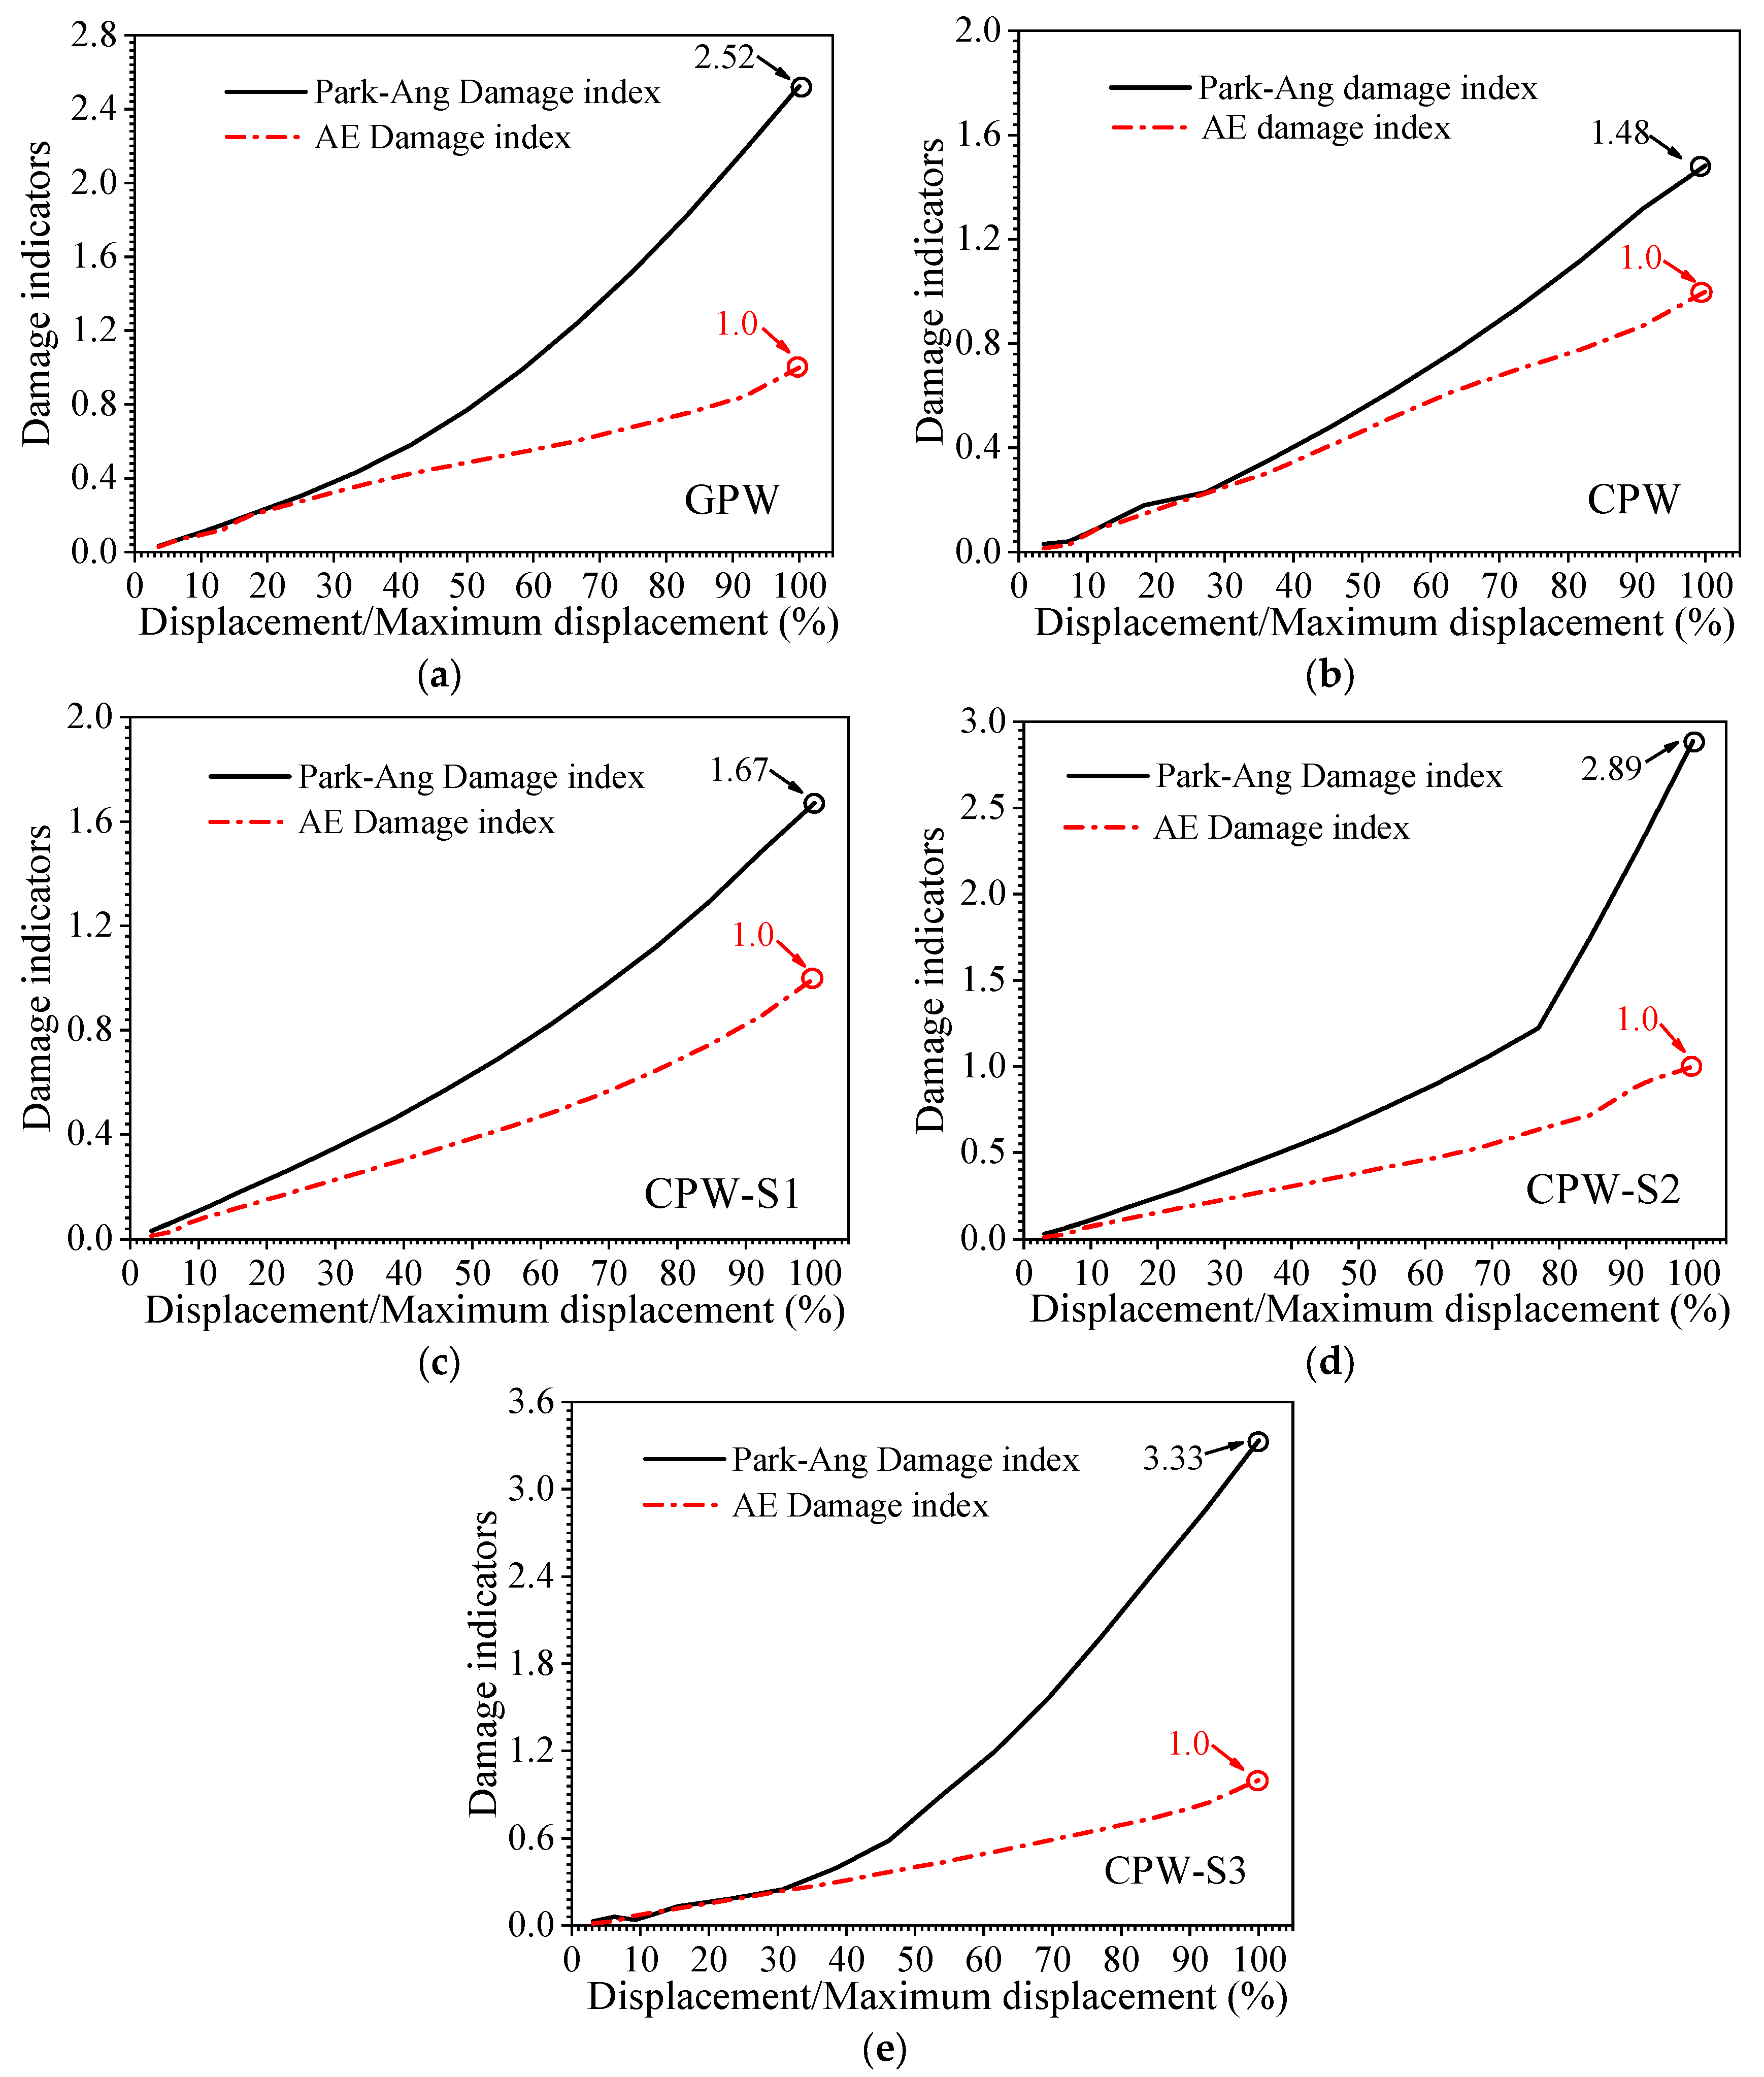
Previous research showed that the β value could be set to 0.25 for the components with good ductility [45,46]. To verify the validity of the AE damage index, the trend of the damage model calculated by the Park–Ang damage index and AE damage index for different working conditions is shown in Figure 11. The trend of the above damage index showed strong consistency with the increase in displacement; that is, the damage indexes were increased gradually with the increase in displacement, which was consistent with the real status of the damage evolution of shear walls. The maximum values calculated by the Park–Ang damage index of the shear walls showed large variability, and the maximum value calculated by the AE damage model of different specimens was 1.
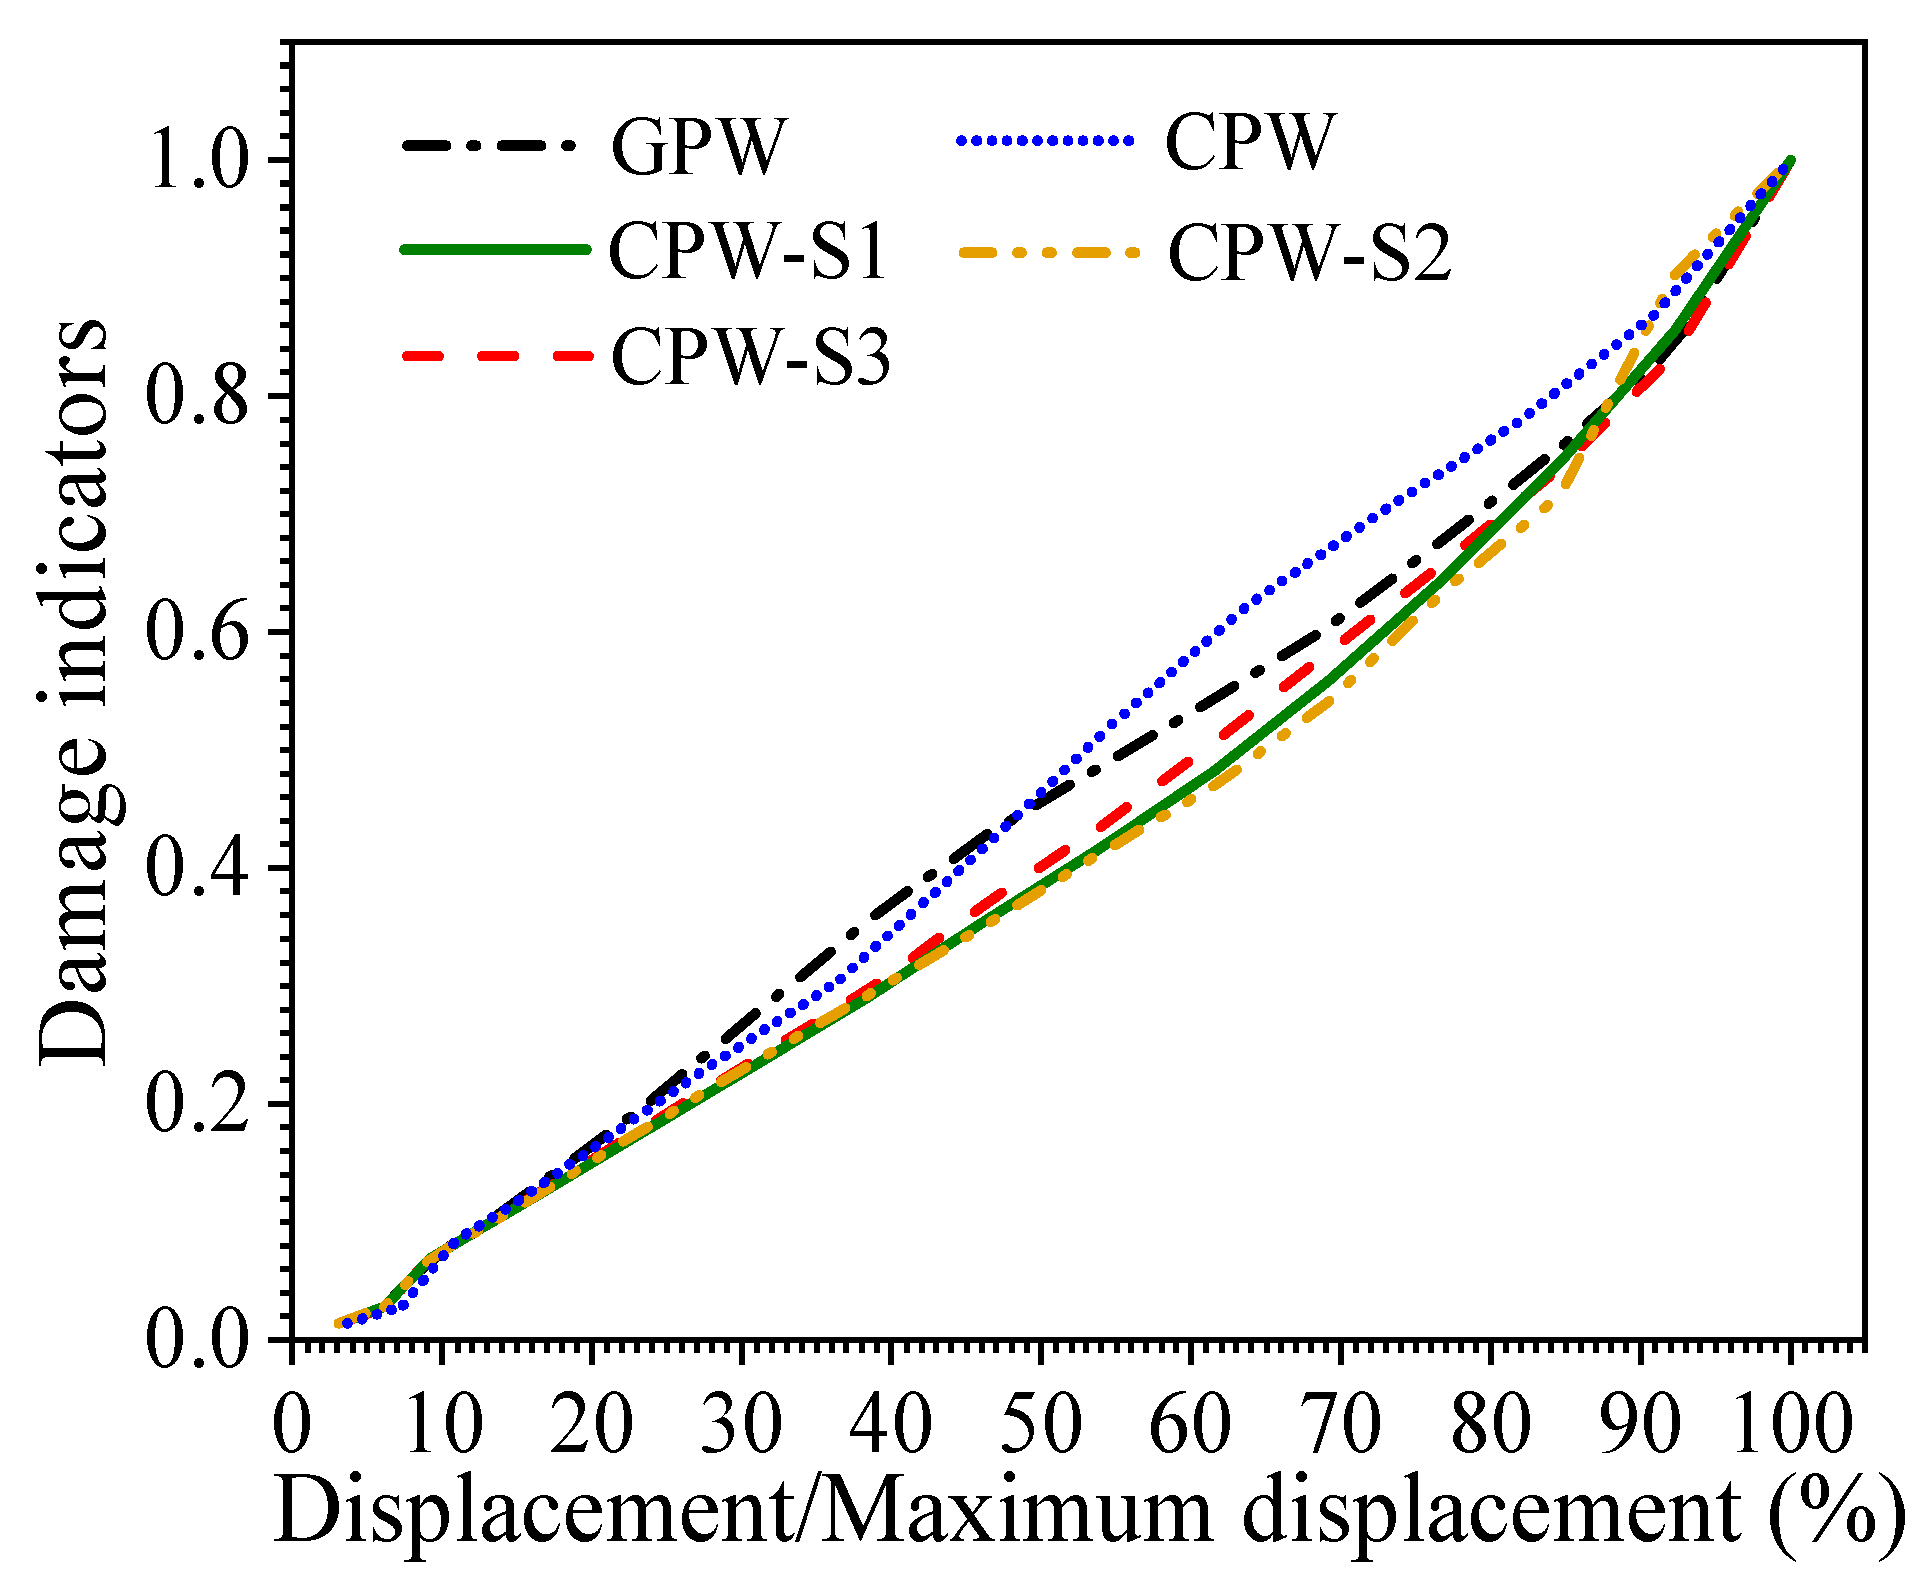
The trend of the damage indicator calculated by the AE damage index of the shear walls is shown in Figure 12; compared to other shear walls, the damage index of specimen CPW increased rapidly during the late stage of loading, which was consistent with the real damage status of the specimen. The major cause was that the bond force exceeded the ultimate maximum bonding strength earlier during the mid–late stages of loading; that is, the relative slip was produced earlier between the rebar and grouted material, which further aggravated the damage process of the whole shear wall. In addition, the trend of the damage model of the shear walls CPW-S1, CPW-S2, and CPW-S3 increased slowly during the damage process, which was consistent with the real damage status of the shear walls. The major cause was that the L-shaped angle steel was attached firmly to the surface of the shear wall, which mitigated the damage degree in the shear wall specimen. The AE damage index proposed in this study is effective for the damage evaluation of shear walls under repeated loads.

4. Conclusions

In this study, the damage characteristics and crack extension of a fabricated shear wall reinforced with angle steel of inadequate grouted material strength were investigated relying on AE technology under horizontal and low-cycle repeated loads, and the five shear walls were designed, the AE damage index of shear walls with repeated loads was proposed, and the main findings are summarized below:
(1)
The crack propagation of the fabricated shear wall was better characterized by the trend of AE energy under low-cycle repeated loads; that is, the AE events of low energy corresponded to the appearance of micro-cracks, and the AE events of high energy corresponded to the appearance of macro-cracks in the shear wall.
(2)
The Ib value decreased with the increase in the damage degree of shear walls, and the Ib value results illustrated the damage to the shear wall CPW was more severe and more micro-cracks were generated at the end of loading.
(3)
The intensity analysis approach can better represent the damage evolution of shear walls with horizontal and low-cycle repeated loads, the Sr levels were increased with the increase in the damage of shear walls, and the increase in the HI levels at the peak of each fluctuation indicated that more macroscopic cracks were generated inside the shear walls.
(4)
The AE damage index was proposed based on the Park–Ang damage model incorporating AE fractal energy density, which could effectively evaluate the damage degree of shear walls under repeated loading. The trend of the damage model calculated by the AE damage index could represent the damage degree of shear walls. The AE damage model proposed in this study was effective for the damage evaluation of shear walls under repeated loads.

Author Contributions

Conceptualization, S.L.; Methodology, R.H. and G.W.; Investigation, R.H. and S.L.; Writing—original draft, R.H.; Writing—review & editing, R.H. and G.W.; Funding acquisition, S.L. All authors have read and agreed to the published version of the manuscript.

Funding

This research was funded by the Key Scientific and Technological Research Projects of Henan Province (222102320436).

Data Availability Statement

The data presented in this study are available on request from the corresponding author.

Conflicts of Interest

The authors declare no conflict of interest.

References

  1. Guo, T.; Zhang, G.; Chen, C. Experimental study on self-centering concrete wall with distributed friction devices. J. Earthq. Eng. 2014, 18, 214–230. [Google Scholar] [CrossRef]
  2. Gu, Q.; Dong, G.; Wang, X.; Jiang, H.; Peng, S. Research on pseudo-static cyclic tests of precast concrete shear walls with vertical rebar lapping in grout-filled constrained hole. Eng. Struct. 2019, 189, 396–410. [Google Scholar] [CrossRef]
  3. Han, R.; Li, S.; Sun, W. Effect of grouting material strength on bond strength of sleeve and acoustic emission characterization of bond failure damage process. Constr. Build. Mater. 2022, 324, 126503. [Google Scholar] [CrossRef]
  4. Dallyn, P.; El-Hamalawi, A.; Palmeri, A.; Knight, R. Experimental investigation on the development of wear in grouted connections for offshore wind turbine generators. Eng. Struct. 2016, 113, 89–102. [Google Scholar] [CrossRef]
  5. Tullini, N.; Minghini, F. Grouted sleeve connections used in precast reinforced concrete construction—Experimental investigation of a column-to-column joint. Eng. Struct. 2016, 127, 784–803. [Google Scholar] [CrossRef]
  6. Jiang, Z.-Q.; Yan, T.; Zhang, A.-L.; Su, L.; Shen, C.-J. Experimental research on special steel frame with stiffened double steel plate shear wall. J. Constr. Steel Res. 2022, 189, 107067. [Google Scholar] [CrossRef]
  7. Khaloo, A.; Ghamari, A.; Foroutani, M. On the design of stiffened steel plate shear wall with diagonal stiffeners considering the crack effect. Structures 2021, 31, 828–841. [Google Scholar] [CrossRef]
  8. Chen, J.; Zhao, C.; Ding, F.-X.; Duan, Q.; Cao, Z.; Xu, F.; Yang, C.-Q.; Lu, D.; Xiang, P. Mechanical performance of the grouted lapped double reinforcements anchored in embedded corrugated sleeves. Structures 2020, 28, 1354–1365. [Google Scholar] [CrossRef]
  9. Sayadi, A.A.; Rahman, A.B.A.; Bahmani, M.; Shahryari, L. Effective of elastic and inelastic zone on behavior of glass fiber reinforced polymer splice sleeve. Constr. Build. Mater. 2015, 80, 38–47. [Google Scholar] [CrossRef]
  10. Henin, E.; Morcous, G. Non-proprietary bar splice sleeve for precast concrete construction. Eng. Struct. 2015, 83, 154–162. [Google Scholar] [CrossRef]
  11. Ameli, M.J.; Pantelides, C.P. Seismic analysis of precast concrete bridge columns connected with grouted splice sleeve connectors. J. Struct. Eng. 2017, 143, 04016176. [Google Scholar] [CrossRef]
  12. Wu, G.; Han, R.; Li, S.; Guo, P. Quantitative damage analysis of brick masonry under uniaxial compression and shear using acoustic emission technology. Struct. Control. Health Monit. 2022, 29, e3130. [Google Scholar] [CrossRef]
  13. Li, S.; Wu, Y.; Shi, H. A novel acoustic emission monitoring method of cross-section precise localization of defects and wire breaking of parallel wire bundle. Struct. Control. Health Monit. 2019, 26, e2334. [Google Scholar] [CrossRef]
  14. Han, R.; Guo, P.; Li, S.; Zhang, P. Damage evaluation of UHPC-GFRP hybrid beams based on acoustic emission technology under bending experiment. Structures 2023, 56, 104890. [Google Scholar] [CrossRef]
  15. Li, S.; Zhang, L.; Guo, P.; Zhang, P.; Wang, C.; Sun, W.; Han, S. Characteristic analysis of acoustic emission monitoring parameters for crack propagation in UHPC-NC composite beam under bending test. Constr. Build. Mater. 2021, 278, 122401. [Google Scholar] [CrossRef]
  16. Benavent-Climent, A.; Castro, E.; Gallego, A. AE monitoring for damage assessment of RC exterior beam-column subassemblages subjected to cyclic loading. Struct. Health Monit. 2009, 8, 175–189. [Google Scholar] [CrossRef]
  17. Zhang, X.; Shan, W.; Zhang, Z.; Li, B. AE monitoring of reinforced concrete squat wall subjected to cyclic loading with information entropy-based analysis. Eng. Struct. 2018, 165, 359–367. [Google Scholar] [CrossRef]
  18. Guzmán, C.; Torres, D.; Hucailuk, C.; Filipussi, D. Analysis of the acoustic emission in a reinforced concrete beam using a four points bending test. Procedia Mater. Sci. 2015, 8, 148–154. [Google Scholar] [CrossRef]
  19. Ma, G.; Li, H. Acoustic emission monitoring and damage assessment of FRP-strengthened reinforced concrete columns under cyclic loading. Constr. Build. Mater. 2017, 144, 86–98. [Google Scholar] [CrossRef]
  20. Ma, G.; Wu, C.; Hwang, H.-J.; Li, B. Crack monitoring and damage assessment of BFRP-jacketed concrete cylinders under compression load based on acoustic emission techniques. Constr. Build. Mater. 2021, 272, 121936. [Google Scholar] [CrossRef]
  21. Wu, Y.; Li, S.; Wang, D.; Zhao, G. Damage monitoring of masonry structure under in-situ uniaxial compression test using acoustic emission parameters. Constr. Build. Mater. 2019, 215, 812–822. [Google Scholar] [CrossRef]
  22. Shiotani, T.; Fujii, K.; Aoki, T.; Amou, K. Evaluation of progressive failure using AE sources and improved b-value on slope model tests. Prog. Acoust. Emiss. 1994, 7, 529–534. [Google Scholar]
  23. Zhang, X.; Li, B. Damage characteristics and assessment of corroded RC beam-column joint under cyclic loading based on acoustic emission monitoring. Eng. Struct. 2020, 205, 110090. [Google Scholar] [CrossRef]
  24. Golaski, L.; Pawel, G.; Kanji, O. Diagnostic of reinforced concrete bridge by acoustic emission. J. Acoust. Emiss. 2002, 20, 83–98. [Google Scholar]
  25. Shahidan, S.; Pulin, R.; Bunnori, N.M.; Holford, K.M. Damage classification in reinforced concrete beam by acoustic emission signal analysis. Constr. Build. Mater. 2013, 45, 78–86. [Google Scholar] [CrossRef]
  26. Park, Y.J.; Ang, H.S. Seismic damage analysis of reinforced concrete buildings. J. Struct. Eng. 1985, 114, 740–757. [Google Scholar] [CrossRef]
  27. Park, Y.J.; Ang, H.S. Mechanistic Seismic damage model for reinforced concrete. J. Struct. Eng. 1985, 111, 722–739. [Google Scholar] [CrossRef]
  28. GB/T 50081-2002; Standard for Test Method of Mechanical Properties on Ordinary Concrete. Ministry of construction and General Administration of Quality Supervision: Beijing, China, 2003.
  29. JG/T 398-2019; The Grouting Coupler for Rebars Splicing. Ministry of Housing and Urban-Rural Development of China: Beijing, China, 2019.
  30. JG/T 408-2019; Cementitious Grout for Sleeve of Rebar Splicing. Ministry of Housing and Urban-Rural Development of China: Beijing, China, 2019.
  31. JGJ/T 101-2015; Specification of Seismic Test of Building. China Architecture & Building Press: Beijing, China, 2015.
  32. Jafari, A.; Beheshti, M.; Shahmansouri, A.A.; Bengar, H.A. Cyclic response and damage status of coupled and hybrid-coupled shear walls. Structures 2024, 61, 106010. [Google Scholar] [CrossRef]
  33. Lu, S.; Jiang, M.; Sui, Q.; Dong, H.; Sai, Y.; Jia, L. Acoustic emission location on aluminum alloy structure by using FBG sensors and PSO method. J. Mod. Opt. 2016, 63, 742–749. [Google Scholar] [CrossRef]
  34. Yin, S.; Cui, Z.; Kundu, T. Acoustic source localization in anisotropic plates with “Z” shaped sensor clusters. Ultrasonics 2018, 84, 34–37. [Google Scholar] [CrossRef] [PubMed]
  35. Rivière, J.; Lv, Z.; Johnson, P.; Marone, C. Evolution of b-value during the seismic cycle: Insights from laboratory experiments on simulated faults. Earth Planet. Sci. Lett. 2018, 482, 407–413. [Google Scholar] [CrossRef]
  36. Li, S.; Wu, Y.; Li, W.; Li, P. Shear test on damage evolution of brick masonry based on acoustic emission technique. Constr. Build. Mater. 2021, 273, 121782. [Google Scholar] [CrossRef]
  37. Han, Q.; Yang, G.; Xu, J.; Fu, Z.; Lacidogna, G.; Carpinteri, A. Acoustic emission data analyses based on crumb rubber concrete beam bending tests. Eng. Fract. Mech. 2019, 210, 189–202. [Google Scholar] [CrossRef]
  38. Li, S.; Wu, G.; Shi, H. Acoustic emission characteristics of semi-rigid bases with three moisture conditions during bending tests. Road Mater. Pavement Des. 2019, 20, 187–198. [Google Scholar] [CrossRef]
  39. Wu, Y.; Li, S.; Wang, D. Characteristic analysis of acoustic emission signals of masonry specimens under uniaxial compression test. Constr. Build. Mater. 2019, 196, 637–648. [Google Scholar] [CrossRef]
  40. Wu, Y.; Gu, S.; Zhao, G.; Li, S. Damage assessment of the in-service brick masonry structure using acoustic emission technique. Mater. Struct. 2020, 53, 41. [Google Scholar] [CrossRef]
  41. Shiotani, T.; Ohtsu, M.; Ikeda, K. Detection and evaluation of AE waves due to rock deformation. Constr. Build. Mater. 2001, 15, 235–246. [Google Scholar] [CrossRef]
  42. Li, D.; Hai, C.; Jinping, O. Fracture behavior and damage evaluation of polyvinyl alcohol fiber concrete using acoustic emission technique. Mater. Des. 2012, 40, 205–211. [Google Scholar] [CrossRef]
  43. Carpinteri, A.; Lacidogna, G.; Pugno, N. Structural damage diagnosis and life-time assessment by acoustic emission monitoring. Eng. Fract. Mech. 2007, 74, 273–289. [Google Scholar] [CrossRef]
  44. Paulay, T.; Priestley, M.N. Seismic Design of Reinforced Concrete and Masonry Buildings; Wiley: New York, NY, USA, 1992. [Google Scholar]
  45. Promis, G.; Ferrier, E.; Hamelin, P. Effect of external FRP retrofitting on reinforced concrete short columns for seismic strengthening. Compos. Struct. 2009, 88, 367–379. [Google Scholar] [CrossRef]
  46. Samiullah, Q.; Laurent, M.; Emmanuel, F. Seismic behavior of RC short shear wall strengthened with externally bonded CFRP strips. Compos. Struct. 2019, 211, 390–400. [Google Scholar]
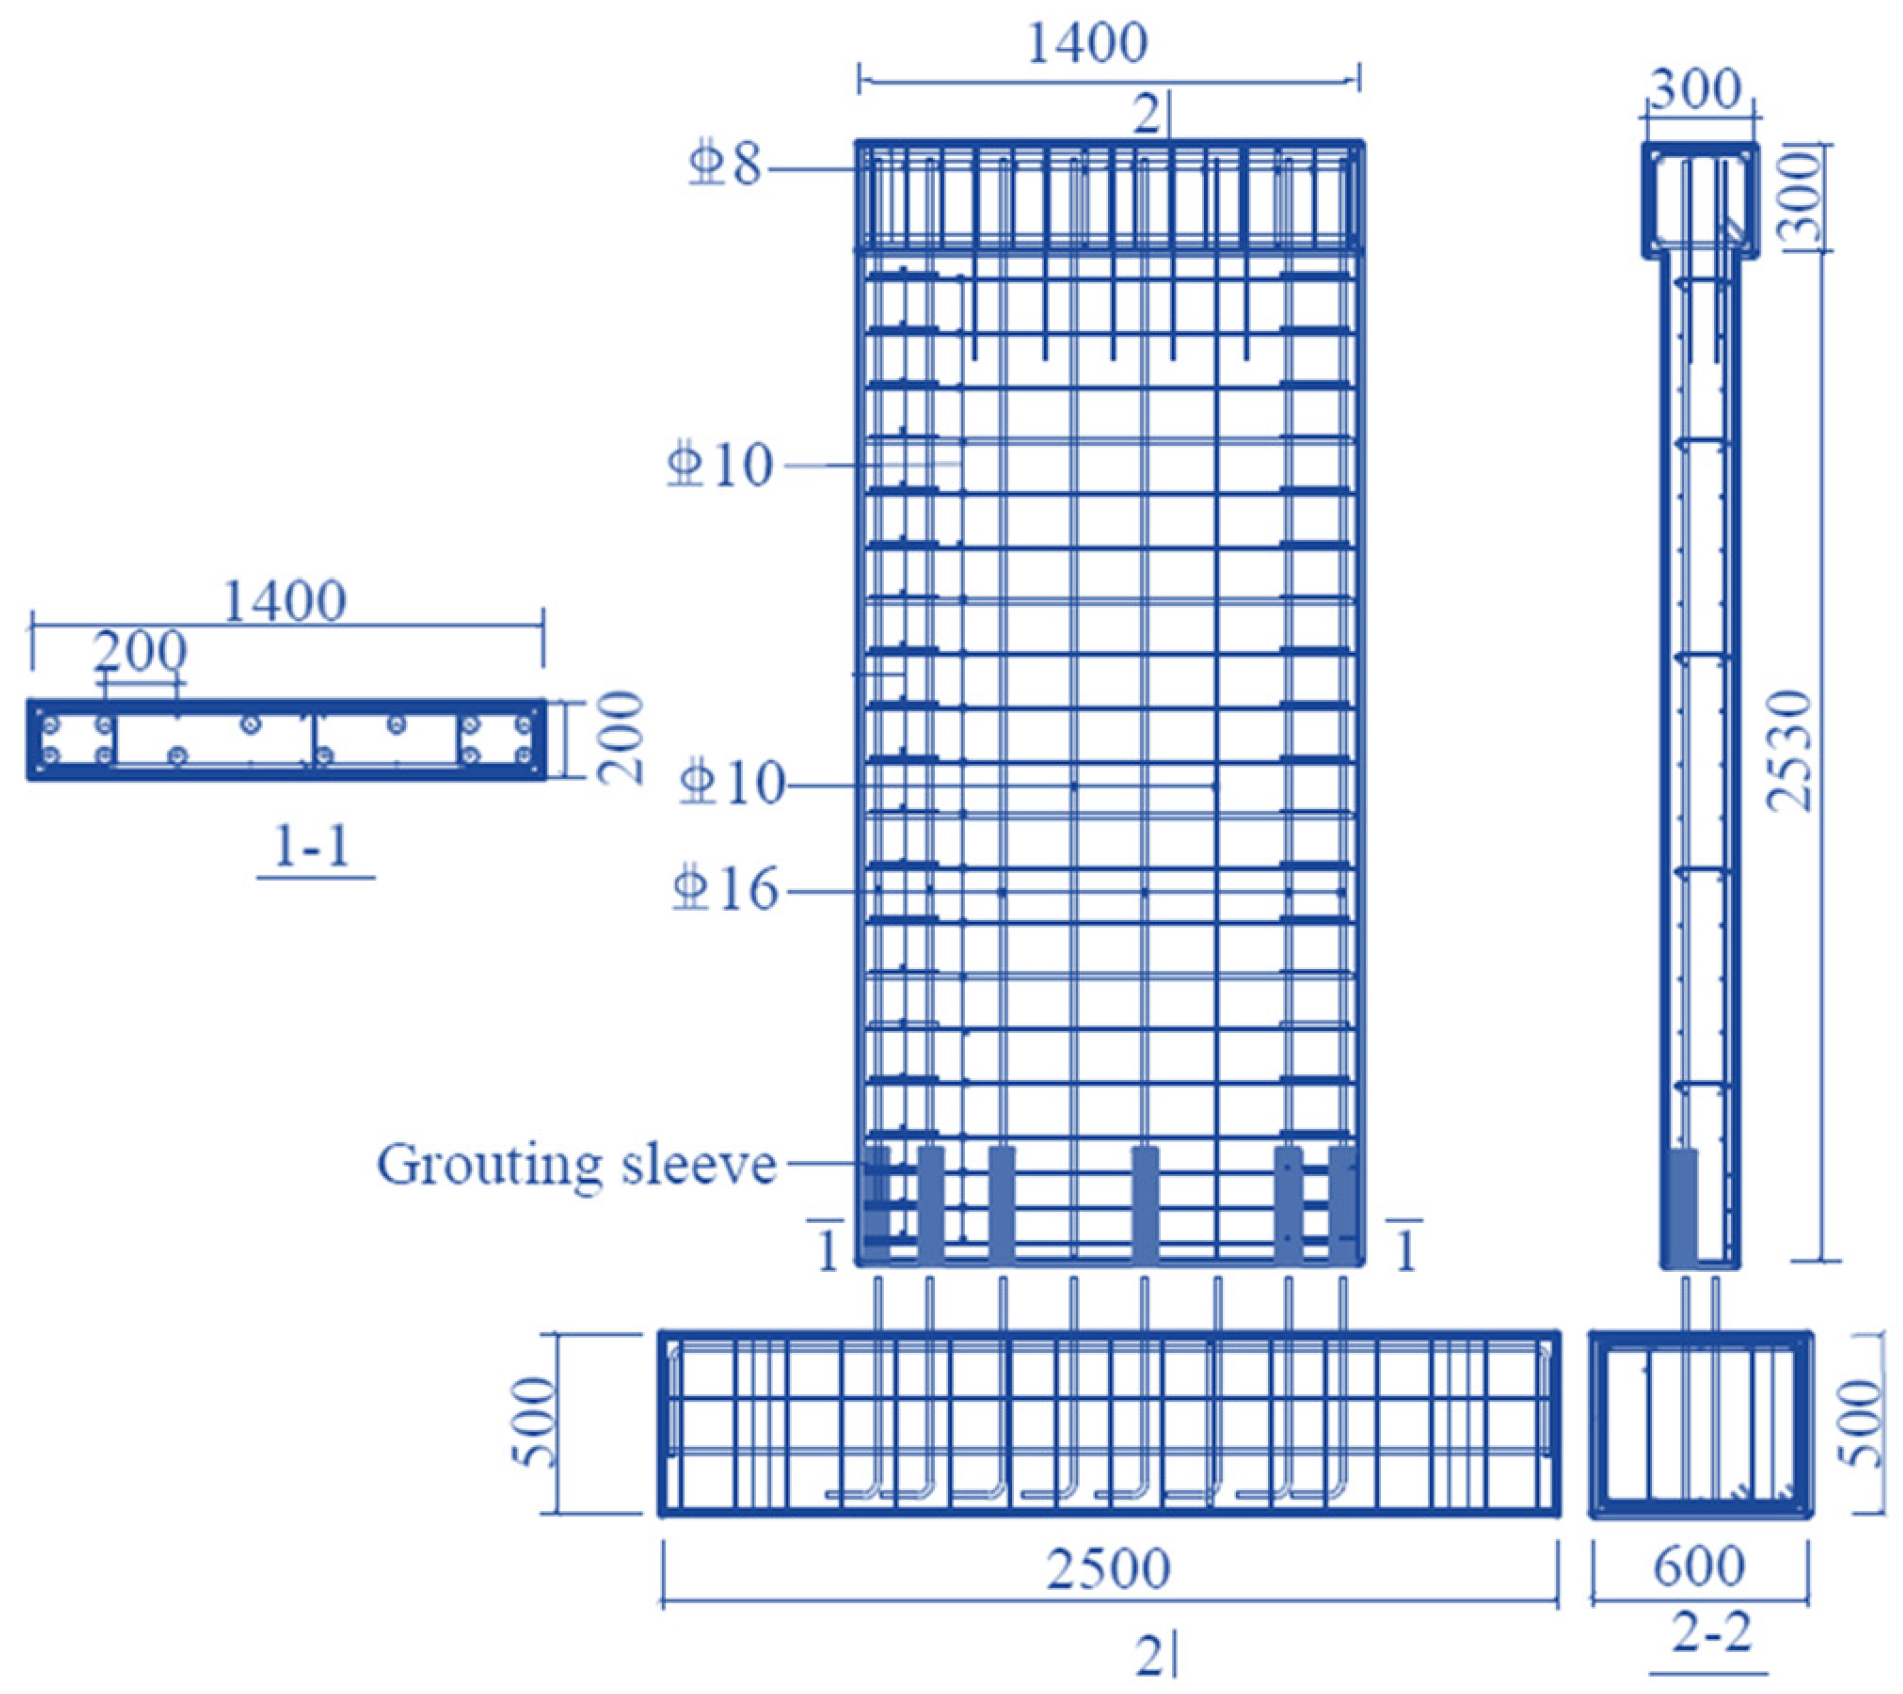
Figure 1. The rebar arrangement inside the fabricated shear wall.
Buildings 14 02038 g001
Figure 2. The strengthening approaches with angle steel: (a) first strengthening method, (b) second strengthening method, (c) third strengthening method, (d) section of the reinforced position.
Buildings 14 02038 g002
Figure 3. The diagram of experiment load device.
Buildings 14 02038 g003
Figure 4. Load regime of horizontal force of the specimen.
Buildings 14 02038 g004
Figure 5. The schematic diagram of AE signal.
Buildings 14 02038 g005
Figure 6. The crack expansion of the shear walls with repeated load: (a) GPW, (b) CPW, (c) CPW-S1, (d) CPW-S2, (e) CPW-S3.
Buildings 14 02038 g006aBuildings 14 02038 g006b
Figure 7. The trend of AE energy of specimens with horizontal and low-cycle repeated load: (a) GPW, (b) CPW, (c) CPW-S1, (d) CPW-S2, (e) CPW-S3.
Buildings 14 02038 g007
Figure 8. Trend of AE accumulated energy and accumulated hysteretic energy with loading: (a) GPW, (b) CPW, (c) CPW-S1, (d) CPW-S2, (e) CPW-S3.
Buildings 14 02038 g008
Figure 9. The trend of AE Ib value with load time of shear walls.
Buildings 14 02038 g009
Figure 10. The trend of HI and Sr values of shear walls: (a) GPW, (b) CPW, (c) CPW-S1, (d) CPW-S2, (e) CPW-S3.
Buildings 14 02038 g010
Figure 11. The trend of damage indicator calculated by Park–Ang index and AE damage index: (a) GPW, (b) CPW, (c) CPW-S1, (d) CPW-S2, (e) CPW-S3.
Buildings 14 02038 g011
Figure 12. The trend of damage index values calculated by the AE damage index of different specimens.
Buildings 14 02038 g012
Table 1. The mechanical performance of rebars.
Diameter do (mm)81016
Yield strength fy (MPa)460445460
Elongation rate (%)24.024.115.0
Disclaimer/Publisher’s Note: The statements, opinions and data contained in all publications are solely those of the individual author(s) and contributor(s) and not of MDPI and/or the editor(s). MDPI and/or the editor(s) disclaim responsibility for any injury to people or property resulting from any ideas, methods, instructions or products referred to in the content.