

Living Walls and Green Façades: An Implementation Code for Energy Simulation

Abstract
:1. Introduction
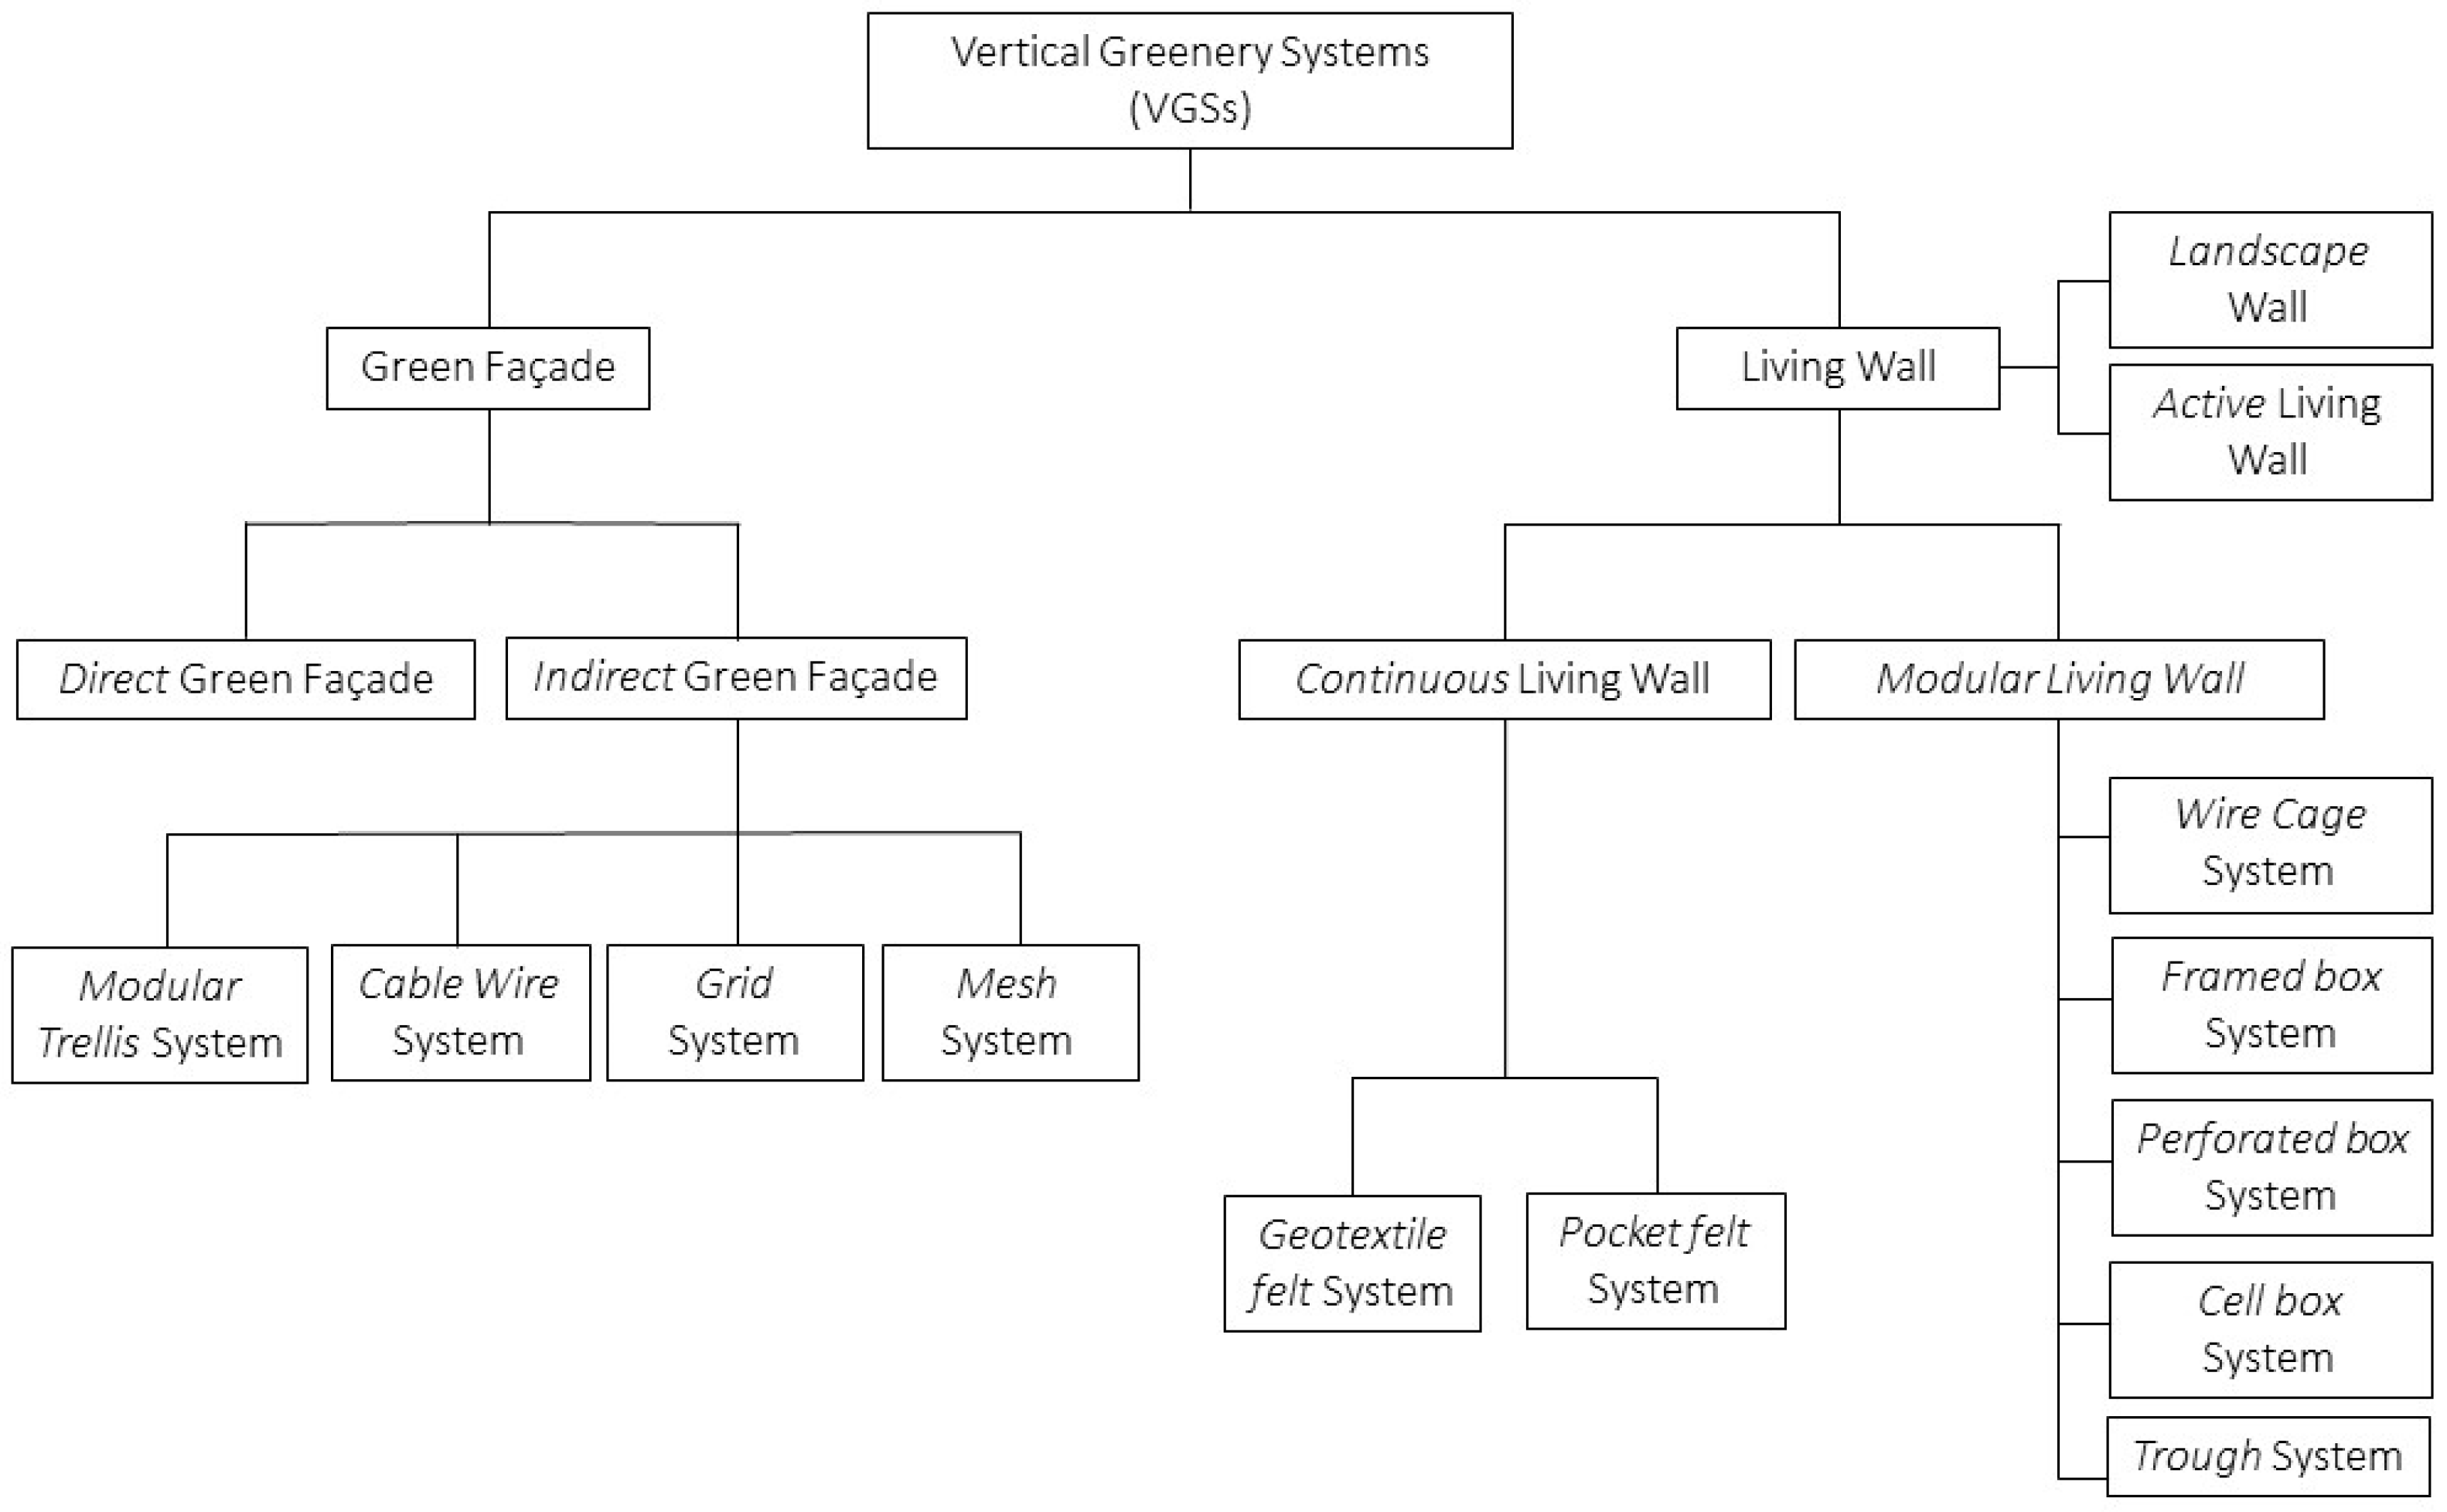
1.1. Vertical Greenery Systems
1.2. Mathematical Models: A Literature Review
1.3. Objective of the Work
2. Materials and Methods
2.1. Green Façade Mathematical Model
2.2. Living Wall Mathematical Model
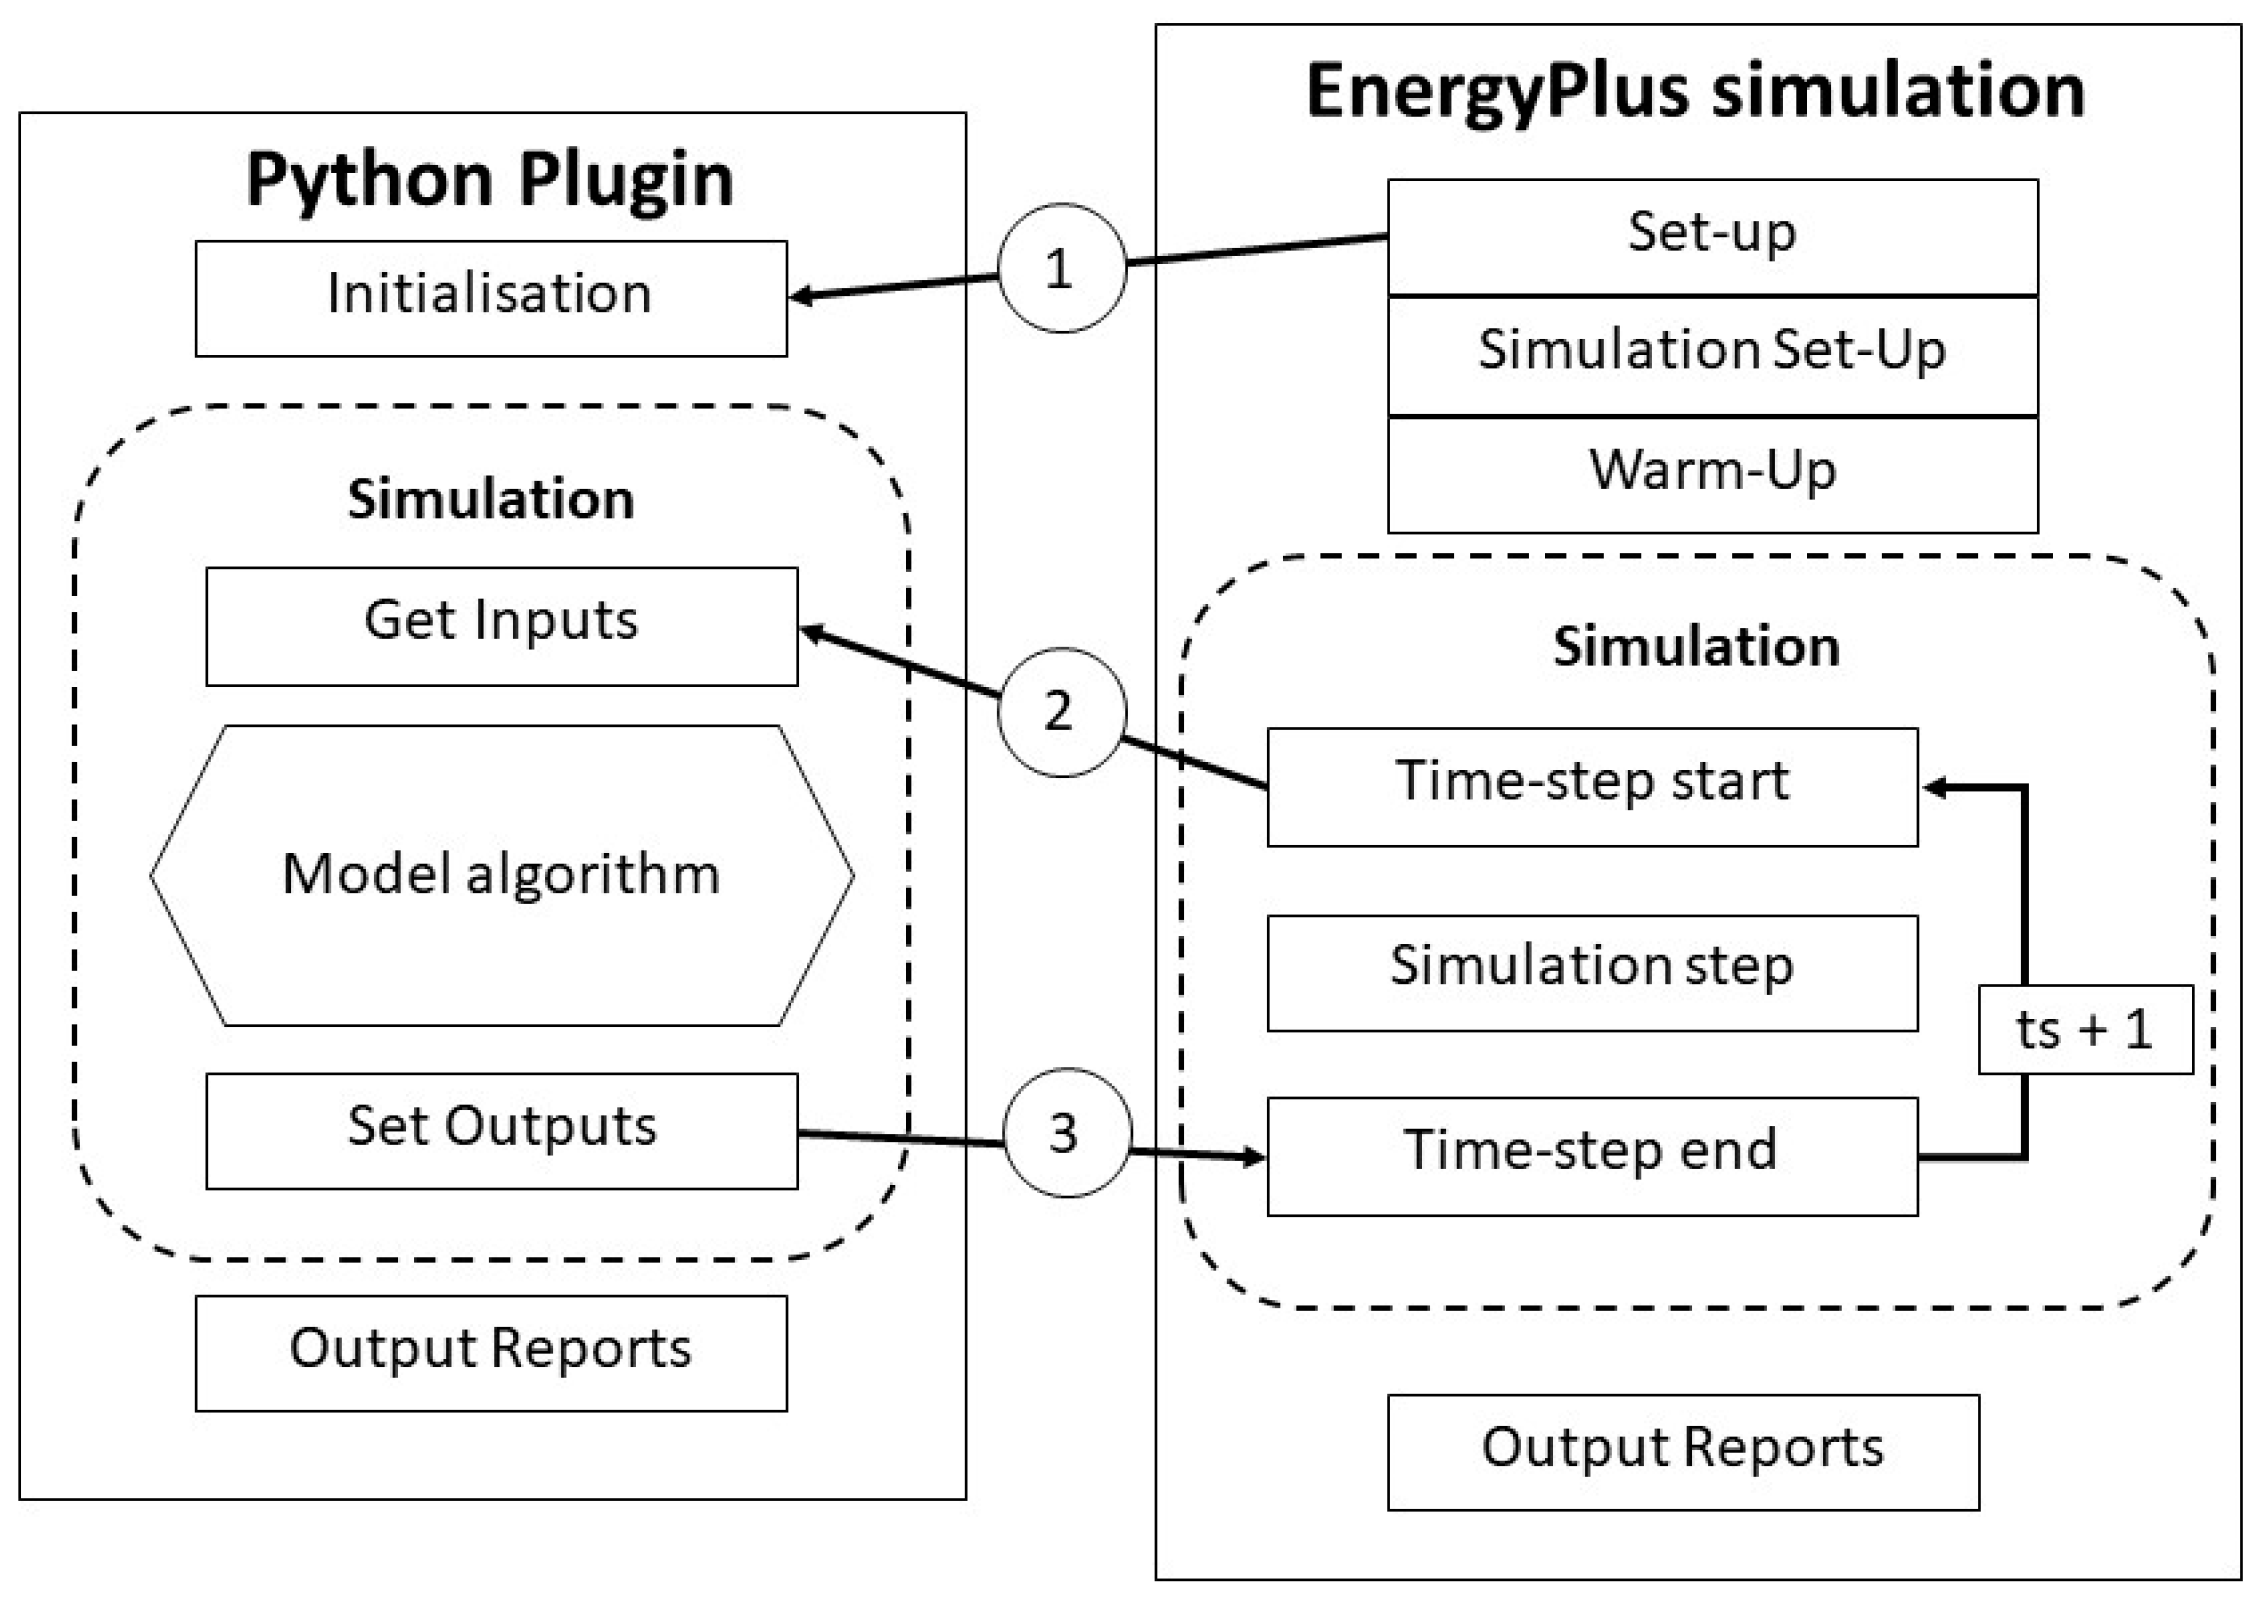
3. Software Module Development: General Methodology
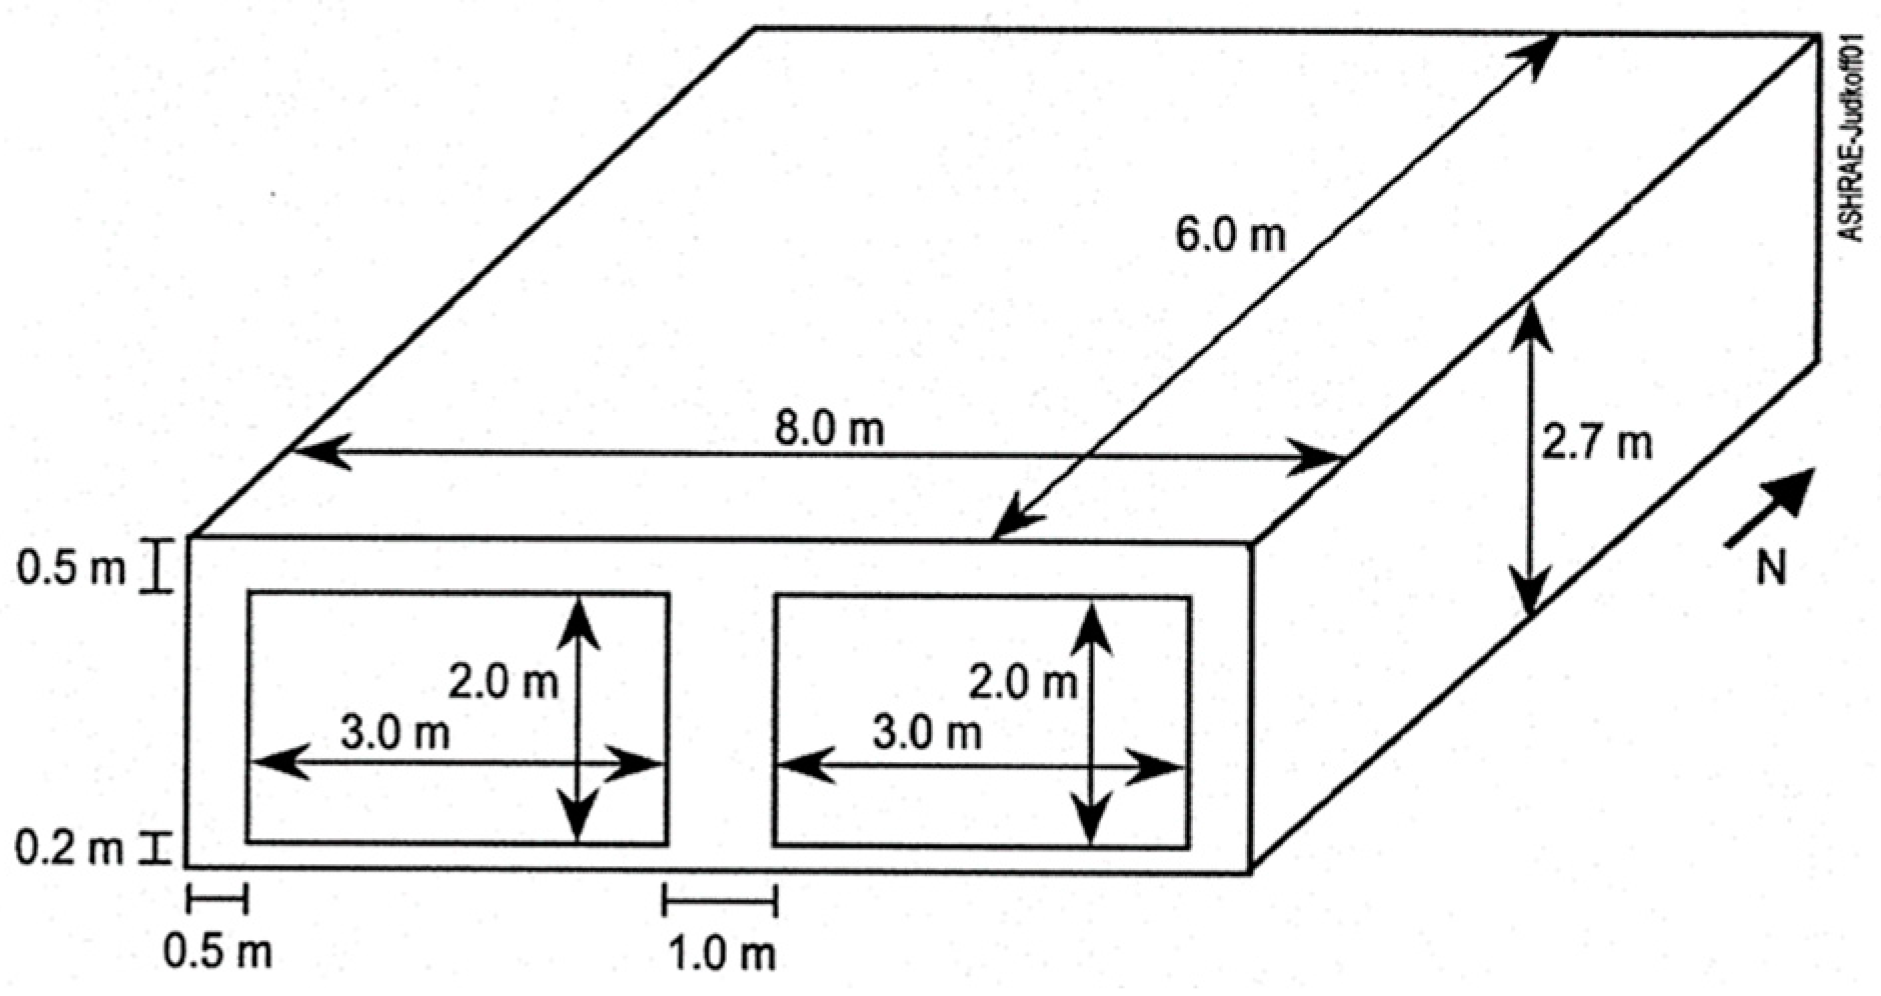
4. Case Study
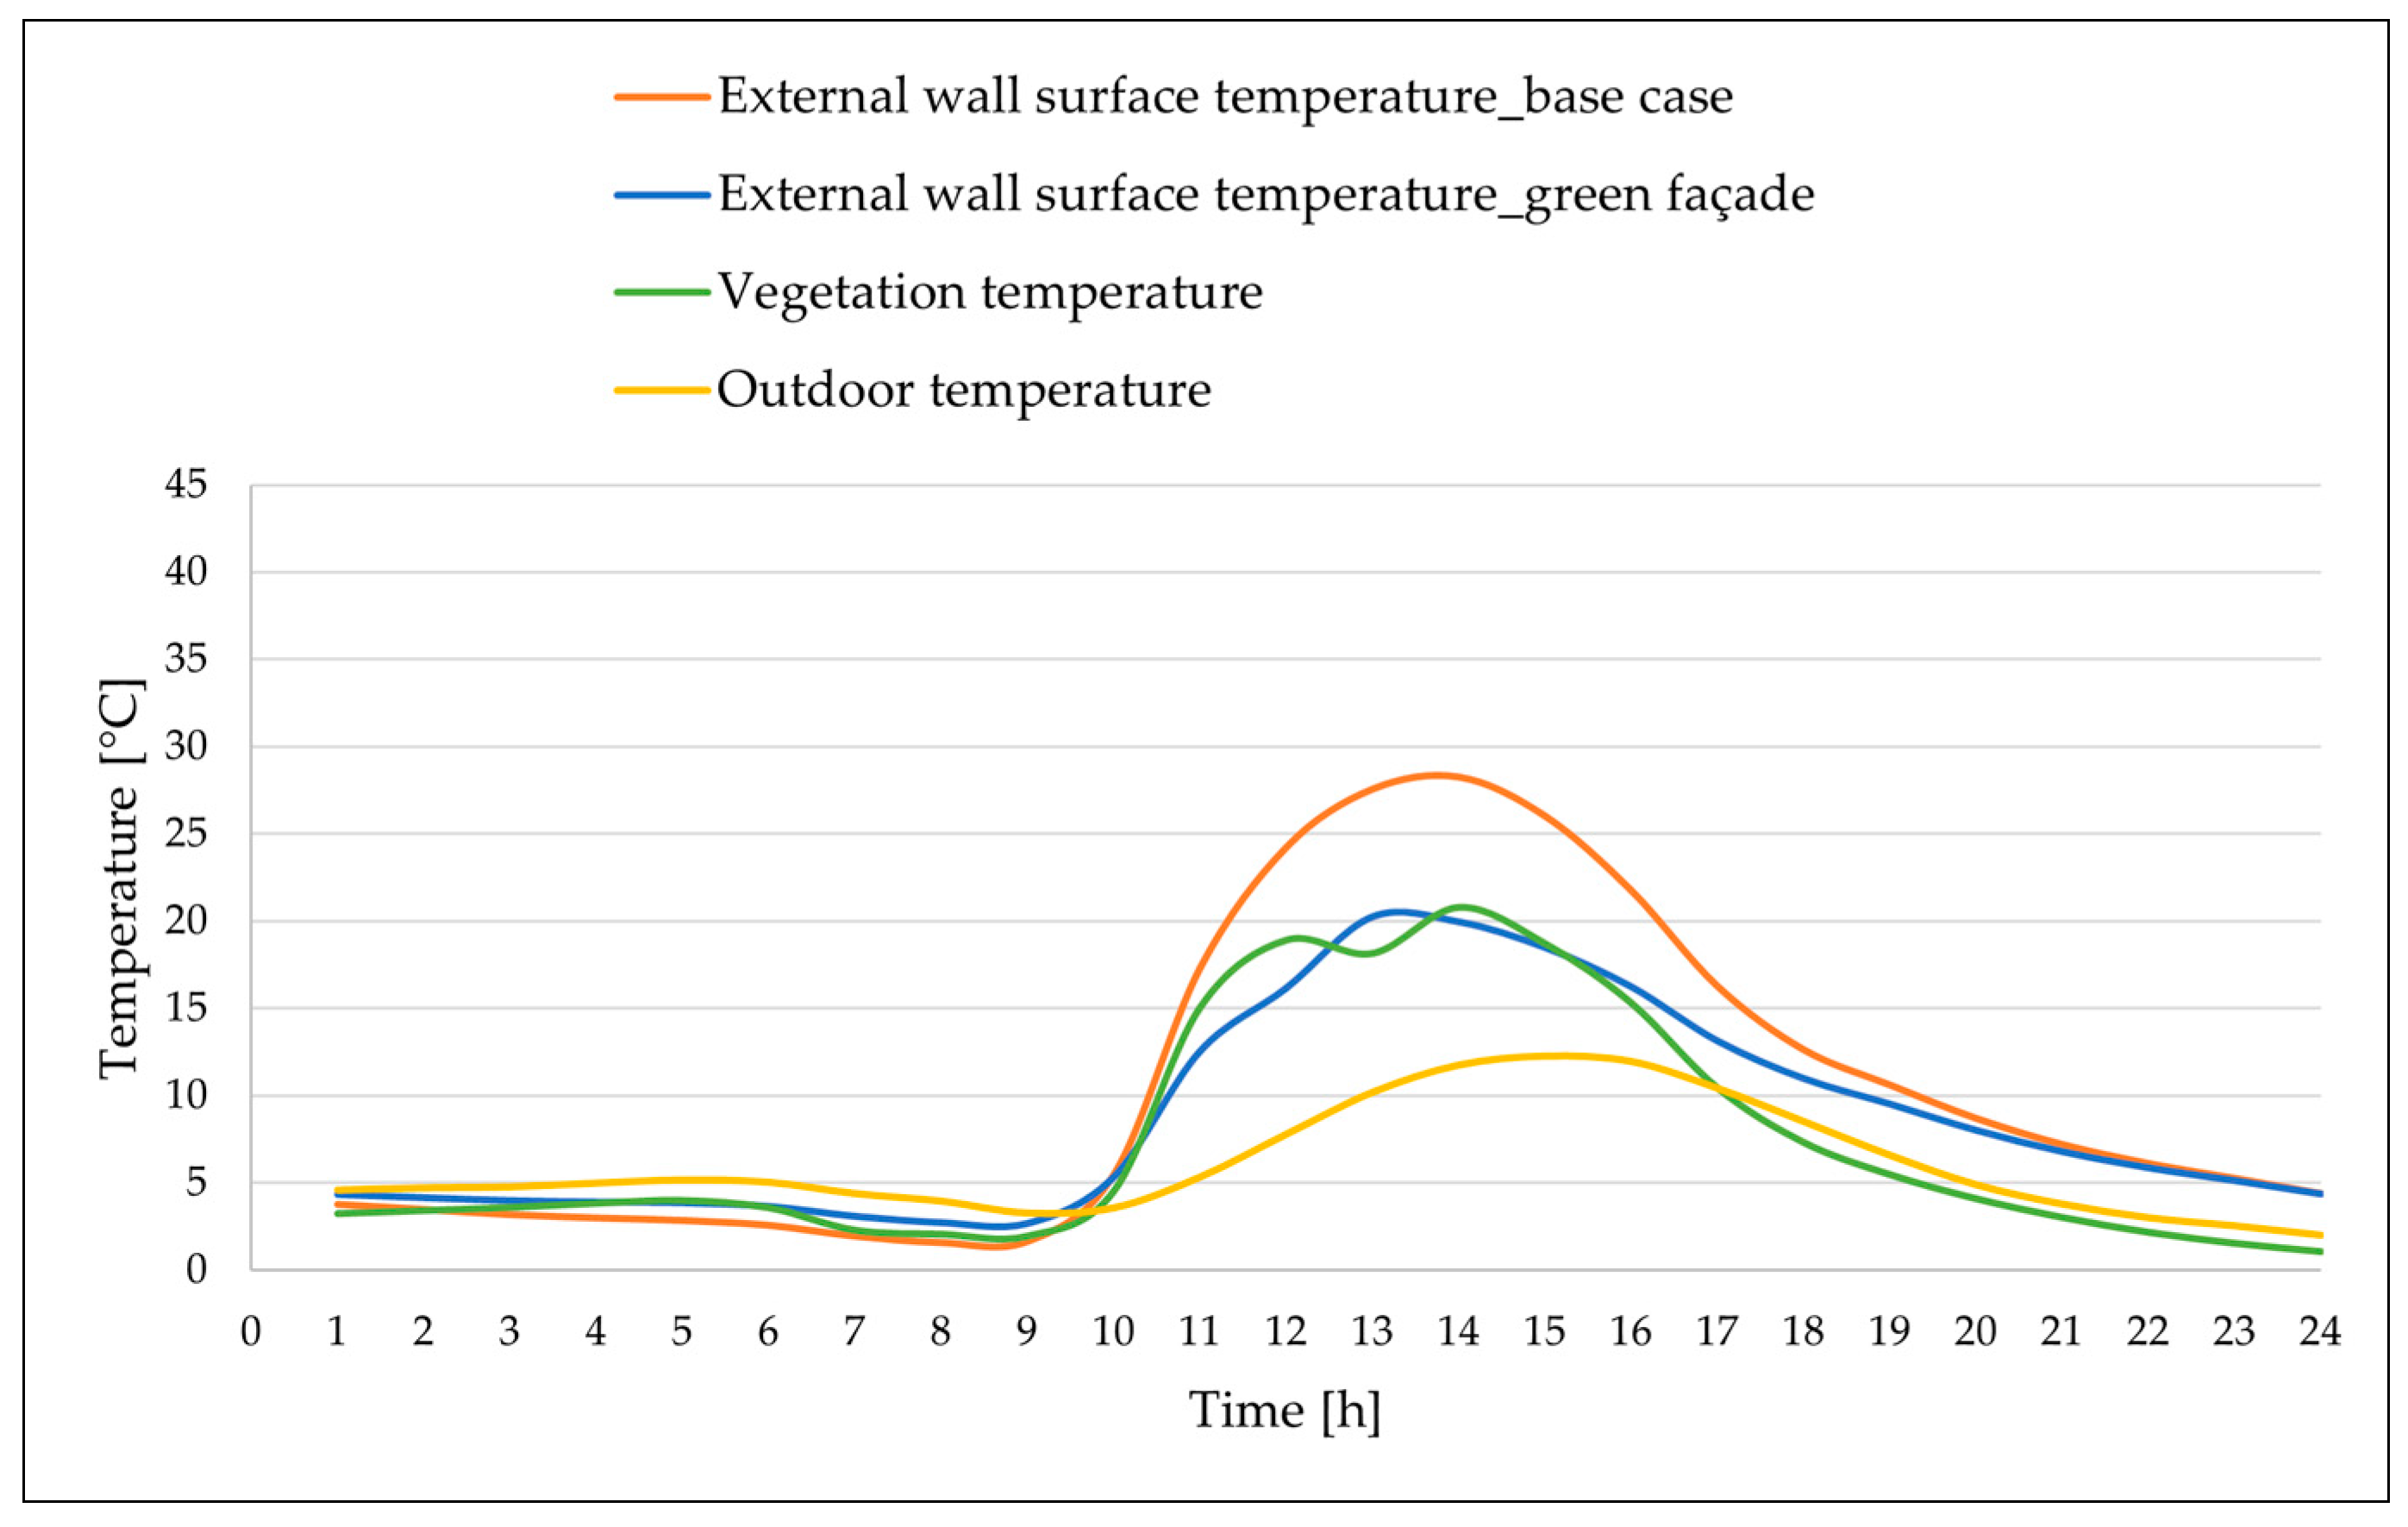
5. Results and Discussion
6. Conclusions
Author Contributions
Funding
Data Availability Statement
Conflicts of Interest
Nomenclature
| Symbol | Quantity | Unit |
| A | Area | m2 |
| c | Specific heat | J/(kg K) |
| d | Characteristic dimension | m |
| e | Vapour pressure | kPa |
| EPnd | Areic thermal energy need | kWh/m2 |
| Gr | Grashof number | − |
| Heat transfer coefficient | W/(m2K) | |
| LAI | Leaf area index | − |
| Nu | Nusselt number | − |
| Pr | Prandtl number | − |
| (Areic) energy flux | W/m2 | |
| Aerodynamic resistance | s/m | |
| Stomatal resistance | s/m | |
| Re | Reynolds number | − |
| Temperature | K | |
| V | Volume | m3 |
| α | Absorptance | − |
| Psychometric constant | kPa/K | |
| Δ | Slope of the vapour saturation pressure curve | kPa/K |
| Emissivity | − | |
| Thermal conductivity | W/(m K) | |
| ρ | Density | kg/m3 |
| Stefan–Boltzmann constant | W/(m2K4) | |
| Fractional vegetation coverage | − | |
| Transmittance | − | |
| Superscripts | ||
| b | Bare | |
| v | Vegetated | |
| Subscripts | ||
| add | Additional | |
| C | Cooling | |
| c | Convection | |
| c | Canopy | |
| d | Conduction | |
| e | External | |
| ea | External air | |
| fl | Floor | |
| gr | Ground | |
| H | Heating | |
| i | Incident | |
| i | Index | |
| r | Long-wave radiation (infrared) | |
| s | Short-wave radiation (solar) | |
| s | Substrate | |
| sky | Sky vault | |
| vs | Saturated vapour | |
| w | Wall |
References
- European Commission. A Renovation Wave for Europe—Greening Our Buildings, Creating Jobs, Improving Lives; European Commission: Brussels, Belgium, 2020. [Google Scholar]
- IEA EBC. International Energy agency’s Energy in Buildings and Communities Programme. Available online: https://www.iea-ebc.org/ (accessed on 10 April 2024).
- Dahanayake, K.W.D.; Kalani, C.; Chow, C.L. Studying the potential of energy saving through vertical greenerysystems: Using EnergyPlus simulation program. Energy Build. 2017, 138, 47–59. [Google Scholar] [CrossRef]
- Susca, T. Nature-Based Solutions Applied to the Built Environment to Alleviate Climate Change: Benefits, Co-benefits, and Trade-offs in a Geographical Multi-scale Perspective. In Handbook of Climate Change Mitigation and Adaptation; Lackner, M., Sajjadi, B., Eds.; Springer: Cham, Switzerland, 2022; pp. 2118–2153. [Google Scholar]
- Safikhani, T.; Abdullah, A.M.; Ossen, D.R.; Baharvand, M. A review of energy characteristic of vertical greenery systems. Renew. Sustain. Energy Rev. 2014, 40, 450–462. [Google Scholar] [CrossRef]
- Manso, M.; Castro-Gomes, J. Green wall systems: A review of their characteristics. Renew. Sustain. Energy Rev. 2015, 41, 863–871. [Google Scholar] [CrossRef]
- Susorova, I.; Bahrami, P. Facade-integrated vegetation as an environmental sustainable solution for energy-efficient buildings. MADE Res. J. Cardiff Univ. Cardiff UK 2013, 7–14. Available online: https://www.researchgate.net/publication/265593368_Facade-integrated_vegetation_as_an_environmental_sustainable_solution_for_energy-efficient_buildings (accessed on 10 April 2024).
- Perini, K.; Ottelé, M.; Fraaij, A.L.A.; Haas, E.M.; Raiteri, R. Vertical greening systems and the effect on air flow and temperature on the building envelope. Build. Environ. 2011, 46, 2287–2294. [Google Scholar] [CrossRef]
- The American Institute of Architects Continuing Education System (AIA/CES). Introduction to Green Walls Technology, Benefits and Design. Green Roofs for Healthy Cities. 2008. Available online: https://www.calameo.com/read/00135160798c31a1b7998 (accessed on 10 April 2024).
- Radic, M.; Dodig, M.B.; Auer, T. Green Facades and Living Walls—A Review Establishing the Classification of Construction Types and Mapping the Benefits. Sustainability 2019, 11, 4579. [Google Scholar] [CrossRef]
- Francis, J.; Hall, G.; Murphy, S.; Rayner, J. Growing Green Guide: A Guide to Green Roofs, Walls and Facades in Melbourne and Victoria, Australia. February 2014. Available online: https://www.melbourne.vic.gov.au/community/greening-the-city/green-infrastructure/Pages/growing-green-guide.aspx (accessed on 10 April 2024).
- Urban greening. UK Guide to Green Walls: An Introductory Guide to Designing and Constructing Green Walls in the UK. 2013. Available online: https://media.wix.com/ugd/c0a820_877fc4a9e779472c53296c58fdfb8d20.pdf (accessed on 10 April 2024).
- National Parl Board. A Concise Guide to Safe Practices for Vertical Greenery. 2013. Available online: https://www.nparks.gov.sg/~/media/srg/publications/A_Concise_Guide_to_Safe_Practices_for_Vertical_Greenery.pdf (accessed on 10 April 2024).
- UNI 11235; Instructions for the design, execution, control and maintenance of green roofs. Italian Organisation for Standardisation (UNI): Milan, Italy, 2015.
- Loh, S. Living Walls—A Way to Green the Built Environment; Environment Design Guide 2008, TEC 26; Royal Australian Institute of Architects: Melbourne, Australia, 2008; pp. 1–7. [Google Scholar]
- He, Y.; Yu, H.; Ozaki, A.; Dong, N.; Zheng, S. An investigation on the thermal and energy performance of living wall system in Shangai area. Energy Build. 2017, 140, 324–335. [Google Scholar] [CrossRef]
- Stec, W.J.; van Paassen, A.H.C.; Maziarz, A. Modelling the double skin façade with plants. Energy Build. 2005, 37, 419–427. [Google Scholar] [CrossRef]
- Zhang, Y.; Zhang, L.; Meng, Q. Dynamic heat transfer model of vertical green façades and its co-simulation with a building energy modelling program in hot-summer/warm-winter zones. J. Build. Eng. 2022, 58, 105008. [Google Scholar] [CrossRef]
- Malys, L.; Musy, M.; Inard, C. A hydrothermal model to assess the impact of green walls on urban microclimate and building energy consumption. Build. Environ. 2014, 73, 187–197. [Google Scholar] [CrossRef]
- Susorova, I.; Angulo, M.; Bahrami, P.; Stephens, B. A model of vegetated exterior facades for evaluation of wall thermal performance. Build. Environ. 2013, 67, 1–13. [Google Scholar] [CrossRef]
- Hartmann, M.; Alsaad, H.; Mosayebzadeh, M.; Voelker, C. The reduction of building energy demand by a living wall system in a Central European climate. In Proceedings of the BS2023, the 18th Conference of IBPSA, Shanghai, China, 4–6 September 2023. [Google Scholar] [CrossRef]
- Garcia, M.; Vera, S.; Bustamante, W.; Rouault, F. Modelling and Validation of two Heat and Mass Transfer Model of Living Walls and Evaluation of Their Impact on the Energy Performance of a Supermarket in a Semiarid Climate. In Proceedings of BS2019, the 16th Conference of IBPSA, Rome, Italy, 2–4 September 2019. [CrossRef]
- Stanghellini, C. Transpiration of Greenhouse Crops an Aid to Climate Management; Instituut voor Mechanisatie, Arbeid en Gebouwen (IMAG): Wageningen, The Netherlands, 1987. [Google Scholar]
- Sailor, D.J. A green roof model for buildings energy simulation programs. Energy Build. 2008, 40, 1466–1478. [Google Scholar] [CrossRef]
- Zotarelli, L.; Dukes, M.D.; Romero, C.C.; Migliaccio, K.W.; Morgan, K.T. Step by Step Calculation of the Penman-Monteith Evapotranspiration (FAO-56 Method); University of Florida: Gainesville, FL, USA, 2010. [Google Scholar]
- Zhao, C.; Zhang, L.; Yang, Y.; Liu, M.; Yan, J.; Zhao, L. Long-wave infrared radiation properties of vertical green façades in subtropical regions. Build. Environ. 2022, 223, 109518. [Google Scholar] [CrossRef]
- ASHRAE Standard 140-2020; Method of Test for Evaluating Building Performance Simulation Software. American Society of Heating Refrigerating and Air-Conditioning Engineers (ASHRAE): Peachtree Corners, GA, USA, 2020.
- European Union. Directive (EU) 2024/1275 of the European Parliament and of the Council of 24 April 2024 on the energy performance of buildings (recast). Official Journal of the European Union, L. 8.5.2024. Available online: https://www.google.com.hk/url?sa=t&source=web&rct=j&opi=89978449&url=https://eur-lex.europa.eu/legal-content/EN/TXT/%3Furi%3DCELEX%253A32024L1275&ved=2ahUKEwiYwd6vm4eHAxX8lK8BHXXTABgQFnoECBIQAQ&usg=AOvVaw13VMZWlcEen2EF3z4EUF6r (accessed on 10 April 2024).


| Parameter | Value |
|---|---|
| Gross volume, V [m3] | 130 |
| Floor area, Afl [m2] | 48 |
| |EPH,nd| [kWh/m2] | Δ|EPH,nd| [%] | |EPC,nd| [kWh/m2] | Δ|EPC,nd| [%] | |
|---|---|---|---|---|
| Base case | 426 | − | 50 | − |
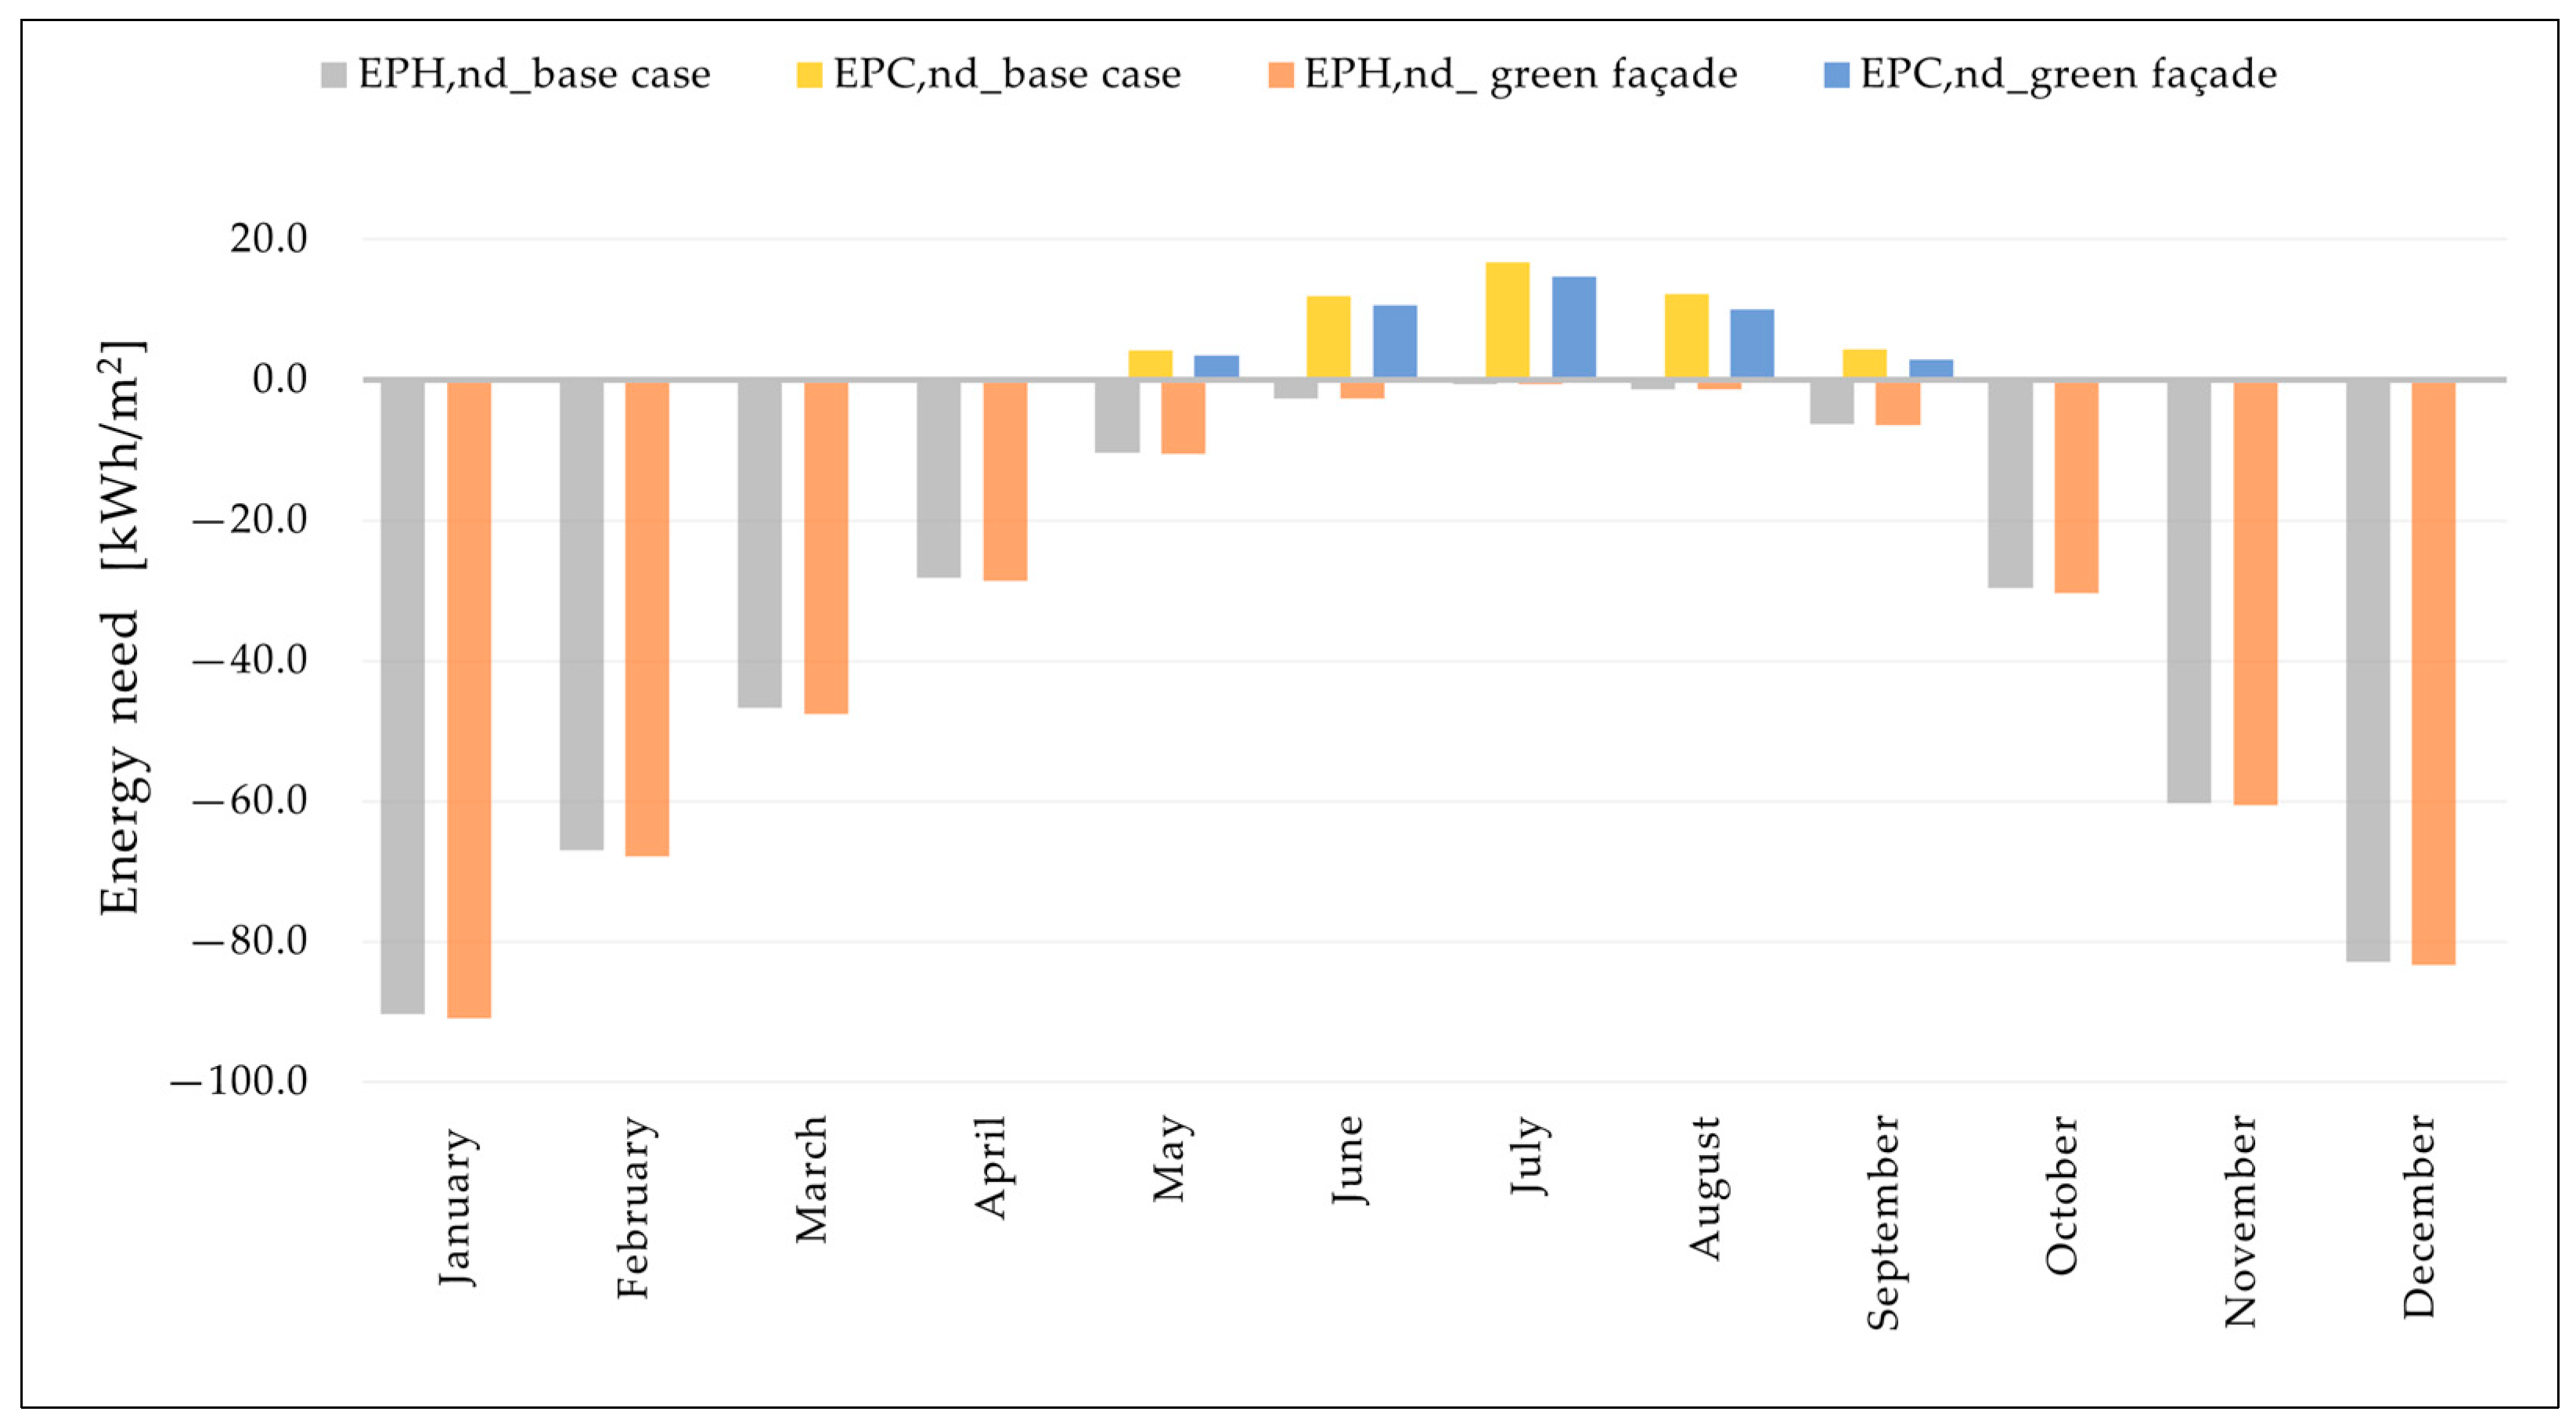
| Green façade | 430 | +1.0 | 42 | −15.2 |
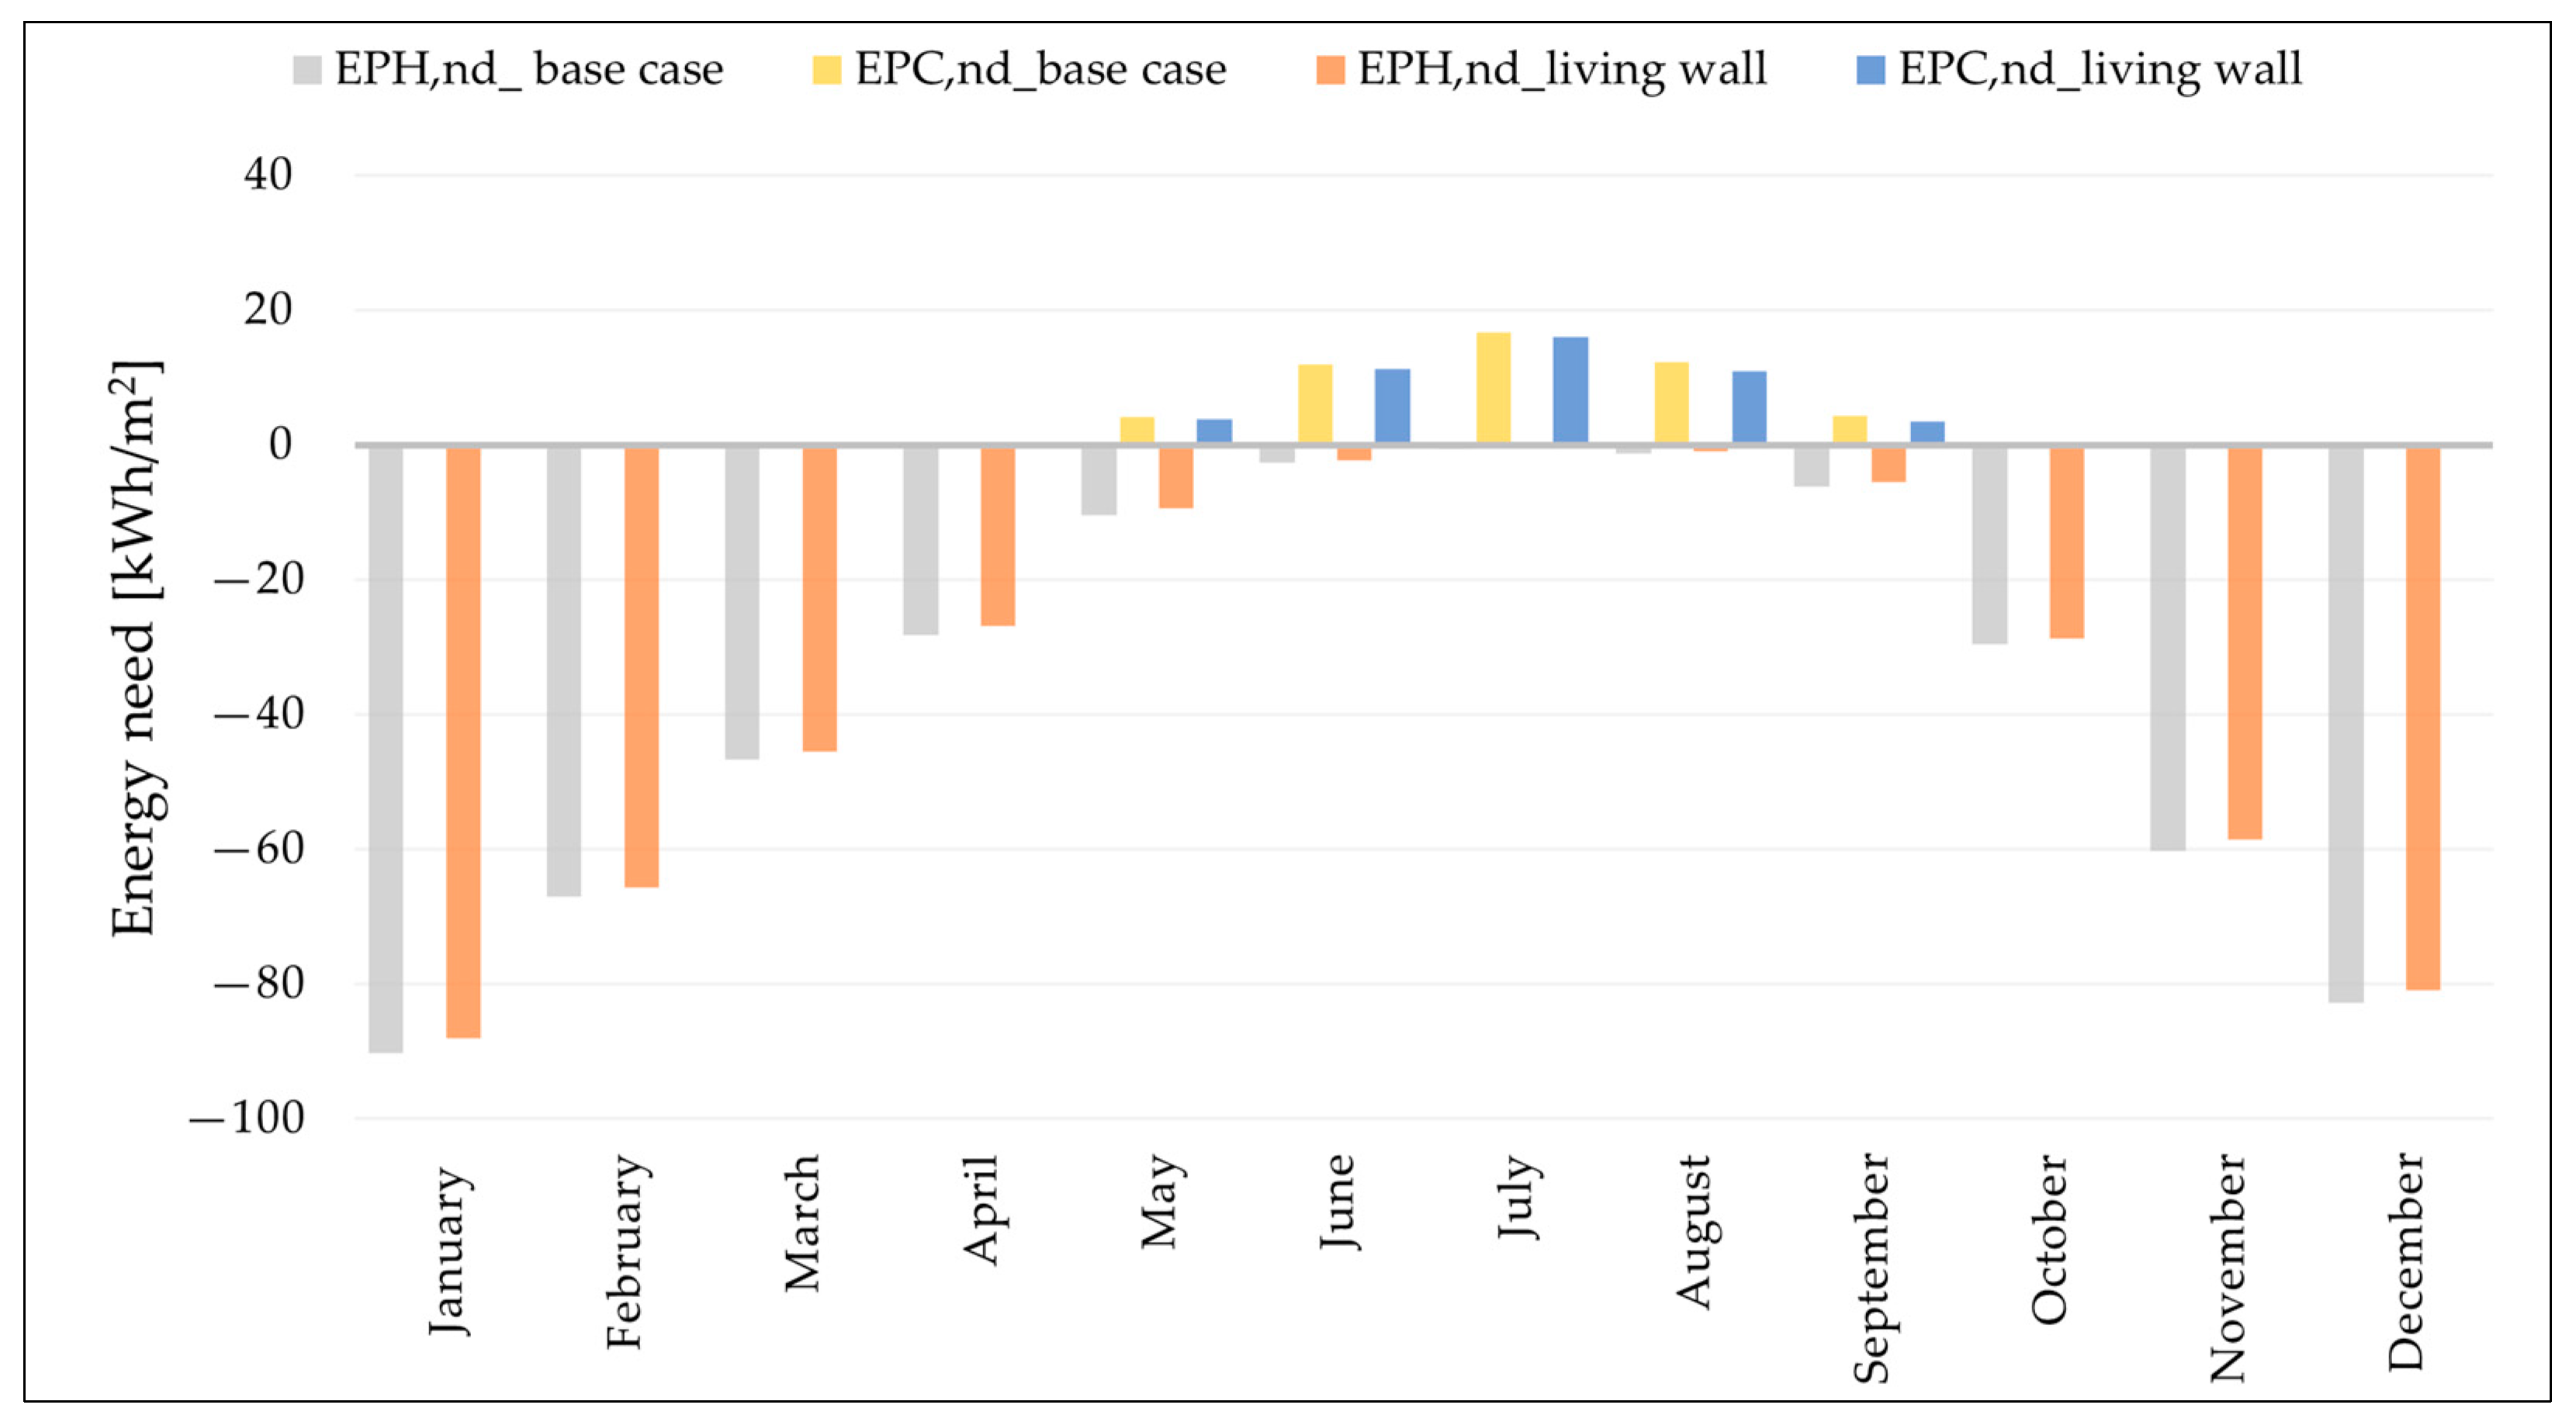
| Living wall | 412 | −3.2 | 46 | −8.5 |
Disclaimer/Publisher’s Note: The statements, opinions and data contained in all publications are solely those of the individual author(s) and contributor(s) and not of MDPI and/or the editor(s). MDPI and/or the editor(s) disclaim responsibility for any injury to people or property resulting from any ideas, methods, instructions or products referred to in the content. |
© 2024 by the authors. Licensee MDPI, Basel, Switzerland. This article is an open access article distributed under the terms and conditions of the Creative Commons Attribution (CC BY) license (https://creativecommons.org/licenses/by/4.0/).
Share and Cite
Nesci, V.; Ballarini, I.; Rando Mazzarino, P.; Corrado, V. Living Walls and Green Façades: An Implementation Code for Energy Simulation. Buildings 2024, 14, 2040. https://doi.org/10.3390/buildings14072040
Nesci V, Ballarini I, Rando Mazzarino P, Corrado V. Living Walls and Green Façades: An Implementation Code for Energy Simulation. Buildings. 2024; 14(7):2040. https://doi.org/10.3390/buildings14072040
Chicago/Turabian StyleNesci, Valeria, Ilaria Ballarini, Pietro Rando Mazzarino, and Vincenzo Corrado. 2024. "Living Walls and Green Façades: An Implementation Code for Energy Simulation" Buildings 14, no. 7: 2040. https://doi.org/10.3390/buildings14072040