Article

Living Walls and Green Façades: An Implementation Code for Energy Simulation

by
Valeria Nesci
1,
Ilaria Ballarini
1,*,
Pietro Rando Mazzarino
2 and
Vincenzo Corrado
1
1
Department of Energy “Galileo Ferraris”, Politecnico di Torino, 10129 Torino, Italy
2
Department of Control and Computer Engineering, Politecnico di Torino, 10129 Torino, Italy
*
Author to whom correspondence should be addressed.
Buildings 2024, 14(7), 2040; https://doi.org/10.3390/buildings14072040
Submission received: 16 April 2024 / Revised: 19 June 2024 / Accepted: 1 July 2024 / Published: 4 July 2024

Abstract

:
The impacts of climate change, excessive greenhouse gas emissions, and the current energy crisis have motivated the European Union to adopt mitigation and adaptation strategies. These strategies primarily focus on the building sector due to its crucial role in addressing these issues. Among the strategies, the implementation of resilient technologies for the building envelope, such as vertical greenery systems (VGSs) is gaining ground. The literature analysis shows that existing models are not sufficiently detailed in their description of the overall thermo-physical phenomena of VGSs. The aim of this work is to overcome the research gaps by selecting and improving two mathematical models for green façades and living walls. A dedicated calculation code to estimate the effect of VGSs on a building’s energy performance and indoor thermal comfort has been developed and implemented within the EnergyPlus calculation software (version 23.2). A BESTest Case from ASHRAE 140 was chosen to test the models and to assess benefits of VGSs. The results show that adopting green solutions for the building envelope can contribute to achieving the building’s energy efficiency goals and that the modelling of these technologies can be easily carried out within a dynamic energy simulation of the building.

1. Introduction

The building sector faces various issues stemming from the effects of climate change, increasing urbanization, and the current energy crisis. These include rising temperatures, CO2 emissions, increased energy consumption, and higher fuel prices for end-users. These challenges highlight the need for adopting innovative solutions to mitigate their impacts. In this regard, the European Union has adopted mitigation policies. The “Renovation Wave” [1] has two primary objectives: to increase the annual rate of energy renovation for both residential and non-residential buildings and to facilitate deep energy renovations. The deep renovation of existing buildings significantly contributes to climate change mitigation by reducing energy consumption and greenhouse gas emissions during the operational phase. However, as the impacts of climate change are expected to intensify, it becomes necessary not only to implement deep renovation interventions and mitigation measures but also to adopt adaptation solutions.
The concept of adaptation to climate change is widely studied, specifically in the building sector, where the design of resilient buildings is crucial. Studies on climate resilience are underway, particularly through initiatives such as the International Energy Agency’s (IEA) Energy Building and Communities environment (EBC) research program [2], which aims to identify solutions to reduce energy and carbon emissions in the built environment. Within this program, the Annex 80 project—known as “Resilient Cooling”—focuses on energy-efficient and low-carbon cooling strategies. Among cooling strategies, green walls, known as vertical greenery systems (VGSs), which encompass green façades and living walls, are included.
To accurately assess the impact of these technologies, accurate and robust numerical models are required. The aim of this work is to enhance the existing mathematical models and develop a calculation code for energy simulation, as further detailed in the description of the objective in Section 1.3.

1.1. Vertical Greenery Systems

Vegetation of building façades has been a traditional architectural feature since ancient times. These vegetated walls were less sophisticated and basically built with self-climbing plants [3]. However, in recent years, significant technological advancements have been achieved in VGSs, making them more efficient and flexible in their application [3]. These systems have evolved considerably, and innovative techniques such as hydroponic systems, which allow plants growth without the need for a substrate, have been introduced.
With the development of these technologies, many terms have been introduced to describe them, such as vertical garden, vertical greenery, vertical green, biowalls, and vertical gardening [4]. Safikhani et al. [5] defined vertical greenery systems as plants which self-develop on vertical surfaces.
The first challenge is to identify technologies that can be classified into the VGS category. To address this issue, a VGS classification has been proposed based on a literature review, as shown in Figure 1. Vertical greenery systems are divided into two main categories: green façades and living walls.
The green façade represents the simplest typology, characterised by a vegetative layer that self-develops on the vertical surface. This can result naturally from self-climbing plants or with the help of support systems that facilitate growth across the maximum dimension of the surface [5,6]. The growing media, where plants roots obtain nourishment, is external to the wall. It typically consists of soil [5] or can be contained within planter boxes at different levels [6].
The living wall is a more complex typology compared to a green façade. Unlike a green façade, where the vegetative layer is attached to the wall, in a living wall, it is fully integrated in the building structure. This typology is characterised by the presence of a substrate that, supported by a specific system, extends across the entire façade. Typically, living walls are separated from the wall surface by a layer of waterproof membrane to protect the envelope from moisture [7].
The two typologies also differ in the plant species that can be implemented. For green façades, common plants are climbers, while for living walls almost any species, both evergreen and deciduous, can be implemented. It is important to pay attention to combining plants with similar needs.
Green façades can be further distinguished into Direct Green Façades, i.e., plants anchored directly to the wall, and Indirect Green Façades, i.e., plants with support systems to aid their development [6,8]. Based on the type of supporting structure employed, Indirect Green Façades can be further classified into Modular Trellis Systems, Cable Wire Systems [9], Grid Systems, and Mesh Systems [10].
Living walls can be subdivided into Modular Living Walls—characterised by several modules that are repeated to form the living walls—and Continuous Living Walls, a wall type without interruptions [6]. In addition to the two main categories, there are further types of living walls that do not fit into a specific category. On the building scale, with a different function compared to the previous types, there is the Active Living Wall. In the landscape context, on the other hand, there is the Landscape Wall.
Due to the growing interest in these solutions, several guidelines explore both their characteristics and advantages. Some significant examples include the “Growing Green Guide” [11], the “UK Guide to Green Walls” [12], and “A concise guide to safe practices for vertical greenery” [13]. These documents provide a comprehensive guide to green walls, covering various systems and offering insights on design, plant selection, irrigation, and maintenance. However, despite the availability of guidelines, there is still a lack of technical standards. For green solutions, currently, only UNI 11235:2015 [14] addresses green roofs, and technical details on VGSs are lacking.
The Vertical greenery systems offer a series of environmental, social, and economic benefits. They mitigate urban air and noise pollution and improve air quality and people’s well-being. Plants, and, in particular, the employed species, play a crucial role in generating these benefits; for example, ivy plants (Hedera helix) can absorb air pollutants and fine dust as well as filter toxic chemicals from the soil, such as volatile organic compounds (VOCs) [10].
The shading effect of the vegetation layer and the process of evapotranspiration significantly lower exterior wall surface temperatures during summer, thus improving building energy performance and occupant comfort. These benefits also positively impact the economic aspect. Although installing a VGS may involve a substantial initial cost, dependent on the system chosen, the subsequent advantages, especially in terms of energy efficiency, reduce the overall energy need over time. The evapotranspirative effect of VGSs also lowers outdoor temperatures in areas surrounding these systems. In high-temperature conditions, when a building’s envelope is covered with vegetation, the air temperature in the surrounding area decreases. This evapotranspirative phenomenon not only cools the surrounding environment but also mitigates urban heat island (UHI) effects [15].
VGSs act as natural noise barriers due to growing substrates and structural materials that absorb and reflect sound, significantly contributing to reducing the noise pollution. This is influenced by the depth of substrate, the materials used and the extent of the vegetation cover.

1.2. Mathematical Models: A Literature Review

Currently, VGSs are still undergoing research and development, unlike traditional solutions such as green roofs, which are widely adopted. Therefore, specific mathematical models are necessary to assess their effect on the energy performance of buildings. Mathematical models of VGSs existing in the literature are often not very detailed or incomplete due to the limited knowledge of such systems. These models mainly focus on analysing the cooling capacity of VGS and investigating the physical processes involved in heat transfer. The main physical phenomena contributing to the cooling effects include shading, resulting from the shielding effect of the vegetation layer, and evapotranspiration from both vegetation and substrate.
To assess the shielding effect of a VGS, scientific studies generally examine the transmittance of solar radiation through vegetation. A study by He et al. [16] investigated the distribution of long-wave radiation, affirming that transmitted radiation is the portion not intercepted by the leaf. The transmission capacity of long-wave radiation through vegetation is determined using Beer’s law, which includes the extinction coefficient for this specific radiation. However, the study does not provide details on the method used to calculate this coefficient.
In addition to the shielding effect, the cooling effects of a VGS are also determined by evapotranspiration by the vegetation and/or substrate. For example, Stec et al. [17] state that approximately 60% of the radiation absorbed by plants is converted into latent heat, thus decreasing the leaf temperature and significantly contributing to the cooling effect. The authors proposed a simplified approach for calculating latent heat to reduce the complexity of heat and moisture transfer models associated with green walls. Nevertheless, adopting such a simplified method may lead to inaccurate results. The most widely used method for estimating the latent heat of evapotranspiration is based on the Penman–Monteith equations, with the most detailed representation described in the DHT model by Zhang et al. [18]. Malys et al. [19] also refer to the Penman–Montheith equations to describe the latent heat flow. The authors developed a heat–mass transfer model to describe green walls, focusing on the development of a hydrothermal model to study these technologies. Despite the positive results of the simulations, uncertainties remain about water balance and evapotranspiration calculation due to the lack of experimental data.
Susorova et al. [20] developed a mathematical model of an exterior wall covered with climbing vegetation to evaluate the thermal effects of plants on heat transfer through building façades. The experiment showed that a layer of plants on a façade can effectively reduce external façade surface temperatures, consequently improving indoor thermal comfort. However, the study considered the heat transfer coefficient of the vegetation-covered wall to be equal to that of a bare wall. This is a problem found in many present mathematical models due to the limited information to refer to. For the study of a living wall, some authors, including Dahanayake et al. [3], utilised the green roof model implemented in EnergyPlus as a starting point. However, the model considered by the authors does not take into account the fact that the main thermo-physical phenomena are different when analysing a vertical green wall. Only a few studies in the literature suggest changes in the main thermo-physical phenomena, such as the absorption of long-wave radiation by plants and the convective transfer flux of the vegetation and substrate. For the latter, the most detailed approaches are those proposed by Hartmann et al. [21] and Garcìa et al. [22] and Stanghellini et al. [23], respectively.

1.3. Objective of the Work

The literature analysis shows that existing models are not sufficiently detailed in the description of the overall thermo-physical phenomena of VGSs. Moving away from traditional solutions, it is necessary to accurately evaluate these technologies using detailed and robust numerical models to analyse their effects on the building energy performance. Furthermore, current detailed dynamic modelling software such as EnergyPlus only allows modelling of a few technologies, such as green roofs, while vertical greening systems are missing. Therefore, it is necessary to set up a calculation code that implements the accurate models of these technologies in simulation tools in order to make them more applicable in professional practice and to boost their use in the building design.
The present work aims to overcome the research gaps by improving existing mathematical models of VGSs as well as developing a calculation code to be integrated in EnergyPlus.
The improved models, which concern both living walls and green façades, were then applied to a BESTest Case (900FF) from ASHRAE 140/2020, adapted to the specific scope of the work, in order to test the effectiveness of the VGSs to reduce the cooling need of the building.

2. Materials and Methods

In the present study, two mathematical models were selected, one for green façades and one for living walls, due to their morphological diversity. The mathematical models presented in this paper fill gaps identified in previous models, making them among the most detailed models available for the study of VGSs. For green façades, the Dynamic Heat Transfer (DHT) model by Zhang et al. [18] was chosen. In the literature, this model describes the green façade typology and the related thermo-physical processes involved more in detail. In addition, it provides the methodological process adopted to incorporate the algorithms in EnergyPlus.
For living walls, there is no complete model available in the literature; existing models only delve into specific thermo-physical phenomena. Therefore, several scientific studies were selected by combining their specific contributions. Generally, studies simulating living walls start from the green roof model (GRM) [24], but many overlook the difference in thermo-physical phenomena between green roofs and living walls. Hence, the implemented model starts from the GRM, but it has been adapted to the specific characteristics of living walls, first of all taking into account vertical orientation. In particular, the main thermo-physical phenomena incorporated include the absorption of long-wave radiation by plants, referencing Hartmann’s studies [21], convective heat transfer flux of vegetation and substrate for a vertical surface according to Stanghellini’s studies [23], and the latent heat flux according to Penman–Monteith’s FAO-56 model [25].

2.1. Green Façade Mathematical Model

To investigate the green façade, the Dynamic Heat Transfer (DHT) model of Zhang [18] was referenced. This model is based on the Beer–Lambert law and the Penman–Monteith equation. After developing the VGS model, a co-simulation through EnergyPlus is proposed, incorporating an additional heat source term and energy management system (EMS). The analysis starts with the heat balance of a bare external wall surface, and then the same balance when it is covered by a green façade is described. The present section provides the heat balances and the most important equations related to them; for more details, refer to the documentation [18,26].
The heat balance on the external surface wall covered by a VGS is given by:
q s , w v + q r , w v + q c , w v = q d , w v
where the terms, expressed in W/m2, represent the net solar radiation flux, the net long-wave radiation flux, the convective heat flux, and the conductive heat flux on the wall covered by VGS.
The net solar radiation for a green façade differs from that of a wall without VGS due to the shading effect of the vegetation cover. The formula is:
q s , w v = q s , i · τ c · α w
where q s , i   is the total incident short-wave radiation flux (solar irradiance) [W/m2], τ c is the total solar energy transmittance of the vegetation [−] and α w is the solar radiation absorptance of the wall surface [−].
The net long-wave radiation is given by:
q r , w v = ε w ( q r , i τ r + ε c σ T c 4 σ   T w , e 4 )
where ε w is the emissivity of the external wall surface [−], q r , i is the total incident long-wave radiation flux [W/m2], ε c is the emissivity of the vegetation [−], σ is the Stefan–Boltzmann constant [W/(m2K4)], T c   is the temperature of the vegetation [K], T w , e is the temperature of the external wall surface [K], and τ r is the long-wave radiation transmittance through vegetation [−].
Regarding thermal convection, previous research indicates that a vertical greenery system may affect the air flow near a wall surface, which could have consequences for the convective heat transfer between that surface and the surrounding air [18]. Due to the lack of studies to refer to, it was assumed that the convective heat flow of a wall covered by VGS is equal to that of an external wall without VGS. This aspect represents a simplification of the model.
Thus, the convection heat transfer of a wall with VGS is:
q c , w v = q c , w b = h c ( T e a T w , e )
where h c is the convective heat transfer coefficient [W/(m2K)] and T e a and T w , e are the external air and external wall surface temperatures, respectively [K].
Finally, the conductive heat flux of the wall covered by a VGS is the result of the sum of all the previous contributions.
In addition to the balance of the external wall surface covered by a VGS, a vegetation balance was developed. By solving the heat balance equation of the vegetation, its temperature ( T c ) is obtained, and the exchange of long-wave radiation between the vegetation and the external wall surface (Equation (3)) is evaluated.
The vegetation balance is expressed by the equation:
q s , c + q r , c + q c , c q t r = 0
where the terms, expressed in W/m2, represent the net solar radiation of vegetation, the net long-wave radiation of vegetation, the convective heat flux of vegetation, and finally the latent heat flux of transpiration, estimated with the Penman–Monteith equation (FAO-56).
The net solar radiation of vegetation is calculated as:
q s , c = q s , i · α c
where q s , i is the total incident short-wave radiation flux [W/m2] and α c is the solar radiation absorptance of vegetation [−].
The net long-wave radiation of vegetation is calculated as:
q r , c = ε c ( q r , i + ε w σ T w , e 4 2 σ T c 4 )
where ε c is the emissivity of the vegetation [−], q r , i is the total incident long-wave radiation flux [W/m2], ε w is the emissivity of the external wall surface [−], σ is the Stefan–Boltzmann constant [W/(m2K4)], T w , e is the temperature of the external wall surface [K], and finally T c is the temperature of the vegetation [K].
The convective heat flux of vegetation is calculated as:
q c , c = 2 L A I ρ e a c e a r a T e a T c
where LAI is the leaf area index [m2/m2], ρ e a is the external air density [kg/m3], c e a is the specific heat of external air at constant pressure [J/(kg·K)], and r a   is the aerodynamic resistance [s/m].
Finally, the latent heat flux of transpiration is calculated using the Penman–Monteith equation:
q t r = Δ q s , c + q r , c + ρ e a c e a ( e v s e ) / r a Δ + γ + r s γ / r a
where Δ is the slope of the vapour saturation pressure curve as a function of temperature [kPa/K], e v s   is the saturated vapour pressure [kPa], e is the real vapour pressure [kPa], γ is the psychrometric constant [kPa/K], and r s   is the stomatal resistance [s/m].
The additional heat source term for the co-simulation approach of the external wall surface covered by VGS was calculated using the equation:
q a d d = q s , w v + q r , w v q s , w b q r , w b
where q s , w v and q r , w v are the fluxes of net short-wave radiation and net long-wave radiation on the VGS covered wall, [W/m2], and q s , w b and q r , w b   are the fluxes of absorbed solar radiation and net long-wave radiation on the surface of the bare external wall, [W/m2], respectively.

2.2. Living Wall Mathematical Model

Starting from the green roof model (GRM), the main equations that modify the model’s balances based on previous studies are given to be adapted to a living wall. To study the phenomenon of the absorption of long-wave radiation by leaves and the substrate, reference is made to Hartmann’s study [21]. The GRM of EnergyPlus considers the absorption of long-wave radiation from the sky, the emission of radiation by the leaves, and multiple reflections between the plant layer and the substrate. In the case of a vertical green wall, however, the radiant exchange is not only towards the substrate and the sky but also towards the ground. Therefore, the view factors for the sky ( F s k y ) and ground ( F g r ) were added to the long-wave radiation balance [21,22]; it is calculated for vegetation and substrate, respectively, as:
  q r , c = σ c F c , g r ε c ε g r σ T g r 4 T c 4 + F c , s k y ε c ( I r σ T c 4 ) + σ c ε s ε c σ ε s + ε c ε s ε c T s 4 T c 4
  q r , s = ( 1 σ c ) · F s , g r ε s ε g r σ T g r 4 T s 4 + F s , s k y ε s ( I r σ T s 4 ) σ c ε s ε c σ ε s + ε c ε s ε c T s 4 T c 4
Convective heat transfer of both vegetation and substrate is the phenomenon that significantly distinguishes green walls from green roofs. The convective sensible heat flow can be calculated using Newton’s law:
q c = h c   ( T e a T c )
where q c is the sensible convective heat flux [W/m2], and h c   is the convective heat transfer coefficient [W/(m2K)].
To determine the sensible convective heat flux, it is necessary to find the convective heat transfer coefficient h c ,   which is often determined using the dimensionless Nusselt number:
h c = N u   λ e a   d 1
where λ e a   is the thermal conductivity of external air [W/(m K)] and d is the characteristic dimension of the component in exam. For the identification of the Nusselt number, there are several possibilities of determination; among them, however, the Stanghellini resolution (Equation (15)) [23] was selected, as it is one of the few that addresses the convective exchange between the air and the leaf layer and can be applied in the case of a vertical green wall.
N u = 0.405   ( P r · G r + 6.29   P r · R e 2 ) 0.25
Pr, Gr, and Re are the dimensionless Prandtl, Grashof, and Reynolds numbers, respectively.
Lastly, the latent heat flux for foliage and substrate can be modelled based on the FAO-56 Penman–Monteith equation [25], as seen for the green façade (Equation (9)). For the substrate, Equation (9) is modified by replacing the short- and long-wave radiation of the substrate. The modelling of living wall behaviour does not take into account the contribution of latent heat due to freeze–thawing of the substrate.

3. Software Module Development: General Methodology

After the models were selected and examined in detail, they were implemented and simulated in EnergyPlus to evaluate their impact on the building’s energy performance. Since EnergyPlus lacks objects to describe the vertical green components, the aforementioned models were externalised and embedded into Python code.
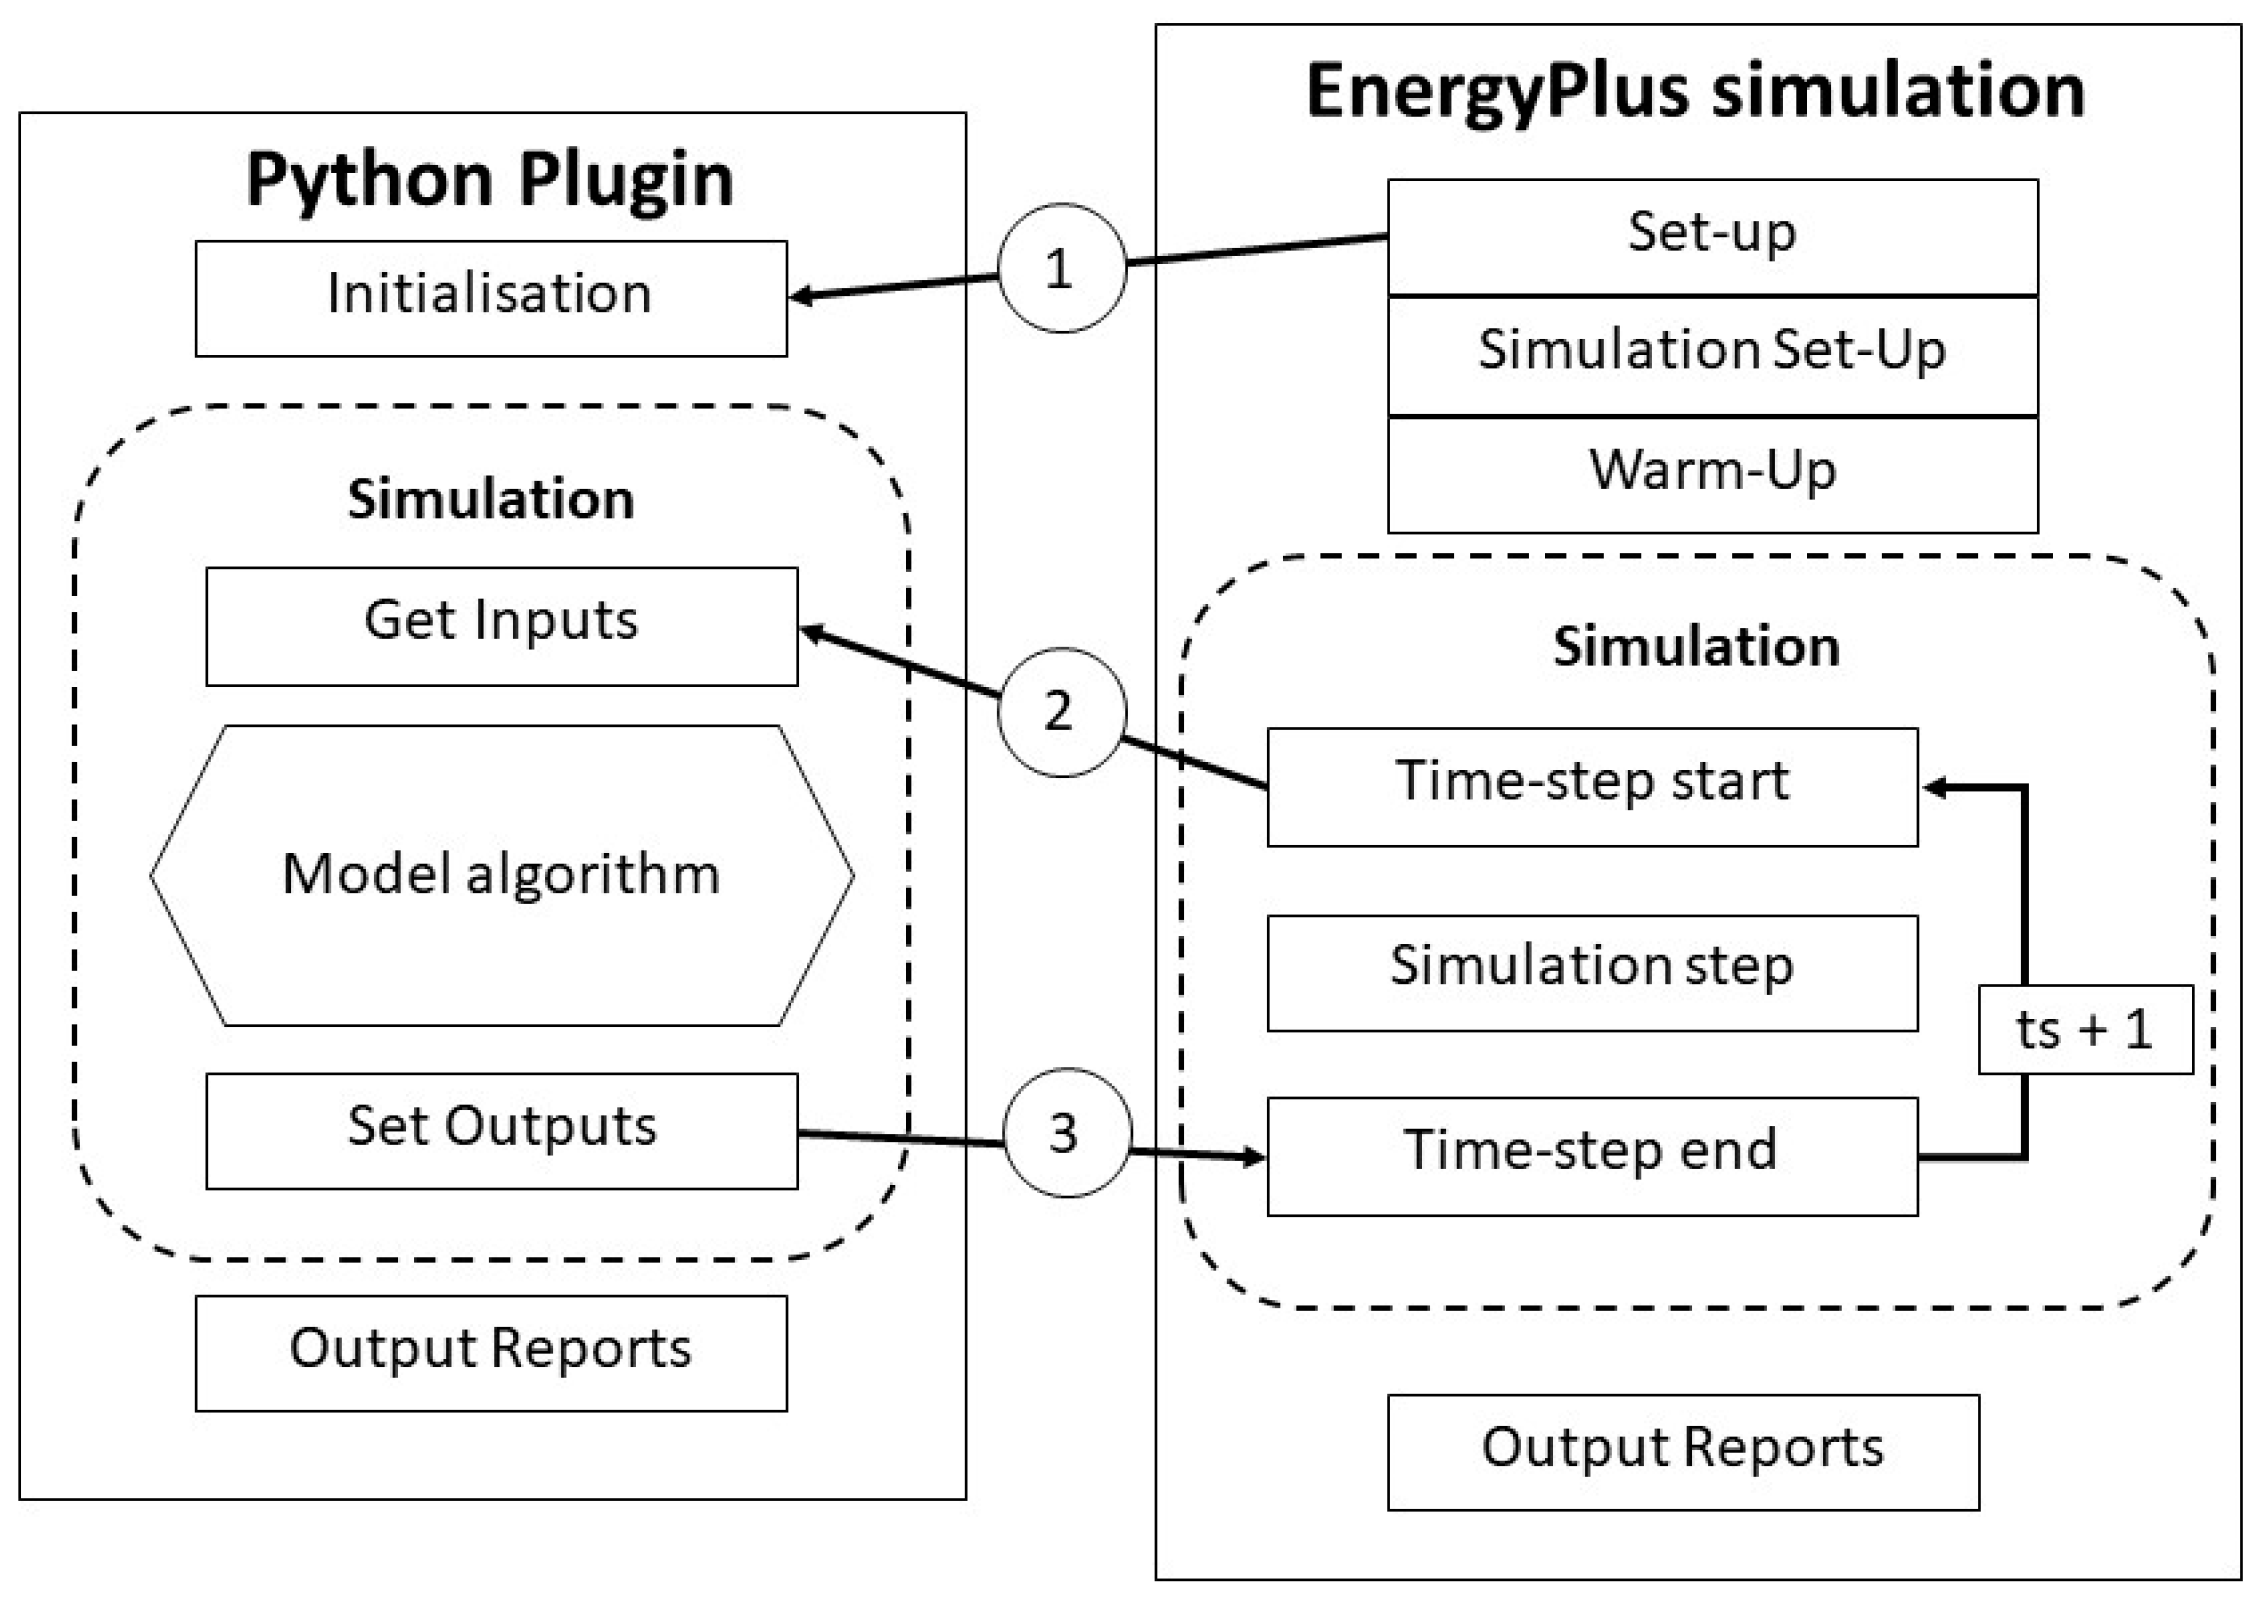
To facilitate this integration, two Python plugins for EnergyPlus were developed. Python plugins are a novel feature in EnergyPlus that enable the seamless integration of Python code into the traditional EnergyPlus execution workflow. This is achieved by overriding a base class that contains a set of callbacks, which are invoked at various stages of the EnergyPlus simulation process.
The two developed plugins differ in their internal algorithmic approach but interact with the EnergyPlus calculations following the same approach. To account for the presence of vertical greenery components, the approach involves modifying the thermal heat balance at the specific surface to which the vertical greenery component is attached. This modification reflects the unique thermal properties and interactions associated with vertical greenery systems. Thus, looking at Figure 2, it is possible to see the generic calling points that allow both Python plugins and EnergyPlus to be interfaced. Indeed, after the initialization, at each simulation step, the EnergyPlus workflow is paused until the Python plugin obtains the needed values, performs its calculation, and sets new boundary conditions for the surfaces of interest. In this work, the calculation for the vertical green components is translated into an additional heat term that is provided to EnergyPlus to properly modify the heat balance on the external surfaces.
To run the simulation with the proposed Python plugins, additional information is needed with respect to the EnergyPlus input file. Parameter configuration for the simulation is then performed partly in EnergyPlus through the Material:Roofvegetation object and partly externally through a configuration file to integrate information not already included in the EnergyPlus object.
Figure 3 shows the details of the two implemented models. Figure 3a reports the steps for the green façade algorithm, while Figure 3b shows the steps for the living wall. Looking at Figure 3a, it is possible to see that the workflow is divided into solar and thermal radiation calculations; the first allows direct estimation of incident solar radiation on the external surface behind the vertical green component, while the latter needs to perform an heat balance on the green façade in order to calculate the temperature at the leaves and then the incident thermal radiation on the external surface. Once both incident solar and thermal radiation are estimated, it is possible to calculate the additional heat term to be set as a boundary condition to the external surface balance inside EnergyPlus.
Figure 3b shows the living wall algorithm steps; the primary objective is the estimation of temperatures at the vegetation and soil layers. This is performed by recursively solve the heat balances at both layers in order to obtain temperatures and heat components. From this, it is possible to determine the heat components involving the external surface behind the living wall and thus set the additional heat term for the EnergyPlus calculations.
In the balances of the green façade and living wall, the vegetation and substrate temperatures represent the final outputs. To solve the balances, balance equations are linearised by expressing the fourth powers of the temperatures involved at timestep i, according to the following formula:
T i 4 = T i 1 4 + 4   ( T i 1 ) 3 ( T i T i 1 )
where T i 1   represents the temperature [K] in the previous timestep, while T i   represents the temperature [K] in the current timestep, and the unknown term in the equation.
A user manual was produced, in which the procedures for first use and the installations required to operate the plugins are explained.

4. Case Study

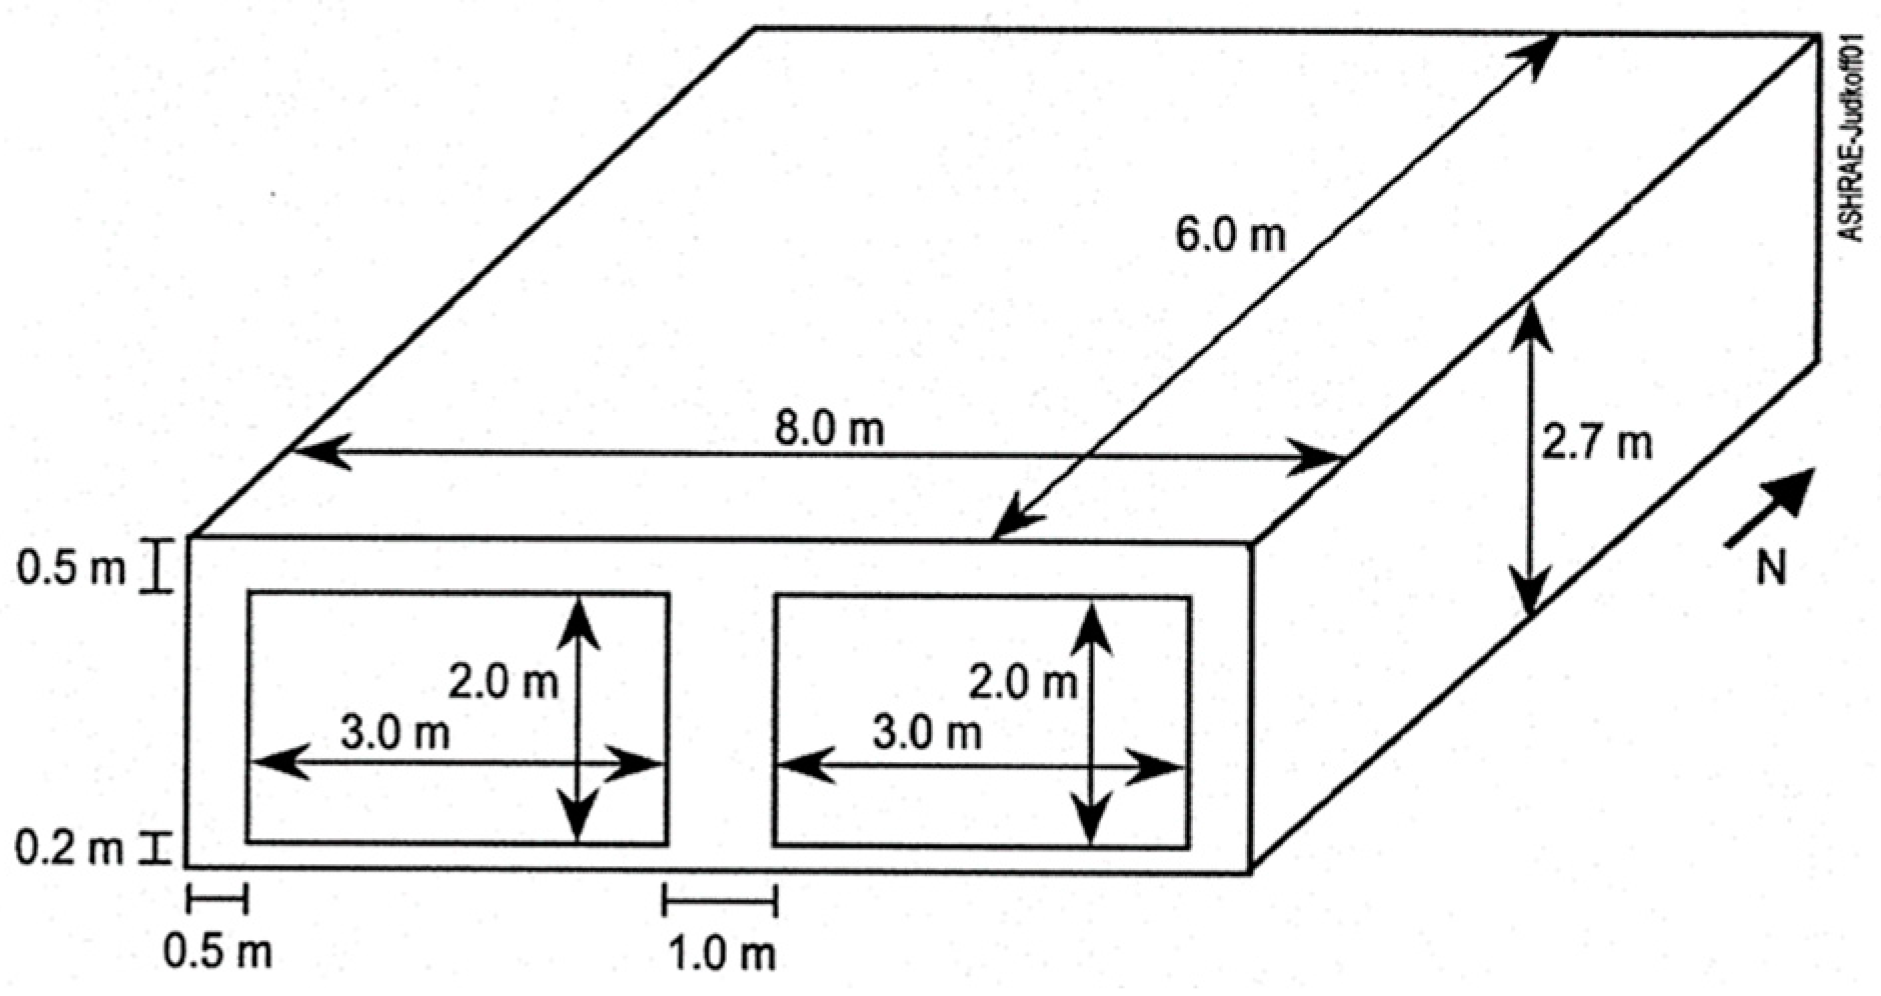
The reference case study used for dynamic simulations of mathematical models is a BESTest Case of the ANSI/ASHRAE 140-2020 standard: “Method of Test for Evaluating Building Performance Simulation Software” [27]. The selected case study is the 900FF: free floating temperature test for base case of a high mass building. The basic case study (Figure 4) consists of a single rectangular room with no internal partitions and two openings on the south side. It has a high mass construction without a heating or cooling system.
Table 1 shows the main geometric data of the case study, taken from the ANSI/ASHRAE 140-2020 standard.
To neutralise the effect caused by the presence of transparent components and to apply the surface finishing under analysis, the initial case study was modified as follows. The south-facing openings were eliminated, and only the concrete block for the vertical walls and the concrete slab for the floor were maintained in the building elements’ stratigraphy constituting the opaque envelope. For the upper floor, the standard configuration was replaced with a concrete slab to ensure uniformity in the structure. The dimensions of the geometric model remained unchanged. The decision to simplify the initial model was driven by the need to assess the effects of the applied technologies without being influenced by the presence of a more complex configuration, as proposed in the initial case, or the presence of a heating or cooling system.
Figure 5 shows the final configuration of the case study used for the simulation and validation of the mathematical models for VGSs. Finally, the green technology was applied to the south wall of the case study. For dynamic simulations, climatic data of Turin (Italy) were employed, neglecting both ventilation and internal gains.
The outputs of the simulations were the external surface temperature of the wall and the operating temperature of the internal environment in the free-floating condition. Finally, the heating and cooling loads of the space were calculated, simulating an ideal system with infinite heat capacity.

5. Results and Discussion

In the analysis, two specific days were considered: 10 December and 17 August. The selection aimed to examine the behaviour of green walls at crucial times of the year. These days were chosen as representative of winter and summer seasons, based on the daily average of global solar radiation and outdoor temperature. For each day, the performance of the south façade, with and without the VGS, was evaluated by assessing the wall’s external surface temperature profiles in free-floating conditions. The annual cooling and heating needs were also assessed with and without the green technology. Additionally, a sensitivity analysis was conducted by varying the most significant parameters for the applied technologies. In the dynamic simulation performed, the leaf area index (LAI) was not kept constant throughout the year but adjusted to the specific values for each of the selected days, i.e., LAI equal to 1 in winter and 5 in summer. This approach aimed to enhance the accuracy of the simulations and bring them closer to reality. The most significant results are presented below.
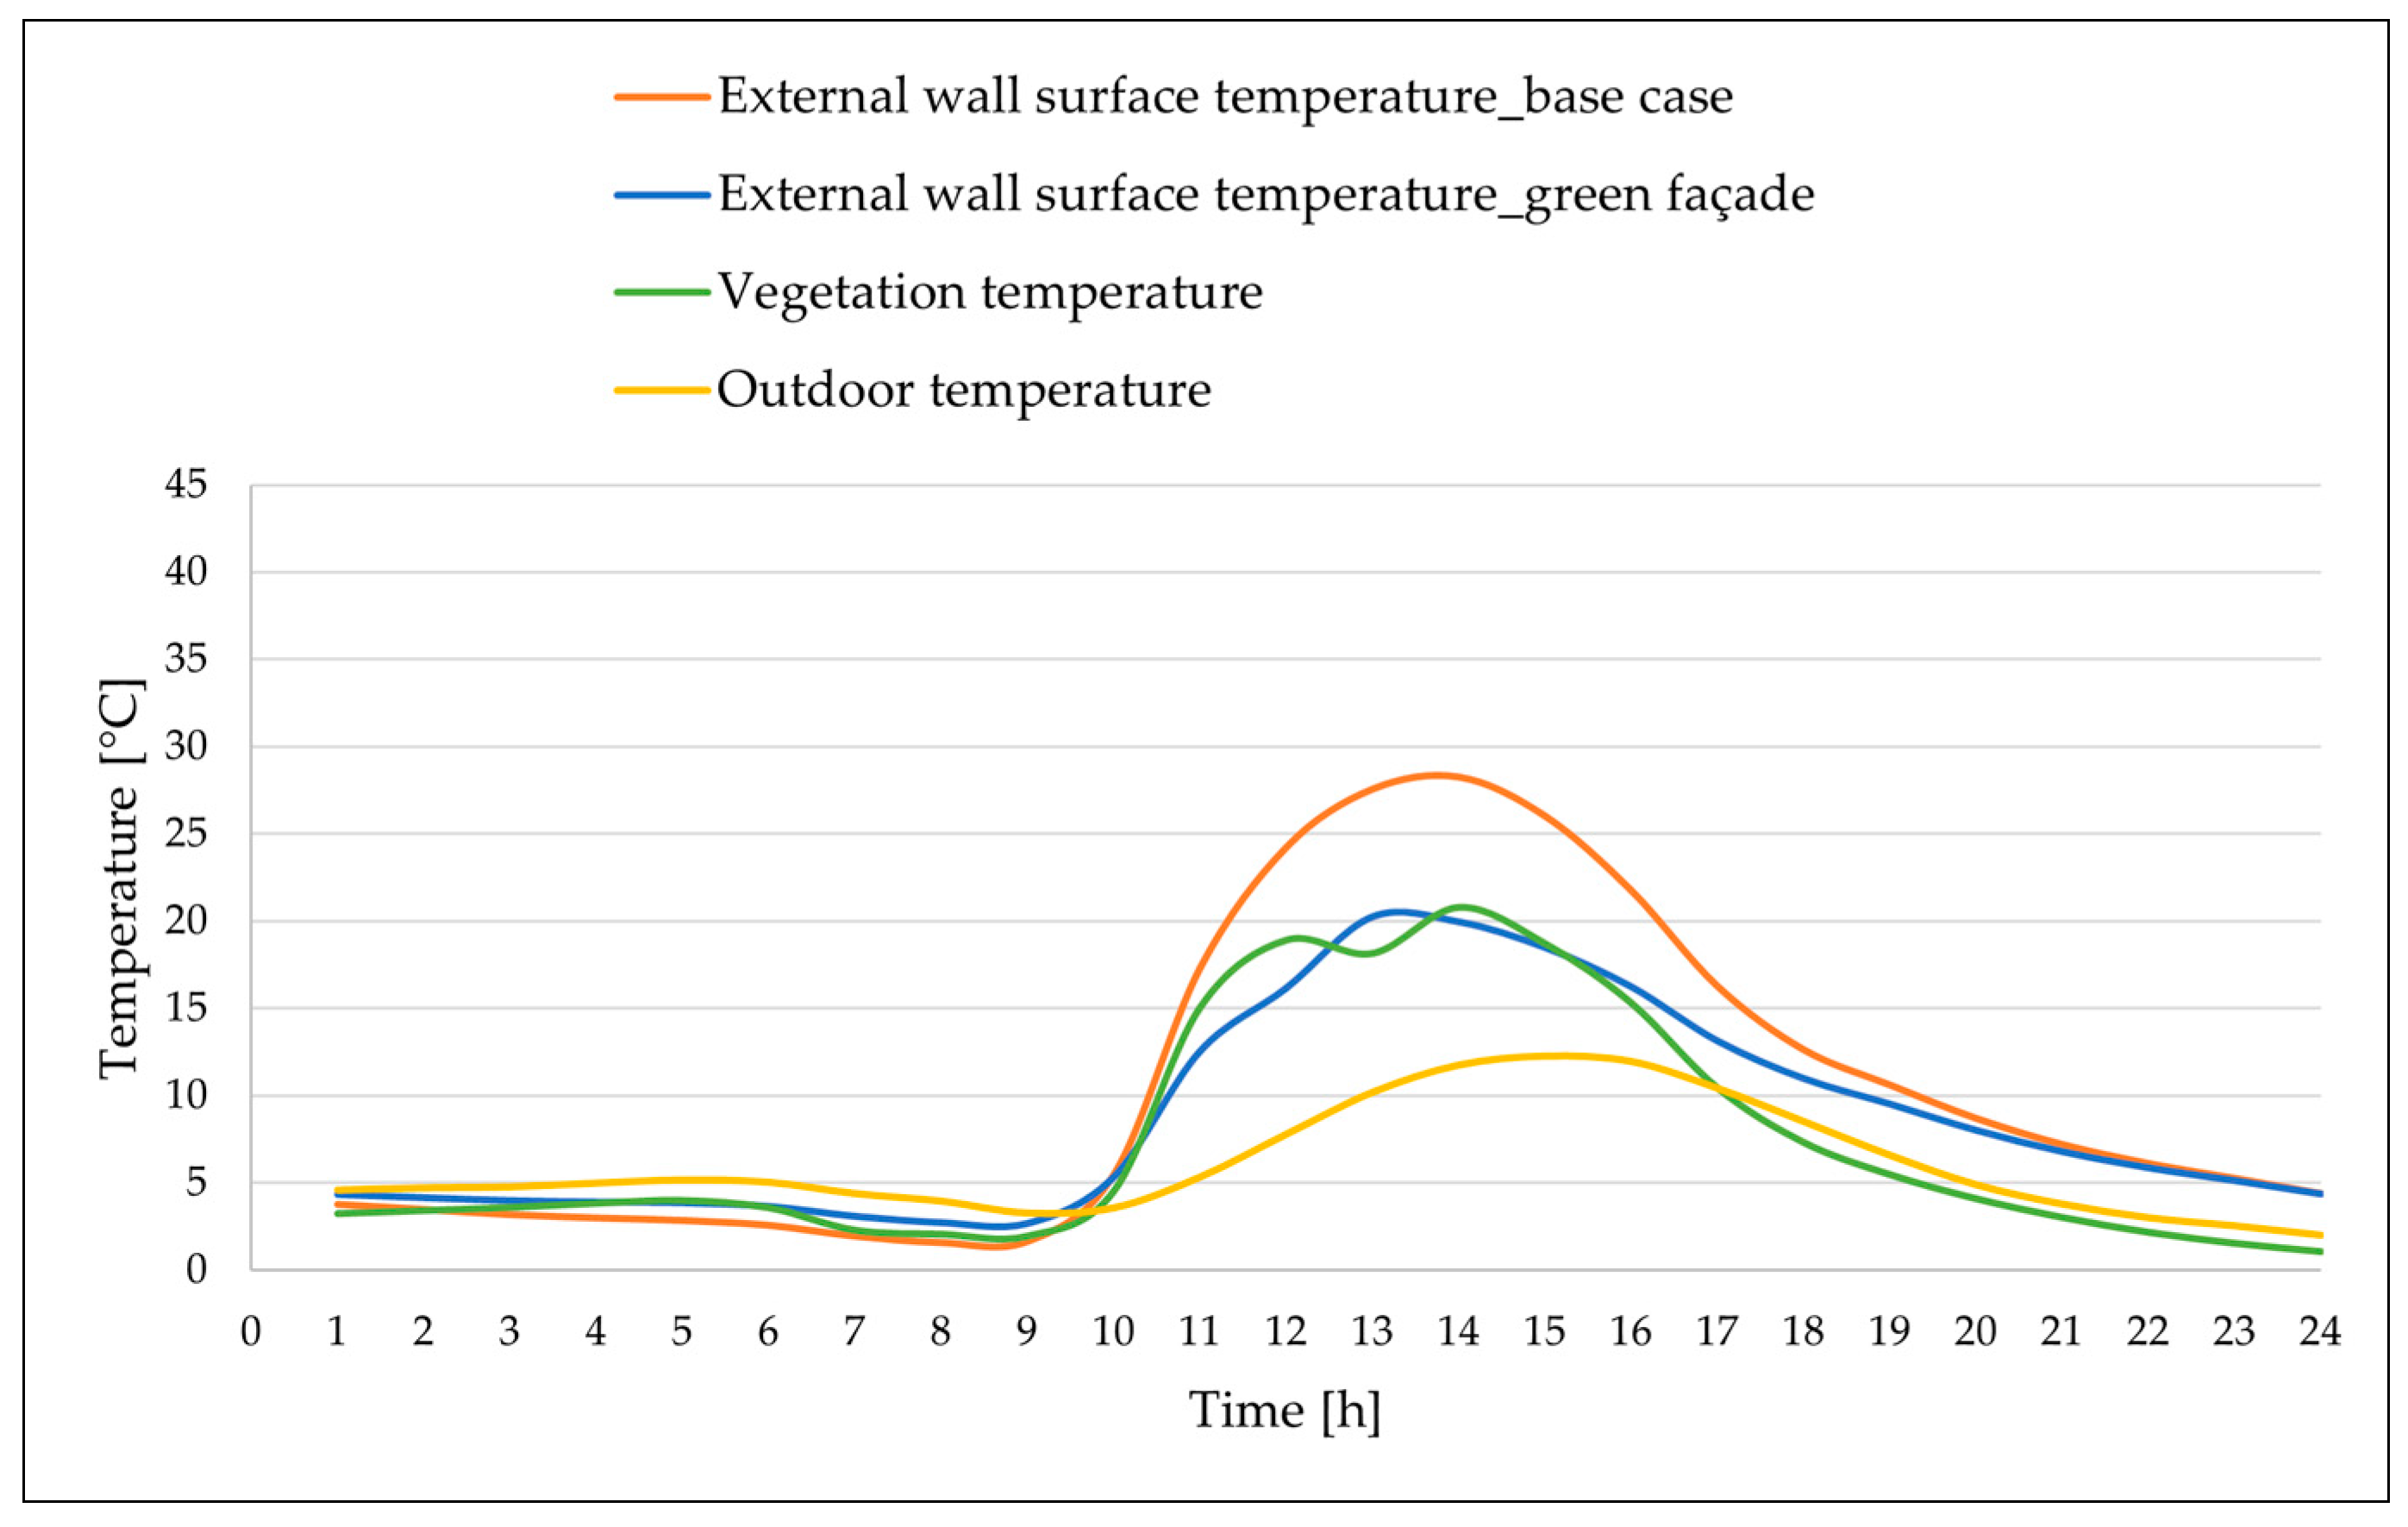
On the winter day (Figure 6), a notable decrease in the external wall surface temperature is observed compared to that of the bare wall, especially in the central hours of the day due to the shielding effect produced by the applied solution.
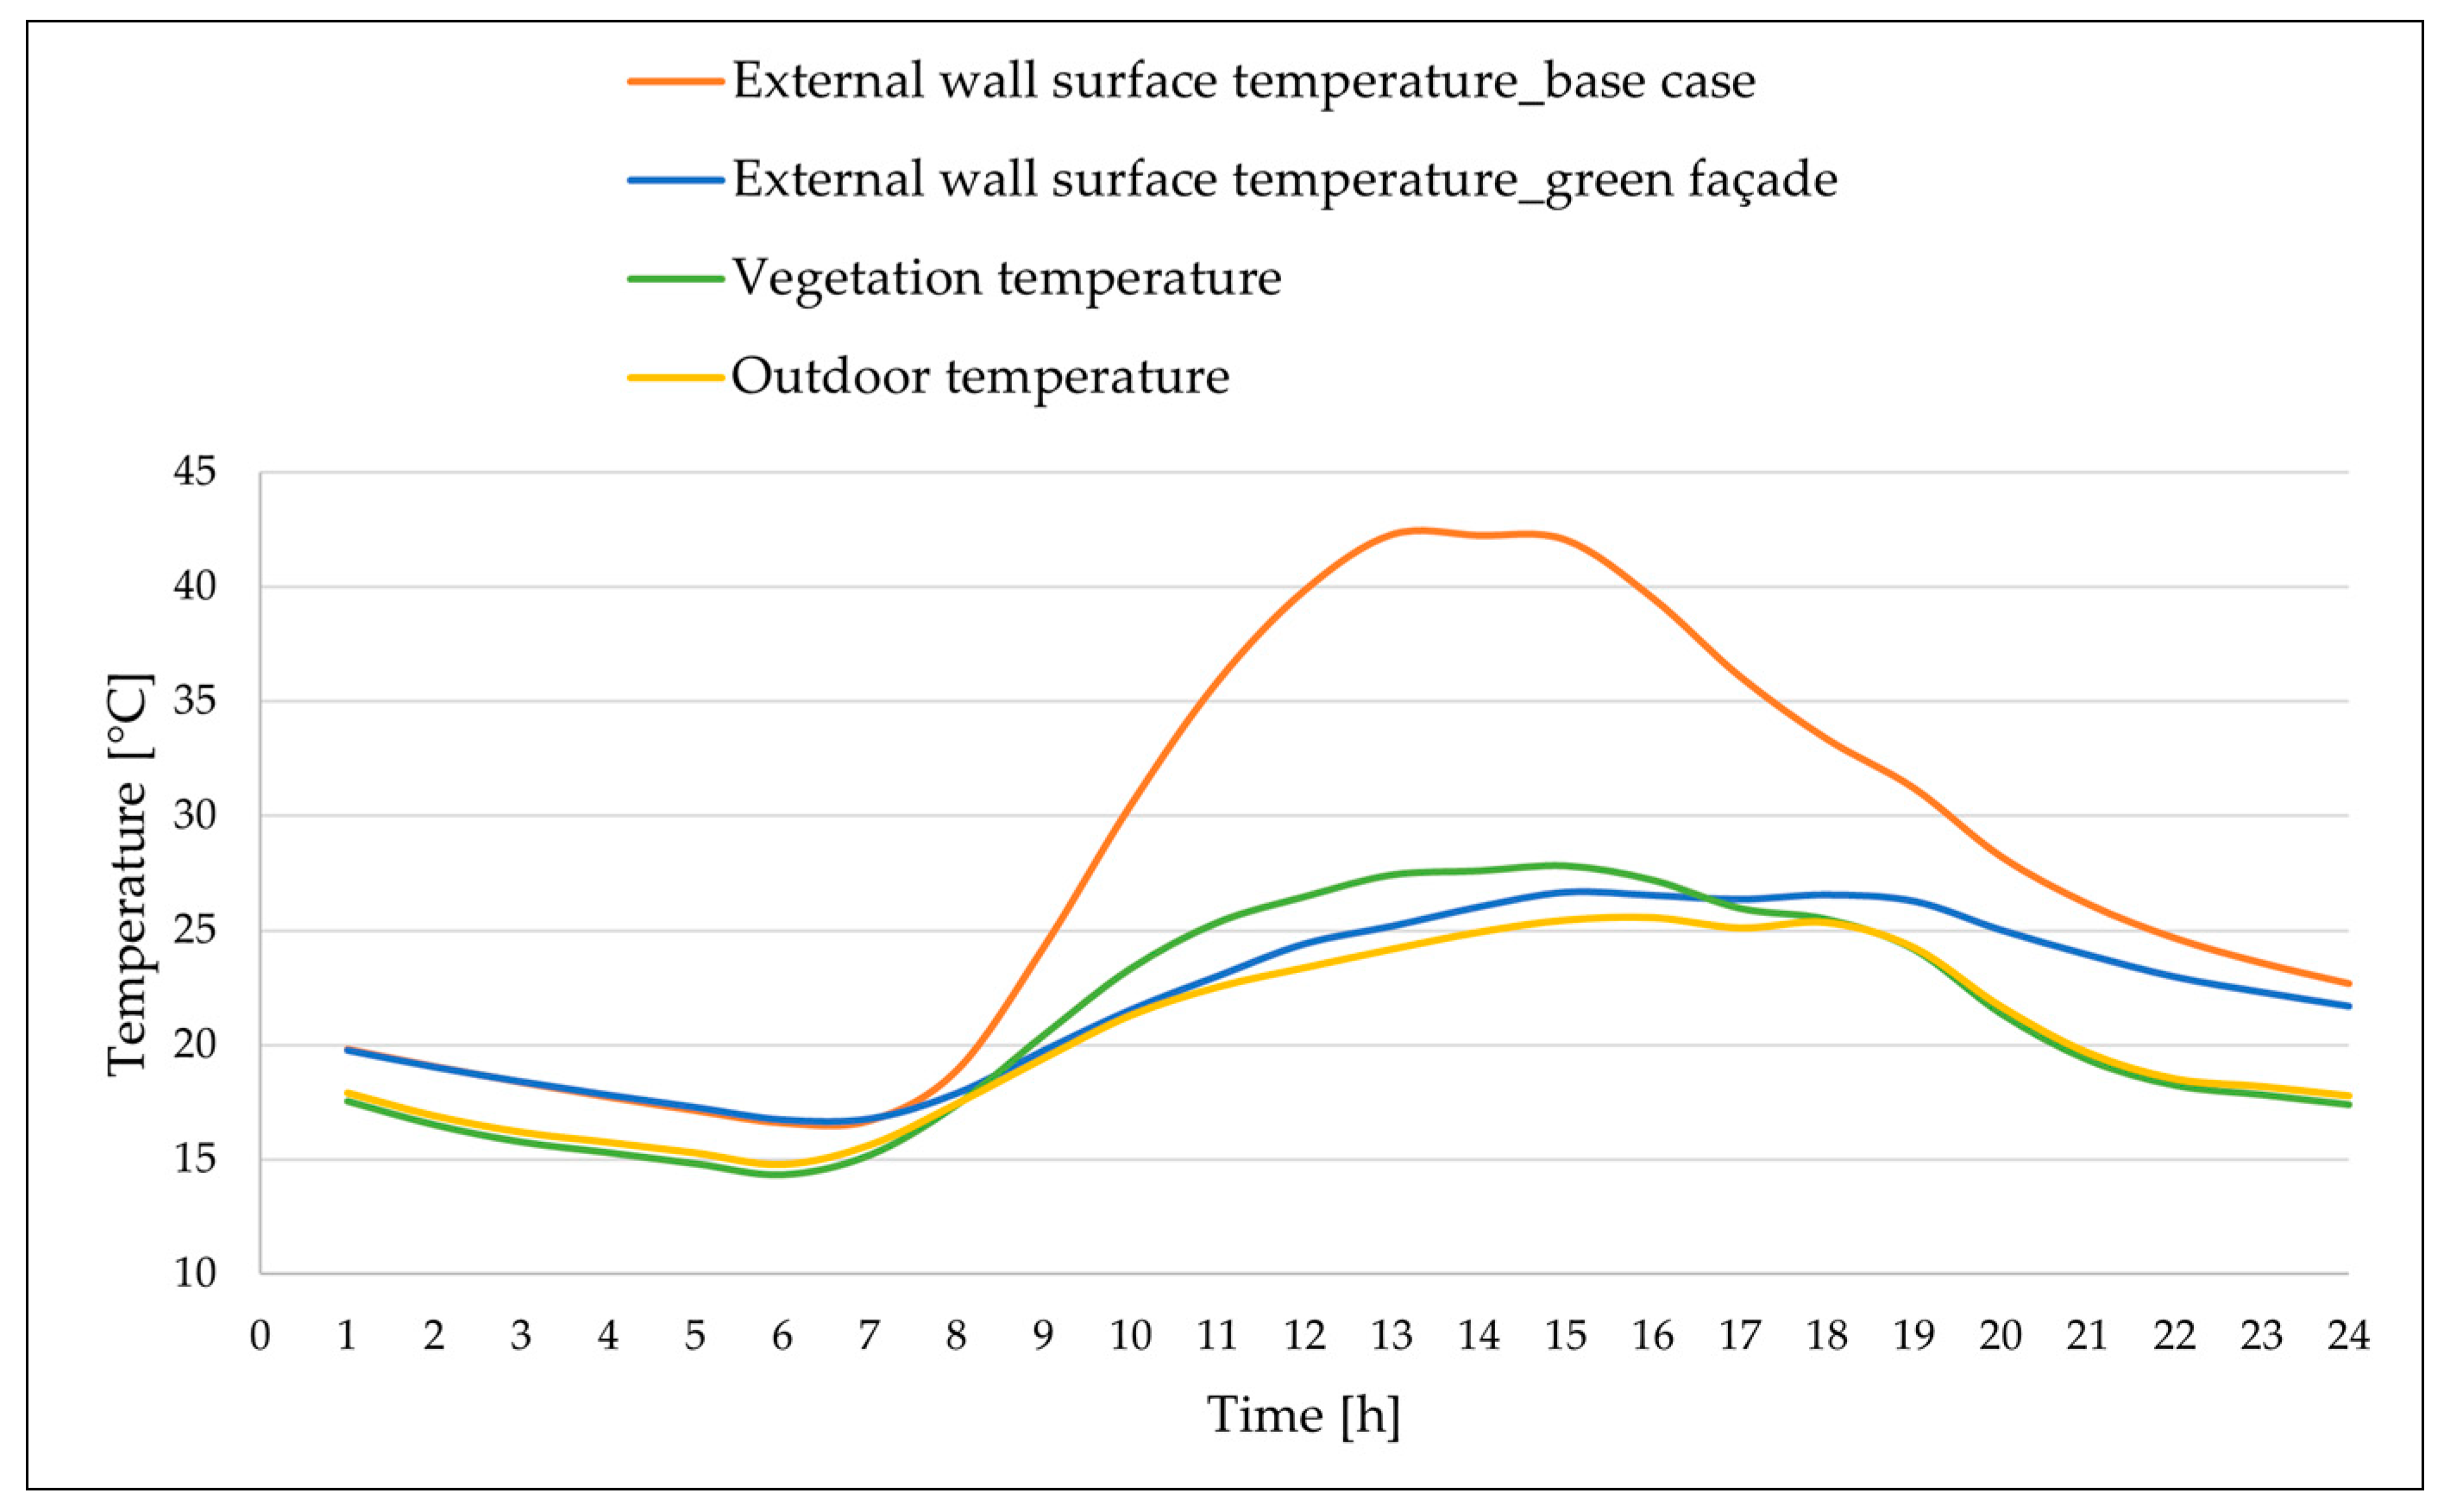
During the summer day (Figure 7), the shielding from solar radiation and the evapotranspiration provided by the presence of the green solution cause a significant decrease in the external surface temperature of the wall, which is higher in summer than in winter as a result of the growth of foliage (LAI = 5).
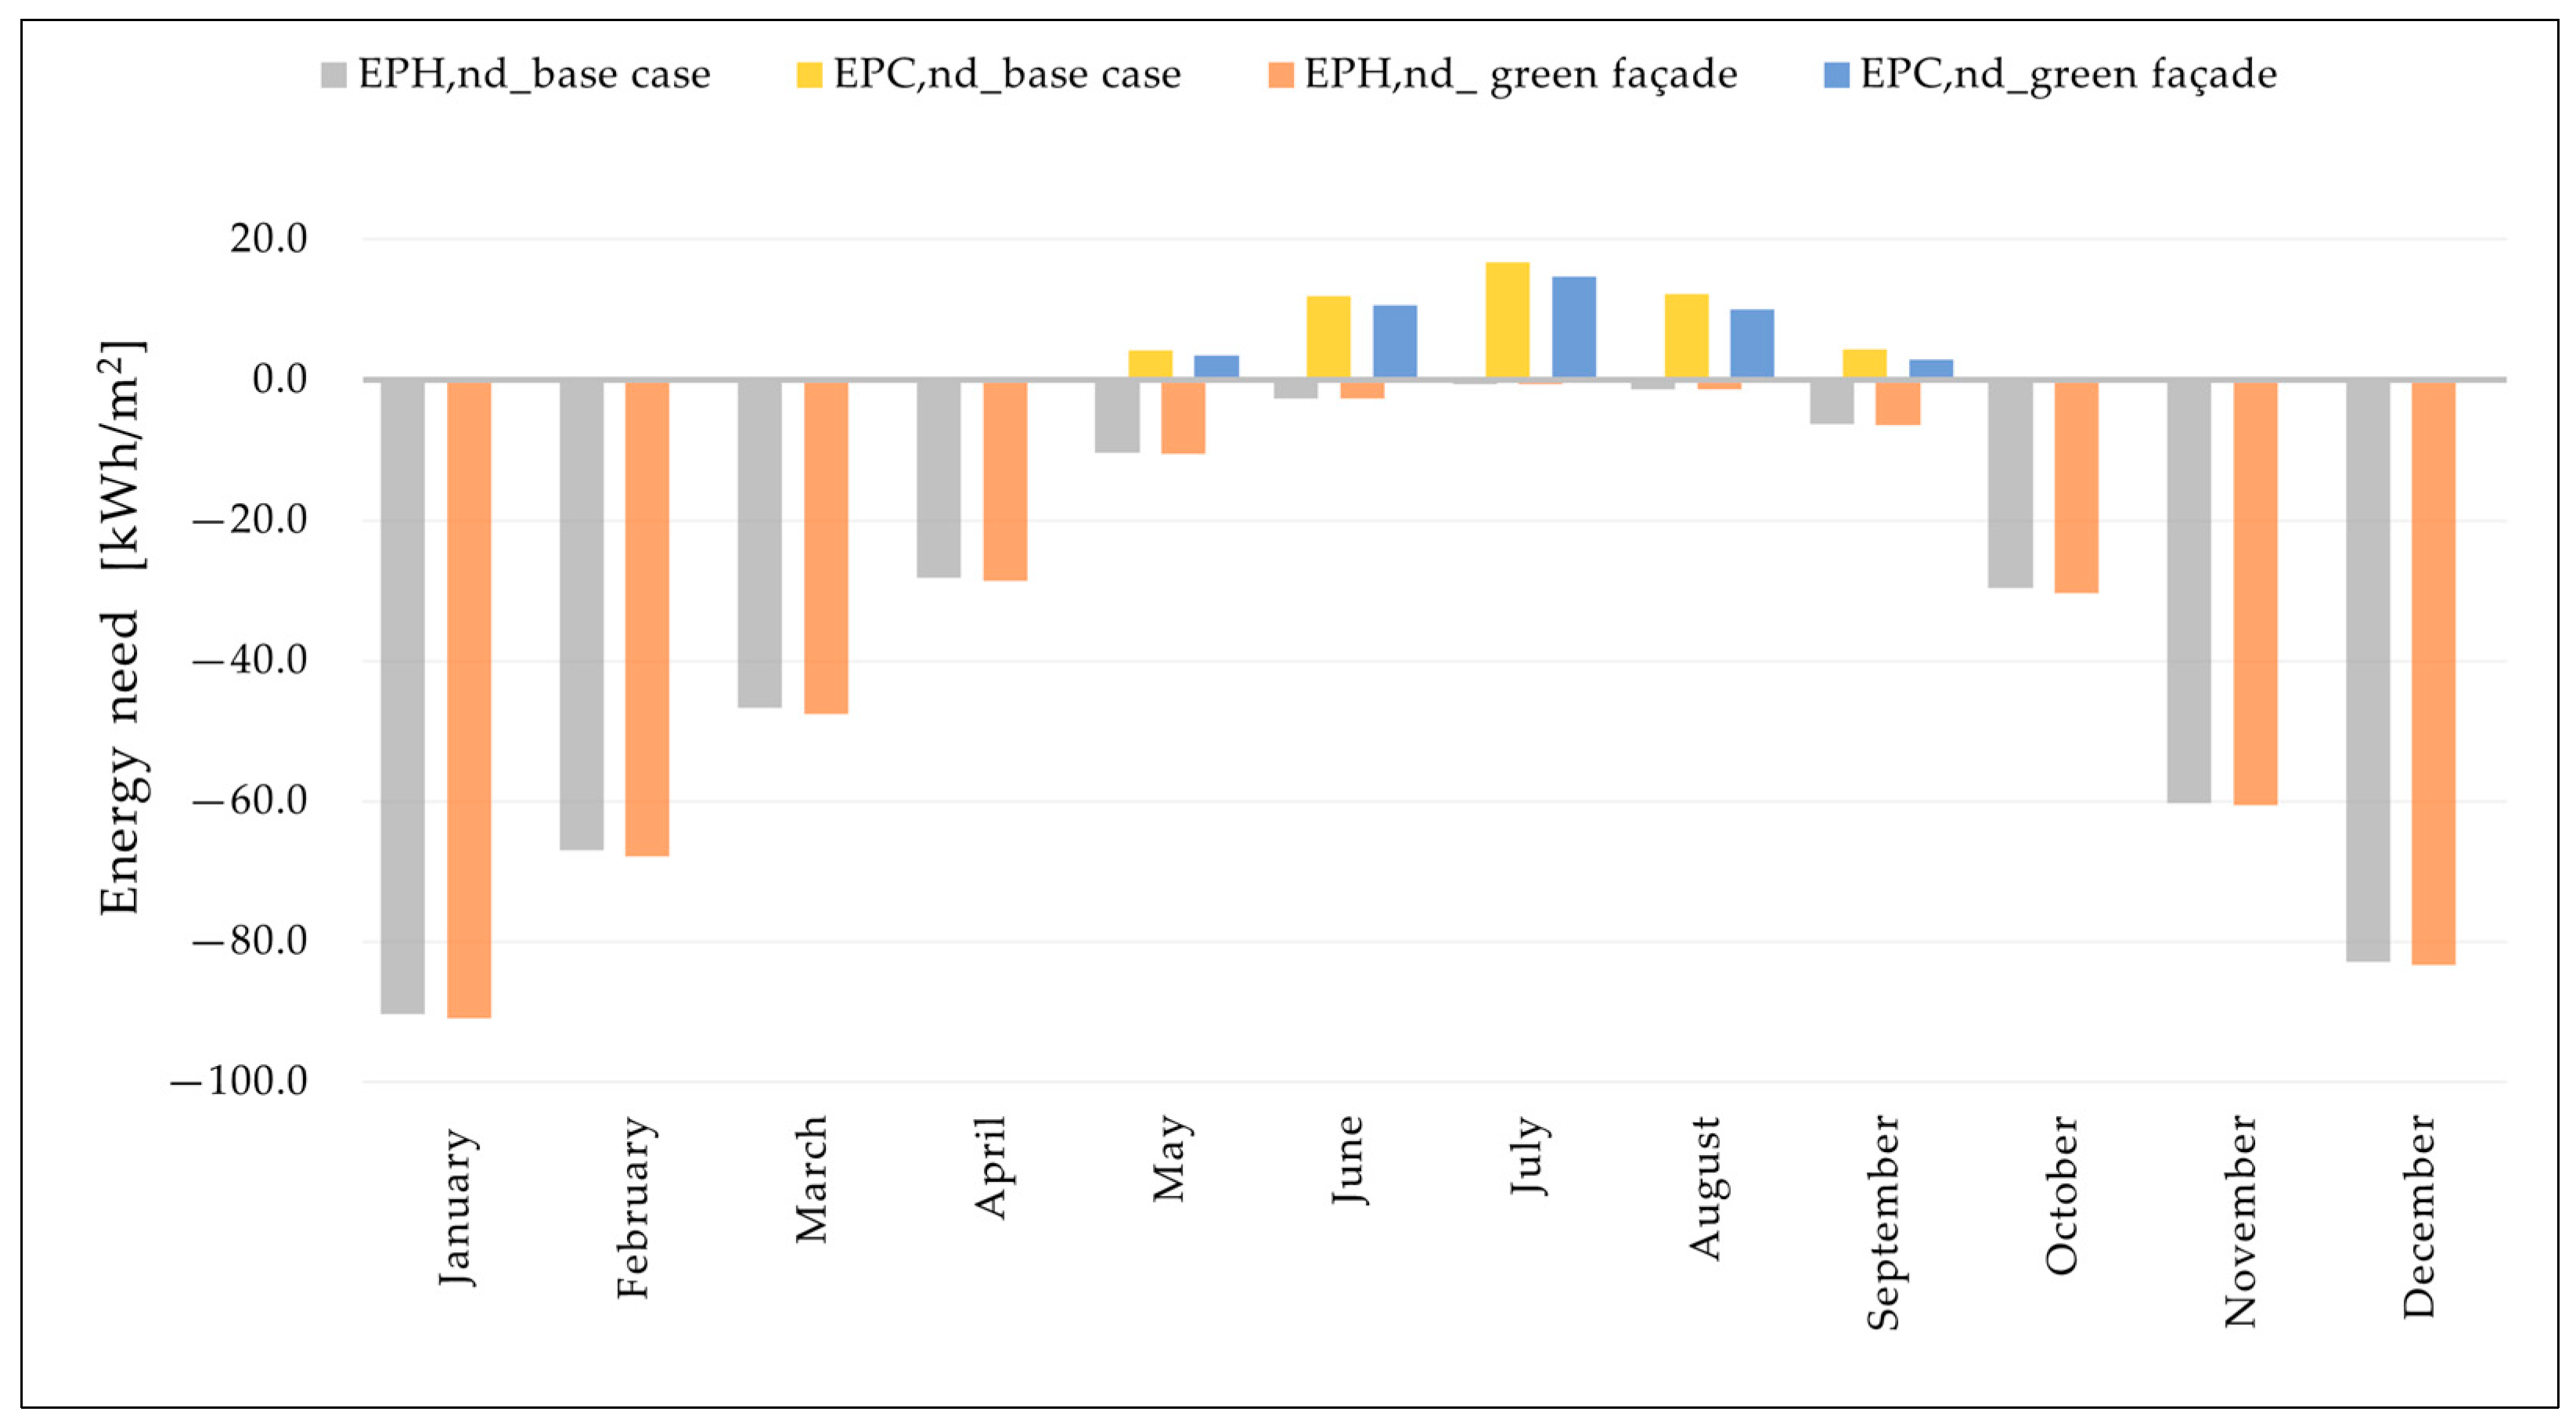
Concerning the ideal thermal energy need of the building, in winter (Figure 8), the cooling of the external surface when the technology is present causes an increase, however minimal (1.0%), in the need for space heating compared to the base case without the green façade. Similarly, in summer, there is a decrease in the need for cooling (15.2%). Limited to the analysed climate and defined boundary conditions, on an annual basis, the green façade causes a greater decrease in cooling need than the increase in heating need.
The results obtained are in line with the literature. Referring to the work of Zhang et al. [18], the reduction in the cooling load in the summer season is between 11.7% and 18.4%, applying the solution on all the external walls. In the present work, a reduction of 8.2% in the cooling load has been achieved by applying the solution only on the south wall of the case study.
As shown in the work of Zhang et al. [18] and in this work, the temperature of the vegetation is higher at certain times of the day when compared to that of the external wall in the presence of the green solution.
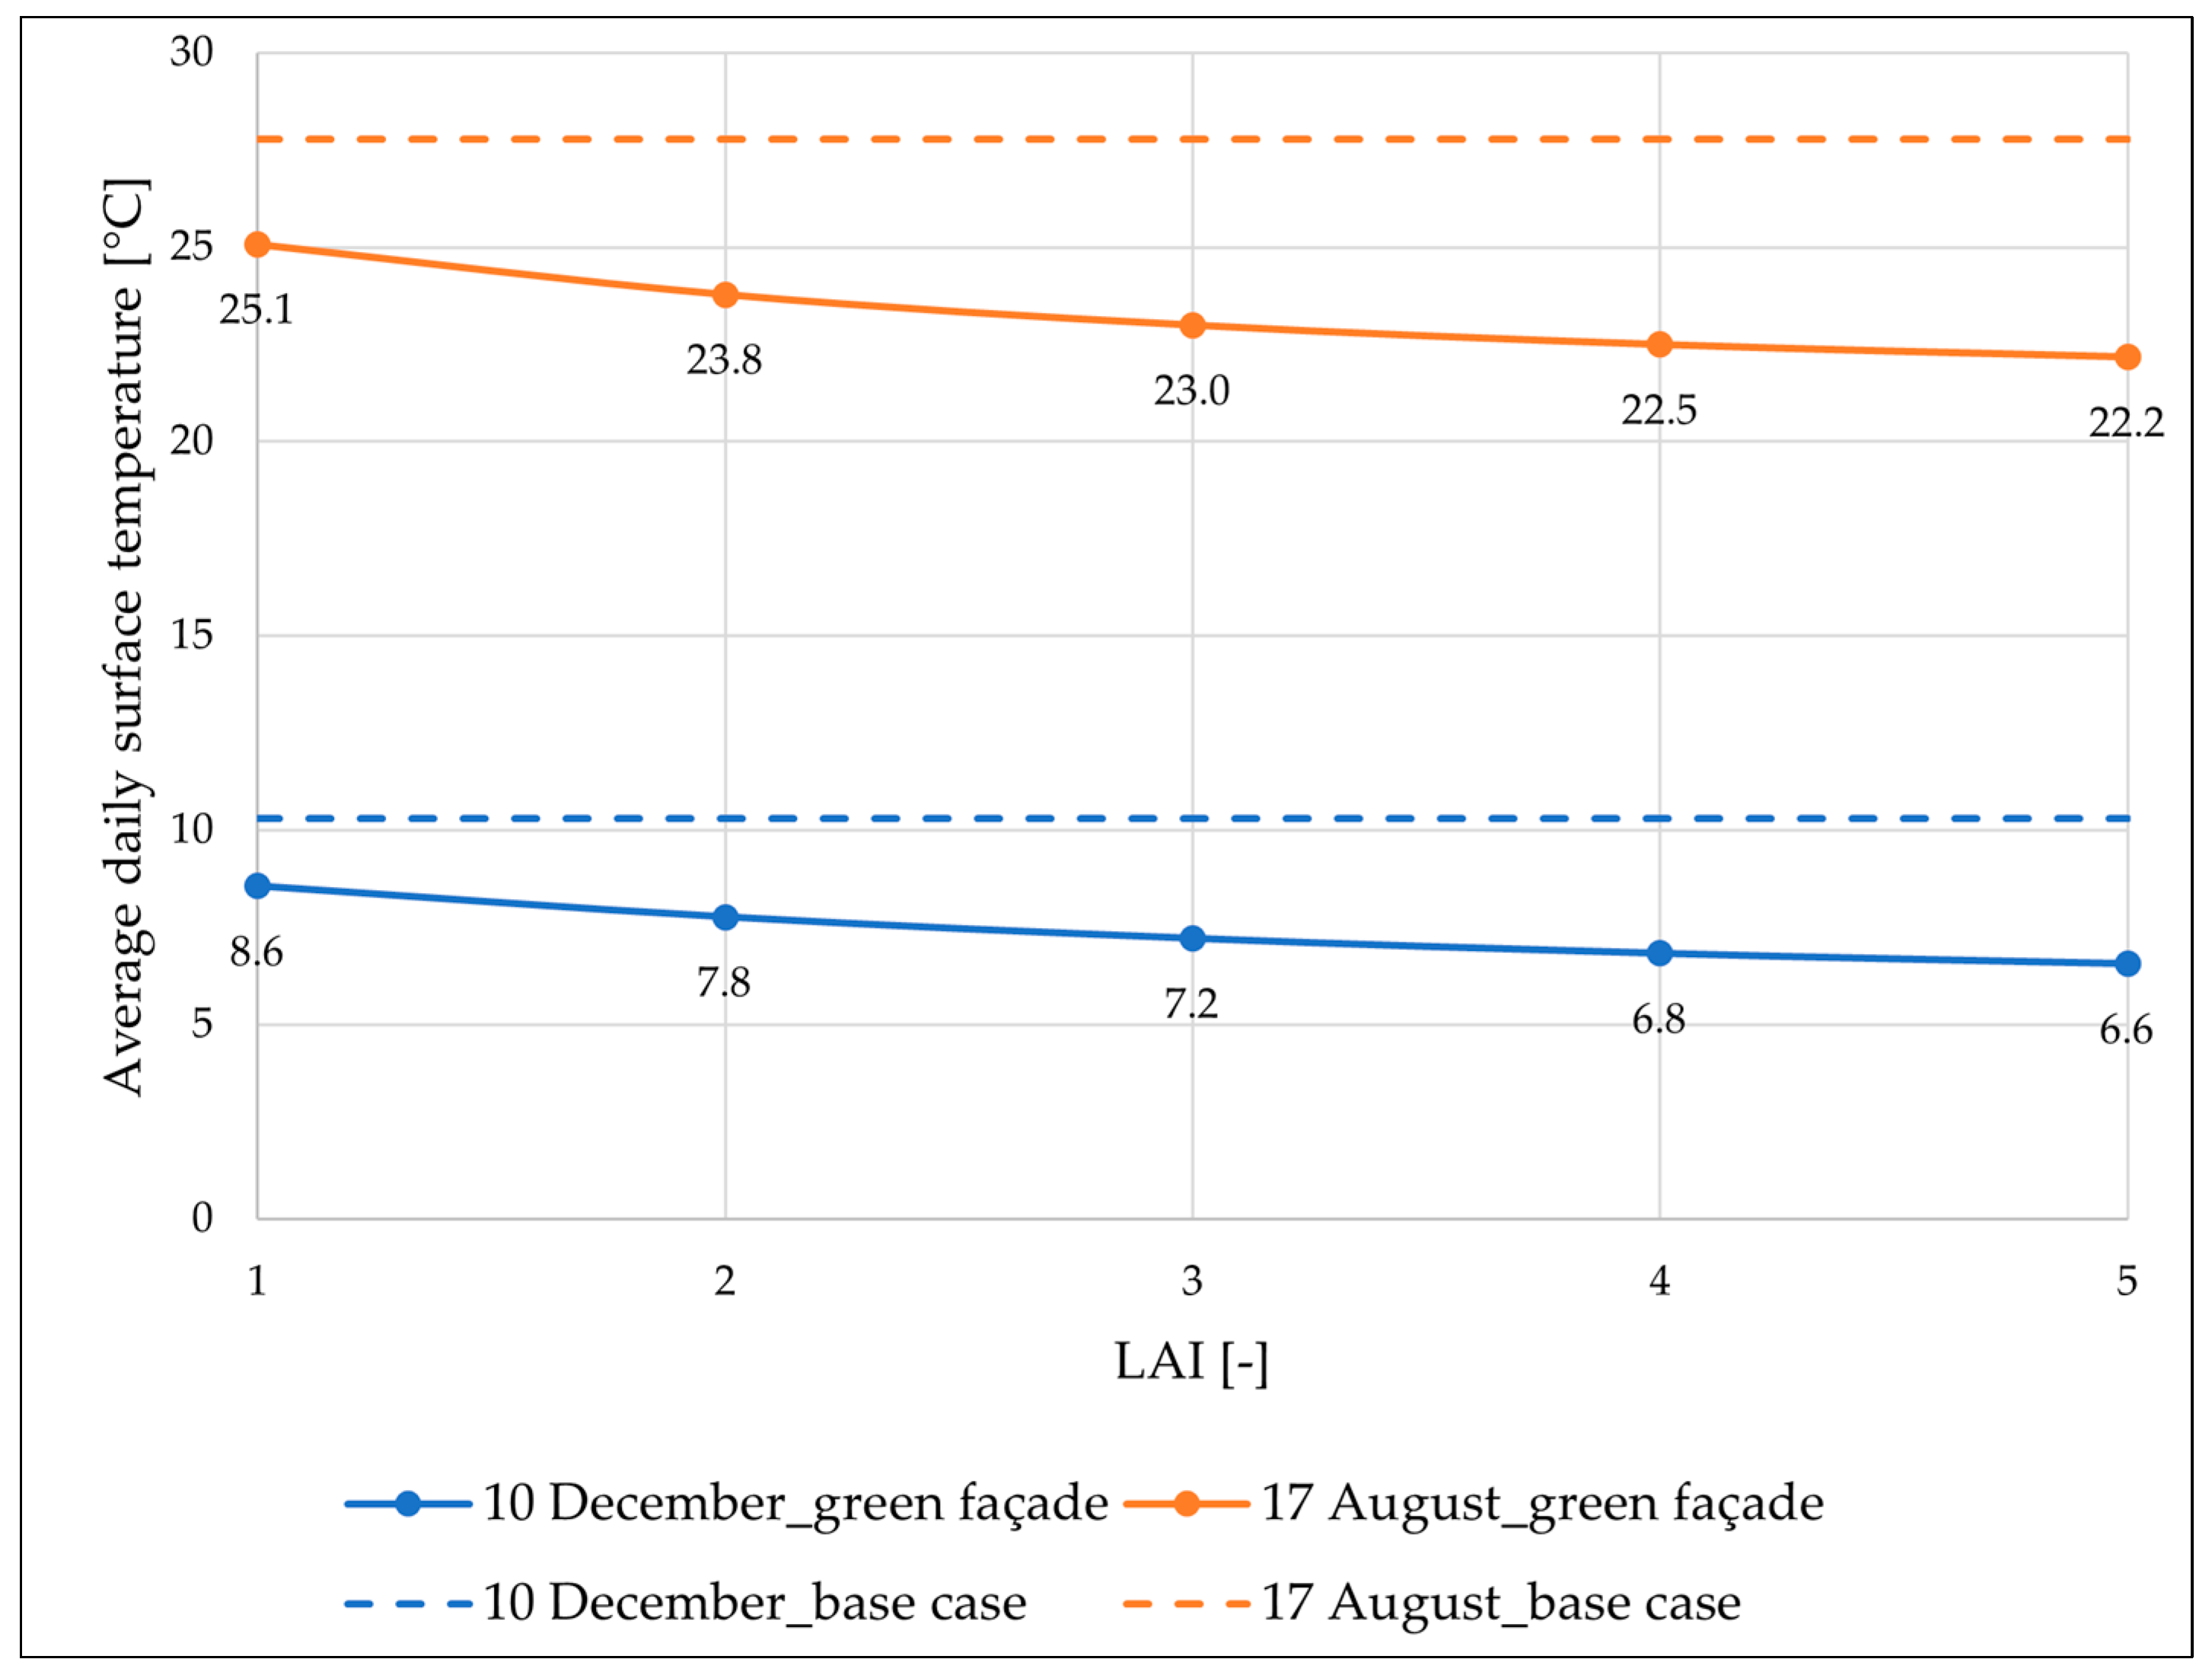
Finally, for the green façade, the result of the sensitivity analysis is presented (Figure 9).
The parameter subject to variation is the leaf area index (LAI). The LAI influences two important factors: the amount of solar radiation incident on the external wall behind the leaves and evapotranspiration. Therefore, from a thermo-physical point of view, the LAI value affects the external surface temperature of the wall on which the vegetation is applied. Figure 9 shows the variation in the average daily temperature on the surface to which the green façade solution is applied by varying LAI. The decrease in the surface temperature resulting from the increase in LAI is noticeable, and it is more significant in summer than in winter.
Also, for the living wall, in the winter day and summer day, there is a decrease in the external wall surface temperature in the presence of the green solution (Figure 10 and Figure 11).
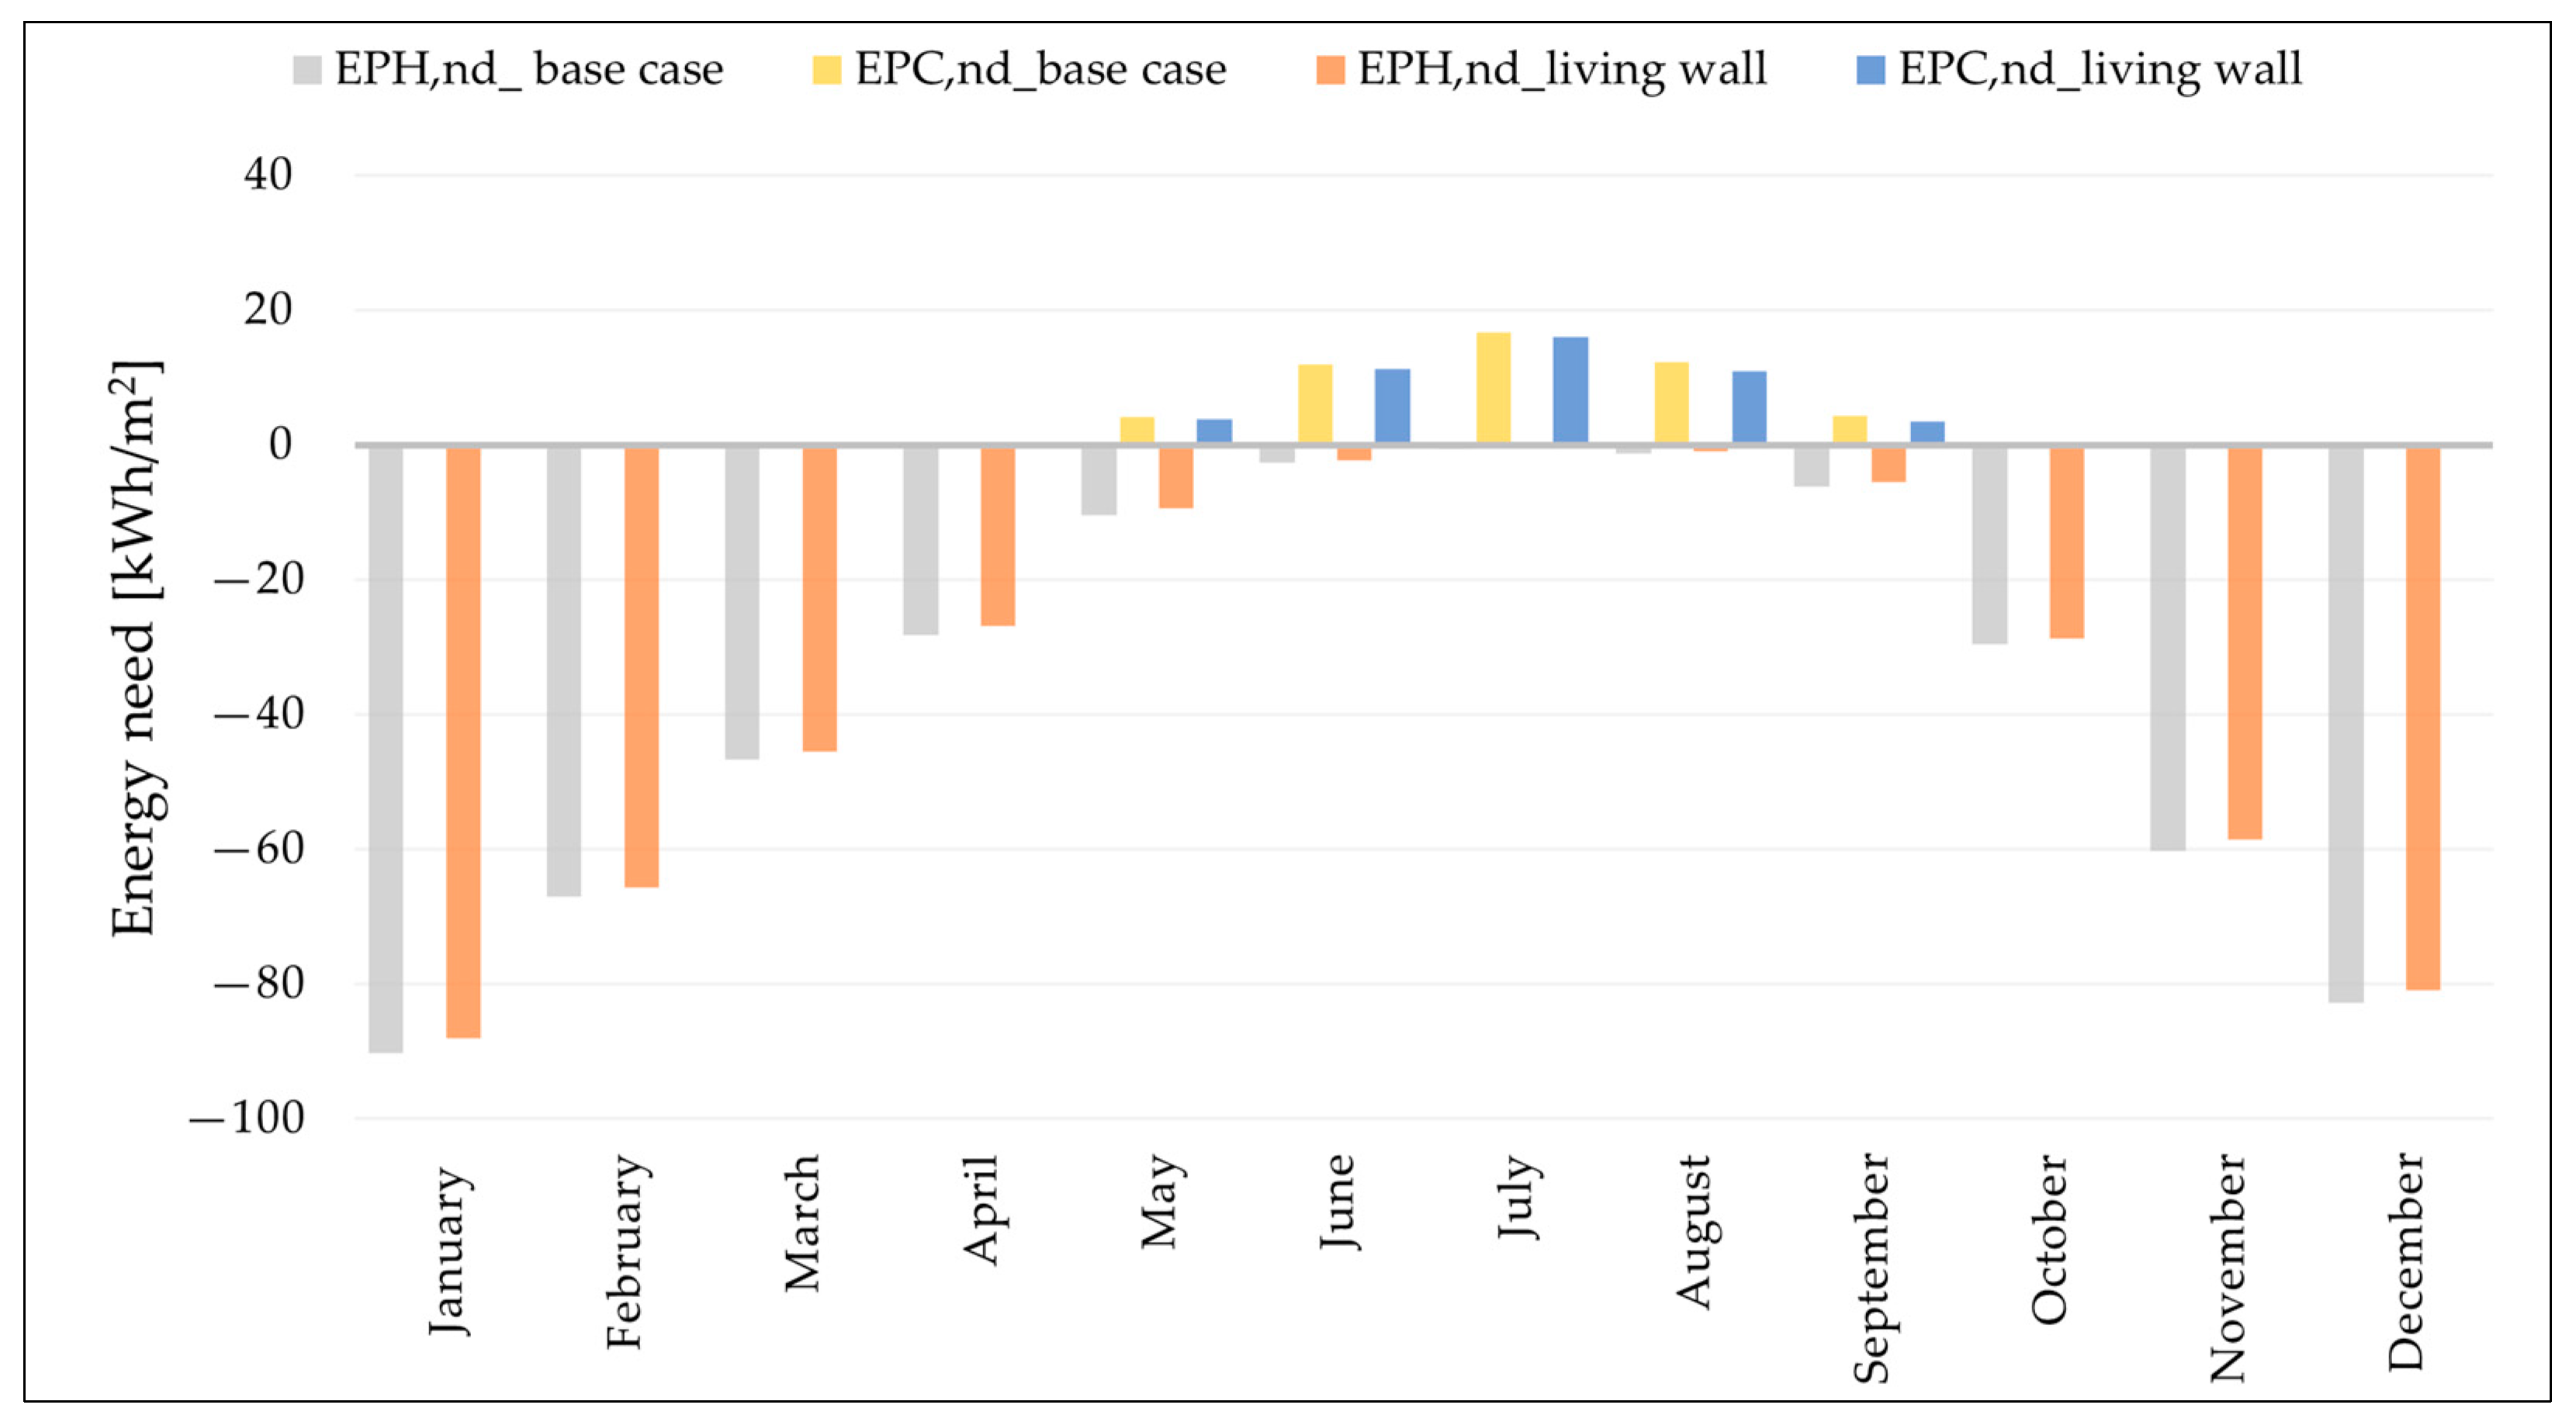
In terms of the ideal heating need, the living wall solution (Figure 12), compared to a wall without substrate and vegetation, results in a reduction—however minimal—in the thermal energy need for heating (3.2%) and a more significant reduction in that for cooling (8.5%). The reduction in heating need would be attributed to a higher thermal resistance of the wall due to the presence of the substrate. For the living wall, the parameters that varied were the LAI and the thickness of the substrate.
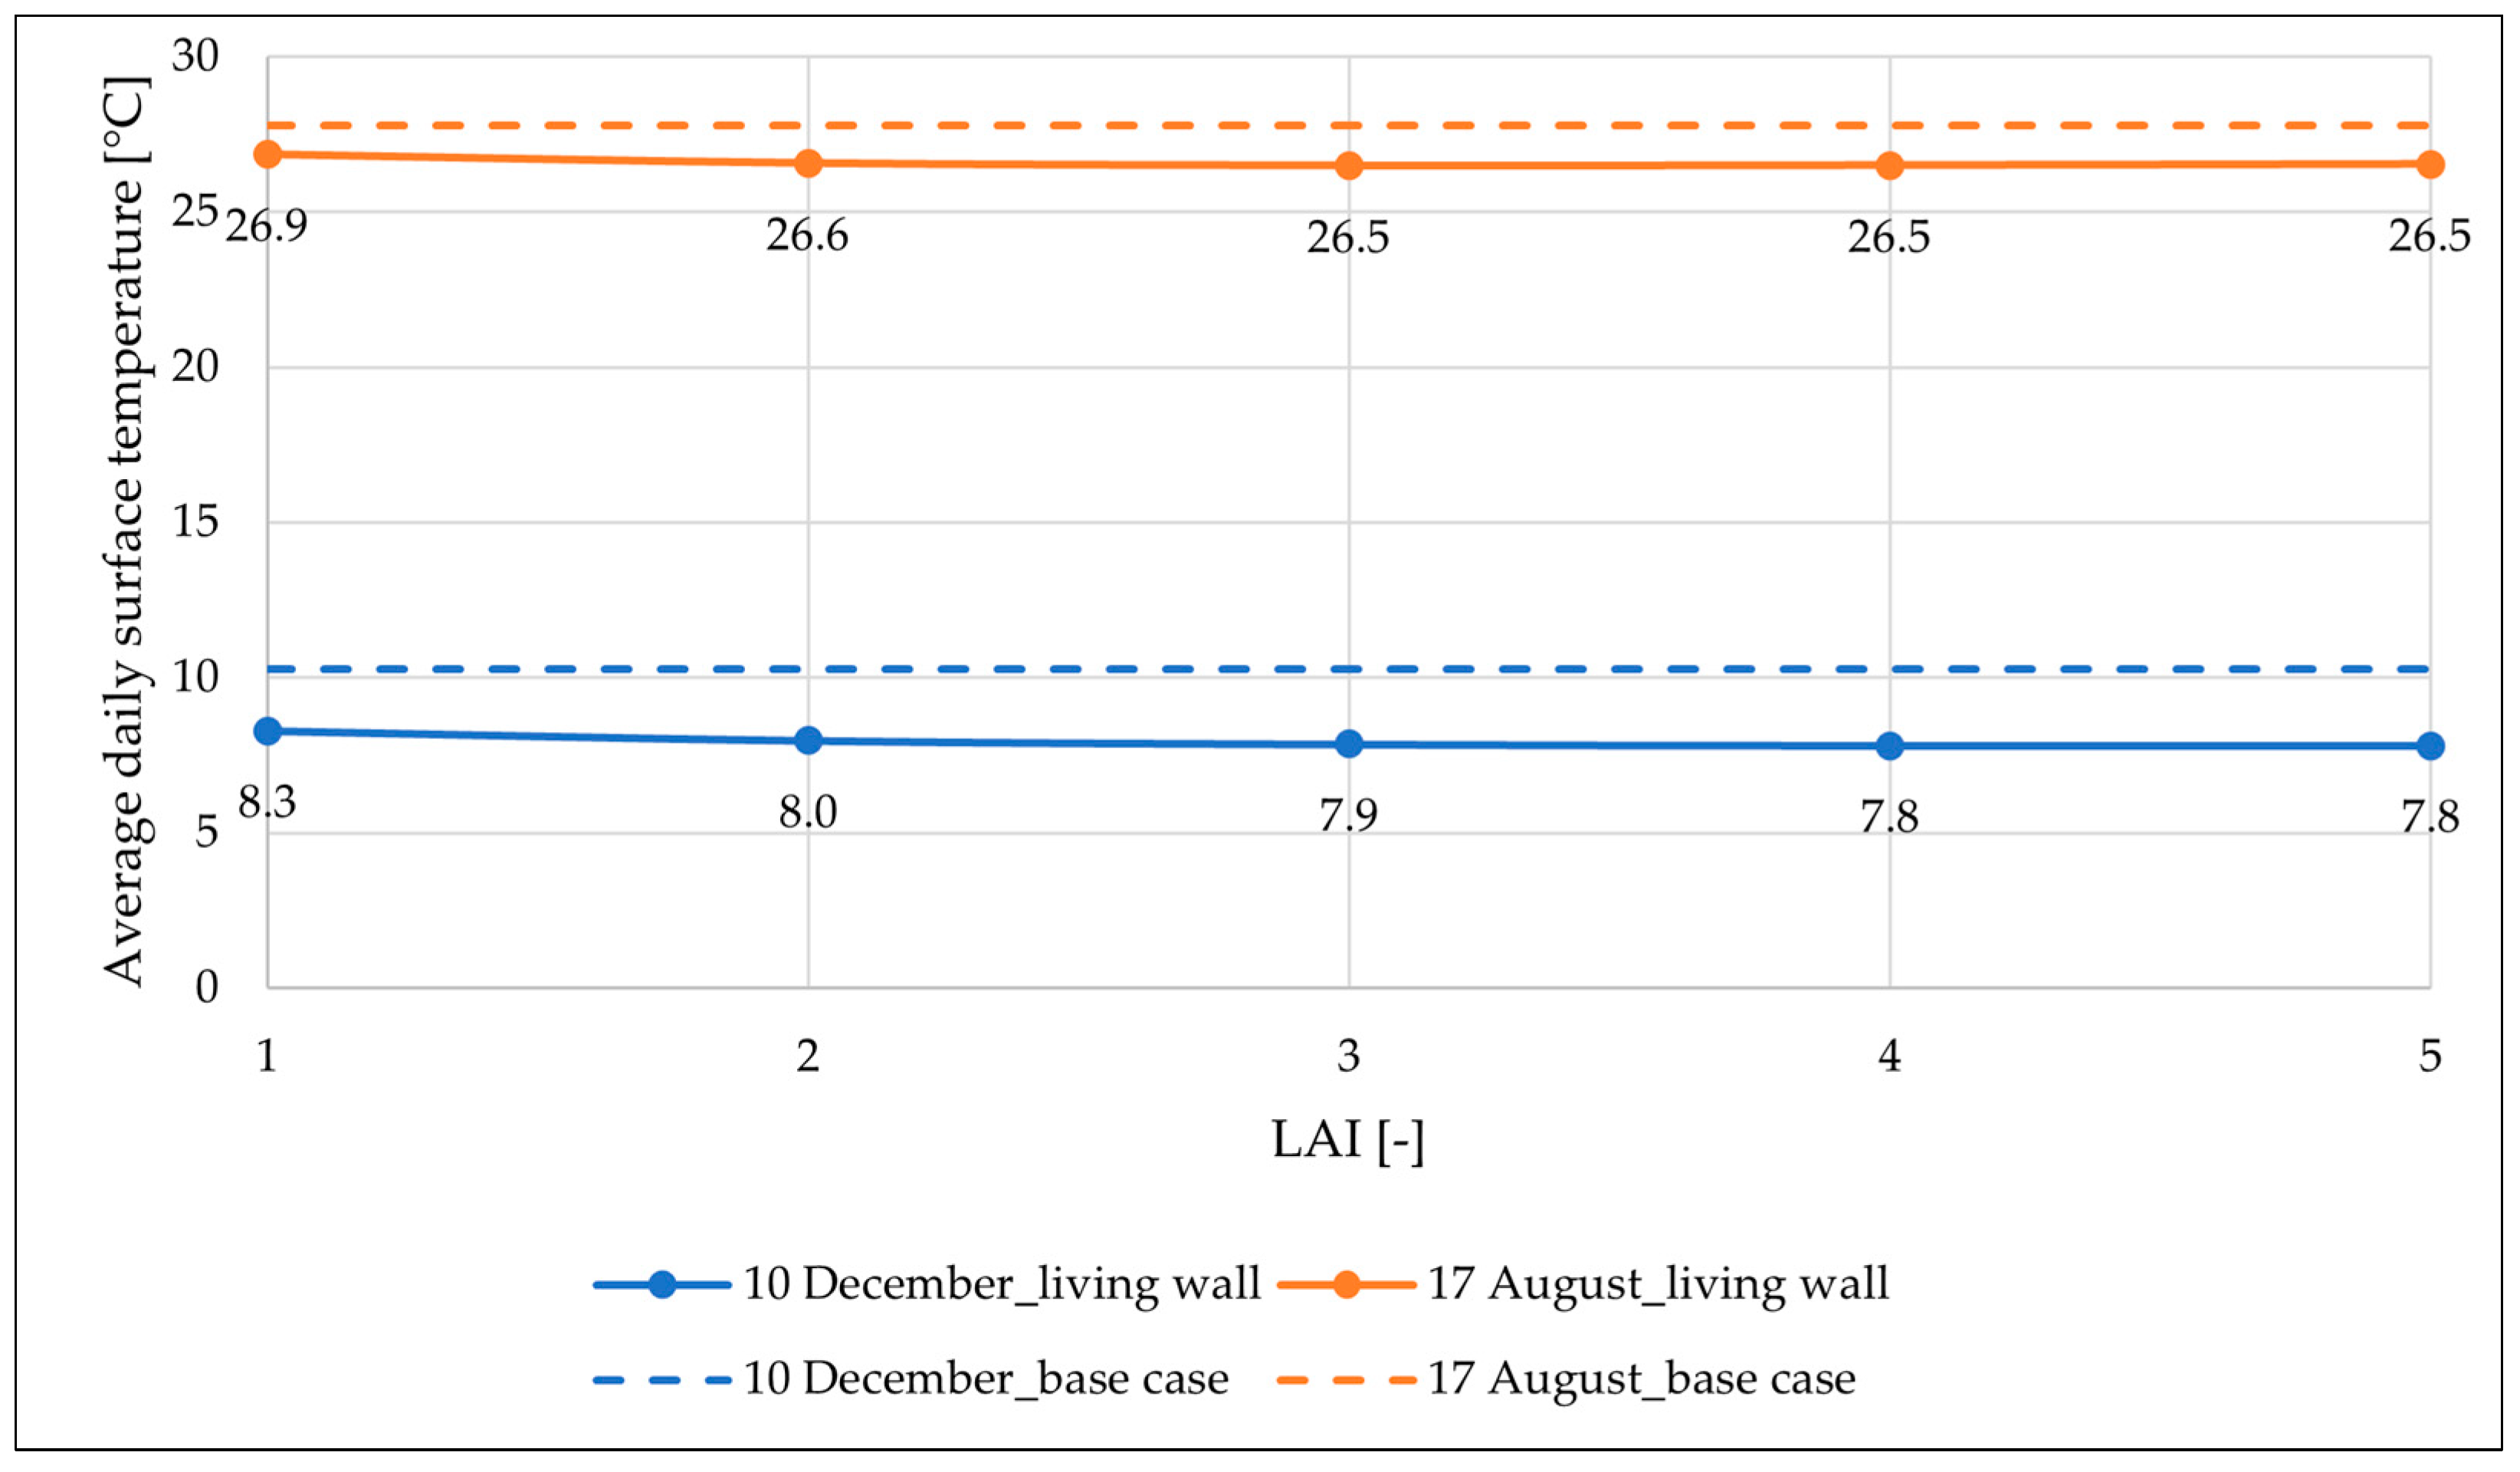
Figure 13 shows the average daily temperature on the surface to which the living wall is applied, as the LAI varies, while maintaining the thickness of the substrate constant. For both winter and summer days, the average daily temperature on the surface remains almost constant as the LAI varies. The presence of the adopted solution determines a reduction in the average daily temperature on the surface compared to the base case, although it is not influenced by the variation in the amount of foliage.
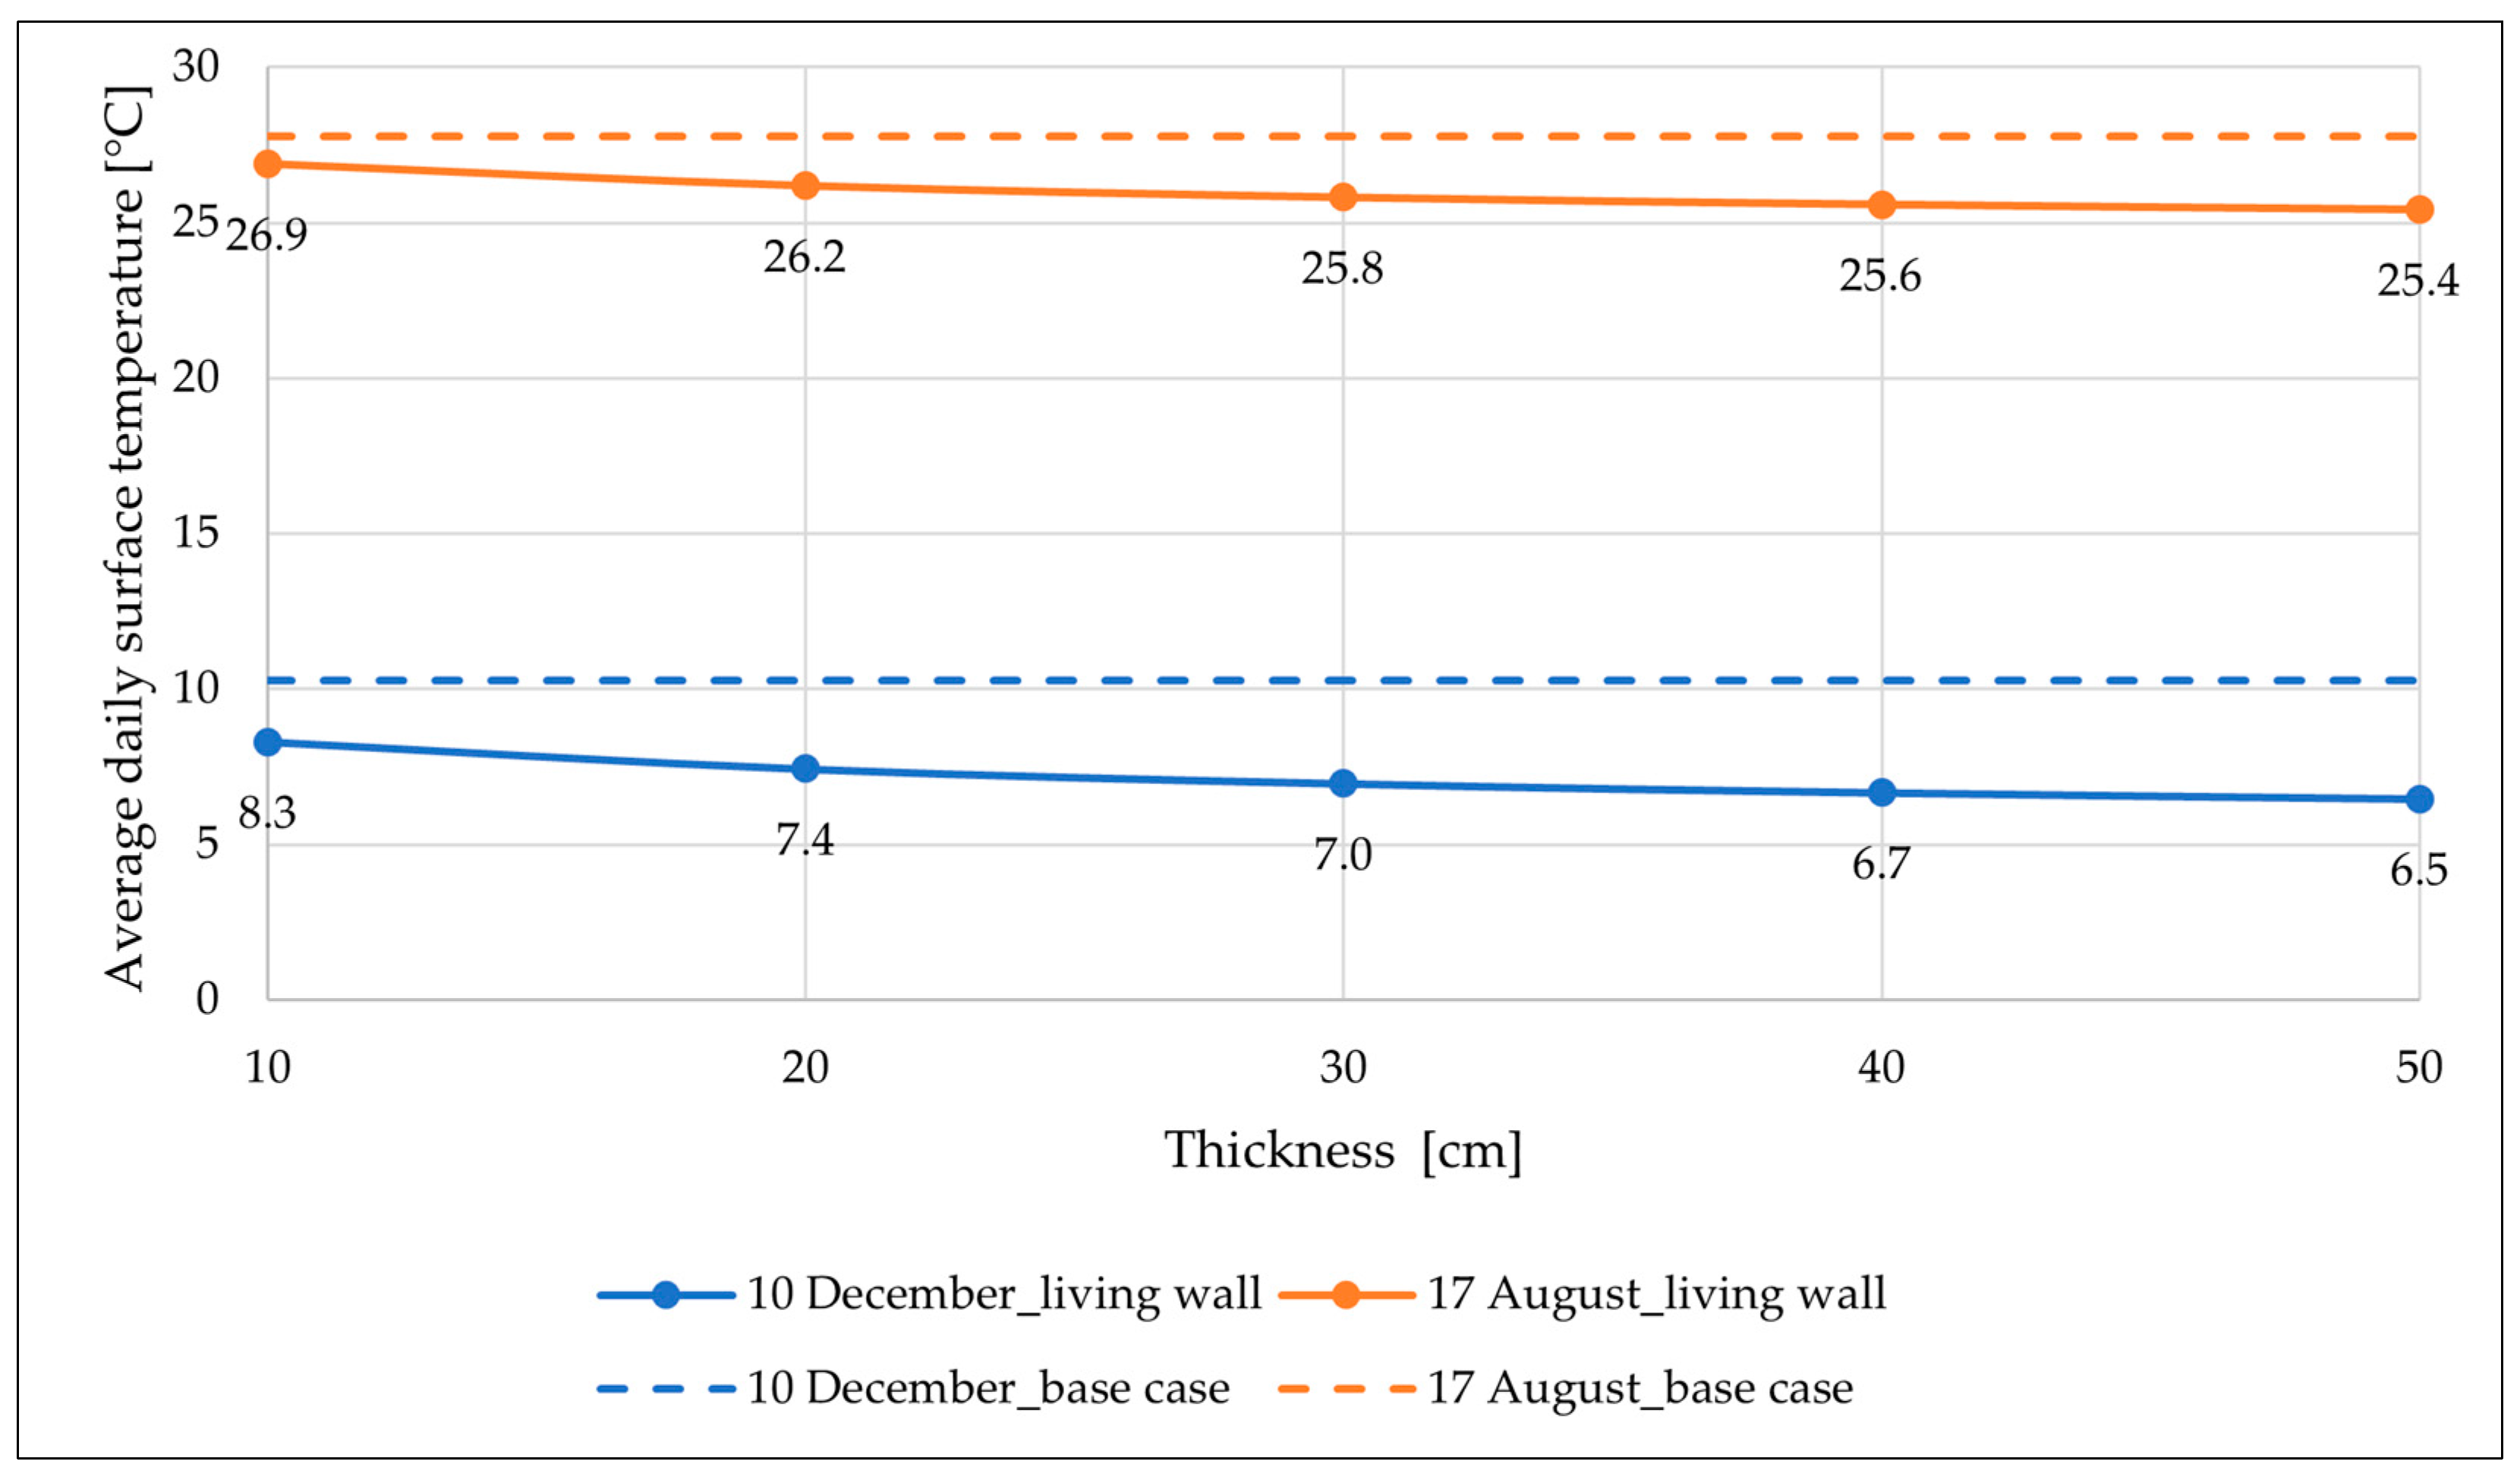
Figure 14 shows the variation in the daily average temperature on the surface to which the substrate is applied, maintaining the LAI fixed and varying the thickness of the substrate. In this case, it is evident that the substrate and the variation in its thickness influence the daily mean temperature of the outer surface of the wall.
Table 2 summarises the annual thermal energy needs for heating and cooling for the base case, the case with the green façade, and the case with the living wall, highlighting the variation with respect to the base case.

6. Conclusions

The impacts of climate change, excessive greenhouse gas emissions, and the current energy crisis have motivated the European Union to adopt mitigation and adaptation strategies, focusing mainly on the building sector due to the crucial role it represents. To achieve this goal, the implementation of resilient technologies for the building envelope, such as vertical greenery systems (VGSs), particularly living wall and green façades, is gaining ground. These systems are considered cooling strategies because, acting as a shading, they partially mitigate solar radiation and, through evapotranspiration, induce a reduction in the surface temperature of the component on which they are installed and of the surrounding environment.
Dedicated mathematical models from the literature were improved to simulate their actual performance, and special calculation codes were created in the present work. Their implementation and simulation in EnergyPlus produced some interesting results.
Firstly, it was found that both technologies, the green façade and the living wall, applied to a test case study contribute positively to the summer season decreasing the surface temperature of the external wall to which they are applied. The shielding effect reduces the incident solar radiation on the back wall, and the evapotranspirative effect, both of vegetation and substrate, based on the technology applied, involves cooling in terms of external surface temperature and immediate surroundings.
In fact, considering the green façade solution effect, the external wall surface temperature in summer decreases by 41%, while for the living wall solution it decreases by 30%. At the same time, in the winter season, always for the reasons expressed earlier, there is a decrease in the external surface temperature of 26% with green façade solution and 18% with living wall, which in that case implies a disadvantage.
Analysis of the thermal energy need for both solutions shows that although the VGSs are not particularly advantageous in winter, the thermal energy need for heating in such months does not change significantly: for green façades, it increases by 1.0% and for living walls by 3.2%. Instead, in summer, the thermal energy need for cooling decreases for green façades and for living walls by 15.2% and 8.5%, respectively.
The sensitivity analysis showed how crucial it is to manage the main data characterising green walls, such as the leaf area index (LAI), especially for the green façade, and the substrate thickness in the living wall. In accordance with the existing literature, these are the two most influential parameters. In particular, given the influence of LAI, in future studies, measured data could be used.
By setting up improved models of VGSs and related calculation codes, the outcomes of this research could effectively contribute to the enhancement of the standardisation activity by introducing new numerical methods in the overall energy performance assessment framework of buildings. The need to model such technologies emerges from the new European directives, in particular, EU Directive 2024/1275 [28], which promotes interventions to make buildings resilient to climate change.
Finally, the implemented tool demonstrated an easy application with no increase in the computational time compared to a standard simulation. This is an advantageous element in incentivising professionals to use the tool.
The scalability of VGS and the study of their long-term performance under different climatic conditions will be a prerogative for future developments of this work. Case studies resulting from different geographical locations and building types will be considered in order to increase the generalizability of the findings. In addition, future research will focus on the assessment of the accuracy of the developed models by comparison with empirical data.

Author Contributions

Conceptualization, I.B. and V.C.; methodology, V.N., I.B., P.R.M. and V.C.; software, P.R.M.; validation, V.N., I.B., P.R.M. and V.C.; formal analysis, V.N. and P.R.M.; investigation, V.N. and P.R.M.; writing—original draft preparation, V.N. and P.R.M.; writing—review and editing, I.B. and V.C.; visualization, V.N.; supervision, I.B. and V.C.; project administration, V.C.; funding acquisition, V.C. All authors have read and agreed to the published version of the manuscript.

Funding

This research was funded by the Italian National Agency for New Technologies, Energy and Sustainable Economic Development (ENEA), Electrical System Research, Implementation Plan 2022–2024, Line of activity: LA2.7, “Implementation of a calculation code for energy modelling of Vertical Greenery Systems”.

Data Availability Statement

The raw data supporting the conclusions of this article will be made available by the authors on request.

Conflicts of Interest

The authors declare no conflicts of interest.

Nomenclature

SymbolQuantityUnit
AAream2
cSpecific heatJ/(kg K)
dCharacteristic dimensionm
eVapour pressurekPa
EPndAreic thermal energy needkWh/m2
GrGrashof number
h Heat transfer coefficient W/(m2K)
LAILeaf area index
NuNusselt number
PrPrandtl number
q (Areic) energy fluxW/m2
r a Aerodynamic resistance s/m
r s Stomatal resistances/m
ReReynolds number
T TemperatureK
VVolumem3
αAbsorptance
γ Psychometric constantkPa/K
ΔSlope of the vapour saturation pressure curvekPa/K
ε Emissivity
λ Thermal conductivityW/(m K)
ρDensity kg/m3
σ Stefan–Boltzmann constantW/(m2K4)
σ c Fractional vegetation coverage
τ Transmittance
Superscripts
bBare
vVegetated
Subscripts
addAdditional
CCooling
cConvection
cCanopy
dConduction
eExternal
eaExternal air
flFloor
grGround
HHeating
iIncident
iIndex
rLong-wave radiation (infrared)
sShort-wave radiation (solar)
sSubstrate
skySky vault
vsSaturated vapour
wWall

References

  1. European Commission. A Renovation Wave for Europe—Greening Our Buildings, Creating Jobs, Improving Lives; European Commission: Brussels, Belgium, 2020. [Google Scholar]
  2. IEA EBC. International Energy agency’s Energy in Buildings and Communities Programme. Available online: https://www.iea-ebc.org/ (accessed on 10 April 2024).
  3. Dahanayake, K.W.D.; Kalani, C.; Chow, C.L. Studying the potential of energy saving through vertical greenerysystems: Using EnergyPlus simulation program. Energy Build. 2017, 138, 47–59. [Google Scholar] [CrossRef]
  4. Susca, T. Nature-Based Solutions Applied to the Built Environment to Alleviate Climate Change: Benefits, Co-benefits, and Trade-offs in a Geographical Multi-scale Perspective. In Handbook of Climate Change Mitigation and Adaptation; Lackner, M., Sajjadi, B., Eds.; Springer: Cham, Switzerland, 2022; pp. 2118–2153. [Google Scholar]
  5. Safikhani, T.; Abdullah, A.M.; Ossen, D.R.; Baharvand, M. A review of energy characteristic of vertical greenery systems. Renew. Sustain. Energy Rev. 2014, 40, 450–462. [Google Scholar] [CrossRef]
  6. Manso, M.; Castro-Gomes, J. Green wall systems: A review of their characteristics. Renew. Sustain. Energy Rev. 2015, 41, 863–871. [Google Scholar] [CrossRef]
  7. Susorova, I.; Bahrami, P. Facade-integrated vegetation as an environmental sustainable solution for energy-efficient buildings. MADE Res. J. Cardiff Univ. Cardiff UK 2013, 7–14. Available online: https://www.researchgate.net/publication/265593368_Facade-integrated_vegetation_as_an_environmental_sustainable_solution_for_energy-efficient_buildings (accessed on 10 April 2024).
  8. Perini, K.; Ottelé, M.; Fraaij, A.L.A.; Haas, E.M.; Raiteri, R. Vertical greening systems and the effect on air flow and temperature on the building envelope. Build. Environ. 2011, 46, 2287–2294. [Google Scholar] [CrossRef]
  9. The American Institute of Architects Continuing Education System (AIA/CES). Introduction to Green Walls Technology, Benefits and Design. Green Roofs for Healthy Cities. 2008. Available online: https://www.calameo.com/read/00135160798c31a1b7998 (accessed on 10 April 2024).
  10. Radic, M.; Dodig, M.B.; Auer, T. Green Facades and Living Walls—A Review Establishing the Classification of Construction Types and Mapping the Benefits. Sustainability 2019, 11, 4579. [Google Scholar] [CrossRef]
  11. Francis, J.; Hall, G.; Murphy, S.; Rayner, J. Growing Green Guide: A Guide to Green Roofs, Walls and Facades in Melbourne and Victoria, Australia. February 2014. Available online: https://www.melbourne.vic.gov.au/community/greening-the-city/green-infrastructure/Pages/growing-green-guide.aspx (accessed on 10 April 2024).
  12. Urban greening. UK Guide to Green Walls: An Introductory Guide to Designing and Constructing Green Walls in the UK. 2013. Available online: https://media.wix.com/ugd/c0a820_877fc4a9e779472c53296c58fdfb8d20.pdf (accessed on 10 April 2024).
  13. National Parl Board. A Concise Guide to Safe Practices for Vertical Greenery. 2013. Available online: https://www.nparks.gov.sg/~/media/srg/publications/A_Concise_Guide_to_Safe_Practices_for_Vertical_Greenery.pdf (accessed on 10 April 2024).
  14. UNI 11235; Instructions for the design, execution, control and maintenance of green roofs. Italian Organisation for Standardisation (UNI): Milan, Italy, 2015.
  15. Loh, S. Living Walls—A Way to Green the Built Environment; Environment Design Guide 2008, TEC 26; Royal Australian Institute of Architects: Melbourne, Australia, 2008; pp. 1–7. [Google Scholar]
  16. He, Y.; Yu, H.; Ozaki, A.; Dong, N.; Zheng, S. An investigation on the thermal and energy performance of living wall system in Shangai area. Energy Build. 2017, 140, 324–335. [Google Scholar] [CrossRef]
  17. Stec, W.J.; van Paassen, A.H.C.; Maziarz, A. Modelling the double skin façade with plants. Energy Build. 2005, 37, 419–427. [Google Scholar] [CrossRef]
  18. Zhang, Y.; Zhang, L.; Meng, Q. Dynamic heat transfer model of vertical green façades and its co-simulation with a building energy modelling program in hot-summer/warm-winter zones. J. Build. Eng. 2022, 58, 105008. [Google Scholar] [CrossRef]
  19. Malys, L.; Musy, M.; Inard, C. A hydrothermal model to assess the impact of green walls on urban microclimate and building energy consumption. Build. Environ. 2014, 73, 187–197. [Google Scholar] [CrossRef]
  20. Susorova, I.; Angulo, M.; Bahrami, P.; Stephens, B. A model of vegetated exterior facades for evaluation of wall thermal performance. Build. Environ. 2013, 67, 1–13. [Google Scholar] [CrossRef]
  21. Hartmann, M.; Alsaad, H.; Mosayebzadeh, M.; Voelker, C. The reduction of building energy demand by a living wall system in a Central European climate. In Proceedings of the BS2023, the 18th Conference of IBPSA, Shanghai, China, 4–6 September 2023. [Google Scholar] [CrossRef]
  22. Garcia, M.; Vera, S.; Bustamante, W.; Rouault, F. Modelling and Validation of two Heat and Mass Transfer Model of Living Walls and Evaluation of Their Impact on the Energy Performance of a Supermarket in a Semiarid Climate. In Proceedings of BS2019, the 16th Conference of IBPSA, Rome, Italy, 2–4 September 2019. [CrossRef]
  23. Stanghellini, C. Transpiration of Greenhouse Crops an Aid to Climate Management; Instituut voor Mechanisatie, Arbeid en Gebouwen (IMAG): Wageningen, The Netherlands, 1987. [Google Scholar]
  24. Sailor, D.J. A green roof model for buildings energy simulation programs. Energy Build. 2008, 40, 1466–1478. [Google Scholar] [CrossRef]
  25. Zotarelli, L.; Dukes, M.D.; Romero, C.C.; Migliaccio, K.W.; Morgan, K.T. Step by Step Calculation of the Penman-Monteith Evapotranspiration (FAO-56 Method); University of Florida: Gainesville, FL, USA, 2010. [Google Scholar]
  26. Zhao, C.; Zhang, L.; Yang, Y.; Liu, M.; Yan, J.; Zhao, L. Long-wave infrared radiation properties of vertical green façades in subtropical regions. Build. Environ. 2022, 223, 109518. [Google Scholar] [CrossRef]
  27. ASHRAE Standard 140-2020; Method of Test for Evaluating Building Performance Simulation Software. American Society of Heating Refrigerating and Air-Conditioning Engineers (ASHRAE): Peachtree Corners, GA, USA, 2020.
  28. European Union. Directive (EU) 2024/1275 of the European Parliament and of the Council of 24 April 2024 on the energy performance of buildings (recast). Official Journal of the European Union, L. 8.5.2024. Available online: https://www.google.com.hk/url?sa=t&source=web&rct=j&opi=89978449&url=https://eur-lex.europa.eu/legal-content/EN/TXT/%3Furi%3DCELEX%253A32024L1275&ved=2ahUKEwiYwd6vm4eHAxX8lK8BHXXTABgQFnoECBIQAQ&usg=AOvVaw13VMZWlcEen2EF3z4EUF6r (accessed on 10 April 2024).
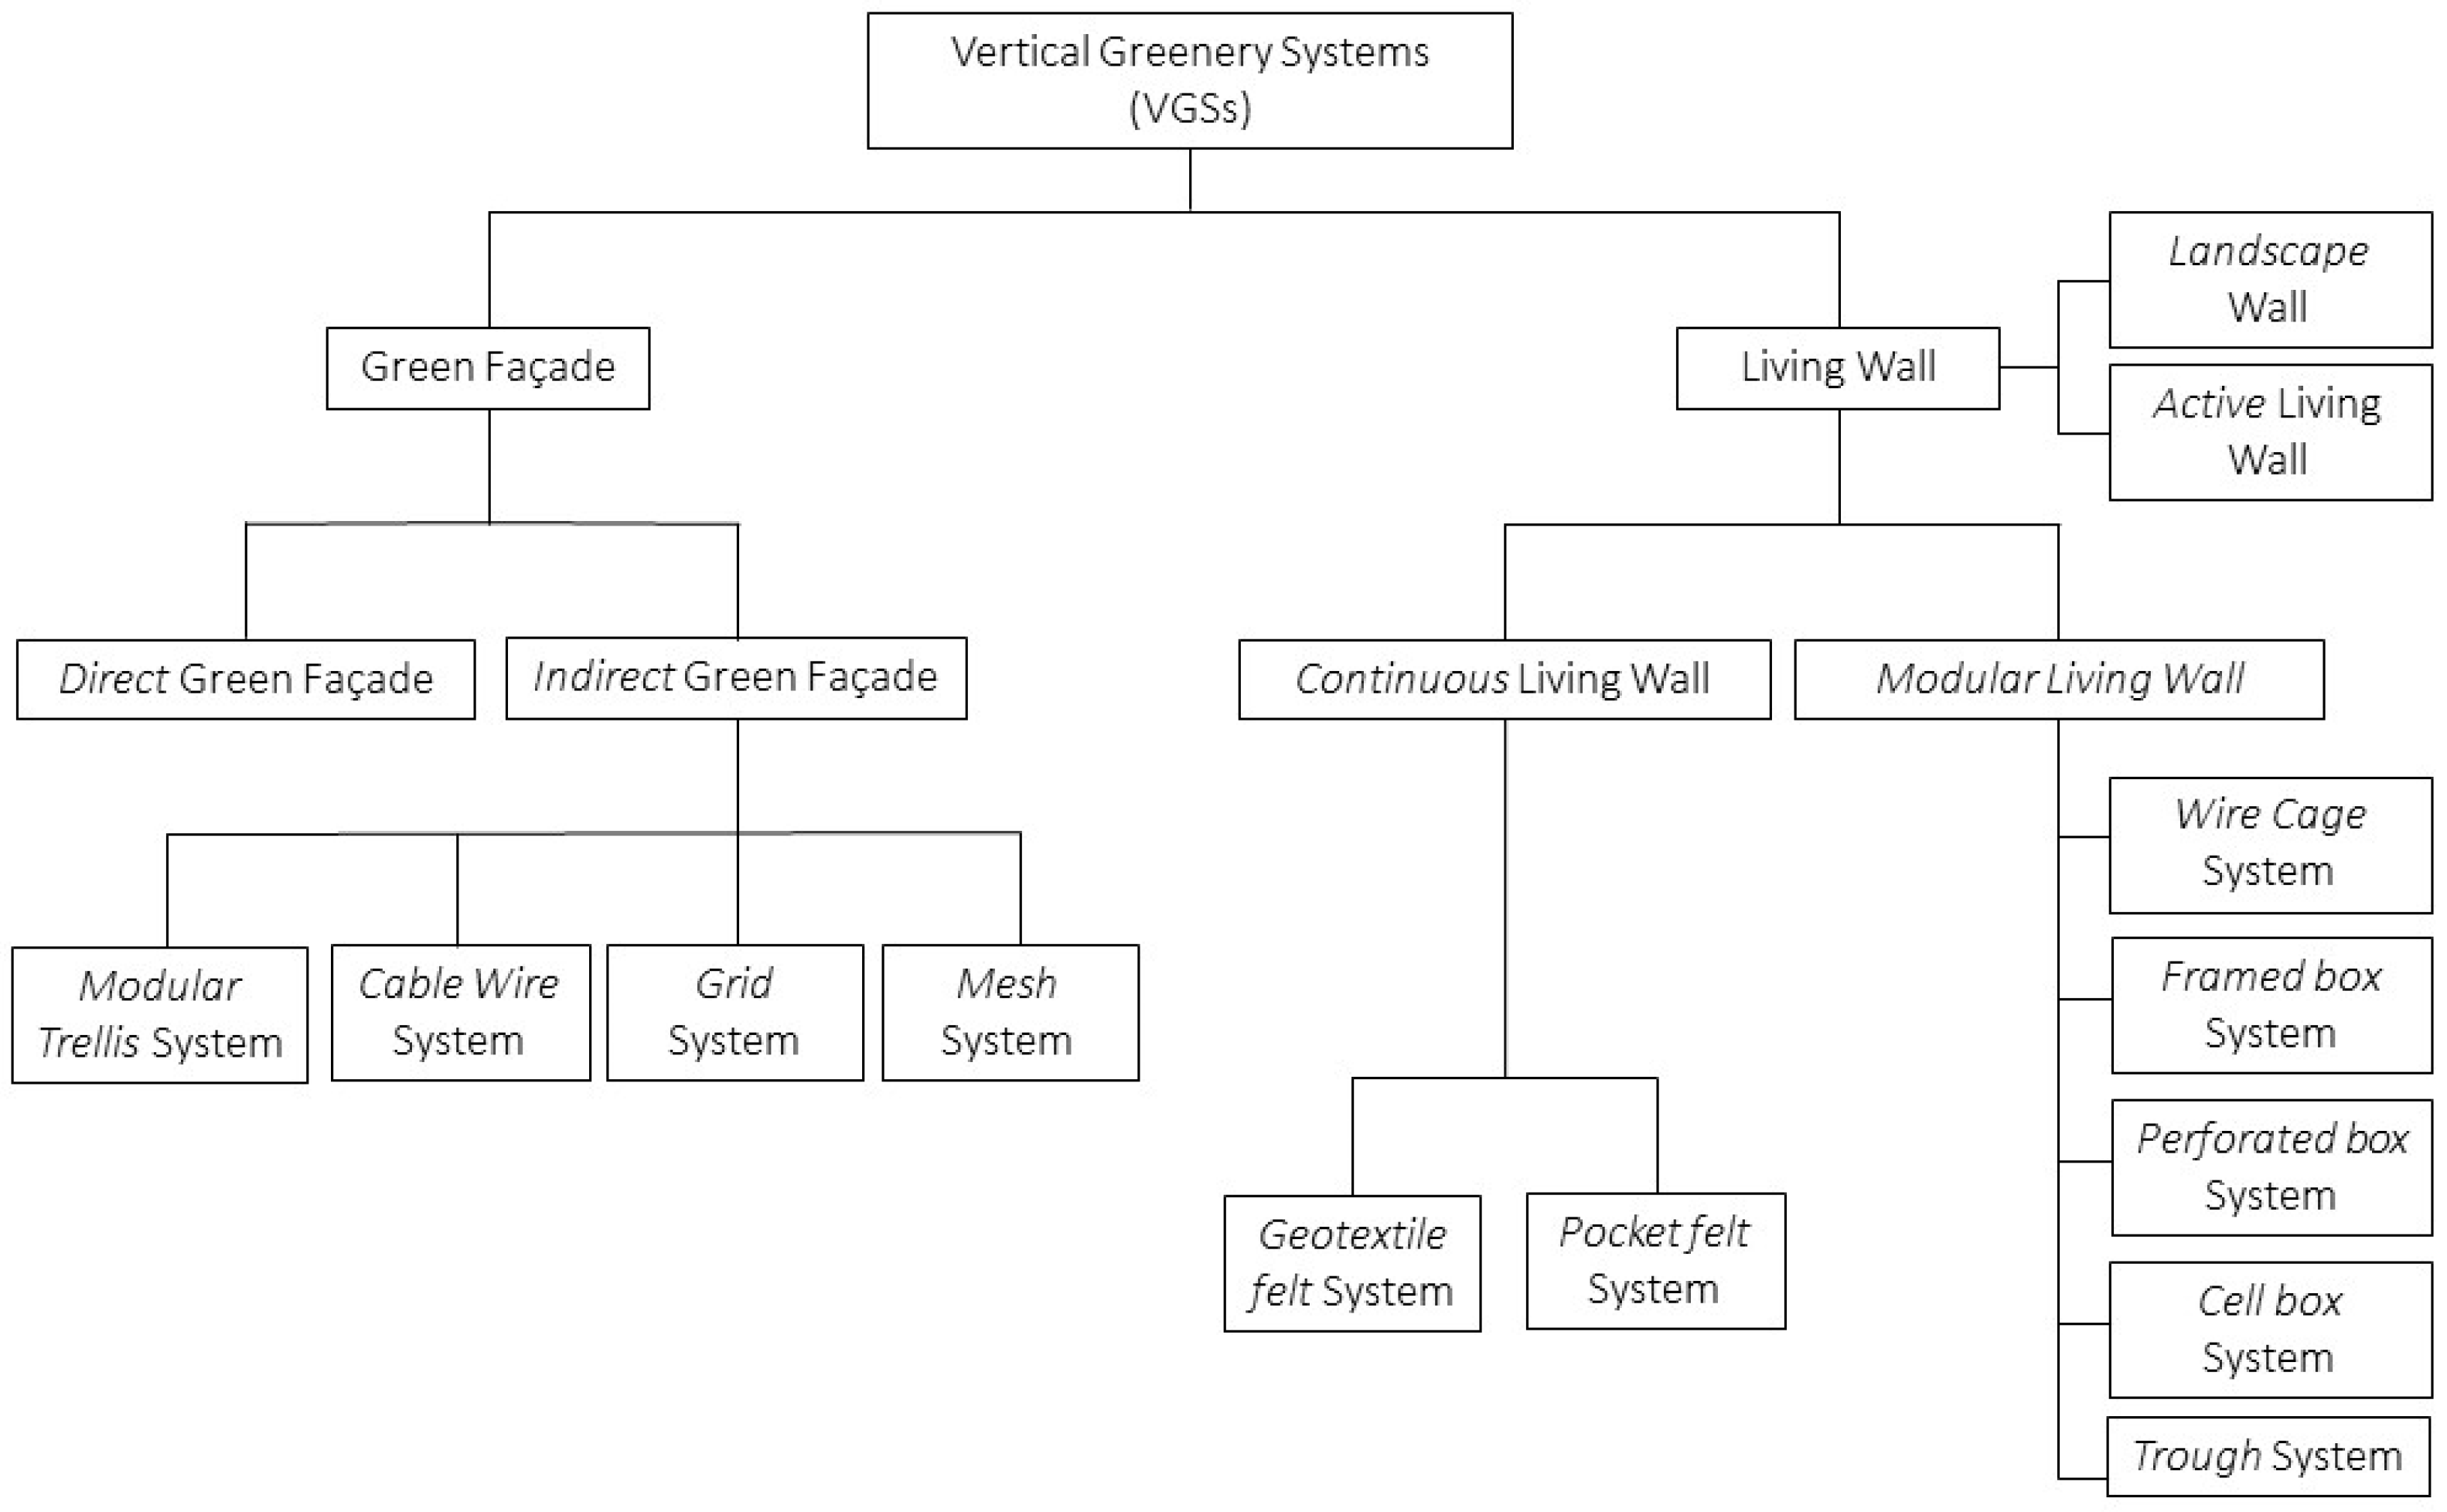
Figure 1. VGS classification.
Buildings 14 02040 g001
Figure 2. Interaction between Python (version 3.8) and EnergyPlus environments.
Buildings 14 02040 g002
Figure 3. Model algorithm schema: (a) green façade, (b) living wall.
Buildings 14 02040 g003
Figure 4. Base case study (900FF BESTest Case of ANSI/ASHRAE 140-2020 standard).
Buildings 14 02040 g004
Figure 5. Final geometrical configuration of the case study.
Buildings 14 02040 g005
Figure 6. Simulation of the green façade. Comparison of external surface temperature profiles—10 December.
Buildings 14 02040 g006
Figure 7. Simulation of the green façade. Comparison of external surface temperature profiles—17 August.
Buildings 14 02040 g007
Figure 8. Simulation of the green façade. Comparison of the ideal thermal energy need for heating (EPH,nd) and for cooling (EPC,nd) on a monthly basis.
Buildings 14 02040 g008
Figure 9. Simulation of the green façade. Sensitivity analysis: LAI variation.
Buildings 14 02040 g009
Figure 10. Simulation of the living wall. Comparison of external surface temperature profiles—10 December.
Buildings 14 02040 g010
Figure 11. Simulation of the living wall. Comparison of external surface temperature profiles—17 August.
Buildings 14 02040 g011
Figure 12. Simulation of the living wall. Comparison of the ideal thermal energy need for heating (EPH,nd) and for cooling (EPC,nd) on a monthly basis.
Buildings 14 02040 g012
Figure 13. Simulation of the living wall. Sensitivity analysis: LAI variation.
Buildings 14 02040 g013
Figure 14. Simulation of the living wall. Sensitivity analysis: thickness substrate variation.
Buildings 14 02040 g014
Table 1. Main geometric data of the case study.
ParameterValue
Gross volume, V [m3]130
Floor area, Afl [m2]48
Table 2. Annual thermal energy need and percentage change—comparison between the base case, green façade, and living wall.
|EPH,nd|
[kWh/m2]
Δ|EPH,nd|
[%]
|EPC,nd|
[kWh/m2]
Δ|EPC,nd|
[%]
Base case42650
Green façade430+1.042−15.2
Living wall412−3.246−8.5
Disclaimer/Publisher’s Note: The statements, opinions and data contained in all publications are solely those of the individual author(s) and contributor(s) and not of MDPI and/or the editor(s). MDPI and/or the editor(s) disclaim responsibility for any injury to people or property resulting from any ideas, methods, instructions or products referred to in the content.