Article

Predicting Residual Flexural Strength of Corroded Prestressed Concrete Beams: Comparison of Chinese Code, Eurocode and ACI Standard

by
Hai Li
1,4,
Zhicheng Pan
2,3,*,
Yiming Yang
1,4,*,
Xinzhong Wang
1,
Huang Tang
1,5,
Fanjun Ma
2 and
Liangfei Zheng
1
1
College of Civil Engineering, Hunan City University, No.158 Yinbindong Road, Yiyang 413000, China
2
Sinohydro Engineering Bureau 8 Co., Ltd., Changsha 410004, China
3
Power China Chizhou Changzhi Prefabricated Construction Co., Ltd., Chizhou 247100, China
4
Key Laboratory of Green Building and Intelligent Construction in Higher Educational Institutions of Hunan Province, Hunan City University, Yiyang 413000, China
5
Hunan Engineering Research Center of Development and Application of Ceramsite Concrete Technology, Hunan City University, Yiyang 413000, China
*
Authors to whom correspondence should be addressed.
Buildings 2024, 14(7), 2047; https://doi.org/10.3390/buildings14072047
Submission received: 23 May 2024 / Revised: 20 June 2024 / Accepted: 28 June 2024 / Published: 4 July 2024
(This article belongs to the Section Building Structures)

Abstract

:
In the present study, 104 sets of flexural tests on corroded prestressed concrete (CPC) beams were gathered from different publications. A flexural strength database for CPC beams was created by incorporating standardized concrete strength and the corrosion rate of prestressed steel. This database enables the analysis of the impact of different factors on the flexural capacity, such as the beam’s width and effective depth, concrete compressive strength, shear span ratio, the prestressed steel’s corrosion level, prestressing ratio (PPR), and the effective prestress. The findings show that the flexural strength of the CPC beams is notably influenced by variations in beam width, shear span ratio, and the prestressed steel’s corrosion level and prestressing ratio compared to other parameters. Furthermore, a comparison was conducted of the Chinese code, Eurocode and ACI standard for evaluating the flexural strength of CPC beams using the established database. It shows that the three design codes overestimate the flexural strength of CPC beams, and it is unsafe to predict flexural strength using these three codes without taking into account the impact of corrosion. Finally, a practical model based on the ACI standard is suggested to provide precise and reliable predictions across a diverse set of test data.

1. Introduction

Compared to normal reinforced concrete (RC) structures, PC structures are characterized by strong crack resistance, good impermeability, high stiffness, high strength, good shear capacity and fatigue resistance [1,2,3]. PC structures are very effective in saving steel, reducing the size of structural cross-section, lowering structural deadweight, preventing cracking and reducing deflection. Therefore, PC structures are extensively utilized in diverse civil engineering including construction, hydraulic engineering and transportation engineering [4]. Prestressed strands in PC are more difficult to corrode than reinforcing bars in RC due to the thicker protective layer. However, the strands in concrete were found to be experience corrosion during the service, which could be attributed to improper protection during transportation and storage of steel strands, insufficient grouting, poor construction quality of PC structures and the external erosive environment [5]. The reduction in cross-sectional area caused by corrosion is more sensitive to prestressed steel. Prestressed steel usually maintains a pre-tension stress throughout the service stage, which accounts for 55–60% of its ultimate tensile strength. A reduction in the section of the prestressed steel will correspondingly increase the pre-tension stress on the section, leading to the fracture and yield of the prestressed steel. Conversely, the tensile strength of prestressed steel is typically 4–5 times that of non-prestressed steel. If the corrosion rate is the same, the load of prestressed steel is 4–5 times that of ordinary steel bars [6]. Therefore, the corrosion of prestressed steel strands at high stress levels is likely to cause their brittle fracture without any warning, resulting in the sudden destruction of the PC structure. For instance, the Ynys-y-Gwas bridge in the UK collapsed suddenly in 1985 as a result of the corrosion of prestressed steel cables [7]. In 2000, a prestressed concrete footbridge in North Carolina of the United States collapsed unexpectedly as a result of the prestressed tendons’ corrosion [8]. In 2019, one of the prestressed steel cables of the Shenzhen Bay Bridge, constructed 12 years prior, exhibited signs of corrosion and failure (Figure 1). Due to this, the bridge had to be closed as an emergency for 28 days, during which the damaged cable was replaced [9].
Deterioration of corroded prestressed steel is intimately connected to the flexural bearing behavior of PC structures. The mechanical performance of corroded steel strands has been studied in detail, and their constitutive relationships are proposed on this basis [10,11,12,13,14,15,16,17,18]. Simultaneously, some researchers have experimentally investigated the flexural behavior of CPC beams, both rectangular sections and T-shaped sections. In the case of rectangular sections, the majority of research initially focused on how the corrosion rates of prestressed strands on the flexural strength of CPC beams [19,20,21]. These studies examined the effects of prestressed strands’ corrosion on the cracking load of concrete, yield and ultimate load of prestressed steel, as well as the failure pattern of CPC beams [19,22]. They also examined the effects of different corrosion rates and positions on the flexural behavior of CPC beams [21]. Secondly, some scholars have investigated the influence of corrosion on the flexural strength of CPC beams caused by prestressed strands in insufficiently grouted ducts [23,24]. Thirdly, bending tests were carried out on post-tension prestressed concrete beams with different corrosion degrees to explore the impact of the deformability between prestressing tendons and concrete on the flexural capacity [25]. Compared with rectangular sections, the research on the flexural strength of CPC T-shaped beams is relatively less. Most of these tests were also used to study the impact of the prestressed steel strand’s corrosion on the flexural strength of the T-shaped beam [26,27,28].
Meanwhile, there were two types of models proposed to evaluate the flexural strength of CPC beams, including the strain compatibility approach and computational intelligence technique. One type of model is proposed based on the strain compatibility approach after the prestressed steel is corroded. In the process of the stress–strain analysis, the section loss and mechanical property deterioration of prestressed steel are usually considered [22,28,29,30,31,32]. In addition, some scholars examined the coordination performance of corroded prestressed strands and concrete in predicting the flexural strength [29] and bond strength degradation [30,31]. The other type of model used a computational intelligence technique to calculate the flexural strength of CPC beams by gathering a relatively large experimental dataset [33].
Based on the above, the prediction models mentioned above often agree well with some experimental results. However, these models are more complicated to use in practical engineering, and whether they are universal is unknown. Moreover, current codes rarely consider the effects of prestressed steel’s corrosion on the flexural strength. The accuracy and applicability of the current main codes for the evaluation of the flexural strength of CPC beams is also unclear. There is thus a clear need to provide a new model that is precise and straightforward to utilize in engineering applications. Therefore, this paper presents a comprehensive database containing 104 flexural experimental tests of CPC beams gathered from the published sources. This database was employed to investigate the effects of various primary parameters on the flexural strength of CPC beams. These parameters included the beam’s width, the effective depth of the beam, the concrete compressive strength, the shear span ratio, the corrosion rate of the prestressed steel, the prestressing ratio (PPR) and the effective prestress. Then, Chinese code, Eurocode and ACI standard were evaluated to investigate the applicability and precision for calculating the flexural strength of CPC beams using the database. In addition, a novel model for predicting the flexural strength of the CPC beams is proposed based on the ACI standard incorporating the prestressed steel’s corrosion. The outcomes of the work presented in this paper can provide guidance for correctly using the standard formula to evaluate the flexural strength of CPC beams.

2. Experimental Database of the Flexural Capacity of CPC Beams

2.1. Set up of the Experimental Database

This section collected experimental data from 104 sets of CPC beams under concentrated loads from published sources. Of these, 86 sets used rectangular sections, while 18 sets used T-shaped sections. These experimental data are integrated into a database and shown in Table 1. The concrete compressive strength in the database is represented by the prismatic compressive strength (fck) and cube crushing strength (fcu,150) obtained from 150 mm cube tests, respectively. The prestressed steel’s corrosion rate is represented by the weight loss ratio (ηwt) and section loss ratio (ηsn) in the database, respectively. The definitions of ηwt and ηsn are given in Section 2.3. A summary of the key characteristics of the selected experimental CPC beams is presented Table 2. It is noted that the typical failure pattern of CPC beams is the wire rupture of corroded prestressed strands or concrete crushing, as shown in Figure 2 [27].

2.2. Unification of Compressive Strength of Concrete

Different test standards are employed to assess the concrete compressive strength, as listed in Table 1, including the conversion between fcu,150 and fck, as suggested by GB50010-2010 [39]. In the following contrast analysis of Chinese Code, Eurocode and ACI Standard, various compressive strengths of concrete are also used in three national standards. For the purpose of a comparative study, different compressive strengths of concrete must be converted to each other. The conversion between fcyl,150 (the concrete compressive strength obtained from cylinder tests of 150 × 300 mm specimens) and fcu,150 are provided in Eurocode 2 [40].

2.3. Unification of Corrosion Rate of Prestressed Steel

To define the prestressed steel’s corrosion rate, different researchers used different indices, e.g., the weight loss ratio (ηwt) and the section loss ratio (ηsn). The ηwt and ηsn can be calculated according to Equations (1) and (2) [39].
η w t = m 0 m r / m 0 × 100 %
η s n = A 0 A min / A 0 × 100 % = d 0 2 d min 2 / d 0 2 × 100 % = d 0 2 d 0 X 2 / d 0 2 × 100 %
where m0 and mr is the initial and residual mass of the prestressed steel before and after corrosion, respectively; d0 and A0 are the diameter and sectional area of the prestressed steel, respectively; dmin and Amin are the minimum residual diameter and sectional area of the prestressed steel after corrosion, respectively; and X is the maximum corrosion depth of the prestressed steel.
Meanwhile, the conversion relationship between ηsn and ηwt proposed by Xue [41] is adopted in this study. At the same time, this study employs the conversion correlation between ηsn and ηwt, as suggested by Xue [41]:
η s n = 0.936 η w t + 0.0045

3. Effects of Parameters on the Flexural Strength of CPC Beams

This study firstly used the experimental database to examine the impact of the main parameters on the flexural strength. The normalized ultimate flexural stress, Mn,exp, Mn,exp = Mn,exp/(bh0fcu,150), is defined to analysis the influence of each main parameter. The beam’s effective depth (h0) [39] can be calculated as follows:
h 0 = h a s
where as is the distance from the resultant force of the prestressed steel and the ordinary tensile steel bar to the edge of the beam section in the tension zone.
To clearly distinguish the effects of different parameters on the flexural strength, the rectangular and T-shaped section beams are discussed separately in the process of analyzing the influence of these parameters.

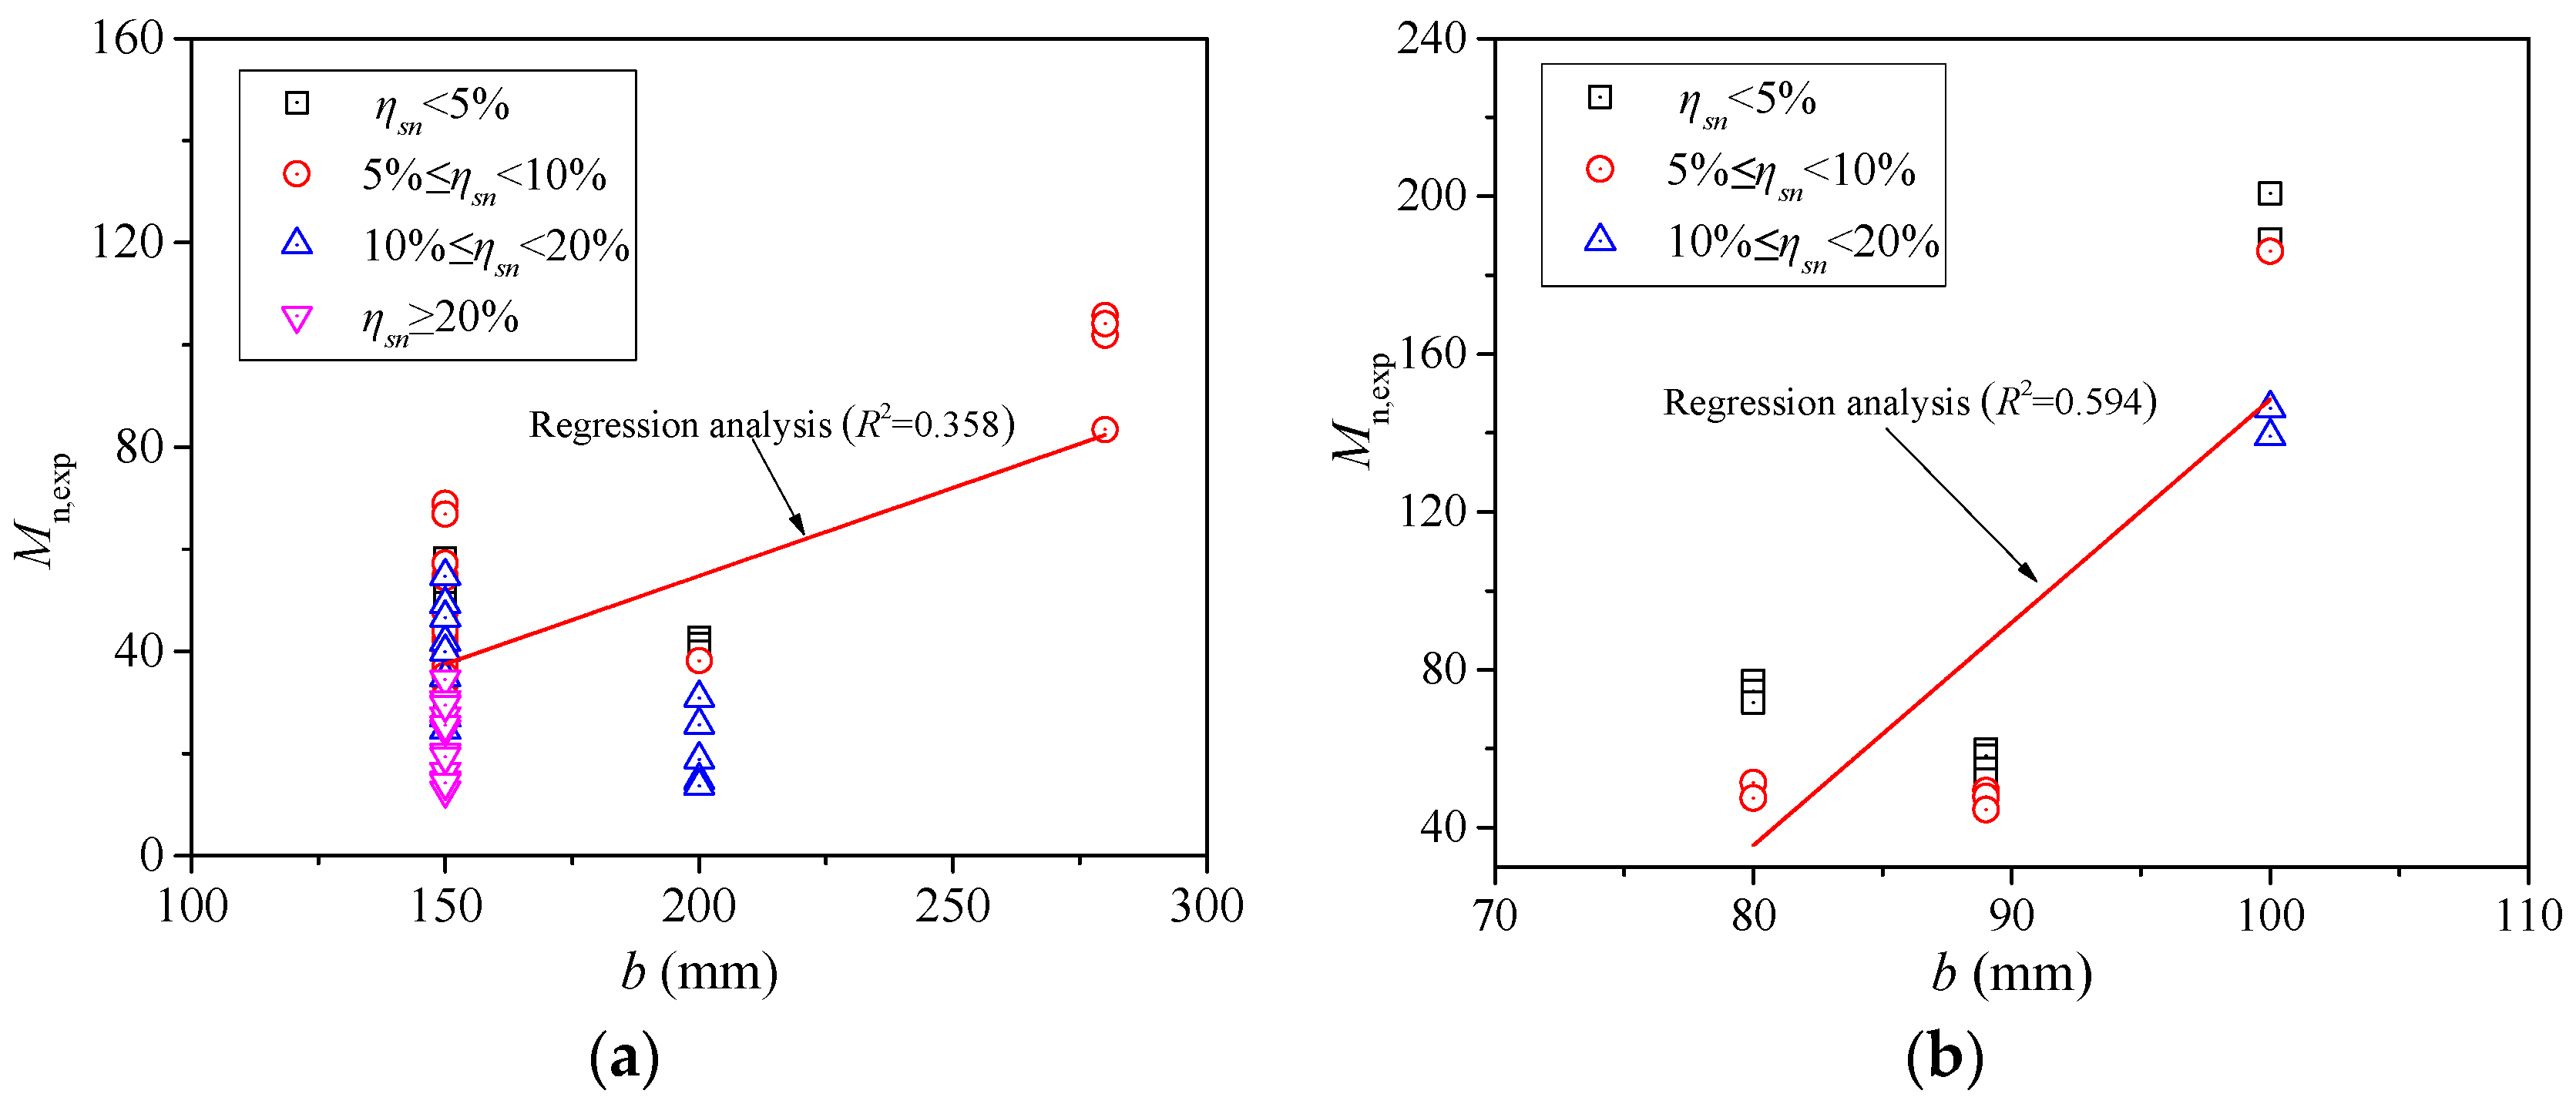
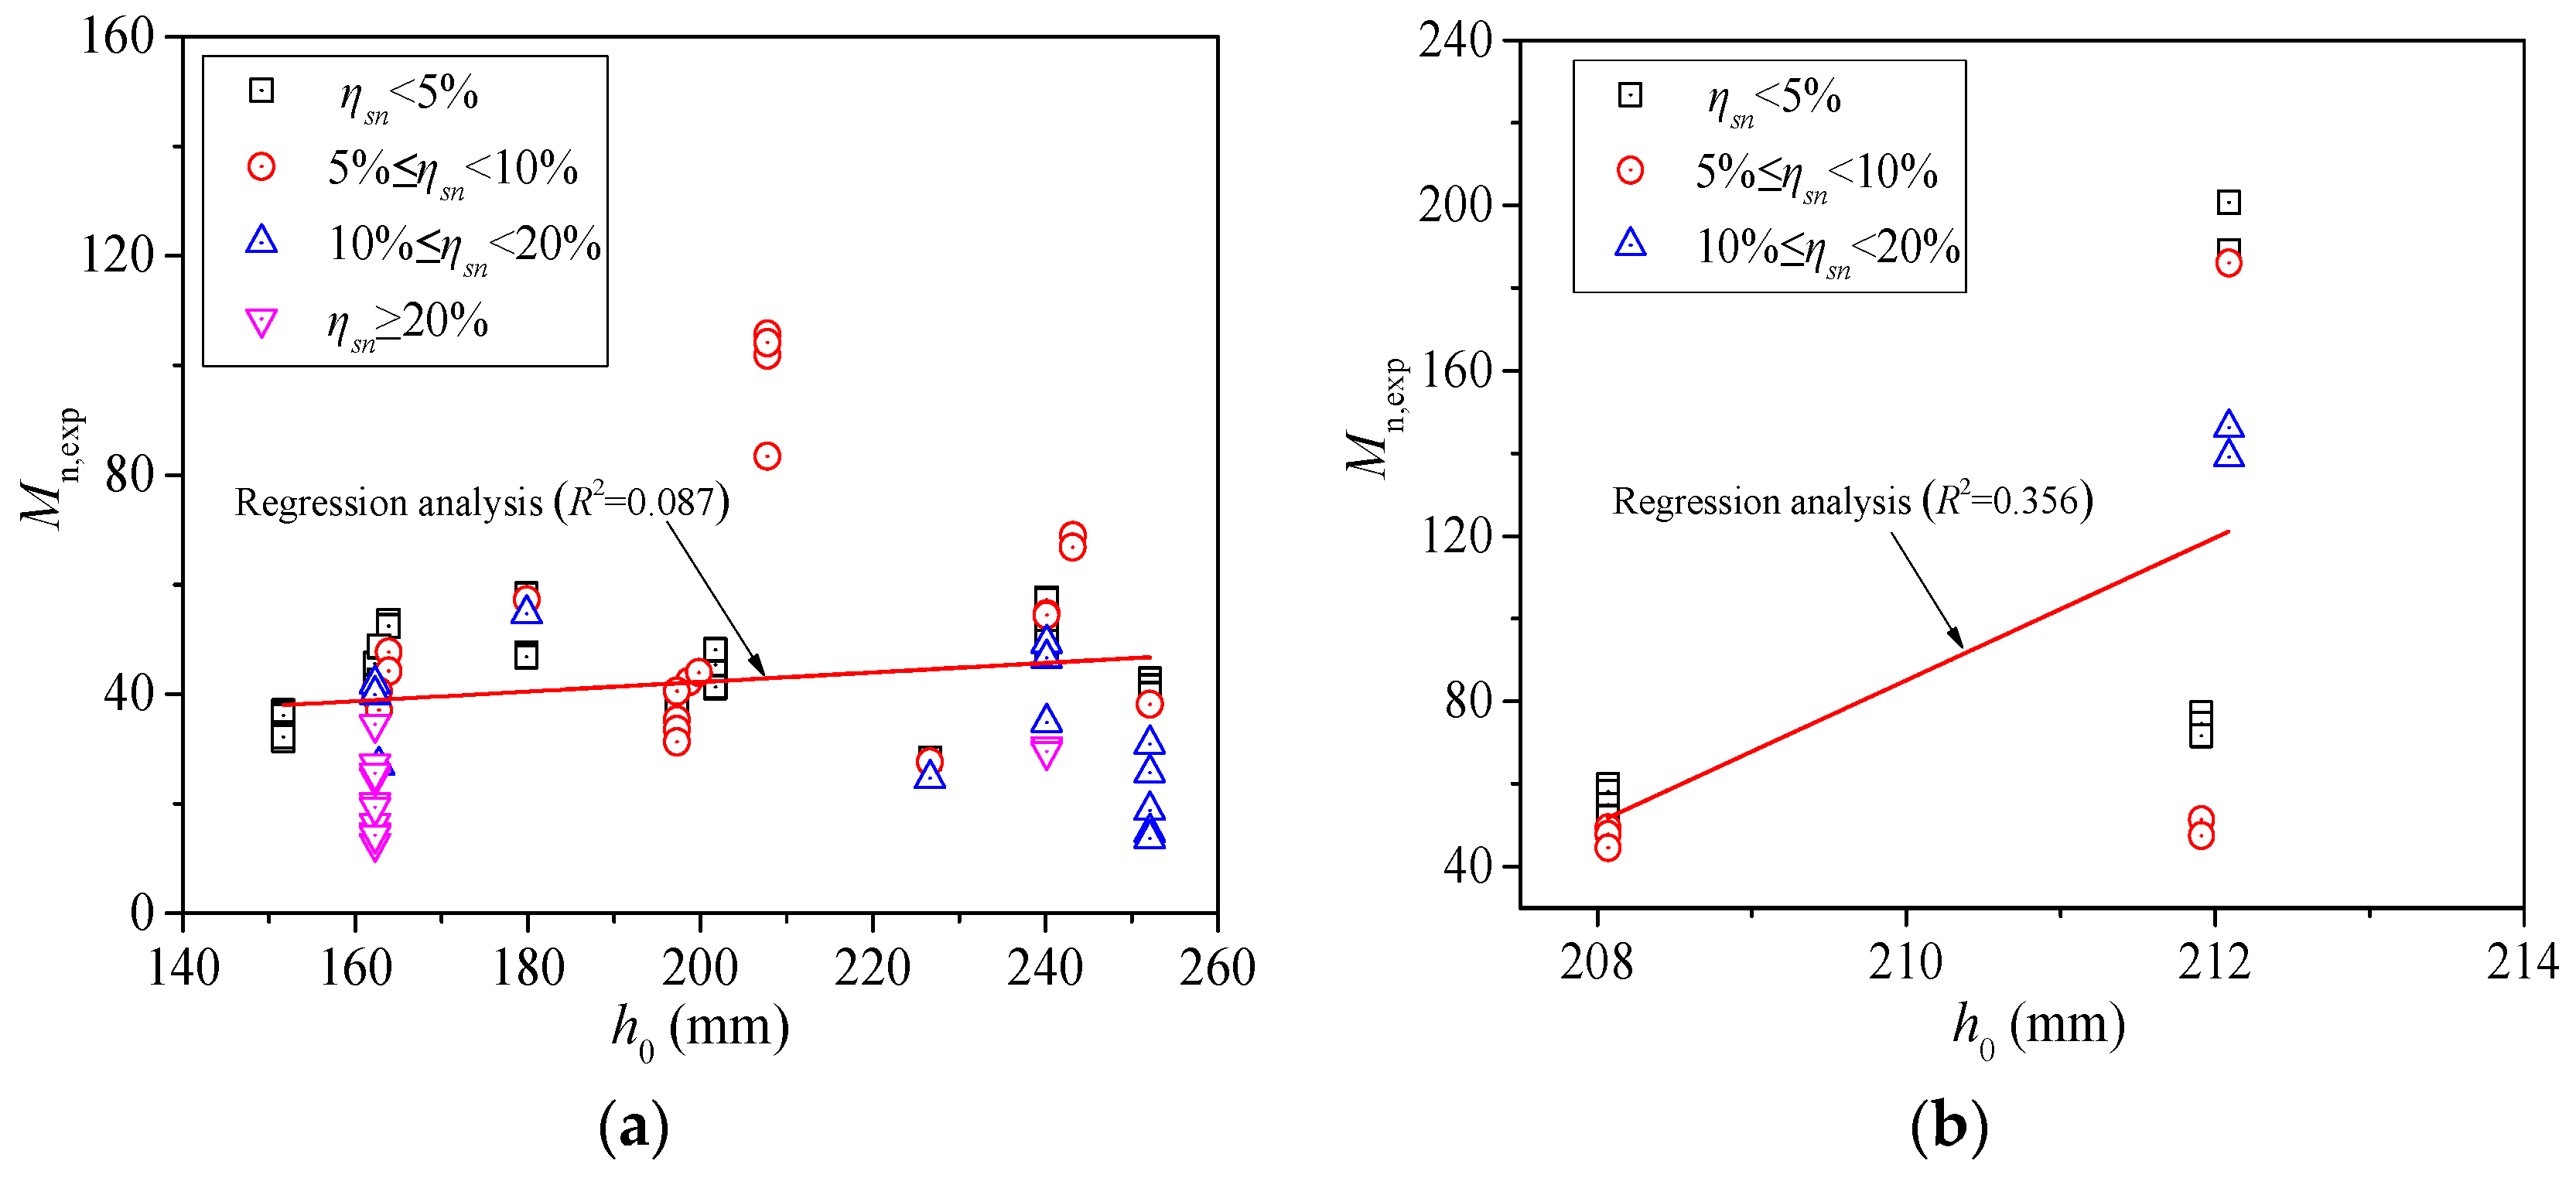
3.1. Beam’s Width and Effective Depth

Mn,exp was analyzed in relation to the beam’s width b and effective depth h0, as shown in Figure 3 and Figure 4. The trend lines are plotted for different corrosion rates after a regression analysis. The test results were classified into four groups according to the section corrosion loss ratio of prestressed steel (ηsn), namely ηsn < 5%, 5% ≤ ηsn < 10%, 10% ≤ ηsn < 20%, and ηsn ≥ 20%. The findings presented in Figure 3 and Figure 4 show that Mn,exp tends to increase gradually with the increase of b and h0. The trend of normalized ultimate flexural stress with the increase in beam width is more obvious than that with the increase in the effective height of the CPC beams. Compared with rectangular beams, the beam width and effective depth have a greater influence on the flexural strength of T-shaped CPC beams. It is noted that because the test data of the T-shaped CPC beam of ηsn ≥ 20% were not collected, there are the test data of ηsn < 20% in Figure 3b and Figure 4b. Moreover, it is evident that for the same beam width or effective depth, whether rectangular or T-shaped, the CPC beams with more severe corrosion of prestressed steel have a lower flexural strength.

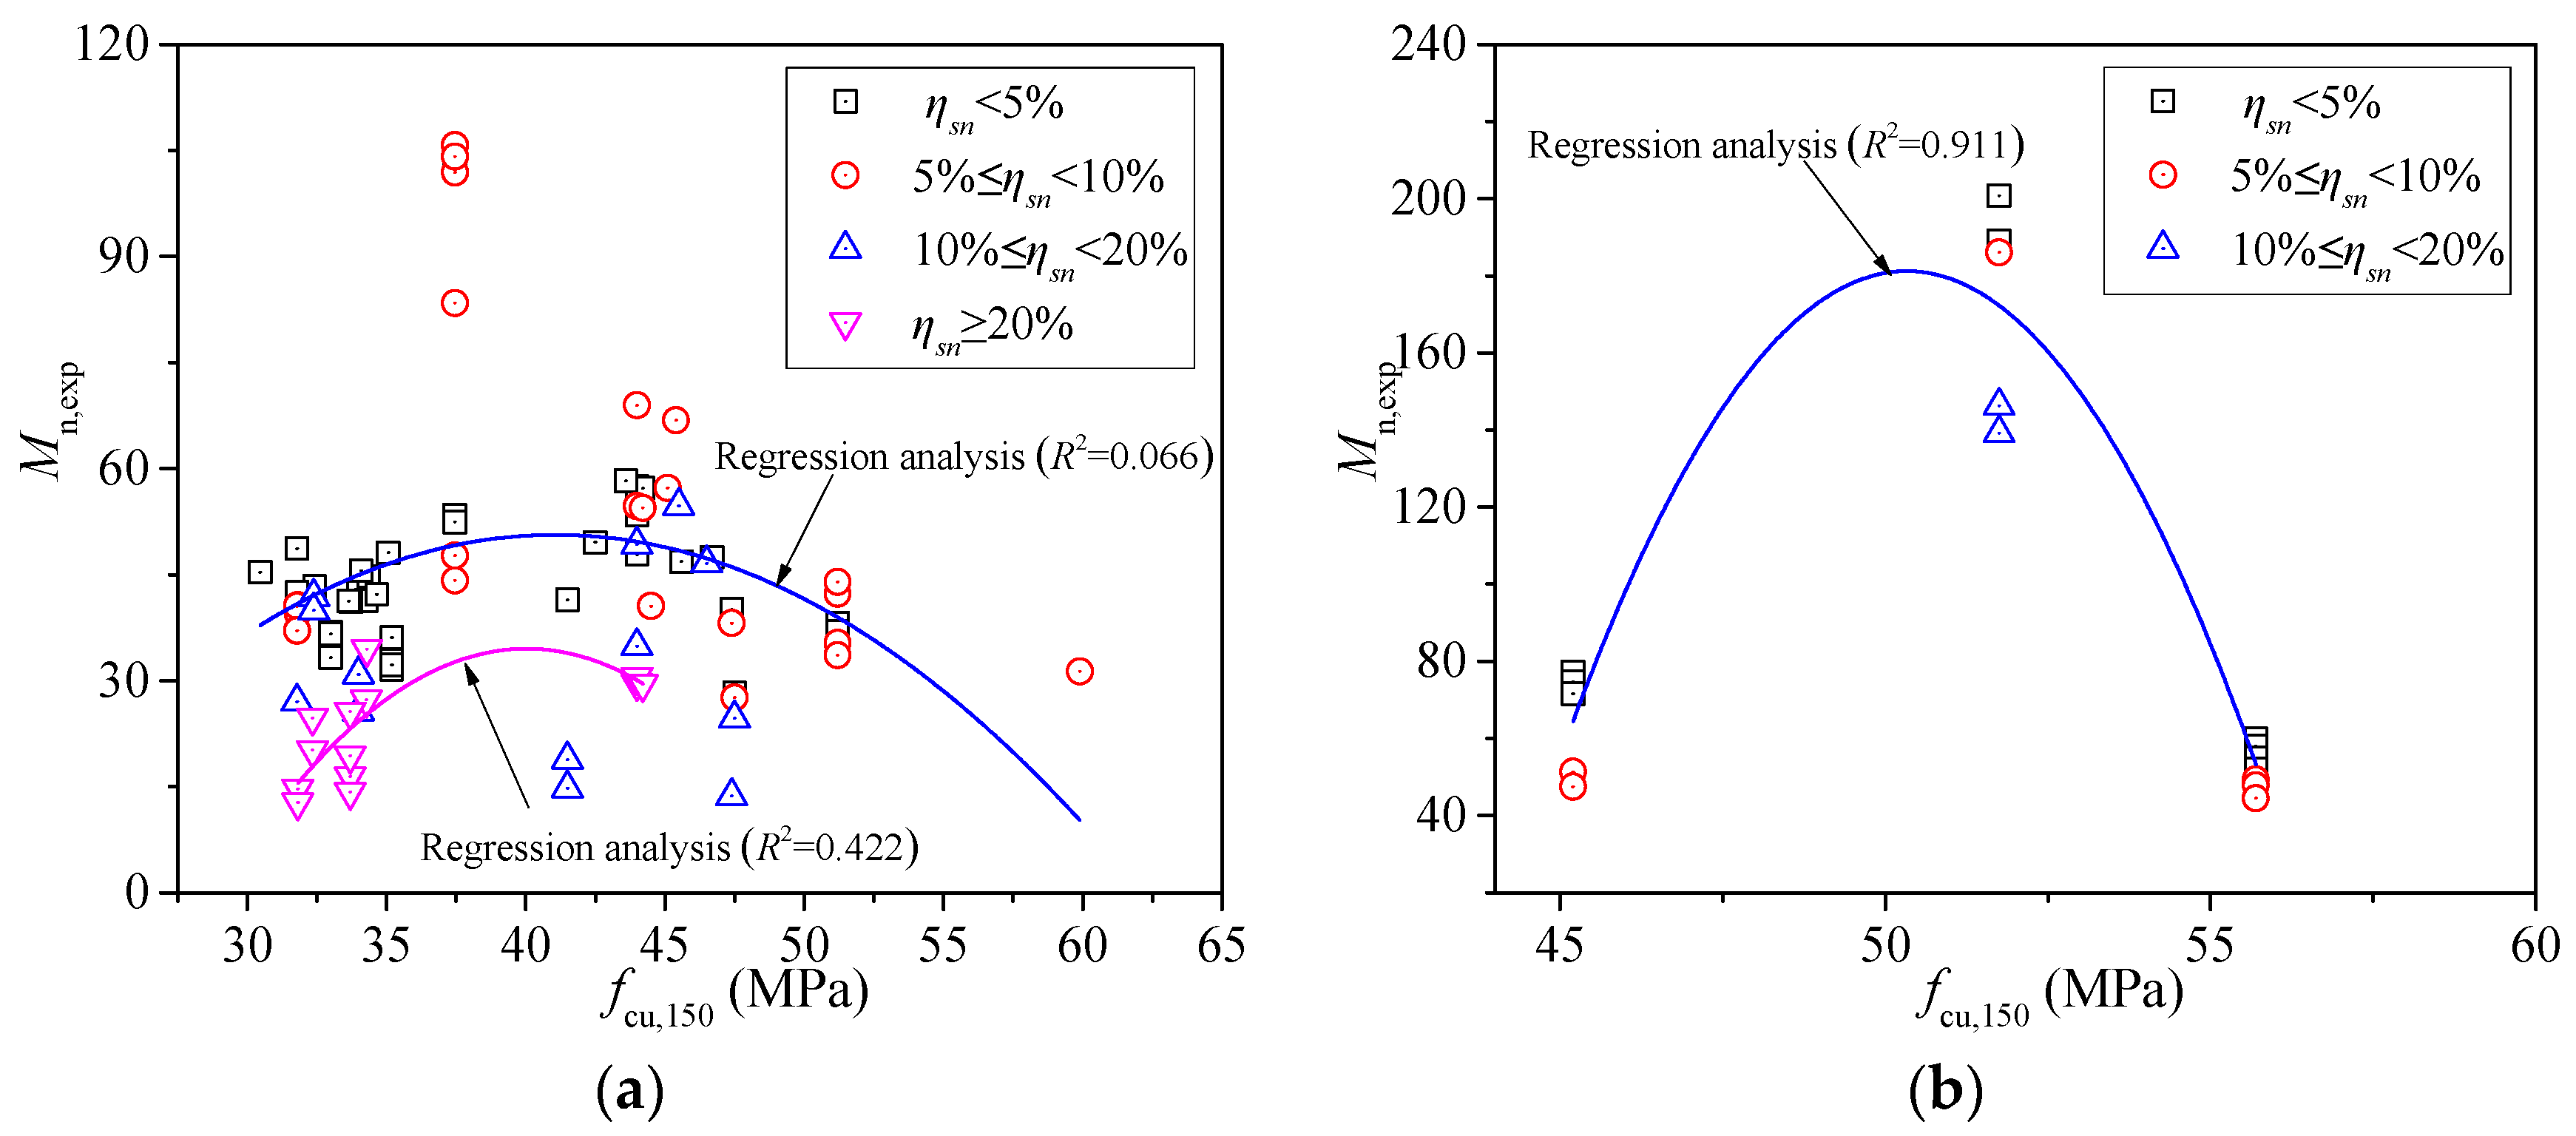
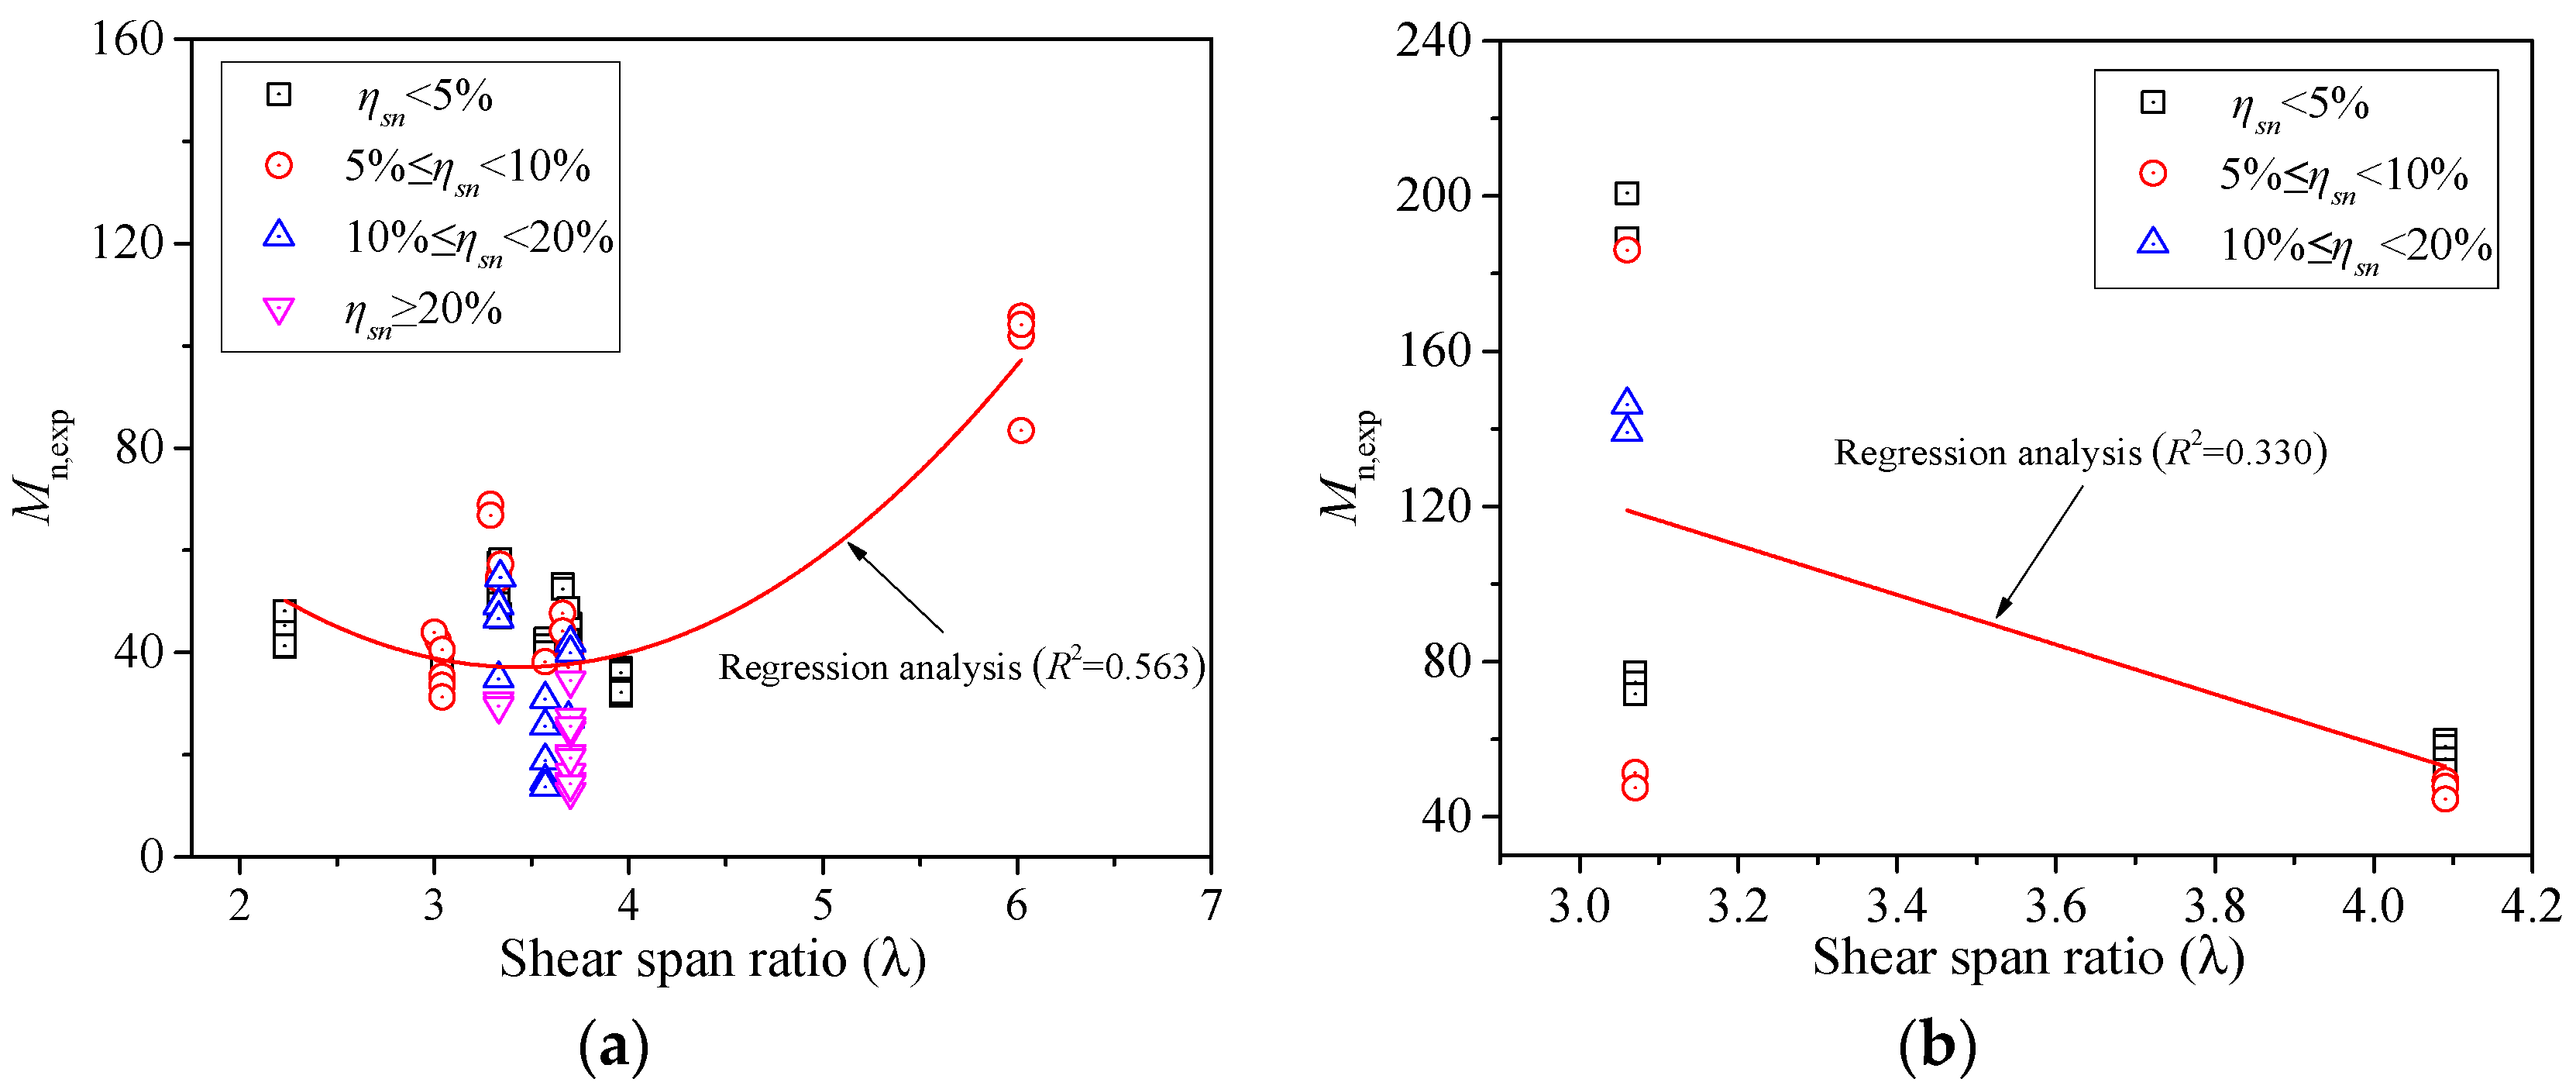
3.2. Compressive Strength of Concrete and Shear Span Ratio

Figure 5 illustrates the relationships between Mn,exp and concrete compressive strength, as indicated by fcu,150. Based on the trend line in Figure 5a, it is evident that as the concrete compressive strength increases, Mn,exp rises first and then declines, with the index R2 of 0.066 (for the test data of ηsn < 20%) and 0.422 (for the test data of ηsn ≥ 20%) in the rectangular section. The changing trend is similar for the CPC T-beams, as shown in Figure 5b. When fcu,150 is larger than 40 MPa in rectangular sections and 50 MPa in T-shaped section, the normalized ultimate flexural stress shows a noticeable decrease. This downtrend is even more pronounced for beams with a corrosion section ratio exceeding 10%.
Figure 6 illustrates the variations in the normalized ultimate flexural stress with the shear span ratio (λ), which is the ratio of the minimum distance a (a is the shear span) from the concentrated load point on the beam to the edge of the support to the effective depth h0 of the section for simply supported beams. As depicted in Figure 6a, the flexural strength of CPC rectangular beams experiences a significant increase as λ rises within the range of 3.5. Once λ > 3.5, there is a significant increase in the flexural strength as λ increases. This trend is similar to the relationship between the shear strength and λ of uncorroded concrete beams. When λ is to 2.5, the shear strength of the concrete beam is in the valley of shear failure [42,43]. However, the flexural strength of CPC T-shaped beams decreases as the λ increases, as shown in Figure 6b. This difference may be due to the fact that the test data of CPC T-beams are relatively small, and only two shear span ratios are used for the regression analysis.

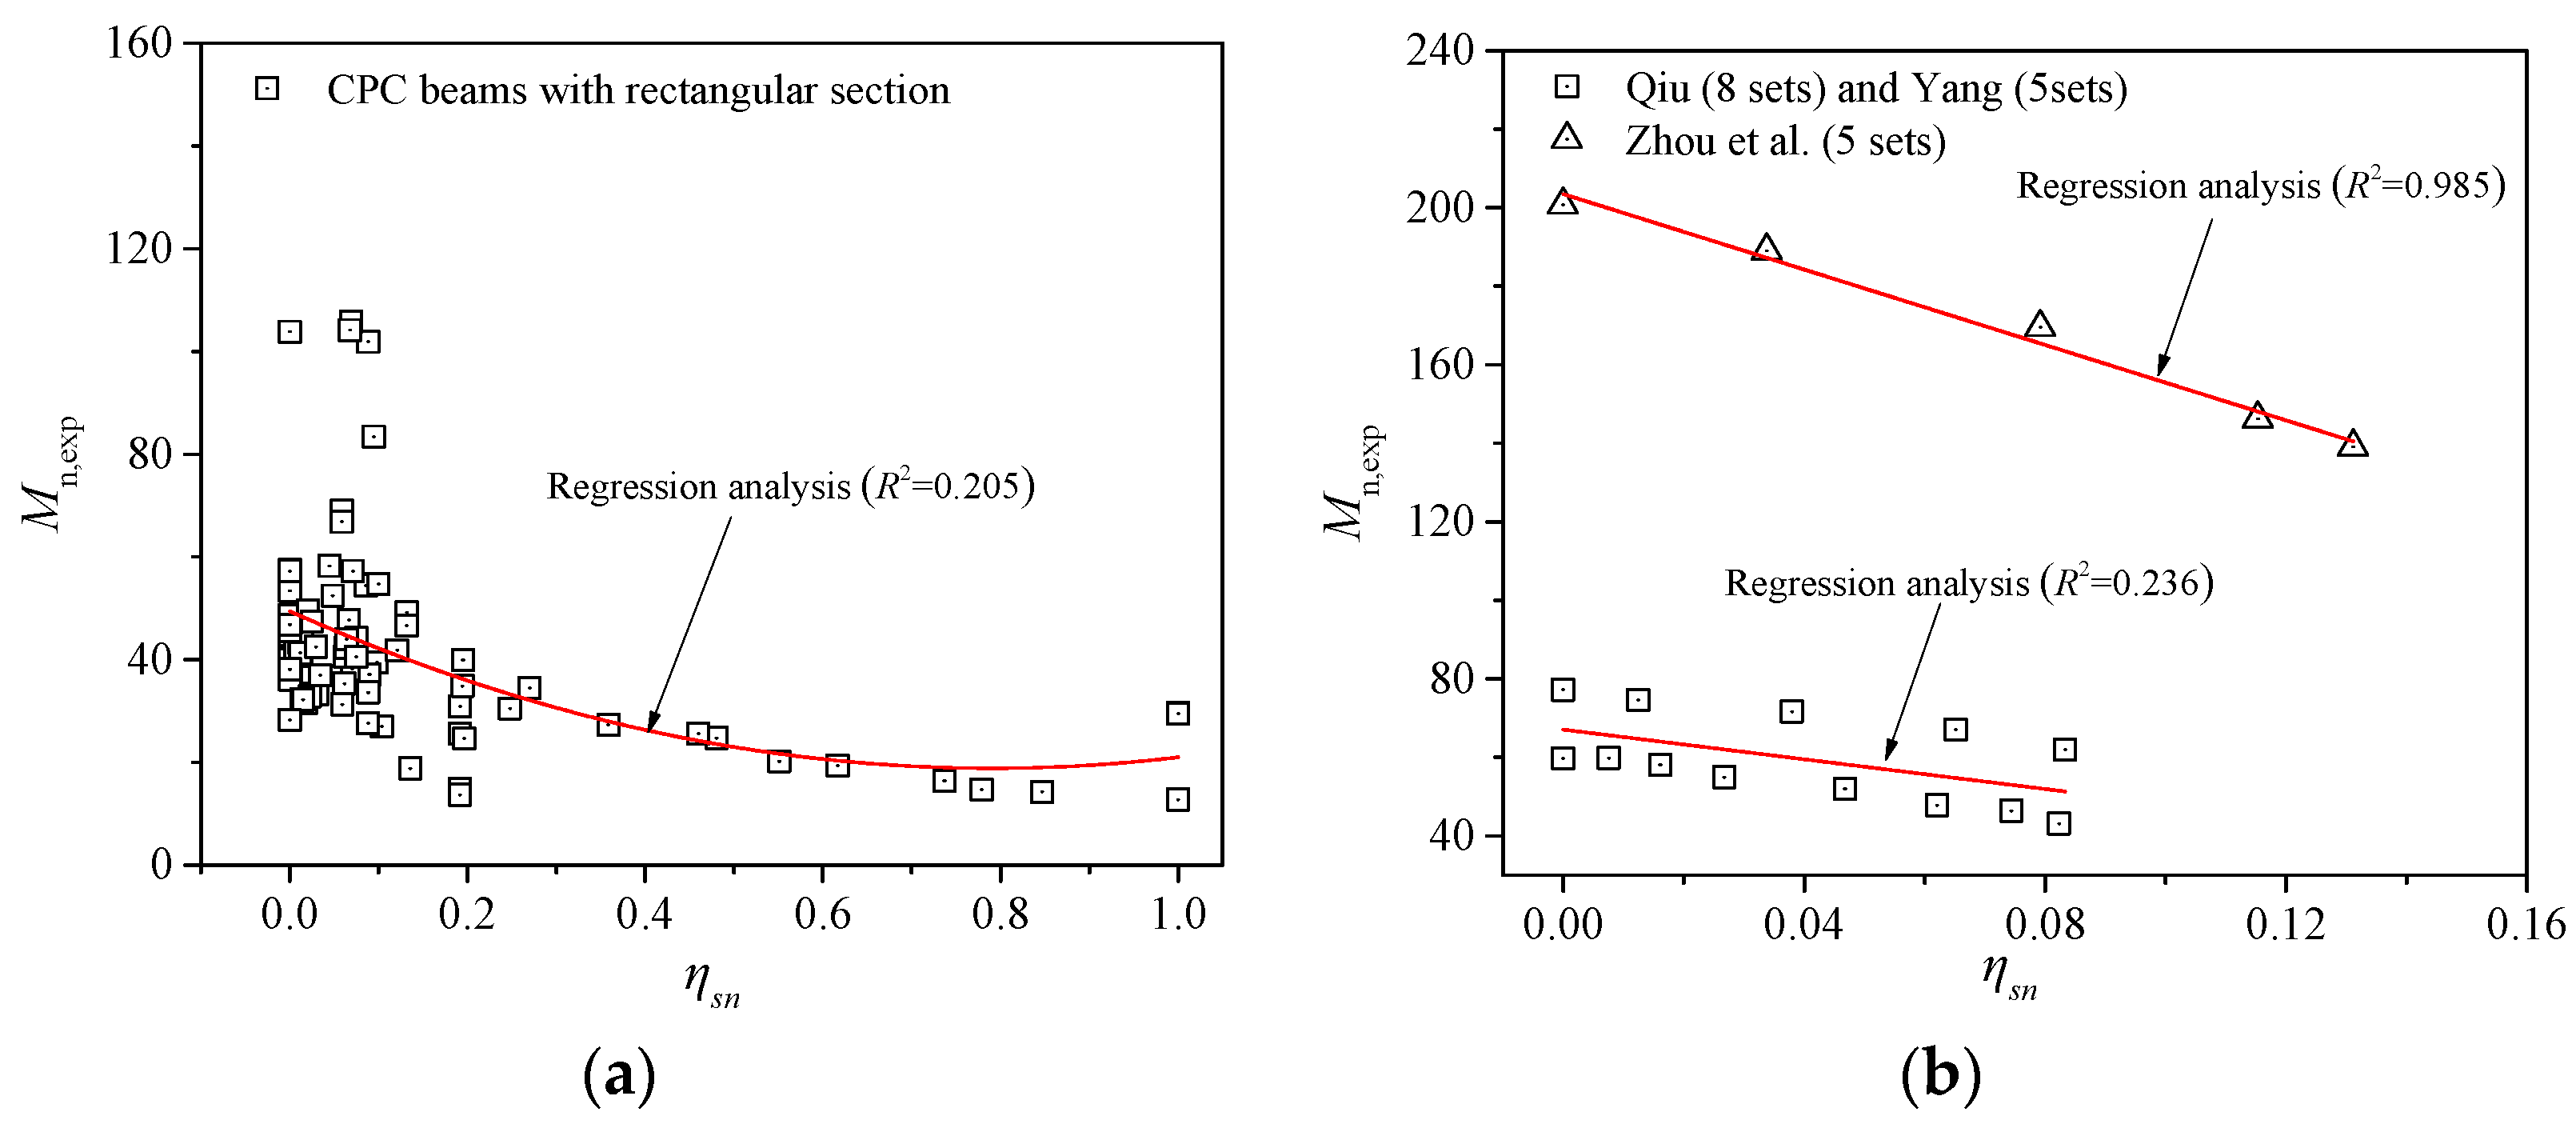
3.3. Corrosion Rate of Prestressed Steel

Figure 7 shows the variation in Mu,exp of the CPC beams with the corrosion level of the prestressed steel, represented by ηsn. As depicted in Figure 7a, the Mu,exp of the CPC rectangular section (Square dots in the Figure 7a) decreases with the increase in the corrosion rate of the prestressed steel. A clear downward trend is observed when the section loss ratio is below 60%. However, this downward trend becomes less pronounced when the section loss ratio exceeds 60%. Figure 7b indicates that the Mu,exp of the CPC T-shaped section decreases always as ηsn rises within the range of 15%, which is consistent with the CPC rectangular section in Figure 7a. For the test data obtained from the same experiment (Triangle dots in the Figure 7b), this trend is more obvious. As shown in Figure 7b, the corresponding coefficient of the determination R2 of Zhou et al. [28] is as high as 0.985.

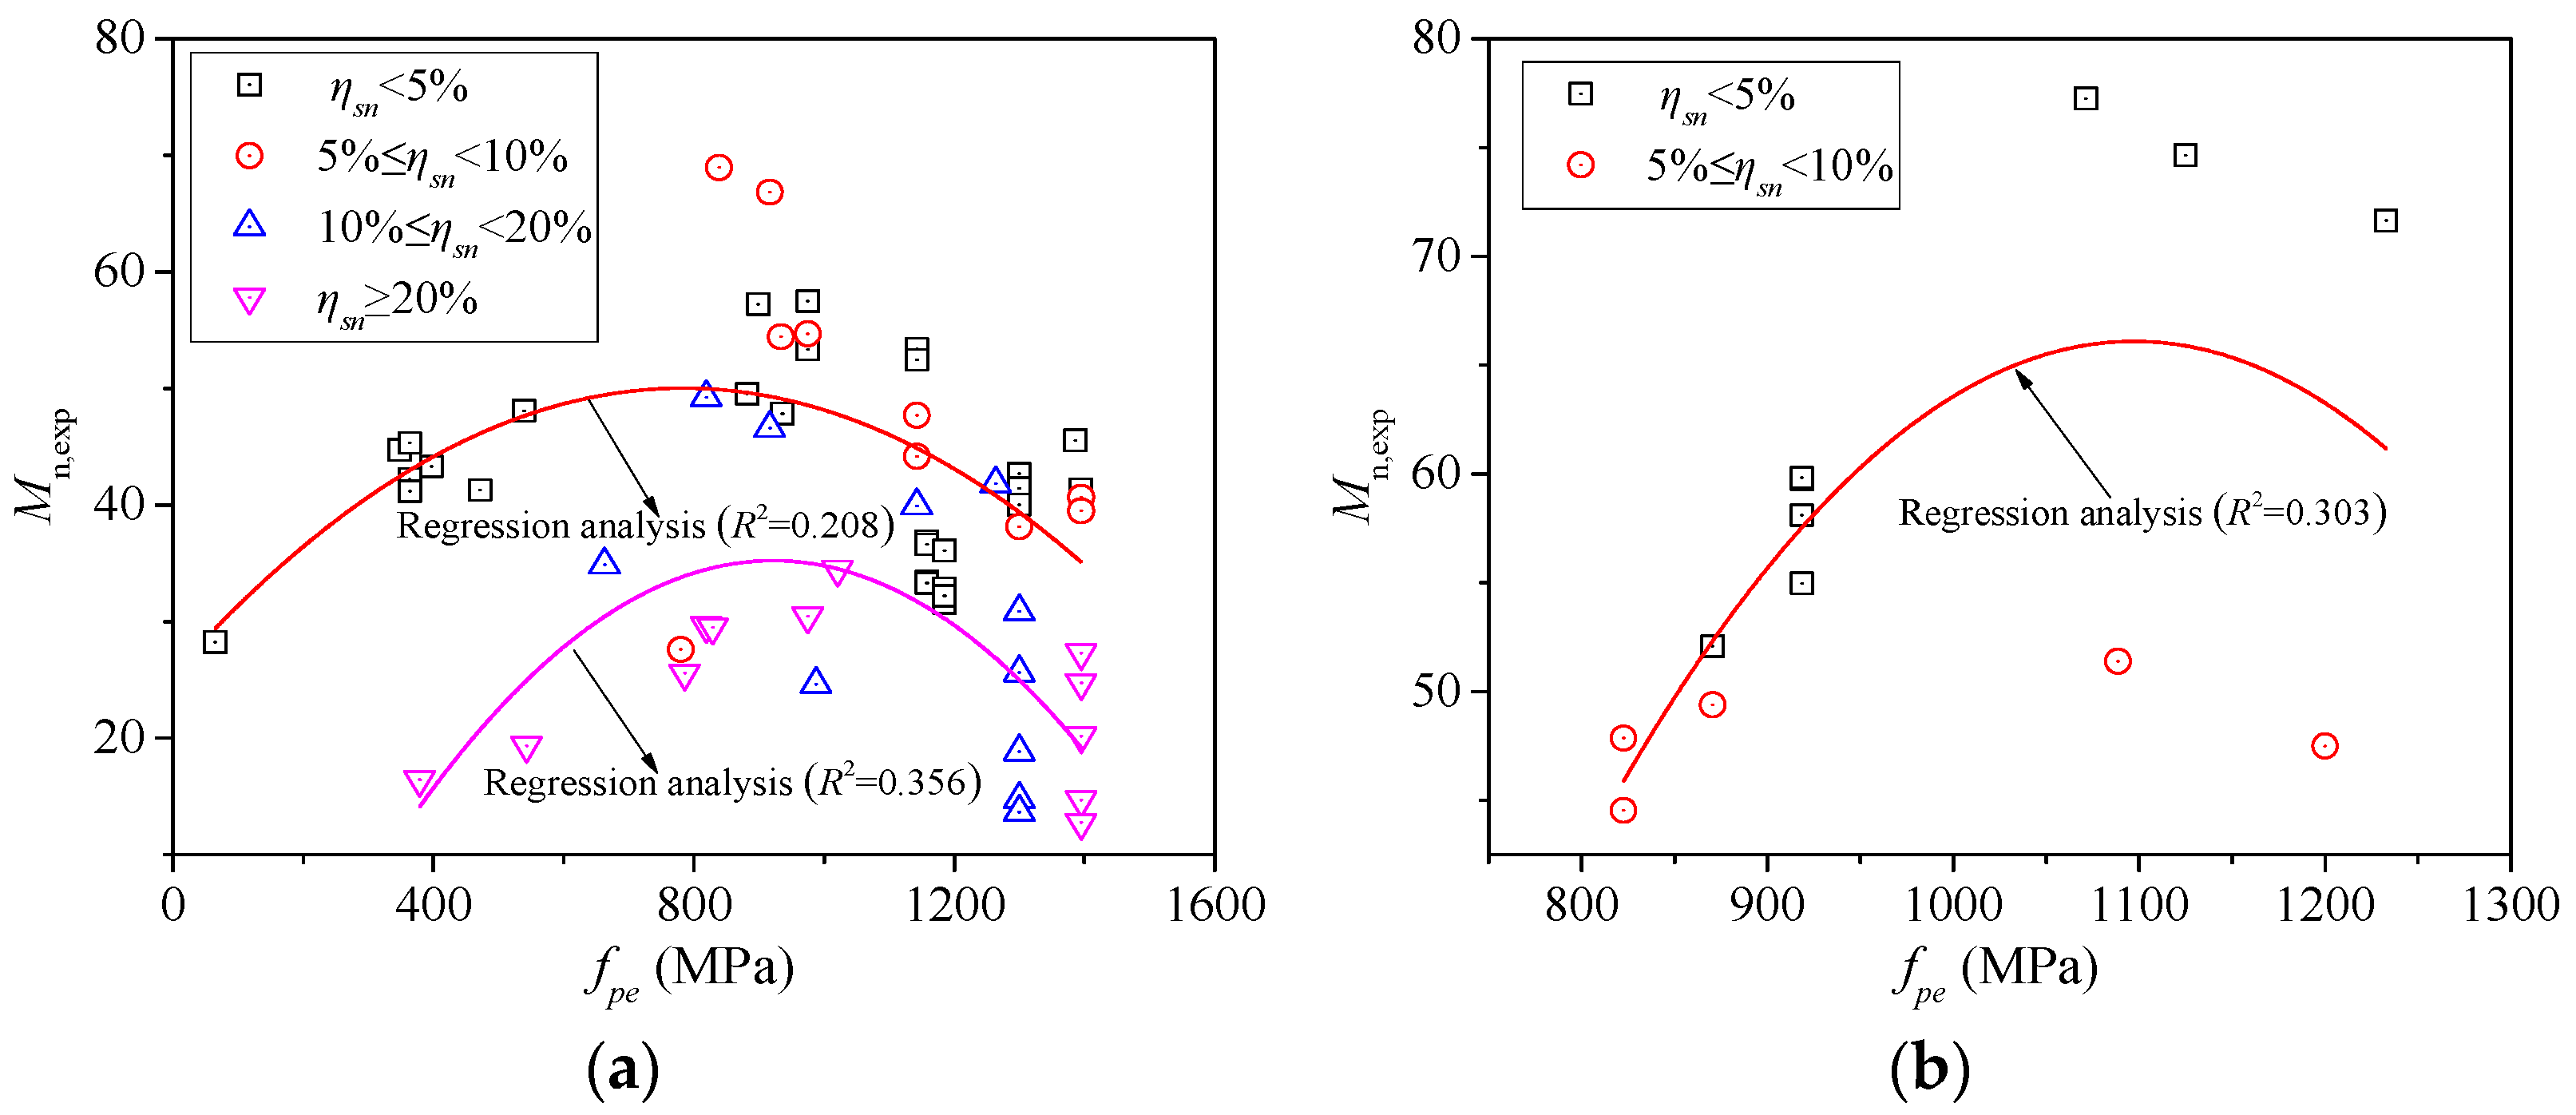
3.4. Prestressing Ratio (PPR) and Effective Prestress

The prestressing ratio (PPR) and effective prestress are important factors affecting the flexural behavior of PC beams. PPR is the ratio of the material strength of prestressed steel to that of non-prestressed steel [35]:
PPR = A P f p y t A P f p y t + A s t f y t
where fpyt and fyt are the yield strength of the tensile prestressed and non-prestressed reinforcement, respectively. Ap and Ast are the cross-sectional areas of the tensile prestressed and non-prestressed reinforcement, respectively.
Figure 8 illustrates the correlation between the Mu,exp and the PPR. Because the T-shaped beams in the data sources did not give PPR, the data of the CPC beams in Figure 8 are all rectangular sections. The normalized ultimate flexural stress decreases as the PPR increases, with an index R2 of 0.346. Additionally, it is evident that the CPC beams with a higher section loss ratio exhibit lower flexural strength at the same PPR.
Figure 9a,b illustrates the correlation between Mu,exp and the effective prestress of CPC rectangular and T-beams, respectively. Compared with other influencing factors, the discrete relationship between the effective prestress and flexural strength is greater. Based on the regression trend in Figure 9, Mu,exp initially increases and then decreases as the effective prestress, including the rectangular section and T-shaped section. When effective prestress is about 900 MPa and 1100 MPa, Mu,exp reaches the maximum value in the rectangular section and in the T-shaped section, respectively. When the same effective prestress is applied, the corrosion of the prestressed steel will also reduce the flexural strength of the CPC beam.
Based on the above investigation, the impact of the main parameters on the flexural strength of CPC rectangular and T-beams is almost the same. The main parameters include the beam width (b), the beam effective depth (h0), the concrete compressive strength (fcu,150), the shear span ratio (λ), the corrosion rate of the prestressed steel (ηsn), the prestressing ratio (PPR) and the effective prestress (fpe). Compared with other influencing parameters, the flexural strength of the CPC beams is notably influenced by variations in the beam width, shear span ratio, section corrosion loss rate of the prestressed steel and prestressing ratio. In particular, the corrosion of prestressed steel will reduce its mechanical performance and affect the flexural strength of PC beams. Moreover, other factors such as concrete strength, effective height, prestressed steel and so on will be affected by the corrosion of prestressed steel, thereby affecting the flexural strength of the CPC beam. Obviously, the flexural strength of the CPC beam is also affected by the corrosion of prestressed steel in the analysis of other influencing factors. Therefore, it is crucial to take into account the critical corrosion impact on the prestressed steel in the model when attempting to predict the flexural strength of CPC beams.

4. Comparison between the Test Results and Predictions of Chinese Code, Eurocode and ACI Standard

In China, the design code for reinforced concrete structures is represented by the GB50010-2010 [39]. In turn, EN 1992-1-1:2004+A1 [40] and ACI 318-19 [44] are the more internationally accepted standards. Therefore, the following mainly discusses the predictions of the flexural strength by the Chinese Code, Eurocode and ACI Standard.

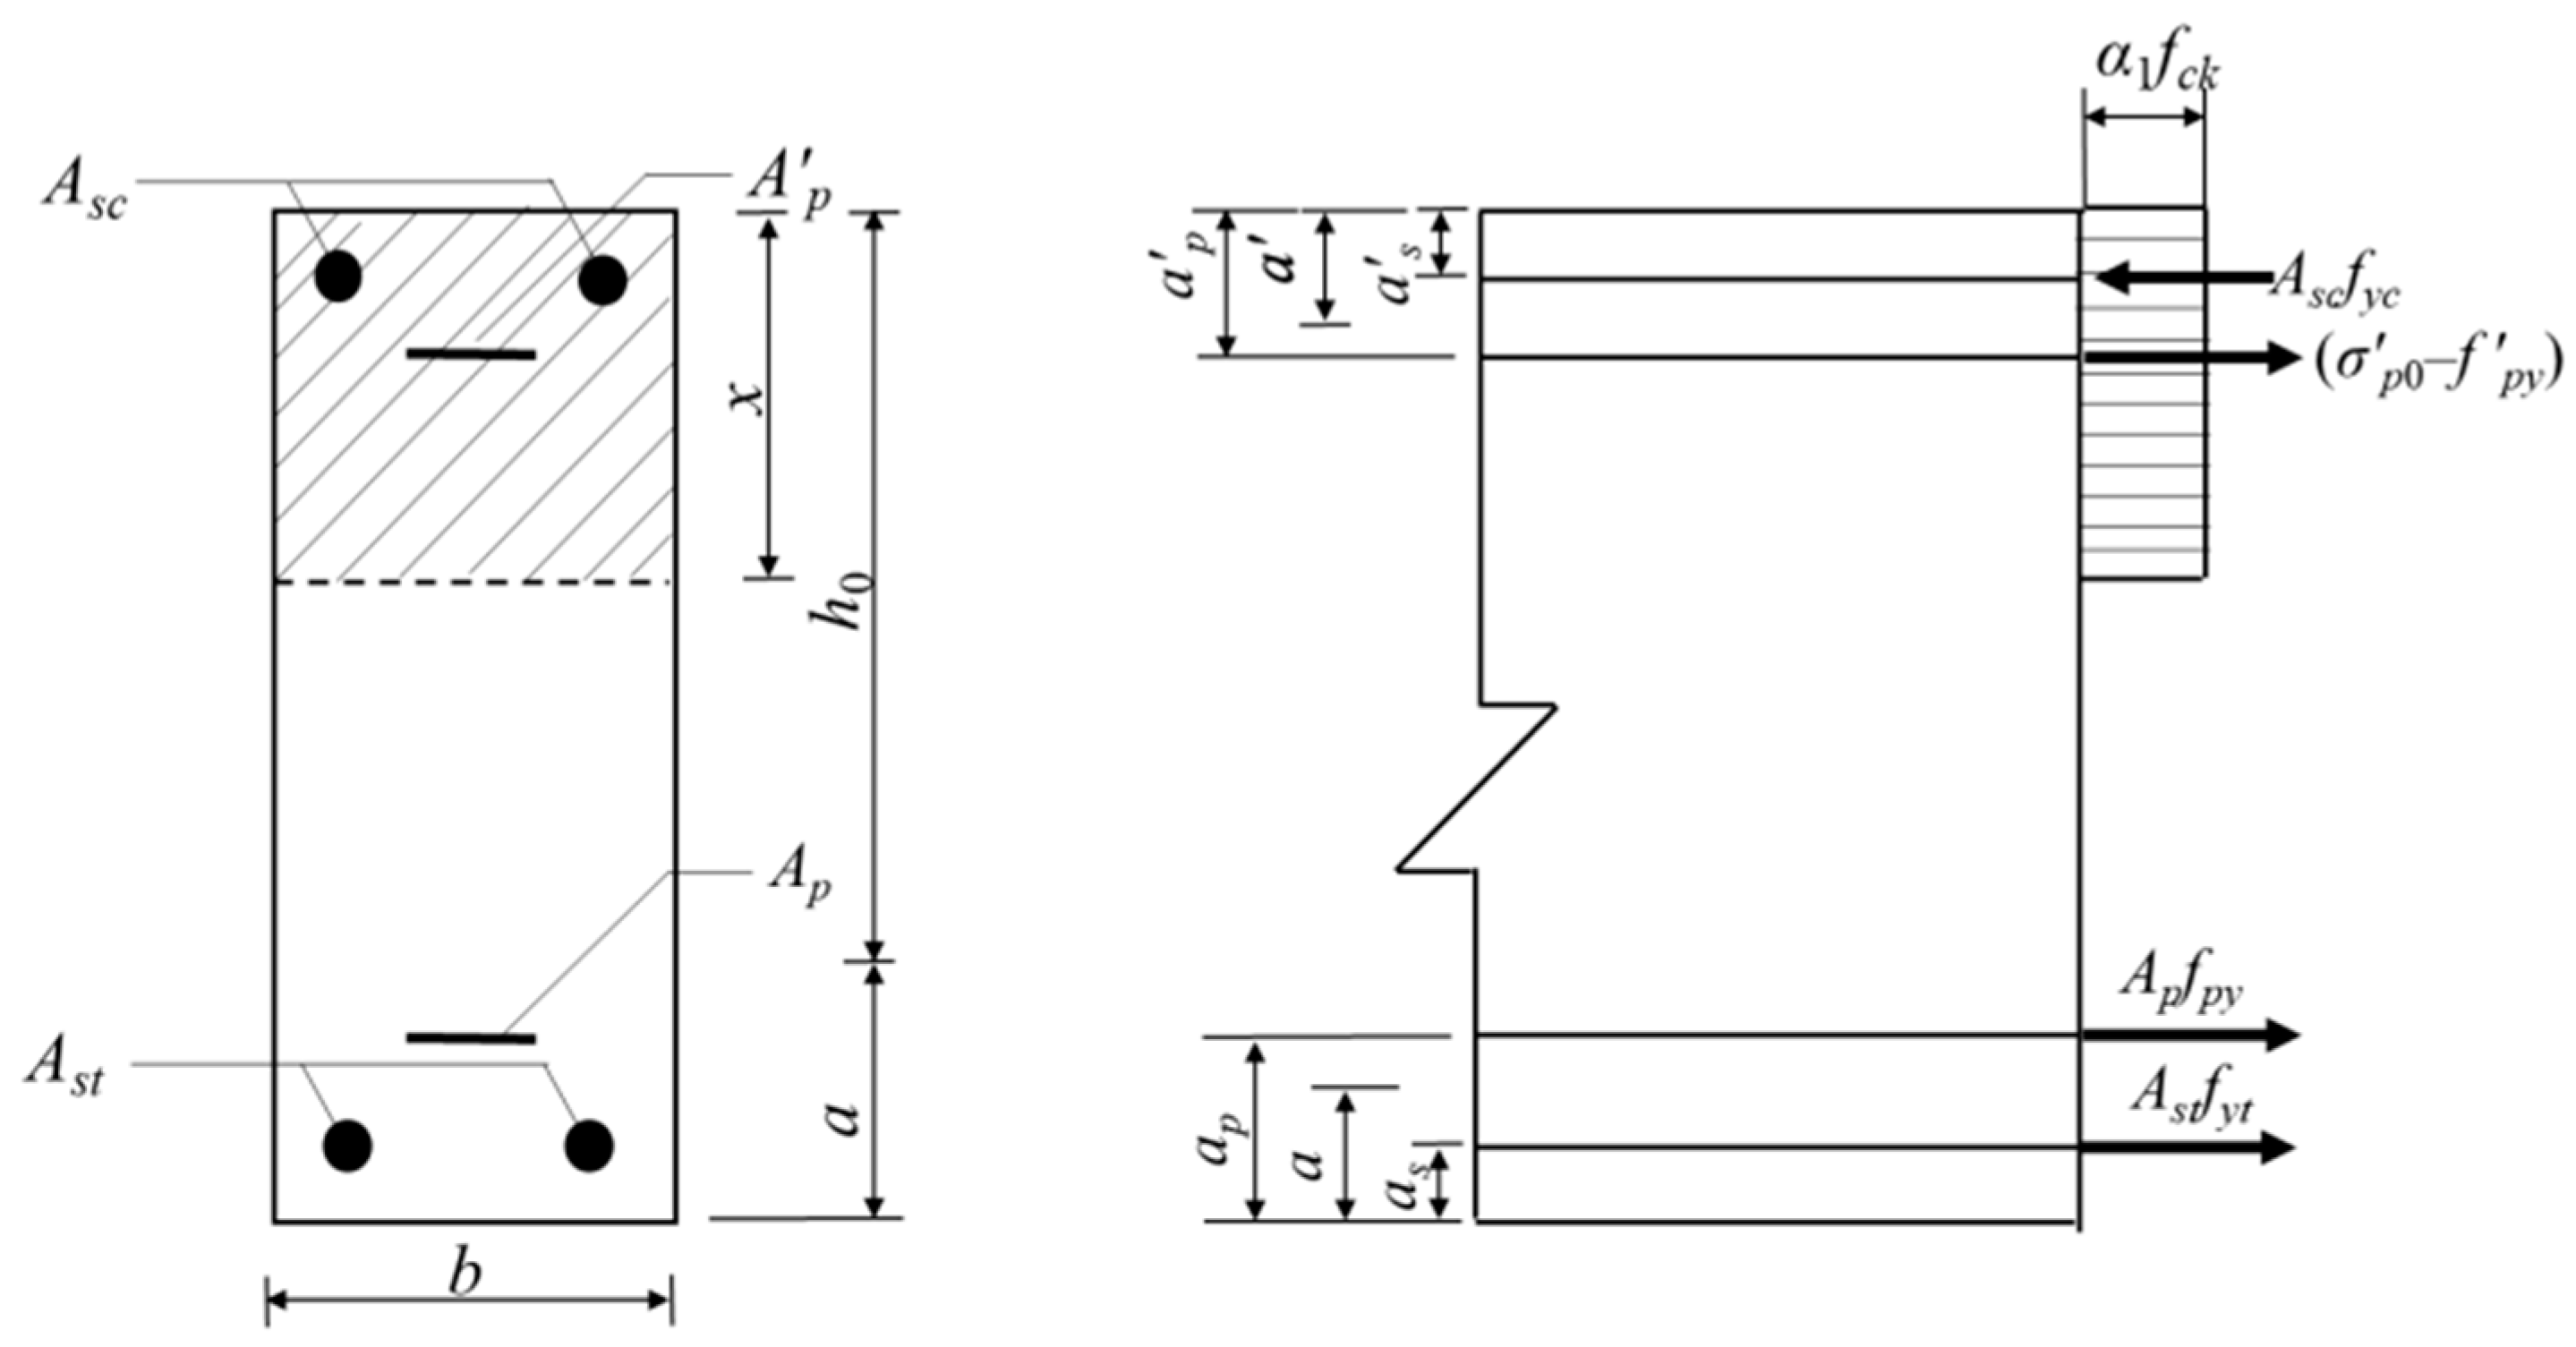
4.1. GB50010-2010 (Chinese Code: Design Code for Concrete Structure, 2010)

The flexural strength calculation for a rectangular section is identical to that of the first type of T-shaped sections. All the T-shaped test beams in the database belong to the first type of T-shaped sections. The standard formula provided below mainly focuses on the prediction of the flexural strength for rectangular sections. Figure 10 shows the section stress distribution diagram in normal section analysis of GB50010-2010 [39]. The calculation of the flexural strength for rectangular sections and the first type of T-shaped sections in GB50010-2010 is expressed as follows [39]:
α 1 f c k b x = f y t A s t f y c A s c + f p y A P + σ P 0 f p y A P
M c a l = α 1 f c k b x h 0 x 2 + f y c A s c h 0 a s σ P 0 f p y A P h 0 a p
where α1 is the ratio of the equivalent rectangular compressive stress to the maximum stress of the concrete compressive (fck); fck is the axial compressive strength of concrete; fyt and fyc are the design values of the tensile and compressive strengths of the non-prestressed reinforcement, respectively; x is the concrete depth of the compression zone; Ast and Asc are the sectional areas of the longitudinal tensile and compressive non-prestressed reinforcement, respectively; Ap and A P are the sectional areas of the longitudinal tensile and compressive prestressed steel, respectively; σ P 0 is the stress of the prestressed steel when the normal stress of the concrete at the resultant point of the longitudinal prestressed steel in the compression zone is equal to zero; b is beam width in the rectangular section or flange width in the first type of the T-shaped section; Mu is the calculated value of the flexural strength of the beam; h0 is the effective depth of the cross-section; and a s and a p are the distances from the resultant point of the longitudinal non-prestressed and prestressed steel in the compression zone to the compression edge of the cross-section, respectively. It should be pointed out that the compression zone of PC beams in the database is not equipped with prestressed steel, so the last item of Equations (6) to (7) is zero when calculating its flexural strength.
The concrete depth of the compression zone should meet the following conditions [39].
x ξ b h 0
x 2 a
where ξb is the height of the relative limit compression zone of concrete; that is, the limit of compression failure and tensile failure of reinforced concrete components, and a′ is the distance from the resultant point of all longitudinal compression reinforcements to the compression edge of the cross-section. When the longitudinal prestressed steel is not configured in the compression area or the prestressed steel’s stress in the compression zone is the tensile stress, a′ in Equation (9) is replaced by as.
Equation (8) ensures that the component does not undergo over-reinforcement failure. When the condition is not satisfied, take x = ξbh0. When Equation (9) is satisfied, the compressive reinforcement of the component will yield, and the stress of the compression reinforcement takes its yield strength in the calculation. If Equation (9) is not satisfied, then take x = 2a′.

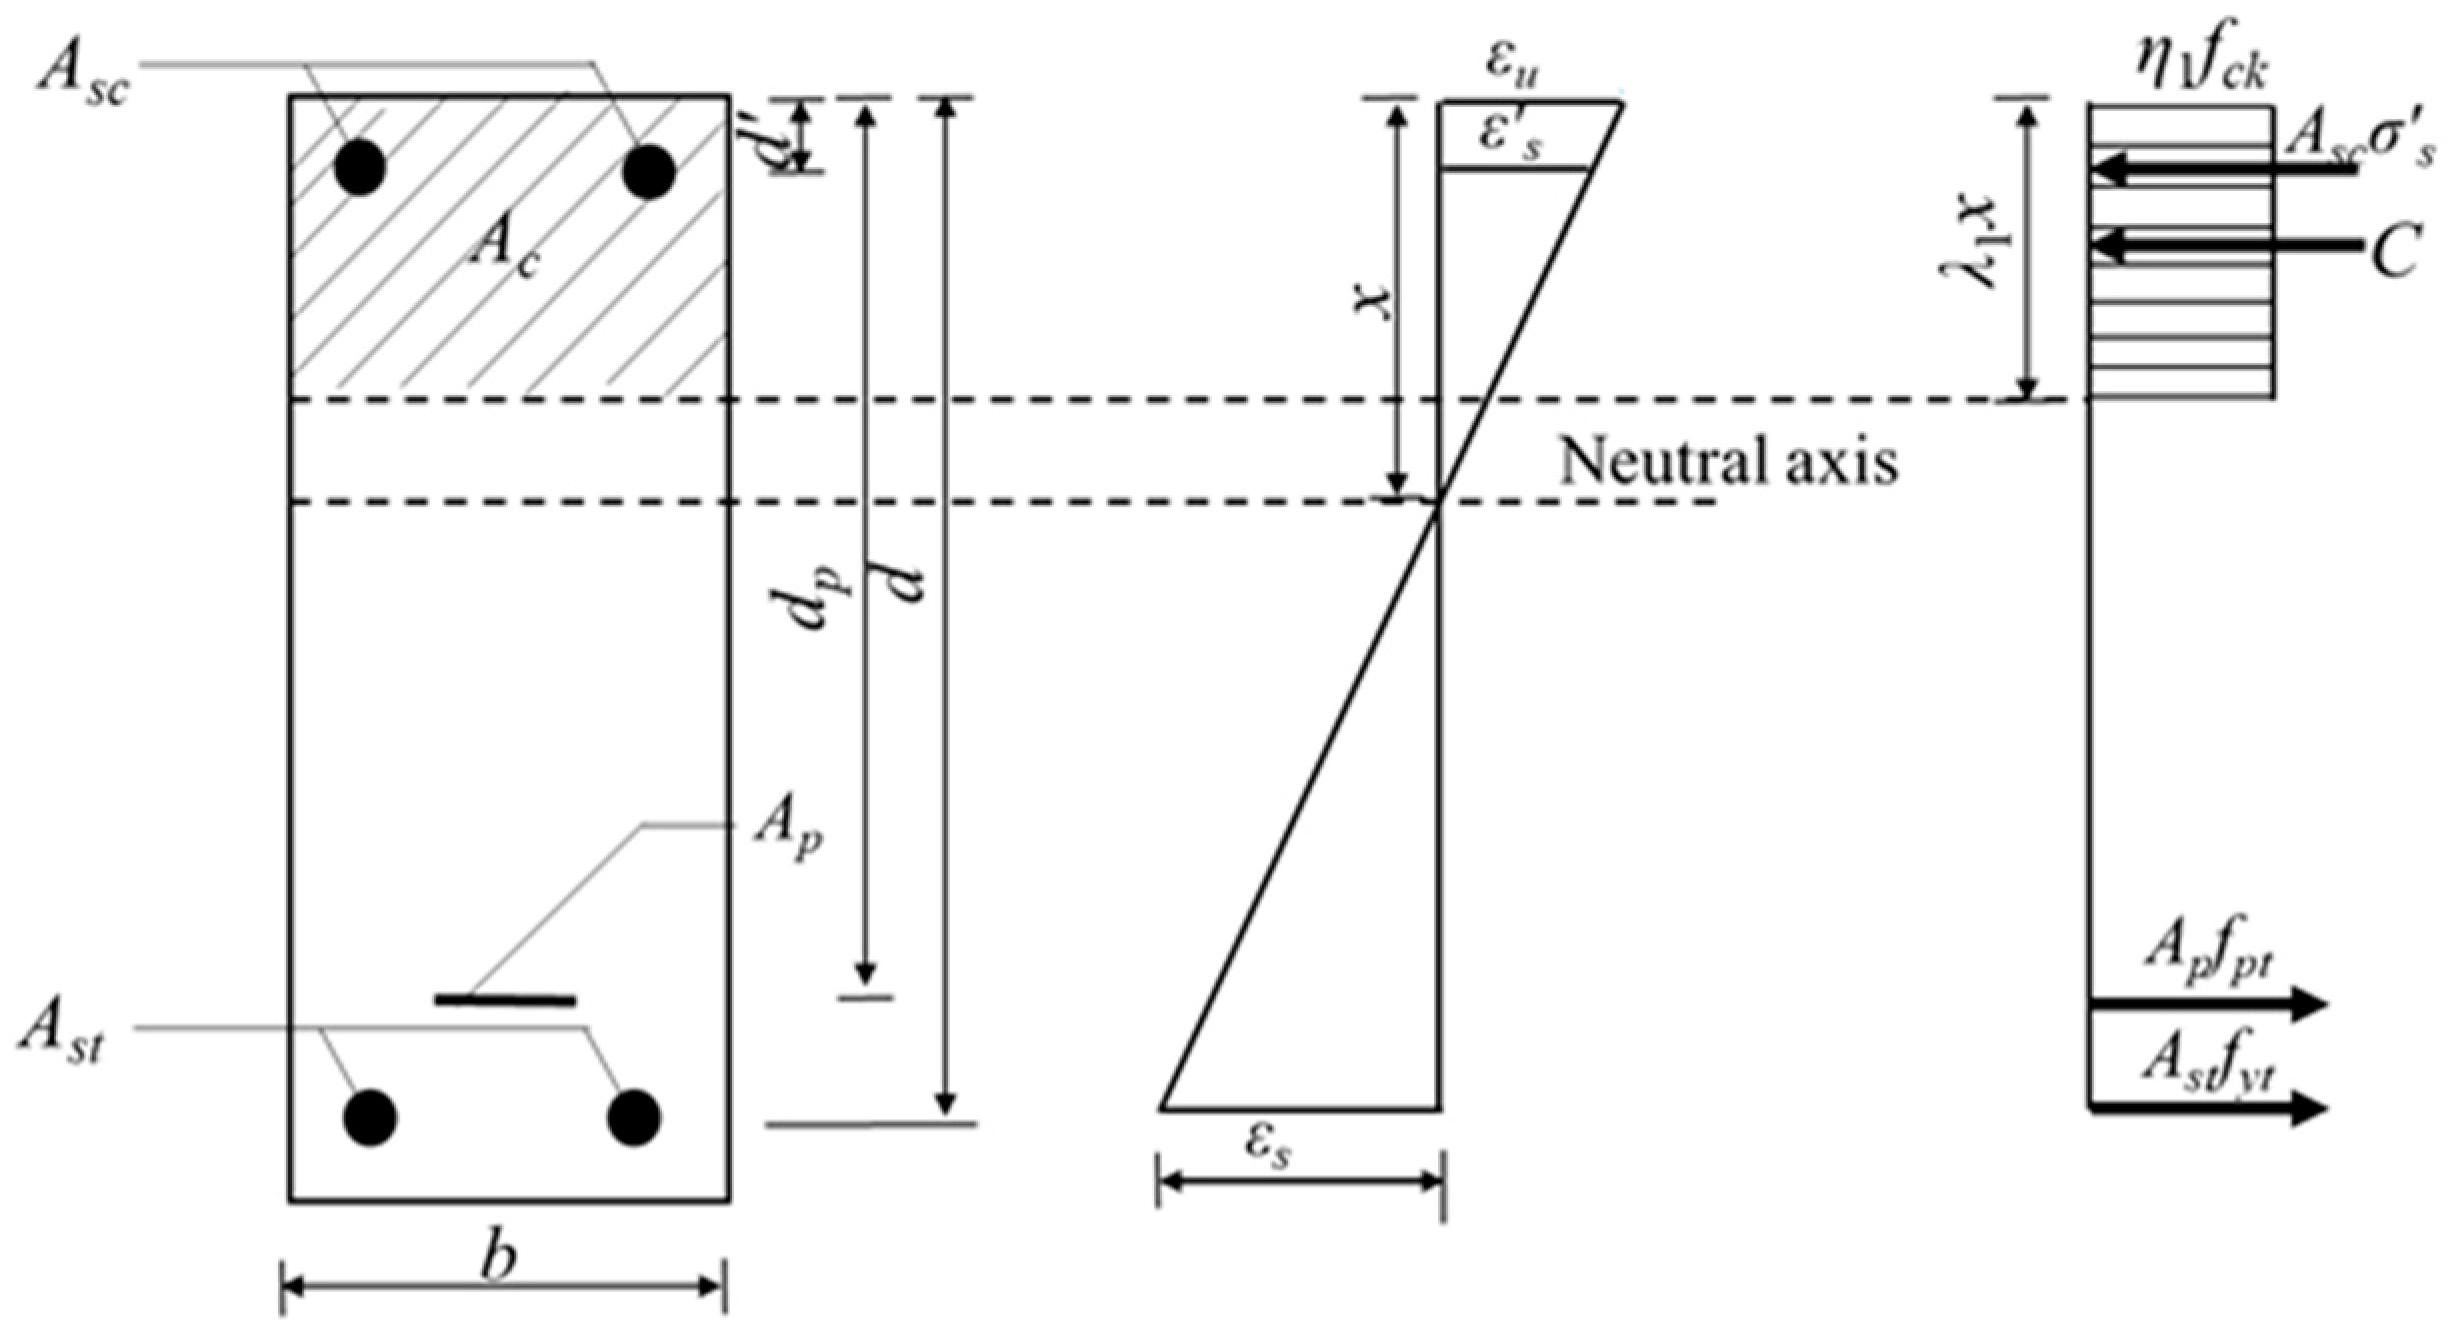
4.2. EN 1992-1-1:2004+A1 (Eurocode 2: Design of Concrete Structure-Part 1-1: General Rules and Rules for Buildings, 2014)

Figure 11 shows section stress distribution diagram in the normal section analysis of EN 1992-1-1:2004+A1 [40]. The calculations of the flexural strength of the rectangular sections and the first type of the T-shaped section are the same as that of the Chinese code. Eurocode 2 uses Equations (10) and (11) [40] to calculate the flexural strength:
η 1 f c k λ 1 x b = A s t f y t d λ 1 x 2 A s c σ s
M c a l = A p f p t d p λ 1 x 2 + A s t f y t d λ 1 x 2 A s c σ s λ 1 x 2 d
where η1 and λ1 are the same as α1 and β1 in the Chinese code; d, dp and d′ are distances from extreme compression fiber to centroid of longitudinal tension reinforcement, prestressed steel and longitudinal compression reinforcement, respectively; and σs is stress of the longitudinal compression reinforcement. If σsfyc, take σs = fyc; if σs < fyc, then σs is calculated according to Equation (12):
σ s = ε c u 2 E s x d x
where εcu2 is the ultimate compressive strain of the concrete and Es is the modulus of elasticity of the reinforcing steel.

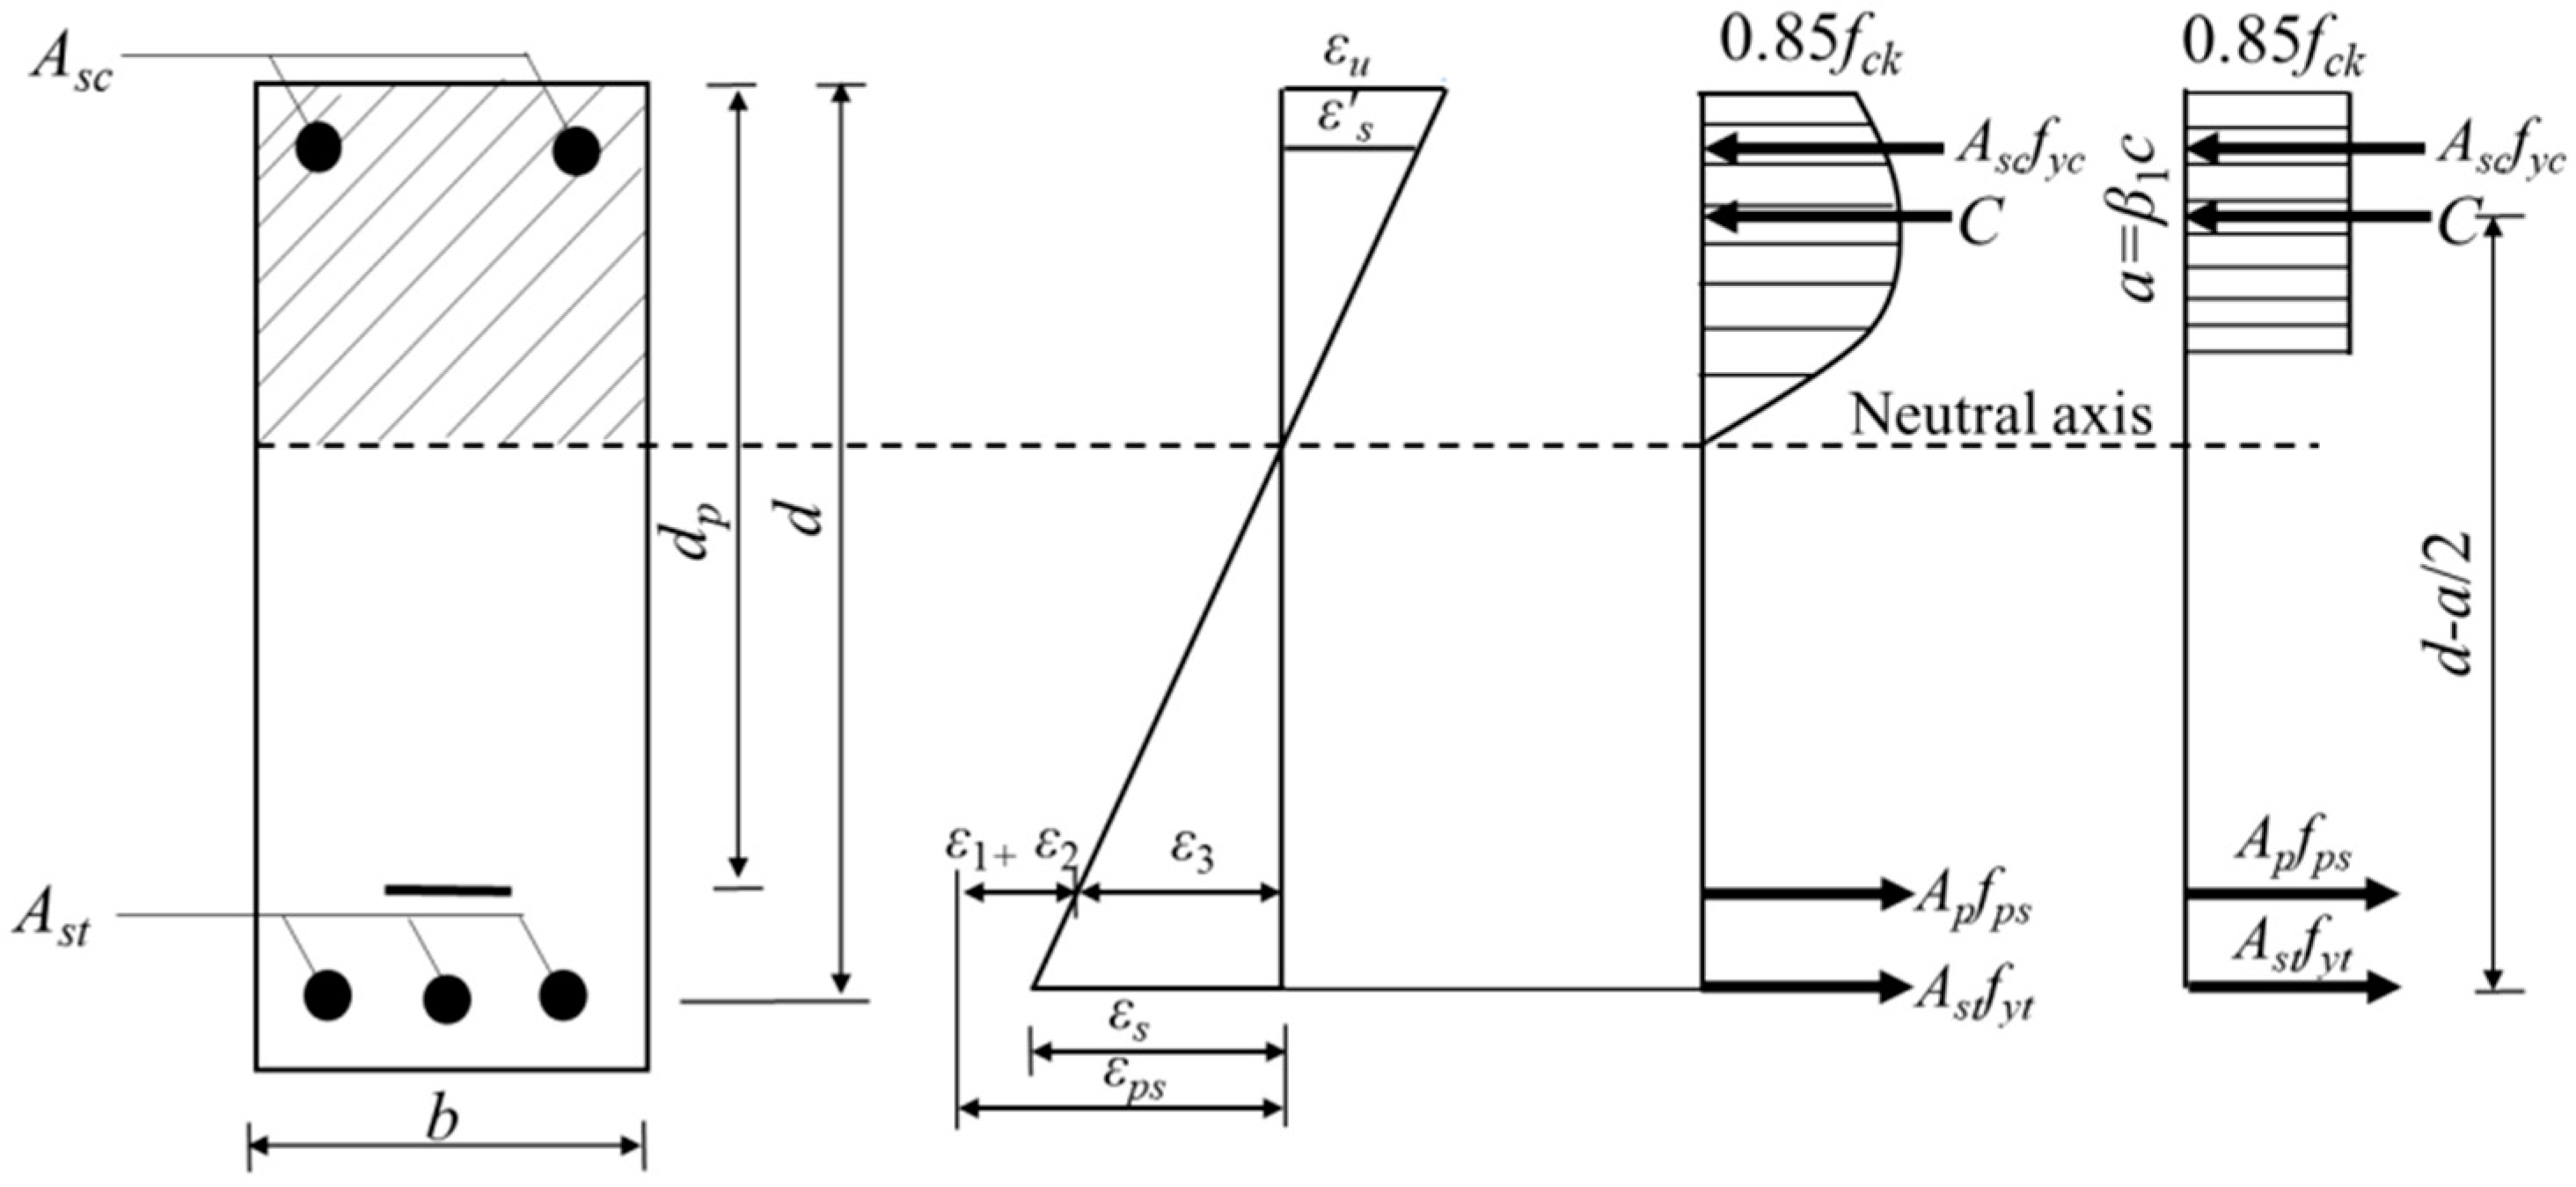
4.3. ACI 318-19 (ACI Standard: Building Code Requirements for Structural Concrete, 2019)

Figure 12 shows the section stress distribution diagram in a normal section analysis of ACI 318-19 [44]. When the longitudinal tensile and compressive reinforcement reach the yield stress, the flexural strength of the PC rectangular beam and the first type of T-shaped section is calculated as follows [44]:
0.85 f c k a b = f y t A s t f y c A s c + f p s A P
M c a l = f y t A s t d a 2 f y c A s c d a 2 + f p s A p d p a 2
where a is depth of the equivalent rectangular stress block, dp is the distance from the extreme compression fiber to the centroid of the prestressed steel and fps is the stress in the prestressed steel at the nominal flexural strength, which can be calculated using strain compatibility method and an approximate formula. When fse is larger than 0.5 fpu, the approximate formula used in the ACI Standard is as follows [44]:
f p s = f p u 1 γ p β 1 ρ b f p u f c k + d d p ω ω
where γp is factor for the type of prestressed steel, β1 is the factor that correlates to the depth of the equivalent rectangular compressive stress block to the depth of the neutral axis, ρb is ratio of Ap to bd, ω is tensile reinforcement index, given by ω = ρfyt/fck, ω′ is compression reinforcement index, given by ω′ = ρ‘fyt/fyc, and ρ and ρ′ are the ratios of Ast to bd and Asc to bd.
When the reinforcement index ωT exceeds the required maximum reinforcement index of 0.36β1, the nominal flexural strength is calculated according to the following formulas [44].
Rectangular   sections M n = 0.85 a d p 2 0.36 β 1 0.08 β 1 2
T-shaped   section      M n = f c k b d p 2 0.36 β 1 0.08 β 1 2 + 0.85 f c k b b w h f d p 0.5 h f

4.4. Calculation of the Flexural Capacity without Considering the Effects of Strand Corrosion

Figure 13 depicts a comparison between the experimental results and predictions of the three design codes. Additionally, statistic indicators reflecting the accuracy of the calculation are provided in Table 3. The influence of prestressed steel corrosion is not considered in the calculation of flexural strength by using Chinese code, Eurocode and ACI standard. As depicted in Figure 13, the calculated flexural strength of the CPC beams with the same arrangement of reinforcement is identical, resulting in a vertical line in the comparison diagram between the calculated and the experimental value, which is not consistent with the actual situation. Furthermore, as the corrosion rate of prestressed steel increases, the ratio of the experimental results to the prediction decreases, indicating a growing deviation between the calculated results of each specification and the test results. This is mainly due to the fact that these three specification formulae do not take into account the reduction in the cross-sectional area and its mechanical properties of the prestressed reinforcement, as well as the reduction in the cooperative working capacity of the prestressed reinforcement and the concrete caused by the corrosion of the prestressed reinforcement. As a result, the flexural capacity of CPC beams is overestimated. As the degree of corrosion of the prestressed reinforcement increases, the deteriorating effect of the corrosion of the prestressed reinforcement on the flexural behavior of the PC beam becomes more obvious.
In the three codes, the average value of the calculated flexural strength is greater than the average test results. The Chinese code is the largest, and the calculated value is 17.0% higher than the test value. Eurocode follows, with an average of 10.9%, and the American standard is the smallest, with an average of 4.8%. It can be concluded that it is unsafe to directly predict the flexural strength of CPC beams by using the three standard formulas without taking into account the impact of corrosion. Furthermore, the deviation between the flexural bearing capacities of the CPC beam, calculated using the ACI standard and the test value, is the smallest. The satisfactory predictive performance of the test results according to the ACI standard is also confirmed by the statistical evaluation given in Table 3.

5. A Proposal for a Flexural Strength Model for CPC Beams on the Basis of the ACI Standard

As discussed in Section 4.4, none of the three codes can predict the flexural capacity of CPC beams well without considering the corrosive effects of steel strands. Therefore, there is a clear need to propose a new model that is precise and straightforward to utilize in predicting the flexural capacity of CPC beams. Since the ACI standard has the smallest deviation in predicting the flexural strength of CPC beams, as discussed in Section 4, a calculation model is proposed for evaluating the flexural strength of CPC beams on the basis of the ACI standard. The calculation model incorporates the impact corrosion on the reduction in the cross-section and the degradation in mechanical performance of the prestressed steel.

5.1. Deterioration of Mechanical Properties of Corroded Prestressed Reinforcement

Corrosion can cause the degradation of the mechanical performance of the prestressed steel, as well as brittle fracture under high stress. Based on previous research findings [22,45], the model for the degradation of mechanical performance of corroded prestressed steel can be expressed as follows:
f p u η = 1 0.75 η p f p u 0
E p η = 0.1 + 0.9 e 26 η p E p
ε s u η = e 2.556 η p ε s u 0
where fpu0 and fpuη are the ultimate tensile strength of prestressed steel before and after corrosion; Ep and E are the elastic modulus of prestressed steel before and after corrosion; εsu0 and εsuη are the ultimate strain of prestressed steel before and after corrosion; and ηp is the section corrosion rate of prestressed steel.

5.2. Proposal of New Model Based on ACI Standard

Considering the decrease in sectional area and degradation in ultimate tensile strength due to the corrosion of prestressed steel, the stress in corroded prestressed steel is determined as follows:
f p s η = f p u η 1 γ p β 1 ρ b η f p u η f c + d d p ω ω
where fpsη is stress of corroded prestressed steel. Because the stress–strain curve of corroded prestressed steel is not universally recognized, fpsη is calculated using the approximate method based on the ACI standard. ρ is ratio of Apηs to bd, which considers the decrease in the sectional area due to corrosion.
The flexural strength of CPC beams of the rectangular section and first type of T-shaped section can be calculated as follows:
0.85 f c k a b = f y t A s t f y c A s c + f p s η A p s η
M c a l η = f y t A s t d a 2 f y c A s c d a 2 + f p s η A p s η d p a 2
where Apsη is the sectional area of the corroded prestressed steel and Mcalη is the calculated flexural strength of the CPC beams.

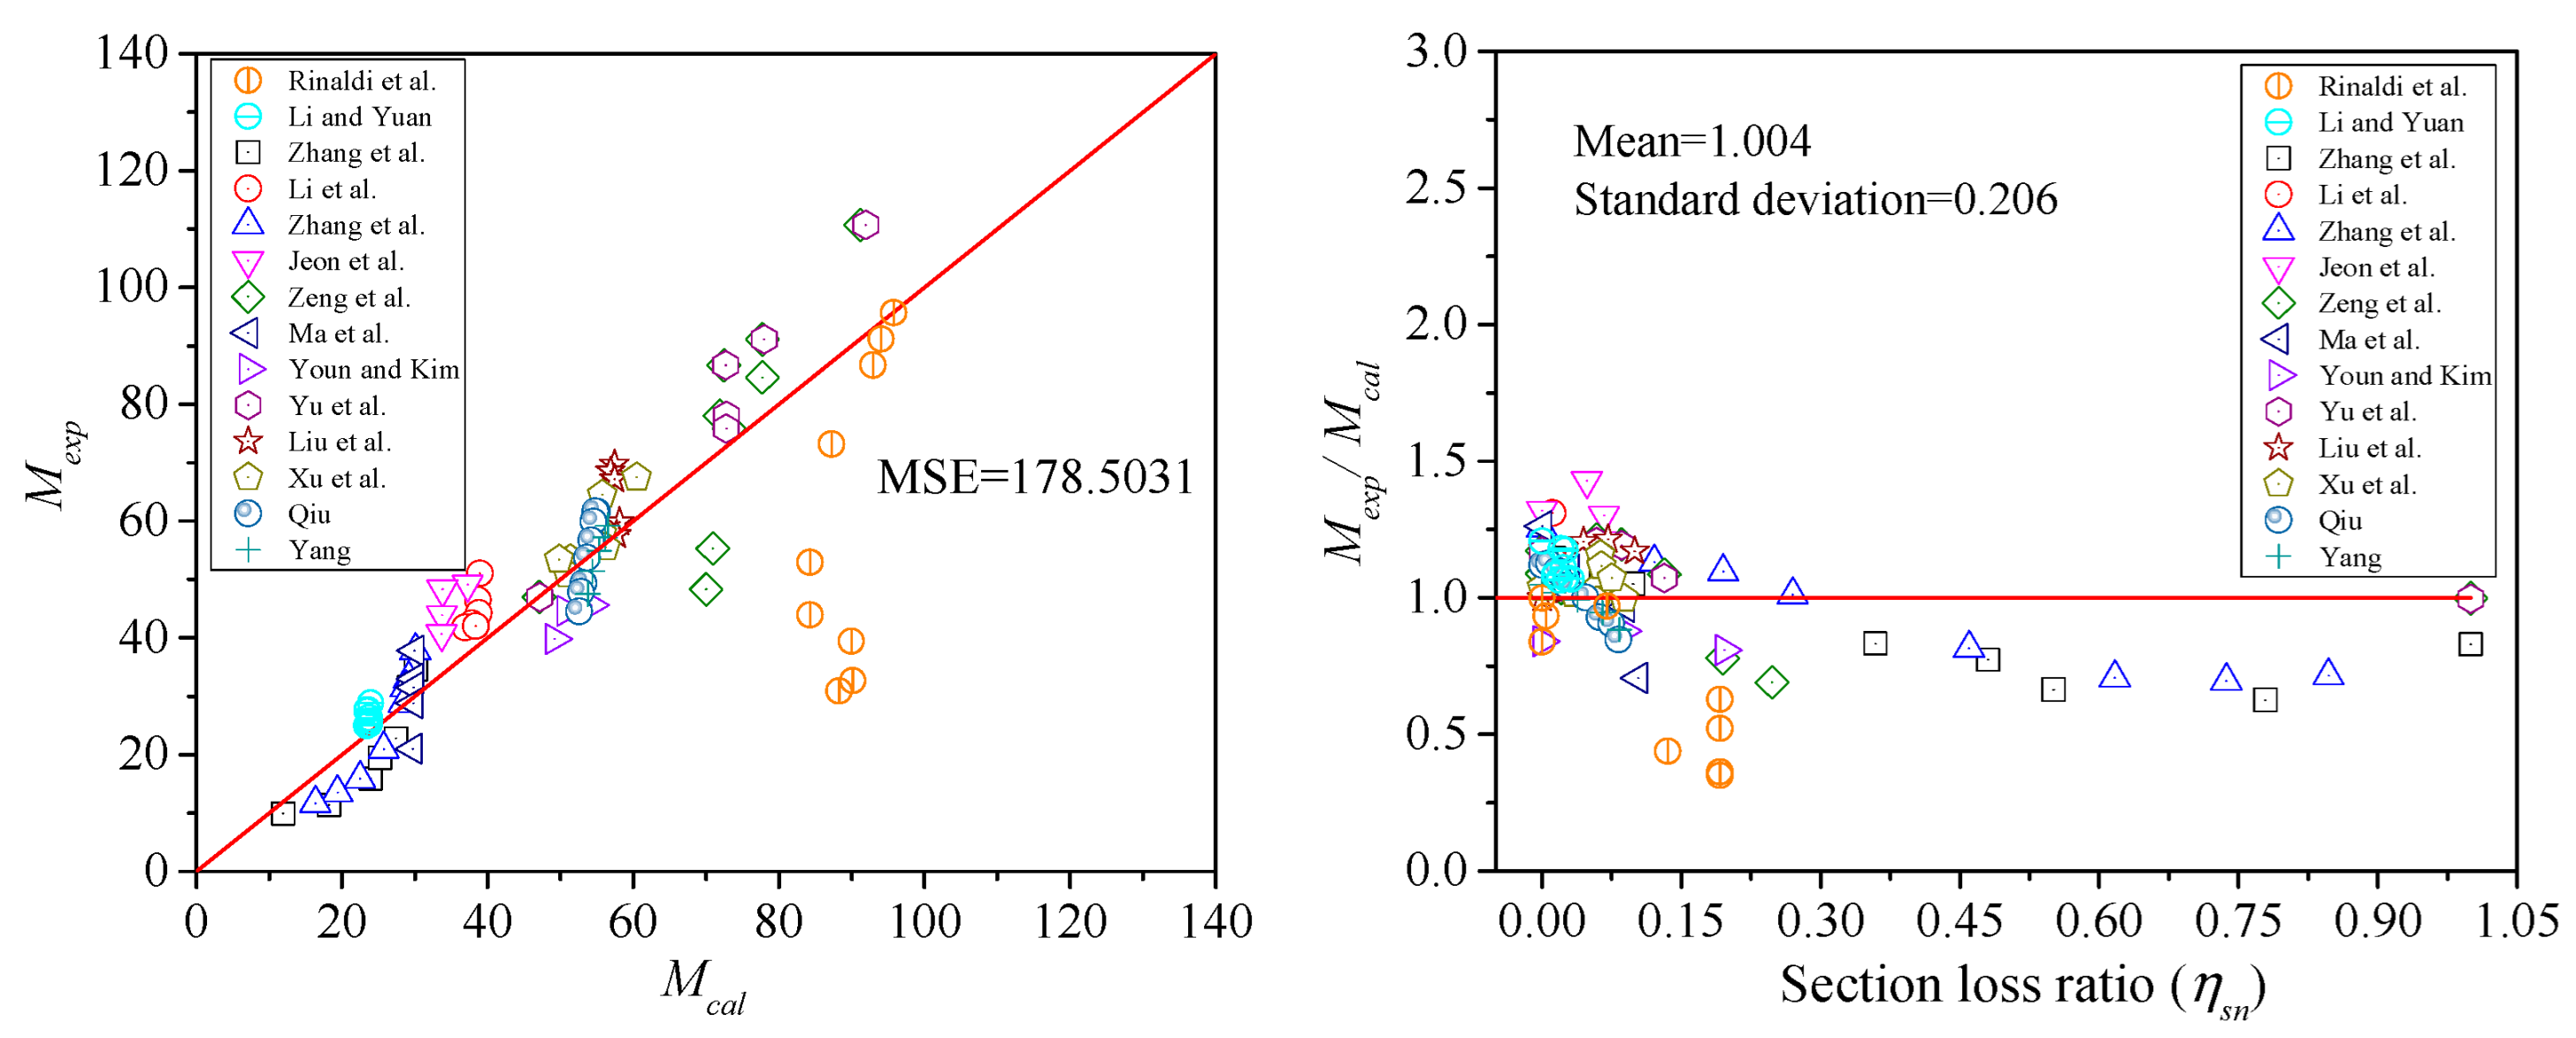
5.3. Verification of Proposed Model

To validate the proposal, the above-mentioned test database of CPC beams is still used for the comparative analysis. In Figure 14, a comparison is presented between the flexural bearing capacities predicted by the proposal and the actual experimental results. After considering the corrosion effect of the prestressed steel, the calculated values of the model for Li and Yuan [19], Zhang et al. [24], Zhang et al. [29], Zeng et al. [35], Ma et al. [31], Yu et al. [22], Liu et al. [37], Xu et al. [38], Qiu [26] and Yang [27] are more closer to the test values. Evidently, the proposal demonstrates better accuracy and consistency in predicting the flexural strength of CPC beams. Moreover, the statistical evaluation in Table 3 also verifies the prediction of the test results by the proposal. Additionally, the mean and standard deviation for the total prediction/test ratio is 1.004 and 0.206.
From Figure 14, it is evident that the discrepancies between the model prediction and test results of Rinaldi et al. [20] and Zhang et al. [29] have a larger deviation than other datasets. This may be because the prestressed steel used in the Rinaldi et al. [20] test is a single prestressed steel, but the degradation law of the mechanical performance is based on the corroded steel strand. Both of the degradation laws are not necessarily similar. In the test data of Zhang et al. [29], the corrosion rate of prestressed steel is up to 84.74%, while the mechanical performance degradation law of prestressed steel in this paper is fitted below the corrosion rate of 21%, which is much lower than the corrosion rate of the test beam. The mechanical performance degradation law used in the proposed model may not fully adapt to the very severe corrosion situation, resulting in calculation deviation.

6. Conclusions

In this research, 104 sets of flexural tests on CPC beams were gathered from a range of published sources. Various significant factors influencing the flexural strength were examined, and the applicability and accuracy of the Chinese code, Eurocode and ACI standard in predicting the flexural strength of CPC beams were assessed. Subsequently, a novel prediction model was developed, and its validity was confirmed. The key findings and contributions are outlined as follows.
(1) A standardized database with 104 sets of CPC test data is established, in which the concrete compressive strength and the corrosion rate of prestressed steel are unified.
(2) The influence of the main parameters on the flexural strength of CPC rectangular and T-beams is almost the same. Compared with other influencing parameters, the beam width, shear span ratio, section corrosion rate of the prestressed steel and prestressing ratio have an obvious influence on the flexural strength of CPC beams.
(3) The established database of flexural tests shows that the residual flexural strength of CPC beams is overestimated by 17.0%, 10.9% and 4.8% in the Chinese code, Eurocode and ACI standard, respectively, compared to the actual flexural test results. Therefore, it is unsafe to evaluate the flexural strength of CPC beams directly using the three standard formulas without considering the influence of corrosion.
(4) Compared to experimental flexural results, the ACI standard provides accurate and effective predictions for the residual flexural strength of CPC beams by only considering the reduction in cross-section and the deterioration in mechanical performance caused by the corrosion of prestressed steel.

Author Contributions

Software, writing—original draft, funding acquisition, H.L.; methodology, writing—review and editing, visualization, funding acquisition, Z.P.; methodology, software, investigation, writing—review and editing, Y.Y.; conceptualization, formal analysis, resources, X.W.; data curation, supervision, project administration, H.T., methodology, validation, iinvestigation, F.M.; visualization, data curation, methodology, validation, L.Z. All authors have read and agreed to the published version of the manuscript.

Funding

This study was partially supported by the National Natural Science Foundation of China (Grant No. 52208166 and 52108135), Science and Technology Innovation Program of Hunan Province (Grant No. 2022RC1186), Hunan Provincial Natural Science Foundation Project of China (Grant No.2022JJ50267, 2023JJ30111 and 2022JJ50283), and Hunan Provincial Department of Education Scientific Research Youth Project (Grant No. 21B0716) and Key project (Grant No. 22A0561), Science and Technology Planning Project of Guichi District, Chizhou City (Grant No. GCKJ202210), National Undergraduate Innovation and Entrepreneurship Training Program (Grant No. S202311527043), Anhui Province Key Research and Development Program (Grant No. 2022o07020003), Scientific and Technological Project for Housing and Urban–Rural Development in Anhui Province (Grant No. 2023-YF-112 and 2023-RK055). These supports are gratefully acknowledged.

Data Availability Statement

The data presented in this study are available from the corresponding author upon request. The data are not publicly available due to privacy.

Conflicts of Interest

The author Zhicheng Pan was employed by the companies Sinohydro Engineering Bureau 8 Co., Ltd. and Power China Chizhou Changzhi Prefabricated Construction Co., Ltd. The author Fanjun Ma was employed by the companies Sinohydro Engineering Bureau 8 Co., Ltd. The research findings are attributed to the collaborative project between industry, university, and research institutions. The remaining authors declare that this research was conducted in the absence of any commercial or financial relationships that could be construed as a potential conflicts of interest.

Nomenclature

A0Cross-sectional area of the prestressed reinforcement
AminMinimum remaining cross-sectional area of the prestressed reinforcement after corrosion
AscCross-sectional area of the compression non-prestressed reinforcement
AstCross-sectional area of the tensile non-prestressed reinforcement
A pOriginal cross-sectional area of the tensile prestressed reinforcement
ApCross-sectional area of the compression prestressed reinforcement
ApsηCross-sectional area of prestressed reinforcement after corrosion
aDepth of equivalent rectangular stress block
asDistance from the resultant force of the prestressed steel and the ordinary tensile steel bar to the edge of the beam Section in tension zone
bBeam width, and the data in brackets are the flange width of the T-beam
d0Diameter of the prestressed reinforcement
dminDiameter of the prestressed reinforcement after corrosion
dpDistance from extreme compression fiber to centroid of prestressed reinforcement
EpElastic modulus of uncorroded prestressed reinforcement
EElastic modulus of corroded prestressed reinforcement
EsModulus of elasticity of the reinforcing steel
fckPrismatic compressive strength of the concrete
fcu,150Cube compressive strength of concrete
fpeEffective prestress
fpsStress in prestressed reinforcement at nominal flexural strength
fpsηStress in corroded prestressed reinforcement at nominal flexural strength
fptUltimate tensile strength of prestressed reinforcement
fpu0Ultimate tensile strength of uncorroded prestressed reinforcement
fpytYield strength of the tensile prestressed reinforcement
fycYield strength of compression non-prestressed reinforcement
fytYield strength of tensile non-prestressed reinforcement
fcyl,150Compressive strength of concrete obtained from cylinder tests of 150 × 300 mm specimens
hBeam depth, and the data in brackets are the flange depth of T-beam
h0Effective depth of the cross-section
McalηCalculated the flexural capacity of CPC beams
MexpExperimental ultimate flexural capacity of CPC beams
Mu,expNormalized ultimate flexural stress
m0Initial mass of the prestressed reinforcement before corrosion
mrRemaining mass of the prestressed reinforcement after corrosion
PPRPrestressing ratio
XMaximum corrosion depth of the prestressed steel
xConcrete depth of compression zone
ηsnSection loss ratio of prestressed reinforcement
ηwtWeight loss ratio of prestressed reinforcement
εcu2Ultimate compressive strain in the concrete
εsu0Ultimate strain of uncorroded prestressed reinforcement
εsuηUltimate strain of corroded prestressed reinforcement
λShear span to depth ratio

References

  1. Gu, X.L.; Jin, X.Y.; Zhou, Y. Prestressed Concrete Structures. In Basic Principles of Concrete Structures; Gu, X.L., Jin, X.Y., Zhou, Y., Eds.; Springer: Berlin/Heidelberg, Germany, 2016; pp. 415–495. [Google Scholar]
  2. Nassiraei, H. Probability distribution models for the ultimate strength of tubular T/Y-joints reinforced with collar plates at room and different fire conditions. Ocean. Eng. 2023, 270, 113557. [Google Scholar] [CrossRef]
  3. Zhang, X.B.; Wang, L.; Tang, S.H.; Cui, H.T.; Xie, X.N.; Wu, H.; Liu, X.H.; Yang, D.L.; Xiang, P. Investigations on the shearing performance of ballastless CRTS II slab based on quasi-distributed optical fiber sensing. Opt. Fiber Technol. 2023, 75, 103129. [Google Scholar] [CrossRef]
  4. Ding, Y.N.; Ning, X.L. Prestressed Concrete. In Reinforced Concrete: Basic Theory and Standards; Ding, Y.N., Ning, X.L., Eds.; Springer Nature: Singapore, 2023; pp. 355–401. [Google Scholar]
  5. Wang, L. Strand Corrosion in Prestressed Concrete Structures, 1st ed.; Springers: Singapore, 2023. [Google Scholar]
  6. ACI PRC-222.2R-14; Report on Corrosion of Prestressing Steels. American Concrete Institute: Farmington Hills, MI, USA, 2014.
  7. Woodward, R.J. Collapse of a segmental post-tensioned concrete bridge. In Transportation Research Record; Transportation Research Board: Washington, DC, USA, 1989. [Google Scholar]
  8. Campione, G. Simplified Model of PC Concrete Beams with Corroded Strands in Highway Viaduct: Case Study and Analytical Modeling. J. Perform. Constr. Facil. 2021, 35, 04021069. [Google Scholar] [CrossRef]
  9. Ma, H.N.; Au, F.K.; Mickleborough, N.; Lim, E.H.; Chan, K.Y.; Chung, P.H. Investigation Report on Prestressing Tendon Failure Incident at Concrete Viaduct of Shenzhen Bay Bridge-Hong Kong Section; Highways Department: Hong Kong, China, 2019. [Google Scholar]
  10. Lu, Z.H.; Li, F.; Zhao, Y.G. An Investigation of Degradation of Mechanical Behaviour of Prestressing Strands Subjected to Chloride Attacking. In Proceedings of the International Conference on the Durability of Concrete Structures, Shenzhen, China, 30 June–1 July 2016. [Google Scholar]
  11. Zhang, W.P.; Li, C.K.; Gu, X.L.; Zeng, Y.H. Variability in cross-sectional areas and tensile properties of corroded prestressing wires. Constr. Build. Mater. 2019, 228, 116830. [Google Scholar] [CrossRef]
  12. Pan, Z.; Ma, F.; Cao, B.; Mo, Z.; Liu, J.; Shi, R.; He, Z. Optimization of the Mechanical Properties of Bolted Connections between Concrete-Filled Tubular Columns and Steel Beam with Reinforcing Rings. Buildings 2024, 14, 782. [Google Scholar] [CrossRef]
  13. Andrade, C. Initial steps of corrosion and oxide characteristics. Struct. Concr. 2020, 21, 1710–1719. [Google Scholar] [CrossRef]
  14. Jeon, C.H.; Nguyen, C.D.; Shim, C.S. Assessment of Mechanical Properties of Corroded Prestressing Strands. Appl. Sci. 2020, 10, 4055. [Google Scholar] [CrossRef]
  15. Liu, X.G.; Zhang, W.P.; Gu, X.L.; Ye, Z.W. Probability distribution model of stress impact factor for corrosion pits of high-strength prestressing wires. Eng. Struct. 2021, 230, 111686. [Google Scholar] [CrossRef]
  16. Shi, R.; Pan, Z.; Lun, P.; Zhan, Y.; Nie, Z.; Liu, Y.; Mo, Z.; He, Z. Research on Corrosion Rate Model of Reinforcement in Concrete under Chloride Ion Environments. Buildings 2023, 13, 965. [Google Scholar] [CrossRef]
  17. Wu, T.T.; Chen, W.Z.; Li, H.; Xu, J.S.; Zhang, B. Experiment and Probabilistic Prediction on Mechanical Properties of Corroded Prestressed Strands under Different Strain Levels. J. Mater. Civil. Eng. 2022, 34, 04022164. [Google Scholar] [CrossRef]
  18. Li, H.; Yang, Y.M.; Wang, X.Z.; Tang, H. Effects of the position and chloride-induced corrosion of strand on bonding behavior between the steel strand and concrete. Structures 2023, 58, 105500. [Google Scholar] [CrossRef]
  19. Li, F.M.; Yuan, Y.S. Experimental study on bending property of prestressed concrete beams with corroded steel strands. J. Build. Mater. 2010, 31, 78–84. (In Chinese) [Google Scholar] [CrossRef]
  20. Rinaldi, Z.; Imperatore, S.; Valente, C. Experimental evaluation of the flexural behavior of corroded P/C beams. Constr. Build. Mater. 2010, 24, 2267–2278. [Google Scholar] [CrossRef]
  21. Jeon, C.H.; Shim, C.S. Flexural Behavior of Post-Tensioned Concrete Beams with Multiple Internal Corroded Strands. Appl. Sci. 2020, 10, 7994. [Google Scholar] [CrossRef]
  22. Yu, Q.Q.; Gu, X.L.; Zeng, Y.H.; Zhang, W.P. Flexural behavior of Corrosion-Damaged prestressed concrete beams. Eng. Struct. 2022, 272, 114985. [Google Scholar] [CrossRef]
  23. Minh, H.; Mutsuyoshi, H.; Niitani, K. Influence of grouting condition on crack and load-carrying capacity of post-tensioned concrete beam due to chloride-induced corrosion. Constr. Build. Mater. 2007, 21, 1568–1575. [Google Scholar] [CrossRef]
  24. Zhang, X.; Wang, L.; Zhang, J.; Liu, Y. Corrosion-induced flexural behavior degradation of locally ungrouted post-tensioned concrete beams. Constr. Build. Mater. 2017, 134, 7–17. [Google Scholar] [CrossRef]
  25. Wang, L.; Dai, L.Z.; Zhang, X.H.; Zhang, J.R. Effect of corrosion on deformation compatibility between prestressed reinforcement and concrete. J. Saf. Environ. 2014, 14, 5–10. (In Chinese) [Google Scholar] [CrossRef]
  26. Qiu, Y.G. Experimental and Numerical Investigation of Flexural Performance of Corrosion-Affected High-Speed Rail Box Beam. Master’s Thesis, Central South University, Changsha, China, 2014. (In Chinese). [Google Scholar]
  27. Yang, X.D. Study on Flexural Performance and Reliability Analysis of Corrosion-Affected Simply-Supported Box Girder for High Speed Railway. Master’s Thesis, Central South University, Changsha, China, 2016. (In Chinese). [Google Scholar]
  28. Zhou, Q.H.; Lu, Z.H.; Li, H. Experimental study on flexural behavior of corroded high-speed railway box girder. Build. Struct. 2021, 51 (S1), 1514–1521. (In Chinese) [Google Scholar]
  29. Zhang, X.H.; Wang, L.; Zhang, J.R.; Ma, Y.F.; Liu, Y.M. Flexural behavior of bonded post-tensioned concrete beams under strand corrosion. Nucl. Eng. Des. 2017, 313, 414–424. [Google Scholar] [CrossRef]
  30. Dai, L.Z.; Wang, L.; Bian, H.B.; Zhang, J.R.; Zhang, X.H.; Ma, Y.F. Flexural Capacity Prediction of Corroded Prestressed Concrete Beams Incorporating Bond Degradation. J. Aerosp. Eng. 2019, 32, 04019027. [Google Scholar] [CrossRef]
  31. Ma, Y.F.; Liu, Y.; Guo, Z.Z.; Wang, L.; Zhang, J.R. Calculation method for flexural capacity of corroded PC beams considering bond degradation. J. Disaster Prev. Mitig. Eng. 2020, 40, 639–646. (In Chinese) [Google Scholar] [CrossRef]
  32. Lu, Z.H.; Zhou, Q.H.; Li, H.; Zhao, Y.-G. A new empirical model for residual flexural capacity of corroded post-tensioned prestressed concrete beams. Structures 2021, 34, 4308–4321. [Google Scholar] [CrossRef]
  33. Bhagwat, Y.; Nayak, G.; Bhat, R.; Kamath, M. A prediction model for flexural strength of corroded prestressed concrete beam using artificial neural network. Cogent Eng. 2023, 10, 2187657. [Google Scholar] [CrossRef]
  34. Li, C.Q.; Ge, W.J.; Cao, D.F. Mechanical behaviors of prestressed concrete beams after stress corrosion of prestressed reinforcement. J. Nanjing Univ. Sci. Technol. 2014, 38, 811–817. (In Chinese) [Google Scholar] [CrossRef]
  35. Zeng, Y.H.; Huang, Q.H.; Gu, X.L.; Zhang, W.P. Experimental Study on Bending Behavior of Corroded Post-Tensioned Concrete Beams. In Earth and Space 2010: Engineering, Science, Construction, and Operations in Challenging Environments; ASCE: Reston, VA, USA, 2010. [Google Scholar]
  36. Youn, S.; Kim, E.K. Deterioration of bonded post-tensioned concrete bridges and research topics on the strength evaluation in isarc. In Proceedings of the JSCE–KSCE Joint Seminar Maintenance and Management Strategy of Infrastructures in Japan and Korea, Kusatsu, Japan, 20 September 2006. [Google Scholar]
  37. Liu, Y.Y.; Fan, Y.F.; Yu, J.; Li, Q.C. Flexural behavior test of corroded prestressed concrete beams under chloride environment. Acta Mater. Compos. Sin. 2020, 37, 707–715. (In Chinese) [Google Scholar] [CrossRef]
  38. Xu, K.C.; Cao, Y.M.; Chen, Z.C.; Chen, M.C.; Fu, B.; Zhu, D.M. Study on flexural behavior of prestressed concrete beams under simulated acid rain corrosion. Chin. J. Comput. Mech. 2019, 36, 124–131. (In Chinese) [Google Scholar]
  39. GB50010-2010; Design Code for Concrete Structure. China Building Industry Press: Beijing, China, 2010. (In Chinese)
  40. 1992-1-1:2004+A1:2014(E); Eurocode2: Design of Concrete Structures-Part 1-1: General Rules and Rules for Buildings. European Committee for Standardization: Brussels, Belgium, 2014.
  41. Xue, C.Y. Research on Bond Performance between Corroded Pre-Stressing Steel Strand and Concrete under Chloride Environment. Ph.D. Thesis, Changsha University of Science and Technology, Changsha, China, 2013. (In Chinese). [Google Scholar]
  42. Lu, Z.H.; Li, H.; Li, W.G.; Zhao, Y.-G.; Tang, Z.; Sun, Z.H. Shear behavior degradation and failure pattern of reinforced concrete beam with chloride-induced stirrup corrosion. Adv. Struct. Eng. 2019, 22, 2998–3010. [Google Scholar] [CrossRef]
  43. Kani, G.N.J. The Riddle of Shear Failure and its Solution. ACI Struct. J. 1964, 61, 441–468. [Google Scholar]
  44. ACI 318-19; Building Code Requirements for Structural Concrete. American Concrete Institute: Farmington Hills, MI, USA, 2019. [CrossRef]
  45. Guo, T.; Sause, R.; Frangopol, D.M.; Li, A. Time-Dependent Reliability of PSC Box-Girder Bridge Considering Creep, Shrinkage, and Corrosion. J. Bridge Eng. 2011, 16, 29–43. [Google Scholar] [CrossRef]
Figure 1. Break of the steel cables after corrosion in Shenzhen, China [9]. (a) Broken strands at anchor head; (b) cross section reduction of broken strands.
Buildings 14 02047 g001
Figure 2. Two typical failure patterns of CPC beams [27]. (a) Concrete crushing. (b) Wire rupture of corroded prestressed strands.
Buildings 14 02047 g002
Figure 3. Relationship between Mu,exp and b. (a) Rectangular section, (b) T-shaped section.
Buildings 14 02047 g003
Figure 4. Relationship between Mu,exp and h0. (a) Rectangular section, (b) T-shaped section.
Buildings 14 02047 g004
Figure 5. Relationship between Mu,exp and fcu,150. (a) Rectangular section, (b) T-shaped section.
Buildings 14 02047 g005
Figure 6. Relationship between Mu,exp and λ. (a) Rectangular section, (b) T-shaped section.
Buildings 14 02047 g006
Figure 7. Relationship between Mu,exp and ηsn. (a) Rectangular section, (b) T-shaped section.
Buildings 14 02047 g007
Figure 8. Relationship between Mu,exp and PPR.
Buildings 14 02047 g008
Figure 9. Relationship between Mu,exp and fpe. (a) Rectangular section, (b) T-shaped section.
Buildings 14 02047 g009
Figure 10. Section stress distribution diagram in normal section analysis of GB50010-2010 [39].
Buildings 14 02047 g010
Figure 11. Section stress distribution diagram in normal section analysis of EN 1992-1-1:2004+A1 [40].
Buildings 14 02047 g011
Figure 12. Section stress distribution diagram in normal section analysis of ACI 318-19.
Buildings 14 02047 g012
Figure 13. Comparisons between the experimental results and the predictions of the Chinese Code, Eurocode and ACI Standard without considering corrosion effects. (The mentioned references are Rinaldi et al. [20], Li and Yuan [19], Zhang et al. [24], Li et al. [34], Zhang et al. [29], Jeon et al. [14], Zeng et al. [35], Ma et al. [31], Youn and Kim [36], Yu et al. [22], Liu et al. [37], Xu et al. [38], Qiu [26], Yang [27]).
Buildings 14 02047 g013
Figure 14. Comparison of the predictions of the proposed model with the test results. (The mentioned references are Rinaldi et al. [20], Li and Yuan [19], Zhang et al. [24], Li et al. [34], Zhang et al. [29], Jeon et al. [14], Zeng et al. [35], Ma et al. [31], Youn and Kim [36], Yu et al. [22], Liu et al. [37], Xu et al. [38], Qiu [26], Yang [27]).
Buildings 14 02047 g014
Table 1. Experimental database of flexural strength of CPC beams collected from existing studies.
ReferenceSpecimenb (mm)h (mm)Concrete Strength (MPa)Ast (mm2)fyt
(MPa)
Asc (mm2)fyc (MPa)Ap (mm2)fpt
(MPa)
Ep (N/mm2)ηλMexp (kN·m)
Rinaldi et al. [20]
(9 sets)
NO.720030034157400157400226.191976195,00003.57 73.20
NO.820030034157400157400226.191976195,0000.23.57 43.95
NO.920030034157400157400226.191976195,0000.23.57 52.95
NO.220030041.5157400157400226.191976195,00003.57 86.70
NO.320030041.5157400157400226.191976195,0000.143.57 39.45
NO.120030041.5157400157400226.191976195,0000.23.57 30.90
NO.420030047.4157400157400226.191976195,00003.57 95.70
NO.620030047.4157400157400226.191976195,0000.073.57 91.20
NO520030047.4
(fcu,150)
157400157400226.191976195,0000.2
(ηwt)
3.57 32.70
Li and Yuan [19]
(9 sets)
PRB115020033.05728422637598.71913195,0000.01733.96 27.7
PRB215020033.05728422637598.71913195,0000.02193.96 27.5
PRB315020033.05728422637598.71913195,0000.02243.96 25.1
PRB415020033.05728422637598.71913195,0000.02873.96 25.0
POB015020035.25728422637598.71913195,00003.96 28.9
POB115020035.25728422637598.71913195,0000.00943.96 25.8
POB215020035.25728422637598.71913195,0000.01513.96 25.3
POB315020035.25728422637598.71913195,0000.01983.96 26.3
POB415020035.2
(fcu,150)
5728422637598.71913195,0000.0112
(ηwt)
3.96 25.8
Zhang et al. [24]
(8 sets)
PCB115022031.821012352263351401910195,0000.77903.70 11.4
PCB215022031.821012352263351401910195,00013.70 9.9
PCB315022031.821012352263351401910195,0000.06353.70 31.5
PCB415022031.821012352263351401910195,0000.09823.70 30.6
PCB515022032.351012352263351401910195,0000.55103.70 15.9
PCB615022032.351012352263351401910195,0000.48043.70 19.5
PCB715022034.281012352263351401910195,0000.35893.70 22.8
PCB815022034.28
(fcu,150)
1012352263351401910195,0000.0128
(ηsn)
3.70 34.5
Li et al. [34]
(7 sets)
SCC0-215025034.37308360100.6254201.1622.83205,00002.23 46.53
SCC2-115025034.65308360100.6254201.1622.83205,0000.00672.23 44.28
SCC2-215025032.42308360100.6254201.1622.83205,0000.01082.23 42.48
SCC2-315025033.73308360100.6254201.1622.83205,0000.01202.23 42.03
SCC2-415025030.47308360100.6254201.1622.83205,0000.01382.23 41.8
SCC1-315025033.65308360100.6254201.1622.83205,0000.01222.23 42.03
SCC4-115025035.07
(fcu,150)
308360100.6254201.1622.83205,0000.0113
(ηsn)
2.23 51.03
Zhang et al. [29]
(8 sets)
CB015022034.11012352263351401910195,00003.70 37.8
CB115022033.71012352263351401910195,0000.73703.70 13.5
CB215022033.71012352263351401910195,0000.46003.70 21
CB315022033.71012352263351401910195,0000.61703.70 15.9
CB415022033.71012352263351401910195,0000.84703.70 11.7
CB515022032.41012352263351401910195,0000.12103.70 33
CB615022032.41012352263351401910195,0000.19503.70 31.5
CB715022034.3
(fcu,150)
1012352263351401910195,0000.2700
(ηsn)
3.70 28.8
Jeon et al.
[14]
(4 sets)
RB15022037.46157400265.464001401865194,50003.6649.17
QB15022037.46157400265.464001401865194,5000.04823.6648.3
MB115022037.46157400265.464001401865194,5000.06673.6643.92
MB215022037.46
(fcu,150)
157400265.464001401865194,5000.0751
(ηsn)
3.6640.68
Zeng et al. [35]
(9 sets)
L1150300444023652263601401950203,00003.33 91.12
L2150300444023652263601401950203,0000.0873.33 86.68
L3150300444023652263601401950203,0000.1363.33 78.04
L4150300444023652263601401950203,00013.33 47
L5150300444023652263601401950203,0000.2033.33 55.28
L6150300447603702263601401950203,0000.0583.29 110.68
L7150300444023652263601401950203,00003.33 84.6
L8150300444023652263601401950203,0000.263.33 48.32
L915030044
(fcu,150)
4023652263601401950203,0000.017
(ηwt)
3.33 75.84
Ma et al. [31]
(5 sets)
B015022031.81012902263751401910193,00003.69 37.8
B115022031.81012902263751401910193,0000.02703.69 33
B215022031.81012902263751401910193,0000.06203.69 31.5
B315022031.81012902263751401910193,0000.09103.69 28.8
B415022031.8
(fcu,150)
1012902263751401910193,0000.1060
(ηwt)
3.69 21
Youn and Kim [36]
(3 sets)
PC115030031265.46400265.4640098.71834195,0000/45.6
PC215030031265.46400265.4640098.71834195,0000.0881/44.6
PC315030031
(fck)
265.46400265.4640098.71834195,0000.1963
(ηsn)
/39.8
Yu et al. [22]
(6 sets)
L115030044.2402.1365226.23591401959203,00003.33 91.1
L215030044.2402.1365226.23591401959203,0000.0873.33 86.7
L315030046.5402.1365226.23591401959203,0000.1363.33 78.0
L415030044.2402.1365226.23591401959203,00013.33 47.0
L515030045.4760.3368226.23591401959203,0000.0583.29 110.7
L615030042.5
(fcu,150)
402.1365226.23591401959203,0000.017
(ηwt)
3.33 75.8
Jeon et al. [21]
(5 sets)
CB128038037.46157400265.46400138.71883195,0000.09496.02 181.75
CB228038037.46157400265.46400138.71883195,0000.08846.02 222.02
CB328038037.46157400265.46400138.71883195,0000.06896.02 230.45
CB428038037.46157400265.46400138.71883195,0000.0686.02 226.92
RB528038037.46
(fcu,150)
157400265.46400138.71883195,0000
(ηsn)
6.02 226.31
Liu et al. [37]
(5 sets)
B215025045.1308335308335197.41860195,0000.0713.34 59.79
B315025043.6308335308335197.41860195,0000.0433.34 67.17
B515025045.5308335308335197.41860195,0000.1023.34 57.63
B715025046.7308335308335197.41860195,0000.0223.34 68.52
B915025045.6
(fcu,150)
308335308335197.41860195,0000
(ηwt)
3.34 69.66
Xu et al. [38]
(8 sets)
PCB-115025051.22264002264001401661202,00003.04 57.8
PCB-215025051.22264002264001401661202,0000.03223.04 56
PCB-315025051.22264002264001401661202,0000.06113.04 53.5
PCB-415025051.22264002264001401661202,0000.08953.04 50.9
PCB-515025051.23084002264001401661202,0000.06233.02 64.5
PCB-615025051.24024002264001401661202,0000.06353.00 67.5
PCB-715025059.92264002264001401661202,0000.05823.04 55.5
PCB-815025044.5
(fcu,150)
2264002264001401661202,0000.0753
(ηwt)
3.04 53.4
Qiu [26]
(8 sets)
A089(265)240(75)55.7100.6350100.63501401860195,00004.09 61.63
A189(265)240(75)55.7100.6350100.63501401860195,0000.00334.09 61.71
A289(265)240(75)55.7100.6350100.63501401860195,0000.01244.09 59.93
A389(265)240(75)55.7100.6350100.63501401860195,0000.02374.09 56.7
A489(265)240(75)55.7100.6350100.63501401860195,0000.04524.09 53.72
A589(265)240(75)55.7100.6350100.63501401860195,0000.06154.09 49.39
A689(265)240(75)55.7100.6350100.63501401860195,0000.07474.09 47.86
A789(265)240(75)55.7
(fcu,150)
100.6350100.63501401860195,0000.0831
(ηwt)
4.09 44.54
Yang [27]
(5 sets)
B0180(320)250(80)45.2100.6350402.43501401860195,00003.07 59.2
CB280(320)250(80)45.2100.6350402.43501401860195,0000.00853.07 57.2
CB380(320)250(80)45.2100.6350402.43501401860195,0000.03583.07 54.9
CB480(320)250(80)45.2100.6350402.43501401860195,0000.06483.07 51.4
CB580(320)250(80)45.2
(fcu,150)
100.6350402.43501401860195,0000.0842
(ηwt)
3.07 47.5
Zhou et al. [28]
(5 sets)
A0100(320)250(80)51.75100.6415.3402.4415.31401980.8195,00003.06 220.33
A1100(320)250(80)51.75100.6415.3402.4415.31401980.8195,0000.03133.06 207.51
A2100(320)250(80)51.75100.6415.3402.4415.31401980.8195,0000.07983.06 186.08
A3100(320)250(80)51.75100.6415.3402.4415.31401980.8195,0000.11843.06 160.56
A4100(320)250(80)51.75
(fcu,150)
100.6415.3402.4415.31401980.8195,0000.1353
(ηsn)
3.06 152.74
Table 2. Important characteristics of the selected experimental CPC beams.
Compressive Strength of the ConcreteYield Strength of the Longitudinal Tensile ReinforcementYield Strength of the Longitudinal Compression ReinforcementUltimate Tensile Strength of the Prestressed ReinforcementSection Loss Ratio of the Prestressed ReinforcementShear Pan RatioPrestressed Reinforcement Type
fcu,150 (MPa)fyt (MPa)fyc (MPa)fpt (MPa)ηsnλ
Range30.47~59.9235~415.3254~415.3622.83~1980.80~100%2.32~6.0212.7 mm and 15.2 mm steel strands, 16 mm prestressed steel bar
Table 3. Comparison of prediction accuracy of three specifications for the flexural capacity of CPC beams.
Types of CodeAAEMSESD
GB50010-2010 [39]0.61861146.88690.5304
EN 1992-1-1:2004+A1 [40]0.3868371.46610.4676
ACI 318-19 [44]0.2829238.28150.3263
The new proposal0.1990178.50130.2764
Note: AAE, MSE and SD are the average absolute error, mean square error and standard deviation, respectively.
Disclaimer/Publisher’s Note: The statements, opinions and data contained in all publications are solely those of the individual author(s) and contributor(s) and not of MDPI and/or the editor(s). MDPI and/or the editor(s) disclaim responsibility for any injury to people or property resulting from any ideas, methods, instructions or products referred to in the content.

