Article

Big Data Value Proposition in UK Facilities Management: A Structural Equation Modelling Approach

by
Ashwini Konanahalli
1,*,
Marina Marinelli
2 and
Lukumon Oyedele
3
1
School of Computing Engineering and Physical Sciences, University of the West of Scotland, High Street, Glasgow G72 0LH, UK
2
School of Civil Engineering, National Technical University of Athens, Zografou Campus, Iroon Polytechniou 9, Zografou, 15780 Athens, Greece
3
Digital Innovation and Enterprise, University of the West of England, Frenchay Campus, Bristol BS16 1QY, UK
*
Author to whom correspondence should be addressed.
Buildings 2024, 14(7), 2083; https://doi.org/10.3390/buildings14072083
Submission received: 9 April 2024 / Revised: 15 June 2024 / Accepted: 5 July 2024 / Published: 7 July 2024
(This article belongs to the Special Issue Data Analytics Applications for Architecture and Construction)

Abstract

:
Big data analytics (BDA) has been introduced in the past few years in most industries as a factor capable of revolutionizing their operations by offering significant efficiency opportunities and benefits. To compete in this digital age, businesses must adopt a client-centric service model, founded on data delivering continuous value and achieving optimal performance, whilst also upgrading their own decision-making and reporting processes. This article aims to explore how UK FM organizations are currently capitalizing on BDA to drive innovation and ‘added value’ in their operations. The objective is to shed light on the initial BDA adoption efforts within the UK’s FM sector, particularly capturing the benefits experienced by FM organizations in relation to customer value and improved decision-making processes. Drawing upon exploratory sequential research including a qualitative stage with 12 semi-structured interviews and an industry-wide questionnaire survey with 52 responses, a novel fifteen-variable model for BDA outcomes was developed. Exploratory Factor Analysis (EFA) and a Higher-Order model using Partial Least Square Structural modelling (PLS-SEM) were used to validate the scale. The EFA output generated three dimensions with 14 items. The dimensions included Improved client value, FM business operations added value, and Improved efficiency added value. Furthermore, the results of PLS-SEM confirmed the validity of the scale items and the reflective–formative measurement model. The findings suggest that the contemporary digitization trend offers the FM service the unique opportunity to develop a smarter, client-centric strategy resulting in more personalized services and stronger customer relationships. Furthermore, efficient resource management and planning powered by analytics and data-driven insights emerge as a key driver for competitive differentiation in the field. As one of the first studies to develop and validate scale items measuring specific dimensions of BDA adoption outcomes, the study makes significant contributions to the literature.

1. Introduction

The vision of the fourth industrial revolution (Industry 4.0) is nowadays spreading at exponential rates across multiple fields and emerges as a universal trend that affects almost every area of business and society. The range of benefits associated with the integrated, smart, and automated manufacturing environment typifying the implementation of Industry 4.0 technologies is particularly broad; it includes increases in the organizations’ productivity, operational efficiency, overall performance, and competitiveness, among others [1]. In the field of construction in particular, the Industry 4.0 paradigm, also known as ‘Construction 4.0’, has dynamically spread as a digital transformation vision capable of reversing the current poor performance of the sector in a range of crucially important metrics associated with safety, quality, efficiency, and sustainability [2]. In this context, overly enthusiastic discourse focused on the perceived implementation benefits of the Construction 4.0 vision has emerged during the past few years, accompanied by an exponentially growing relevant literature trend in the area of construction management [3].
Regardless of the field of application, the digital transformation process involves the application of engineering knowledge to create electronic devices and systems such as the internet of things (IoT), digital twins, and blockchains that enable more precise and flexible communication and thus efficient and effective operations [4]. The aforementioned technologies are inextricably linked to the generation of Big Data (BD), i.e., massive datasets that exceed the capacity of standard database software tools for capturing, storing, managing, and analyzing. BD mark a significant advancement from conventional data analysis and have the potential to be stored, retrieved, integrated, pre-processed, selected, transformed, analyzed, and interpreted to uncover new insights [5]. Furthermore, the speed at which large datasets are produced and accumulated through disruptive digital technologies has created a demand for effective tools and methods for their management and processing [6]. These tools and methods, also known as Big Data Analytics (BDA), rely on machine learning mechanisms such as pattern recognition, statistics, and ANNs which are capable of revealing meaningful insights, patterns, and trends. By scrutinizing key processes, roles, and functions within a company, BDA has the capacity not only to facilitate an understanding of current processes or operations but also to question if a process is relevant to the business and suggest innovative ways for solving issues [7]. Furthermore, BDA generates benefits in precision marketing, new product development, and realigning business strategy to maintain sustainable competitive advantage [8]. Thus, BDA can be considered as a game changer, enabling improved business efficiency and effectiveness because of its high operational and strategic potential [9].
Facilities management (FM) is the discipline that involves managing and maintaining the physical assets and infrastructure of an organization. This can include buildings, grounds, equipment, and other resources that are necessary for the organization to function. The goal of FM is to ensure that these assets are well-maintained, safe, and efficient, and that they effectively support the core business activities of the organization. In this context, FM involves a wide range of activities related to buildings, including maintenance and repairs, safety and security, energy management, space management, and environmental sustainability. However, buildings have tremendous differences in size, function, construction, design, and other attributes while presenting varying levels of potential hazards and risks to the occupants and the surrounding environment [10]. Therefore, a data management system that can create data and share information can have a substantial effect on the performance of buildings [4]. An example of such a system is Computer-Aided Facilities Management (CAFM) software, which typically includes a range of tools and features for managing maintenance schedules, work orders, space utilization, asset management, energy usage, and building security. Such software can also help to automate many routine tasks. Furthermore, the FM discipline also includes, beyond the built assets, information management related to procurement, inventory, and manufacturing, e.g., transactions, purchases, requests, and warranties, typically accomplished using Enterprise Resource Planning (ERP) software [10].
The examples above show that the FM discipline relies heavily on efficiently gathering and analyzing vast and varied amounts of data that are continually generated by crucial operational resources. In particular, the emerging coupling of Building Information Models (BIMs) and IoT-enabled sensors has the potential to transform traditional FM systems into smart systems, capable of continuously monitoring, adapting, and managing the built environment in an automated way. In this context, innovative BDA-based approaches can drastically reduce traditional FM problems with lower data quality and longer notification times and delays, while ensuring that organizations are capable of anticipating customer requirements and responding to them more efficiently. Nevertheless, BD management is in its nascency, and research studies on construction and its management in relation to big data are scarce [6].
The main aim of this research is to investigate the beneficial impact of BDA implementation on the FM organizations’ customer value potential and decision-making processes. The goal is to highlight the initial efforts of BDA adoption within the UK’s FM sector, specifically focusing on the advantages these organizations are gaining. This will be achieved through research based on exploratory sequential design [11], starting with a qualitative research phase where the views of participants are identified and followed by a second, quantitative phase where data are further tested with a sample of a population. More specifically, after a thorough literature review, a qualitative research stage based on semi-structured interviews is conducted. Specifically, twelve FM practitioners were interviewed with the aim of offering insights into the process of BDA adoption and implementation in their respective organizations. Following content analysis of the interview transcripts [12], a list of outcomes from BDA adoption is developed. These factors are treated as the quantitative variables of the stage that comes next, i.e., they are first approved through a questionnaire, by a greater sample of FM practitioners with relevant experience, and then they are used for the application of the processes of EFA and subsequently CFA. The latter is to yield a structural model expressing the correlations between the outcomes in response.
As multi-strategy designs necessarily include both fixed and flexible design elements or phases, they call for the inclusion of a research question, or questions, covering both aspects [13]. In this context, the questions proposed by this study, to be answered through the aforementioned steps, are:
  • RQ1: What are the main outcomes observed in the operation of UK FM organizations as a result of their BDA adoption efforts?
  • RQ2: What principal factors (if any) can be identified to express correlations between those factors?
  • RQ3: What is the strength of correlations between the variables?
The aforementioned research questions can be categorized as descriptive (RQ1, RQ2) and correlative (RQ3), and their order reflects the sequence of steps in the mixed methods design used and the qualitative/quantitative nature of the research stage they belong to.
The remainder of this article is organized as follows: Section 2 reviews the literature on the potential of BDA integration in FM businesses, focusing on conditions, technological requirements, and prospects; Section 3 analyzes the research methodology and Section 4 presents the respective Exploratory and Confirmatory Factor Analysis results. Section 5 discusses the findings of the analysis and, finally, Section 6 includes the research’s conclusions, limitations, and future directions.

2. Literature Review

2.1. BDA-Based Operational Applications for FM

The literature is very extensive as regards BDA applications in the management of building operations and the facilities‘ everyday use. Notably, comprehensive coverage of BDA’s potential has been offered by [10], with an extensive review of the related building automation and management systems (BAMSs), the AI mechanisms involved, a detailed presentation of various building environments’ characteristics, and a thorough analysis of the relevant computing platforms and supported applications. The described applications and benefits span a variety of operational areas, including energy management, maintenance management, space management, user comfort, and safety and security. BDA enables the real-time monitoring of various building parameters and subsequent informed decision-making, which can transform the experience of all main FM stakeholders, i.e., the owner, the FM service provider, and the end-user. Appropriate dynamic dashboards and visualization tools allow facilities managers to continually observe in real-time how employees and customers are using the building and plan their actions accordingly. For instance, BDA indicatively enables real-time monitoring of the level of occupancy [10,14,15], the temperature and the lighting level [16,17], parking space availability [16,17], indoor air and water quality assessment [10,14], and garbage management [17]. With IoT-based micro-location technologies (e.g., Bluetooth, RFID, and magnetic field mapping), real-time tracking and monitoring of all the places users visit are possible, which in turn provides opportunities for, e.g., effective visitor navigation or balanced distribution in various building spaces [16]. One such case is also hotdesking in office buildings [15]. Therefore, the occupant can obtain a better user experience, faster and higher quality services, and better indoor conditions.
BDA also reveals the historical trends, patterns, and causal correlation of issues and events occurring in the building’s mechanical, electrical, and plumbing (MEP) subsystems [7]. For instance, owners and service providers can monitor what their energy usage is in heating, ventilation, and air conditioning (HVAC) systems and develop effective benchmarking practices and prediction models based on constantly collected smart meter data reflecting load patterns and ambient conditions [7]. Thus, BDA can help in better understanding building, asset, and process performance. Other BDA-based energy applications include energy retrofit analysis, development of pricing strategies, energy efficiency evaluation, and simulation of use [7,10,14,18]. Furthermore, the field of maintenance operations, which is of crucial importance for both the owner and the FM service provider, is also being revolutionized by BDA: visual inspections and manual data processing are increasingly being replaced by high-frequency sensors generating real-time BD on a variety of measurements including vibration, temperature, and thermography [19]. Furthermore, BDA boosts predictive maintenance capabilities such as the ability to determine appropriate maintenance intervals, improved asset condition prognosis, and early anomaly detection [7,14,20,21]. Finally, a critical area of interest for all stakeholders is building safety and security. The potential applications of BDA include the monitoring and control of security systems [16,17,22,23,24], the monitoring and immediate response to emergency situations, system alarms and fire safety alerts [10,14,24], and the prevention of accidents [15,22,23], as well as the building automation system’s cybersecurity [25]. As a result of the above, the owner benefits from better quality and more efficient and smarter FM services. The FM service providers, on their part, are also able to develop and offer new services, speed up operations, save resources, and thus improve building profitability.

2.2. FM Business Value Implications Resulting from BDA

The tremendous potential that BDA applications hold towards helping organizations gain and sustain a competitive edge in the market through context-sensitive dynamic decision-making and intelligence autonomy, has been well-acknowledged in the last decade [16,26,27]. A preliminary survey by IBM confirms that organizations using BDA within their innovation processes are 36 percent more likely to beat their competitors in terms of revenue growth and operating efficiency [27]. Τhe successful integration of BDA and business processes provides organizations with the opportunity to extract valuable insights that would otherwise remain hidden and helps the top-performing ones redefine their business and dominate in their field [28].
In construction particularly, the systematic literature investigation by Madanayake and Egbu [29] identified that the common themes representing the industry’s expectations from BDA include value creation, informed business decisions, visualization of patterns and correlations between factors, enhancing supply chain flexibility, optimized resource and process management, and productivity growth. Along the same lines, ref. [30] emphasized the contribution of BD to efficiency through better claims management, improved accuracy for project pricing tasks and tenders, effective project progress monitoring based on near- to real-time communications and updates between the site and head office, quick responses to issues and defects, improved relations between stakeholders, and informed supply chain decisions.
According to [31], the FM discipline represents the part of the construction sector where a greater potential for BDA utilization is being observed. According to [10], this can be associated with the tremendous complexities and operational uncertainties of buildings, which BDA can significantly alleviate with concrete contributions to theory, experimentation, and simulations. Mawed and Al-hajj [7] identified several drivers for BDA adoption in FM, among which are the more effective use of facilities, more accurate asset use forecasting, FM cost savings, better maintenance planning, customized user experience, and improved customer relations. Furthermore, the benefits observed by a major FM service provider responsible for 168 facilities in the UAE include improved efficiency, profitability, and quality of services. They indicatively refer to informed contractor selection, evaluation and control, easier work order follow-up, cost benchmarking, optimum time investment, prediction of shutdowns, development of energy reduction strategies, and more effective and efficient predictive maintenance strategies. Furthermore, in the field of maintenance, BDA-leveraged insights can help extend equipment life, reduce operating costs, and minimize disruption [32]. Nota et al. [33] verified the above by reporting the results of the introduction of an IoT-based cyber–physical production system for the machinery maintenance of an industrial facility: their analysis for the year after the intervention found a substantial reduction of downtime events (27%) and breakdown hours (45%), a significant increase in production output (12%), and an impressive 20% reduction in maintenance costs. These result from timely preventive maintenance strategies based on early diagnosis of anomalies and failure pattern recognition enabled by real-time data analysis.

2.3. Quantitative Models for the Adoption of Digital Technologies in the Built Environment
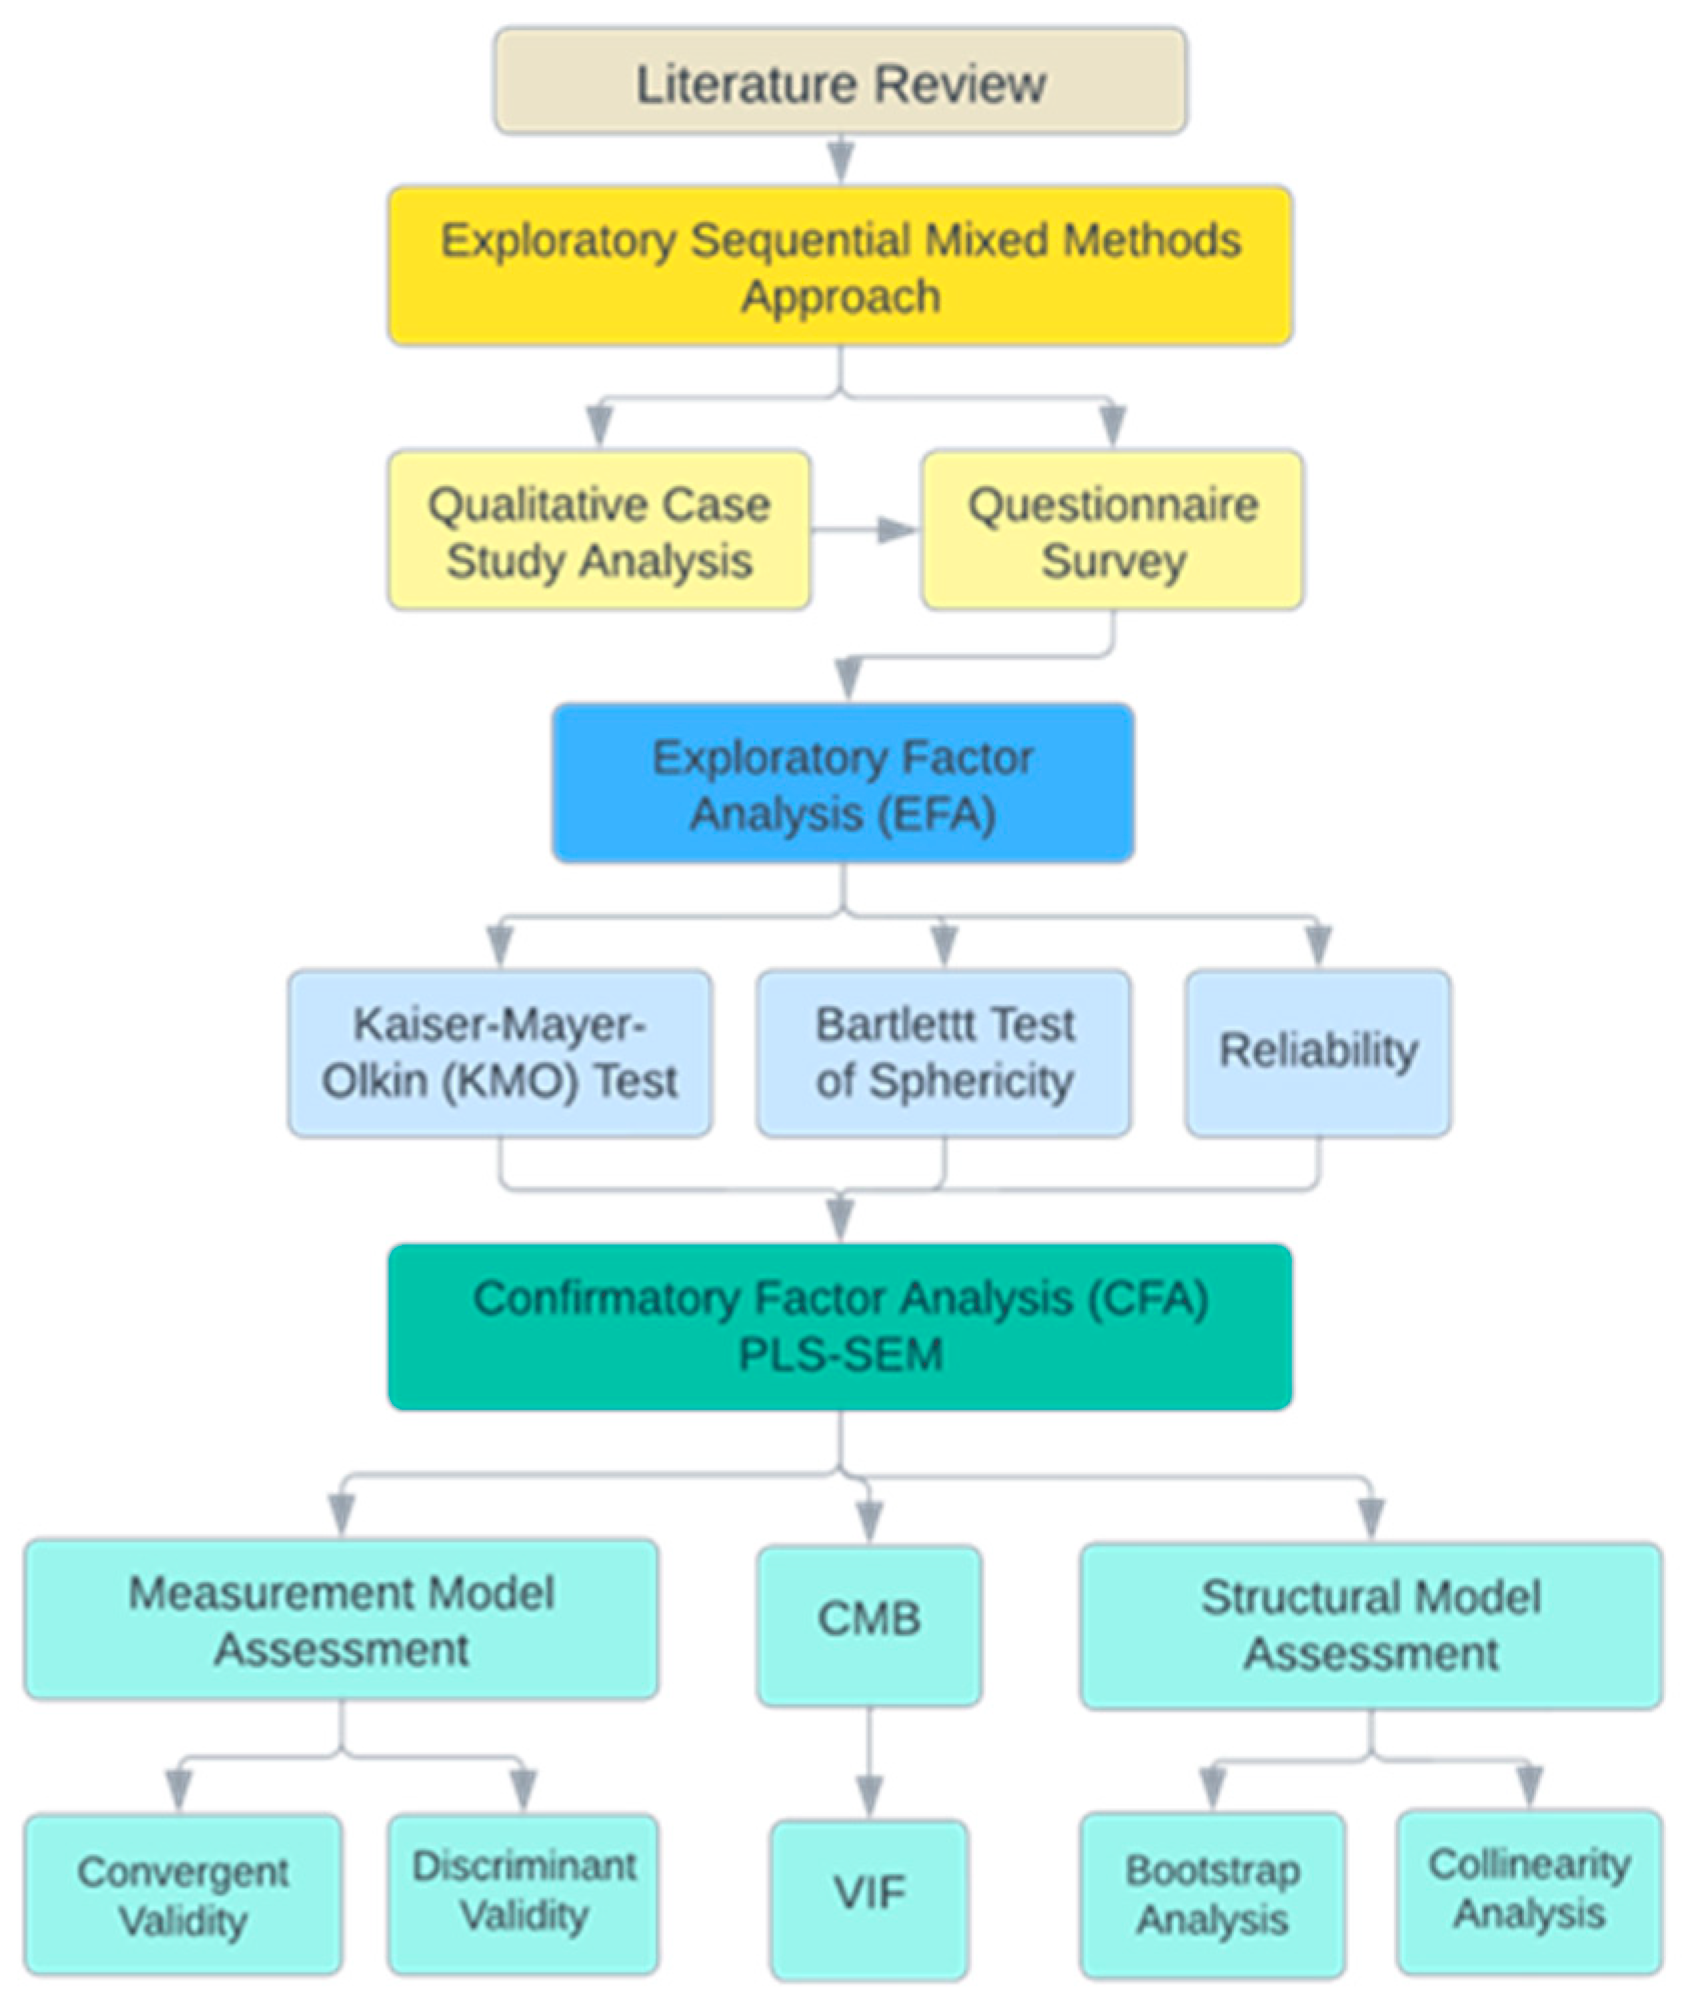
The fourth industrial revolution, also known as ‘Industry 4.0’, is a relatively recent concept where organizational processes are digitally interconnected with the aim of reforming value delivery mechanisms [34]. Industry 4.0 has introduced an ‘intelligent construction’ era, commonly reported as ‘Construction 4.0’, which encompasses older and emerging technological applications such as BIM, the Internet of Things (IoT), BDA, additive manufacturing, and robots [35]. Given that construction is special in the uniqueness and diversity of its products, information needs and value chains [36] are concepts that not only mark a new addition to the construction market but also conceptually transform construction itself [37].
In this context, numerous researchers have attempted the development of quantitative models to highlight various factors emerging from the adoption of Industry 4.0 technologies in the construction industry. The value of such models lies in providing empirical evidence to validate the interactions and level of relations between factors, deepening the understanding of paths of causality and theoretically illuminating the way a phenomenon occurs. Those in turn can motivate businesses towards implementing specific processes or changes and assisting policymakers in formulating priorities and mapping out effective strategies [38,39,40,41].
The lion’s share relates to BIM, which is a more mature technology with a much higher level of actual use in the industry than any other. For instance, Ref. [40] conducted research regarding the enabling factors of BIM adoption in Vietnamese construction enterprises; they initially performed an exploratory factor analysis (EFA) of 32 factors detected in the literature and then, developed a model based on the PLS-SEM approach with the aim of examining the interrelationships between the latent variables provided by the EFA. In a subsequent research project, the same authors developed a new structural model enriched with two behavioral factors, i.e., the behavioral intention to use BIM and actual behavior during BIM use. Their aim was to determine what factors influence individuals’ readiness and satisfaction levels in adopting BIM. Furthermore, Ref. [42] performed EFA and developed a structural model to identify key constraints in BIM application in sustainable buildings in China. Similarly, Ref. [43] implemented EFA and SEM to identify the most pressing issues preventing the adoption of BIM in Malaysia, while Ref. [44] employed SEM to highlight the factors that drive BIM implementation effectiveness.
Other technology-related purposes where the same methods were implemented include identifying technological drivers for sustainable residential building delivery [45], the benefits of cloud computing for sustainable construction [46], and the benefits of incorporating cyber technologies in building design and construction [39,47]. Furthermore, Ref. [38] used the PLS-SEM approach to test the effect of digital technology adoption on construction project sustainability performance and explore how stakeholder collaboration impacts this relationship. Moreover, Ref. [48] developed a PLS-SEM model with the aim of investigating the relationship between culture, organizational digital innovation capabilities, and digital innovation barriers.
In the field of FM, the BDA-related literature is mainly oriented towards conceptual or bibliometric research related to the IoT-BIM aspect of BD generation (e.g., [17,24,44,49,50,51,52,53,54]). This aspect has gained significant attention due to the fact that the development of reliable IoT-generated datasets from various resources is the fundamental building block for the transformation of buildings and urban spaces to smart homes, offices, and cities [55], and BIM has a key role in this vision. No previous quantitative research regarding BDA implementation in the FM sector was found during the literature search of the Scopus database. The most relevant research attempt concerns the manufacturing sector of Indonesia, where [56] used the PLS-SEM approach to model the influence of BDA-driven business performance and business model innovation on business processes and marketing strategies.
In addition to the above and despite the popularity of the Construction 4.0 topic in the literature, there is still limited understanding of the implications and efficacy of incorporating digital tools in construction information management [47]. Maroco and Garofolo [15] particularly noted the need to enhance the FM sector’s awareness regarding the benefits of disruptive technologies and also highlighted the necessity of more frequent showcasing of these benefits. Furthermore, the literature unanimously reports that the industry is still far from an established data-driven decision-making culture [6,22,31,57]. An extensive analysis of challenges impeding the effective integration of BD in FM has been provided by [31,58]. Ιn this context, this research aims to contribute to the existing literature on BDA adoption in FM and simultaneously respond to the aforementioned need for greater showcasing of benefits. This is achieved by introducing a model that quantifies the relationships between BDA adoption outcomes, thus clarifying BDA’s potential to help FM organizations make informed decisions and improve their operational efficiency.

3. Research Method

Due to the lack of literature on actual BDA adoption cases in the FM sector, qualitative case study research methodology was employed at the first stage of the study to explore BD applications for FM organizations in the UK. The second stage involved a questionnaire survey and factor analysis (both exploratory and confirmatory) to test the initial relationship established through the use of a qualitative study and a literature review. As such, the study was carried out in two stages in line with the exploratory sequential mixed method approach (see Figure 1 for the research design approach followed by the authors).
A list of factors associated with BDA implementation (Drivers, Challenges, Strategies, Outcomes, and Future initiatives), which emerged from the first phase of the study (qualitative case study), was produced in the form of a comprehensive questionnaire. The authors have elaborately analyzed the part of Drivers and Challenges in a previously published paper [58]; therefore, this study specifically focuses on the quantitative analysis of the “outcomes” presented in Table 1. The relevant survey instrument asked the respondents to rate their agreement with regards to the potential occurrence of various benefits as a result of BDA practice as per their experience, using a 1 to 5 Likert scale where 1 represented “strongly disagree” and 5 represented “strongly agree”. In order to prevent ambiguity in the research instrument, a pilot study was carried out with several experts to test the clarity of language, layout, degree of depth, and the logic of the questions, and to perform a preliminary check of the proposed analysis.

3.1. Sample Profile

Key decision-makers within UK FM companies involved with BDA adoption formed the population of this study. Given the limited adoption among FM organizations, the researchers recruited 150 experts for participation. As such, Cochran and Slovin’s formulas [59] were used to find a representative sample of the population, with 80% confidence, a 5% acceptable margin of error, 0.5 population heterogeneity [60], and a 95% anticipated rate. According to the Cochran formula, the adjusted sample size was 52, but over-sampling yielded 54. Slovin’s formula yielded 109 samples. The researchers selected a sample size based on oversampling, and owing to missing or redundant surveys, the study ended up with 52 participants, which is acceptable.
From 150 email requests sent, a total of 52 complete responses were returned, yielding an effective response rate of around 35%. A total of 40% of participants were directors with a considerable number of years of experience, followed by Project managers (15%) and technical managers (14%). The remaining 23% of the respondents held various titles, including Innovation Manager, Bid Manager, IT partner, Sales Manager, Marketing Manager, and Head of Data Governance, to name a few. More than half of the sample population (56%) had industry experience of over 15 years. Significant effort was made by the researchers to ensure that only those individuals who had sufficient experience in BDA implementation were involved in the study.
Interestingly, only 29% of the respondents held membership from the British Institute of Facilities Management (BIFM), whereas a substantial 47% of the respondents did not hold any professional memberships. It should be noted that it is very common for BIFM members to hold additional memberships with other professional bodies/institutions. As for the education and qualifications of the respondents, a third (33%) held a first degree, 15% held a Master’s, 4% held a Doctorate, 27% reported Pre-Degree qualifications, and 17% had various other qualifications. The bulk of the responses (66%) were from larger FM organizations with 5000+ employees, whereas the participation of small businesses (fewer than 50 employees) was restricted to 7.5%.

3.2. Analysis of Statistical Approach

The Statistical Package for Social Sciences (SPSS) 26.0 was used to conduct preliminary statistical analysis that included Exploratory Factor Analysis (EFA) and Cronbach’s Alpha followed by Confirmatory Factor Analysis (CFA) to establish construct path models and validate the confidence and reliability level of the PCA results. The EFA analysis helped to identify the variable structure that explained each of the specified underlying items of Outcomes associated with BDA Adoption. Since there is no reliable theory articulating variable relationships, Principal Component Analysis (PCA) was adopted by the researchers to explore the patterns in data using variance analysis and reduce dimensions to obtain the comprehensive and key indicators that explain most of the variables of the original set. The PCA extraction method and varimax rotation were employed to generate the uncorrelated extracted component with an eigenvalue greater than 1.0. As recommended by researchers, the accepted threshold value of standardized factor loading was set at 0.50, while Cronbach’s alpha was set at 0.70. In EFA, the Kaiser–Mayer–Olkin (KMO) test was adopted to measure the sampling adequacy for each constructed variable and Bartlett’s Test of Sphericity was used to examine the null hypothesis, i.e., whether the correlation matrix based on the collected data is an identity matrix, which indicates that the sample is unsuitable for structure detection. The threshold for KMO values is set between 0.8 and 1 and the significance level of Bartlett’s Test of Sphericity is recommended to be less than 0.05.
For the next stage of the analysis, the researchers performed Confirmatory Factor Analysis (CFA) using SmartPLS to confirm the reliability and validity of constructs identified through EFA. This is because EFA focuses on variable categorization and lacks the ability to specify relationships between variables and their latent constructs [61]. In this case, Partial Least Square Structural Equation Modelling (PLS-SEM) is essential to the validation scale (as there is limited understanding of the structure of the newly developed construct, i.e., the reflective–formative nature) in terms of convergent and discriminant validity following EFA. The higher statistical power of PLS-SEM lends itself to the current study, which focuses on testing the relationship between latent variables with a smaller sample. Given the limited uptake of BDA among FM organizations (very few companies) in the UK, attaining a higher sample was unreasonable. As per [62,63], studies have established the versatility of PLS-SEM to handle small sample sizes without affecting the estimation of the structural model. As such, PLS-SEM is recommended for studies with a relatively smaller sample size (as in this case) and data that violate normality assumptions [64,65]. Since PLS-PM is capable of handling complex relationships in smaller samples (as small as 20) [64], the researchers adopted PLS-SEM for the current study.
As recommended by [66], the repeated indicator approach was adopted as it helps to estimate all latent variables simultaneously rather than estimating the higher and lower order constructs separately, thus avoiding interpretational inconsistency [67].

3.2.1. Evaluation of First-Order Reflective Constructs (Measurement Model)

PLS-SEM is conducted to establish confidence in the measurement model, which specifies how the hypothetical constructs are measured in terms of the observed variables [68]. Once the measurement model’s reliability and validity were established, the Structural model assessment was conducted. The measurement model is evaluated by convergent and discriminant validity [66]. Convergent validity is a measure of internal consistency, which is estimated to ensure that the measurement variables provide true measures of the respective latent variables in their entirety. As per [66], it can be examined with reference to standardized factor loadings, Composite Reliability (CR), and Average Variance Extracted (AVE). Threshold values for factor loadings, CR, and AVE should be higher than 0.5, 0.7, and 0.5, respectively. Discriminant validity, on the other hand, represents the extent to which a construct is truly different from other constructs [66]. Discriminant validity of a measurement model was examined by [69,70] by evaluating the criteria and cross-loadings. These, respectively, foresee that the covariance among unobserved variables (Heterotrait-Monotrait ratio—HTMT) should be lower than 0.85 and that the inter-construct correlations should be less than the square roots of AVEs.

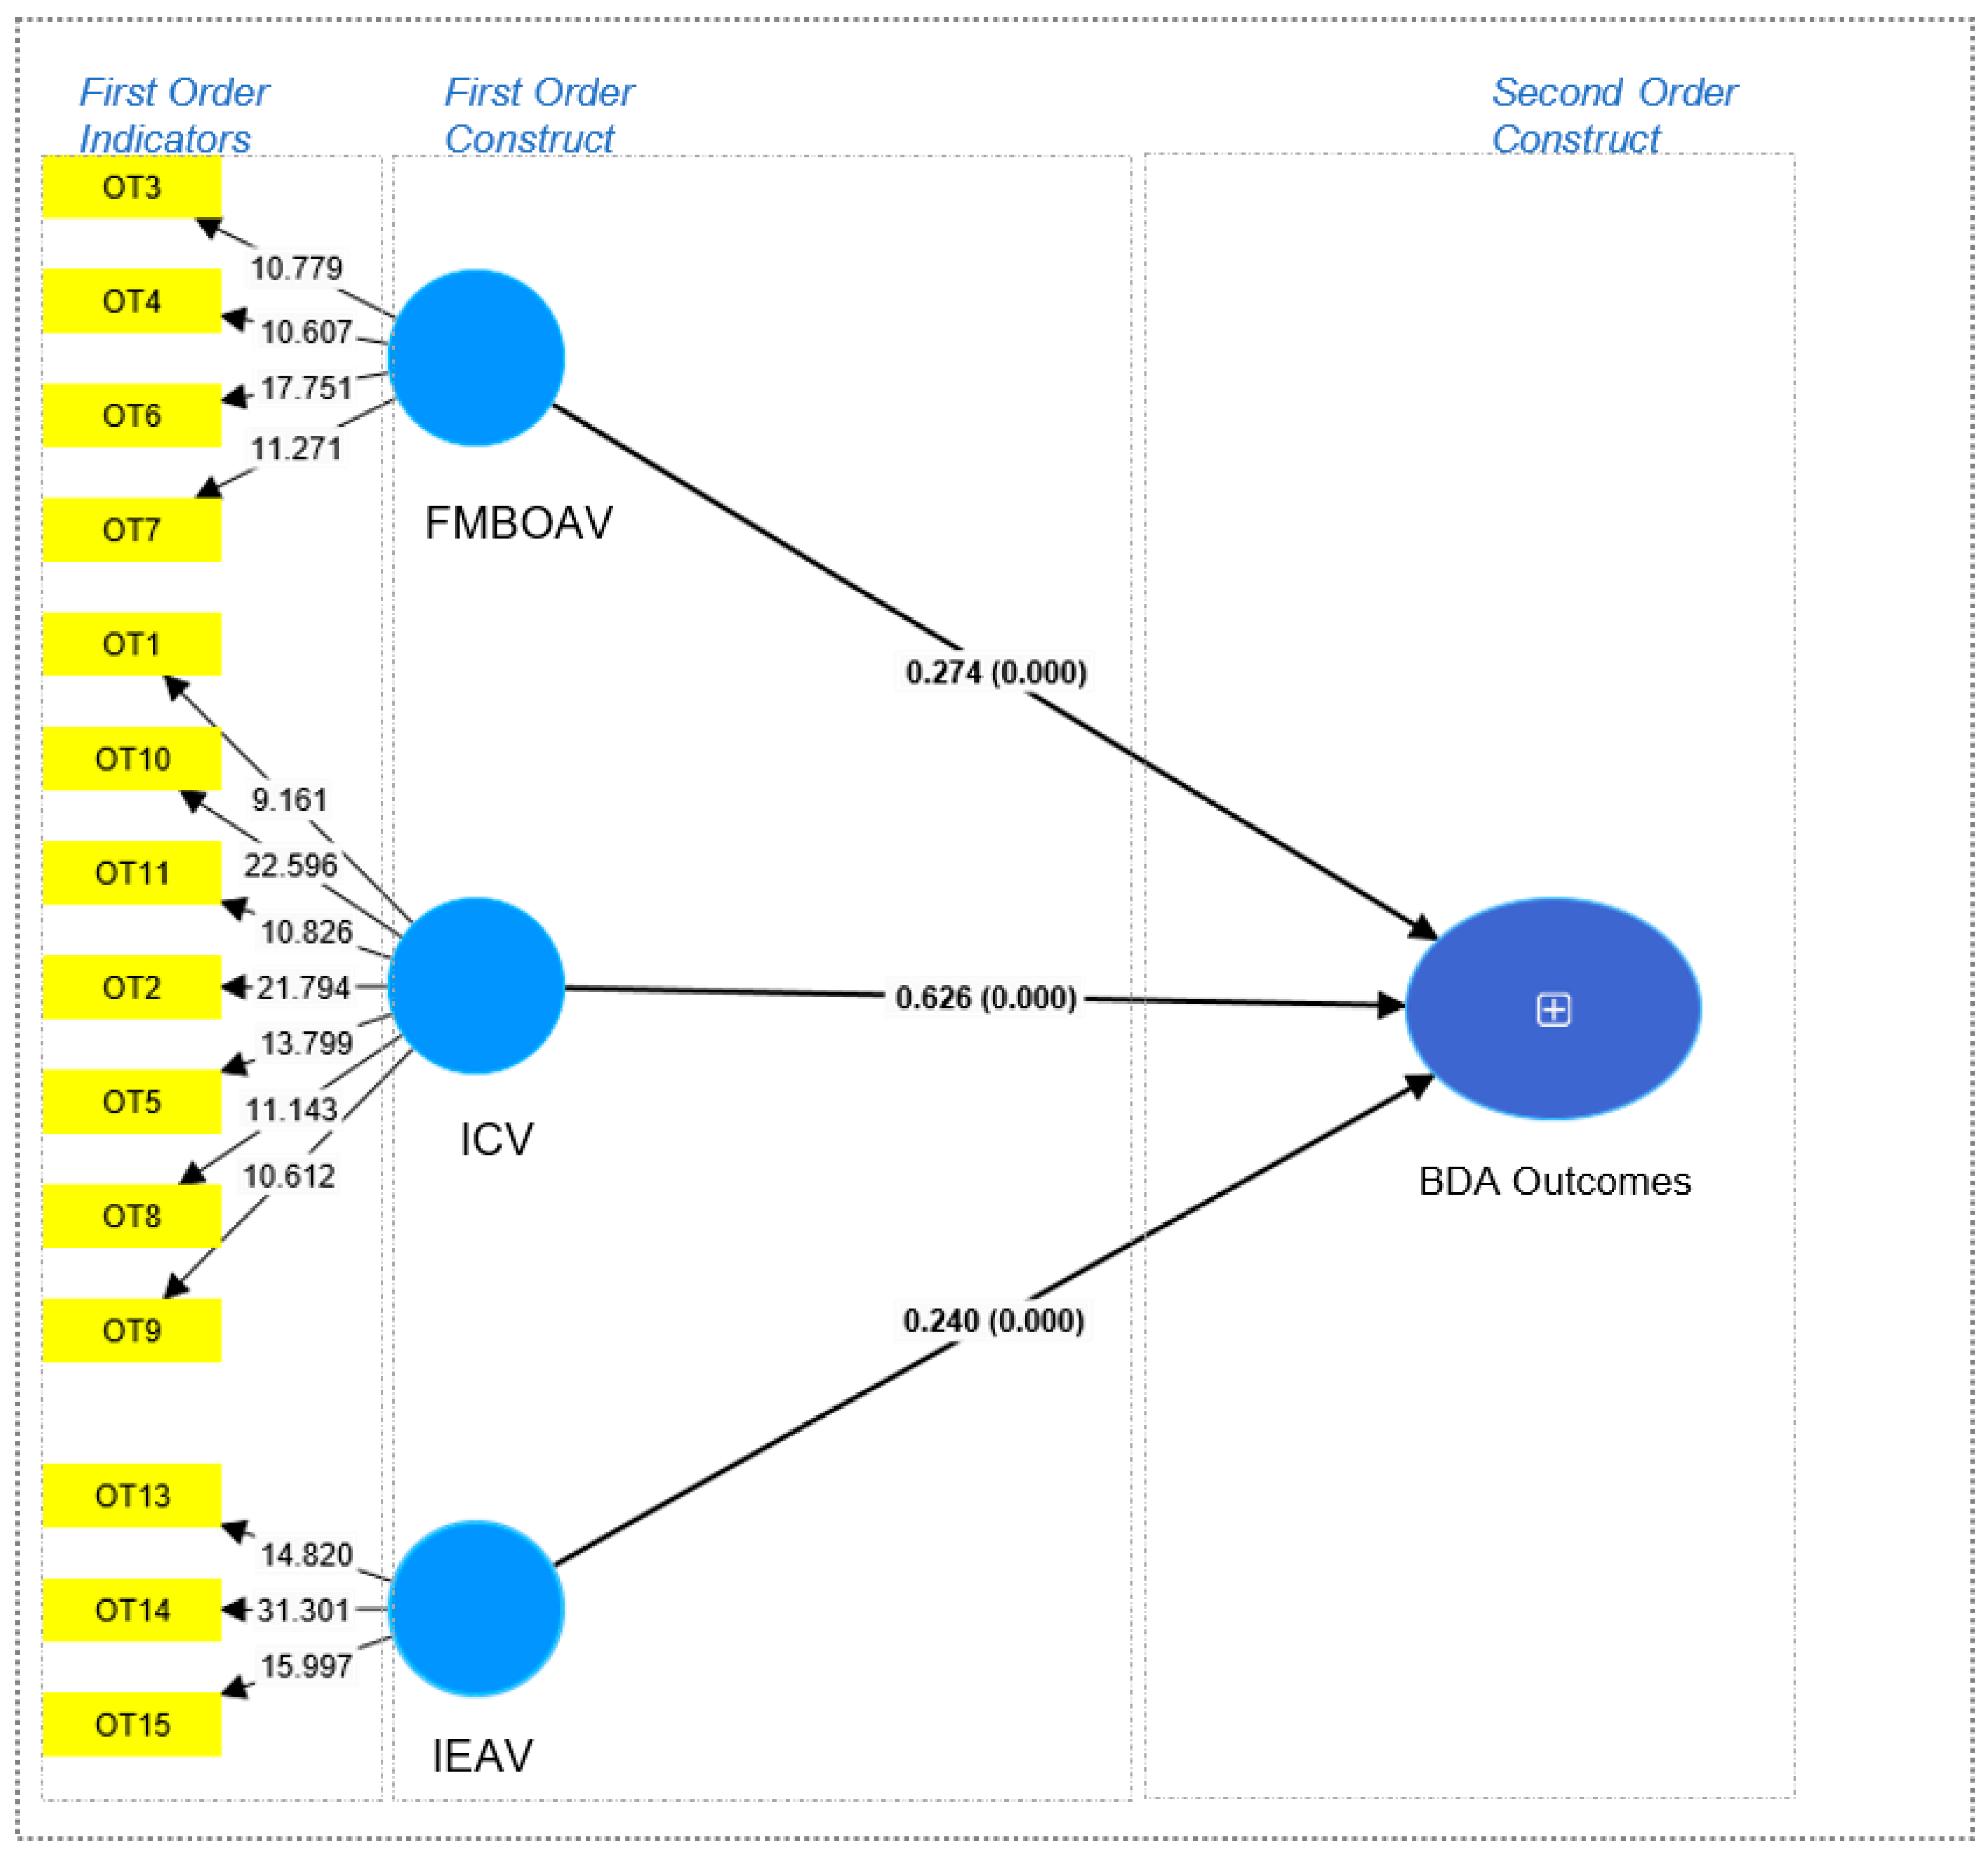
3.2.2. Evaluation of Second-Order Reflective Constructs (Structural Model)

At the higher (second) order level, the validity of the formative construct/model was assessed. The Bootstrapping procedure was adopted to evaluate if the outer weights in formative measurement models differed significantly from zero. t values were calculated to assess each indicator weight’s significance. Random subsamples of bootstrapping are typically about 5000. Here, the weights (beta co-efficient) were adopted to measure the contribution of each formative indicator to the variance of the latent variable, i.e., the relationship between lower-order and higher-order constructs. Researchers have recommended a significance level (p-value) of at least 0.05 to indicate the relevance of the indicator towards the establishment of a formative index, thus validating the construct. As for indicator weights (beta co-efficient [71]), they are recommended to be >0.1 and [62] supported by 0.2. As recommended by [72], the degree of multicollinearity among the formative indicators was estimated with a variance inflation factor (VIF) to examine if the formative constructs were distinct at the first-order level. A conservative estimate of 5 or lower is recommended by [73], whereas [74] suggests a cut-off criterion of 3.33.

4. Results

The results for both PCA and CFA formalized three-dimensional models for BDA Adoption Outcomes. The value of the KMO test for sampling adequacy is 0.812, (p > 0.50), and Bartlett’s Test of Sphericity is 468, with a significance level of 0.000, implying that the population correlation matrix is not an identity matrix and thus the sample is adequate for factor analysis. Following this confirmation, Components with an Eigenvalue >1 were extracted by PCA with Varimax rotation. Table 2 (Rotated component matrix extracted from SPSS) displays the variables onto each factor with loadings exceeding 0.50. The weighting of the factor loading reflects the substantial degree of contribution of each variable to its extracted factor. Based on the correlation among the variables, each extracted factor was labelled with an overarching title. Three principal factors were identified and therefore labelled as “Improved client value”, “FM business operations added value”, and “Improved efficiency added value”. Overall, these three principal factors explained 67.8% of the variance.

4.1. Measurement Model

Following the EFA, the 14 observed outcome variables were divided into three latent variables, i.e., Improved Client Value (ICV), FM Business Operations Added Value (FMBOAV), and Improved Efficiency Added Value (IEAV). PLS SEM was used to evaluate the distinctiveness of the measures adopted in the present study. Overall, there are three factor structures. ICV has eight variables, FMBOAV has four, and IEAV has three indicator variables (see Table 3). The OT12 variable was deleted during analysis due to lower factor loading.
Here, BDA outcomes are conceptualized as a Hierarchical Component Model (HCM). The HCM has two components/constructs, i.e., the Higher-Order Component/construct (HOC), which captures the more abstract entity (in this case, BDA outcomes), and the Lower-Order Components/construct (LOC), i.e., ICV, FMBOAV, and IMEAV, which capture the sub-dimensions of the abstract entity. In the literature, there are various HCM types characterized by different relationships (formative and reflective) between the HOC and LOCs and the construct and their indicators. As per [75], the formative model assumes that causality is from each indicator or sub-dimension to the construct, whereas, for the reflective model, the causality is from each construct to the indicator, i.e., where a change in the latent variable affects all indicators. There are several reasons that support the conceptualization of BDA outcomes as a Reflective–Formative model. Firstly, the sub-dimensions, i.e., ICV, FMBOAV, and IMEAV, are the characteristics that define higher-order BDA Outcomes exhibiting inter-correlations and same-directional relationships [76,77,78], suggesting that the three dimensions capturing different outcomes associated with BDA adoption are not interchangeable [79]. Secondly, the three uni-dimensional Lower-order constructs represented by observed indicators not only reflectively specify relevant dimensions but are interchangeable. As recommended by [80,81], the researchers propose that the BDA outcomes are scaled to be best captured as a reflective first-order, formative second-order measurement model.
As depicted in Table 3, the first-order measurement model meets the threshold values for convergent validity and reliability. The outer loadings (ranging from 0.754 to 0.909) exhibit strong relationships with their respective constructs, which is further supported by Cronbach’s α for each construct, indicating high internal consistency (ranging from 0.818 to 0.913). With AVE values ranging from 0.648 to 0.74 > 0.5, the results suggest that each construct shares a significant proportion of variance with its measures. Additionally, the constructs also display high composite reliability with both rho_a and rho_c exceeding the threshold value of 0.7. Overall, the results demonstrate the reliability and convergent validity of the measurement model.
To assess discriminant validity, the Fornell–Larcker criterion and the Heterotrait-Monotrait (HTMT) ratio of correlations were used. The Fornell–Larcker criterion is met (see Table 4—Section A), in that the √AVE for each construct (diagonal values highlighted in bold*) are greater than the off-diagonal values, i.e., the correlations between constructs. Regarding the HTMT ratio (see Table 4—Section B), all the values are less than 0.85 and the loadings of all indicators of the assigned latent construct were greater than the cross-loadings on other constructs (Table 5), indicating that the constructs have good discriminant validity and measure a unique concept.

4.2. Second-Order Formative Construct—Structural Model Analysis

After evaluating the parameters in the first-order reflective model, this study focused on the second-order formative model’s path weighting scheme [68]. In terms of collinearity, Table 6 shows that the variance inflation factor (VIF) values for all first-order constructs range from 1.569 to 2.144, indicating satisfactory reliability. The results also suggest that multicollinearity is not a problem for this study, offering support to the formative conceptualization of BDA Outcomes. Overall, the corresponding significant path weights (exceeding 0.2, significant at p < 0.01) of the first-order constructs on the higher-order construct, along with the construct-to-item loadings, can be seen in Figure 2 and Figure 3. In addition, since all the VIF values are less than 3.3, the data are not exhibiting any concerning signs of method bias.

5. Discussion of Findings

The main objective of this study was to validate a newly developed scale to measure the Outcomes of BDA adoption. Building on three qualitative case studies followed by an industry-wide questionnaire survey from 52 respondents heavily involved with BDA implementation, the researchers validated a three-factor 15-item scale that was extracted through EFA and established through CFA. This is the first empirical study that takes a step forward towards capturing the potential of FM organizations to deliver a host of value-enhancing benefits to their customers and improve their own decision-making based on BDA.
From a theoretical perspective, the results suggest that outcomes of BDA Adoption in an FM context can be conceptualized meaningfully as a multi-dimensional construct. The newly developed construct captures the principal elements of BDA Outcomes; as expected, ‘Improved Client value’ (ICV) emerged at the top, with the largest beta weight of 0.626, suggesting that increased focus on performance measurement and adoption of analytical tools are helping FM organizations to become an integral part of the value creation process [82]. This is closely followed by FM Business Operations Added Value (FMBOAV) with a beta weight of 0.274 and Improved efficiency Added Value (IEAV) with a weight of 0.240, indicating that infusing analytics into critical FM business tasks/operations enables organizations to efficiently plan and manage resources.

5.1. Improved Client Value (ICV)

The indicators of this construct include greater transparency, reduced asset downtime, evidence of engineering compliance, better understanding of asset life-cycles, evidence-based decision-making, new benchmarks for facilities/assets/site performance, and accurate quantification of cost savings for the client.
The findings suggest that organizations leveraging BD capabilities can now focus on client centricity and reinvent the customer experience. This opportunity to not only create value but share it with clients could be regarded as the raison d’être of collaborative customer–supplier relationships [83]. FM BD brings new opportunities for discovering ‘value’. With an emphasized focus on cost savings, FM organizations are increasingly expected to offer comprehensive reporting propositions, benchmarking, engineering compliance of assets/equipment, etc. In a bid to support these objectives, a growing number of FM organizations are investing in BDA and IoT technology to remotely monitor and collect sensor data to better understand the performance of buildings. Self-monitoring ‘smart’ equipment can measure its own performance and spot even the minutest change by comparing the historical operational footprint of an asset to its real-time operating data [84]. Gaining unprecedented visibility and transparency into critical asset performance through condition-based maintenance approaches is not only about de-risking FM operations but also about providing valuable insights into clients’ energy profiles, demonstrating statutory compliance, evidencing decision-making, and reducing the cost of asset ownership [12]. As highlighted by [57], this newfound ability to extend BDA capabilities to their clients allows facilities managers to see the bigger picture and defend their decisions based on supporting information, track trends for preventive maintenance, and provide insight during budget calls. Granular visibility provides FM with direct control over all aspects, from the location to the enterprise level [85].
The current trends suggest that the value of data and analytics has completely upended the traditional FM–client relationship. Increased connectedness is creating unique opportunities for businesses to focus on proactive customer service and innovativeness, thus enhancing the value of the firm’s offering in business-to-business contexts [86]. As highlighted by [87], this aspect is relevant to the FM industry where the customers are often an integral part of the service production process. Therefore, it is not surprising to note that companies at the forefront of data analytics implementation are able to achieve a higher rate of return compared to other recent technologies. Going forward, the FM sector is compelled to make BDA a critical business priority to face the challenges of digitization and make the business more customer-centric.

5.2. FM Business Operations Added Value (FMBOAV)

The indicators of this construct include Seamless data/information mobilization between contracts, Optimization of stock management, Accurate pricing for tenders, and a Lower cost of asset ownership for the client.
Among the benefits reported by organizations was the newly acquired capability to seamlessly mobilize and transfer data between FM contracts. Indeed, the data standardization approach is positively streamlining the whole process of data accumulation for submitting tenders/contracts. According to [12], the positive implications are the generation of value and the contribution to data mobilization, i.e., the transfer of a standardized data set from previous contracts to subsequent ones, and providing supporting statistics. This onset of the analytics journey has transformed the traditional FM process, delivering significant benefits such as improved resource and stock management and greater accuracy in tender pricing. Furthermore, the FM industry is actively involved in developing advanced strategies and techniques to maintain its assets. As such, Condition-based and predictive maintenance are emerging to be major trends in the digitized FM industry. Primarily because these maintenance strategies are enabled by the ‘Internet of Things’ (IoT), they offer remote monitoring of typical FM systems (HVAC, Power, Air Quality, Temperature, Lighting, etc.) [88], provide granular visibility into an asset’s history, optimize FM operations, and in turn decrease the total cost of asset ownership for client organizations [12].

5.3. Improved Efficiency Added Value (IEAV)

This group of indicators addresses how a data-driven approach to workflow management and planning is fostering a culture and learning system that values data usage for continual improvement. The indicators of this construct include productivity in workflow management, better route planning for sub-contractors, i.e., optimization of field crews, and connected business operations.
As maintenance is a complex business area with different processes and a wide range of required competencies [89], it also imposes significant responsibilities on managers with regards to day-to-day facility functions and workflow. Most often, companies dealing with rising maintenance costs seek to cut FM spending by reducing repair interventions to a minimum and delaying preventive maintenance actions, leading to a cascade of extra costs in the medium- and long-term [90]. In addition, such delays could be attributed to the sub-optimal allocation of resources and an unstructured workflow process [91]. However, by making use of information systems and BDA, advanced FM organizations can set rules to automatically assign tasks to specific technicians and monitor their performance in real-time [92]. Therefore, they can reform resource-intensive service delivery processes and optimize manual maintenance tasks to maximize productivity. As per [57], this data-driven approach not only allows the FM team to automate the workflow and resolve problems quickly but also enhances customer satisfaction through reduced response time, downtime, and claims. Furthermore, the resulting improved information management also supports the development initiatives to optimize field crew and better route planning. As suggested, route optimization planning helps with cost efficiencies in transportation. In this instance, based on BDA mapping, managers can assign tasks to field crew based on traffic situations, distance, weather, efficient real-time-based routes, and a host of other factors, reducing mileage and identifying opportunities to improve efficiency.
Furthermore, according to [93], increased connectedness and BDA adoption are creating unique opportunities for FM businesses to make huge strides in carrying out tasks and processes more efficiently. This is achieved by streamlining existing labor-intensive maintenance and freeing up time to spend on value-adding or strategic activities.
However, it should be noted that organizations adopting this data-driven mindset need to cultivate a new culture of decision-making, in that they must be prepared to accept what the “data” indicate, even when the data contradict their observations and experience [94].

6. Conclusions

This study sheds light on the early successes of FM organizations as they evolve into insight-driven organizations by means of an exploratory three-dimensional model of outcomes associated with BDA adoption in the sector. Furthermore, the developed confirmatory model establishes the relationships between fifteen variables and its validated scale can serve as a tool for FM organizations to foster change by highlighting the constructs offering ‘added value’. Specifically, the findings suggest that the contemporary digitization trend offers FM services the unique opportunity to develop a smarter, client-centric strategy by taking advantage of BDA tools and applications (the IoT, digital twins, machine learning initiatives, etc.) and leveraging the data transparency, accuracy, and comprehensive understanding the latter entails. More specifically, an improved client experience lies at the core of the emerging opportunities and creates the conditions for more personalized services and stronger customer relationships. Furthermore, making the most of BDA translates to suitably analyzed business and workflow data able to provide FM teams with evidence to introduce significant value-adding changes to their existing work patterns, field crew operations, and route planning. In this context, BDA adoption is creating a competitive differentiation strategy for FM organizations, resulting from a renewed focus on developing strategies and relationships that enhance the firm’s competitiveness in the marketplace in line with the concept of ‘Competitive Intelligence’. This market-disrupting strategy could certainly help to improve the standing of the FM profession in the world of business and facilitate growth opportunities.

Implications, Limitations, and Further Research Directions

There is no doubt that BDA is emerging as a significant advancement in the FM sector. Through the current study and previous publications [12,58], the researchers have provided insight into how BDA is delivering value to FM organizations in the UK. This research confirms that BDA adoption has the potential to help FM businesses improve their performance in the age of digital transformation by transforming their service approach into a more client-centric model, geared towards efficient operations able to continuously deliver added value. The associated model’s features, as previously presented, are firmly grounded in CFA and have been tested with reliable survey instruments and data from the UK. Since the UK FM sector has a leading role in the industry, this research provides the opportunity for FM managers, consultants, and practitioners worldwide to understand how FM companies can be at the forefront of innovation and leverage BDA’s power to deal with industry dynamics, trends, and changes. This can help them redefine their strategy in the digital business landscape and deepen their understanding and proficiency in navigating the complexities of the sector. Secondarily, this research enriches the limited literature associated with the FM sector’s digital transformation by presenting early BDA implementation outcomes and highlighting the features expected to become the focal point of interest in the fast-approaching digital twin phase. These undoubtedly include BDA applications for improved costing, pricing, and contract monitoring, more efficient personnel and resource management, and an enhanced client experience.
Given that BDA adoption is at a nascent stage and limited to larger organizations, the overall sample size of this research was small (though statistically adequate). Therefore, there may be limitations when generalizing the findings of this study to other developing economies. As the technology adoption gathers pace, future studies could focus on collecting and analyzing larger and more diverse sample frames to include developing countries and small- and medium-sized organizations (SMEs).
As far as future research directions are concerned, the expansion of data analytics over the next few years is anticipated to enhance the capabilities of intelligent building technologies. This growth is poised to drive further progress in building automation systems and equipment standards. However, given its current rudimentary stage of adoption, there are still diverse challenges in attaining market penetration, including legal, interoperability, security, and privacy issues, among others. Therefore, undertaking additional research initiatives is crucial to determining the technology’s full potential and commercial viability to prepare the ground for its widespread adoption as a business tool. Its potential integration with blockchain-based applications is also worth exploring in the future, given that blockchain technology has proven to be a valuable ally in enhancing data analysis speed, accuracy, and security, thereby making a distinct contribution to the direction of efficiency. Additionally, the importance of investing in timely educational initiatives to promote digital skills and capabilities in the FM sector cannot be overstated. This requires extensive research to define the specific needs emerging from the special characteristics of local industries, depending on the geographical context of their operation.

Author Contributions

Conceptualization, A.K., M.M. and L.O.; methodology, A.K. and L.O.; software, A.K.; validation, A.K. and M.M.; formal analysis, A.K.; investigation, M.M. and A.K.; resources, M.M. and A.K.; data curation, M.M. and A.K.; writing—original draft preparation, A.K. and M.M.; writing—review and editing, A.K., M.M. and L.O.; visualization, A.K. and M.M.; supervision, A.K. and M.M.; project administration, A.K.; funding acquisition, A.K., M.M. and L.O. All authors have read and agreed to the published version of the manuscript.

Funding

This work was supported by the RICS Research Trust Fund under Project 492.

Data Availability Statement

Some or all data, models, or code that support the findings of this study are available from the corresponding author upon reasonable request.

Conflicts of Interest

The authors declare no conflict of interest.

References

  1. Oesterreich, T.D.; Schuir, J.; Teuteberg, F. The emperor’s new clothes or an enduring it fashion? Analyzing the lifecycle of industry 4.0 through the lens of management fashion theory. Sustainability 2020, 12, 8828. [Google Scholar] [CrossRef]
  2. Sawhney, A.; Riley, M.; Irizarry, J. (Eds.) Construction 4.0: Introduction and overview. In Construction 4.0: An Innovation Platform for the Built Environment; Routledge: London, UK, 2020. [Google Scholar]
  3. Marinelli, M. From Industry 4.0 to Construction 5.0: Exploring the Path towards Human–Robot Collaboration in Construction. Systems 2023, 11, 152. [Google Scholar] [CrossRef]
  4. Lee, J.Y.; Irisboev, I.O.; Ryu, Y.-S. Literature review on digitalization in facilities management and facilities management performance measurement: Contribution of industry 4.0 in the global era. Sustainability 2021, 13, 13432. [Google Scholar] [CrossRef]
  5. Bibri, S.E. The IoT for smart sustainable cities of the future: An analytical framework for sensor-based big data applications for environmental sustainability. Sustain. Cities Soc. 2018, 38, 230–253. [Google Scholar] [CrossRef]
  6. Munawar, H.S.; Ullah, F.; Qayyum, S.; Shahzad, D. Big Data in Construction: Current Applications and Future Opportunities. Big Data Cogn. Comput. 2022, 6, 18. [Google Scholar] [CrossRef]
  7. Mawed, M.; Aal-Hajj, A. Using big data to improve the performance management: A case study from the UAE FM industry. Facilities 2017, 35, 746–765. [Google Scholar] [CrossRef]
  8. Ranjan, J.; Foropon, C. Big Data Analytics in Building the Competitive Intelligence of Organizations. Int. J. Inf. Manag. 2021, 56, 102231. [Google Scholar] [CrossRef]
  9. Wamba, S.F.; Gunasekaran, A.; Akter, S.; Ren, S.J.-F.; Dubey, R.; Childe, S.J. Big data analytics and firm performance: Effects of dynamic capabilities. J. Bus. Res. 2017, 70, 356–365. [Google Scholar] [CrossRef]
  10. Himeur, Y.; Elnour, M.; Fadli, F.; Meskin, N.; Petri, I.; Rezgui, Y.; Bensaali, F.; Amira, A. AI-big data analytics for building automation and management systems: A survey, actual challenges and future perspectives. Artif. Intell. Rev. 2023, 56, 4929–5021. [Google Scholar] [CrossRef]
  11. Cresswell, J.W.; Cresswell, J.D. Research Design Qualitative, Quantitative, and Mixed Methods Approaches, 6th ed.; Sage: Los Angeles, CA, USA, 2022. [Google Scholar]
  12. Konanahalli, A.; Oyedele, L.O.; Marinelli, M.; Selim, G. Big Data: A New Revolution in UK Facilities Management Sector. RICS Research Trust Report. 2018. Available online: https://www.rics.org/globalassets/rics-website/media/knowledge/research/research-reports/big-data-a-new-revolution-in-the-uk-fm-sector-rics.pdf (accessed on 4 July 2024).
  13. Robson, C.; McCartan, K. Real World Research, A Resource for Users of Social Research Methods in Applied Settings, 4th ed.; Wiley: Chichester, UK, 2016. [Google Scholar]
  14. Dahanayake, K.C.; Sumanarathna, N. IoT-BIM-based digital transformation in facilities management: A conceptual model. J. Facil. Manag. 2022, 20, 437–451. [Google Scholar] [CrossRef]
  15. Maroco, M.; Garofolo, I. Integrating disruptive technologies with FM: A literature review and future research directions. Autom. Constr. 2021, 131, 103917. [Google Scholar] [CrossRef]
  16. Daissaoui, A.; Boulmakoul, A.; Karim, L.; Lbath, A. IoT and Big Data Analytics for Smart Buildings: A Survey. Procedia Comput. Sci. 2020, 170, 161–168. [Google Scholar] [CrossRef]
  17. Bashir, M.R.; Gill, A.Q.; Beydoun, G.; McCusker, B. Big data management and analytics metamodel for IoT-enabled smart buildings. IEEE Access 2020, 8, 169740–169758. [Google Scholar] [CrossRef]
  18. Fan, C.; Yan, D.; Xiao, F.; Li, A.; An, J.; Kang, X. Advanced data analytics for enhancing building performances: From data-driven to big data-driven approaches. Build. Simul. 2021, 14, 3–24. [Google Scholar] [CrossRef]
  19. Sivanuja, T.; Sandanayake, Y.G. Industry 4.0 enabled predictive maintenance of facilities: A study on applicability, benefits and challenges. In Proceedings of the 10th World Construction Symposium, Online, 24–26 June 2022; Sandanayake, Y.G., Gunatilake, S., Waidyasekara, K.G.A.S., Eds.; pp. 585–597. [Google Scholar] [CrossRef]
  20. Bousdekis, A.; Apostolou, D.; Mentzas, G. Predictive maintenance in the 4th industrial revolution: Benefits, business opportunities, and managerial implications. IEEE Eng. Manag. Rev. 2020, 48, 57–62. [Google Scholar] [CrossRef]
  21. Li, Z.; Wang, Y.; Wang, K.S. Intelligent predictive maintenance for fault diagnosis and prognosis in machine centres: Industry 4.0 scenario. Adv. Manuf. 2017, 5, 377–387. [Google Scholar] [CrossRef]
  22. Mannino, A.; Dejaco, M.C.; Cecconi, F.R. Building information modelling and internet of things integration for facility management—Literature review and future needs. Appl. Sci. 2021, 11, 3062. [Google Scholar] [CrossRef]
  23. Huang, Y.; Shi, Q.; Zuo, J.; Pena-Mora, F.; Chen, J. Research Status and Challenges of Data-Driven Construction Project Management in the Big Data Context. Adv. Civ. Eng. 2021, 2021, 6674980. [Google Scholar] [CrossRef]
  24. Halmetoja, E. The conditions data model supporting building information models in facility management. Facilities 2019, 37, 484–501. [Google Scholar] [CrossRef]
  25. Elnour, M.; Meskin, N.; Khan, K.; Jain, R. Application of data-driven attack detection framework for secure operation in smart buildings. Sustain. Cities Soc. 2021, 69, 102816. [Google Scholar] [CrossRef]
  26. Manyika, J.; Chui, M.; Brown, B.; Bughin, J.; Dobbs, R.; Roxburgh, C.; Byers, A.H. Big Data: The Next Frontier for Innovation, Competition, and Productivity. McKinsey Global Institute. 2011. Available online: https://www.mckinsey.com/capabilities/mckinsey-digital/our-insights/big-data-the-next-frontier-for-innovation (accessed on 30 March 2023).
  27. Marshall, A.; Mueck, S.; Shockley, R. How leading organizations use big data and analytics to innovate. Strategy Leadersh. 2015, 43, 32–39. [Google Scholar] [CrossRef]
  28. Bumblauskas, D.; Nold, H.; Bumblauskas, P.; Igou, A. Big data analytics: Transforming data to action. Bus. Process Manag. J. 2017, 23, 703–720. [Google Scholar] [CrossRef]
  29. Madanayake, U.H.; Egbu, C. Critical analysis for big data studies in construction: Significant gaps in knowledge. Built Environ. Proj. Asset Manag. 2019, 9, 530–547. [Google Scholar] [CrossRef]
  30. Atuahene, B.T.; Kanjanabootra, S.; Gajendran, T. Benefits of big data application experienced in the construction industry: A case of an Australian construction company. In Proceedings of the 36th Annual Conference of Association of Researchers in Construction Management, Online, UK, 7–8 September 2020; pp. 346–355. [Google Scholar]
  31. Ahmed, V.; Tezel, A.; Aziz, Z.; Sibley, M. The future of Big Data in facilities management: Opportunities and challenges. Facilities 2017, 35, 725–745. [Google Scholar] [CrossRef]
  32. Caglayan, B.; Turhan, B.; Bener, A.; Habayeb, M.; Miransky, A.; Cialini, E. Merits of Organizational Metrics in Defect Prediction: An Industrial Replication. In Proceedings of the International Conference on Software Engineering, Florence, Italy, 16–24 May 2015; Volume 2, p. 7202953. [Google Scholar]
  33. Nota, G.; Peluso, D.; Lazo, A.T. The contribution of Industry 4.0 technologies to facility management. Int. J. Eng. Bus. Manag. 2021, 13, 24131. [Google Scholar] [CrossRef]
  34. Bolpagni, M.; Gavina, R.; Ribeiro, D.; Arnal, I.P. Shaping the Future of Construction Professionals in Industry 4.0. In Structural Integrity; Correia, J.A.F.O., de Jesus, A.M.P., Eds.; Springer: Cham, Swizterland, 2022; Volume 20, pp. 1–28. [Google Scholar]
  35. Marinelli, M.; Janardhanan, M. The Value Proposition of Machine Learning in Construction Management: Exploring the Trends in Construction 4.0 and Beyond. In Artificial Intelligence and Machine Learning Techniques for Civil Engineering; Plevris, V., Ahmad, A., Lagaros, N.D., Eds.; IGI Global: Hershey, PA, USA, 2023; pp. 246–272. [Google Scholar]
  36. Turk, Ž.; de Soto, B.G.; Mantha, B.R.K.; Maciel, A.; Georgescu, A. A systemic framework for addressing cybersecurity in construction. Autom. Constr. 2022, 133, 103988. [Google Scholar] [CrossRef]
  37. Forcael, E.; Ferrari, I.; Opazo-Vega, A.; Pulido-Arcas, J.A. Construction 4.0: A literature review. Sustainability 2020, 12, 9755. [Google Scholar] [CrossRef]
  38. Li, Y.; Sun, H.; Li, D.; Song, J.; Ding, R. Effects of Digital Technology Adoption on Sustainability Performance in Construction Projects: The Mediating Role of Stakeholder Collaboration. J. Manag. Eng. 2022, 38, 04022016. [Google Scholar] [CrossRef]
  39. Kineber, A.F.; Oke, A.; Hamed, M.M.; Alyanbaawi, A.; Elmansoury, A.; Daoud, A.O. Decision Making Model for Identifying the Cyber Technology Implementation Benefits for Sustainable Residential Building: A Mathematical PLS-SEM Approach. Sustainability 2023, 15, 2458. [Google Scholar] [CrossRef]
  40. Nguyen, T.-T.-N.; Do, S.T.; Nguyen, V.T.; Nguyen, T.A. Interrelationships among enabling factors for BIM adoption in construction enterprises. Eng. Constr. Archit. Manag. 2024, 31, 891–918. [Google Scholar] [CrossRef]
  41. Nguyen, T.-T.-N.; Nguyen, T.A.; Do, S.T.; Nguyen, V.T. Developing a structural model of stakeholders’ behavior toward BIM adoption in construction enterprises. Int. J. Constr. Manag. 2024, 24, 1038–1053. [Google Scholar] [CrossRef]
  42. Zhang, L.; Chu, Z.; He, Q.; Zhai, P. Investigating the constraints to buidling information modeling (BIM) applications for sustainable building projects: A case of China. Sustainability 2019, 11, 1896. [Google Scholar] [CrossRef]
  43. Waqar, A.; Qureshi, A.H.; Alaloul, W.S. Barriers to Building Information Modeling (BIM) Deployment in Small Construction Projects: Malaysian Construction Industry. Sustainability 2023, 15, 2477. [Google Scholar] [CrossRef]
  44. Caglayan, S.; Ozorhon, B. Determining building information modeling effectiveness. Autom. Constr. 2023, 151, 104861. [Google Scholar] [CrossRef]
  45. Oke, A.E.; Kineber, A.F.; Olanrewaju, O.I.; Omole, O.; Jamir Singh, P.S.; Samsurijan, M.S.; Ramli, R.A. Exploring the 4IR Drivers for Sustainable Residential Building Delivery from Social Work Residential Perspective—A Structural Equation Modelling Approach. Sustainability 2023, 15, 468. [Google Scholar] [CrossRef]
  46. Oke, A.E.; Kineber, A.F.; Al-Bukhari, I.; Famakin, I.; Kingsley, C. Exploring the benefits of cloud computing for sustainable construction in Nigeria. J. Eng. Des. Technol. 2023, 21, 973–990. [Google Scholar] [CrossRef]
  47. Adekunle, P.; Aigbavboa, C.; Akinradewo, O.; Ikuabe, M.; Otasowie, K. Towards the Uptake of Digital Technologies for Construction Information Management: A Partial Least Squares Structural Equation Modelling Approach. Buildings 2024, 14, 827. [Google Scholar] [CrossRef]
  48. Distel, B.; Plattfaut, R.; Kregel, I. How business process management culture supports digital innovation: A quantitative assessment. Bus. Process Manag. J. 2023, 29, 1352–1385. [Google Scholar] [CrossRef]
  49. Han, K.K.; Golparvar-Fard, M. Potential of big visual data and building information modeling for construction performance analytics: An exploratory study. Autom. Constr. 2017, 73, 184–198. [Google Scholar] [CrossRef]
  50. Shvets, Y.; Hanák, T. Use of the internet of things in the construction industry and facility management: Usage examples overview. Procedia Comput. Sci. 2023, 219, 1670–1677. [Google Scholar] [CrossRef]
  51. Atta, N.; Talamo, C. Digital transformation in facility management (FM); IoT and big data for service innovation. Res. Dev. 2020, 1, 267–278. [Google Scholar]
  52. Demirdöğen, G.; Diren, N.S.; Aladağ, H.; Işık, Z. Lean Based Maturity Framework Integrating Value, BIM and Big Data Analytics: Evidence from AEC Industry. Sustainability 2021, 13, 10029. [Google Scholar] [CrossRef]
  53. Qiang, G.; Tang, S.; Hao, J.; Di Sarno, L. BIM, IoT, and Big Data Integration Framework in the Green Building Industry. Lect. Notes Civ. Eng. 2024, 393, 15–23. [Google Scholar]
  54. Xia, W.; Zheng, Y.; Huang, L.; Liu, Z. Integration of Building Information Modeling (BIM) and Big Data in China: Recent Application and Future Perspective. Buildings 2023, 13, 2435. [Google Scholar] [CrossRef]
  55. Rathore, M.M.; Ahmad, A.; Paul, A.; Rho, S. Urban planning and building smart cities based on the Internet of Things using Big Data analytics. Comput. Netw. 2016, 101, 63–80. [Google Scholar] [CrossRef]
  56. Kriswanto, J.; Toshio, M. Building an implementation model for IoTand Big Data and its improvement. Int. J. Technol. 2021, 12, 1000–1008. [Google Scholar]
  57. Yang, E.; Bayapu, I. Big Data analytics and facilities management: A case study. Facilities 2020, 38, 268–281. [Google Scholar] [CrossRef]
  58. Konanahalli, A.; Marinelli, M.; Oyedele, L. Drivers and Challenges Associated with the Implementation of Big Data within U.K. Facilities Management Sector: An Exploratory Factor Analysis Approach. IEEE Trans. Eng. Manag. 2022, 69, 916–929. [Google Scholar] [CrossRef]
  59. Cochran, W.G. Sampling Techniques, 3rd ed.; John Wiley & Sons: New York, NY, USA, 1977. [Google Scholar]
  60. Krejcie, R.V.; Morgan, D.W. Determining sample size for research activities. Educ. Psychol. Meas. 1970, 30, 607–610. [Google Scholar] [CrossRef]
  61. Aghimien, D.; Aigbavboa, C.; Aghimien, L.; Oke, A.; Thwala, W. Unearthing the Factors Impeding Sustainable Construction in Developing Countries—A PLS-SEM Approach. In Emerging Research in Sustainable Energy and Buildings for a Low-Carbon Future, Advances in Sustainability Science and Technology; Howlett, R.J., Littlewood, J.R., Jain, L.C., Eds.; Springer: Singapore, 2021. [Google Scholar]
  62. Chin, W.W.; Marcolin, B.L.; Newsted, P.R. A partial least squares latent variable modeling approach for measuring interaction effects: Results from a Monte Carlo simulation study and an electronic-mail emotion/adoption study. Inf. Syst. Res. 2003, 14, 189–217. [Google Scholar] [CrossRef]
  63. Haenlein, M.; Kaplan, A.M. A beginner’s guide to partial least squares analysis. Underst. Stat. 2004, 3, 283–297. [Google Scholar] [CrossRef]
  64. Wong, K.K.K. Partial least squares structural equation modeling (PLS-SEM) techniques using SmartPLS. Mark. Bull. 2013, 24, 1–32. [Google Scholar]
  65. Chin, W.W.; Newsted, P.R. Structural Equation Modeling Analysis with Small Samples Using Partial Least Squares. Stat. Strateg. Small Sample Res. 1999, 1, 1307–1341. [Google Scholar]
  66. Hair, J.F.; Black, W.; Babin, B.; Anderson, R.; Tatham, R. Multivariate Data Analysis, 6th ed.; Prentice Hall: Upper Saddle River, NJ, USA, 2006. [Google Scholar]
  67. Becker, J.M.; Klein, K.; Wetzels, M. Hierarchical Latent Variable Models in PLS-SEM: Guidelines for Using Reflective-Formative Type Models. Long Range Plan. 2012, 45, 359–394. [Google Scholar] [CrossRef]
  68. Tabish, S.Z.S.; Jha, N.K. Success Traits for a Construction Project. J. Constr. Eng. Manag. 2012, 138, 1131–1138. [Google Scholar] [CrossRef]
  69. Henseler, J.; Ringle, C.M.; Sarstedt, M. A new criterion for assessing discriminant validity in variance-based structural equation modelling. J. Acad. Mark. Sci. 2015, 43, 115–135. [Google Scholar] [CrossRef]
  70. Fornell, C.; Larcker, D. Evaluating structural equation models with unobservable variables and measure. J. Mark. Res. 1981, 18, 39–50. [Google Scholar] [CrossRef]
  71. Lohmoller, J.B. Latent Variable Path Modeling with Partial Least Squares; Physica-Verlag: Heidelberg, Germany, 1989. [Google Scholar]
  72. Greene, G.; D’Arcy, J. Assessing the Impact of Security Culture and the Employee-Organisation Relationship on is Security Compliance. Presented at the 5th Annual Symposium on Information Assurance, New York, NY, USA, 4–6 June 2010. [Google Scholar]
  73. Kock, N.; Lynn, G.S. Lateral Collinearity and Misleading Results in Variance-Based Sem: An Illustration and Recommendations. J. Assoc. Inf. Syst. 2012, 13, 546–580. [Google Scholar] [CrossRef]
  74. Diamantopoulos, A.; Siguaw, J. Formative versus reflective indicators in organizational measure development: A comparison and empirical illustration. Br. J. Manag. 2006, 17, 263–282. [Google Scholar] [CrossRef]
  75. Bollen, K.A. Structural Equations with Latent Variables; John Wiley & Sons: Hoboken, NJ, USA, 1989. [Google Scholar] [CrossRef]
  76. MacKenzie, S.B.; Podsakoff, P.M.; Podsakoff, N.P. Construct measurement and validation procedures in MIS and behavioral research: Integrating new and existing techniques. MIS Q. 2011, 35, 293–334. [Google Scholar] [CrossRef]
  77. Polites, G.L.; Roberts, N.; Thatcher, J. Conceptualizing models using multidimensional constructs: A review and guidelines for their use. Eur. J. Inf. Syst. 2012, 21, 22–48. [Google Scholar] [CrossRef]
  78. Coltman, T.; Devinney, T.M.; Midgley, D.F.; Venaik, S. Formative versus reflective measurement models: Two applications of formative measurement. J. Bus. Res. 2008, 61, 1250–1262. [Google Scholar] [CrossRef]
  79. Diamantopoulos, A.; Winklhofer, H.M. Index construction with formative indicators: An alternative to scale development. J. Mark. Res. 2001, 38, 269–277. [Google Scholar] [CrossRef]
  80. Diamantopoulos, A.; Riefler, P.; Roth, K.P. Advancing Formative Measurement Models. J. Bus. Res. 2008, 61, 1203–1218. [Google Scholar] [CrossRef]
  81. Wetzels, M.; Oderkerken-Schröder, G.; van Oppen, C. Using PLS path modeling for assessing hierarchical construct models: Guidelines and empirical illustration. MIS Q. 2009, 33, 177–195. [Google Scholar] [CrossRef]
  82. de Valence, G. The FM Industry and adding value to clients. In Proceedings of the Third European Research Symposium in Facilities Management, Copenhagen, Denmark, 12–14 May 2004; Brochner, J., Haugen, T.I., Eds.; [Google Scholar]
  83. Anderson, J.C. Relationships in business markets: Exchange episodes, value creation, and their empirical assessment. J. Acad. Mark. Sci. 1995, 23, 346–350. [Google Scholar] [CrossRef]
  84. Reed, M. Understanding How Predictive Analytics Tools Benefit Power Utility Asset Management; Schneider: Le Creusot, France, 2015. [Google Scholar]
  85. Cline, G. Make Facilities Management Data-Driven and Transparent. Aberdeen Strategy and Research. 2018. Available online: https://www.aberdeen.com/cfo-essentials/make-facilities-management-data-driven-transparent/ (accessed on 4 July 2024).
  86. Kumar, A.; Grisaffe, D.B. Effects of extrinsic attributes in perceived quality, customer value and behavioral intentions in B2B settings: A comparison across goods and service industries. J. Bus.-Bus. Mark. 2004, 11, 43–74. [Google Scholar] [CrossRef]
  87. Jensen, P.A.; Sarasoja, A.L.; Van der Voordt, T.; Coenen, C. How can Facilities Management add value to organisations as well as to society? In Proceedings of the CIB World Building Congress, Brisbane, Australia, 5–9 May 2013. [Google Scholar]
  88. Patel, B. Three Steps for Using the Digital Revolution to Reduce Downtime and Improve Operational Efficiencies in Your Facility; Schnieder White Paper; Schnieder: Le Creusot, France, 2015. [Google Scholar]
  89. Cigolini, R.; Fedele, L.; Garetti, M.; Macchi, M. Recent advances in maintenance and facility management. Prod. Plan. Control 2008, 19, 279–286. [Google Scholar] [CrossRef]
  90. De Marco, A.; Ruffa, S.; Mangano, G. Strategic factors affecting warehouse maintenance costs. J. Facil. Manag. 2010, 8, 104–113. [Google Scholar] [CrossRef]
  91. Yousefli, Z.; Nasiri, F.; Moselhi, O. Maintenance workflow management in hospitals: An automated multi-agent facility management system. J. Build. Eng. 2020, 32, 101431. [Google Scholar] [CrossRef]
  92. Tan, J. Increasing Facilities Management Operational Efficiency with Workflow Automation. 2021. Available online: https://blog.facilitybot.co/increasing-facilities-management-operational-efficiency-with-workflow-automation/ (accessed on 4 July 2024).
  93. Institute of Work and Facilities Management (IWFM). The Technology Impact: Embracing Technology to Move FM Forward Report; IWFM: London, UK, 2018. [Google Scholar]
  94. McAfee, A.; Brynjolfsson, E. Big data: The management revolution. Harv. Bus. Rev 2012, 90, 60–68. [Google Scholar] [PubMed]
Figure 1. Research Design adopted in the current study.
Buildings 14 02083 g001
Figure 2. PLS-SEM Model.
Buildings 14 02083 g002
Figure 3. Reflective–Formative Path Model BDA Outcomes.
Buildings 14 02083 g003
Table 1. Outcome Variables.
Code OutcomesMean
OT1Evidence-based decision making3.92
OT2Better understanding of asset life-cycle3.82
OT3Optimization of stock management3.35
OT4Accurate pricing for tenders3.37
OT5Accurate quantification of cost savings for the client3.75
OT6Seamless data/information mobilization between contracts3.33
OT7Lower the cost of asset ownership for the client3.55
OT8Greater transparency in reporting to the client4.04
OT9Evidence of engineering compliance3.88
OT10Reduced asset downtime3.73
OT11New benchmarks for facilities/assets/site performance3.75
OT12Demonstrable return on investment for the client3.65
OT13Productivity in workflow management3.67
OT14Better route planning for sub-contractors, i.e., optimization of field crews3.53
OT15Connected business operations3.71
Table 2. Rotated Component Matrix.
Rotated Component Matrix
Collective Label Component
123Cronbach’s αVariance
Explained
Improved Client Value (ICV)Greater transparency in reporting to the client (OT8)0.813 0.9127.74%
Reduced asset downtime (OT10)0.811
Evidence of engineering compliance (OT9)0.709
Better understanding of asset life-cycle (OT2)0.669
Evidence-based decision-making (OT1)0.630
New benchmarks for facilities/assets/site performance (OT11)0.630
Accurate quantification of cost savings for the client (OT5)0.600
Demonstrable return on investment for the client (OT12)0.579
FM Business Operations Added Value
(FMBOAV)
Seamless data/information mobilization between contracts (OT6) 0.798 0.8222.18%
Optimization of stock management (OT3) 0.738
Accurate pricing for tenders (OT4) 0.737
Lower the cost of asset ownership for the client (OT7) 0.659
Improved Efficiency Added Value
(IEAV)
Productivity in workflow management (OT13) 0.8390.8217.87%
Better route planning for sub-contractors, i.e., optimization of field crews (OT14) 0.802
Connected business operations (OT15) 0.684
Table 3. Convergent Validity of BDA Outcomes.
ConstructItemFactor LoadingCronbach’sComposite Reliability (CR)
CR (rho_a) CR (rho_c)
Average Variance Extracted (AVE)
FM Business Operations Added Value (FMBOAV)OT30.8010.8180.8190.880.648
OT40.814
OT60.849
OT70.754
Improved Client Value (ICV)OT10.7810.9130.9150.9310.657
OT100.864
OT110.770
OT20.843
OT50.829
OT80.794
OT90.789
Improved Efficiency Added Value (IEAV)OT130.8440.8230.8280.8950.74
OT140.909
OT150.825
Table 4. Discriminant Validity of the Measurement Model.
Discriminant Validity
A. Fornell–Larcker CriterionB. Heterotrait-Monotrait (HTMT)
ICVIEAVFMBOAV ICVIEAVFMBOAV
ICV0.811 * ICV
IEAV0.5850.86 * IMEAV0.673
FMBOAV0.6710.4990.805 *FMBOAV0.7730.603
Table 5. Cross-Loadings of BDA Outcomes.
ICVERMPFMBOAV
OT100.9030.4810.586
OT110.8050.4960.636
OT20.8810.5020.681
OT50.8670.6550.706
OT80.830.480.466
OT90.8250.5960.495
OT10.8170.4250.618
OT130.5150.9280.357
OT140.5580.8350.532
OT150.5040.9070.527
OT30.5880.3950.885
OT40.570.5370.899
OT60.5110.4170.939
OT70.5870.4110.834
Table 6. Analysis of the Formative Higher-Order Measurement Model.
VIFβTp-Values
FMBAV -> BDA Outcomes1.8780.2747.8040.01
ICV -> BDA Outcomes2.1440.62614.0290.01
IEAV -> BDA Outcomes1.5690.2409.3090.01
Disclaimer/Publisher’s Note: The statements, opinions and data contained in all publications are solely those of the individual author(s) and contributor(s) and not of MDPI and/or the editor(s). MDPI and/or the editor(s) disclaim responsibility for any injury to people or property resulting from any ideas, methods, instructions or products referred to in the content.

