Article

Experimental and Numerical Study of Newly Assembled Lightweight Radiant Floor Heating System

1
Faculty of Infrastructure Engineering, Dalian University of Technology, Dalian 116024, China
2
School of Architecture and Fine Art, Dalian University of Technology, Dalian 116024, China
*
Author to whom correspondence should be addressed.
Buildings 2024, 14(7), 2096; https://doi.org/10.3390/buildings14072096
Submission received: 29 May 2024 / Revised: 23 June 2024 / Accepted: 1 July 2024 / Published: 9 July 2024
(This article belongs to the Section Building Energy, Physics, Environment, and Systems)

Abstract

:
In this study, the heating capacity of a new prefabricated assembled hot water radiant modular heating system made from a recycled waste building masonry structure is investigated through experimental and numerical simulation methods. The heating capacity of the system in different working conditions (a water supply temperature of 48 °C, 51 °C, 56 °C, and 61 °C; a flow rate of 0.49 m3/h, 0.35 m3/h, and 0.21 m3/h) is analyzed and verified. A three-dimensional steady-state heat transfer numerical model of the floor heat transfer of the module is established, and the accuracy of the model is verified through the measured results to investigate the heating capacity of this system under different water supply temperatures, flow rates and coil spacings. The results show that the new prefabricated hot water radiant module heating system has a 0.9 °C higher air temperature and 2.1 °C higher average floor surface temperature than the traditional wet floor radiant heating system under the same experimental conditions, and the response time is 44% shorter. The water supply temperature can significantly change the heating capacity of the system, while the water supply flow rate has little effect on the system. The established three-dimensional steady-state numerical model can be in good agreement with the measured results. This study can provide an experimental and theoretical basis for the design and application of such systems.

Graphical Abstract

1. Introduction

Heating is a major area of China’s livelihood construction. According to the Annual Development Report on Building Energy Efficiency in China (2020), heating energy consumption in northern Chinese cities and towns accounted for 21% of the total building energy consumption nationwide in 2018 [1]. It is of great practical significance to reduce heating energy consumption for developing a resource-saving society. At present, a variety of heating methods exist in China, among which the radiant floor heating system is widely used in the field of building heating because of its comfort, energy efficiency, and other advantages. A conventional radiant floor heating system (i.e., a concrete- or cement mortar-filled radiant floor heating system) is the most widely used. Meanwhile, various types of dry radiant floor heating systems and wet radiant floor heating systems have emerged. Therefore, it is one of the trends in this field to improve and optimize the existing radiant floor heating system, as well as the thermal performance and heating characteristics of the new system.
Many scholars have studied the wet radiant floor heating system, mainly focusing on the methods of calculating the heating capacity, construction, indoor thermal comfort, and system energy consumption. For the calculation methods of wet systems, Weitzmann et al. [2] established a two-dimensional numerical model of the floor heating system, simulated the heat loss and temperature field of the system, and explored the influence of the floor structure and foundation on the performance of the floor heating system. To accurately predict the energy consumption of such a system, Richard K. Strand integrated a transient two-dimensional heat conduction model with a heat balance-based simulation, demonstrating the potential loss of accuracy associated with one-dimensional radiant system models by providing a comparison of one- and two-dimensional solutions. The experimental results showed that using a 1D solution can be slightly faster in terms of computation time, but might overpredict energy consumption slightly [3]. Jin et al. [4] derived a new formula for estimating the floor surface temperature of radiant floor heating/cooling systems. Li et al. [5] proposed an analytical solution for the heat transfer process of the floor structure of a radiant floor heating system based on the heat transfer process of a multilayer floor, equivalent thermal resistance and a variable separation method. Zhang et al. [6] simplified the calculation of the average surface temperature as well as the surface temperature distribution of a radiant floor heating and cooling system. Wu et al. [7] developed a simplified model for calculating the surface temperature and heat transfer of a radiant floor heating/cooling system using shape factors. Ding et al. [8] developed a simplified calculation method for calculating the heating capacity, heat loss, and surface temperature of a radiant floor heating system with a high-performance insulation layer. Oumayma Babaharra et al. [9] evaluated the PCM underfloor heating system based on a two-dimensional computation physical model, and made calculations using the enthalpy approach and the numerical finite volume method. The effect of different parameters such as microcapsule integration, mass fraction, tube inter-distance and PCM type on the heated floor’s thermal performance were evaluated and discussed. The obtained results showed that the best performance of the heated floor was reached when 15% of microcapsules were placed above the heating tubes. For floor heating system structures, Sattari et al. [10] investigated the effect of design parameters (such as pipe diameter, type (material), number, thickness, and finish layer material) on the heating performance of a radiant floor heating system using the finite element method. Ngo C et al. [11] investigated the effect of pipe spacing, burial depth, temperature, and backfill medium on the system performance in the design of a radiant floor heating system. Qi et al. [12] developed a mathematical model of two-dimensional steady-state heat transfer and simulated the ground temperature distribution with different flooring materials. In addition, the thermal comfort of floor heating systems and their energy consumption have also received attention from a wide range of scholars. Ren et al. [13] established a dynamic thermal model for radiant floor heating rooms based on the characteristics of the thermal processes in the rooms. Zhao et al. [14] investigated the indoor comfort of rooms with a radiant floor heating system via experimental and numerical simulation methods. Yang et al. [15] analyzed the performance of a solar-assisted radiant floor heating system for domestic use in cold regions (Jinan as an example). Baek et al. [16] analyzed the thermal performance and energy saving potential of a PCM radiant floor heating system based on wet hot water radiation using EnergyPlus. Haruka Kitagawa et al. [17] investigated the applicability of a thermal energy simulation (TES) for a naturally ventilated building in which a phase change material (PCM)-based radiant floor cooling system was installed. The obtained results show that the maximum liquid fraction influenced the retention of the thermal storage effect of the PCM and the proposed system using the PCM achieved a thermal comfort period of up to 68.5% a year.
Wet floor heating systems are widely used in the building heating field due to their own advantages, but they also have their own inherent drawbacks. Wet radiant floor heating requires a certain infill layer height to level and protect heating pipes, which reduces the usable floor height. The backfill of concrete or cement mortar increases the load of the building The temperature stress makes the floor slab and floor heating structure prone to cracking and cause other problems [18]. Due to the above problems, the dry floor radiant heating system came into existence. As for dry radiant floor heating systems, research has focused mainly on the thermal performance of the system and the heating characteristics of the system under various new structures or materials. Yu et al. [19] and Zhang et al. [20] investigated the temperature field uniformity and heating effect of the dry radiant floor heating system through experiments. Alessio et al. [21] compared the thermal performance of a dry, wet radiant floor, and roof heating system. Yu et al. [22] experimentally investigated the steady-state and dynamic performance of a lightweight radiant floor under heating and cooling conditions. Liu et al. [23] proposed a new lightweight radiant floor heating system with an aluminum layer, and the results showed that the average floor surface temperature, heat transfer rate, and annual extraction cost of the new system were better than those of the conventional system. Werner-Juszczuk et al. [24] presented a structure for lightweight radiant floor heating using a radiant polyethylene sheet coated with a thin aluminum layer, and performed experiments and numerical calculations to determine its thermal performance. Long Ni et al. [25] designed a micro-hole radiant plate without adding a dynamic and piping system and conducted an experimental study on the heating performance of the micro-hole radiant plate under different installation conditions. The experimental results showed that the indoor average temperature under various installation types basically met the set requirements, and the deviation was within 1 °C. In summary, many scholars have conducted more complete research on the radiant floor heating system, because the conventional system has been backed up by mature theory and experiment-related research. The dry floor radiant heating system has also been studied by many scholars, but the dry floor heating structures proposed at present are mostly of the sheet type, and face problems such as insufficient structural load bearing capacity and high composite module costs [26]. Based on such problems, this study investigates a new prefabricated dry floor heating structure, the main body of which is composed of a waste building masonry structure; it has good structural mechanical properties, comes with low costs and can recycle building fertilizer, having a positive impact on reducing building construction costs and building carbon emissions. Now, there are few relevant studies on this system.

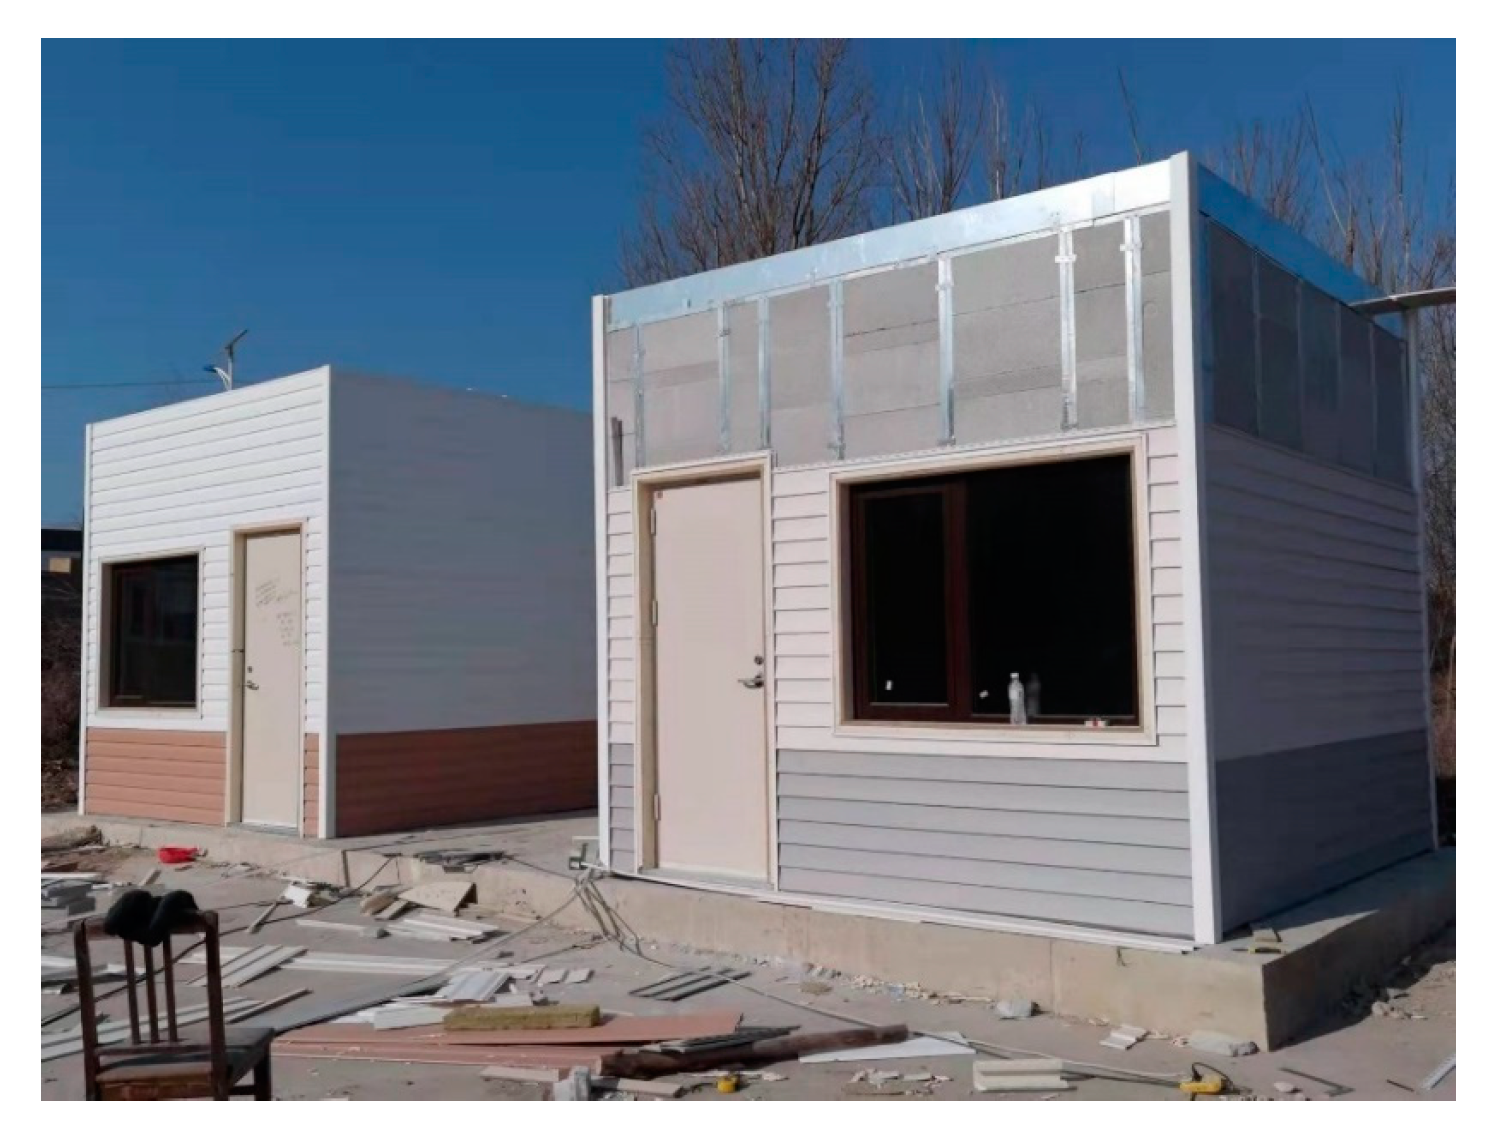
2. Experimental Research

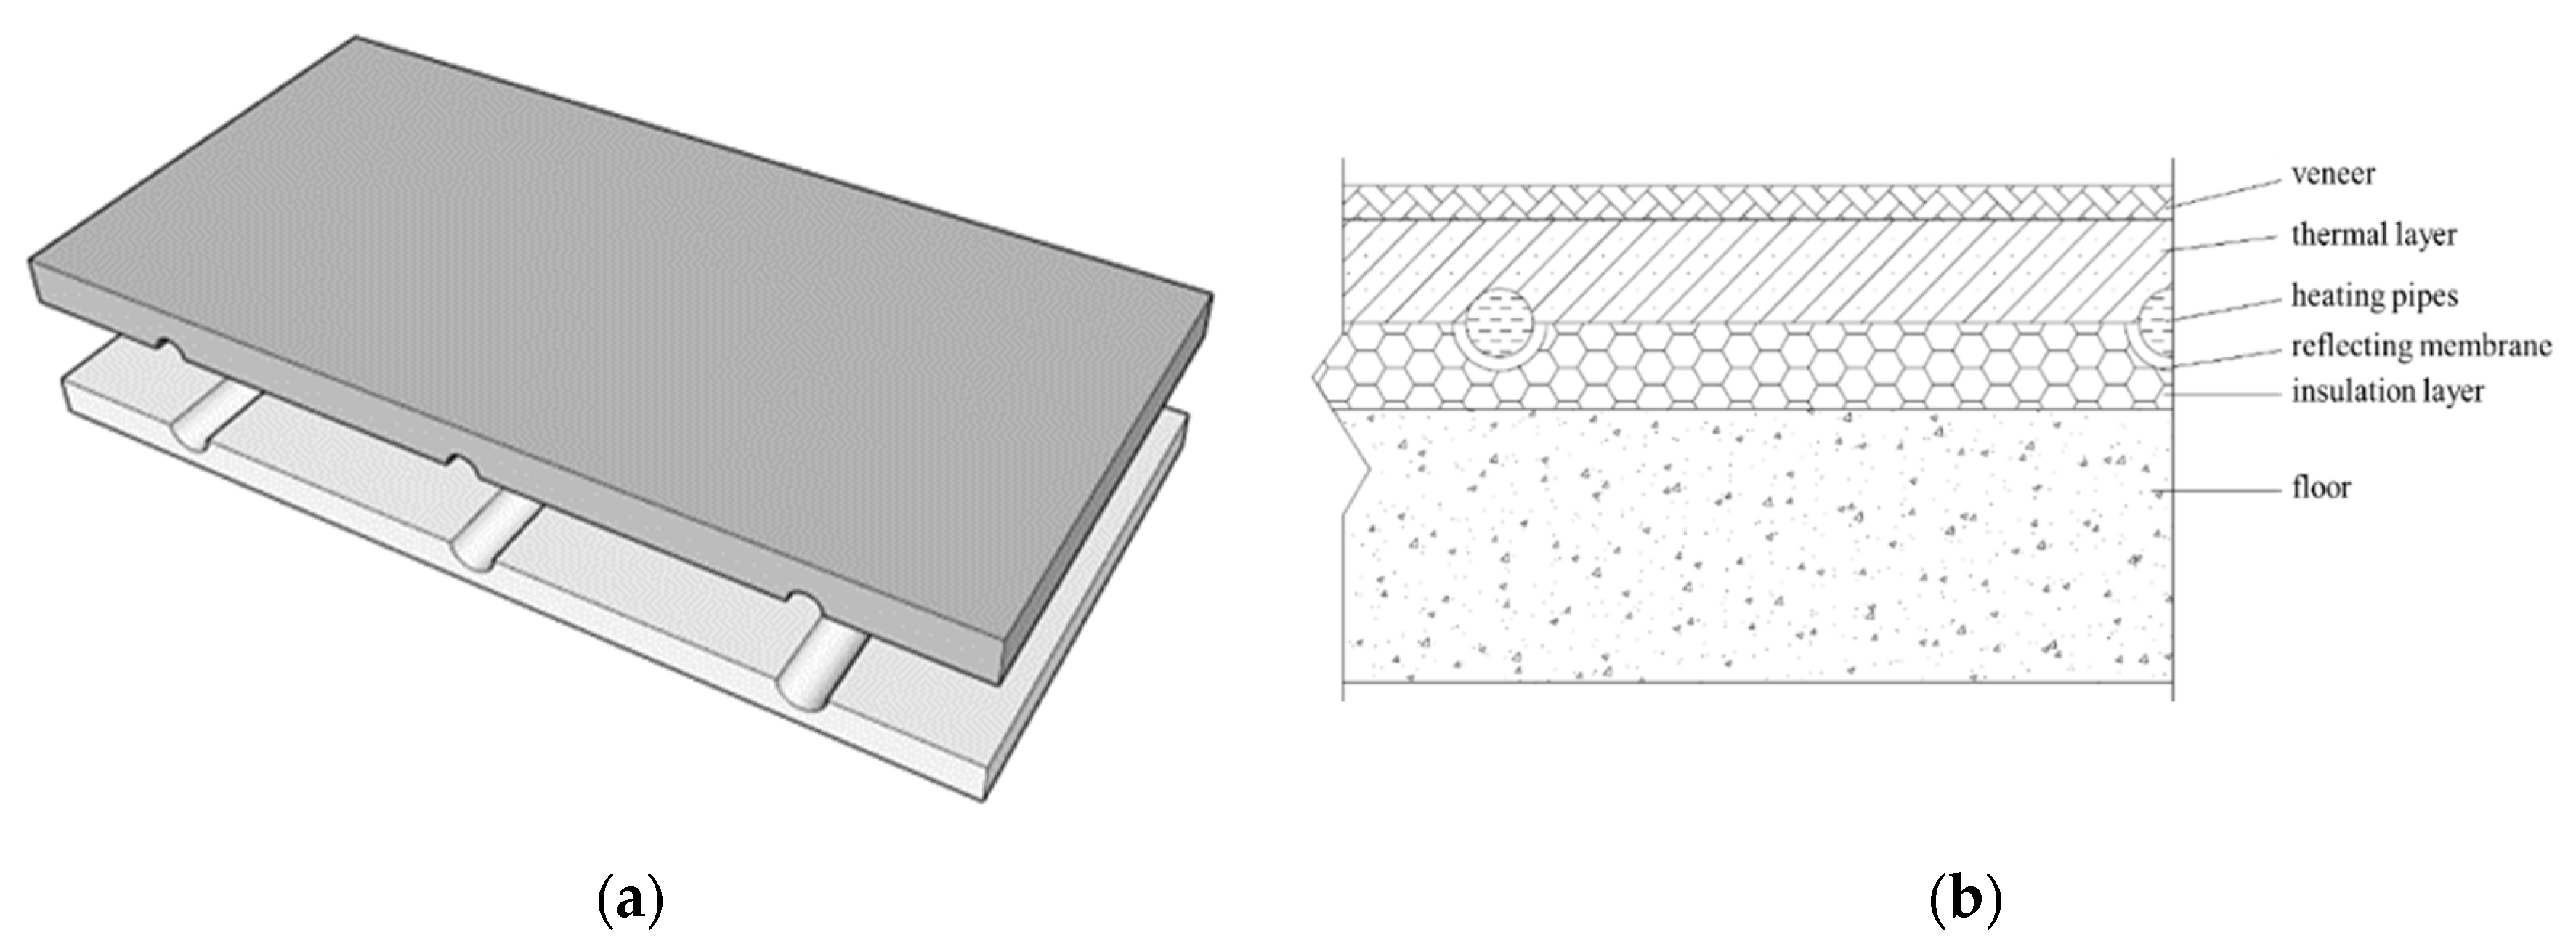
2.1. Assembled Geothermal Module Structure

The prefabricated assembled hot water module studied in this paper is structurally divided into two parts: the upper plate and the lower plate. The upper plate is connected to the finish layer, which resembles the thermal conductivity. The lower plate is near the floor slab, which has small thermal conductivity, and serves as the insulation layer. The surface of the structural lower plate of the module in use is covered with highly reflective film, as shown in Figure 1. The upper and lower plates have fixed-size grooves at corresponding positions for laying heating pipes. Figure 2 shows a schematic diagram of this prefabricated assembly module. The spacing and the size of the grooves can be adjusted during production to match different design solutions. During use, the module is laid directly on the floor slab. After the lower slab is laid, the heating pipes are set along the trench in a certain circuit, and the upper slab is installed on top of it, with fixed connections between the lower and upper slabs to ensure the corresponding position and stable connection between them. When the pipe is laid in the trench, there is a bracket under the pipe to ensure a close fit between the heating pipe and the upper plate.

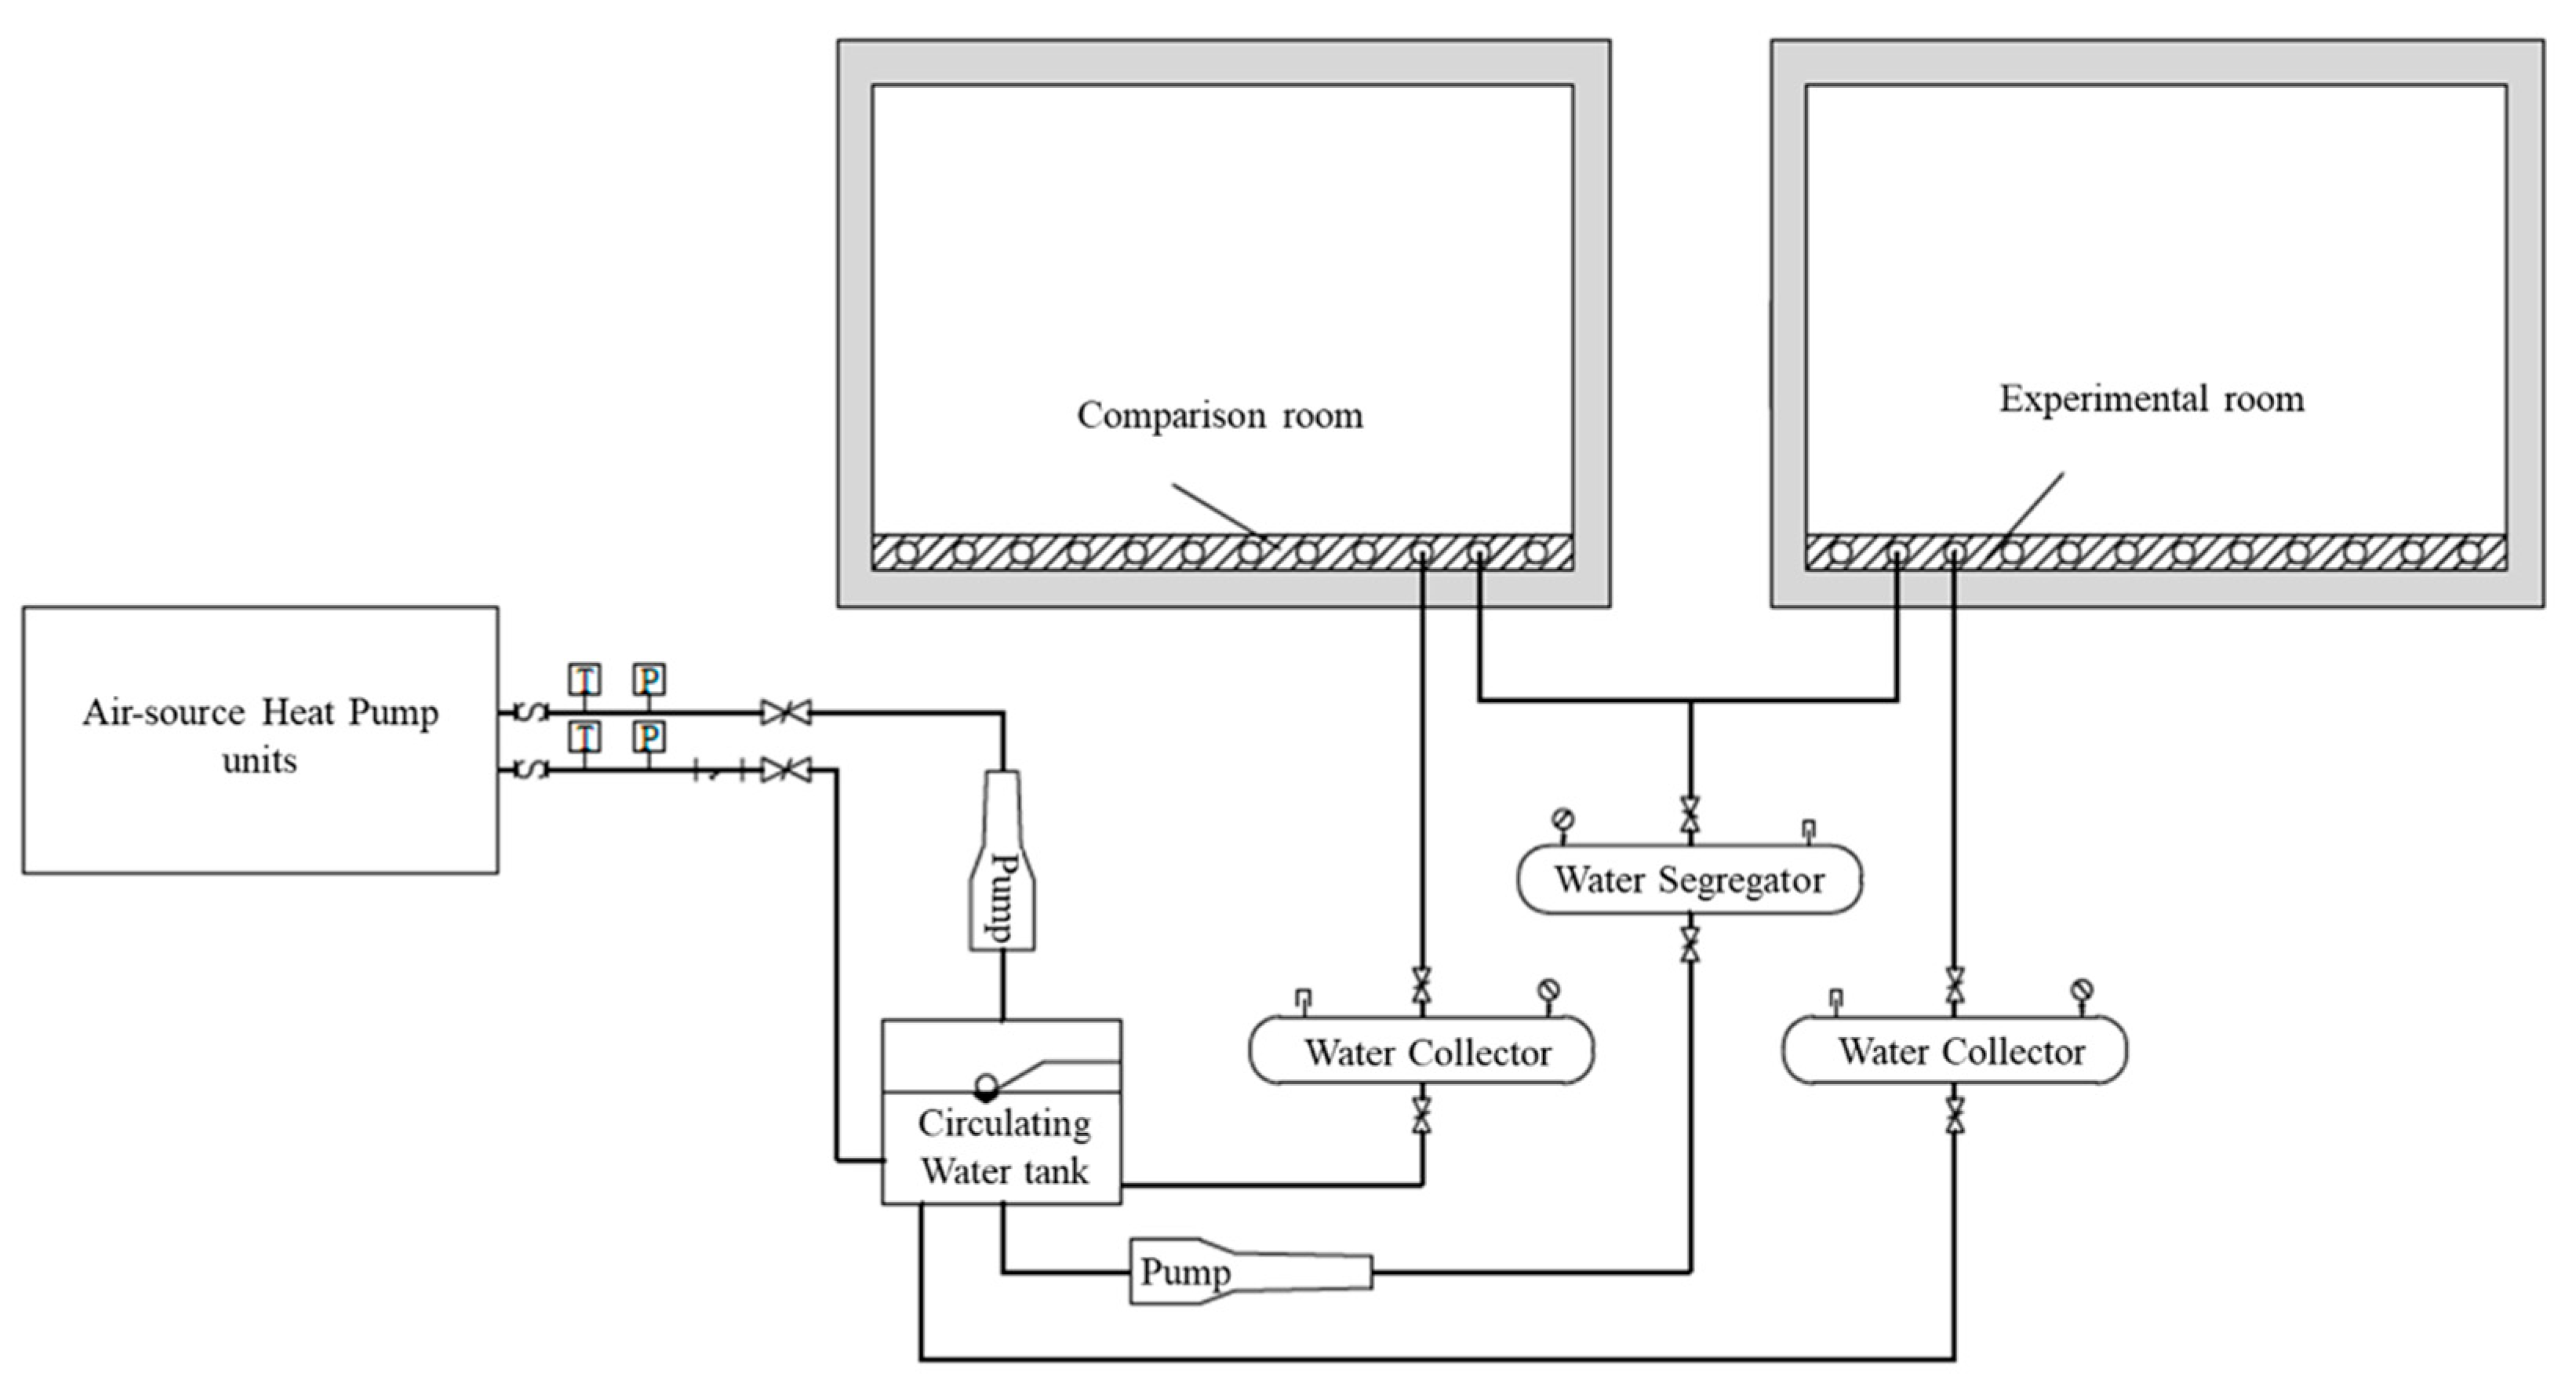
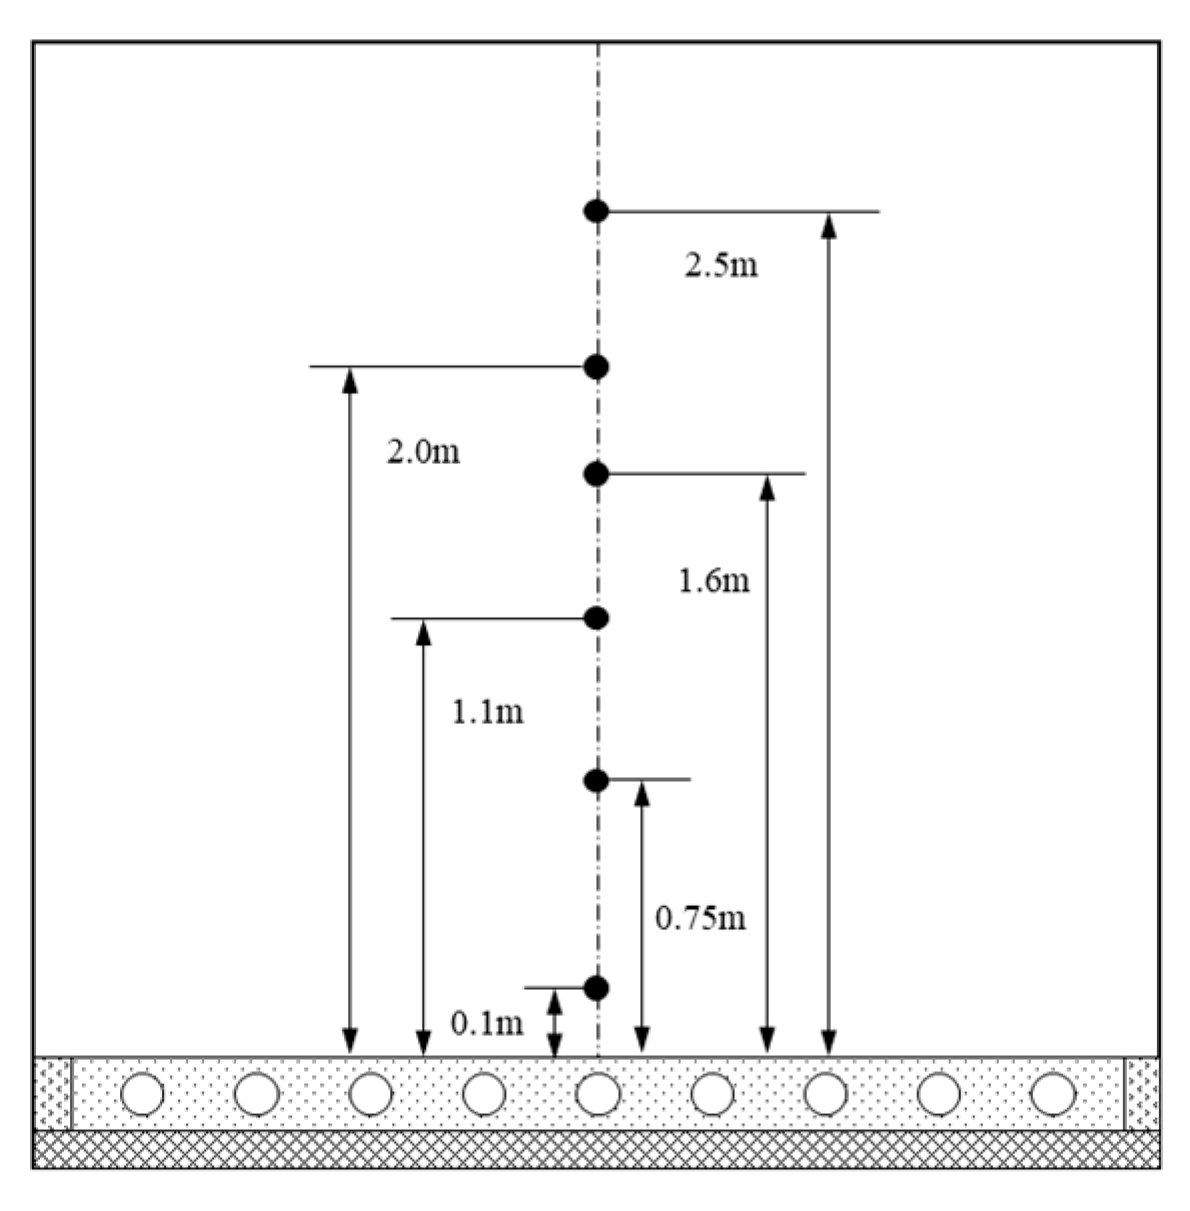
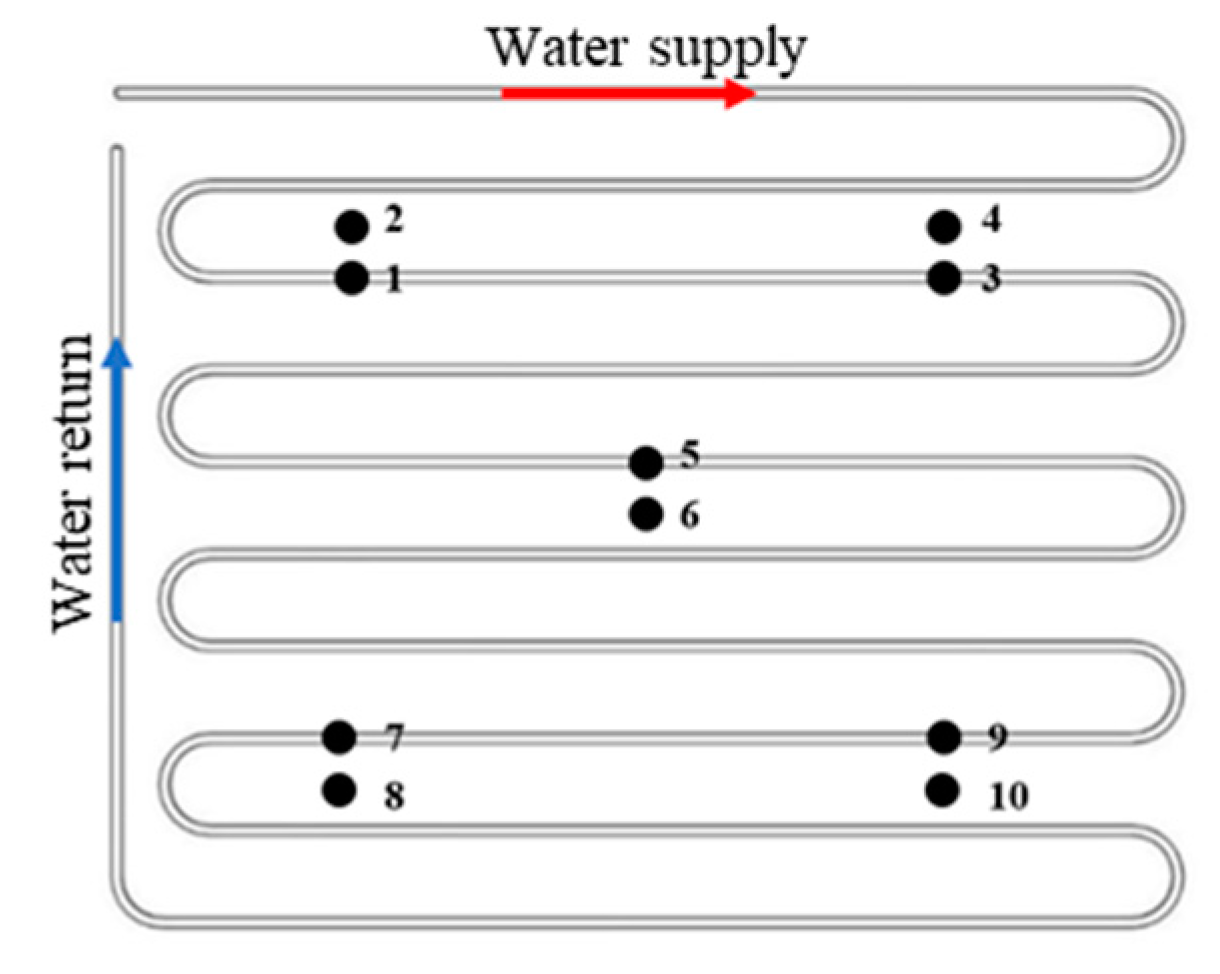
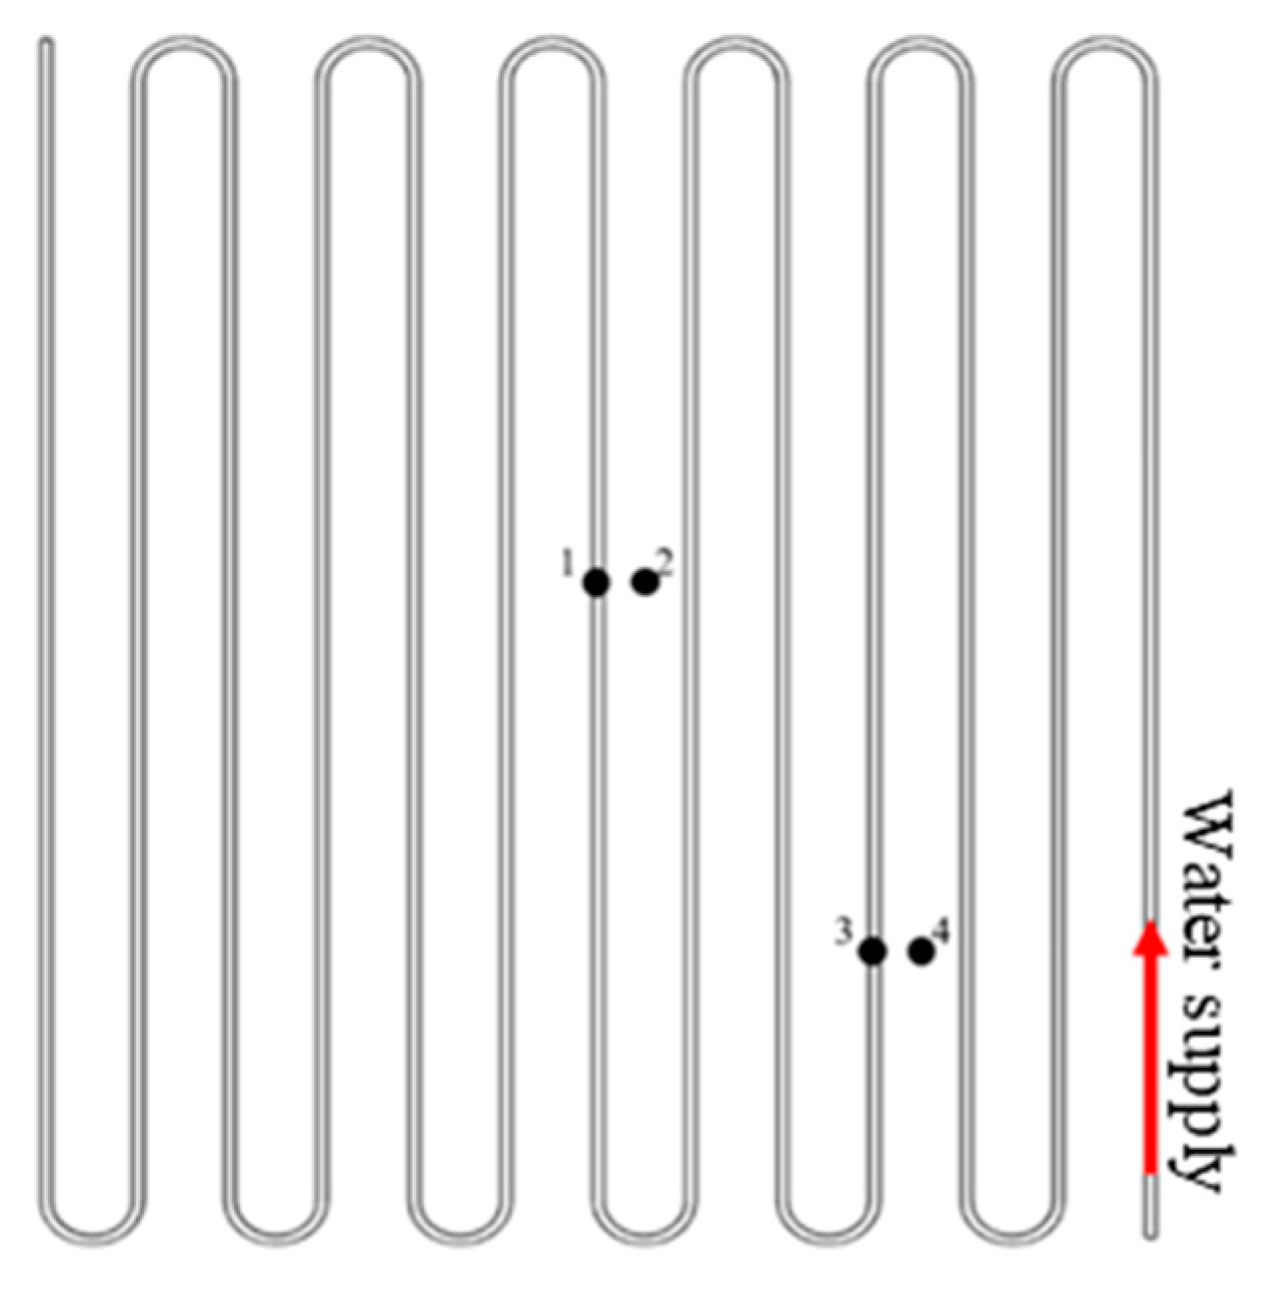
2.2. Experimental Method

To investigate the heating characteristics of the prefabricated assembled geothermal module heating system, an experimental platform was set up in a plant in Lvshunkou District, Dalian City, Liaoning Province. Figure 3 shows the photos of the experimental rooms. The two rooms are identical in structure; one is set up with a concrete-filled radiant floor heating system as a comparison room, and the other is laid with a prefabricated hot water radiant module system for performance experiments. The dimensions of the rooms are 3.36 m × 3.36 m × 3.2 m (length × width × height), the thickness of the external wall is 180 mm, the heat transfer coefficient is 0.32 W/(m2·K), the heat transfer coefficient of the roof is 0.35 W/(m2·K), the external windows are set in the north and south direction of the room, the external window size is 1.5 m × 1.2 m, the heat transfer coefficient is 2.50 W/(m2·K), and the height of the sill is 810 mm. The external door is placed in the south direction of the room, and the size of the external door is 0.9 m × 2 m.
The hot water pipes in the experimental room and the comparison room are buried in a single serpentine laying method, and the pipes are DN20 PE-RT, with the room wall having a thickness of 2 mm. The pipes are connected to the manifold in the room. The system heat source adopts an air source heat pump (cooling and heating) unit with a rated heat production of 17.0 kW and a rated COP of 3.68. The heat pump unit can provide hot water of different temperatures and allows the conduction of heating performance experiments under different water supply temperatures. To ensure the stability of the system and avoid the frequent starting and stopping of the unit, the hot water produced by the unit is not directly delivered to the coils in each room through the pump, but is stored in the water tank and then delivered to the experimental room through the pump. The rated water pressure of the tank is 0.6 MPa and the rated capacity is 60 L. The double-cycle buffer tank can ensure the normal operation of the other side of the system when the primary or secondary side of the water circuit system fails. The schematic diagram of the experimental system is shown in Figure 4.
According to the purpose and content of the experiment, the parameters to be measured in the experiment were as follows: (1) indoor air temperature; (2) heated radiant surface temperature; (3) non-heated wall surface temperature; (4) water supply flow rate; (5) hot water supply and return temperature. In addition, to evaluate the thermal storage performance of the system, the response time of the system and the time to maintain the room temperature above the design temperature after stopping heating are also tested to evaluate the thermal stability of the system when heating. Different parameters should be measured using appropriate measurement methods to ensure accuracy. When measuring the indoor temperature of a radiantly heated room, as shown in Figure 5, the center of the floor at a height of 0.75 m is taken as the reference point for indoor air temperature measurement. For the measurement of the surface temperature, the standard requires that, for the measurement of radiant floor heating components with hot water as the medium, the ground temperature measurement points shall not amount to less than 5 pairs, half of which should be placed on the pipe and the other half of which should be placed between the pipes. For a non-heating radiation wall, temperature measurement points should be arranged at the center of the surface location. The measurement point arrangement and measurement of the rest of the parameters should also follow the corresponding standards to ensure accurate data. Ground temperature measurement points are arranged as shown in Figure 6.

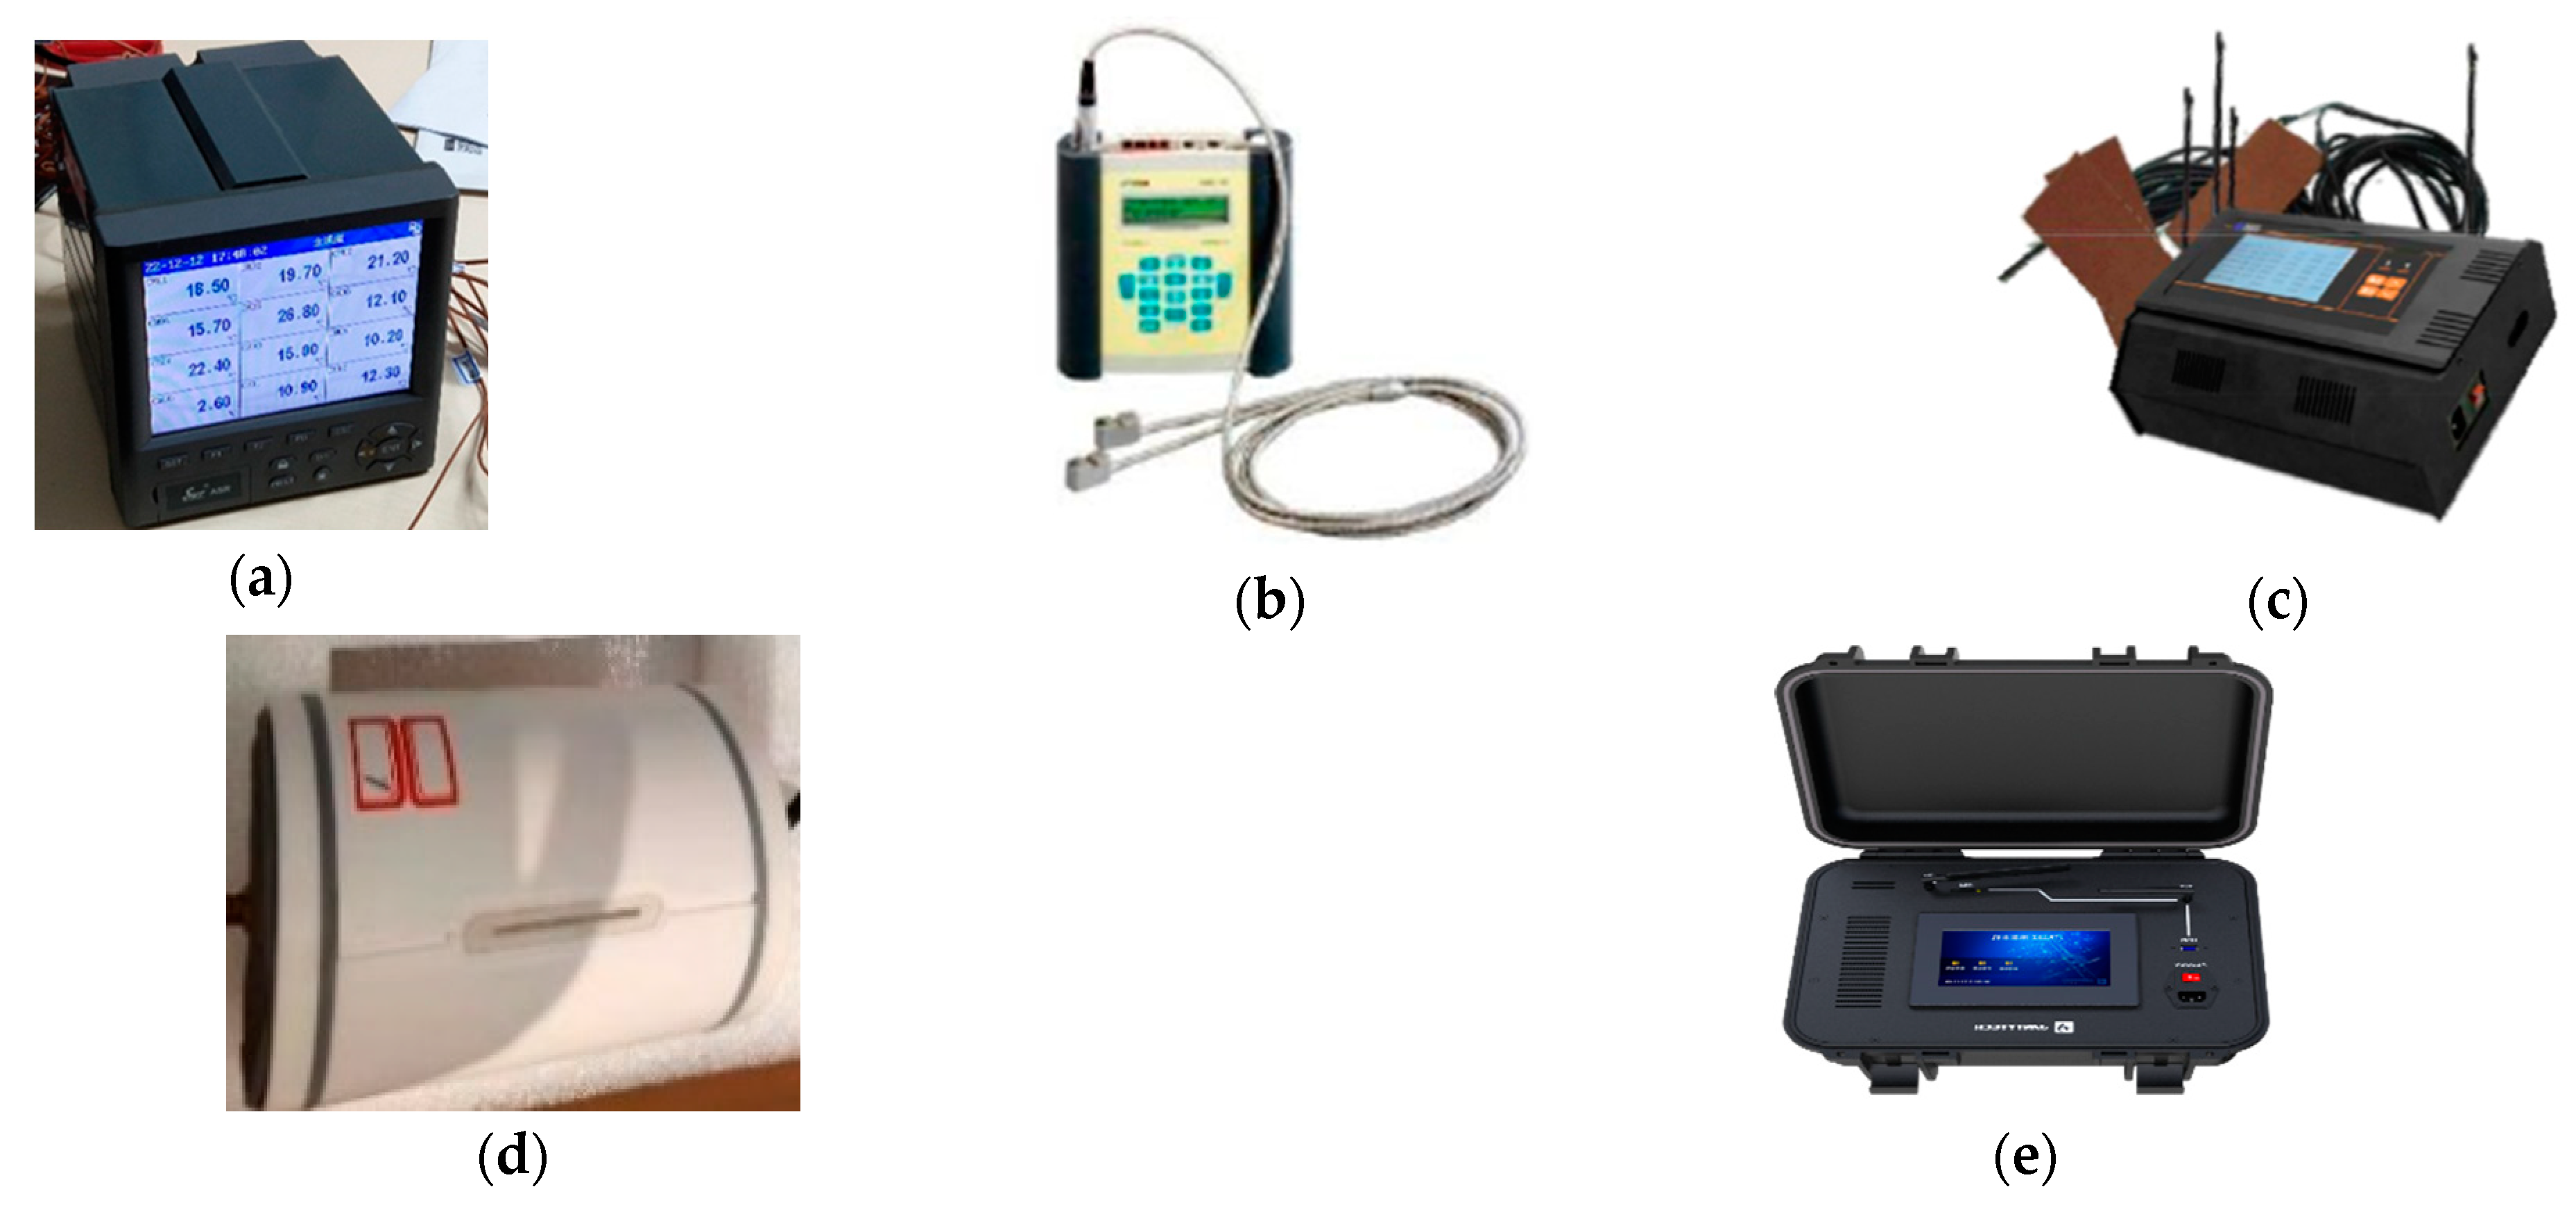
2.3. Experimental Instruments

In this experiment, the ground temperature, indoor air reference point temperature and supply, and return water temperatures were measured with copper-Constantan thermocouples (T-type thermocouples). The thermocouples were calibrated using a constant-temperature water bath. The error met the requirements of the measurement. The measurement data were automatically recorded using the SWP-ASR512 paperless recorder (Manufactured by JT Technology in Beijing, China). The temperature of the non-heated wall was measured and automatically recorded using the JTSOFT multi-channel data logger (Manufactured by JT Technology in Beijing, China). The vertical distribution of the indoor air temperature was measured using a JTR01Z wireless temperature test module (Manufactured by JT Technology in Beijing, China) and transmitted to the JTR25Z wireless acquisition host for recording (Manufactured by JT Technology in Beijing, China). Hot water flow was measured using the FLUXUS F601 ultrasonic flow meter (Manufactured by FLEXIM GmbH in Germany). Each measuring instrument is shown in Figure 7, and the information related to each instrument is shown in Table 1.
During the experiment, the air source heat pump and the primary-side water pump started to run. After the water in the buffer tank was heated to the specified temperature, the secondary-side water pump started to run. Both heated the two experimental rooms and started to record the data. The interval of data recording was 120 s. When the system was stable and this lasted for a period of time, the heating stopped, and when the indoor temperature was reduced to below the design temperature, the measurement of this set of data ended. Then, we changed the working conditions to continue the experiment. During the experiment, the water supply temperature and flow rate of the system were adjusted by changing the power of the inverter air source heat pump and the valve opening.

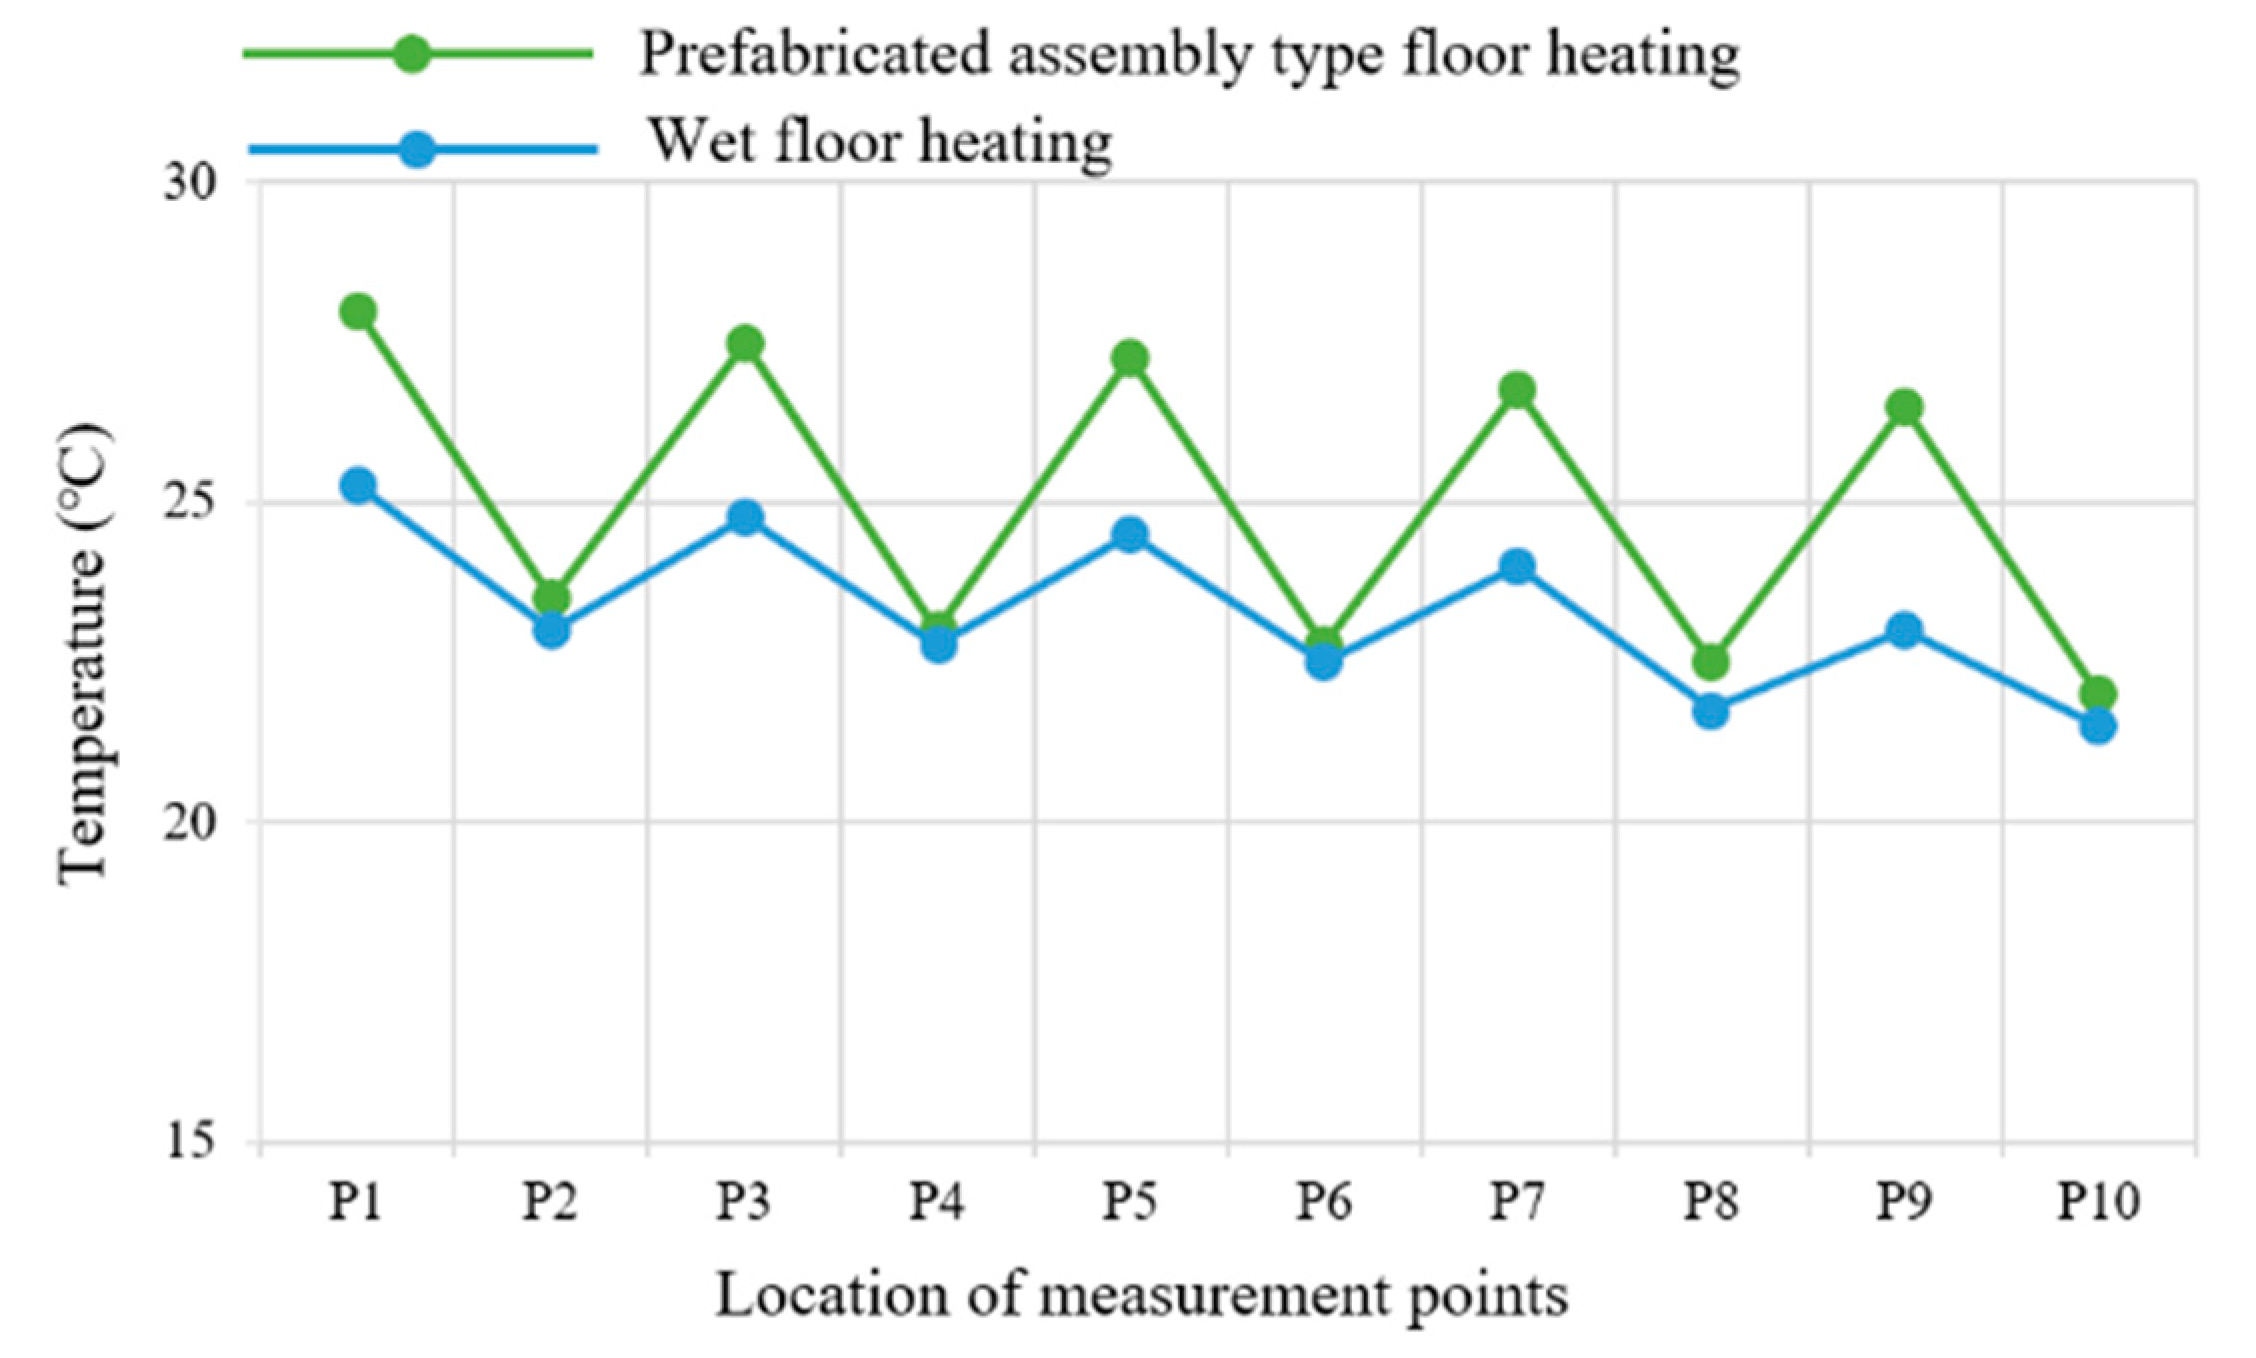
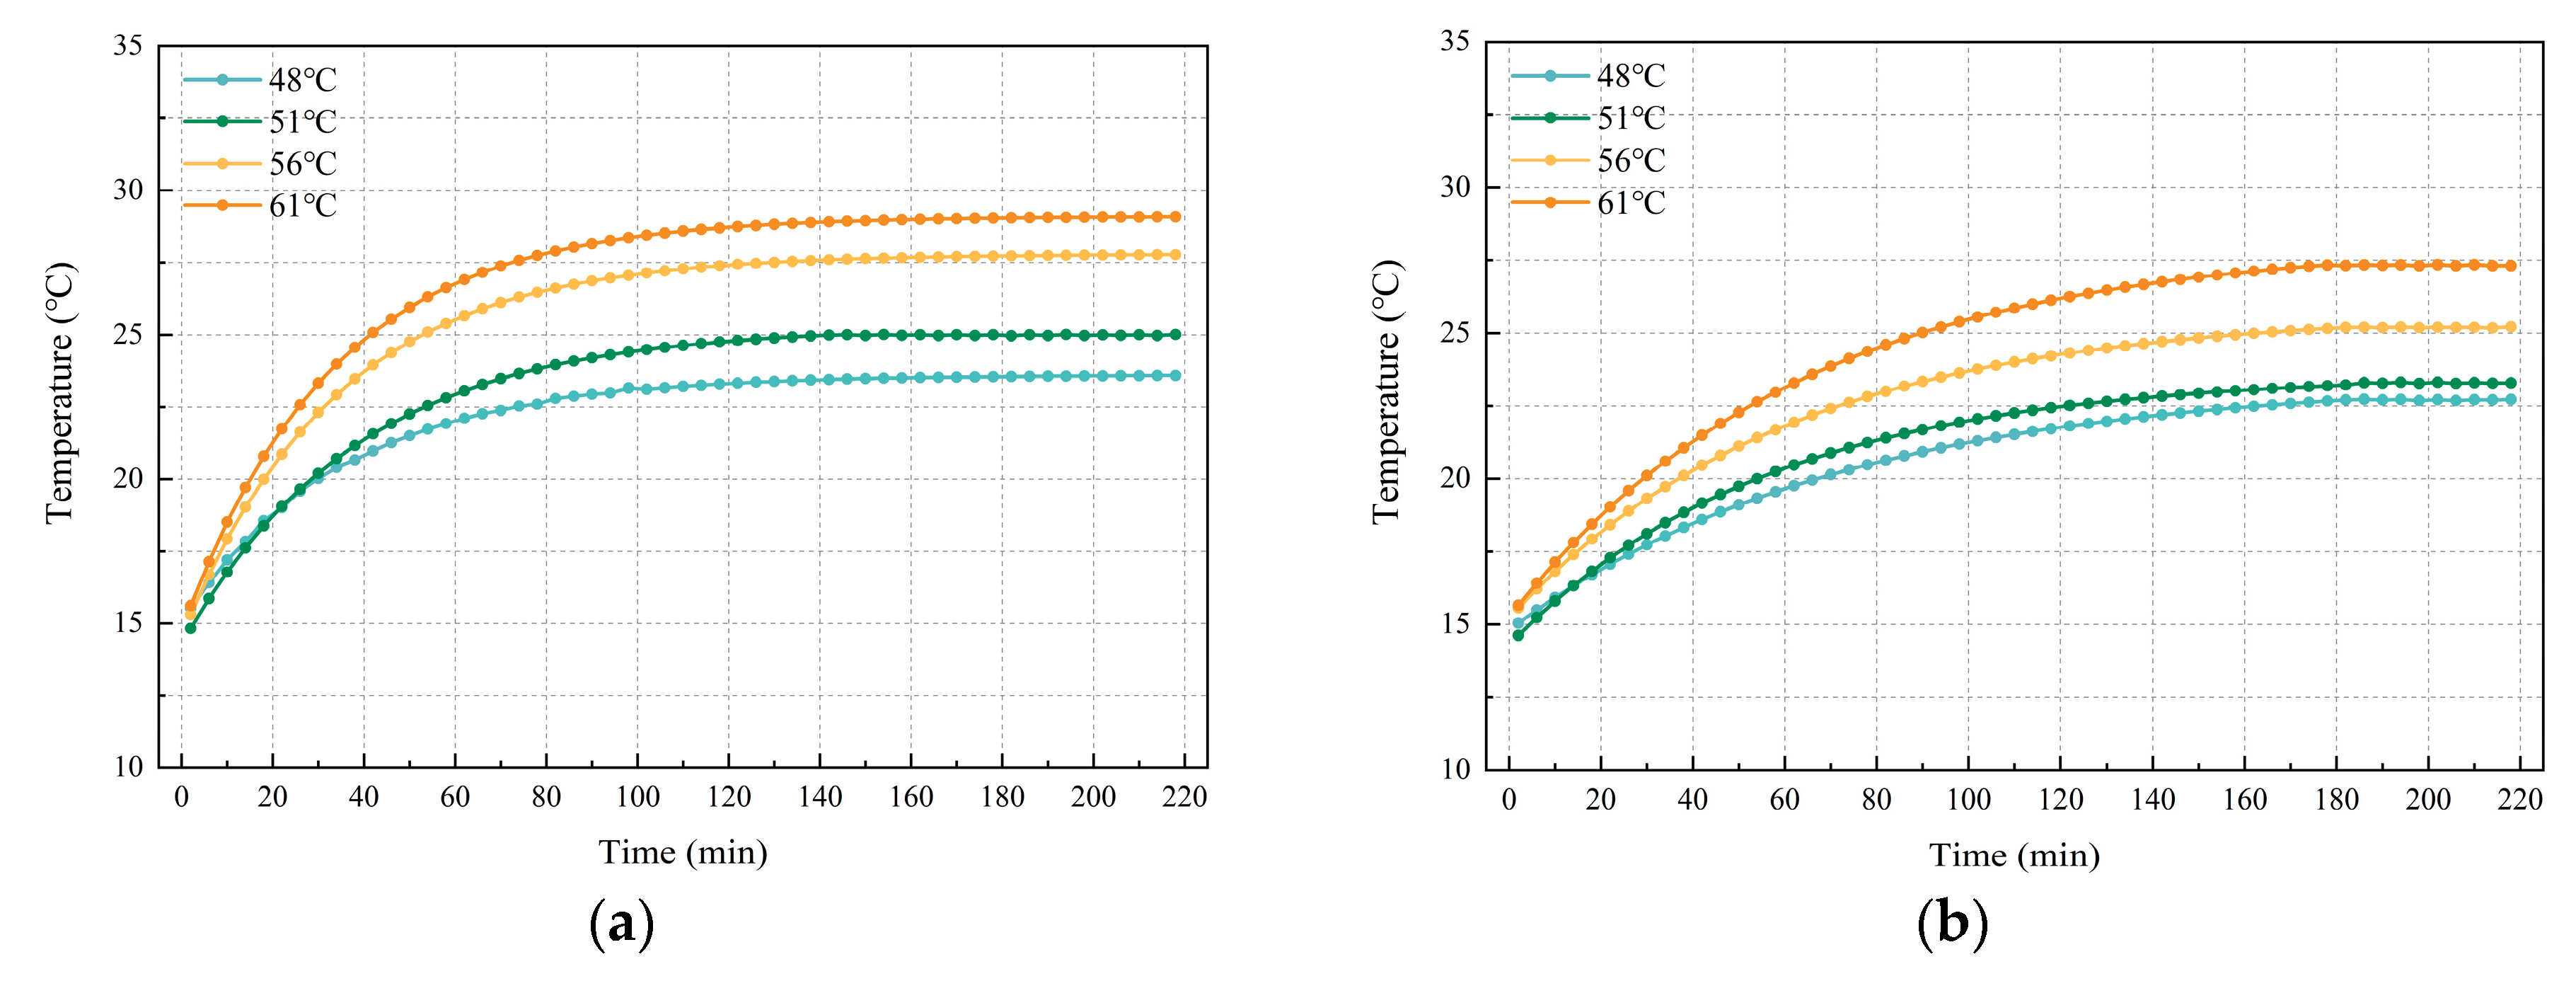
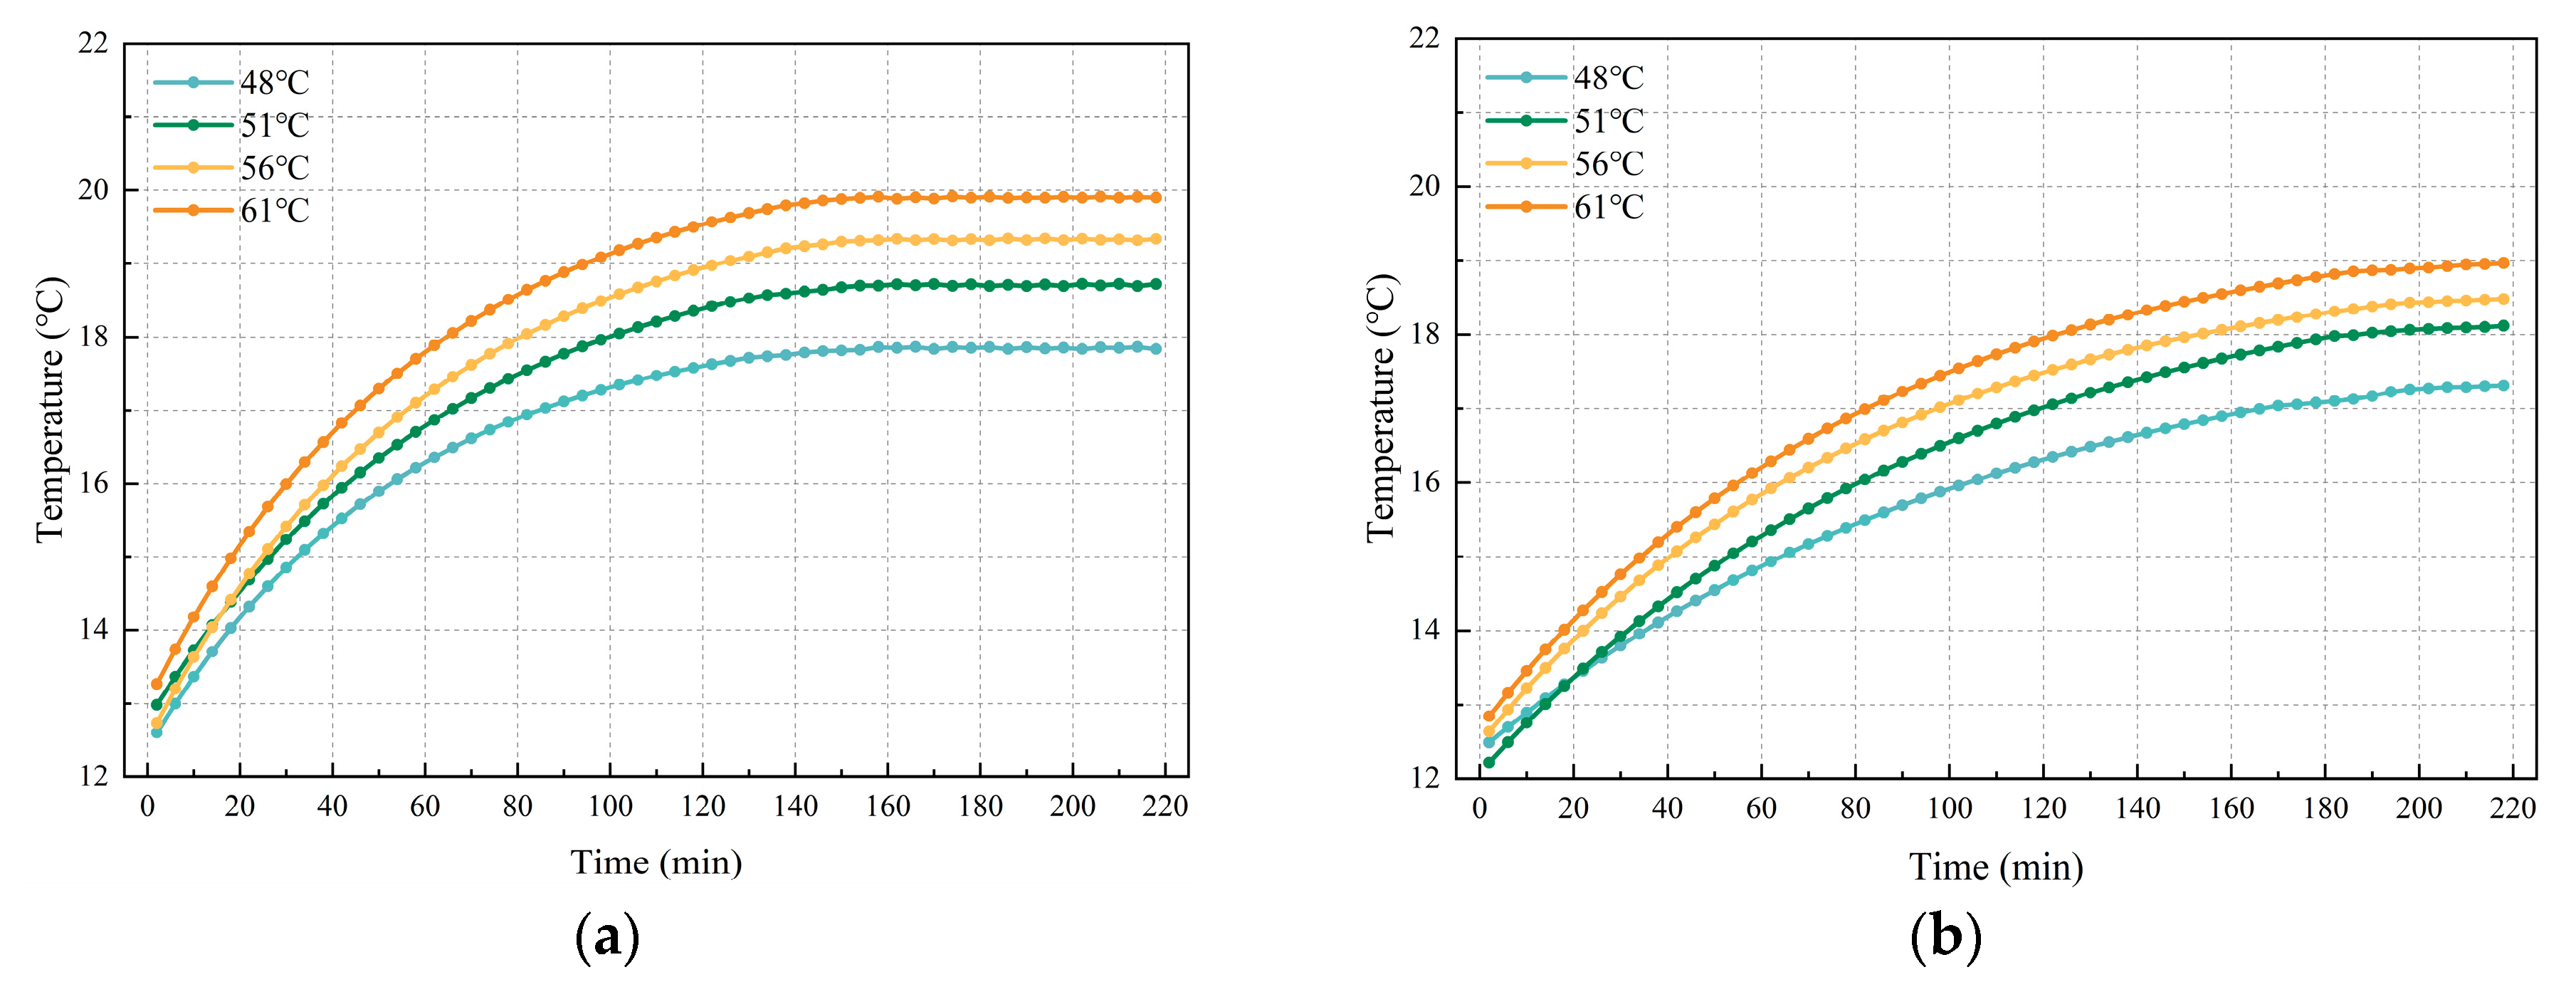
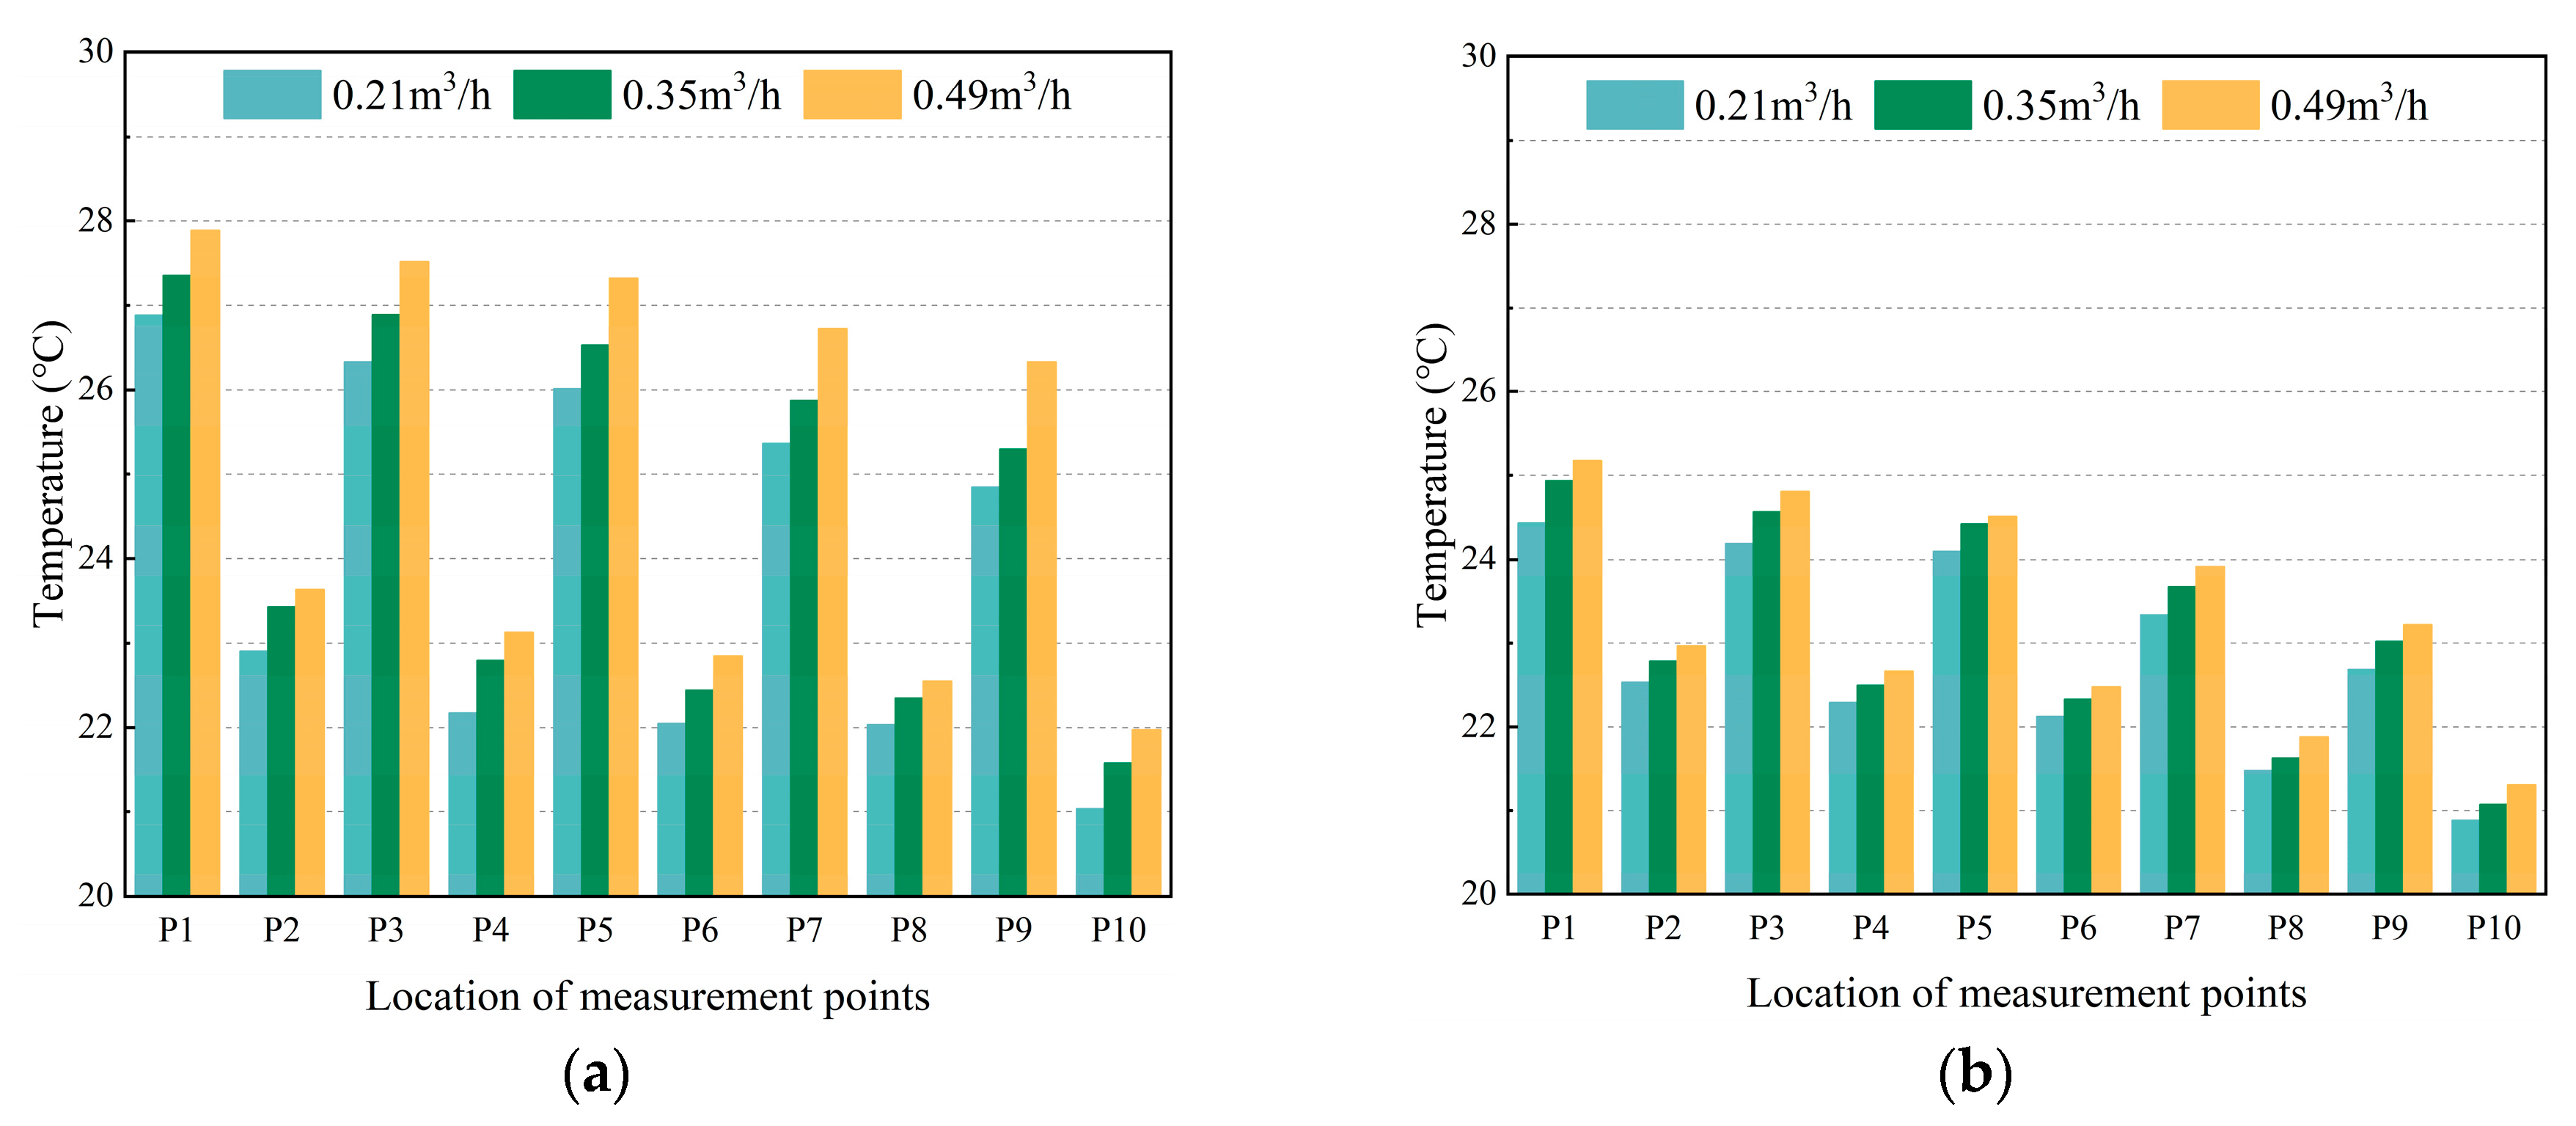
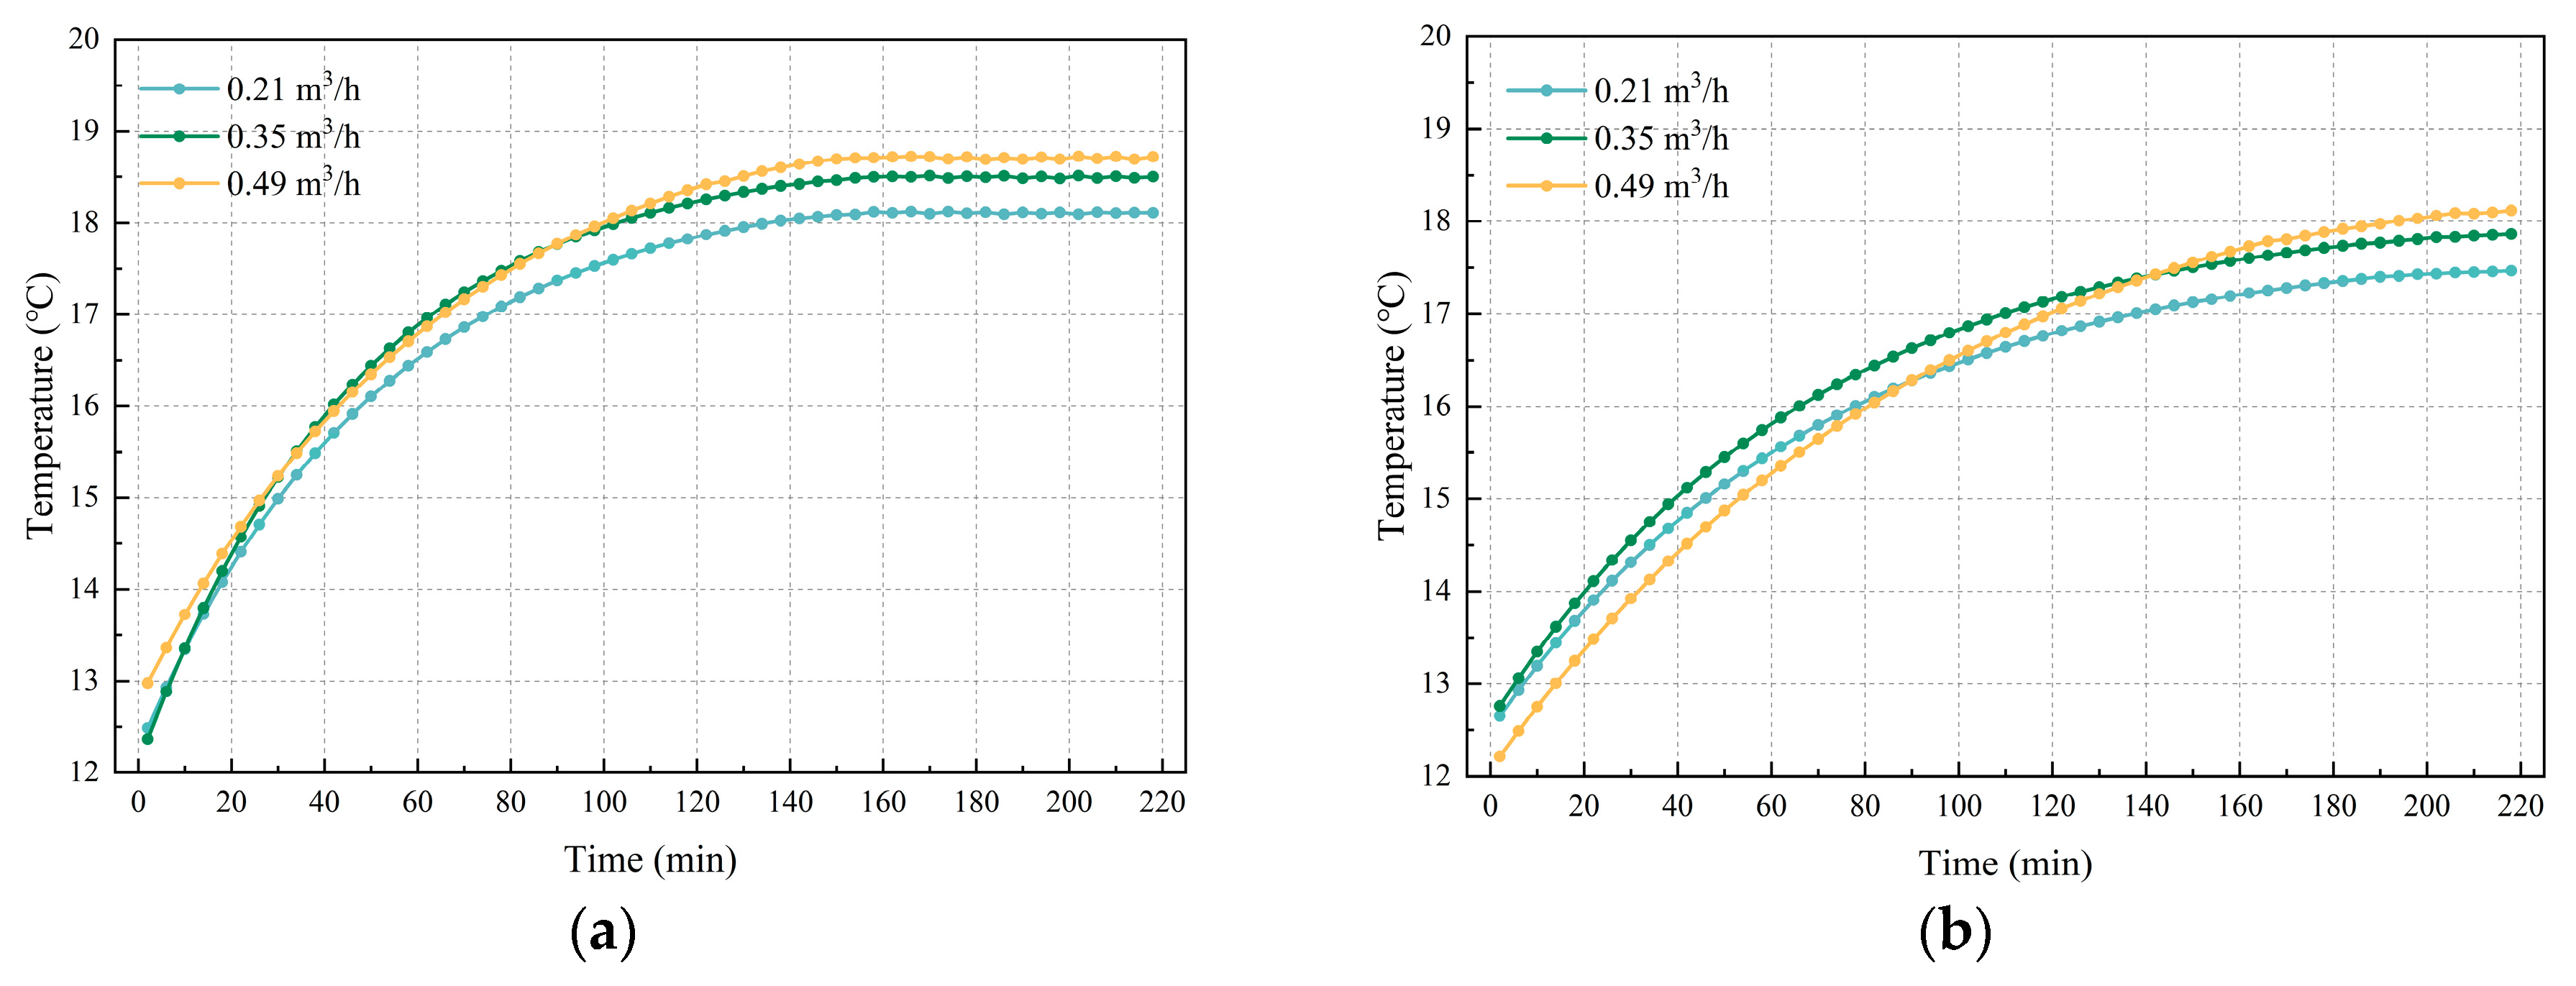
2.4. Experimental Results and Analysis

The heating parameters of the two rooms were measured under the following working conditions: a water supply temperature of 51 °C and a flow rate of 0.49 m3/h. Figure 8 shows the temperature level of the floor surface at each measurement point. As shown in Figure 8, after stabilization, the temperature of measurement points on tubes on the ground surface was higher than that between the tubes, the prefabricated assembled floor heating system had massive floor temperature fluctuations at each measurement point, and the maximum temperature difference was close to 5 °C. The conventional floor heating system has little temperature difference between the measurement points, and the temperature distribution is quite uniform. The ground surface temperature of a prefabricated assembled floor heating system is overall above that of the conventional system, with both below 28 °C.
Figure 9 shows the room floor temperature, room air datum temperature, and supply and return water temperature levels. As shown in Figure 9, the ground temperature of the prefabricated assembled floor heating system is higher than that of the conventional system under the same operating conditions. The average ground temperature of a prefabricated assembled floor heating system is about 24.73 °C after stabilization, and the ground temperature of a conventional floor heating system is about 23.28 °C. In addition, the ground temperature of a prefabricated system rises faster, and according to the experimental data, the prefabricated operation is close to stability at 120 min. While the conventional system rises more slowly, the ground surface temperature tends to be stable at 180 min. The air temperature changes similarly to ground temperature, but the air temperature changes more slowly. The air temperature of the room with prefabricated floor heating becomes stabilized at about 140 min, and the temperature is about 18.7 °C. The air temperature of conventional floor heating changes slowly, and the room temperature becomes stabilized after 200 min with a temperature of 18.1 °C. In addition, when both rooms stop heating after the indoor air temperature reaches stability, it takes a total of about 40 min for the indoor temperature of the prefabricated assembled floor heating room to drop to below 16 °C, while the room temperature drops to below 16 °C after about 1h20 min in the conventional floor heating room.
Under the condition that the flow rate of hot water in the pipe was 0.49 m3/h, the indoor parameters were measured under the four water supply temperature conditions of 48 °C, 51 °C, 56 °C and 61 °C, and the arrangement of the measurement points was the same as that in the above experiments. As shown in Figure 10, when the supply water temperature increased, the unevenness of the floor temperature in the prefabricated assembled floor heating room increased, and the maximum temperature difference between the measurement points reached 5.61 °C. In addition, when the supply water temperature was 61 °C, the temperature of some measurement points exceeded 29 °C or even more than 30 °C. According to the Technical Regulations for Radiant Heating and Cooling (JGJ 142) [27], the average temperature range of the ground surface at the location where people often stay is desirable from 25 °C to 27 °C, and the upper limit is 29 °C. Therefore, the heating water temperature should not be too high when the prefabricated assembled heating system module is used.
As shown in Figure 11, the ground temperature of the prefabricated floor heating room was stabilized at about 120 min under all four operating conditions when the initial ground temperature was about 15 °C. As the supply water temperature rises, the ground temperature rises when the system is stabilized. The ground temperature of the conventional floor heating room stabilized at about 180 min, and the temperature level was lower than that of the prefabricated floor heating room under the same working condition; the higher the supply water temperature, the greater the difference between the ground temperatures of the two systems.
As shown in Figure 12, as for the indoor reference point air temperature, at different supply water temperatures, the higher the temperature is, the higher the air temperature of the prefabricated floor heating room is when the system is stabilized, and the air temperature of the prefabricated floor heating room tends to stabilize at about 140 min. As the walls and roof of the experimental room are an external envelope structure, the actual heat dissipation is large, so the increase in indoor air temperature is not obvious when the supply water temperature increases. When the supply water temperature reaches 61 °C, the air reference point temperature is 19.9 °C after system stabilization, which was 1.2 °C higher than the water supply temperature of 51 °C. The indoor air temperature in the conventional floor heating room tends to stabilize at around 200 min, and the temperature levels are all lower than those in the prefabricated floor heating room.
The water supply flow rate is changed by adjusting the valve opening of the pipe under the condition of maintaining the water supply temperature in the pipe at 51 °C. In the experiment, the water supply flow rates were 0.49 m3/h, 0.35 m3/h, and 0.21 m3/h. The arrangement of measurement points is the same as in the above experiments. As shown in Figure 13, the unevenness of the ground temperature increases slightly with the increase in the flow rate, and the maximum temperature difference between the measurement points reaches 4.1 °C when the flow rate is 0.49 m3/h.
As shown in Figure 14, as the flow rate increased from 0.21 m3/h to 0.35 m3/h, the ground temperature of the system after stabilization also increased from 23.96 °C to 24.55 °C, an increase of 0.59 °C, while as the flow rate increased from 0.35 m3/h to 0.49 m3/h, the ground temperature increased from 24.55 °C to 24.99 °C, an increase of 0.44 °C, and the increase in temperature became smaller. The reason is that as the flow rate increased, the flow rate of water in the pipe increased, and the heat transfer between the hot water and the pipe wall was enhanced. When the flow rate increased to a certain value, the convective heat transfer coefficient between the water in the pipe and the wall became less affected by the flow rate, so when the flow rate continued to increase, the temperature grew slightly. The temperature level of each measurement point in the conventional floor heating room was lower than that in the floor heating room, and with the flow rate changes, the temperature fluctuated slightly.
As shown in Figure 15, for the indoor reference point air temperature, under different supply water flow rates, as the temperature increased, the air temperature also increased when the system stabilized, but because the ground temperature did not change much under the three operating conditions, the reference point air temperature changed slightly after the three operating conditions were stabilized.
For the above experiments, there were not too many operating conditions in the experiments, the adjustable range and precision of the variables were limited, and the experimental rooms were all externally enclosed, so the measured parameters results can only reflect the general laws of the system, but cannot represent the heating parameters of the rooms in actual use. To perform a more in-depth study of the system, it is necessary to conduct numerical simulations.

3. Numerical Simulation of Newly Assembled Floor Heating System

3.1. Simulation Method

The objective of this study is to explore the heating characteristics of this system when stabilized at different operating conditions, and the system is numerically simulated using ANSYS Fluent 2021 for heat transfer with the following assumptions:
(1)
The heat transfer process of the system is a steady-state heat transfer process;
(2)
The materials of each layer are isotropic and homogeneous, and the thermal properties are constant;
(3)
The heat transfer around the floor can be ignored due to the role of the insulation layer;
(4)
According to the analysis of the thermal theory of the system, the heat transfer process of the air in the cavity of the floor structure can be regarded as a thermal conductivity process, so it is assumed that the thermal property parameters of the air in the cavity do not change with temperature;
(5)
The layers of materials are in close contact with each other and contact thermal resistance is not considered.
The simulation problem in this study involves fluid flow as well as heat transfer problems, satisfying the following three basic control equations:
(a)
The continuity equation, as shown in Equation (1):
ρ t + ρ u x + ρ v y + ρ w z = 0
where ρ is fluid density, kg/m3; u, v, w is the velocity in the x, y, z direction, m/s.
The above equation can be simplified to Equation (2) when the fluid is an incompressible:
u x + v y + w z = 0
(b)
Momentum conservation equations, as shown in Equation (3):
ρ u t + u u x + v u y + w u z = ρ f x p x + μ 2 u x 2 + 2 u y 2 + 2 u z 2 ρ v t + u v x + v v y + w v z = ρ f y p y + μ 2 v x 2 + 2 v y 2 + 2 v z 2 ρ w t + u w x + v w y + w w z = ρ f z p z + μ 2 w x 2 + 2 w y 2 + 2 w z 2
where p is pressure, pa; μ is dynamic viscosity, kg/(m·s); f is the external force per unit volume of fluid.
(c)
The energy conservation equation, as shown in Equation (4):
ρ c p u T x + ν T y + w T z = λ 2 T x 2 + 2 T y 2 + 2 T z 2 + S H
where T is fluid temperature, °C; S H is the fluid’s internal heat source, W.
In the radiant floor heating room, the heat exchange between the radiant floor and the room includes convective heat exchange between the floor surface and the room air, between the floor and the envelope, and between furniture and human body. The heat exchange is the sum of radiant heat exchange and convective heat exchange. In the actual calculation, it is more complicated to use this method to calculate the heat exchange of the radiant floor, so in this study, the radiation and convection integrated heat exchange coefficient based on the air temperature of the radiant heating room is used to express the heat exchange between the floor and the indoor space, and the integrated heat exchange coefficient of the upper surface of the floor is shown in Equation (5) [28]:
h = 8.92 t p j t n 0.1
where t p j is the average temperature of the surface of the radiating surface, °C; t n is indoor air temperature, °C.
In previous studies on the radiant floor heating system, many scholars believed that the radiant floor heating system is laid with insulation, and assumed that the lower part of the floor heating is insulated, ignoring the heat transfer downward from the heating system. In the actual situation of the floor radiant heating system, this part of the heat transfer cannot be ignored. The downward heat transfer of the system is conducted from the floor heating structure to the floor slab, and the floor slab transfers the heat to the lower heating room. The mechanism of heat transfer between the floor surface and the lower room is similar to that of the radiant floor surface, i.e., radiation and convection heat transfer. Therefore, the heat transfer in this part is also analyzed with the integrated heat transfer coefficient. The integrated heat transfer coefficient, h e , between the lower surface of the floor slab and the lower heating room is calculated as shown in Equation (6) [29]:
h e = t p j . e t n 1 1 / 3 + 0.025 t p j . e t n 1 + 0.055 t n 1 + 4.05
where t p j . e is the average temperature of the lower surface of the floor slab, °C; t n 1 is indoor air temperature of the room under the floor slab, °C.
The physical properties of each material in the model are shown in Table 2.

3.2. Boundary Conditions and Mesh Independence Verification

3.2.1. Boundary Conditions

The setting of the cell area and boundary conditions is a key part of ANSYS Fluent simulation, and has a great influence on the accuracy of numerical simulation results. As far as the unit area conditions are concerned, in the prefabricated assembled underfloor heating module system in this study, the upper plate, lower plate, finish layer, and floor slab are solid areas, and the pipes and cavities are fluid areas. For the flow boundary, the coil inlet and outlet are set as the velocity inlet and pressure outlet, respectively, and the turbulence setting selects the turbulence intensity and hydraulic diameter; the diameter of the pipe in this study is 20 mm, and the wall thickness is 2 mm, so the hydraulic diameter is 16 mm. For the radiant floor heating system, the hot water in the pipe is generally in the transition zone and in vigorous turbulence. Through calculation, the turbulence intensity is about 5%, so the turbulence intensity for the velocity inlet and pressure outlet is set to 5%. The specific boundary conditions are shown in Table 3.

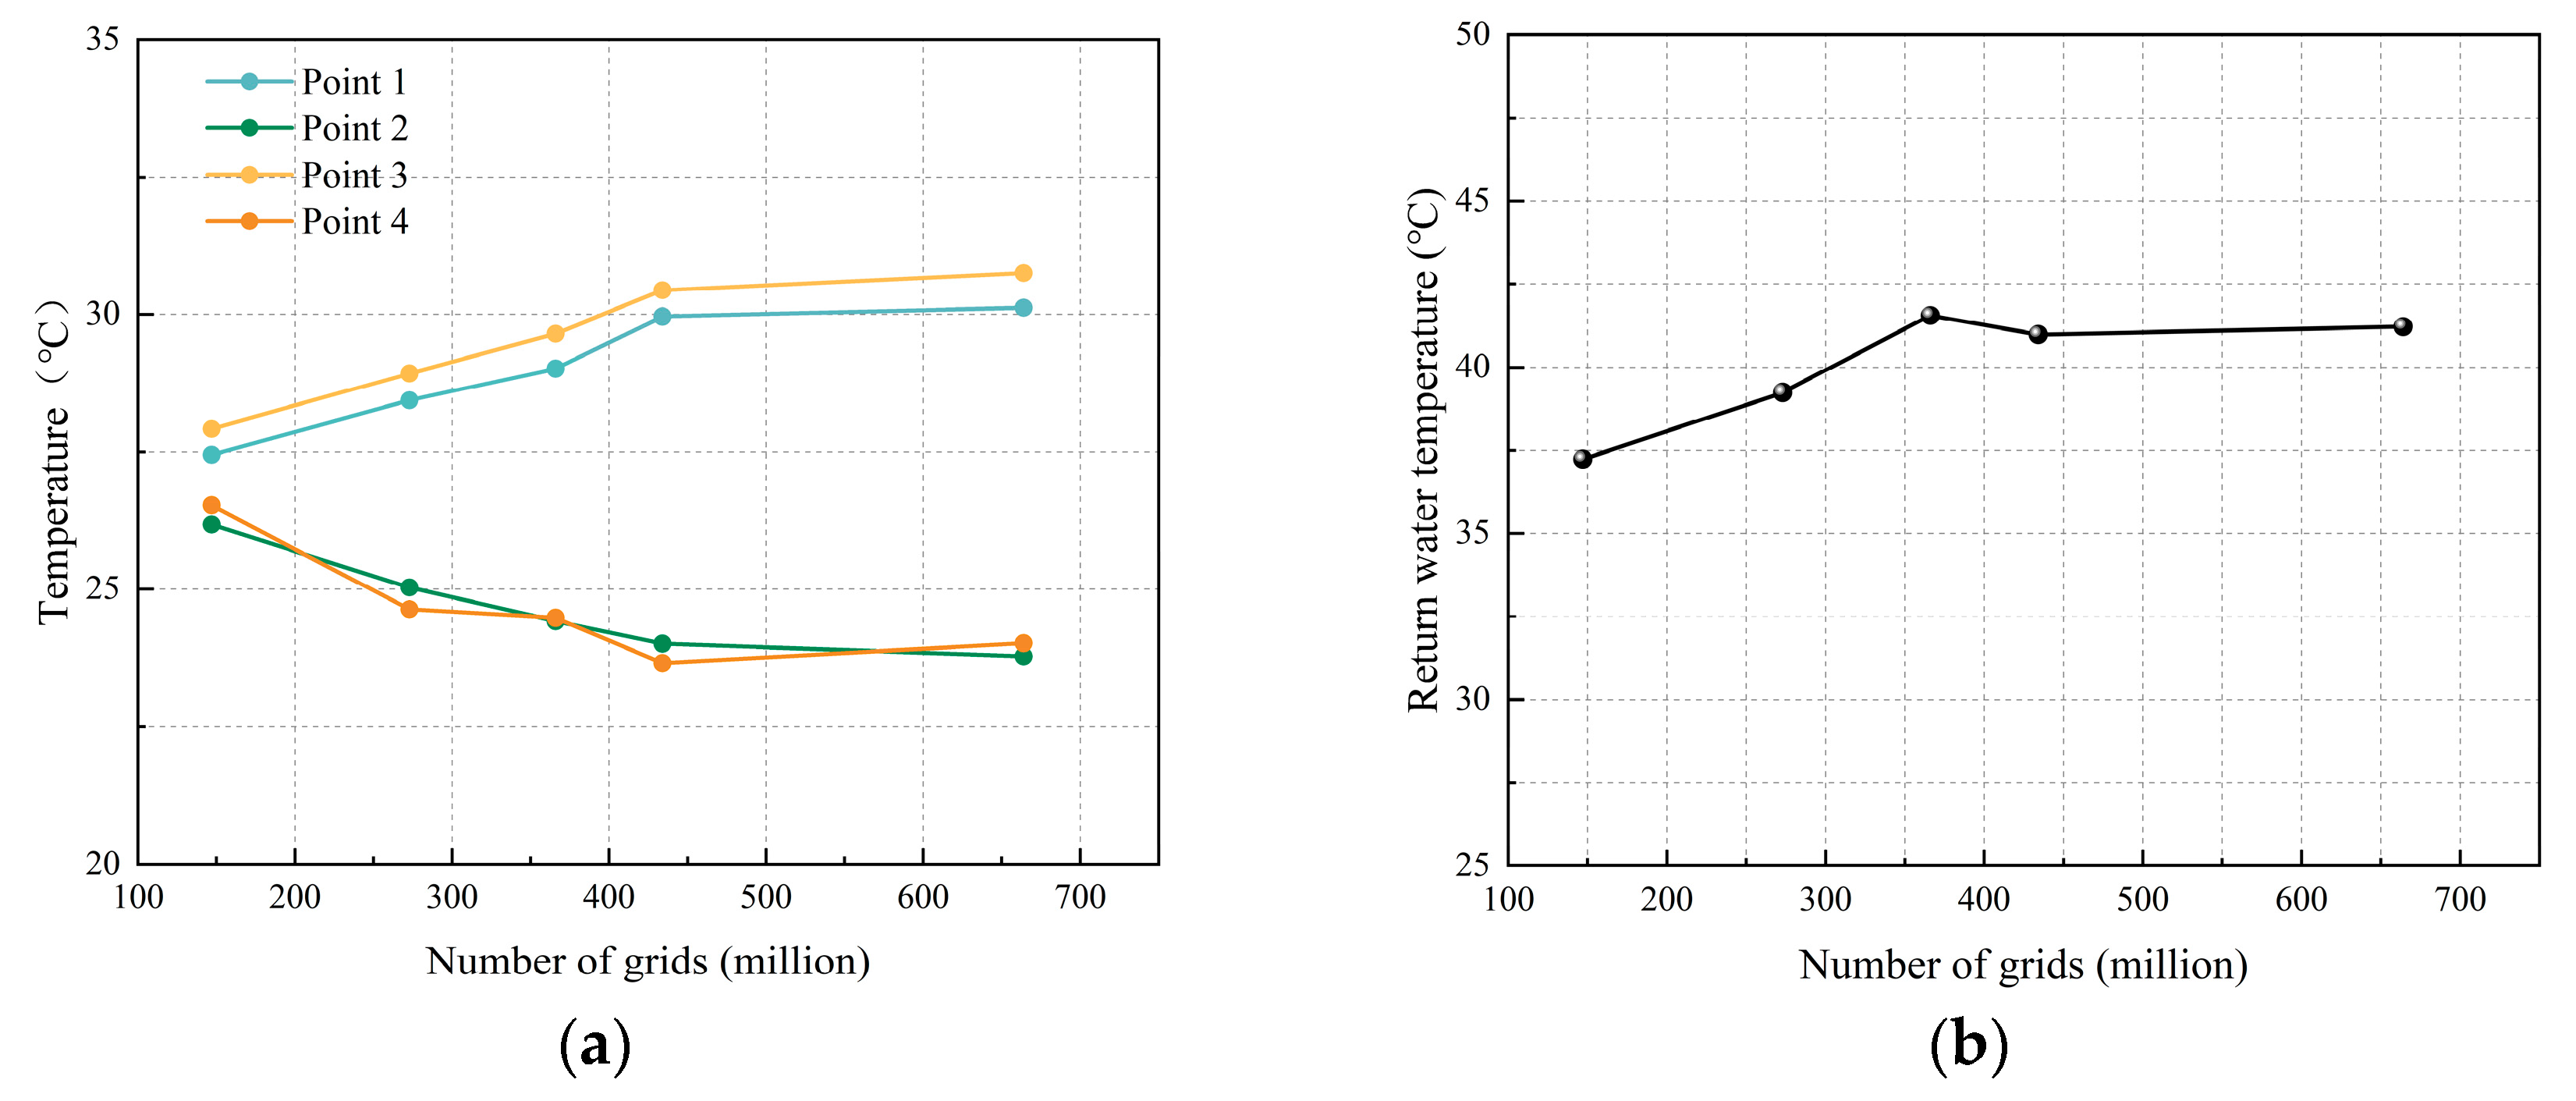
3.2.2. Verification of Mesh Irrelevance

In this study, Fluent Meshing software is used, the mesh type is Poly-Hexcore, and the mesh encryption is carried out at pipes and cavities, as shown in Figure 16. As shown in Figure 17, in the grid-independent validation, this study takes the 200 mm pipe spacing prefabricated assembled floor heating module as an example, and implements five different grid sizes of meshing with the model to obtain five sets of meshes with different grid numbers.
In this study, the RNG k-ε model is chosen for the simulations, and scalable wall functions (SWFs) are chosen as the wall functions. In Fluent Meshing, the pressure-based steady-state solver is chosen, neglecting the effect of gravity on the system. The coupled algorithm is selected for the pressure solver. The second-order scheme is chosen as the pressure interpolation term. The least squares cell-based scheme is chosen for gradient interpolation, and second-order upwind is used on the rest of the terms to discretize the control equations.
As shown in Figure 18, the temperatures of four points on the floor surface and the water temperature of the return water outlet are selected as the basis for judgment, and an appropriate number of grids are selected for subsequent numerical simulations through grid-independent verification. When the number of grids was greater than 4.34 million, the simulation results of the temperature of each measured point on the floor and the average temperature of the return water fluctuated less as the grid number increased, and it was considered that the simulation results of this study would not be affected by continuing to increase the number of grids at this time. Therefore, to improve the efficiency of simulation calculation and reduce the consumption of computational resources, the subsequent simulation study will be based on the model grid division size.
In this study, water supply temperature, flow rate and coil spacing were selected as influencing factors, and the average floor surface temperature, heat dissipation per unit area of floor surface, and maximum temperature difference between adjacent pipes on the ground were chosen as indicators reflecting the heating performance of the system; the change in each performance indicator was studied under different factor levels. According to Technical Regulations for Radiant Heating and Cooling (JGJ 142-2012) [27], the supply water temperature in the hot water floor radiant heating system should not be greater than 60 °C, and a temperature of 35 °C to 45 °C is appropriate for civil buildings, while the temperature difference between the supply and return water should not be greater than 10 °C. Therefore, for the setting of the supply water temperature, four factor levels of 35 °C, 40 °C, 45 °C, and 50 °C were set for numerical simulation while keeping the other working conditions consistent; flow rate working conditions were set according to the transition zone between the laminar and exuberant turbulent flow of the fluid in the coil (2300 < Re < 104) as 0.15 m/s, 0.20 m/s, 0.25 m/s, and 0.30 m/s. The spacing of the floor heating pipes was generally in the range of 100 mm to 300 mm depending on the heating conditions and the room heat load requirements, and the coil spacing was related to the pipe and the pipe outer diameter size [27]. In this study, four simulated working conditions with a pipe spacing of 150 mm, 200 mm, 250 mm, and 300 mm were set. We kept two of the above three influencing factors constant, while the other factor was changed to study the changes in each performance index at different factor levels.

3.3. Simulation Results and Analysis

In the case of a pipe spacing of 200 mm and a flow rate of 0.15 m/s, the water supply temperature keeps changing for numerical simulation. As shown in Figure 19, with the increase in the temperature gradient around the coil, with the increase of the temperature gradient around the coil and the greater the heat dissipation per unit area, the structure of the lower plate and the floor isothermal distribution of the floor plate is gentle; with a smaller temperature gradient, the heat dissipation per unit area is lower, the cavity, reflective film, and structure of the lower plate can effectively increase the downward heat transfer thermal resistance of the system, and the insulation performance is better. With the increase in supply water temperature, the temperature gradient around the coil increases significantly, and the ground temperature above the coil increases significantly, but the degree of change between the pipe is small, and the ground temperature distribution uniformity is weakened. As shown in Figure 20, the average floor surface temperature and heat dissipation have an approximately linear relationship with the supply water temperature. When the water supply temperature increases from 35 °C to 50 °C, the average floor surface temperature rises from 23.53 °C to 28.41 °C, and the floor surface heat dissipation per unit area increases from 61.2 W/m2 to 115.21 W/m2. The average temperature of the floor surface under all working conditions meets the requirements of Technical Regulations for Radiant Heating and Cooling (JGJ 142-2012). However, when the supply water temperature is 50 °C, the partial temperature of the floor surface exceeds the specified value of the standard. To characterize the uniformity of the temperature distribution on the floor surface, the measurement points are set in accordance with the method in the experiment, and the temperature difference between the measurement points indicates the uniformity of the temperature distribution on the floor surface. As shown in Figure 21, as the supply water temperature increases, the temperature of each measurement point increases; the maximum temperature difference on the floor surface increases, and the uniformity of the temperature distribution decreases. When the supply water temperature increases from 35 °C to 50 °C, the maximum temperature difference between the pipes increases from 2.348 °C to 4.419 °C.
Numerical simulation is performed by varying the flow rate at a pipe spacing of 200 mm and a water supply temperature of 45 °C. As shown in Figure 22, the temperature distribution inside the floor does not differ much under different flow rates, and the isotherm trend is flat in the lower plate of the structure as well as in the floor, while the temperature distribution is uniform. As shown in Figure 23, the average temperature and heat dissipation of the floor surface are approximately linearly related to the flow rate, but the slope is small. When the flow rate increases from 0.15 m/s to 0.30 m/s, the average temperature of the floor surface increases from 26.78 °C to 27.24 °C, and the increase is not large. The heat dissipation per unit area of the floor surface increases from 97.21 W/m2 to 102.24 W/m2. The average temperature of the floor surface under all working conditions satisfies the value specified in Technical Regulations for Radiant Heating and Cooling (JGJ 142-2012). As shown in Figure 24, when the flow rate increases, the temperature of each measurement points changes slightly, but the change is small, and the maximum temperature difference of the floor surface changes less. When the flow rate increases from 0.15 m/s to 0.30 m/s, the maximum temperature difference between the pipes increases from 3.729 °C to 3.794 °C.
The numerical simulation is carried out by changing the coil spacing at a supply water temperature of 45 °C and a flow rate of 0.15 m/s. As shown in Figure 25, in the direction of the pipe section, the floor surface temperature located near the top of the pipe is higher due to the increase in coil spacing, and the temperature between pipes is lower. As shown in Figure 26, the average floor surface temperature and heat dissipation are approximately negatively correlated with the supply water temperature, and the floor surface temperature and heat dissipation decrease to the greatest extent when the pipe spacing increases from 200 mm to 250 mm. When the coil spacing increases from 150 mm to 300 mm, the average temperature of the floor surface decreases from 26.88 °C to 24.81 °C, and the heat dissipation per unit area of the floor surface decreases from 98.32 W/m2 to 75.41 W/m2. With the increase in coil spacing, the maximum temperature difference of floor surface increases and the uniformity of temperature distribution decreases. When the coil spacing increases from 150 mm to 300 mm, the maximum temperature difference between the pipes increases from 2.479 °C to 4.172 °C. As shown in Figure 27 the temperature difference between the measurement points at 250 mm and 300 mm is not significant.

4. Analysis of the Impact Factors of the Newly Assembled Floor Heating System

4.1. Analysis Method

To investigate the effects of the supply water temperature, flow rate, and coil spacing on system performance and to minimize the number of tests, an orthogonal experimental is conducted to investigate the effects of each factor. For the influencing factors of a prefabricated hot water radiant module heating system, each factor is divided into a total of three factors and four levels without considering the interaction between the factors. An L16 (43) orthogonal table is selected, and an intuitive analysis and variance analysis method is used for data processing.
In the simulation study on the floor heat transfer of the prefabricated assembled hot water radiant module heating system, the average ground temperature, T a v e , heat dissipation per unit area, q , and maximum temperature difference, T m a x , between the pipes are used as the experimental indexes for data analysis. As can be seen in Table 4, for the supply water temperature, the mean values of the three indicators vary greatly at different levels, and the extreme difference in the supply water temperatures is the largest among the three factors, indicating that the variation in the supply water temperature has a great influence on the average ground temperature, heat dissipation per unit area, and maximum temperature difference between the pipes. On the other hand, for the flow rate, the mean values of the indicators vary to a lesser extent at different levels, and the extreme difference between each indicator is the smallest among the three factors. The extreme difference between each index is the smallest among the three factors, indicating that the influence of flow rate on each index is small among the three factors.

4.2. Results and Analyses

The results of the ANOVA of the orthogonal simulation experiment are given in Table 5. For the ground mean temperature, the F-values of both the pipe spacing and supply water temperature are much larger than the critical value at α = 0.01, indicating that the factor level changes in pipe spacing and supply water temperature have a very significant effect on the ground mean temperature, and the F-values of the water supply temperature are larger than the F-values of the pipe spacing, indicating that the influence of the water supply temperature on the ground mean temperature is greater than that of pipe spacing. The horizontal variation in flow velocity also shows a significant on the mean ground temperature, but the degree of influence is weak and consistent with the results of previous simulations. For the heat dissipation per unit area, the F-values of pipe spacing and water supply temperature are much larger than the critical values at α = 0.01, and the horizontal variation in the two factors has a significant effect on the heat dissipation per unit area. For the maximum temperature difference between pipes, the F-values of the pipe spacing and water supply temperature are larger than the critical values, and the level changes in the two factors have a very significant effect on the maximum temperature difference between pipes, while the F-values of flow velocity are smaller than the critical values, indicating that the changes in flow velocity have no significant effect on the maximum temperature difference between pipes.
To describe the degree of influence of these factors on each indicator more accurately, regression models between each factor and indicator are established to predict the changes in indicators at different factor levels. For the simulated calculated data of the orthogonal experiments in this study, each factor level and indicator are quantitative data, and the changes in the indicators are influenced by multiple influencing factors together. In addition, the results of the previous extreme difference analysis show that the trend of the influence of each factor on the indicators is roughly correlated, so a multiple linear regression model is chosen to conduct the regression analysis of the data in this study. For the multiple linear regression model, the least squares method is used for the parameter estimation of this model. According to the relevant model, the simulation results of each factor and indicator are substituted to solve the model parameters, and the multiple regression fitting equation of each indicator for each factor is obtained to test the fitting results. By examining the coefficient of determination (R2) of the fitted model using the Durbin–Watson test (DW test), the normality test of the residuals, and the heteroskedasticity test, whether or not the regression model is well constructed can be verified. The fitted equations and the model test results are given in Table 6. The maximum temperature difference between pipes did not show significance in the ANOVA, so this factor was not considered when fitting the equation.
As shown in Table 7, the numerical simulation results are compared with the regression model predictions for verification. The results show that the numerical model predictions are in high agreement with the experimental results and can be used as a valid basis for validating the accuracy of the model predictions.

5. Discussion

5.1. System Performance Testing

Under the condition of a water supply temperature of 51 °C and flow rate of 0.49 m3/h, the prefabricated assembled hot water radiant module heating system shows a high level temperature, and the average temperature of the ground and the indoor reference point of the air temperature are higher than those of a conventional concrete-filled radiant floor heating system, indicating that the system has good thermal performance and better efficiency at the same level of expenditure, which is conducive to building energy efficiency. Under this condition, the temperature difference from 0.1 m to 1.6 m in the vertical direction of the prefabricated underfloor heating room is 2.1 °C, and the indoor air temperature allows for more thermal comfort. The response time of the prefabricated underfloor heating room is about 33% faster than that of the conventional underfloor heating room with good modulation.

5.2. The Change Rule of Heating System Characteristics

The results show that, under the working conditions of different water supply temperatures (48 °C, 51 °C, 56 °C, and 61 °C), the average temperature of the floor of the system and the air temperature of the indoor reference point increase with the increase in the water supply temperature; the temperature levels are higher than those of the conventional floor heating system. The ground temperature uniformity decreases with the increase in the water supply temperature, and the maximum temperature difference between pipes reaches 5.61 °C when the water supply temperature reaches 61 °C; the ground temperature at the location above the pipes exceeds 30 °C. The flow rate has a small effect on the heating capacity of the system, and when the flow rate increases (0.49 m3/h, 0.35 m3/h, and 0.21 m3/h), the ground temperature and the indoor reference point temperature increase slightly but not by much.

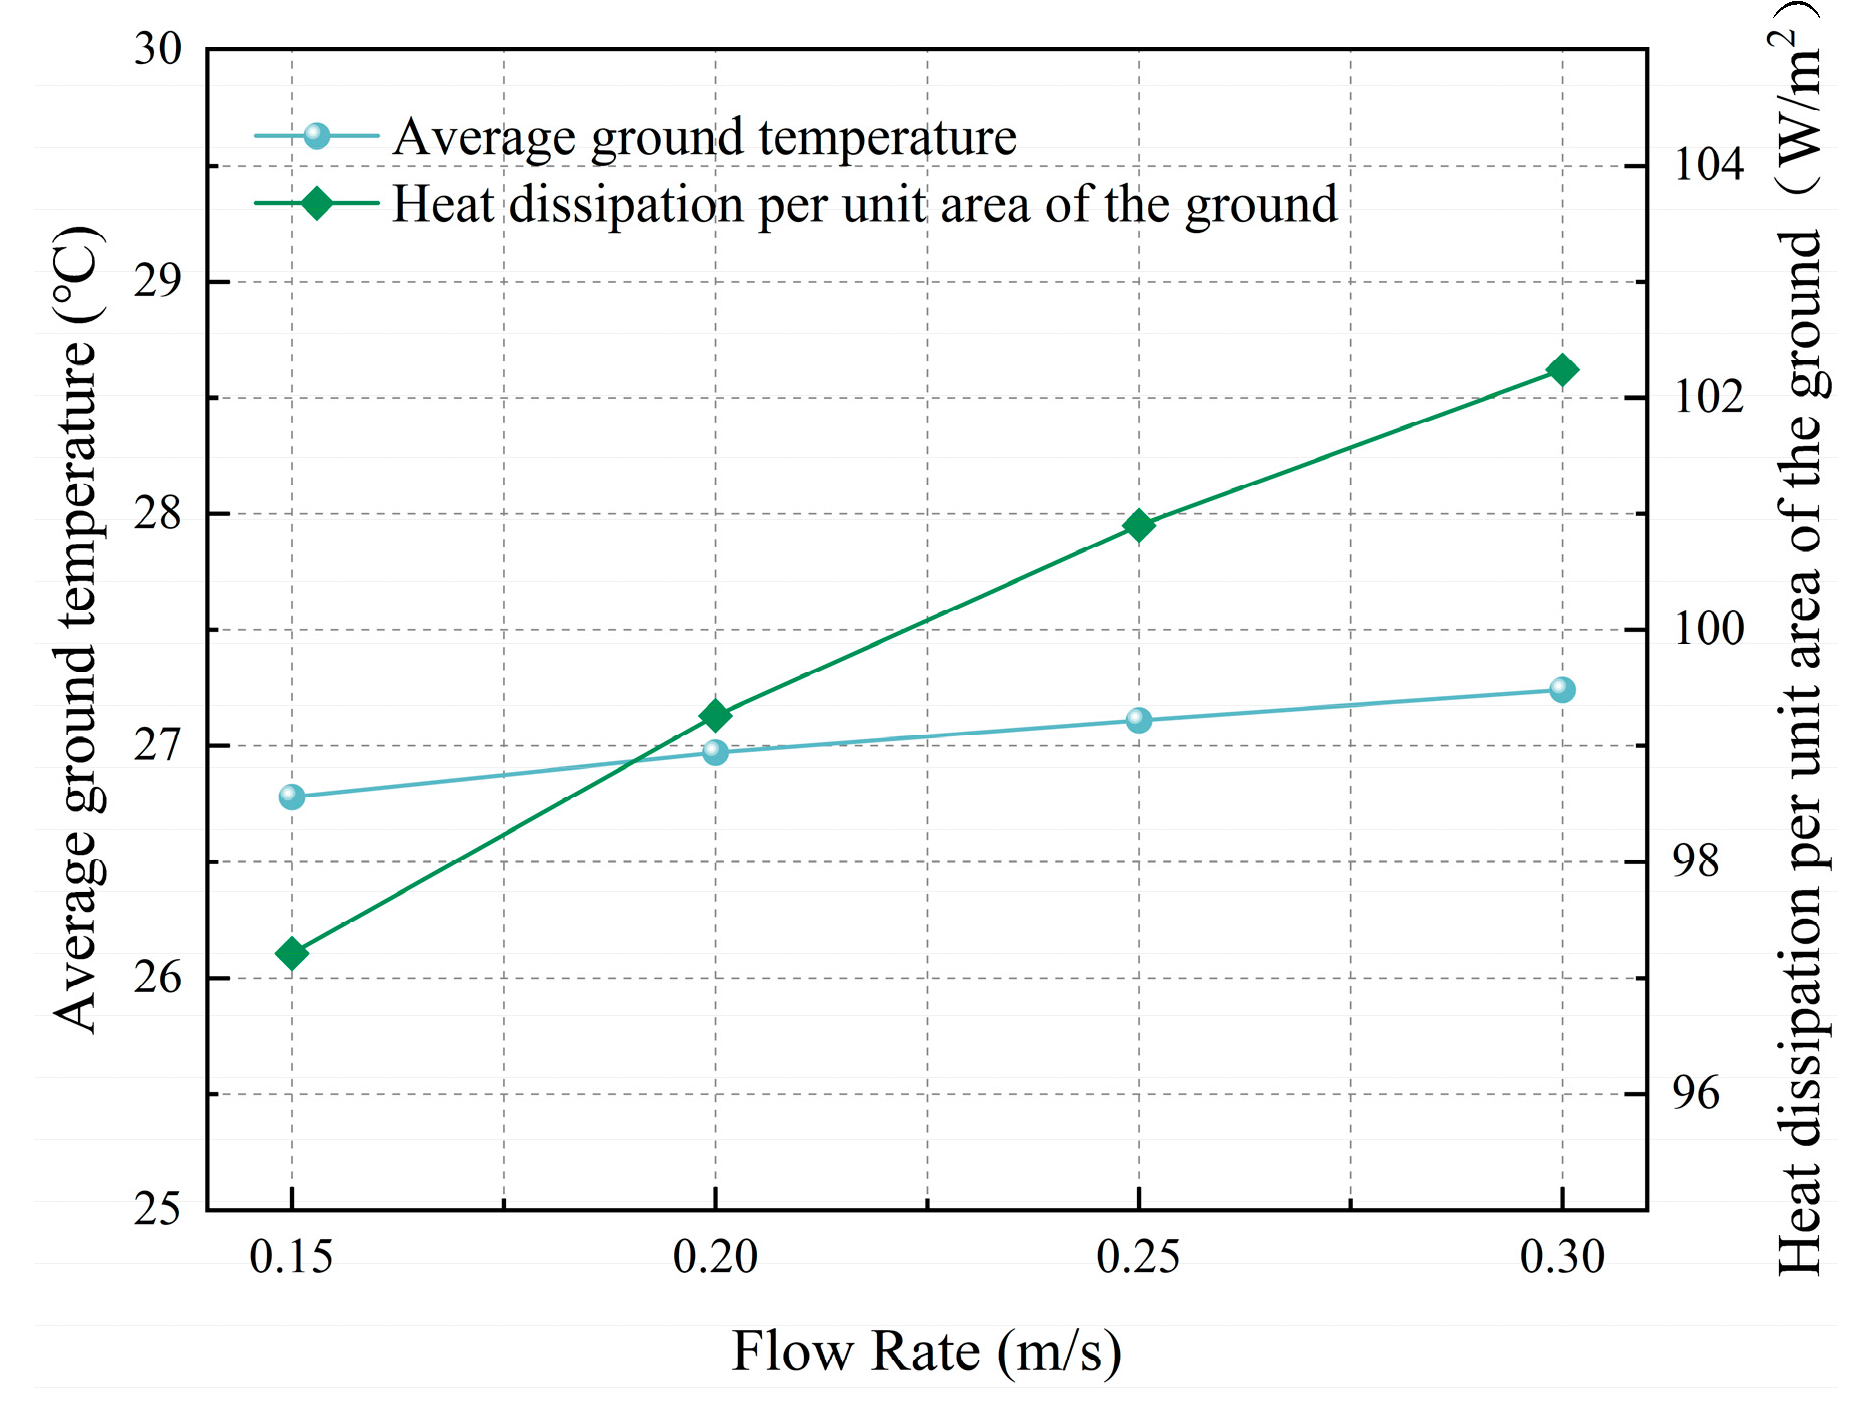
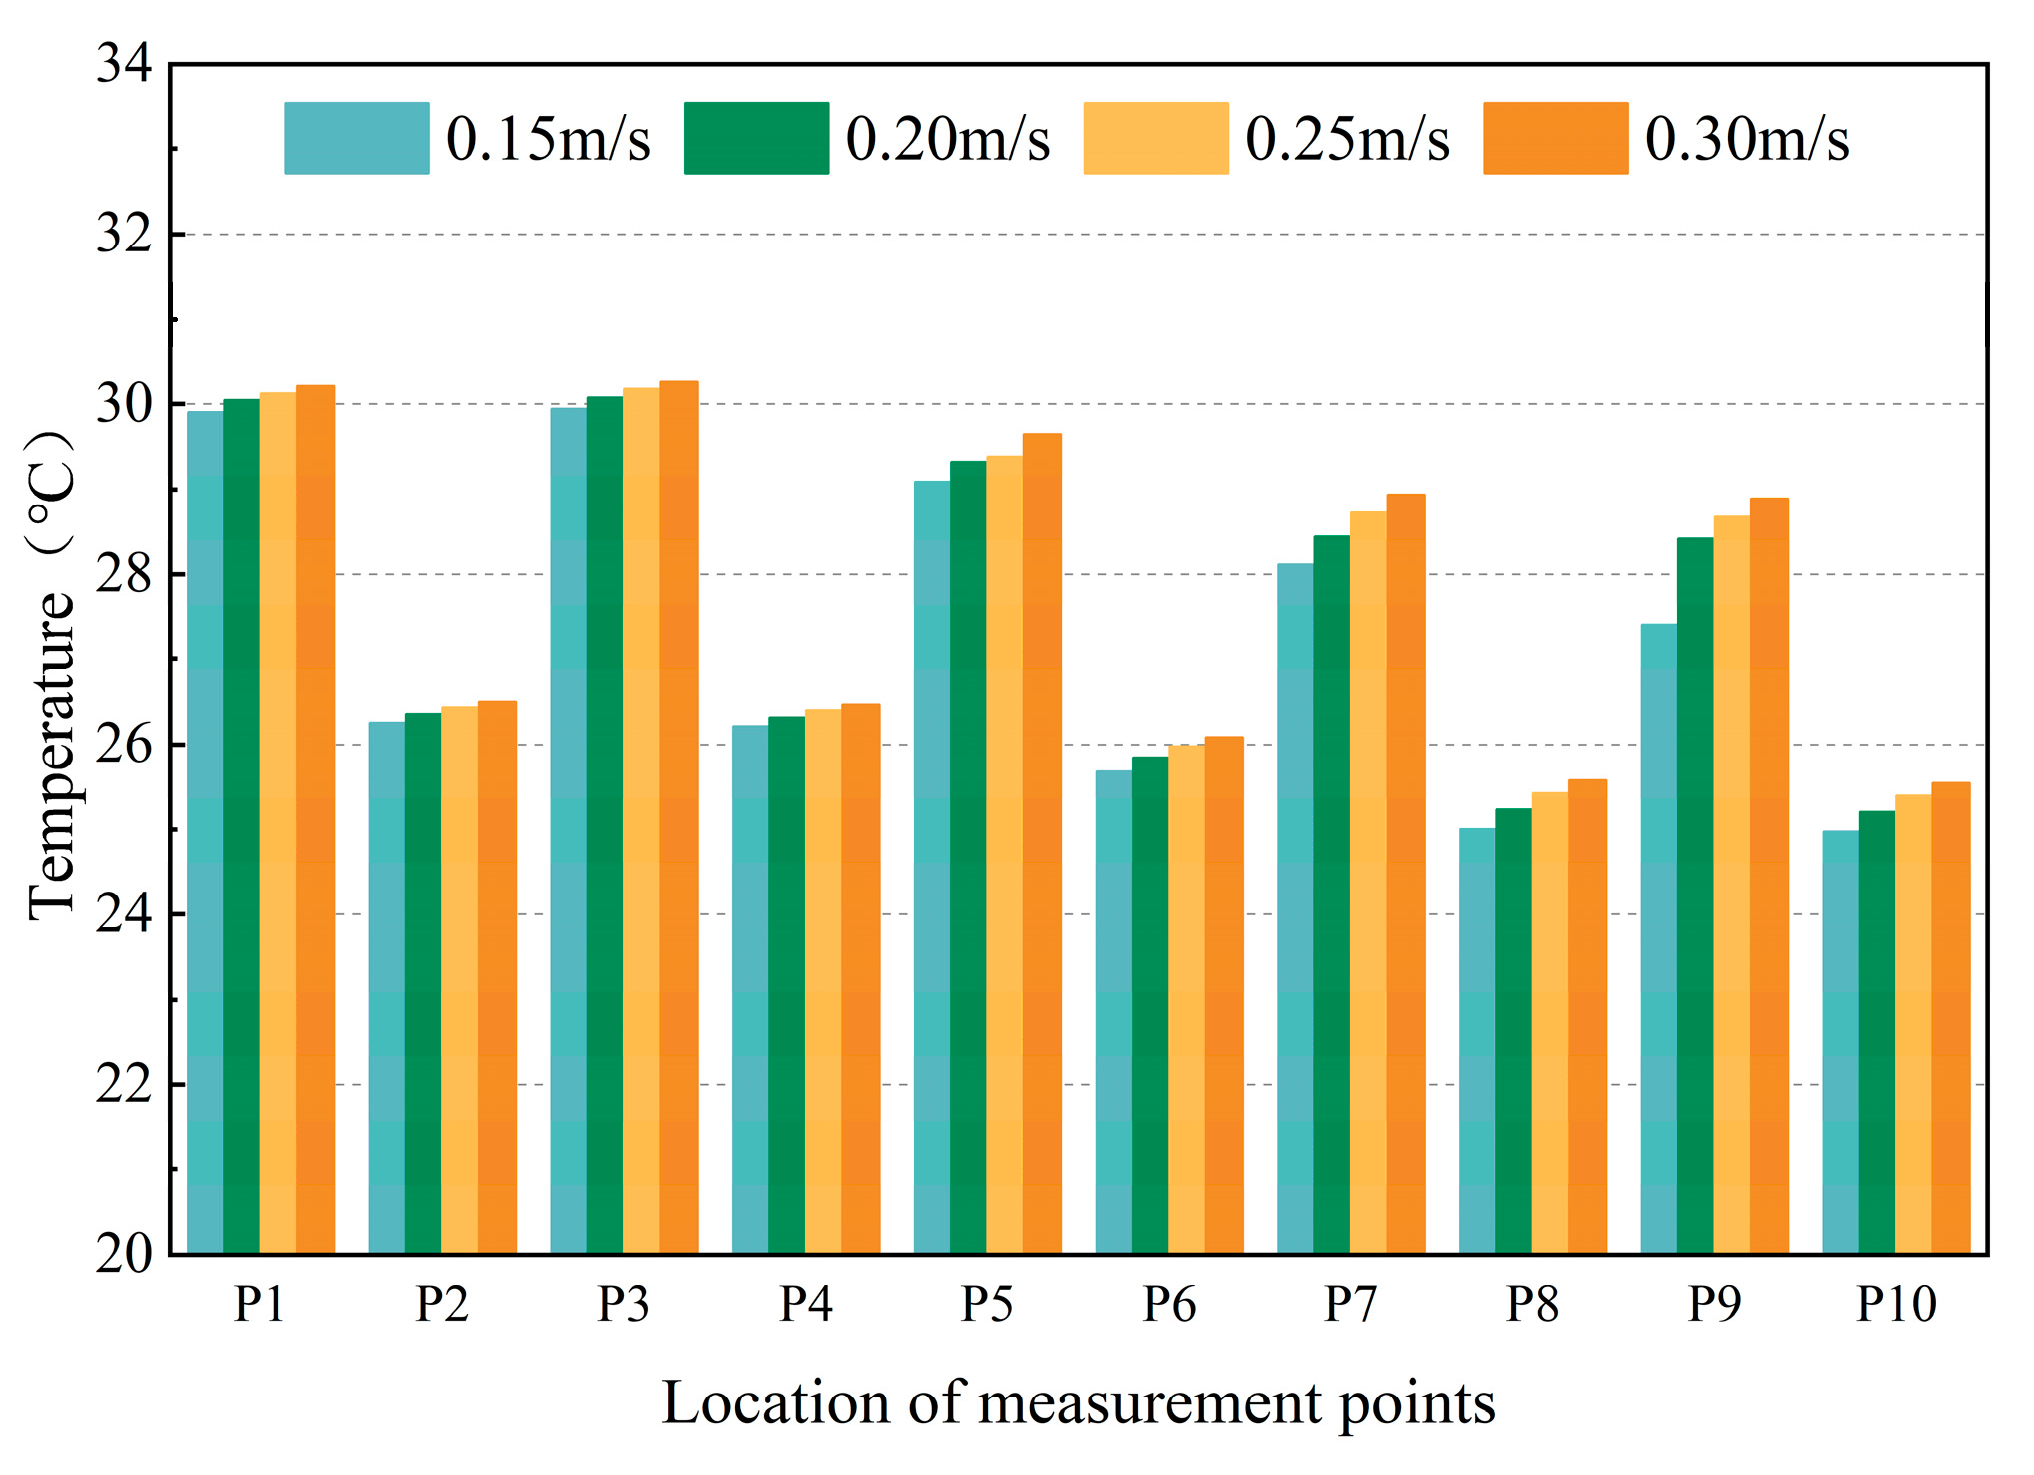
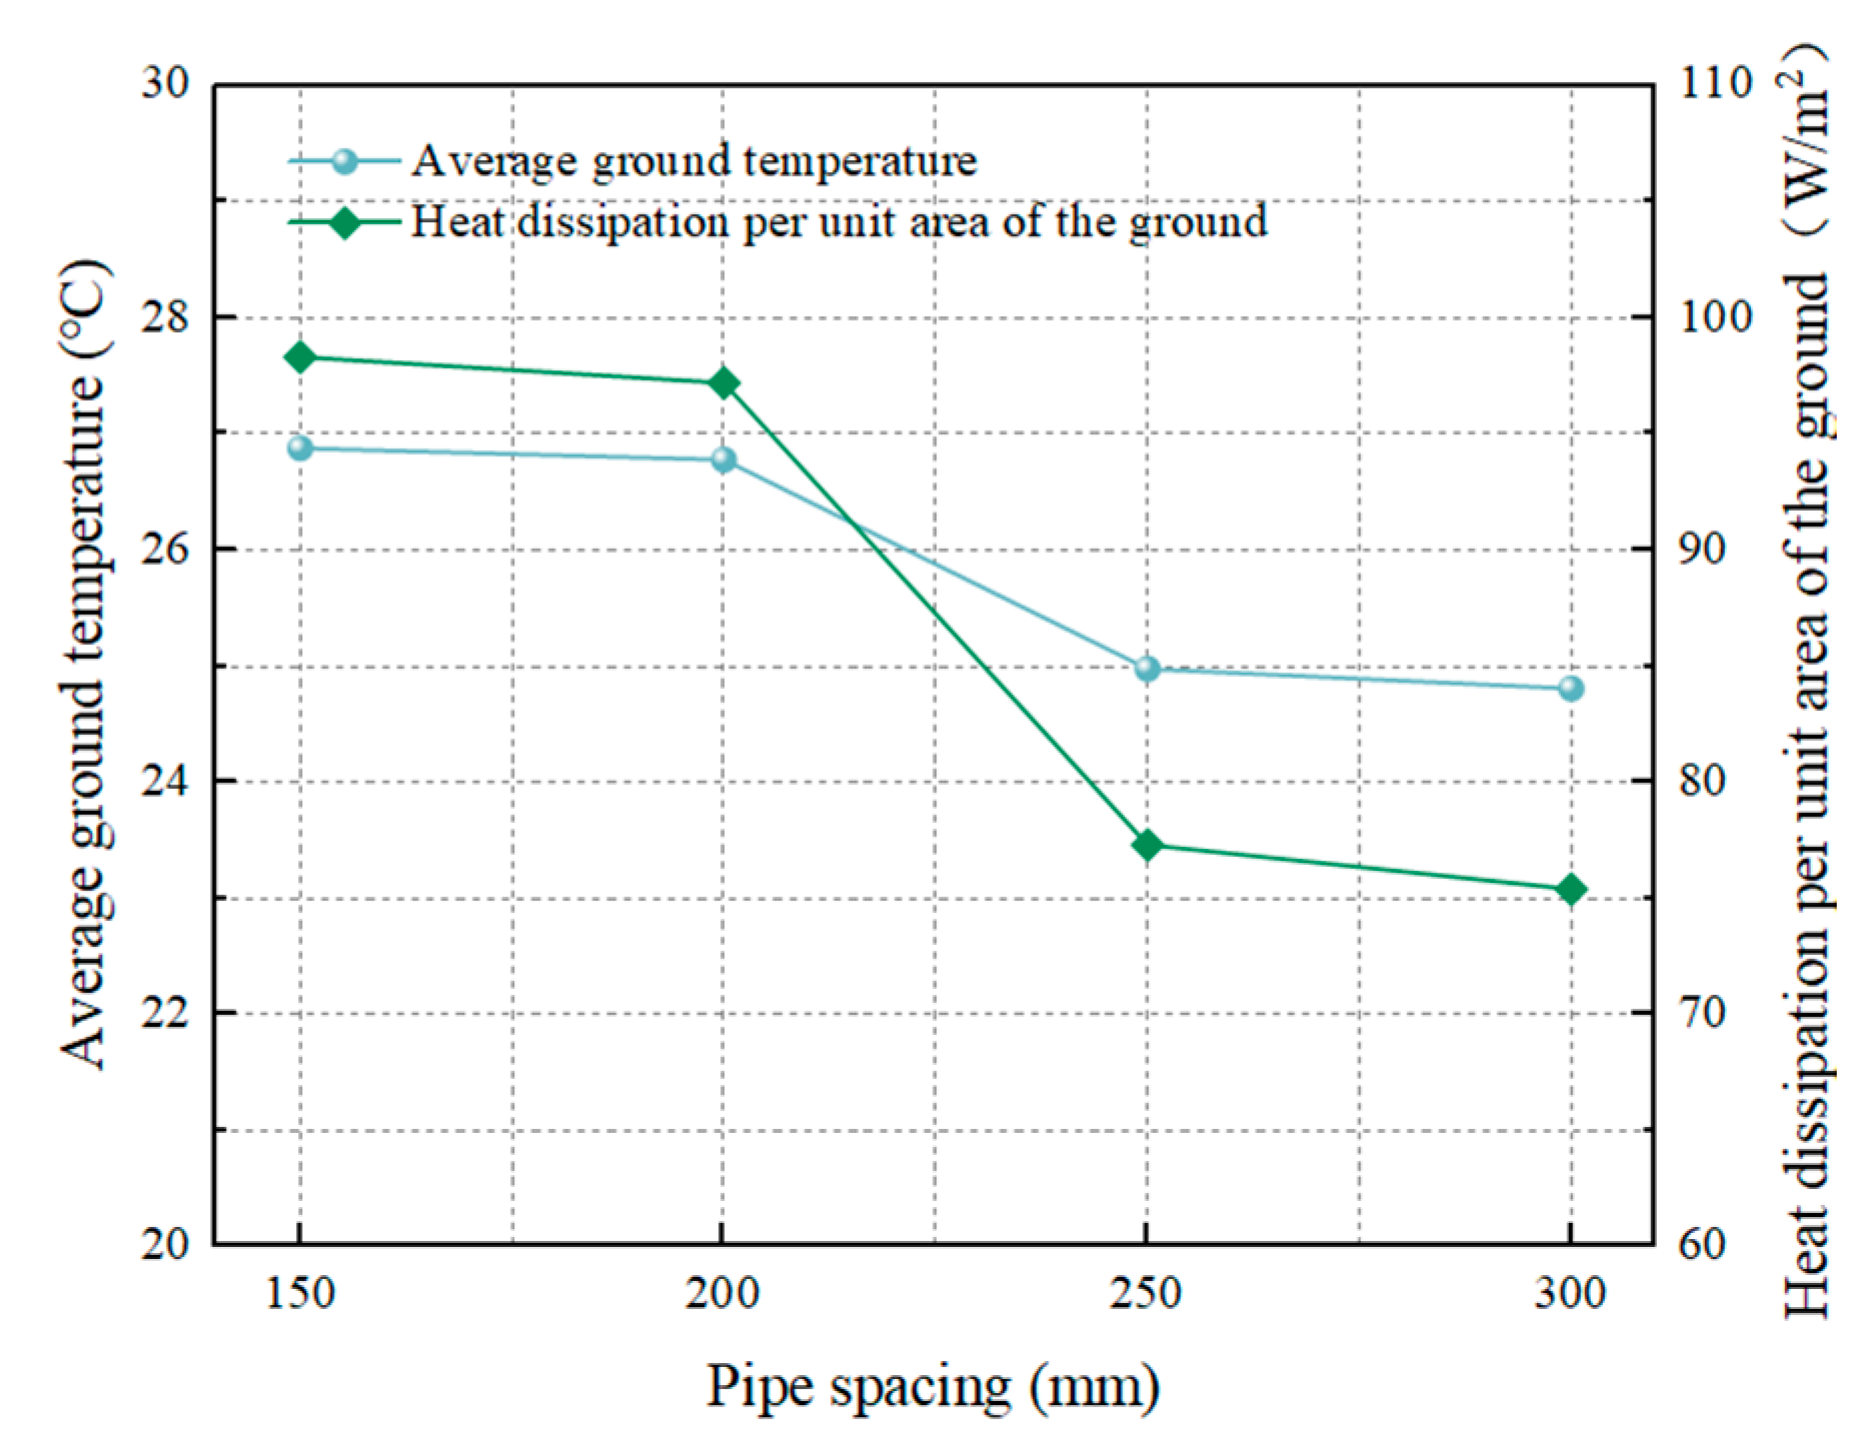
5.3. Factors Affecting the Heating Performance of the System

The results show that the influence of the water supply temperature and flow rate on the system performance is consistent with the experimental results. For the pipe spacing, the average ground temperature and heat dissipation per unit area decrease and the maximum temperature difference between the pipes increases when the coil pipe spacing increases under working conditions with a water supply temperature of 45 °C and a flow rate of 0.15 m/s. In the analysis of the orthogonal simulation results, the water supply temperature and coil pipe spacing show a highly significant effect on the average ground temperature, heat dissipation per unit area, and maximum temperature difference between pipes. While the flow rate shows a significant effect on the average ground temperature and heat dissipation per unit area, it does not show significant effects on the maximum temperature difference between pipes. A multiple linear regression model is established for the average ground temperature, heat dissipation per unit area, and maximum temperature difference between pipes. Through tests on the goodness of fit and multicollinearity of the model, and the normality of residuals, as well as through a comparison with the simulation results, it is shown that the established multiple linear regression model can predict the prefabricated hot water radiant module heating system well. Of course, multiple sets of comparison experiments can be conducted in different-sized rooms to explore whether or not room size has an impact on system performance in the future.

6. Conclusions

The present research study thus contributes to the field by investigating the heating capacity of a new prefabricated assembled hot water radiant modular heating system made from a recycled waste building masonry structure via experimental and numerical simulation methods. The main conclusions of this study are as follows:
(1)
A new prefabricated assembled hot water radiant module heating system composed of construction waste masonry structure and other materials is proposed, and its performance is studied to verify that the system has a good heating effect;
(2)
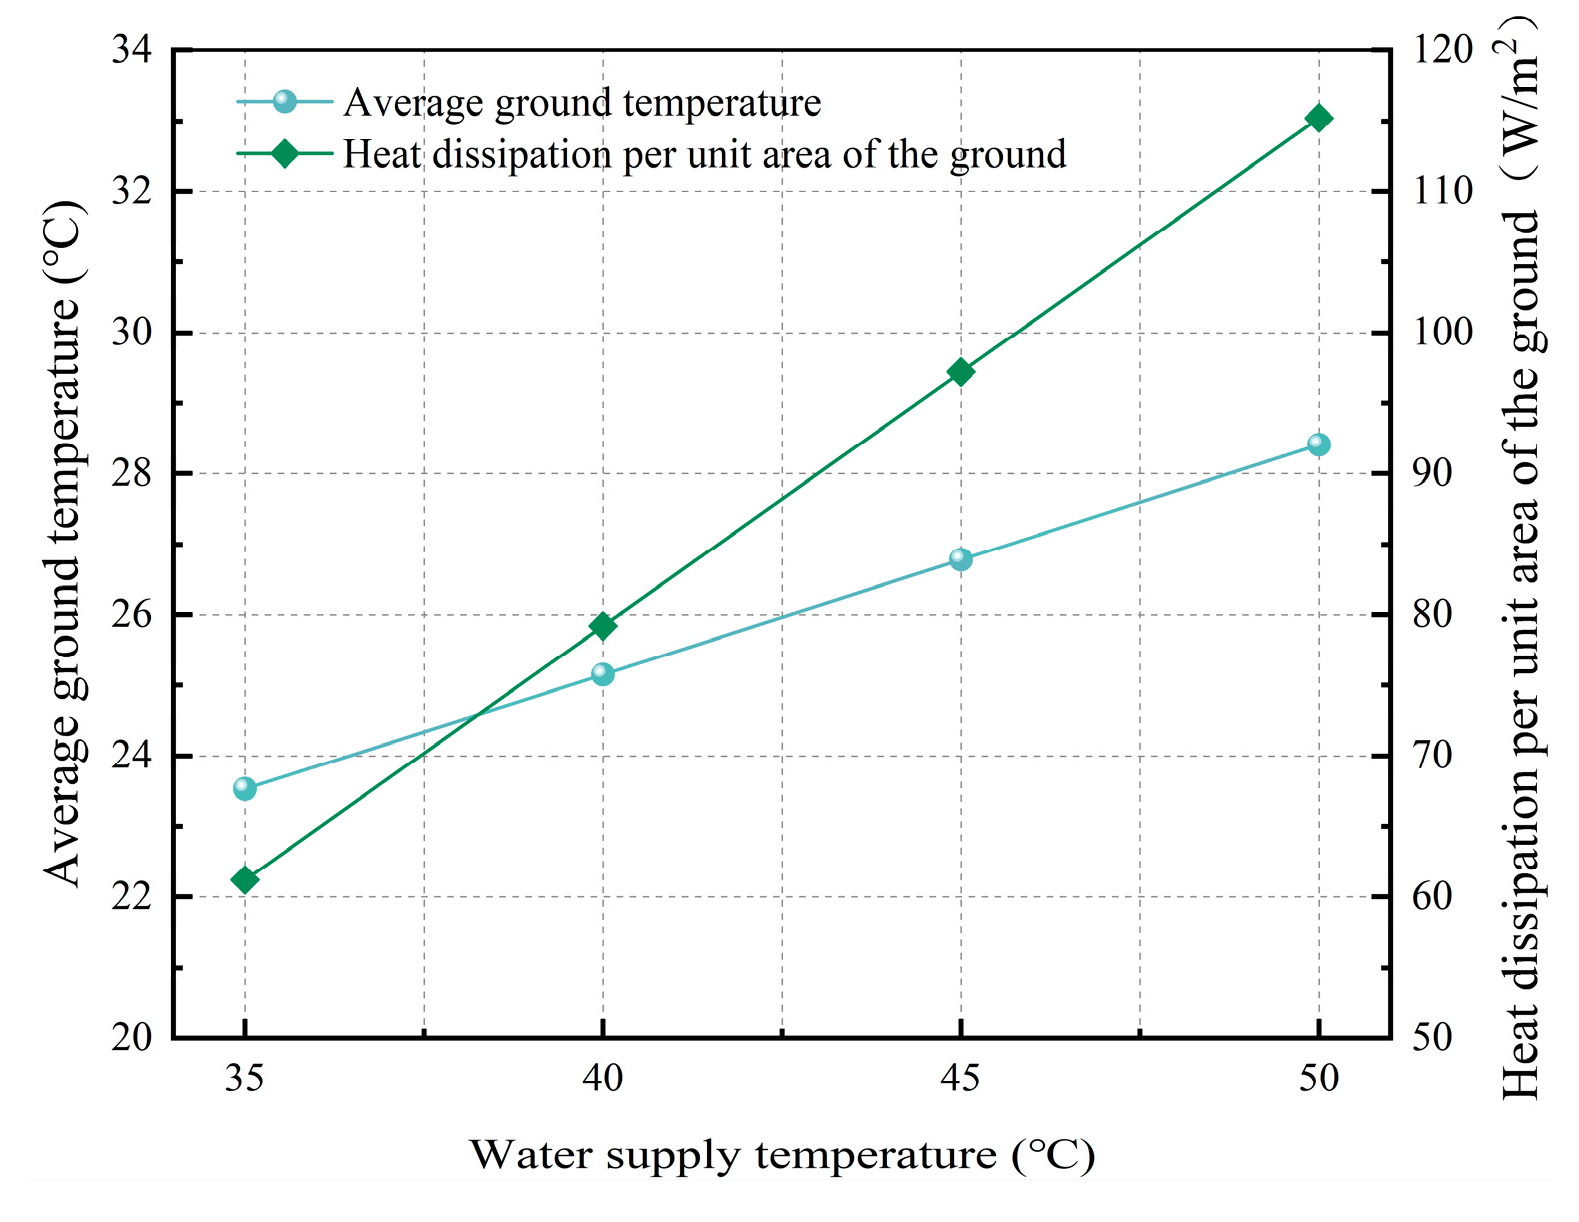
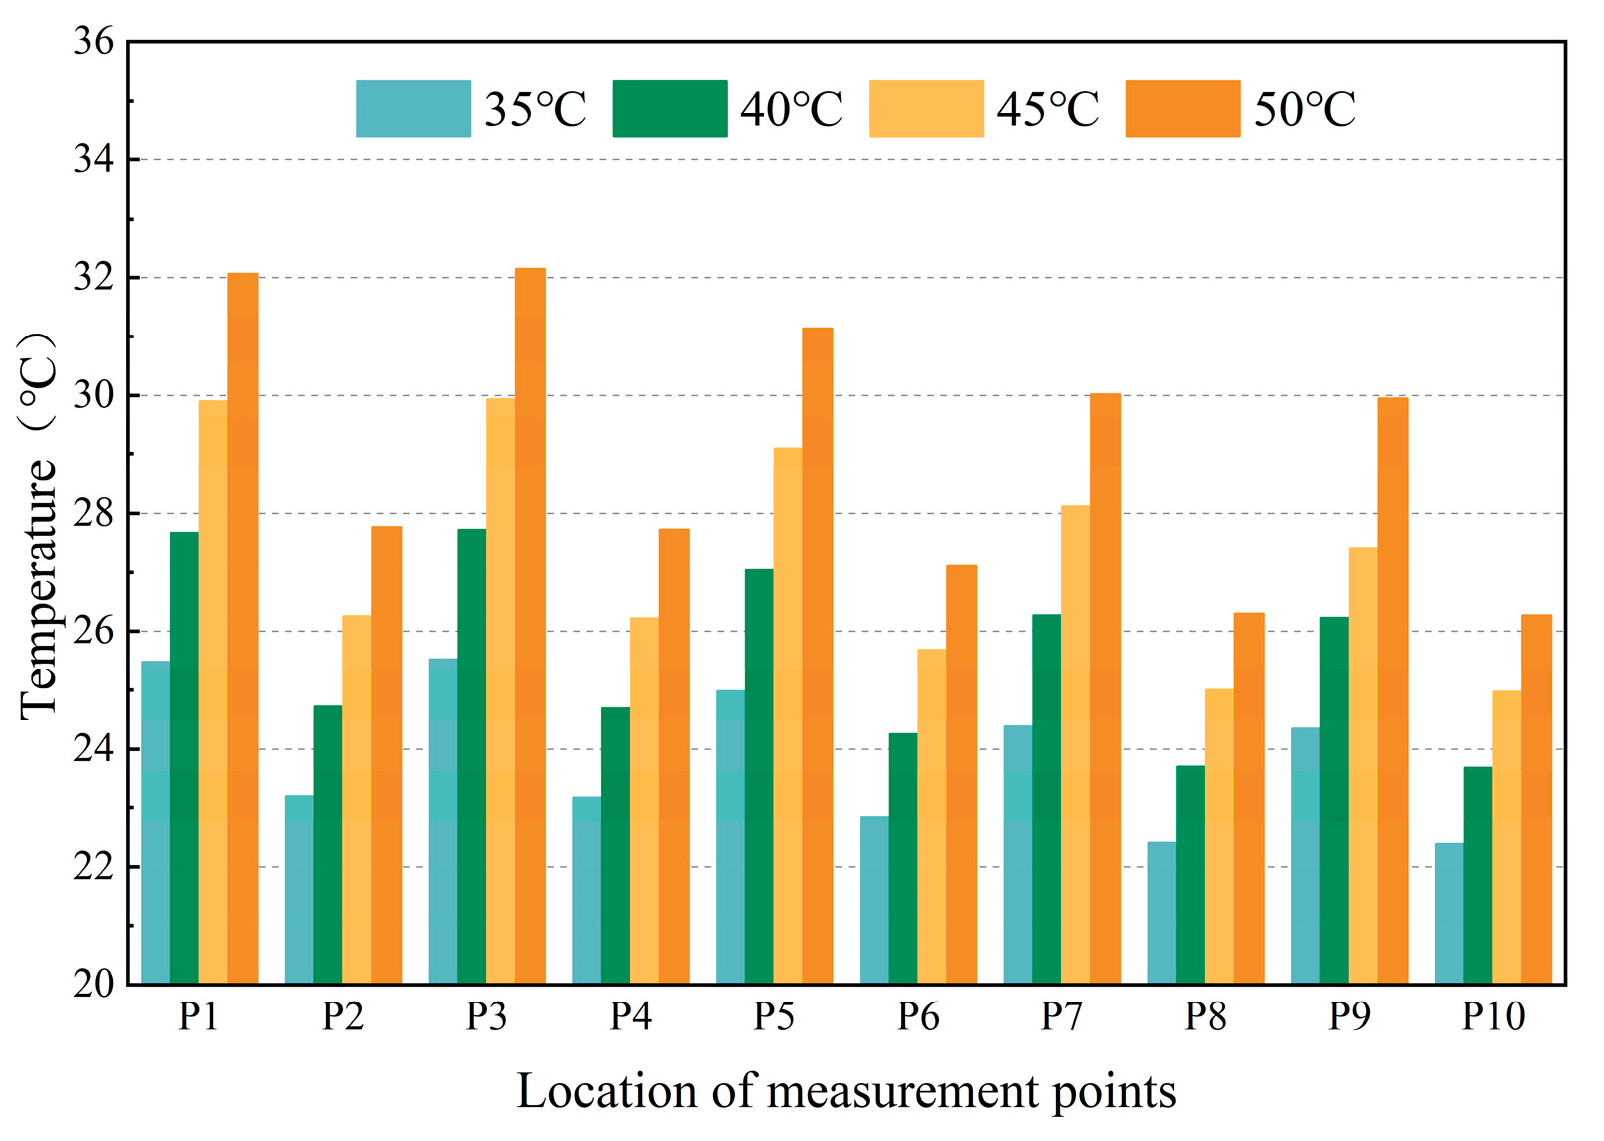
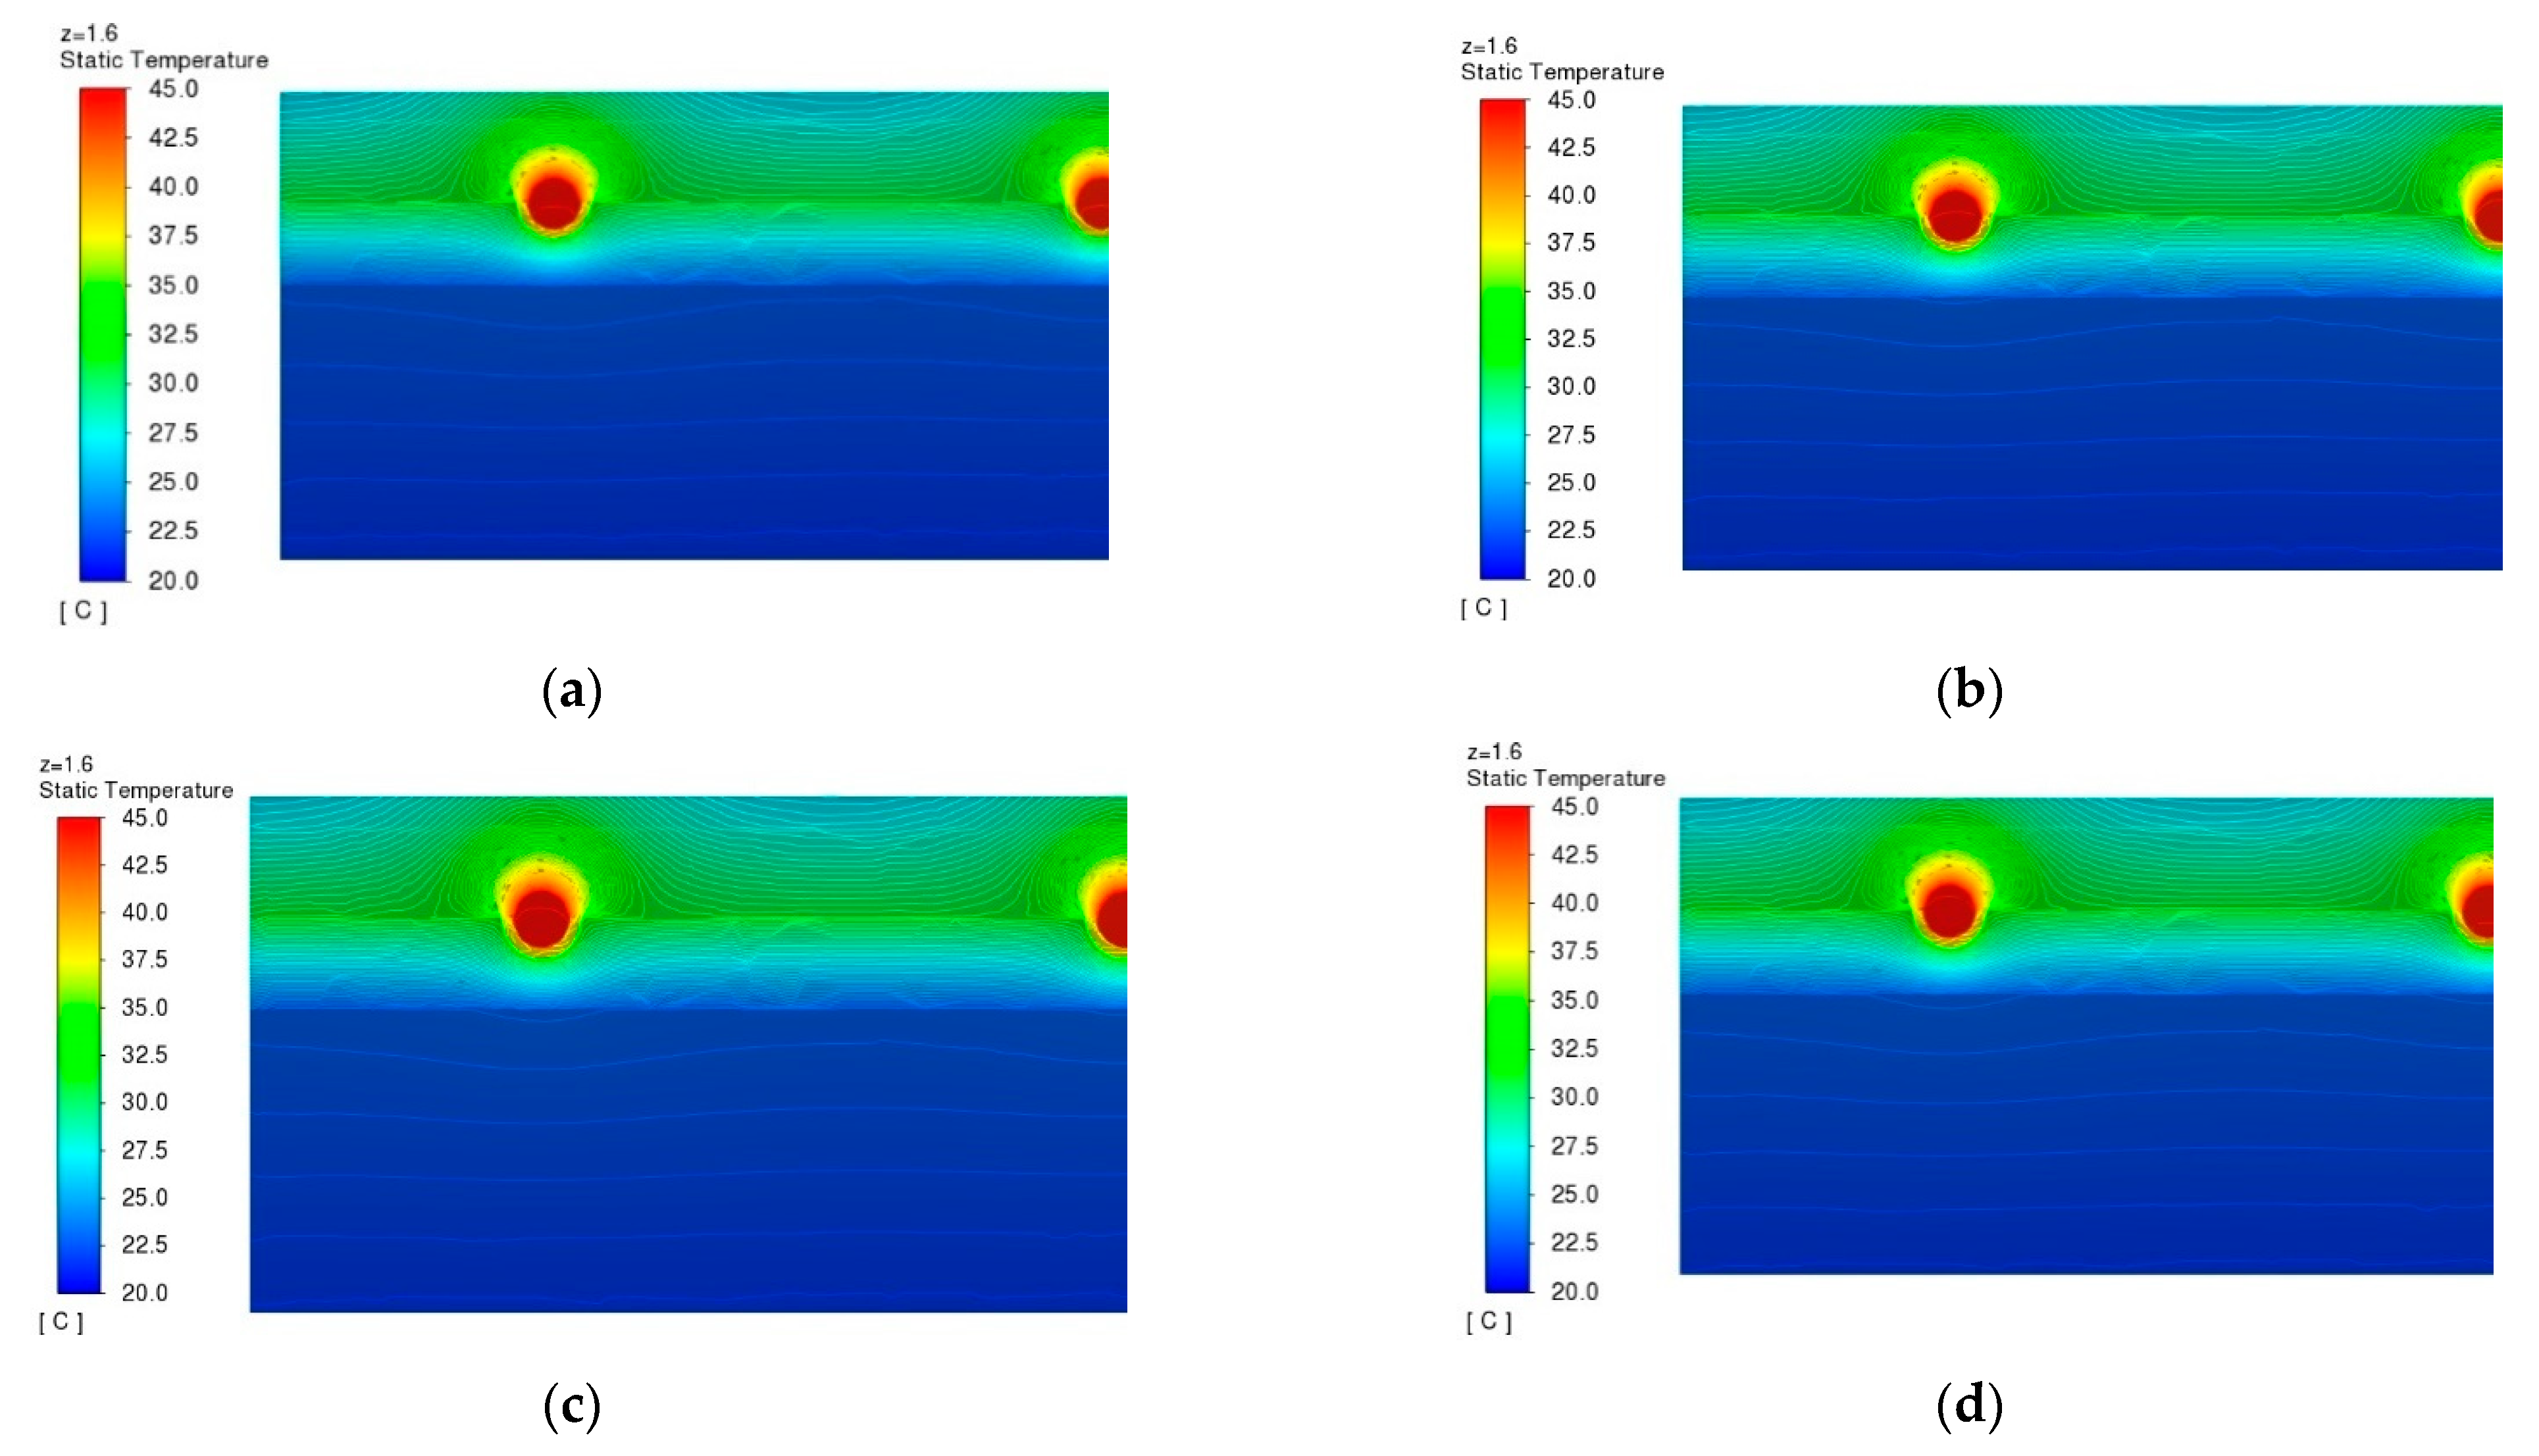
Based on the theoretical analysis of thermal engineering, a physical model of a prefabricated assembled system is established, and the influence of the water supply temperature, flow rate, and coil spacing on the heating index of the system is explored by taking the average temperature of the ground, the density of heat flow, and the maximum temperature difference between the pipes as the indicators.
(3)
Through numerical simulation and orthogonal experiments, the change rules of the heating capacity of the system under different working conditions are explored, and a multivariate linear regression mathematical model (R2 > 0.85) is established between the numerical model of heat transfer in the floor structure of the system and the indexes of the heating capacity, which are verified to have a high degree of accuracy and provide experimental support and the theoretical basis for the design of the system in practical applications.

Author Contributions

Methodology, B.Z. and M.L.; software, B.Z. and Z.Z.; validation, B.Z., Y.W. and M.L.; formal analysis, B.Z. and Z.Z.; investigation, Y.W. and Z.Z.; resources, B.Z. and M.L.; data curation, Y.W. and Z.Z.; writing—original draft preparation, B.Z.; writing—review and editing, Y.W.; supervision, M.L.; funding acquisition, M.L., Project administration, M.L. All authors have read and agreed to the published version of the manuscript.

Funding

This research was funded by the projects of the Liao Ning Social Science Foundation of China (Project No. L10TJ002).

Data Availability Statement

The data presented in this study are available on request from the corresponding author. The data are not publicly available due to privacy.

Acknowledgments

The authors would like to thank the reviewers of the previous draft for their helpful comments.

Conflicts of Interest

The authors declare no conflicts of interest.

References

  1. Tsinghua University; Building Energy Efficiency Research Center. China Building Energy Efficiency Annual Development Research Report Rural Housing; China Construction Industry Press: Beijing, China, 2020. [Google Scholar]
  2. Weitzmann, P.; Kragh, J.; Roots, P.; Svendsen, S. Modelling floor heating systems using a validated two-dimensional ground-coupled numerical model. Build. Environ. 2005, 40, 153–163. [Google Scholar] [CrossRef]
  3. Kitagawa, H.; Asawa, T.; Del Rio, M.A.; Kubota, T.; Trihamdani, A.R. Thermal energy simulation of PCM-based radiant floor cooling systems for naturally ventilated buildings in a hot and humid climate. Build. Environ. 2023, 238, 110351. [Google Scholar] [CrossRef]
  4. Jin, X.; Zhang, X.; Luo, Y. A calculation method for the floor surface temperature in radiant floor system. Energy Build. 2010, 42, 1753–1758. [Google Scholar] [CrossRef]
  5. Li, Q.Q.; Chen, C.; Zhang, Y.; Lin, J.; Ling, H.S.; Ma, Y. Analytical solution for heat transfer in a multilayer floor of a radiant floor system. Build. Simul. 2014, 7, 207–216. [Google Scholar] [CrossRef]
  6. Zhang, L.; Liu, X.-H.; Jiang, Y. Simplified calculation for cooling/heating capacity, surface temperature distribution of radiant floor. Energy Build. 2012, 55, 397–404. [Google Scholar] [CrossRef]
  7. Wu, X.; Zhao, J.; Olesen, B.W.; Fang, L.; Wang, F. A new simplified model to calculate surface temperature and heat transfer of radiant floor heating and cooling systems. Energy Build. 2015, 105, 285–293. [Google Scholar] [CrossRef]
  8. Ding, P.; Li, Y.; Long, E.; Zhang, Y.; Liu, Q. Study on heating capacity and heat loss of capillary radiant floor heating systems. Appl. Therm. Eng. 2020, 165, 114618. [Google Scholar] [CrossRef]
  9. Ye, J.; Chen, X.; Xu, L.; Ni, L. Experimental study on heating performance of micro-holes radiant plate under different installation types in severe cold regions. Energy Build. 2023, 285, 112915. [Google Scholar] [CrossRef]
  10. Sattari, S.; Farhanieh, B. A parametric study on radiant floor heating system performance. Renew. Energy 2006, 31, 1617–1626. [Google Scholar] [CrossRef]
  11. Ngo, C.C.; Alhabeeb, B.A.; Balestrieri, M. Experimental study on radiant floor heating system. In Proceedings of the ASME International Mechanical Engineering Congress and Exposition, Proceedings (IMECE), Houston, TX, USA, 13–19 November 2015. [Google Scholar]
  12. Qi, H.B.; He, F.Y.; Wang, Q.S.; Li, D.; Lin, L. Simulation analysis of heat transfer on low temperature hot-water radiant floor heating and electrical radiant floor heating. Appl. Mech. Mater. 2012, 204, 4234–4238. [Google Scholar] [CrossRef]
  13. Ren, Y.; Li, D. Analysis of indoor thermal environment and heat loss of radiant floor heating system. In Proceedings of the 2011 International Conference on Remote Sensing, Environment and Transportation Engineering, RSETE 2011—Proceedings, Nanjing, China, 24–26 June 2011. [Google Scholar]
  14. Zhao, Z.C.; Jiang, P.P.; Zhao, K.; Shen, R.D. Analysis on indoor thermal comfort of radiant floor heating. Sci. Technol. Eng. 2018, 18, 321–328. [Google Scholar]
  15. Yang, F.; Liu, J.; Sun, Q.; Cheng, L.; Wennersten, R. Simulation analysis of household solar assistant radiant floor heating system in cold area. Energy Procedia 2019, 158, 631–636. [Google Scholar] [CrossRef]
  16. Baek, S.; Kim, S. Analysis of thermal performance and energy saving potential by PCM radiant floor heating system based on wet construction method and hot water. Energies 2019, 12, 828. [Google Scholar] [CrossRef]
  17. Strand, R.K. Incorporating two-dimensional conduction modeling techniques into an energy simulation program: The EnergyPlus radiant system example. Energy Build. 2022, 274, 112405. [Google Scholar] [CrossRef]
  18. Shen, D.Y.; Wang, S.L.; Yan, Q.Y.; Li, L.S. Experimental study of thin dry floor radiant heating system. Build. Sci. 2010, 26, 1–5. [Google Scholar]
  19. Yu, S.Z.; Feng, T.T.; Yu, T.T.; Lv, X.D. Study on thermal performance of floor radiant heating system with dry cavity. Shenyang Jianzhu Daxue Xuebao (Ziran Kexue Ban)/J. Shenyang Jianzhu Univ. (Nat. Sci.) 2013, 29, 888–893. [Google Scholar]
  20. Zhang, D.; Wang, Z.; Zhang, X. Experimental study on dry model radiant floor heating system. Taiyangneng Xuebao/Acta Energiae Solaris Sin. 2010, 31, 834–838. [Google Scholar]
  21. Alessio, G.; De Carli, M.; Zarrella, A.; Di Bella, A. Efficiency in heating operation of low-temperature radiant systems working under dynamic conditions in different kinds of buildings. Appl. Sci. 2018, 8, 2399. [Google Scholar] [CrossRef]
  22. Yu, G.; Yao, Y. The Experimental Research on the Heating and Cooling Performance of Light Floor Radiant Panels. Procedia Eng. 2015, 121, 1349–1355. [Google Scholar] [CrossRef]
  23. Liu, M.; Zhang, H.; Zheng, W.; You, S. Heat Transfer Research of a New Type of Radiant Floor Heating System. Heat Transf. Eng. 2020, 41, 1626–1641. [Google Scholar] [CrossRef]
  24. Werner-Juszczuk, A.J. Experimental and numerical investigation of lightweight floor heating with metallised polyethylene radiant sheet. Energy Build. 2018, 177, 23–32. [Google Scholar] [CrossRef]
  25. Babaharra, O.; Choukairy, K.; Hamdaoui, S.; Khallaki, K.; Mounir, S.H. Thermal behavior evaluation of a radiant floor heating system incorporates a microencapsulated phase change material. Constr. Build. Mater. 2022, 330, 127293. [Google Scholar] [CrossRef]
  26. Liu, X.L.; Wang, S.H.; Zhang, Y.C.; Du, H.M. Problems in design and construction of dry low temperature hot water radiant heating system. Build. Energy Effic. 2023, 51, 99–102. [Google Scholar]
  27. JGJ 142-2012; Technical Specification for Radiant Heating and Cooling. China Academy of Building Research: Beijing, China, 2012.
  28. Werner-Juszczuk, A.J. The influence of the thickness of an aluminium radiant sheet on the performance of the lightweight floor heating. J. Build. Eng. 2021, 44, 102896. [Google Scholar] [CrossRef]
  29. Zukowski, M. Heat transfer and pressure drop characteristics of the underfloor air distribution system. Energy Build. 2005, 37, 890–896. [Google Scholar] [CrossRef]
Figure 1. Floor module schematic and details. (a) Diagram of prefabricated underfloor heating modules. (b) Prefabricated underfloor heating module construction.
Buildings 14 02096 g001
Figure 2. Diagram of prefabricated underfloor heating module installation.
Buildings 14 02096 g002
Figure 3. Appearance of the experimental rooms.
Buildings 14 02096 g003
Figure 4. Schematic diagram of the experimental system.
Buildings 14 02096 g004
Figure 5. Schematic diagram of air temperature measuring point layout.
Buildings 14 02096 g005
Figure 6. Schematic diagram of ground temperature measuring point layout.
Buildings 14 02096 g006
Figure 7. Experimental measuring instruments. (a) SWP-ASR512 paperless recorder. (b) FLEXIM handheld ultrasonic flowmeter. (c) JTNT-A/C building envelope field tester. (d) JTR01Z wireless temperature test module. (e) JTR25Z wireless multi-channel acquisition host.
Buildings 14 02096 g007
Figure 8. Temperature of ground measurement points.
Buildings 14 02096 g008
Figure 9. Comparison of each temperature change curve in the experiment. (a) Prefabricated assembled floor heating room. (b) Conventional floor heating room.
Buildings 14 02096 g009
Figure 10. Temperature distribution of different water supply temperatures at different ground measurement points. (a) Prefabricated assembled floor heating room. (b) Conventional floor heating room.
Buildings 14 02096 g010
Figure 11. Surface temperature variation curves for different supply water temperatures. (a) Prefabricated assembled floor heating room. (b) Conventional floor heating room.
Buildings 14 02096 g011
Figure 12. Air temperature change curves of indoor reference points at different water supply temperatures. (a) Prefabricated assembled floor heating room. (b) Conventional floor heating room.
Buildings 14 02096 g012
Figure 13. Surface temperature distribution for different supply water flows. (a) Prefabricated assembled floor heating room. (b) Conventional floor heating room.
Buildings 14 02096 g013
Figure 14. Surface temperature variation with different supply water flows. (a) Prefabricated assembled floor heating room. (b) Conventional floor heating room.
Buildings 14 02096 g014
Figure 15. Air temperature changes at reference points under different supply water flows. (a) Prefabricated assembled floor heating room. (b) Conventional floor heating room.
Buildings 14 02096 g015
Figure 16. Prefabricated assembled hot water radiant heating module floor grid division schematic. (a) Pipe profile meshing. (b) Pipe section direction meshing.
Buildings 14 02096 g016
Figure 17. Schematic diagram of the grid irrelevance verification ground measurement points.
Buildings 14 02096 g017
Figure 18. Grid-independent validation results for prefabricated underfloor heating modules. (a) Ground measurement point temperature. (b) Return water temperature.
Buildings 14 02096 g018
Figure 19. Cloud map of temperature distribution of pipe sections at different water supply temperatures. (a) Water supply temperature of 35 °C. (b) Water supply temperature of 40 °C. (c) Water supply temperature of 45 °C. (d) Water supply temperature of 50 °C.
Buildings 14 02096 g019
Figure 20. Variation in average floor surface temperature and heat dissipation under different supply water temperatures.
Buildings 14 02096 g020
Figure 21. Temperature distribution of each measurement point on the ground under different supply water temperatures.
Buildings 14 02096 g021
Figure 22. Cloud map of pipeline cross-sectional temperature distribution under different flow rate working conditions: (a) 0.15 m/s; (b) 0.20 m/s; (c) 0.25 m/s; (d) 0.30 m/s.
Buildings 14 02096 g022
Figure 23. Variation in average floor surface temperature and heat dissipation under different supply water flow rates.
Buildings 14 02096 g023
Figure 24. Temperature distribution of each measurement point on the ground at different flow rates.
Buildings 14 02096 g024
Figure 25. Cloud diagram of pipe section temperature distribution under different coil spacings: (a) 150 mm; (b) 200 mm; (c) 250 mm; (d) 300 mm.
Buildings 14 02096 g025
Figure 26. Variation in average floor surface temperature and heat dissipation under different pipe spacings.
Buildings 14 02096 g026
Figure 27. Temperature distribution of each measurement point on the ground at different pipe spacings.
Buildings 14 02096 g027
Table 1. Experimental measuring instruments.
Test ParametersTest InstrumentInstrument AccuracyRecording Mode
Indoor reference point air temperature, ground temperature, inlet and outlet water temperatureThermocouple and SWP-ASR512 Paperless Recorder±0.1 °CAutomatic
FlowFLEXIM Handheld Ultrasonic Flowmeter±0.01 m/sManual
Unheated wall temperatureJTNT-A/C Building Envelope Field Tester±0.2 °CAutomatic
Indoor vertical air temperatureJTR01Z Wireless Temperature Test Module±0.1 °CAutomatic
JTR25Z Wireless Multi-Channel Acquisition Host
Table 2. Thermal property parameters of each layer material.
MaterialsThermal Conductivity (W/m·K)Density (kg/m3)Heat Capacity (J/kg·K)
Module upper board0.7980750
Module lower plate0.076501380
PE-RT pipe0.49402000
Reinforced concrete1.742500920
Tile1.122001250
Reflective film202.42719871
Table 3. Boundary conditions for prefabricated geothermal module heating system.
No.Boundary NameBoundary TypeNo.Boundary NameBoundary Type
1Upper/lower surface of floorType III boundary condition4Supply inletVelocity inlet
2Around the floorInsulation layer5Return inletPressure outlet
3Pipe wallCoupling, thin shell heat transfer6Solid–fluid contact surfaceCoupling
Table 4. Analysis of extreme differences of orthogonal experiments.
Serial NumberA—Pipe Spacing
(mm)
B—Water Temperature
(°C)
C—Flow Rate
(m/s)
Average Ground Temperature
(°C)
Heat Dissipation per Unit Area
(W/m2)
Maximum Temperature Difference between Pipes
(°C)
1150350.1522.5850.701.33
2150400.2025.3981.832.02
3150450.2527.23102.122.02
4150500.3029.08122.682.98
5200350.2023.6462.502.36
6200400.1525.1579.213.04
7200450.3027.24102.243.79
8200500.2528.80119.584.48
9250350.2522.5450.212.44
10250400.3023.9365.683.18
11250450.1524.9877.323.80
12250500.2026.4293.234.56
13300350.3022.4549.302.66
14300400.2523.7163.173.43
15300450.2024.9276.594.19
16300500.1526.0789.384.94
Average ground temperature T 1 ¯ 26.0722.8024.70---
T 2 ¯ 26.2124.5525.09---
T 3 ¯ 24.4726.0925.57---
T 4 ¯ 24.2927.5925.68---
Heat flow
Density
T 1 ¯ 89.3353.1874.15---
T 2 ¯ 90.8872.4778.54---
T 3 ¯ 71.6189.5783.77---
T 4 ¯ 69.61106.2284.98---
Maximum temperature difference between tubes T 1 ¯ 2.092.203.28---
T 2 ¯ 3.422.923.28---
T 3 ¯ 3.503.453.09---
T 4 ¯ 3.814.243.15---
RIndicators 11.924.790.98---
Indicators 221.2753.0410.82---
Indicators 31.722.040.19---
Table 5. Analysis of variance table for orthogonal experiments.
(a) Ground mean temperature variance analysis
Source of
Difference
Off-Difference Sum of SquaresDegree of
Freedom
Mean Square ValueF-ValueF Critical ValueSignificance
Pipe spacing (A)12.51134.17035.086 F 0.01 3 , 6 = 9.78 **
Water supply temperature (B)50.737316.912142.291 F 0.05 3 , 6 = 4.76 **
Flow rate (C)2.46230.8216.906 F 0.1 3 , 6 = 3.29 *
Error0.71360.119
Total sum of squared deviations66.42
(b) Heat dissipation per unit area variance analysis
Source of DifferenceOff-Difference Sum of SquaresDegree of
Freedom
Mean Square ValueF-ValueF Citical ValueSignificance
Pipe spacing (A)1533.4153511.13834.731 F 0.01 3 , 6 = 9.78 **
Water supply temperature (B)6217.95732072.652140.834 F 0.05 3 , 6 = 4.76 **
Flow rate (C)299.124399.7086.775 F 0.1 3 , 6 = 3.29 *
Error88.302614.717
Total sum of squared deviations8138.798
(c) Analysis of variance for maximum temperature difference between pipes
Source of DifferenceOff-Difference Sum of SquaresDegree of FreedomMean Square ValueF-ValueF Critical ValueSignificance
Pipe spacing (A)6.96332.32164.941 F 0.01 3 , 6 = 9.78 **
Water supply temperature (B)8.89132.96482.920 F 0.05 3 , 6 = 4.76 **
Flow rate (C)0.10630.0350.992 F 0.1 3 , 6 = 3.29
Error0.21460.036
Total sum of squared deviations16.175
Clarification: * represents the level of significance, the higher its number the more significant it is.
Table 6. Regression model and test results.
IndicatorsFitting Equation R 2 R 2 ¯ DW
Average ground temperature T a v e = 13.380 0.014 A + 0.318 B + 6.835 C 0.9490.9372.18
Heat dissipation per unit area q = 51.091 0.157 A + 3.524 B + 75.4 C 0.9490.9362.142
Maximum temperature difference between pipes T m a x = 4.808 + 0.010 A + 0.133 B 0.8860.8691.983
Table 7. Multiple linear regression model validation results.
Work ConditionsGround-Averaged Temperature
Regression Model Validation Results
Heat Dissipation per Unit Area
Regression Model Validation Results
Maximum Temperature Difference between Pipes Regression Model Validation Results
Simulation Results (°C)Predicted Results (°C)Relative Error
(%)
Simulation Results (°C)Predicted Results (°C)Relative Error
(%)
Simulation Results (°C)Predicted Results (°C)Relative Error
(%)
126.7825.923.2397.2187.4010.093.733.1814.80
226.9726.262.6499.2691.178.153.763.1815.46
327.1126.601.89100.9094.945.913.783.1815.86
427.2426.941.10102.2498.713.453.793.1816.26
523.5322.743.3861.2052.1614.772.351.8521.34
625.1524.333.2879.2169.7811.913.042.5117.31
726.7825.923.2397.2187.4010.093.733.1814.80
828.4127.513.18115.21105.028.854.423.8413.06
926.8826.620.9898.3295.253.122.482.68−7.99
1026.7825.923.2397.2187.4010.093.733.1814.80
1124.9825.22−0.9477.3279.55−2.883.923.686.13
1224.8124.521.1975.4171.704.924.174.18−0.12
Disclaimer/Publisher’s Note: The statements, opinions and data contained in all publications are solely those of the individual author(s) and contributor(s) and not of MDPI and/or the editor(s). MDPI and/or the editor(s) disclaim responsibility for any injury to people or property resulting from any ideas, methods, instructions or products referred to in the content.

