Impact of Air Velocity on Mold Growth in High Temperature and Humidity Conditions: An Experimental Approach


Abstract
1. Introduction
2. Design and Method
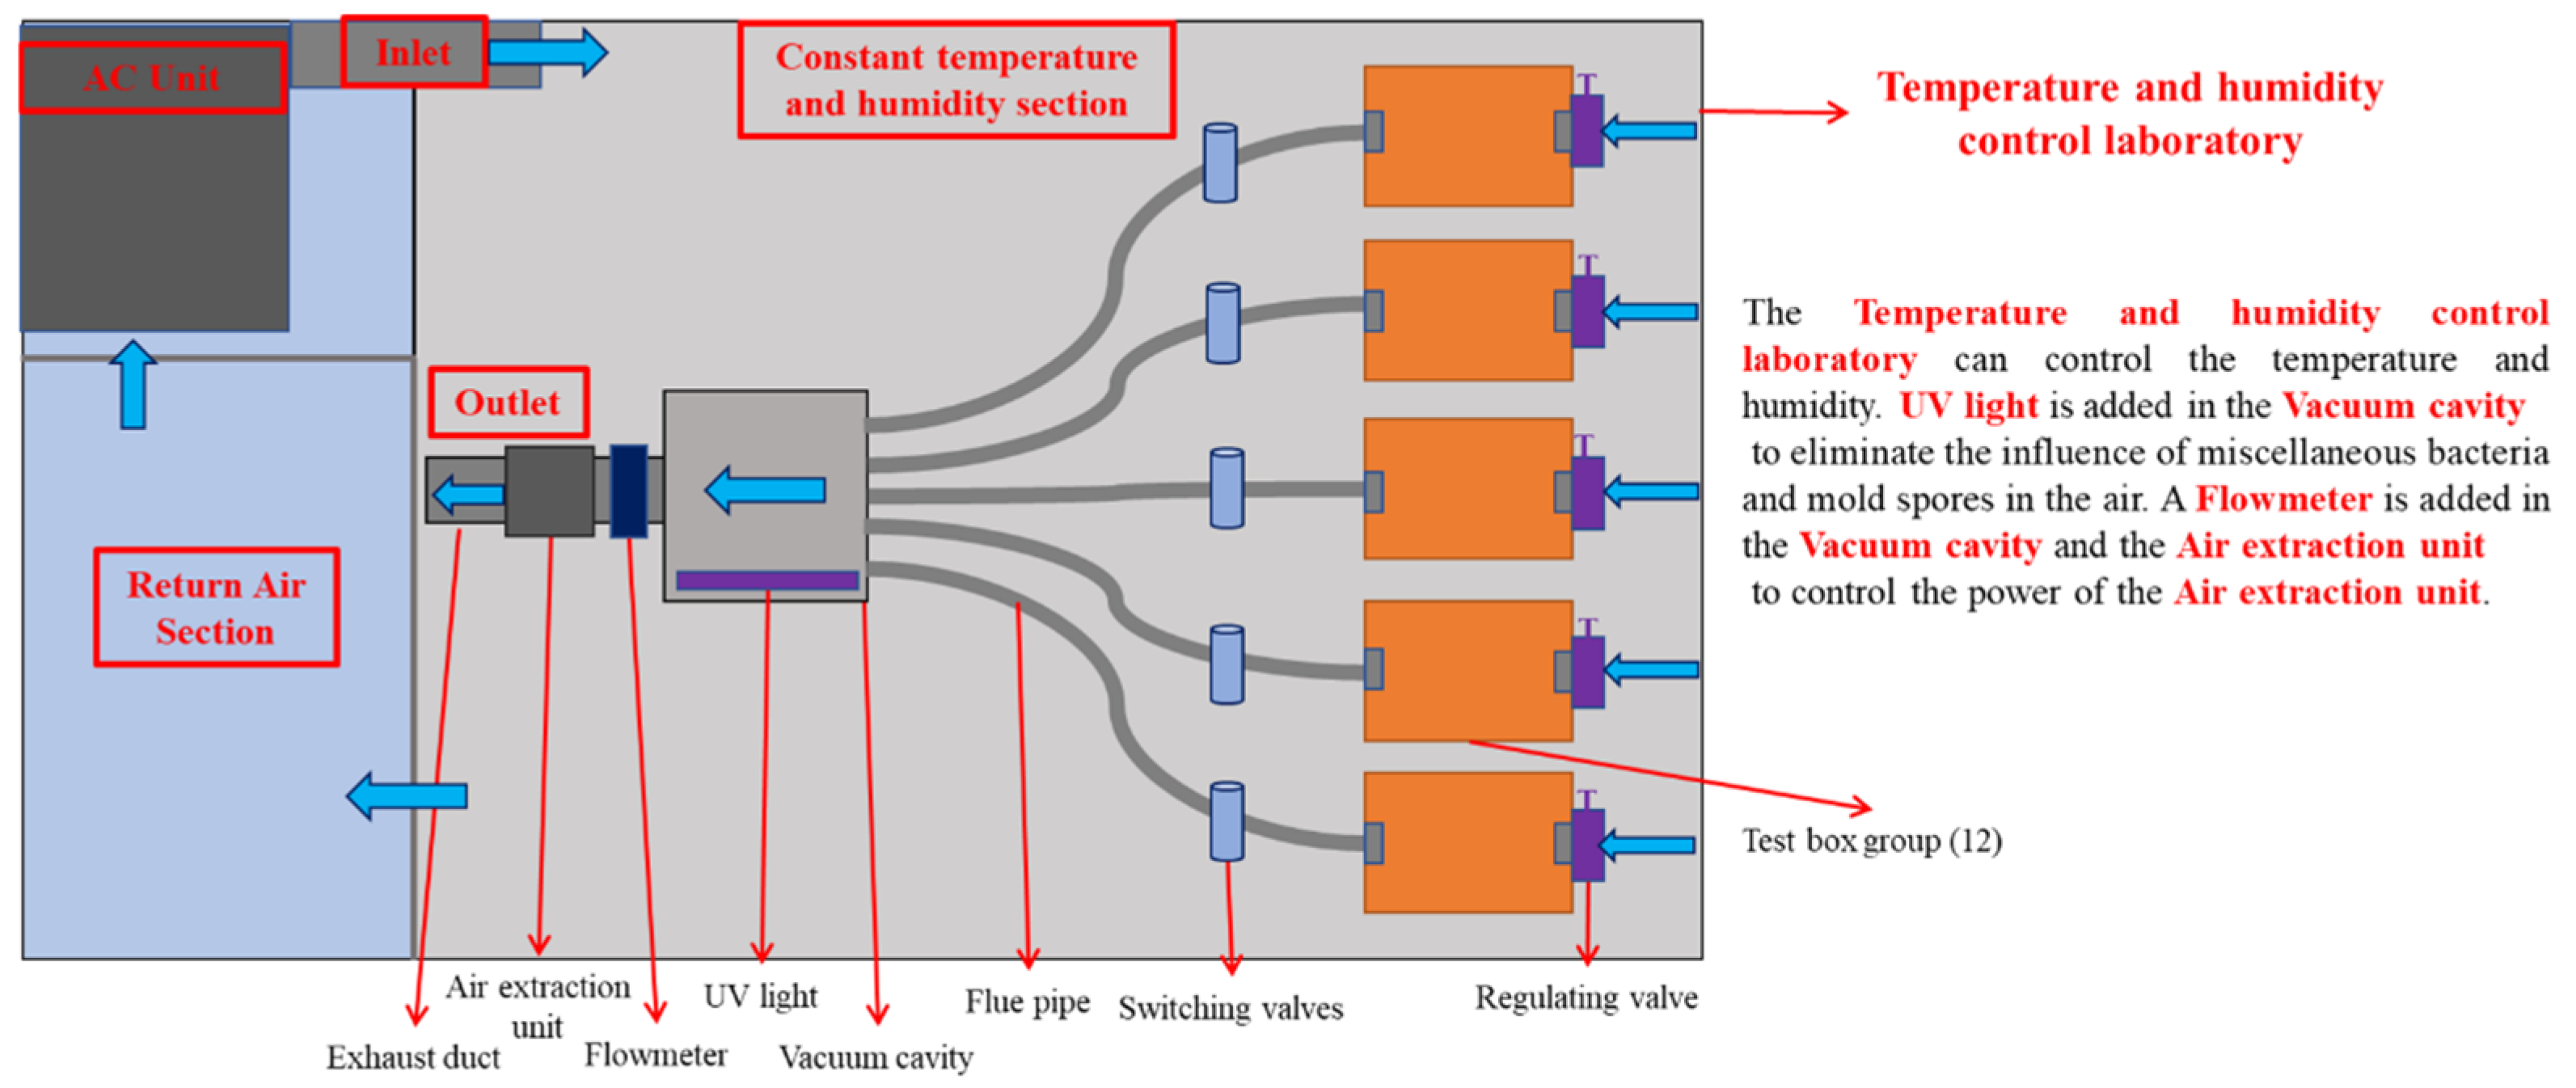
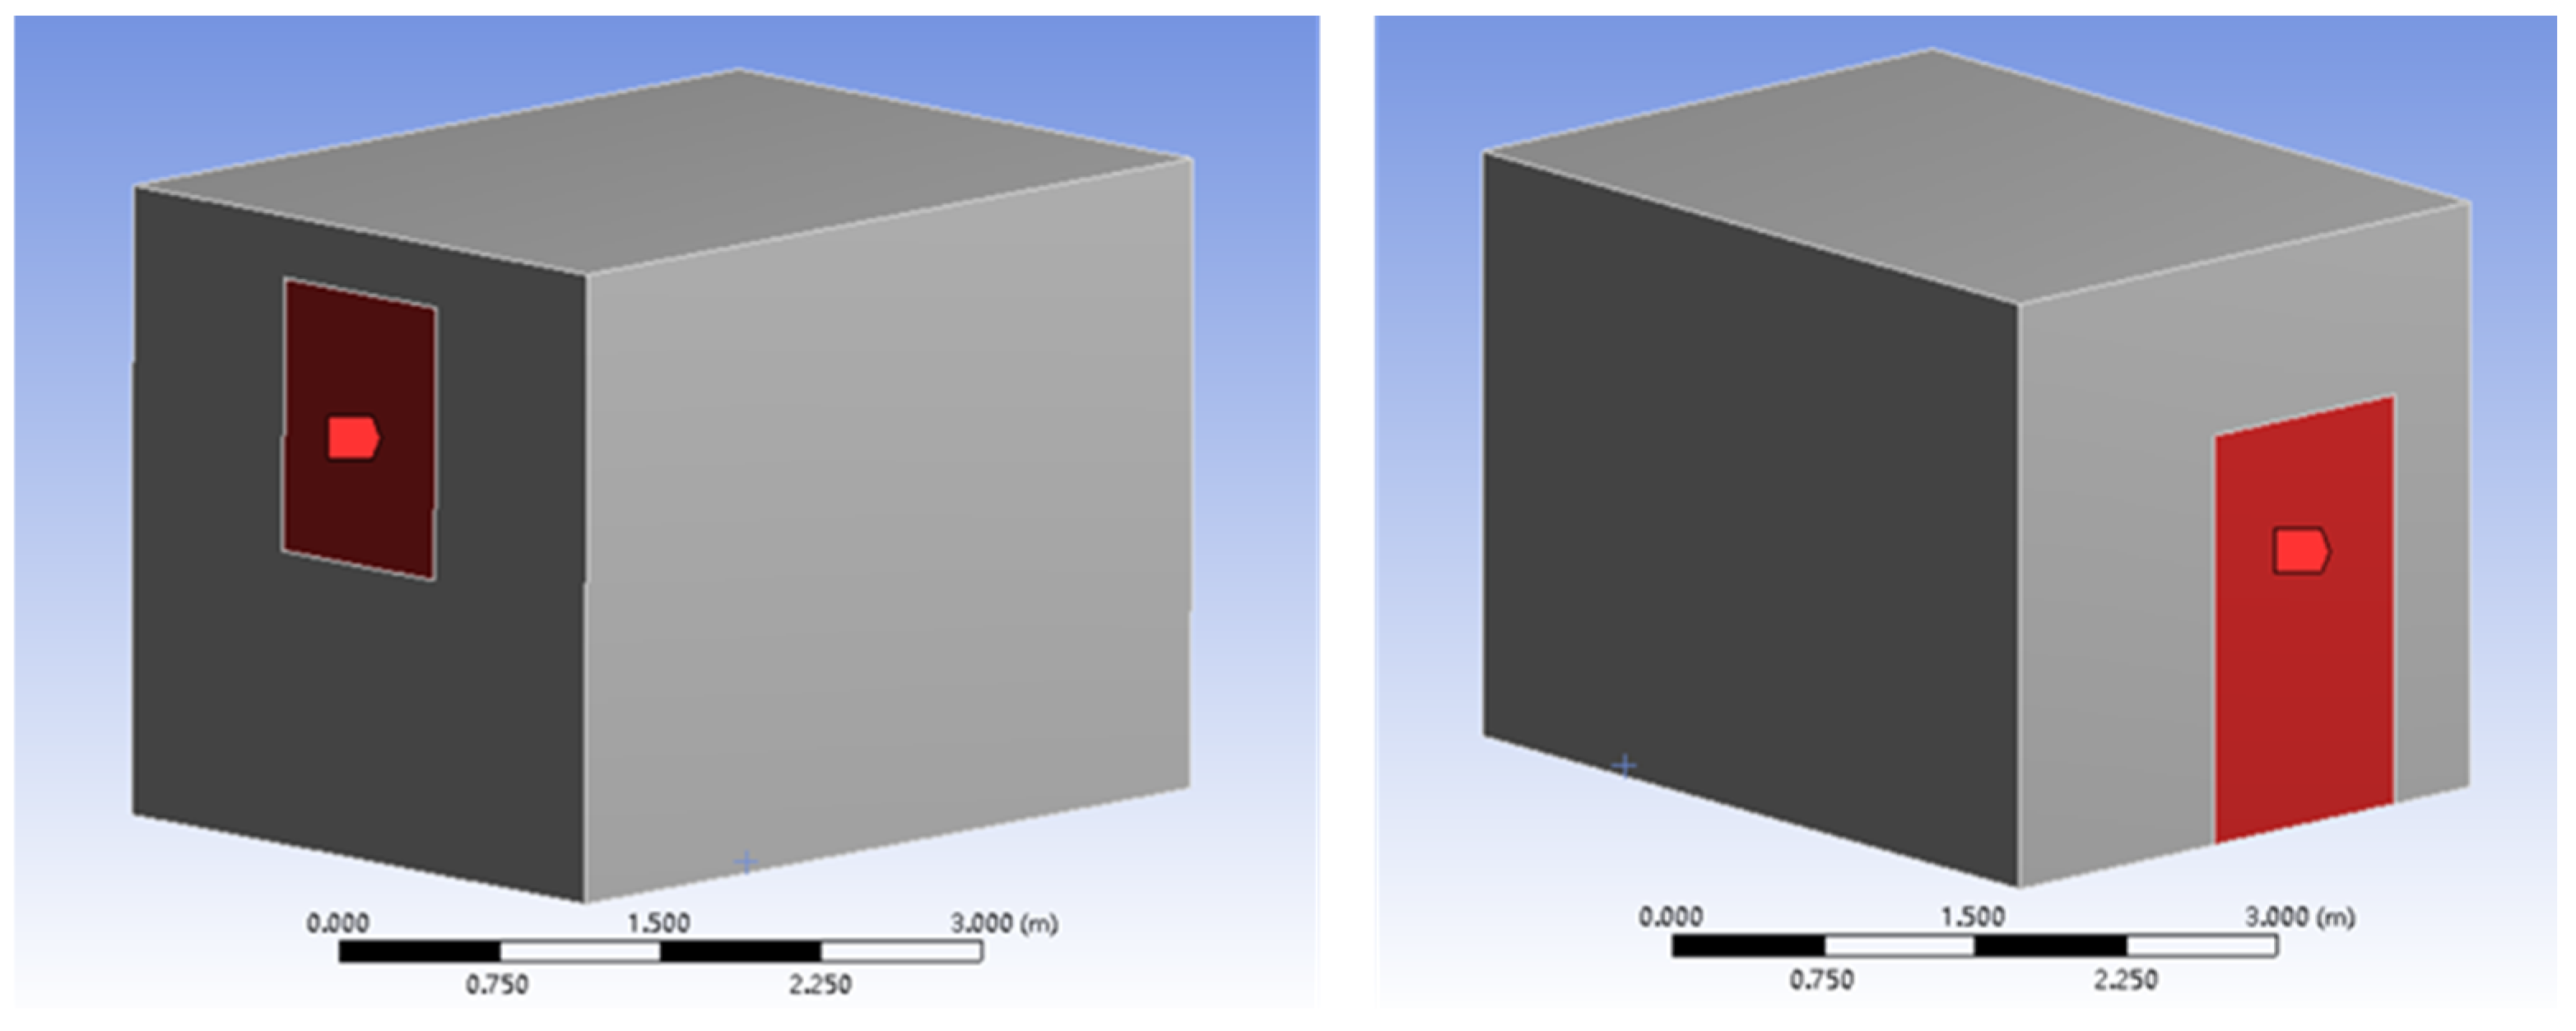
2.1. Laboratory System Design
- A.
- Ease of assembly, with relatively low cost and the use of appropriate materials.
- B.
- Ability to accurately control airflow velocity, temperature, and humidity within the test box.
- C.
- Placement surfaces for building materials on the bottom, sides, and top of the chamber.
- D.
- Transparent front panel with controllable transparency to regulate the amount of light entering the chamber.
- E.
- Simple and convenient opening and closing mechanism for easy inoculation of mold and observation of mold growth.
- F.
- Reusability for multiple experiments.
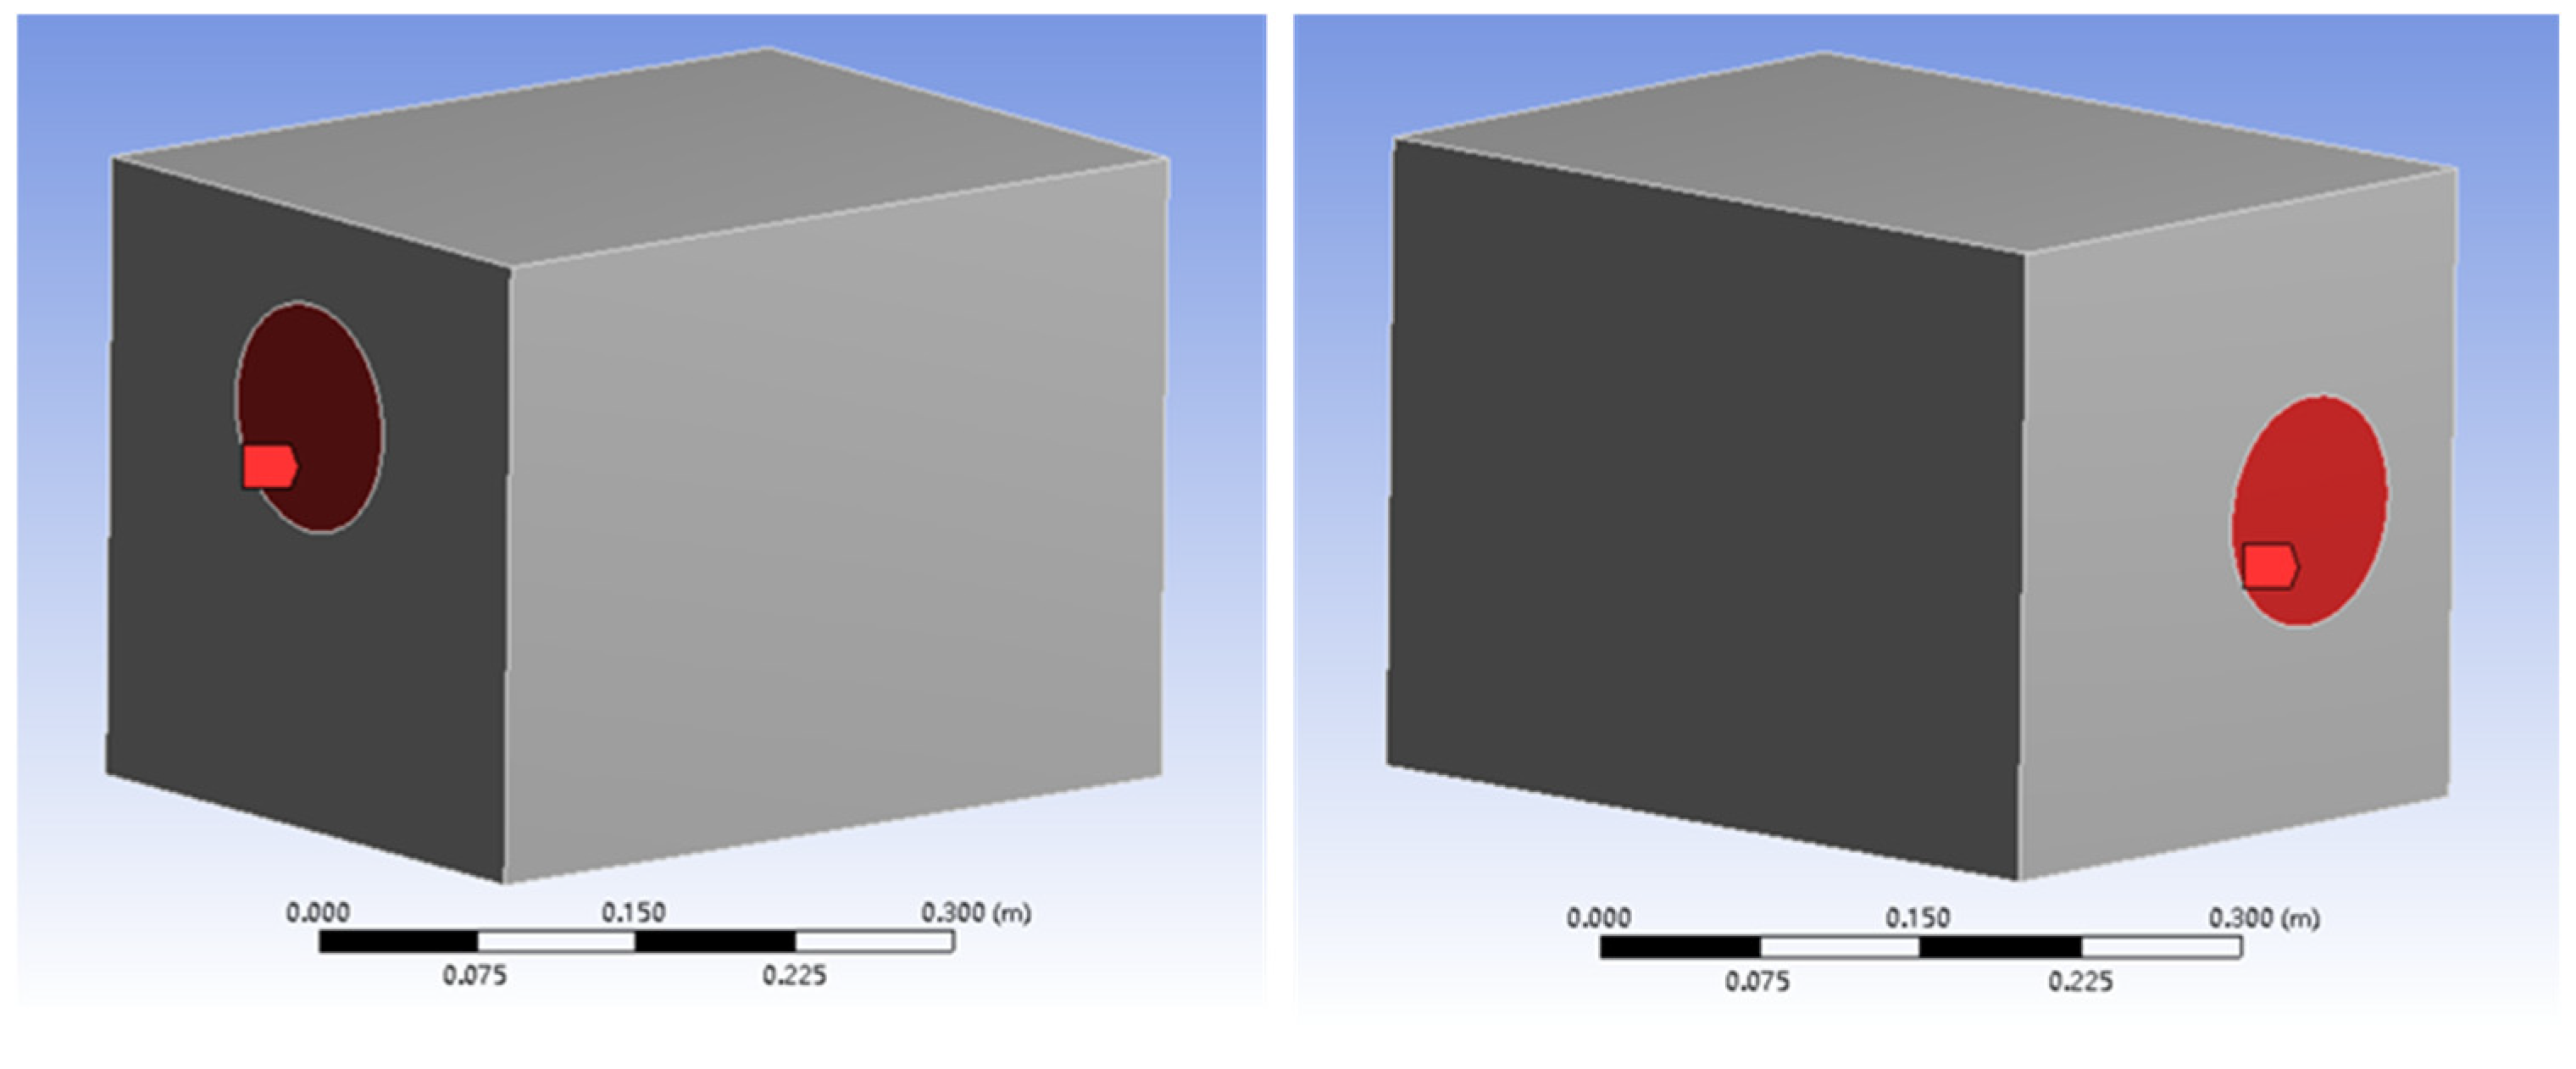
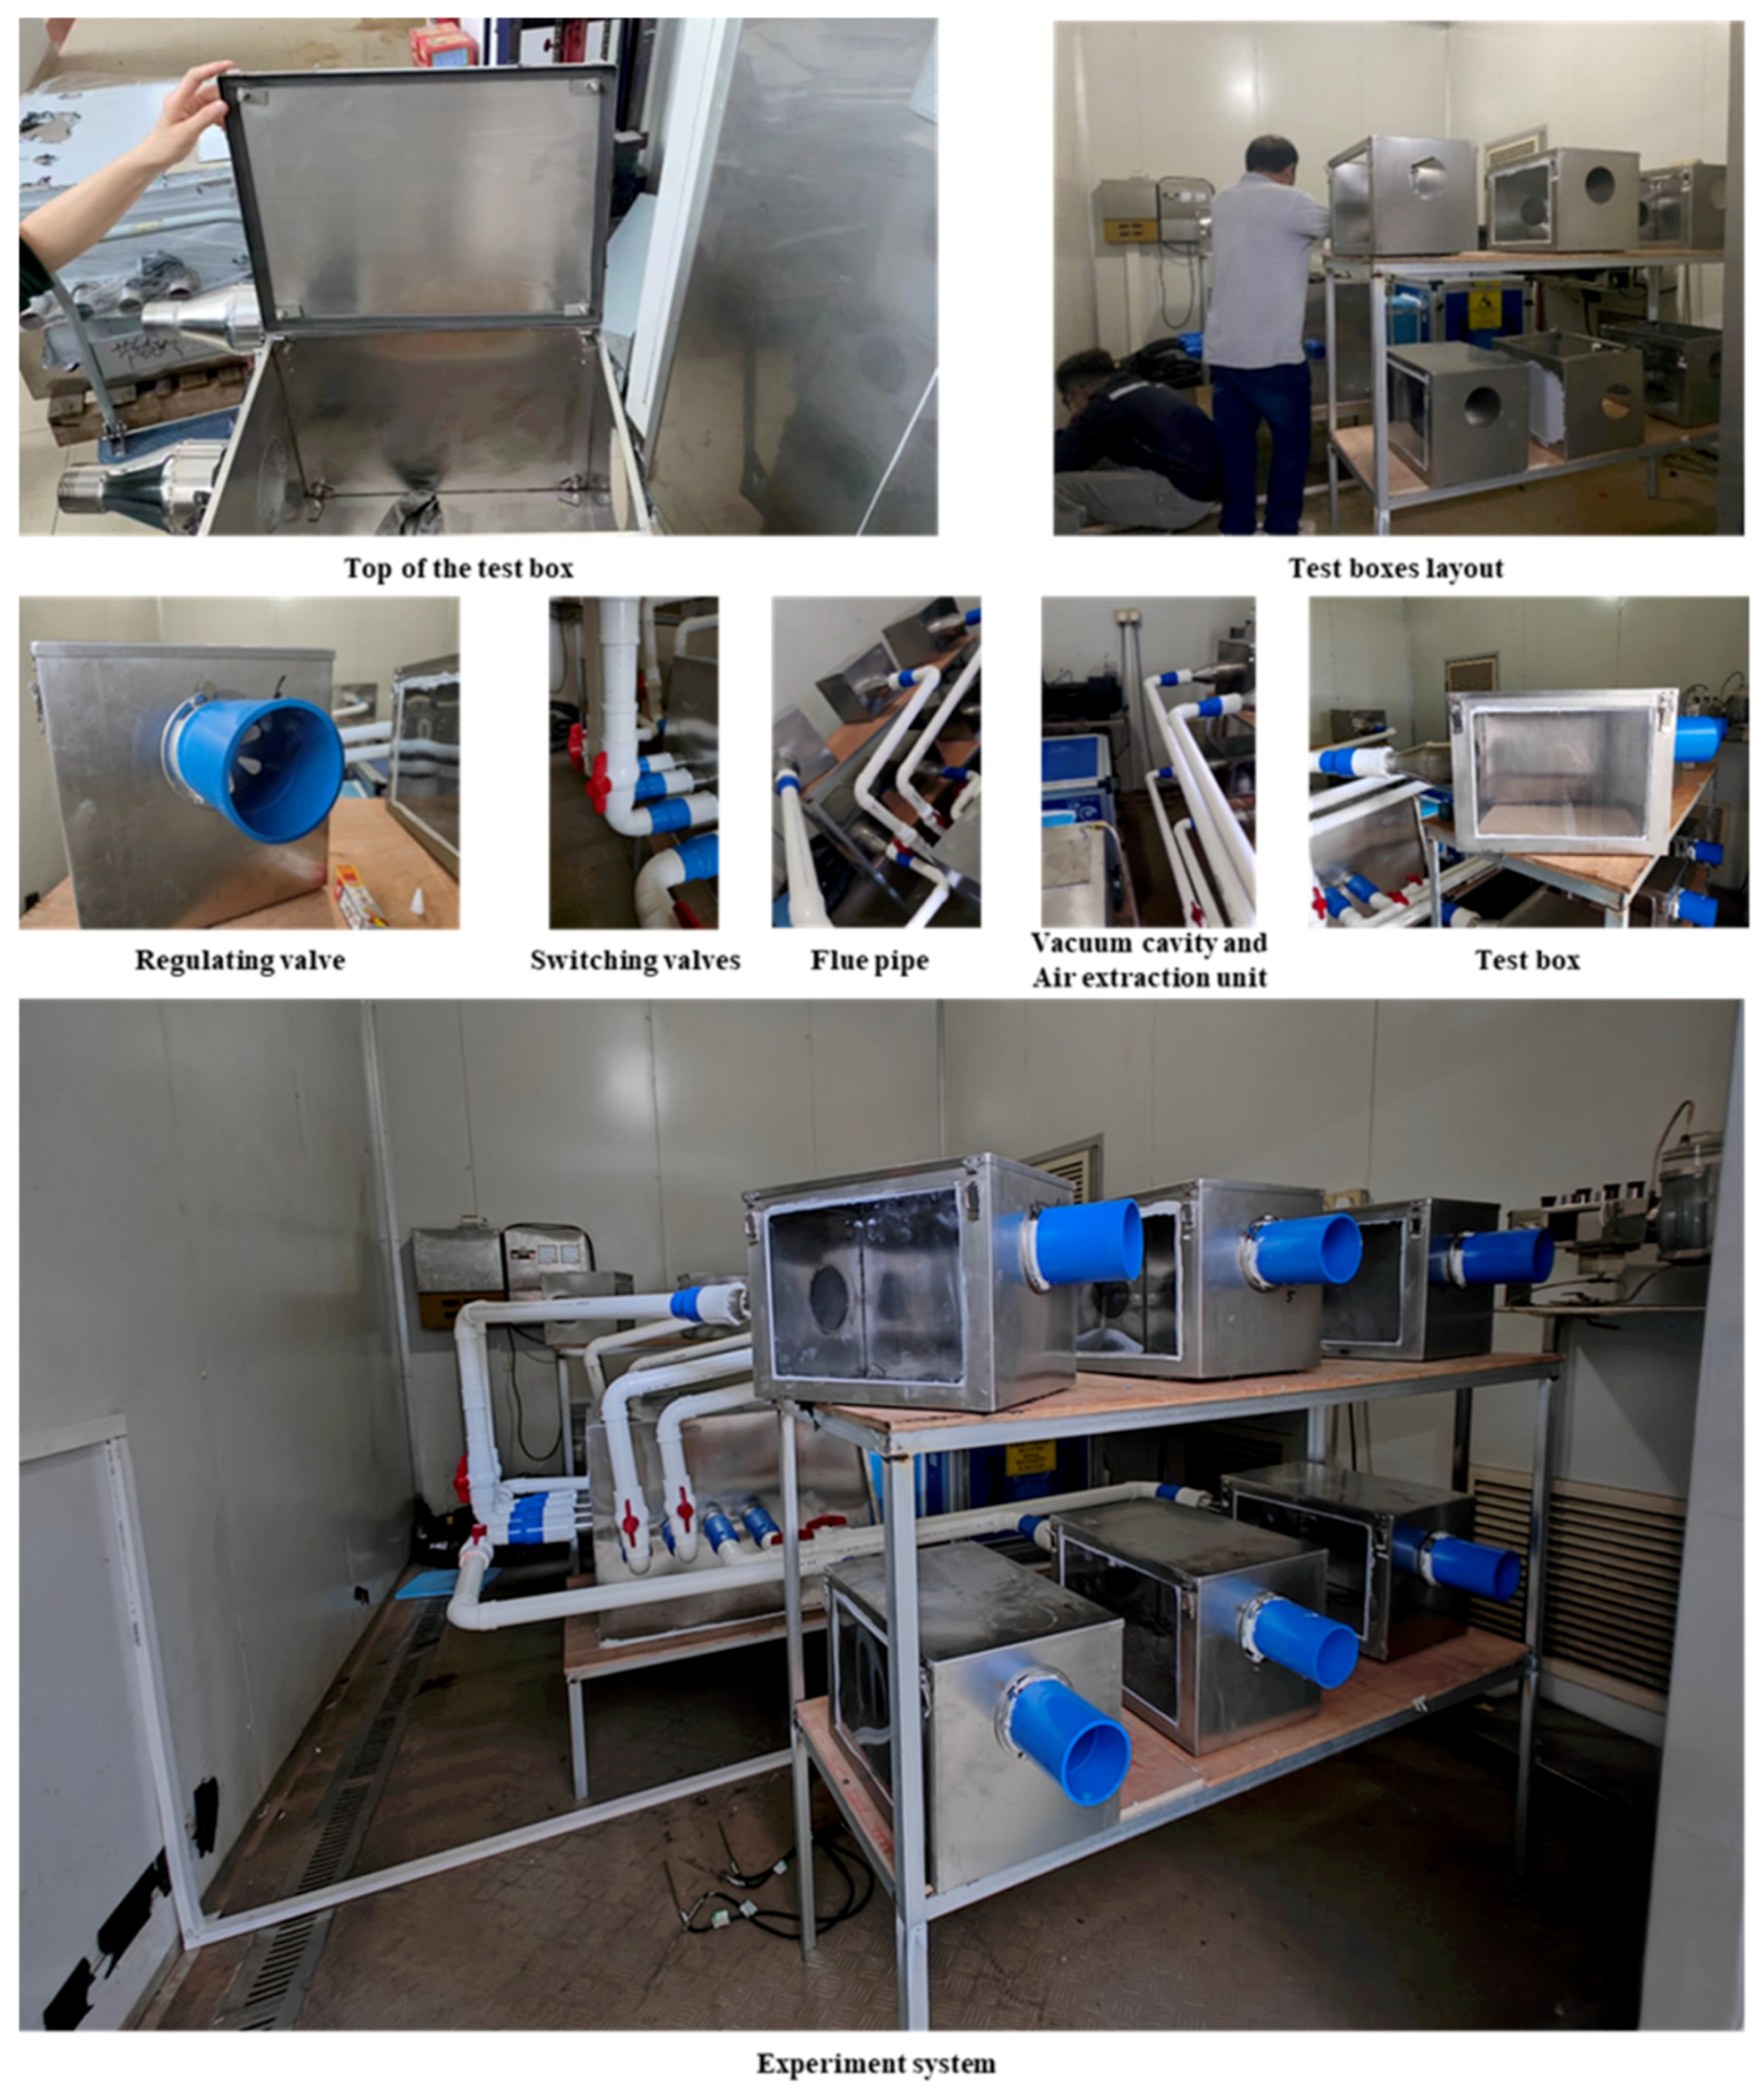
2.2. Test Box Design
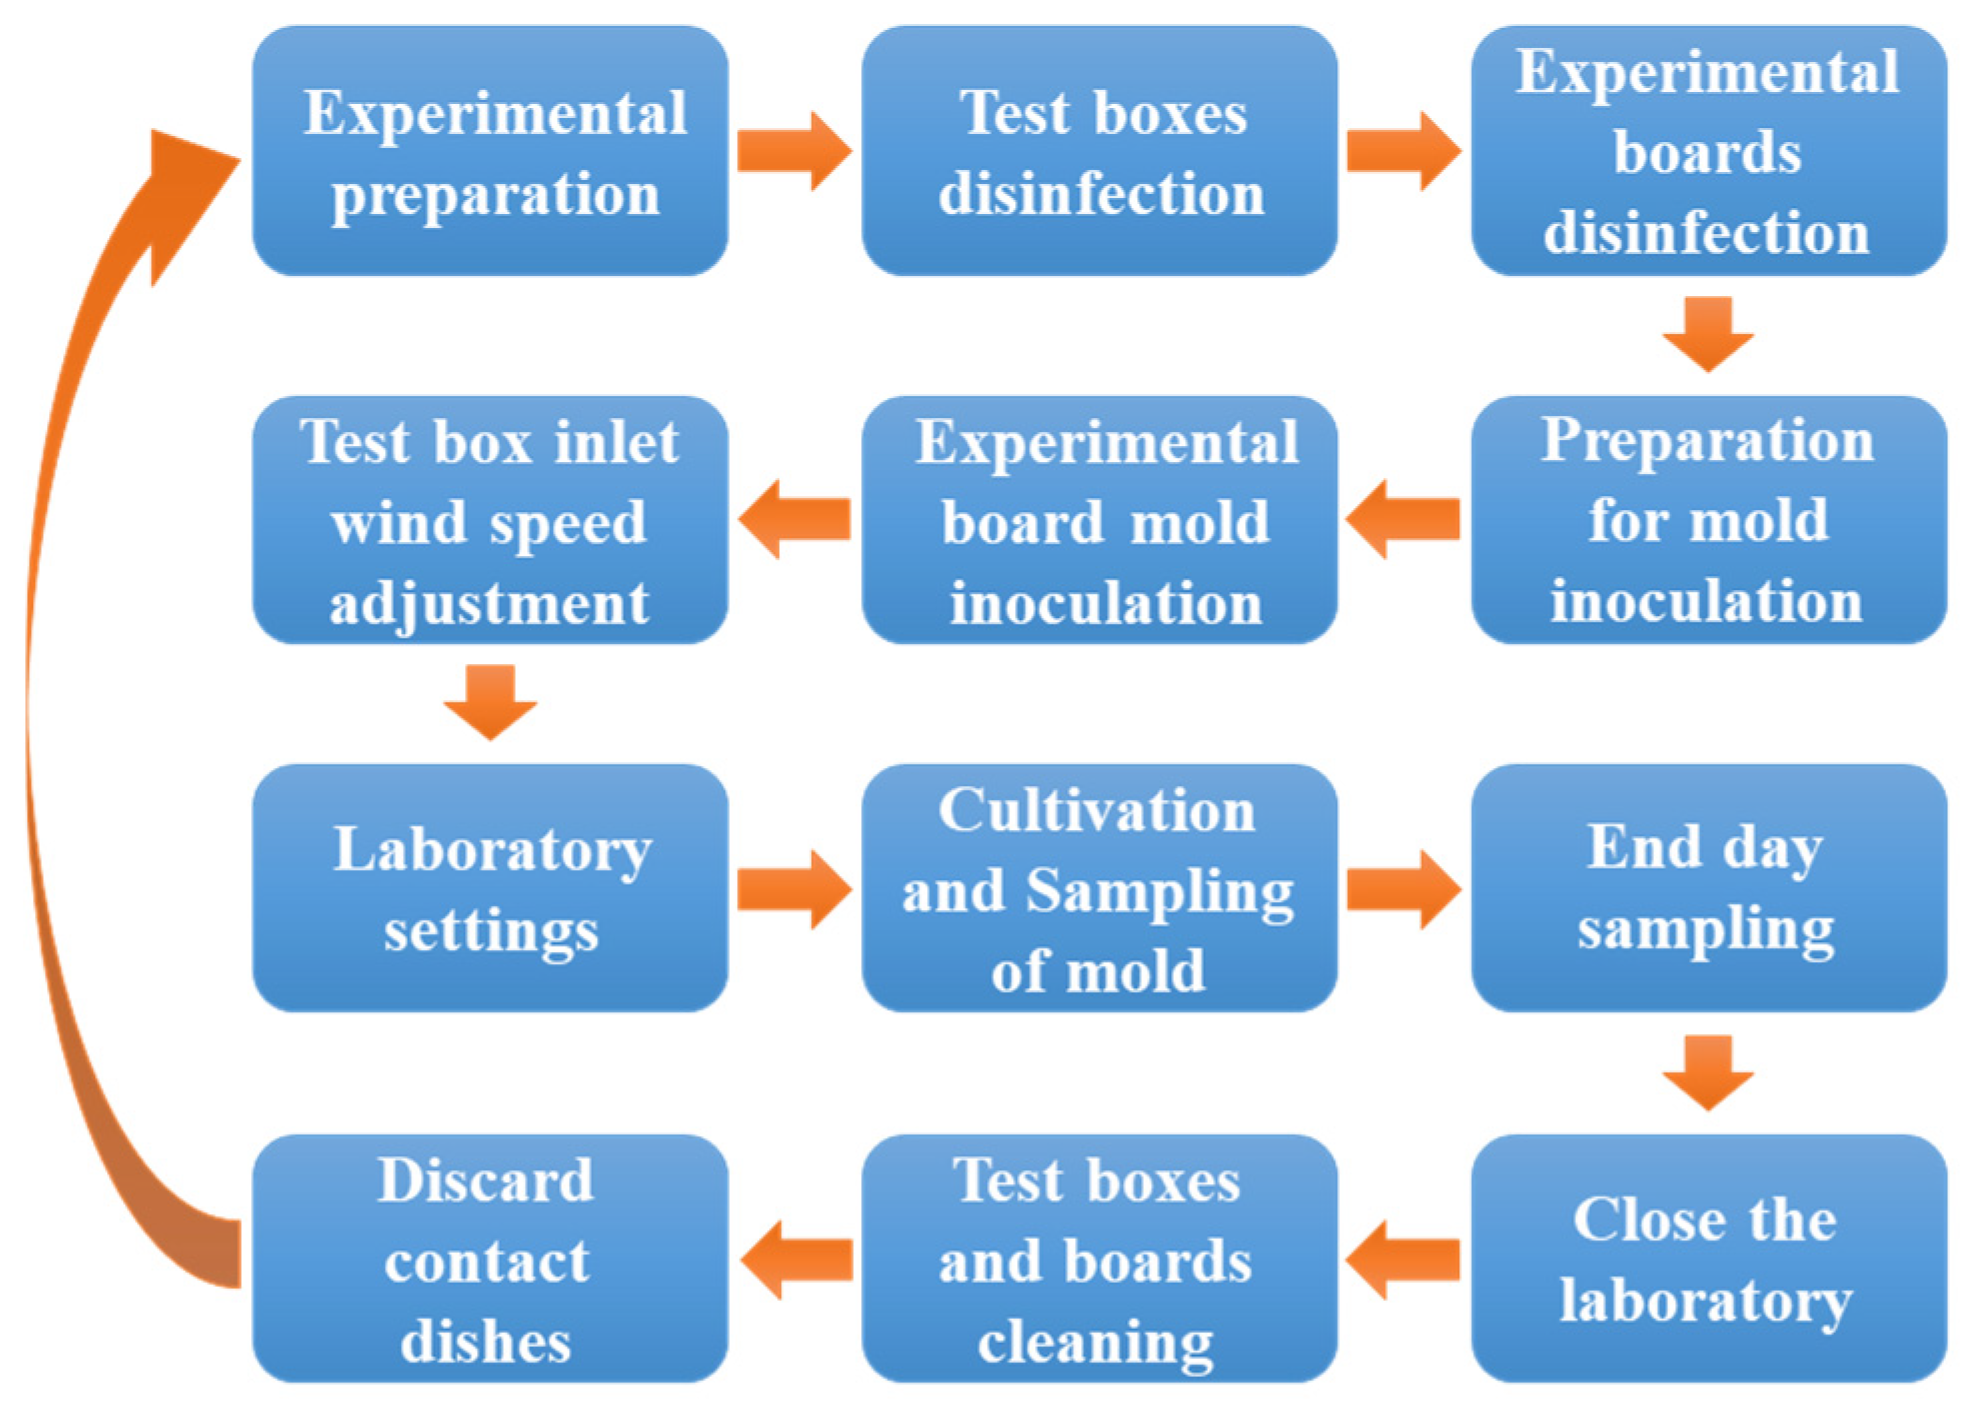
2.3. Methodology for Mold Growth Experiments
- A.
- Preparation for demonstration experiment:
- B.
- Disinfection of test box:
- C.
- Test board disinfection:
- D.
- Preparation of Aspergillus niger and SDB mixture:
- E.
- Building board mold inoculation:
- F.
- Adjustment of wind speed at the inlet of the test box:
- G.
- Laboratory temperature and humidity settings:
- H.
- Sampling and cultivation of mold on building panels:
- I.
- End day sampling:
- J.
- Close the laboratory:
- K.
- Cleaning of test boxes and test plates:
- L.
- Discard contact dishes after use:
- M.
- Cultivate colony count analysis and draw experimental result charts.
3. Experiment and Result
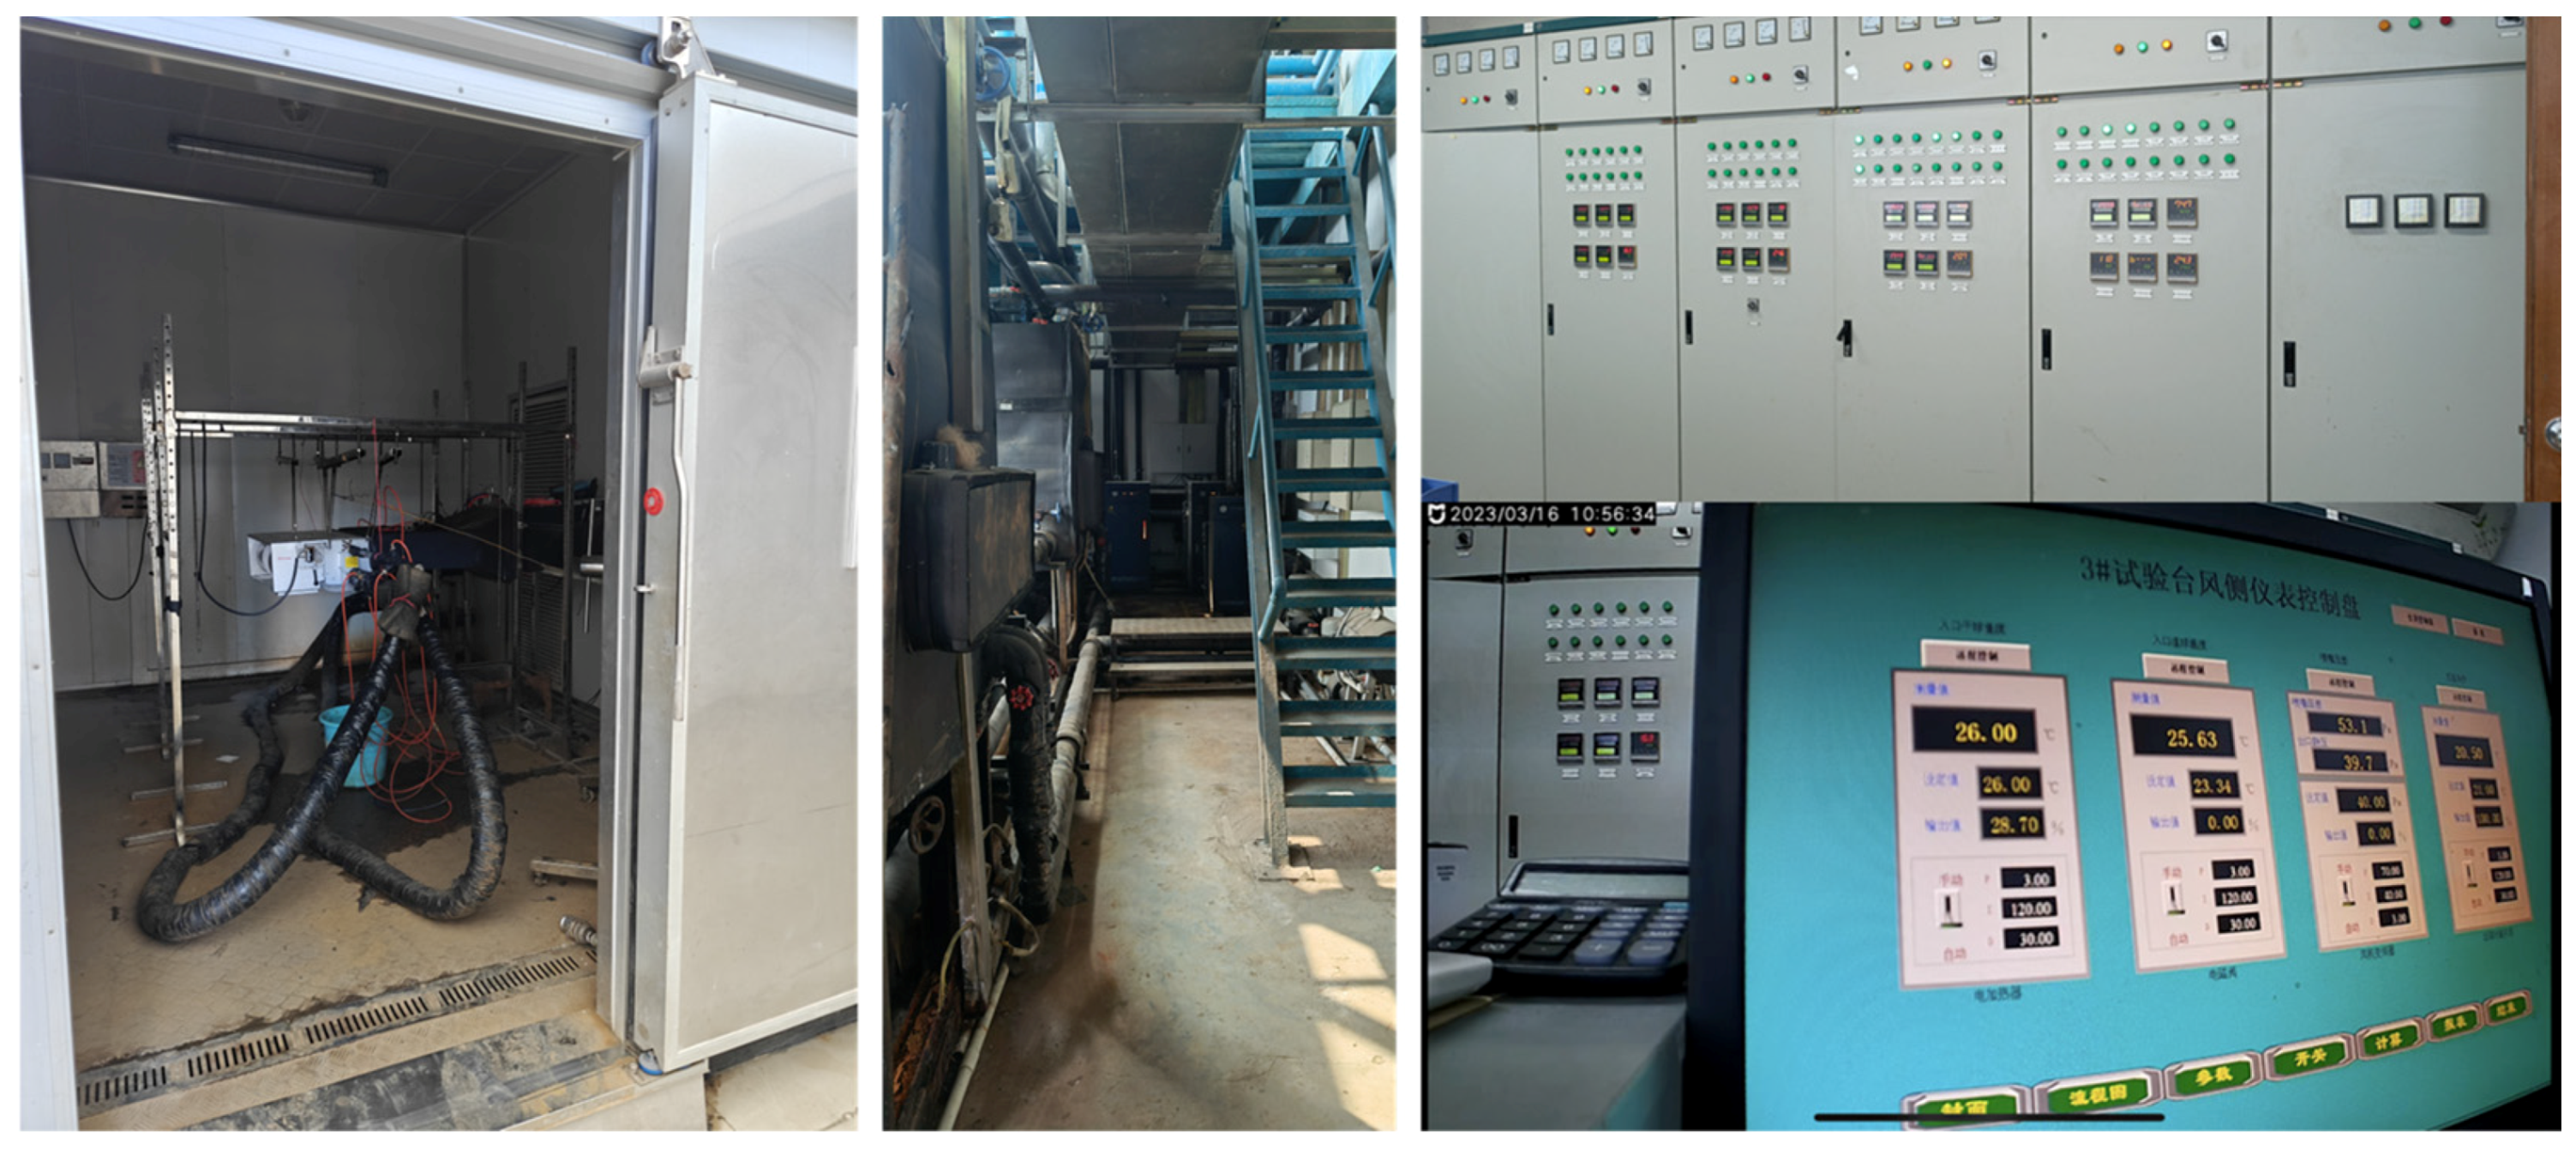
3.1. Experimental Platform Construction
3.2. Installation and Debugging of Test Box
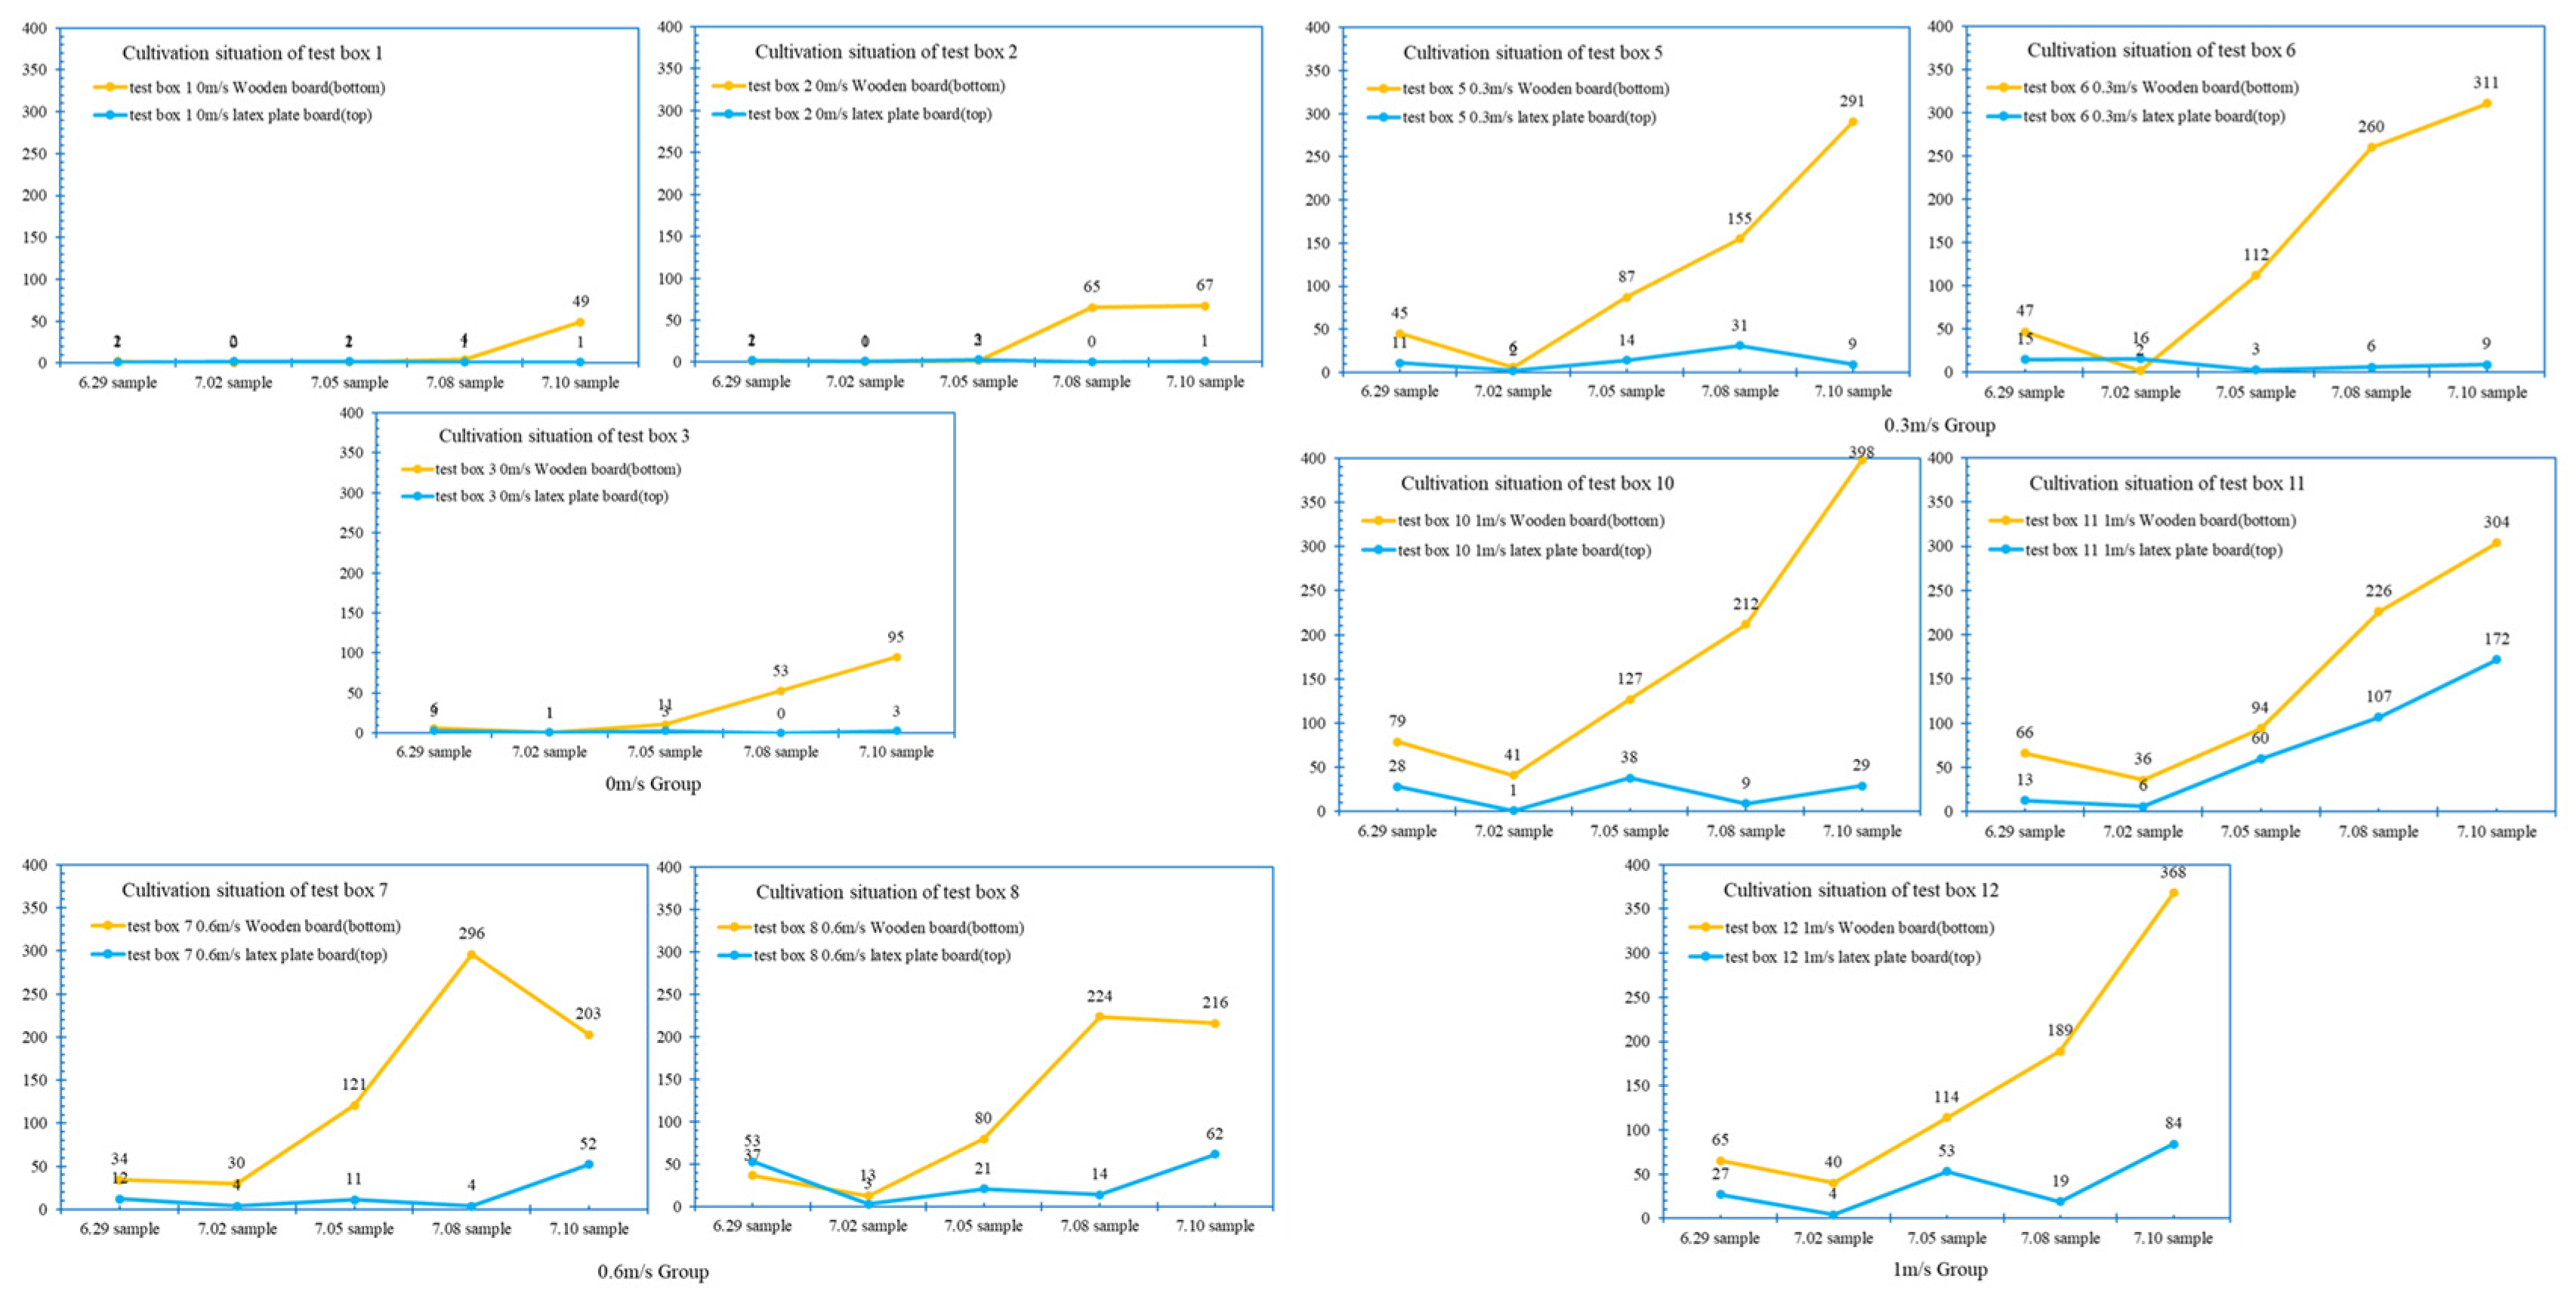
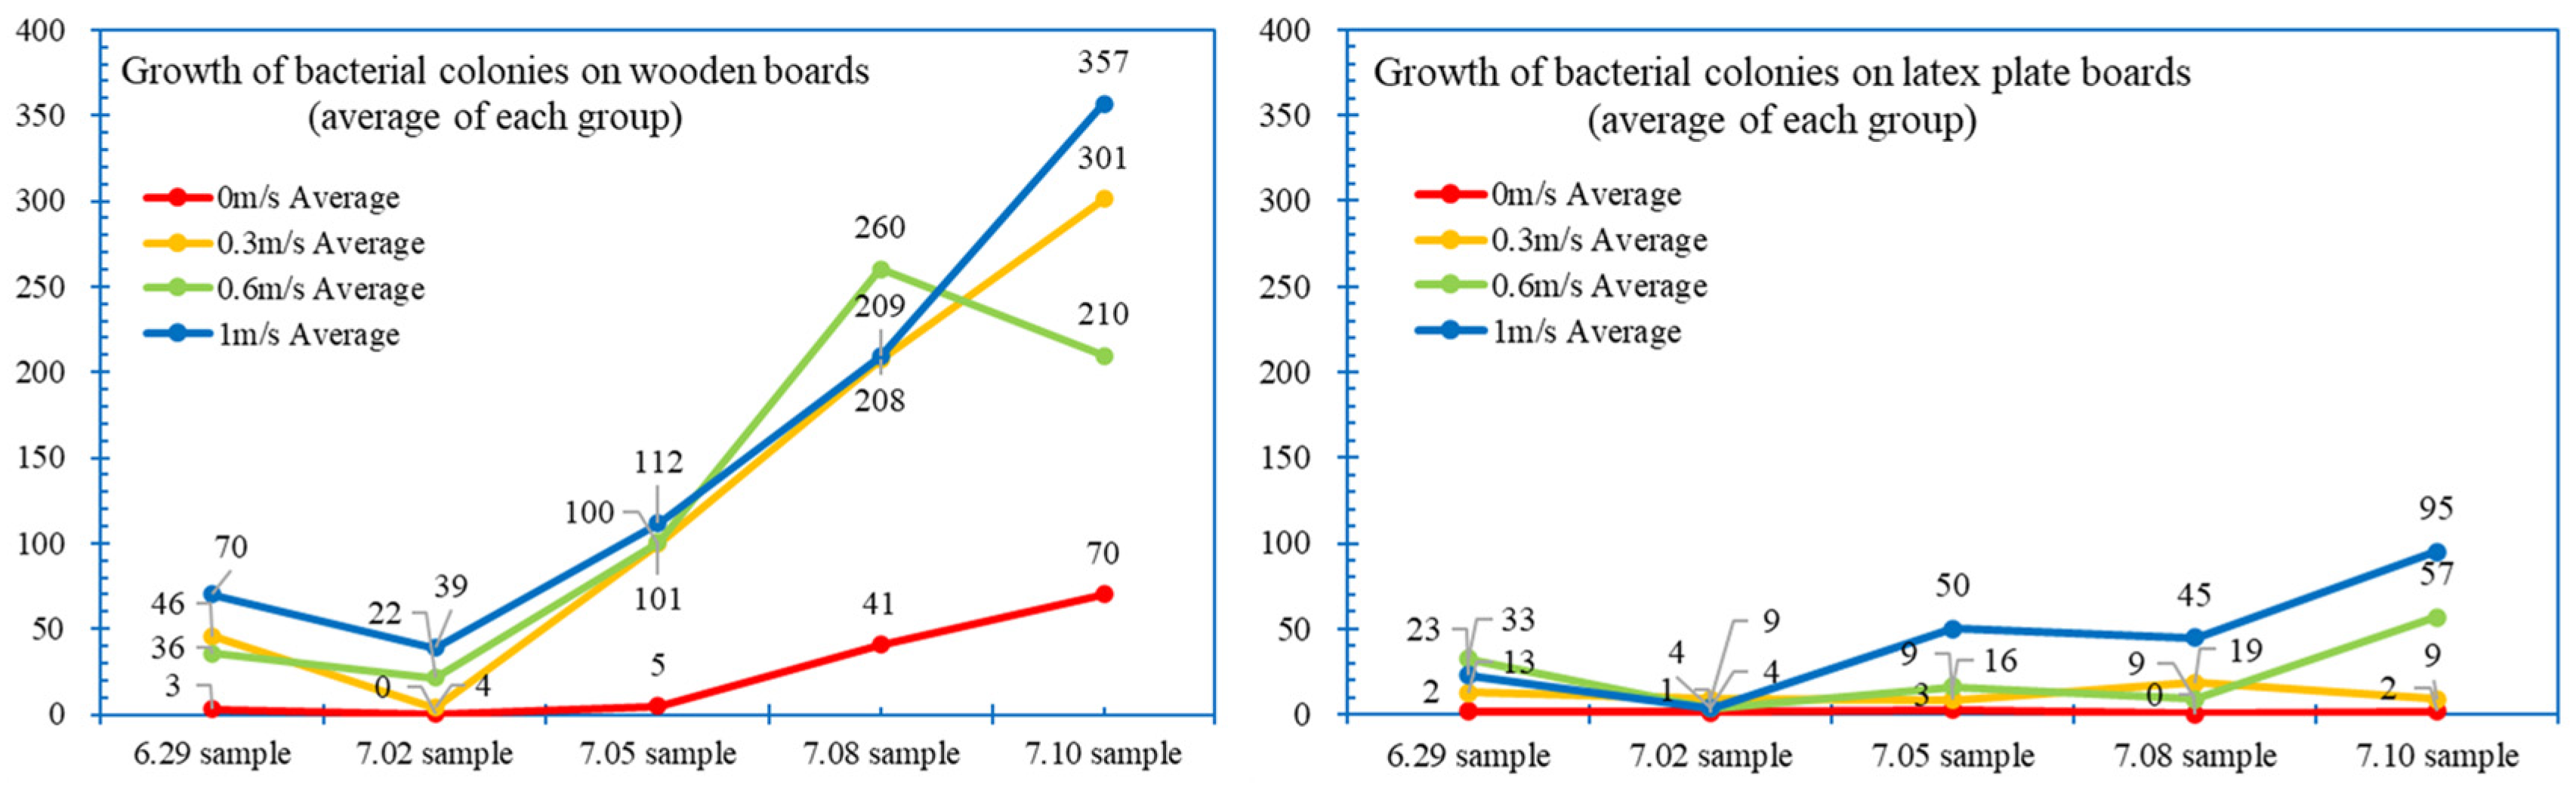
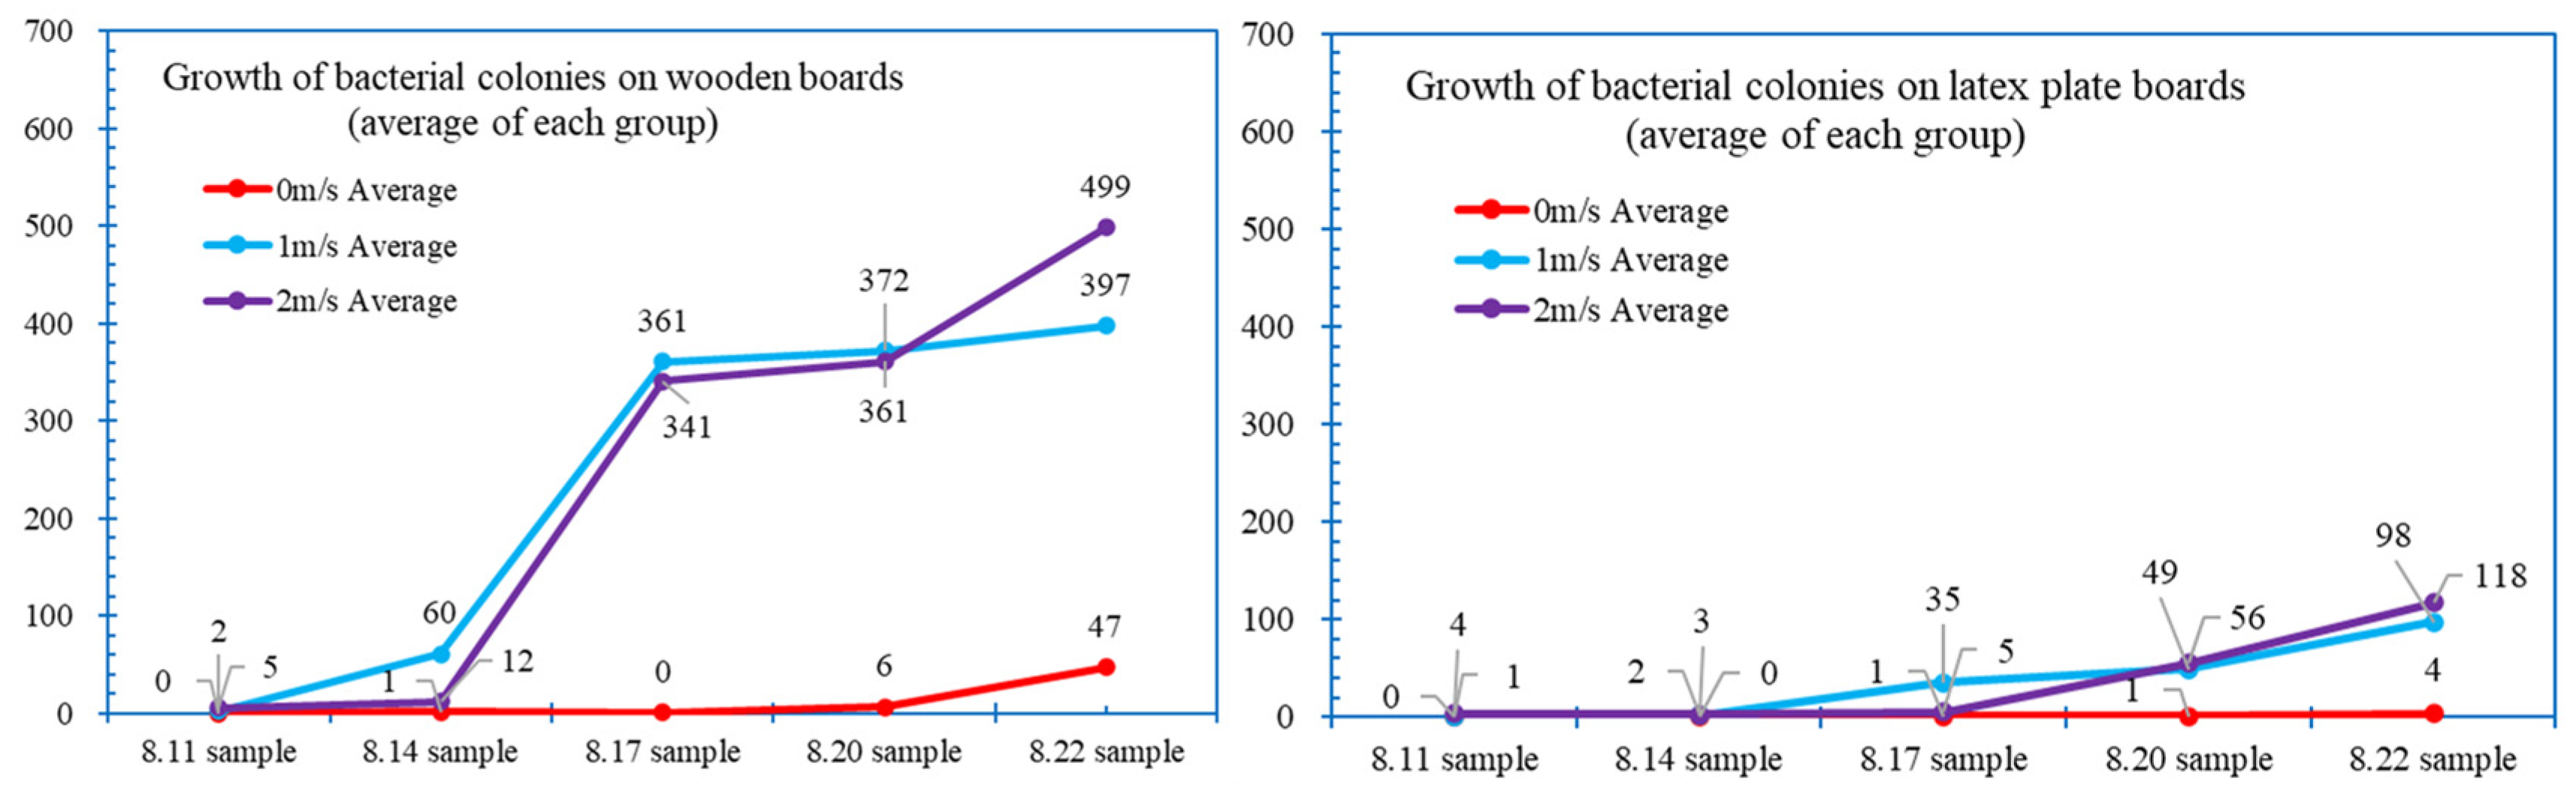
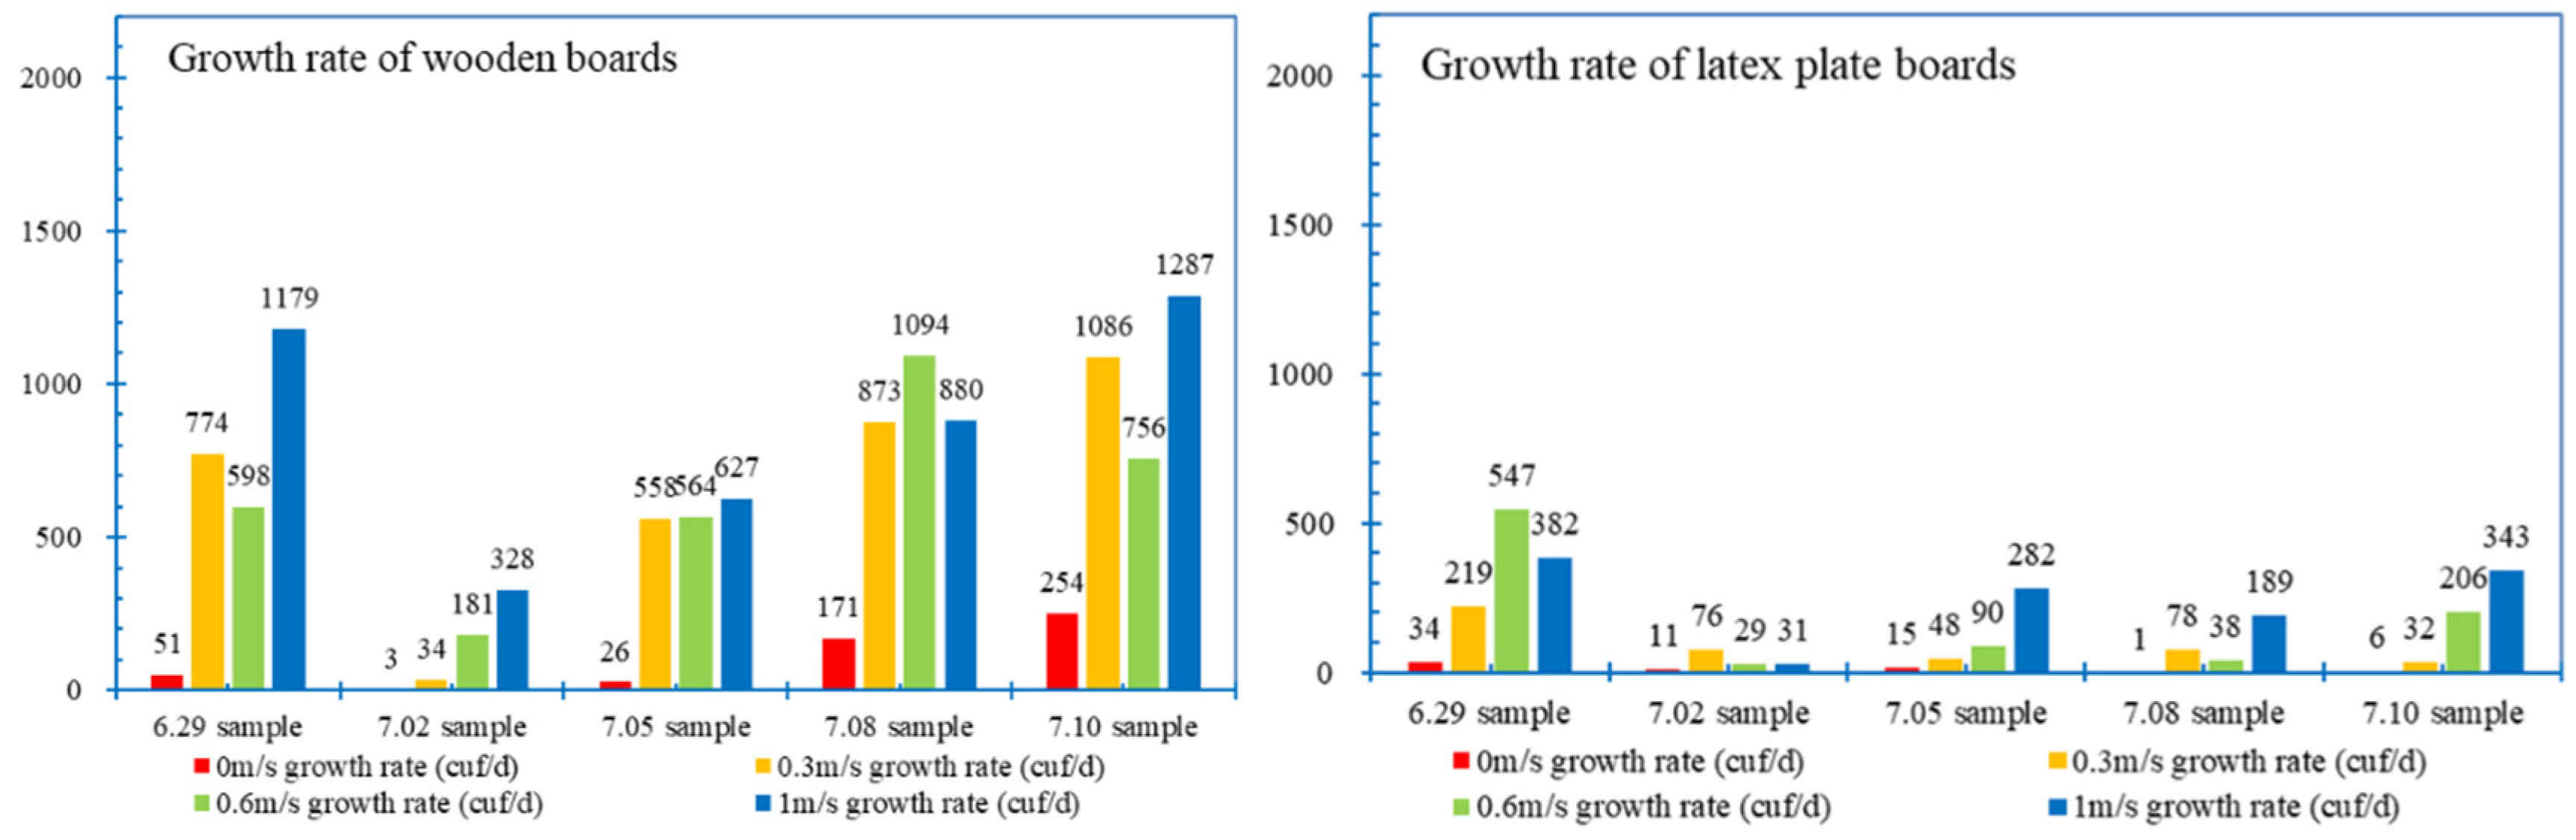
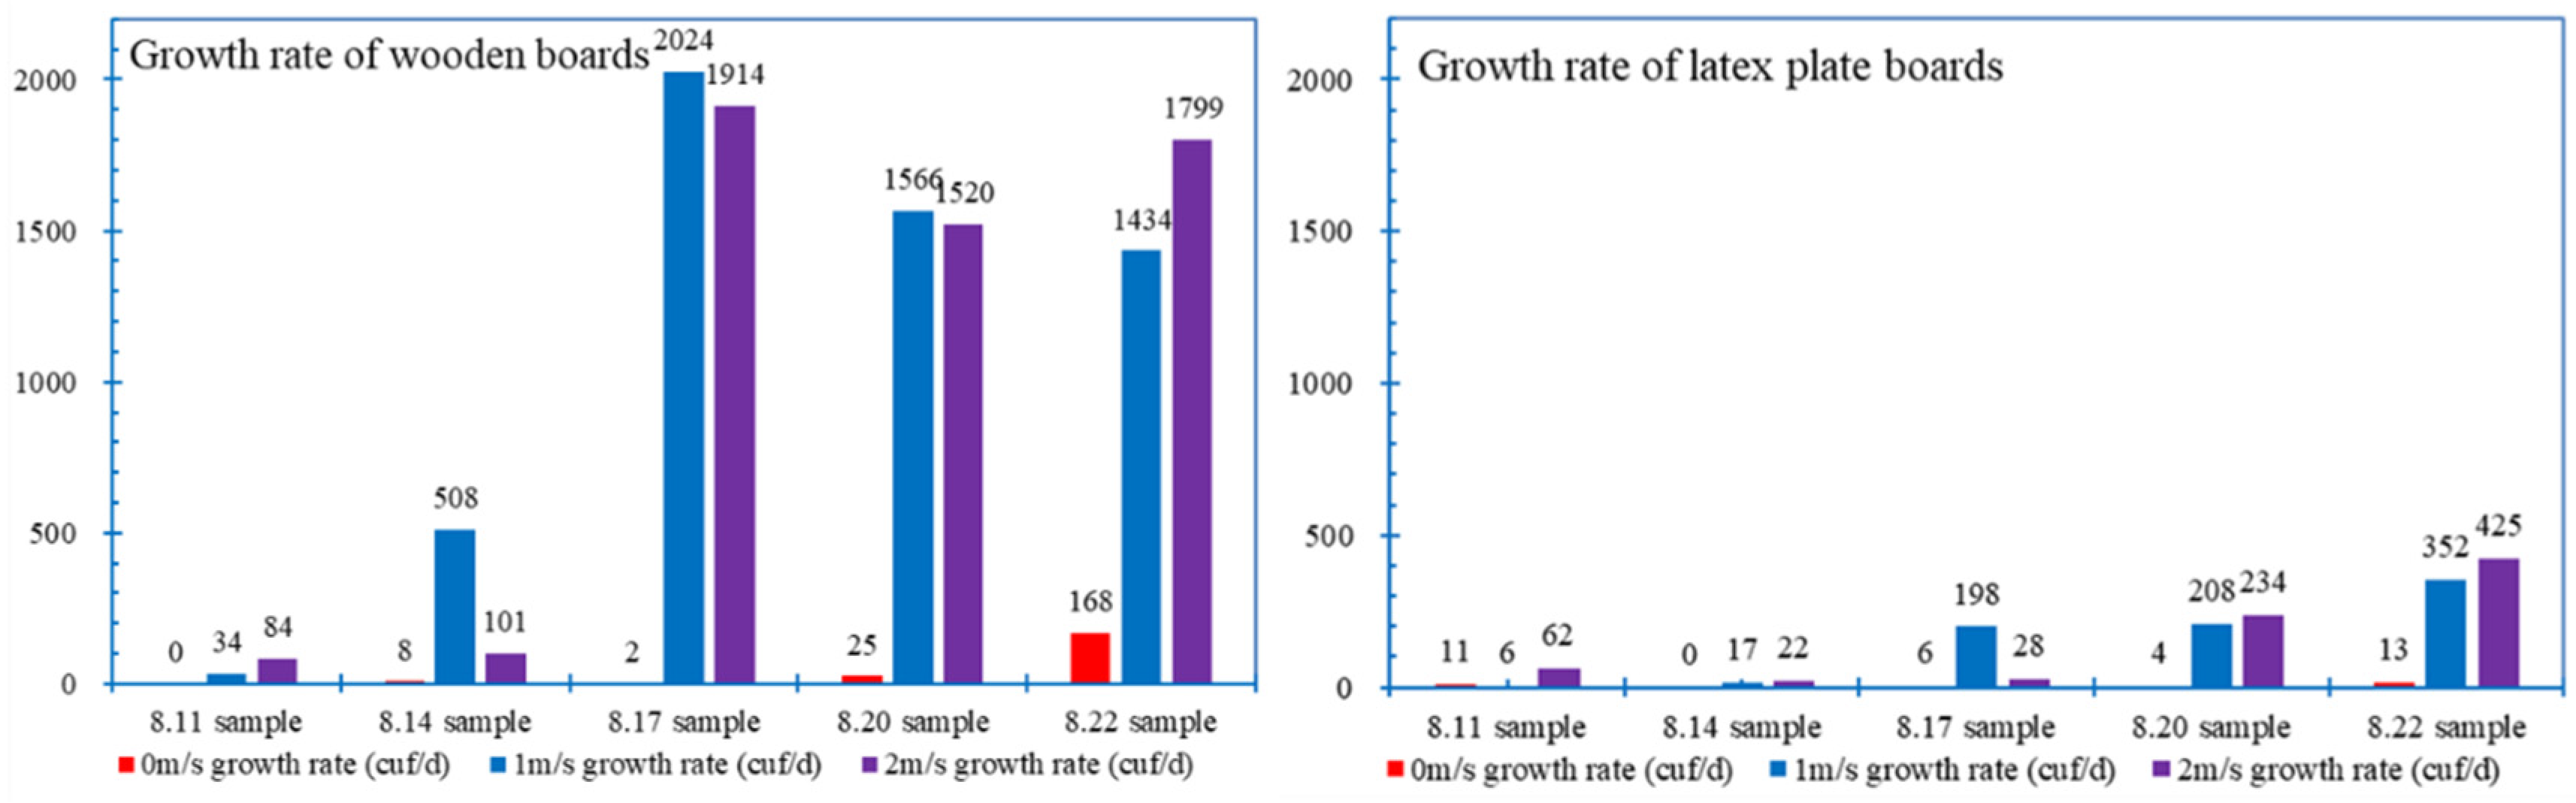
3.3. Test Box Mold Growth Experiment
4. Discussion
5. Conclusions
Author Contributions
Funding
Data Availability Statement
Conflicts of Interest
References
- Van Rooyen, C.; Sharpe, T. Ventilation provision and use in homes in Great Britain: A national survey. Build. Environ. 2024, 257, 111528. [Google Scholar] [CrossRef]
- Wu, H.; Wong, J. Current challenges for shaping the sustainable and mold-free hygienic indoor environment in humid regions. Lett. Appl. Microbiol. 2020, 70, 396–406. [Google Scholar] [CrossRef] [PubMed]
- Cheng, A.; Hsin, Y.; Lin, W.-T. Effects of mold growth on building materials by different environments in Taiwan. KSCE J. Civ. Eng. 2014, 18, 1083–1090. [Google Scholar] [CrossRef]
- Hardin, B.D.; Kelman, B.J.; Saxon, A. Adverse human health effects associated with molds in the indoor environment. J. Occup. Environ. Med. 2003, 45, 470–478. [Google Scholar] [PubMed]
- Adan, O.C.; Samson, R.A. Fundamentals of Mold Growth in Indoor Environments and Strategies for Healthy Living; Wageningen Academic Publishers: Wageningen, The Netherlands, 2011. [Google Scholar]
- Johansson, P.; Svensson, T.; Ekstrand-Tobin, A. Validation of critical moisture conditions for mould growth on building materials. Build. Environ. 2013, 62, 201–209. [Google Scholar] [CrossRef]
- Worster, M.S. Mold Prevention: Limiting Your Exposure. Forensic Engineering; American Society of Civil Engineers: Reston, VA, USA, 2003; pp. 55–60. [Google Scholar]
- Chen, W.J.; Claridge, D.E.; Rohrs, C.; Liao, J. Modeling to predict positive pressurization required to control mold growth from infiltration in buildings in a hot and humid climate. Build. Environ. 2016, 104, 102–113. [Google Scholar] [CrossRef]
- Alaidroos, A.; Mosly, I. Preventing mold growth and maintaining acceptable indoor air quality for educational buildings operating with high mechanical ventilation rates in hot and humid climates. Air Qual. Atmos. Health 2023, 16, 341–361. [Google Scholar] [CrossRef]
- Inal, A.; Karakoc, G.B.; Altintas, D.U.; Guvenmez, H.K.; Aka, Y.; Gelisken, R.; Yilmaz, M.; Kendirli, S.G. Effect of indoor mold concentrations on daily symptom severity of children with asthma and/or rhinitis monosensitized to molds. J. Asthma 2007, 44, 543–546. [Google Scholar] [CrossRef] [PubMed]
- Pert, A. A Literature Analysis on Stachybotrys chartarum and Connections to Sick Building Syndrome. West. Undergrad. Res. J. Health Nat. Sci. 2022, 12, 1–11. [Google Scholar] [CrossRef]
- Chen, Y.; Li, M.; Lu, J.; Chen, B. Influence of residential indoor environment on quality of life in China. Build. Environ. 2023, 232, 110068. [Google Scholar] [CrossRef]
- Hurrass, J.; Heinzow, B.; Aurbach, U.; Bergmann, K.-C.; Bufe, A.; Buzina, W.; Cornely, O.A.; Engelhart, S.; Fischer, G.; Gabrio, T. Medical diagnostics for indoor mold exposure. Int. J. Hyg. Environ. Health 2017, 220, 305–328. [Google Scholar] [CrossRef] [PubMed]
- Curtis, L.; Lieberman, A.; Stark, M.; Rea, W.; Vetter, M. Adverse health effects of indoor molds. J. Nutr. Environ. Med. 2004, 14, 261–274. [Google Scholar] [CrossRef]
- Small, B.M. Creating mold-free buildings: A key to avoiding health effects of indoor molds. Arch. Environ. Health Int. J. 2003, 58, 523–527. [Google Scholar] [CrossRef] [PubMed]
- Wang, Y.-H.; Wang, Y.-C.; Wu, P.-H.; Hsu, L.; Wang, C.-Y.; Jan, C.-R.; Su, H.-H. A cross-sectional study into the correlation of common household risk factors and allergic rhinitis in Taiwan’s tropical environment. Asian Pac. J. Trop. Med. 2017, 10, 134–140. [Google Scholar] [CrossRef]
- Caillaud, D.; Leynaert, B.; Keirsbulck, M.; Nadif, R. Indoor mould exposure, asthma and rhinitis: Findings from systematic reviews and recent longitudinal studies. Eur. Respir. Rev. 2018, 27, 170137. [Google Scholar] [CrossRef]
- Wang, J.; Zhao, Z.; Zhang, Y.; Li, B.; Huang, C.; Zhang, X.; Deng, Q.; Lu, C.; Qian, H.; Yang, X. Asthma, allergic rhinitis and eczema among parents of preschool children in relation to climate, and dampness and mold in dwellings in China. Environ. Int. 2019, 130, 104910. [Google Scholar] [CrossRef] [PubMed]
- Rylander, R.; Etzel, R. Introduction and summary: Workshop on children’s health and indoor mold exposure. Environ. Health Perspect. 1999, 107, 465–468. [Google Scholar] [CrossRef] [PubMed]
- Haas, D.; Habib, J.; Galler, H.; Buzina, W.; Schlacher, R.; Marth, E.; Reinthaler, F. Assessment of indoor air in Austrian apartments with and without visible mold growth. Atmos. Environ. 2007, 41, 5192–5201. [Google Scholar] [CrossRef]
- Wu, Z.; Zhang, S.; Tang, Y.; Jiang, W.; Jiang, H.; Xie, Z.; Zhang, B. Indoor environment in relation to recurrent childhood pneumonia in Southern China. Build. Environ. 2020, 172, 106727. [Google Scholar] [CrossRef]
- Lu, C.; Xiao, F.; Norbäck, D.; Yang, X.; Zhang, Y.; Li, B.; Zhao, Z.; Huang, C.; Zhang, X.; Qian, H. Long-term exposure to mould/damp stains and mouldy odour increases low birth weight. Build. Environ. 2022, 222, 109418. [Google Scholar] [CrossRef]
- Johanning, E. Indoor moisture and mold-related health problems. Eur. Ann. Allergy Clin. Immunol. 2004, 36, 182–185. [Google Scholar] [PubMed]
- Burr, M.L. Health effects of indoor molds. Rev. Environ. Health 2001, 16, 97–104. [Google Scholar] [CrossRef] [PubMed]
- Zhang, X.; Liang, J.; Wang, B.; Lv, Y.; Xie, J. Indoor air design parameters of air conditioners for mold-prevention and antibacterial in island residential buildings. Int. J. Environ. Res. Public Health 2020, 17, 7316. [Google Scholar] [CrossRef] [PubMed]
- Wu, H.; Wong, J.W.C. Temperature versus relative humidity: Which is more important for indoor mold prevention? J. Fungi 2022, 8, 696. [Google Scholar] [CrossRef] [PubMed]
- Abe, K. Assessment of home environments with a fungal index using hydrophilic and xerophilic fungi as biologic sensors. Indoor Air 2012, 22, 173–185. [Google Scholar] [CrossRef]
- Kalamees, T.; Korpi, M.; Vinha, J.; Kurnitski, J. The effects of ventilation systems and building fabric on the stability of indoor temperature and humidity in Finnish detached houses. Build. Environ. 2009, 44, 1643–1650. [Google Scholar] [CrossRef]
- Saijo, Y.; Sata, F.; Mizuno, S.; Yamaguchi, K.; Sunagawa, H.; Kishi, R. Indoor airborne mold spores in newly built dwellings. Environ. Health Prev. Med. 2005, 10, 157–161. [Google Scholar] [CrossRef] [PubMed]
- Liu, Y.; Considine, B.; McNabola, A. Assessment of hygrothermal performance and mould growth risk in roofs of post-retrofitted non-dormer and dormer attic rooms with reduced ventilation. Build. Environ. 2024, 250, 111172. [Google Scholar] [CrossRef]
- Udawattha, C.; Galkanda, H.; Ariyarathne, I.S.; Jayasinghe, G.; Halwatura, R. Mold growth and moss growth on tropical walls. Build. Environ. 2018, 137, 268–279. [Google Scholar] [CrossRef]
- D’Orazio, M.; Palladini, M.; Aquilanti, L.; Clementi, F. Experimental evaluation of the growth rate of mould on finishes for indoor housing environments: Effects of the 2002/91/EC directive. Build. Environ. 2009, 44, 1668–1674. [Google Scholar] [CrossRef]
- Abe, K.; Murata, T. A prevention strategy against fungal attack for the conservation of cultural assets using a fungal index. Int. Biodeterior. Biodegrad. 2014, 88, 91–96. [Google Scholar] [CrossRef]
- Li, Y.; Dang, X.; Xia, C.; Ma, Y.; Ogura, D.; Hokoi, S. The effect of air leakage through the air cavities of building walls on mold growth risks. Energies 2020, 13, 1177. [Google Scholar] [CrossRef]
- GB 50096-2011; Code for Design of Residential Buildings. China Architecture & Building Press: Beijing, China, 2011.
- ANSYS. Fluent Theory Guide, Chapter 4: Turbulence, 4.3. Standard, RNG, and Realizable K-E Models, 4.3.1. Standard k-epsilon Model. Available online: https://ansyshelp.ansys.com/account/secured?returnurl=/Views/Secured/corp/v190/flu_th/flu_th_sec_turb_ke.html (accessed on 5 July 2024).
- GB 50736-2012; Design Code for Heating Ventilation and Air Conditioning of Civil Buildings. China Architecture & Building Press: Beijing, China, 2012.
- ISO 846; Plastics—Evaluation of the Action of Microorganisms. ISO Copyright Office: Geneva, Switzerland, 2019.
- GB/T 24128-2018; Plastics—Assessment of the Effectiveness of Fungistatic Compounds in Plastics Formulations. State Administration for Market Regulation: Beijing, China, 2018.
- Vornanen-Winqvist, C.; Salonen, H.; Järvi, K.; Andersson, M.A.; Mikkola, R.; Marik, T.; Kredics, L.; Kurnitski, J. Effects of ventilation improvement on measured and perceived indoor air quality in a school building with a hybrid ventilation system. Int. J. Environ. Res. Public Health 2018, 15, 1414. [Google Scholar] [CrossRef] [PubMed]
- Piecuch, A.; Ogórek, R. Quantitative and Qualitative Assessment of Mycological Air Pollution in a Dormitory Bathroom with High Humidity and Fungal Stains on the Ceiling a Case Study. Pol. J. Environ. Stud. 2021, 30, 1955–1960. [Google Scholar] [CrossRef] [PubMed]


| Inlet Wind Speed | Bottom Wind Speed | Back Wind Speed | Top Wind Speed |
|---|---|---|---|
| 0.5 m/s | 0.31 m/s | 0.27 m/s | 0.17 m/s |
| 1 m/s | 0.55 m/s | 0.54 m/s | 0.28 m/s |
| 1.5 m/s | 0.91 m/s | 0.85 m/s | 0.39 m/s |
| 2 m/s | 1.19 m/s | 1.12 m/s | 0.65 m/s |
| 2.5 m/s | 1.52 m/s | 1.40 m/s | 0.80 m/s |
| 3 m/s | 1.65 m/s | 1.68 m/s | 0.92 m/s |
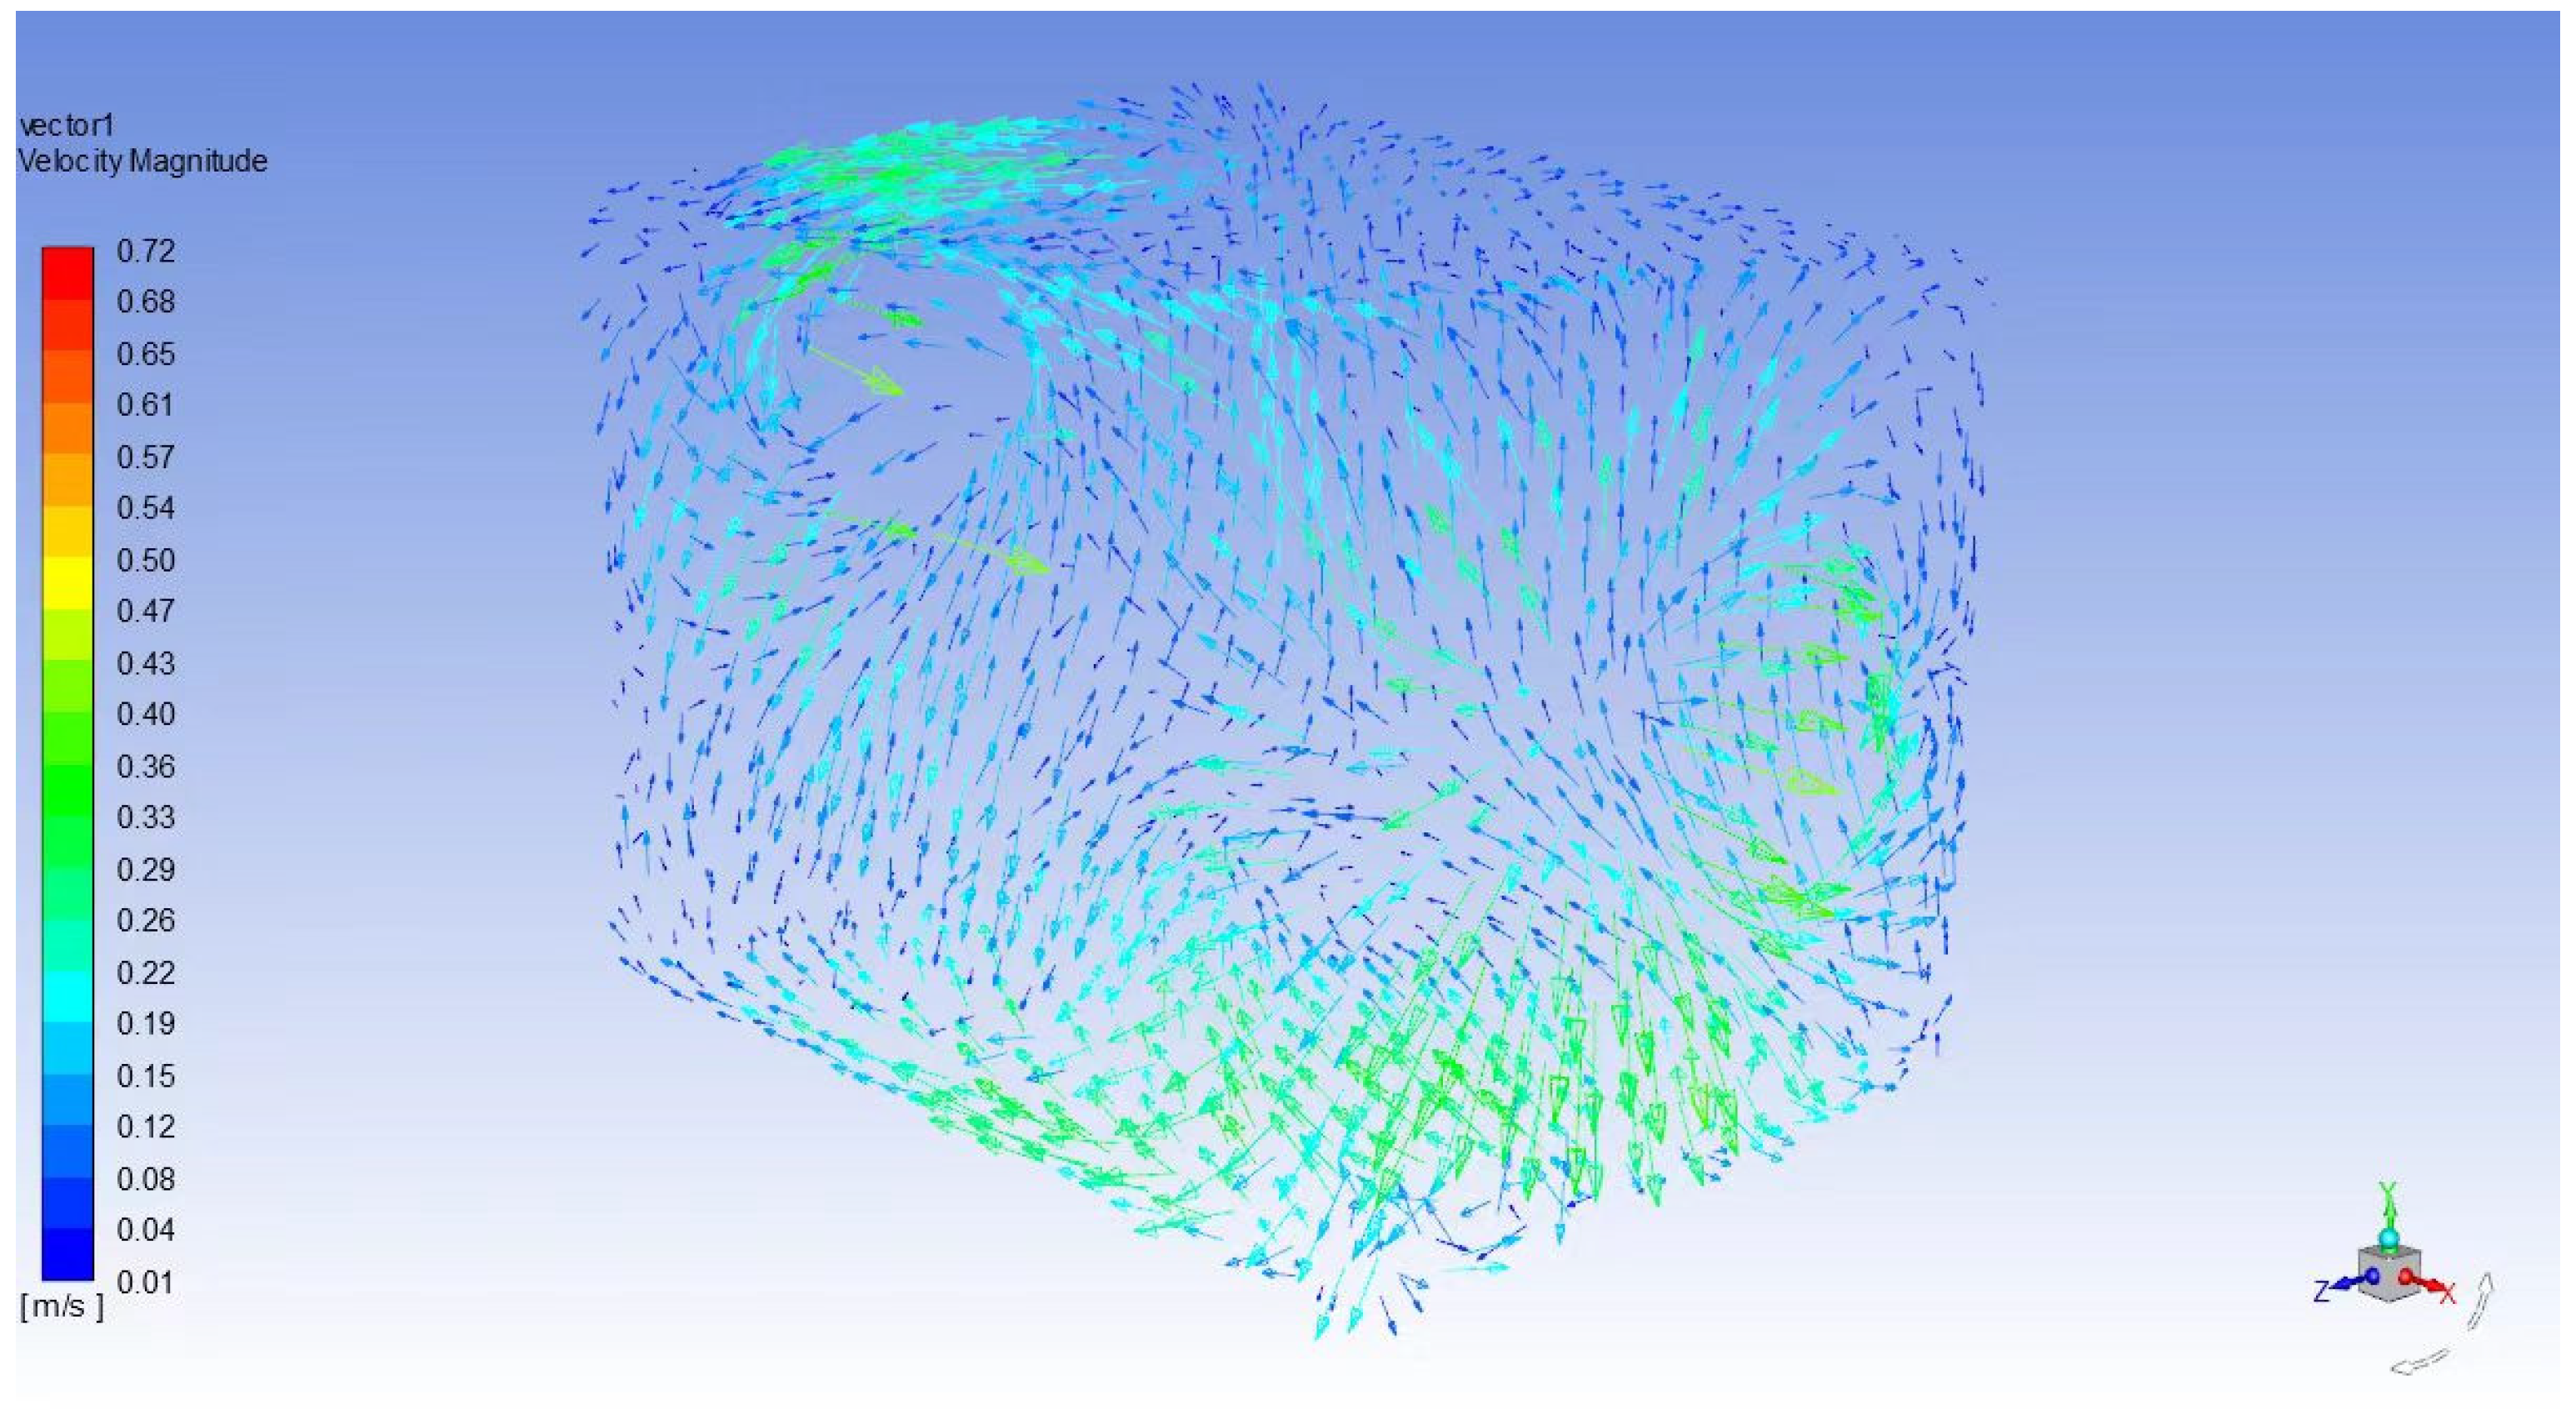
| Object | Inlet Wind Speed (m/s) | Bottom Wind Speed (m/s) | Back Wind Speed (m/s) | Top Wind Speed (m/s) |
|---|---|---|---|---|
| Simulate room | 0.5 | 0.31 | 0.27 | 0.17 |
| Test box | 0.26 | 0.20 | 0.16 | |
| Simulate room | 1 | 0.55 | 0.54 | 0.28 |
| Test box | 0.53 | 0.47 | 0.27 | |
| Simulate room | 1.5 | 0.91 | 0.85 | 0.39 |
| Test box | 0.81 | 0.82 | 0.38 | |
| Simulate room | 2 | 1.19 | 1.12 | 0.65 |
| Test box | 1.10 | 1.05 | 0.55 | |
| Simulate room | 2.5 | 1.52 | 1.40 | 0.80 |
| Test box | 1.42 | 1.45 | 0.71 | |
| Simulate room | 3 | 1.65 | 1.68 | 0.92 |
| Test box | 1.51 | 1.65 | 0.85 |
| Wind Speed | Radius of Outlet | Area of Outlet | Rate of Flow | |||
|---|---|---|---|---|---|---|
| m/s | m | m2 | m³/s | m³/min | m³/h | L/min |
| 0.1 | 0.055 | 0.0094985 | 0.00095 | 0.06 | 3.42 | 56.99 |
| 1 | 0.00950 | 0.57 | 34.19 | 569.91 | ||
| 1.5 | 0.01425 | 0.85 | 51.29 | 854.87 | ||
| 2 | 0.01900 | 1.14 | 68.39 | 1139.82 | ||
| 2.5 | 0.02375 | 1.42 | 85.49 | 1424.78 | ||
| 3 | 0.02850 | 1.71 | 102.58 | 1709.73 | ||
Disclaimer/Publisher’s Note: The statements, opinions and data contained in all publications are solely those of the individual author(s) and contributor(s) and not of MDPI and/or the editor(s). MDPI and/or the editor(s) disclaim responsibility for any injury to people or property resulting from any ideas, methods, instructions or products referred to in the content. |
© 2024 by the authors. Licensee MDPI, Basel, Switzerland. This article is an open access article distributed under the terms and conditions of the Creative Commons Attribution (CC BY) license (https://creativecommons.org/licenses/by/4.0/).
Share and Cite
Yang, Z.; Gao, W.; Yang, D.; Hu, X.; Xu, T. Impact of Air Velocity on Mold Growth in High Temperature and Humidity Conditions: An Experimental Approach. Buildings 2024, 14, 2145. https://doi.org/10.3390/buildings14072145
Yang Z, Gao W, Yang D, Hu X, Xu T. Impact of Air Velocity on Mold Growth in High Temperature and Humidity Conditions: An Experimental Approach. Buildings. 2024; 14(7):2145. https://doi.org/10.3390/buildings14072145
Chicago/Turabian StyleYang, Zhijun, Weijun Gao, Dandan Yang, Xiaotong Hu, and Tao Xu. 2024. "Impact of Air Velocity on Mold Growth in High Temperature and Humidity Conditions: An Experimental Approach" Buildings 14, no. 7: 2145. https://doi.org/10.3390/buildings14072145
APA StyleYang, Z., Gao, W., Yang, D., Hu, X., & Xu, T. (2024). Impact of Air Velocity on Mold Growth in High Temperature and Humidity Conditions: An Experimental Approach. Buildings, 14(7), 2145. https://doi.org/10.3390/buildings14072145