Article

An Experimental and Numerical Parametric Study on a Novel T-Shaped Steel–Concrete Composite Shear Wall

1
School of Infrastructure Engineering, Nanchang University, Nanchang 330031, China
2
Design and Research Institute, Nanchang University, Nanchang 330031, China
*
Author to whom correspondence should be addressed.
Buildings 2024, 14(7), 2148; https://doi.org/10.3390/buildings14072148
Submission received: 14 June 2024 / Revised: 27 June 2024 / Accepted: 6 July 2024 / Published: 12 July 2024
(This article belongs to the Section Building Structures)

Abstract

:
In this paper, a novel T-shaped steel–concrete composite shear wall (TSCCW) is proposed. Low-cycle reciprocating tests were carried out on the TSCCW to investigate its performance in terms of its damage characteristics, hysteretic properties, energy dissipation capacity, stiffness degradation and ductility. A numerical model was established on the basis of the tests, and the correctness of the numerical model was verified. Afterwards, parameters such as shear span ratio, axial load ratio, rebar diameter, steel thickness, concrete strength grade and axial compression position were analyzed. The results show that the shear span ratio has a great influence on the performance of the TSCCW. A reduction in the shear span ratio from 2.1 to 1 reduces its stiffness by 333%. An increase in the axial load ratio will increase the load carrying capacity and stiffness of the TSCCW, and the deformation capacity will first increase and then decrease; it is recommended that the axial load ratio should be taken as 0.4. Increasing the steel thickness will improve the load carrying capacity, stiffness, deformation capacity and energy dissipation capacity of the TSCCW to a certain extent. Increasing the reinforcement diameter has less effect on the seismic performance of the TSCCW.

1. Introduction

In high-rise buildings, orthogonally oriented shear walls are usually combined to form T-shaped or L-shaped shear walls [1,2,3]. A T-shaped wall is a member consisting of two orthogonal shear walls. The flange portion and web portion of a T-shaped shear wall interact with each other under horizontal loading. Therefore, the seismic design of T-shaped shear walls faces a more complicated situation [4,5,6]. A separate study should be carried out on T-shaped shear walls.
Some experimental studies on T-shaped shear walls exist. Ke et al. [7] found that T-shaped shear walls have better seismic performance than rectangular shear walls. Guo et al. [8] analyzed the tenacity and ductility of T-shaped short-limb shear walls. Wang et al. [9] found through experimental studies that the damage zones of both bending- and shear-damaged T-shaped shear wall specimens were concentrated at the tip of the webs. E. Smyrou et al. [10] developed curvature relationships for yield curvature, serviceability and damage control curvature for the asymmetric nature of T-shaped shear walls. Ni et al. [11] conducted an experimental study on high-strength reinforced T-shaped shear walls and concluded that 600 MPa steel bars can be used effectively in T-shaped shear walls. Chen et al. [12] investigated the relationship between parameters such as the shear-to-span ratio, axial compression ratio and seismic performance in high-strength concrete T-shaped shear walls configured with steel trusses. Studies [13,14] have shown that factors such as constraint length and reinforcement rate have a significant impact on the mechanical properties, such as the load carrying capacity, ductility and stiffness, of T-shaped concrete shear walls. Blueggen et al. [15] conducted bi-directional proposed static loading tests on two T-shaped shear walls and found that increasing the reinforcement ratio of longitudinal reinforcement in the flanges reduced the crack width of the specimens. Shen et al. [16] developed a precast T-shaped reinforced concrete (RC) shear wall with H-shaped shear keys and conducted an experimental study. Liu et al. [17] experimentally investigated the effect of reinforcement corrosion on the seismic performance of T-shaped RC shear walls. Zhang et al. [18] conducted an experimental study on six T-shaped slender RC shear walls. Wang et al. [19] conducted an experimental study on T-shaped shear walls considering seismic loads in the biaxial direction. An experimental study of a new type of stainless steel core plate wall was carried out by Shu et al. [20]. Lim et al. [21] investigated the seismic performance of a wet-cast joint T-shaped shear wall and found that the shear transfer diagonal reinforcement in the wall can effectively inhibit wall cracking.
Regarding numerical simulations, Ji et al. [22], Ni et al. [23], Cho et al. [24], Kolozvari et al. [25] and Eom et al. [26] have also studied the seismic performance of T-shaped shear walls.
Through the existing research studies, it is found that the seismic research on T-shaped shear walls mostly focuses on RC shear walls. There are fewer studies on steel–concrete composite T-shaped shear walls. In order to improve the load carrying capacity and plastic deformation capacity of RC shaped shear walls, a new type of C-shaped steel frame composite T-shaped shear wall (TSCCW) was designed and fabricated in this paper. A low circumferential reciprocating loading test was carried out on the TSCCW. Based on the experimental study, finite element analysis of the specimen was carried out. Parameters such as the shear span ratio, axial compression ratio, reinforcement size, steel plate size, concrete strength and axial compression location were also parametrically analyzed.

2. Experimental Program

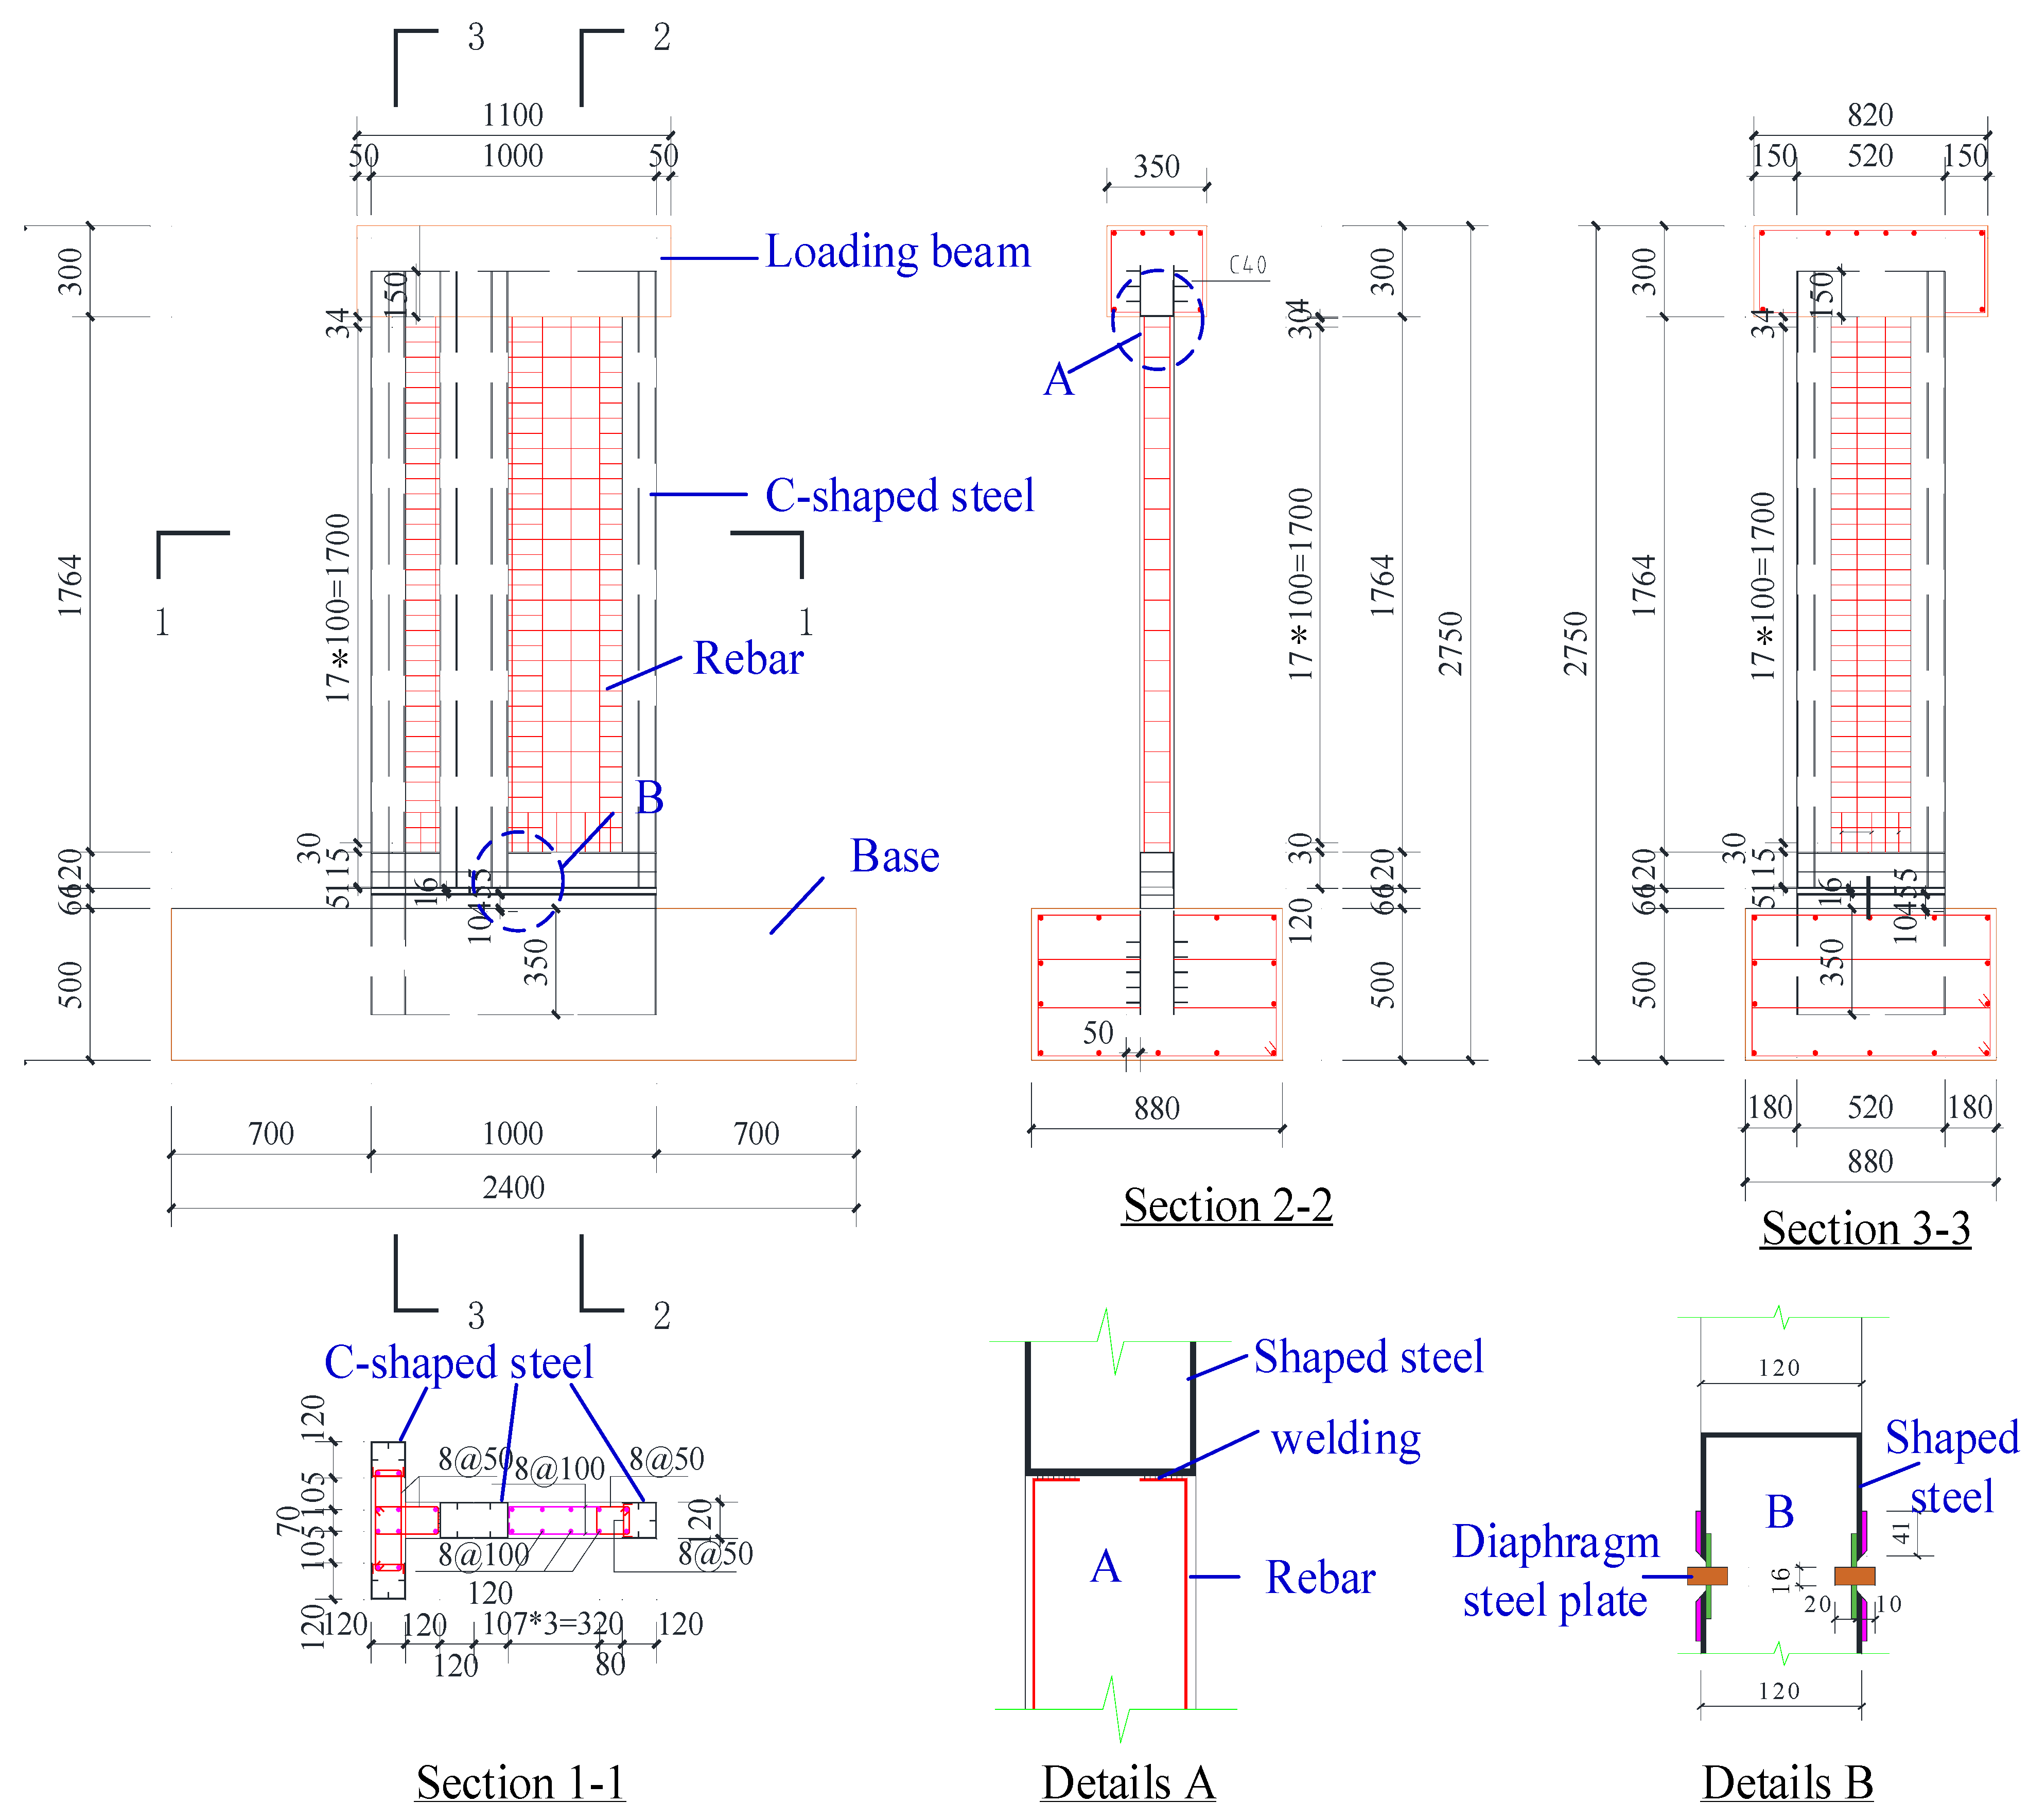
2.1. Specimen Design

Based on an actual project structure, a C-shaped steel frame composite T-shaped shear wall (TSCCW) specimen with a scaling ratio of 1/2 was designed and fabricated. The details of the specimen are shown in Figure 1. C-shaped steel frames were arranged at both sides of the flange, the center end of the web and near the web and flange of the TSCCW specimen. The top of the wall had a built-in steel plate welded to the top to avoid concrete damage at the top corners. A steel frame was provided at the bottom of the wall to avoid concrete damage at the bottom corners while achieving plastic transfer. The width of the shear wall is 1000 mm, and the effective height is 2000 mm. The thickness of the steel plate is 2.86 mm, and the diameter of the hoop and the longitudinal reinforcement in the concrete wall is 8 mm.

2.2. Materials

When manufacturing the specimen TSCCW, the same batch of steel plates and rebar was used for the material property test. The steel in the specimen TSCCW was sampled and tested according to the Chinese specification GB/T 2975-2018 [27]. Tensile testing of the steel was carried out using an MTS 311.31 testing machine. Three specimens were tested in each group, and the final results were averaged. The mechanical properties of the steel are shown in Table 1. The material property test of the concrete was determined based on GB/T 50081-2019 [28]. Three cubic specimens with dimensions of 150 mm × 150 mm × 150 mm were taken and tested for their mechanical properties after curing the concrete under the same conditions as the specimen TSCCW for 28 days. The compressive strength of the concrete was measured to be 41.8 MPa.

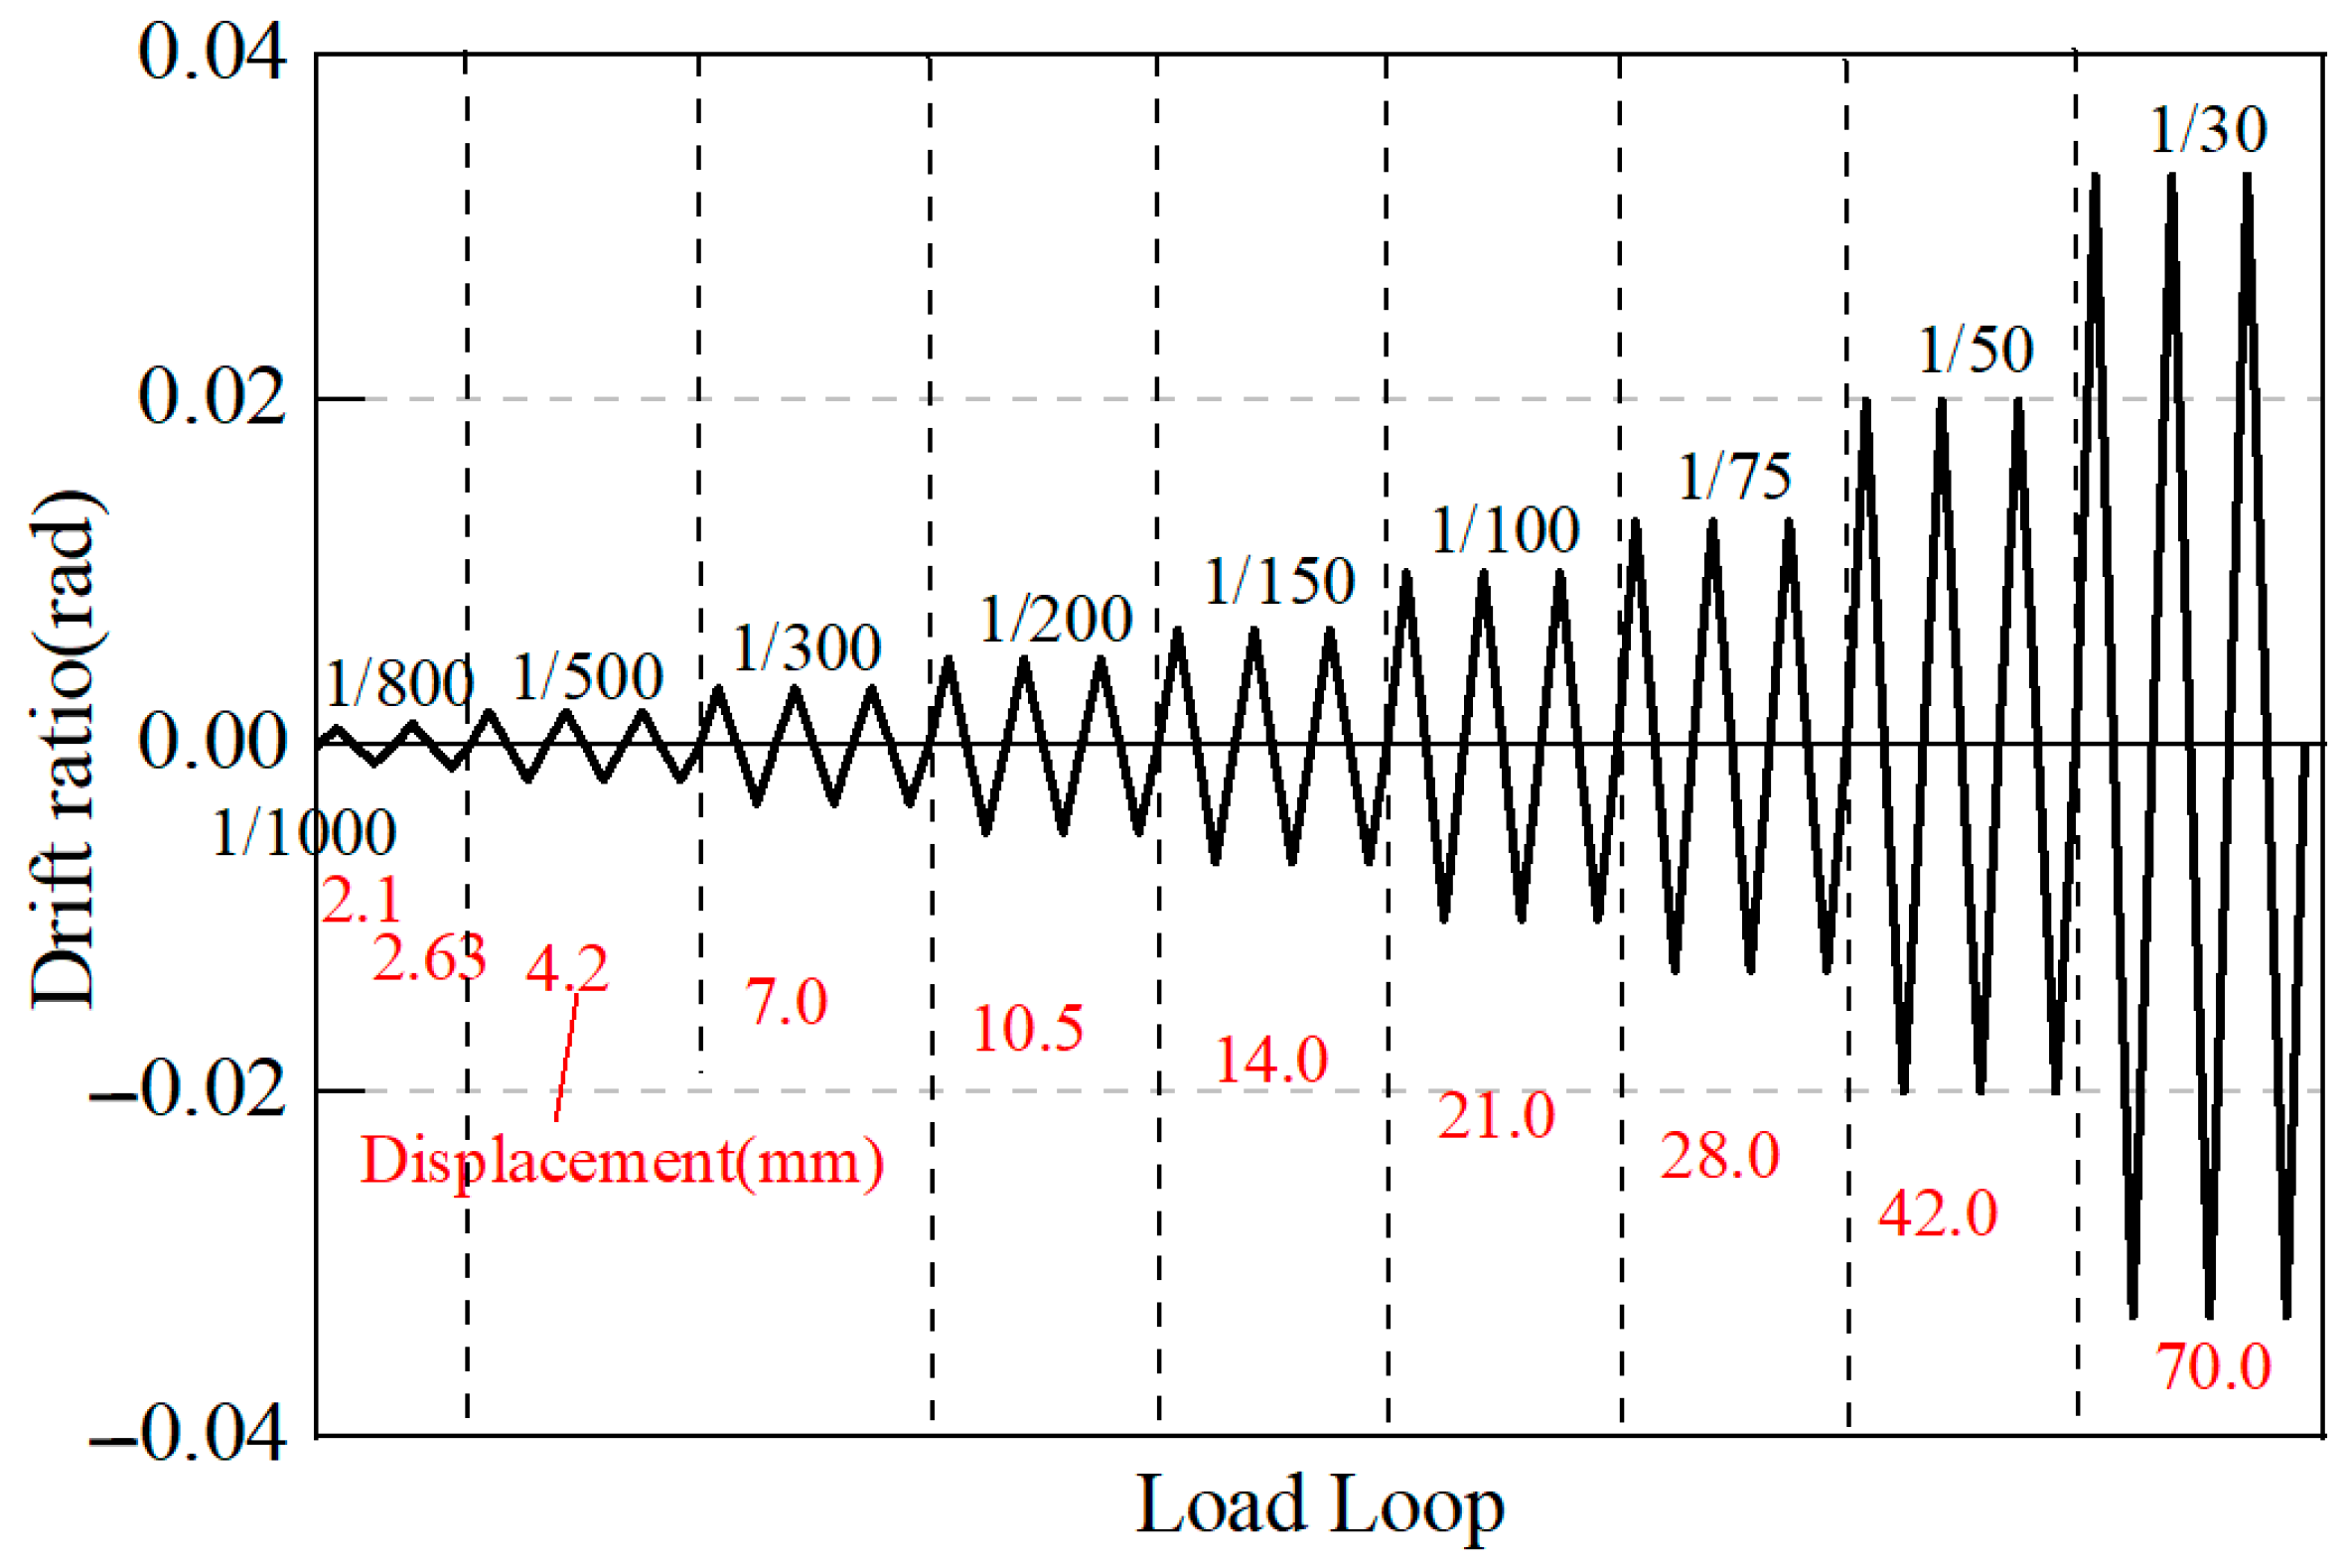
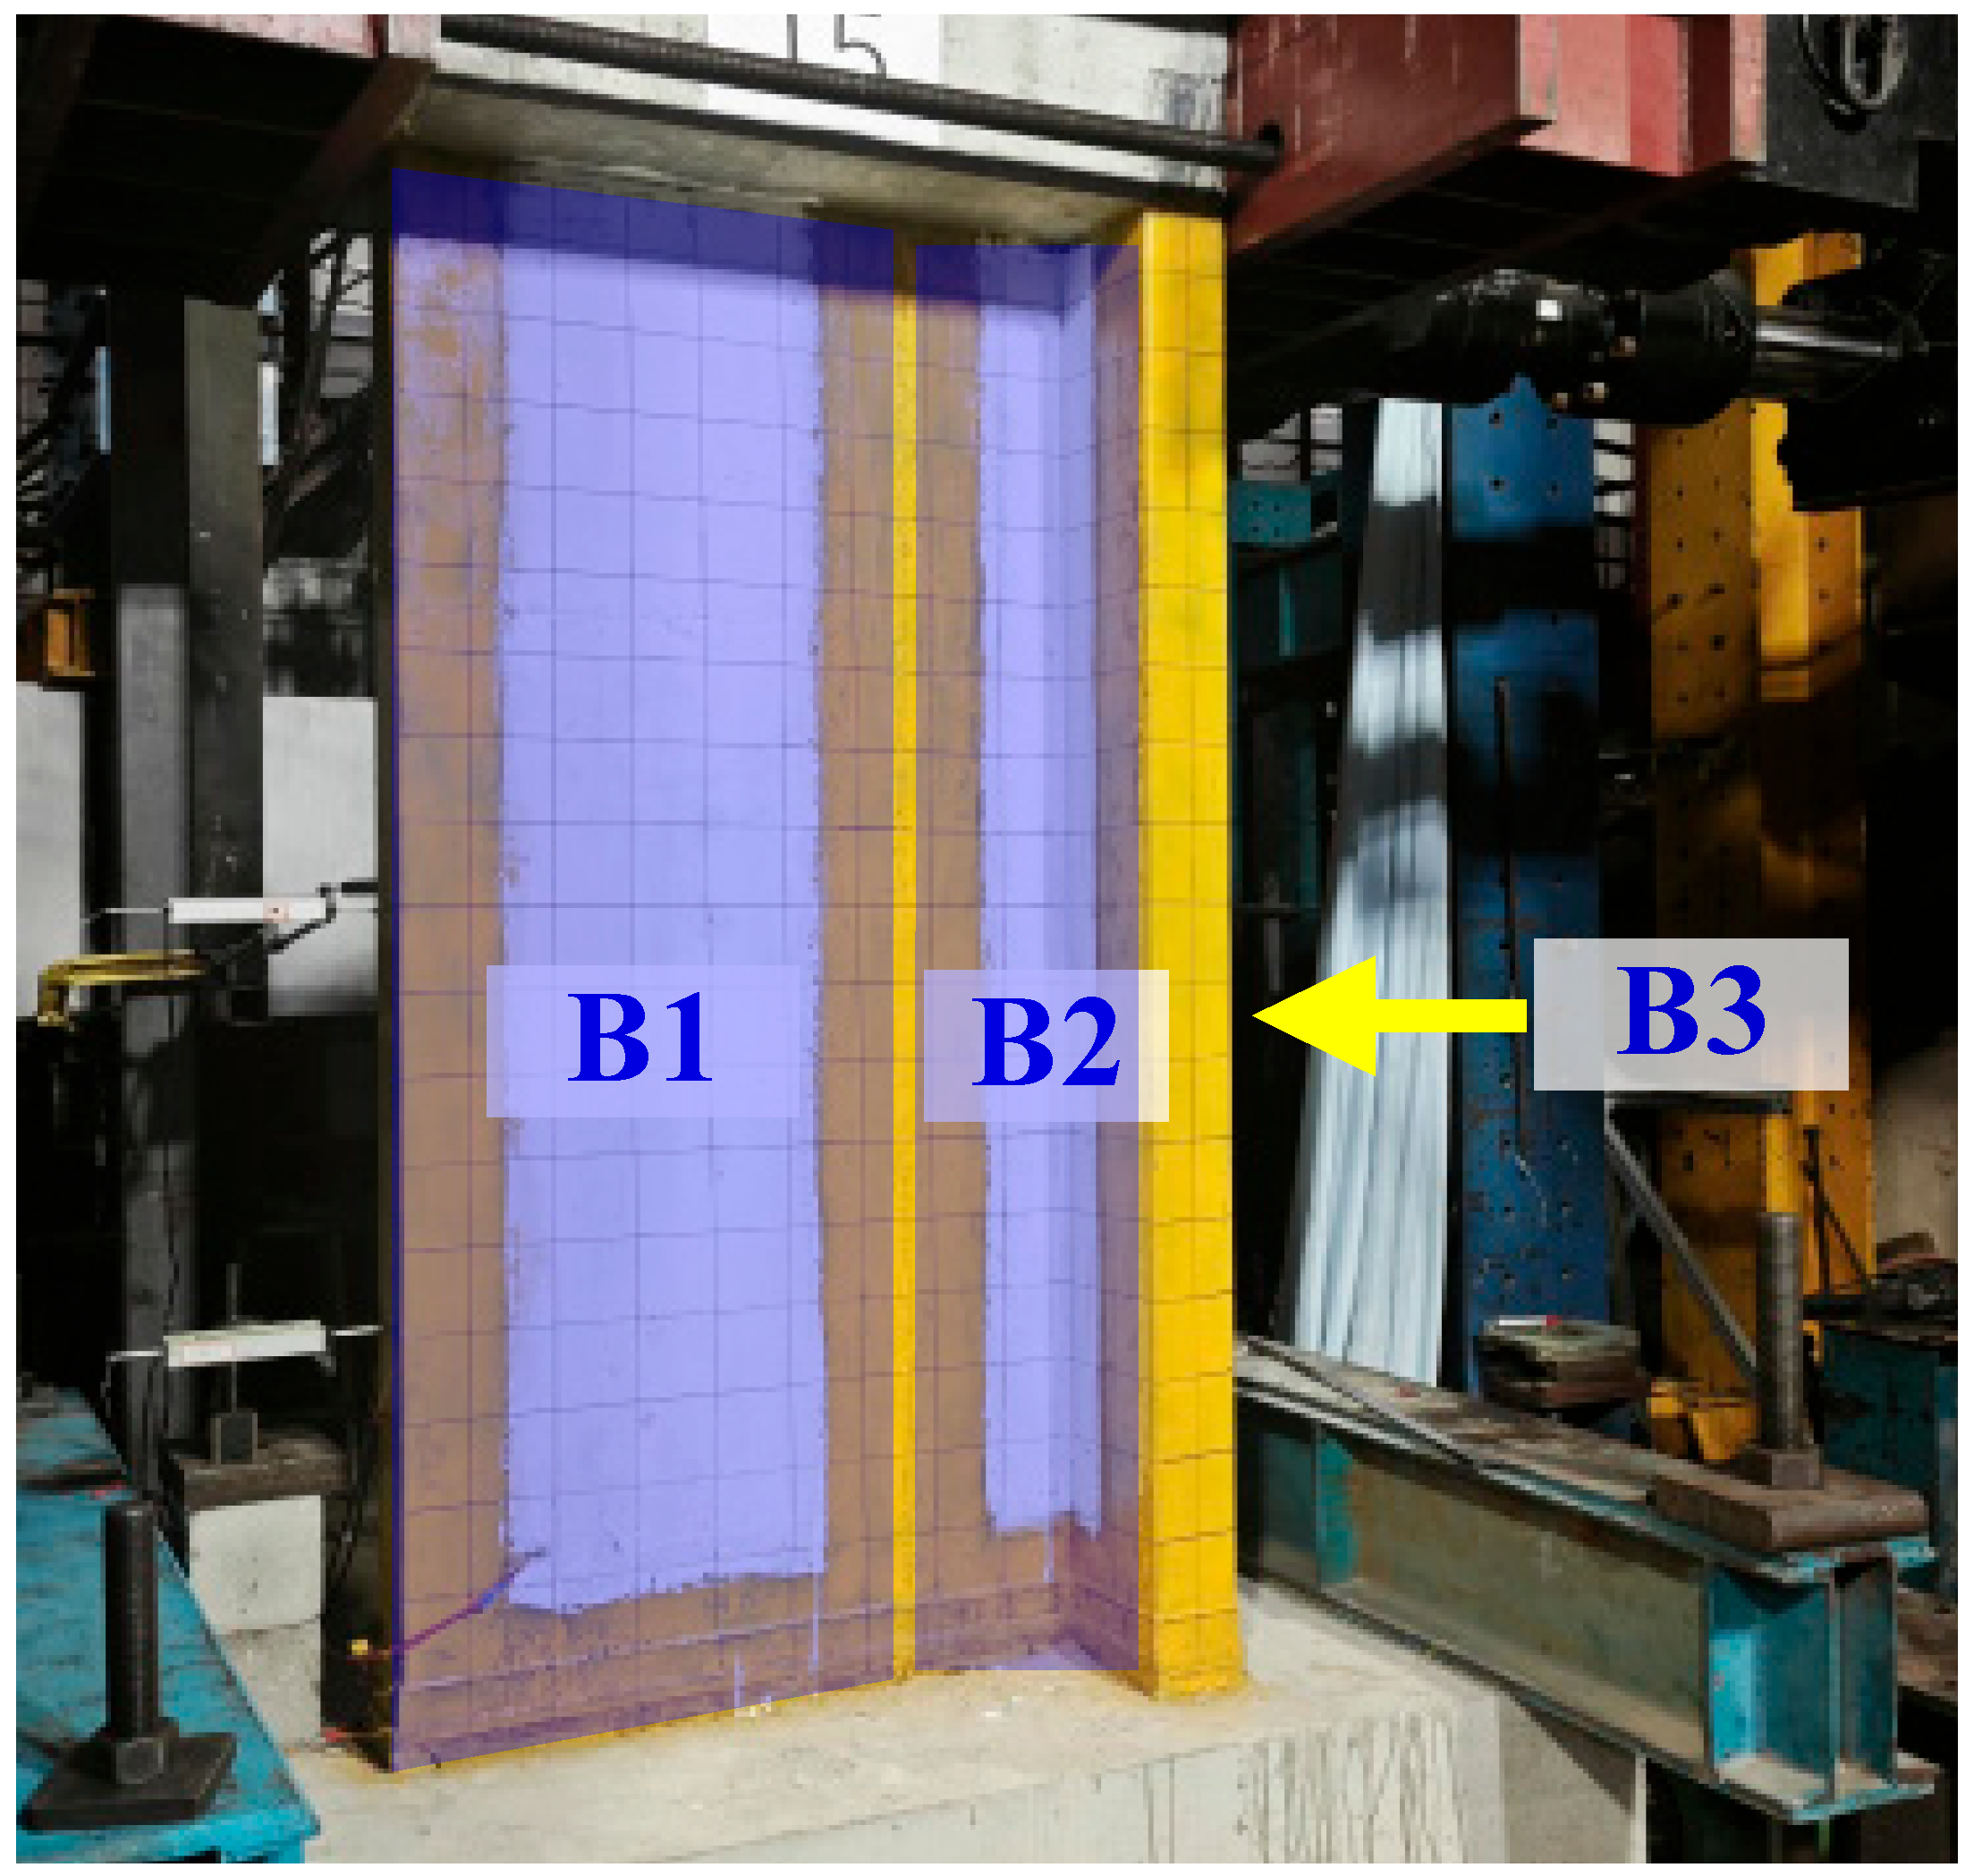
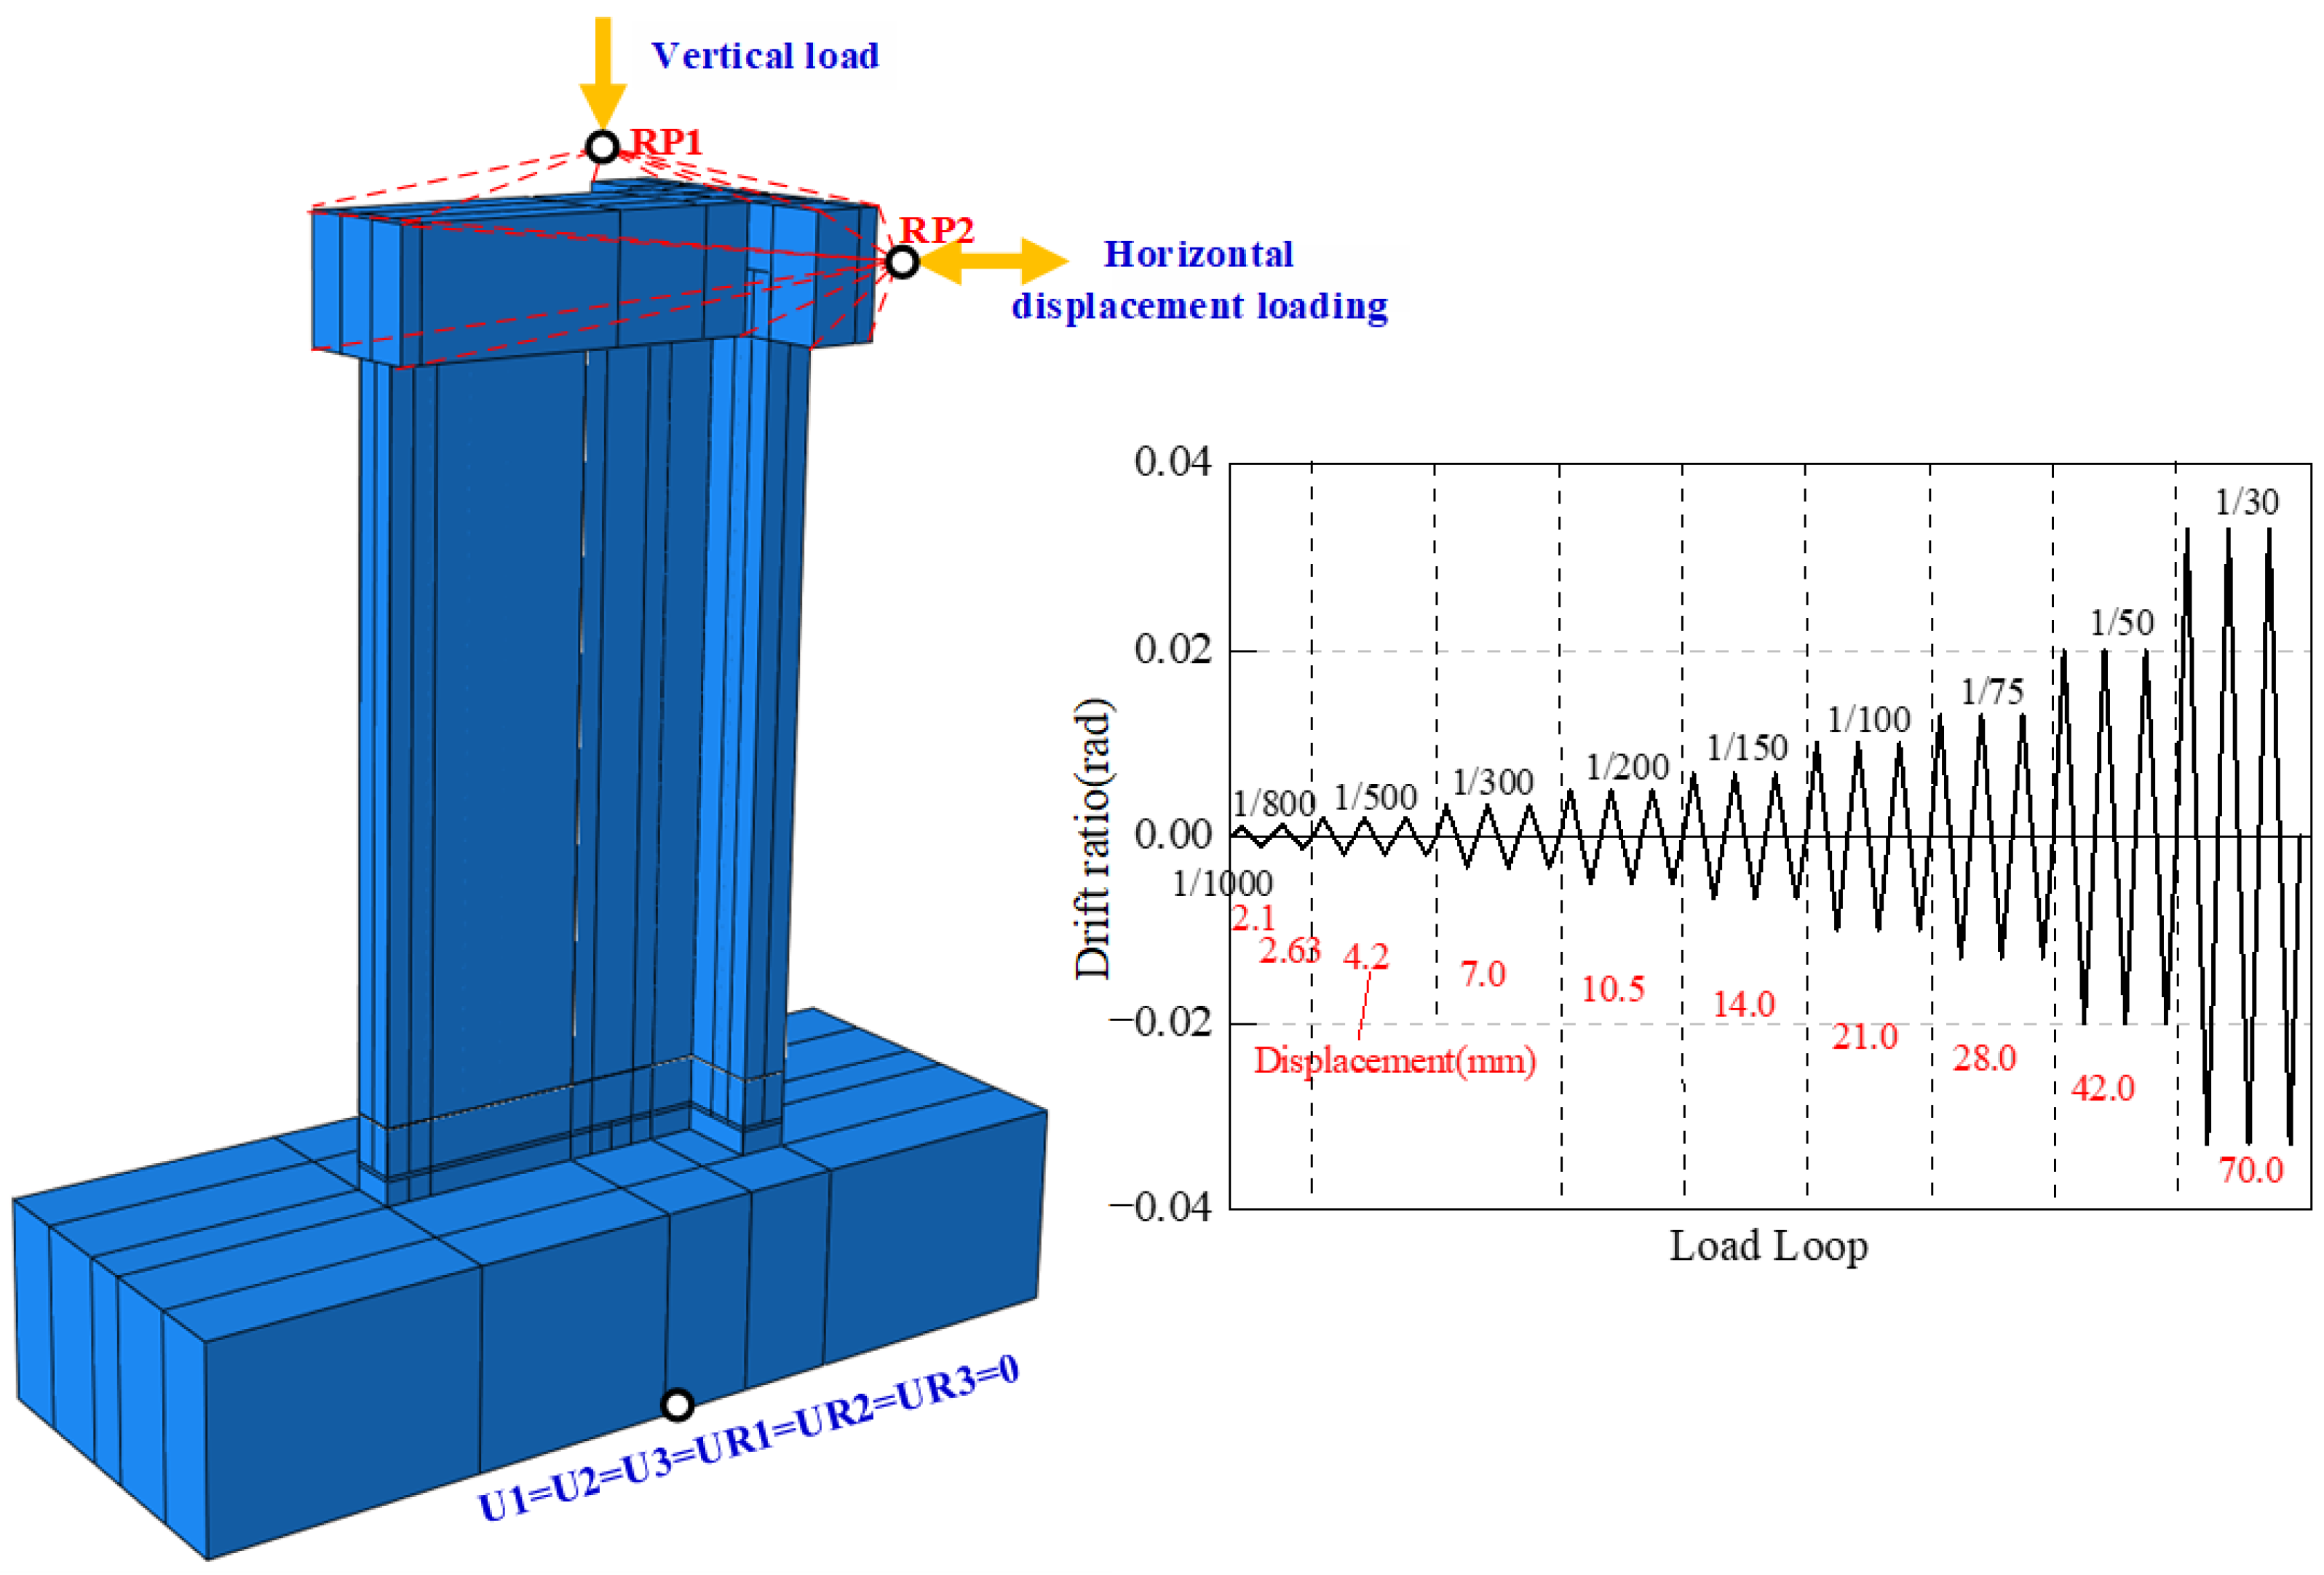
2.3. Test Setup and Loading Process

The test loading device is shown in Figure 2. The base of the specimen is fixed with steel beams and ground bolts to restrain the base from moving horizontally, vertically or rotating to ensure that the base does not displace or rotate during test loading. Horizontal hydraulic jacks apply a constant force on both sides of the base to prevent the foundation beam from sliding. A 100 t electro-hydraulic servo actuator is set up on the top beam of the specimen for vertical axial pressure loading. Two electro-hydraulic servo actuators of 150 tons with a stroke range of ±250 mm are jointly loaded in the horizontal direction. The rear end of the actuator is fixed to the reinforced concrete counterforce wall. Horizontal reciprocating loading is realized by means of high-strength screws and loading beams.
The loading system is based on the specification JGJ/T 101 [29]. The load–displacement control mode is used throughout. The test is divided into three stages: pre-loading, axial loading and horizontal loading.
Pre-loading: Firstly, apply a 100 kN vertical load, and then apply a reciprocal horizontal load of ±50 kN for one cycle. Observe whether the floor beam slips or buckles during the loading process. Check whether each measuring instrument is working normally. After ensuring that there is no abnormal situation, prepare for subsequent loading.
Axial loading: Load according to the designed axial pressure ratio of 0.2. Stabilize the load until the end of the test.
Horizontal loading: Horizontal loading adopts displacement control corresponding to each displacement angle. The first and second levels are loaded for 1 cycle, and the third level is loaded for 3 cycles until the specimen is damaged and cannot be further loaded or the load capacity drops to less than 85% of the maximum load capacity of the test. The horizontal loading process is shown in Figure 3.

3. Test Results and Discussion

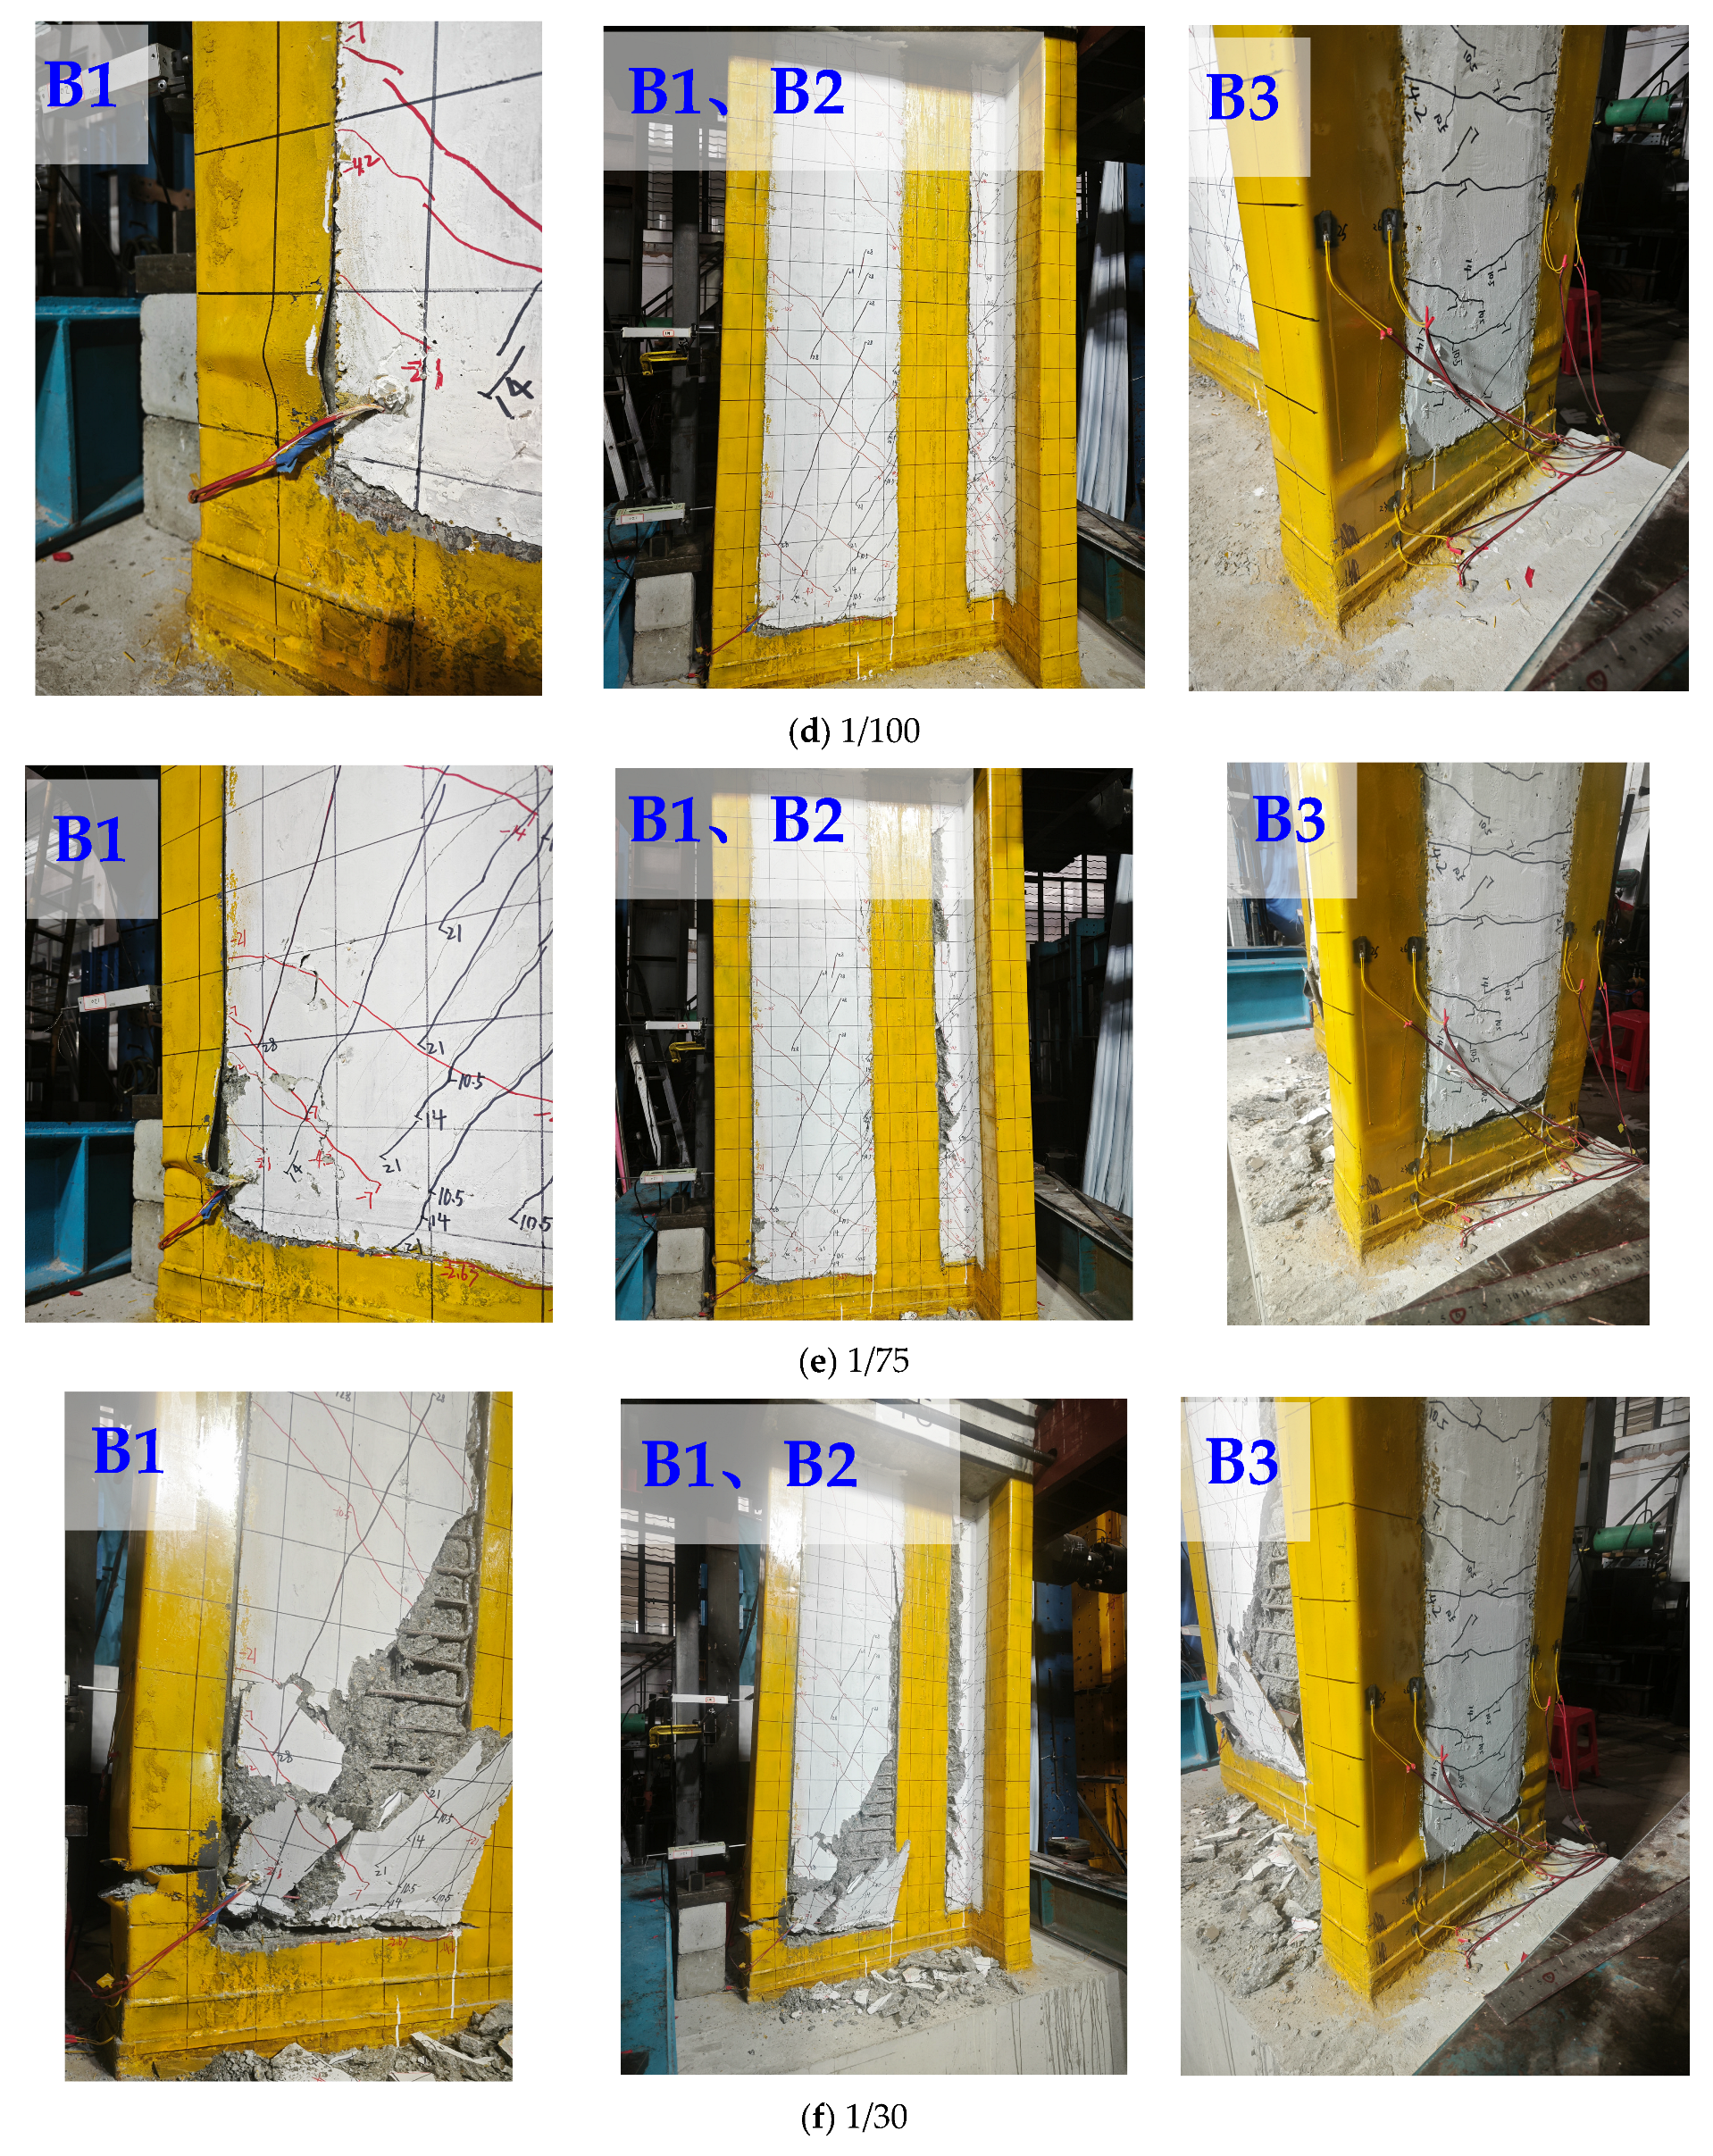
3.1. Experimental Phenomena and Failure Behaviors

During the loading of the specimens, the development of concrete cracks and damage to the specimens was recorded at the peak of the cycle at each level of loading. In order to facilitate the description of the experimental phenomena during the loading process, the specimens were divided into three regions, B1, B2, and B3. Area B1 corresponds to the web edge of the first concrete position of the specimen TSCCW; area B2 corresponds to the corner position where the web and flange of the specimen TSCCW meet; area B3 corresponds to the back of the flange of the specimen TSCCW. The specimen area division is shown in Figure 4.
The failure process of the specimen is shown in Figure 5. When the drift ratio is less than 1/500 (2.1 mm), the specimen deformation is small, with no obvious phenomena. At a drift ratio of 1/500 (4.2 mm), a diagonal crack appears near the corner in the B1 and B2 areas, measuring 20 mm in length and 0.08 mm in width, along with a transverse crack in the B3 area. Increasing the drift ratio to 1/300 (7 mm) results in new vertical cracks in the B1 and B2 areas, extending the existing cracks to a maximum width of 0.18 mm, and more transverse cracks in the B3 area, with a maximum width of 0.08 mm. At a drift ratio of 1/150 (14 mm), the cracks in the B1 and B2 areas continue to grow, and cracks cover the entire height of the B3 area, with a maximum width of 0.53 mm. At a drift ratio of 1/100 (21 mm), the corners of the steel plate in the B1 and B3 areas bulge, indicating yielding. Finally, at a drift ratio of 1/30, the corners of the steel frame in the B1 area fracture, and large chunks of concrete fall off in the B1 and B2 areas, leading to specimen failure.

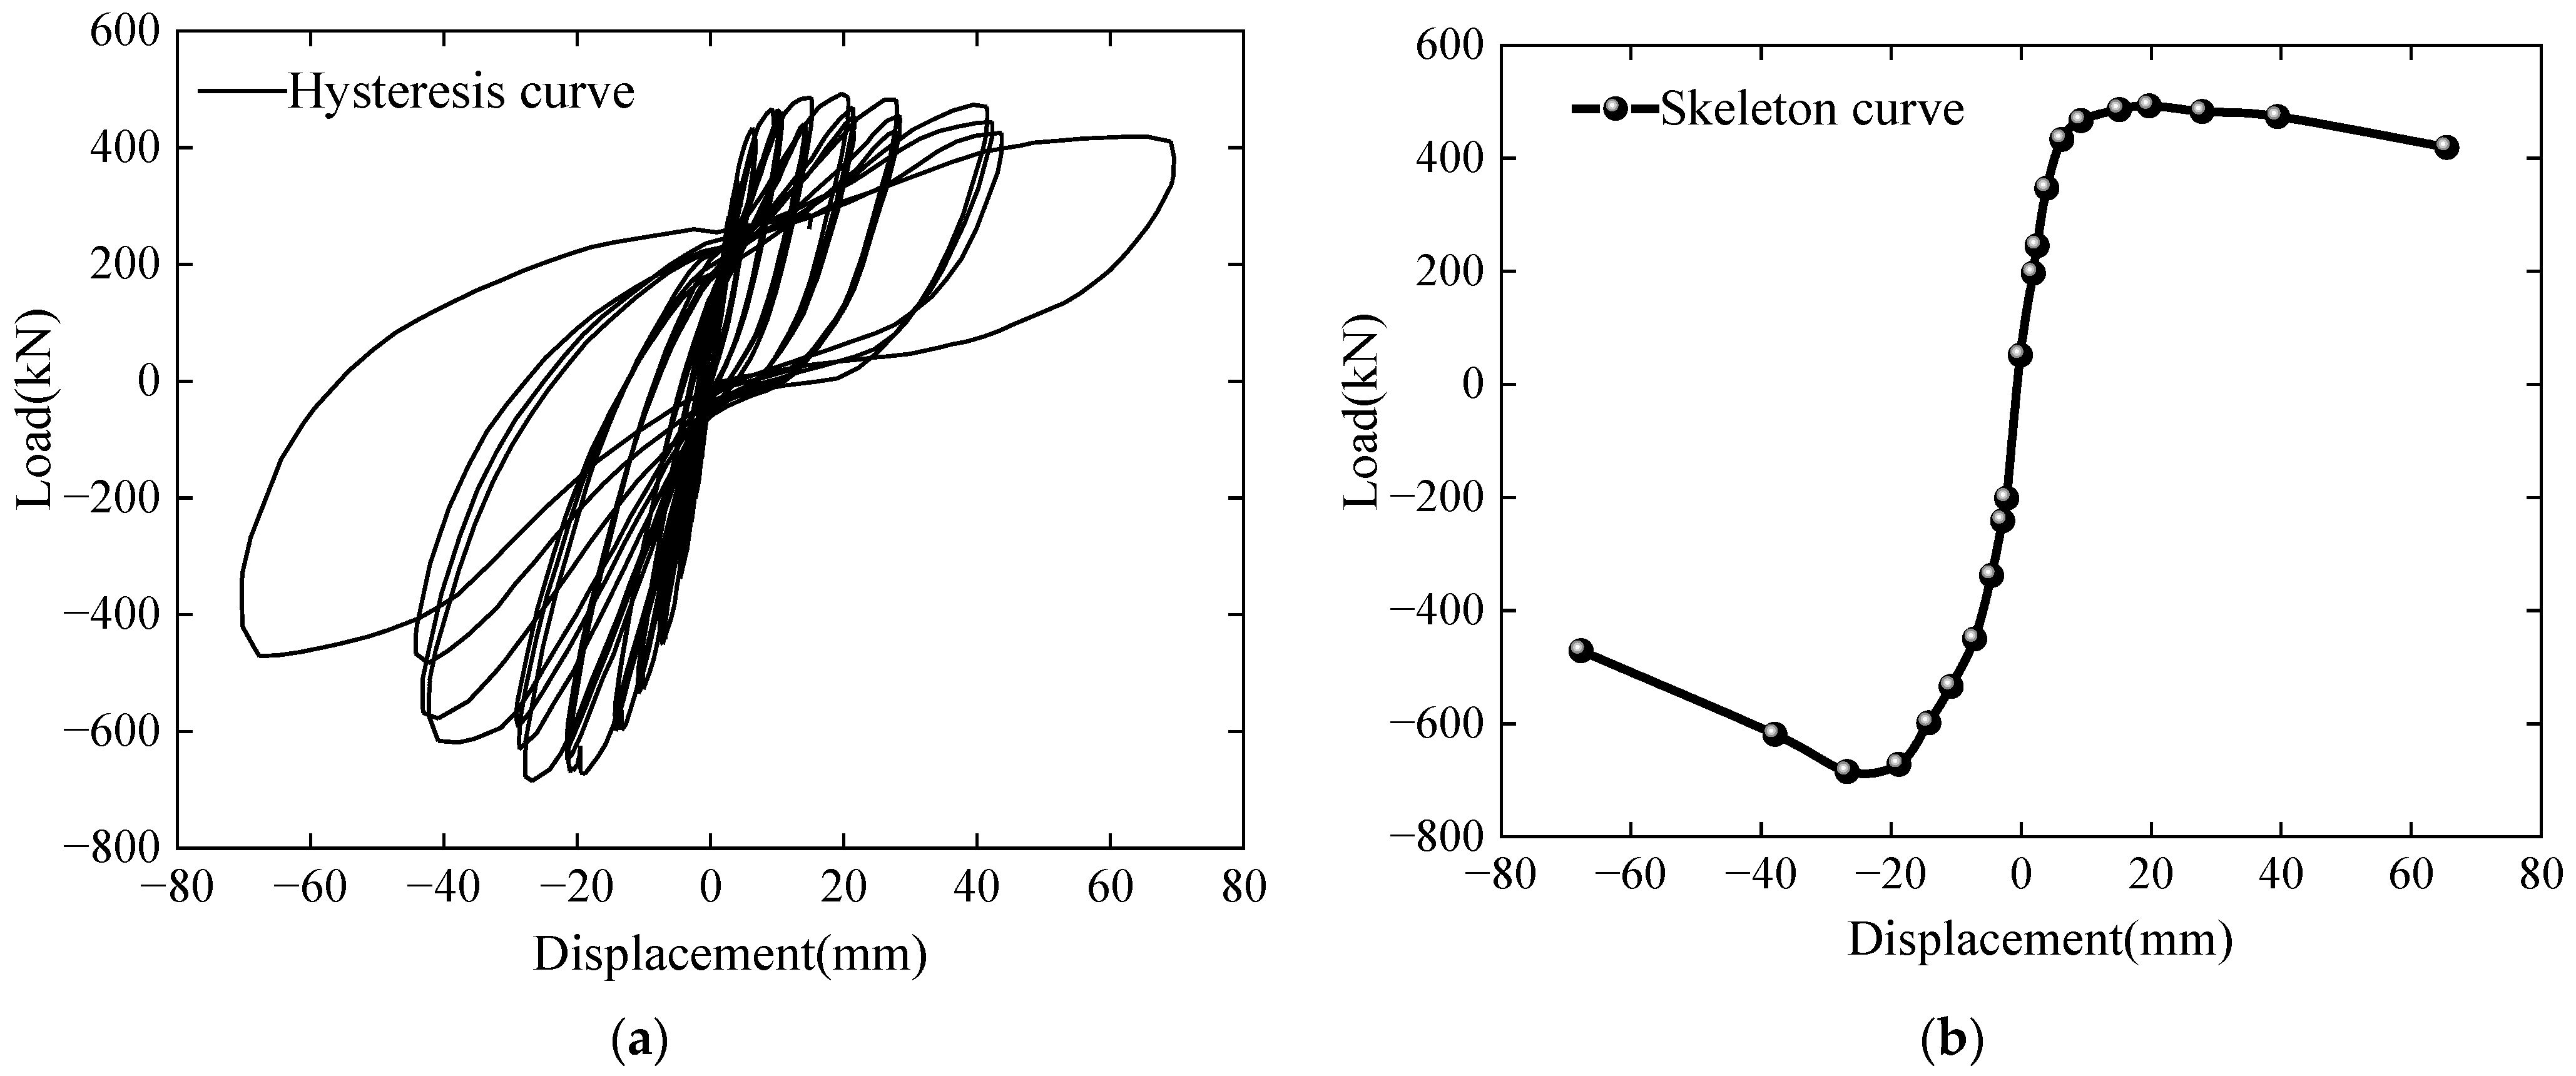
3.2. The Hysteresis Loop and Other Data

The hysteresis curve and skeleton curve of the specimen TSCCW are shown in Figure 6. In the early stage of horizontal loading, the load and displacement are linear during loading and unloading, and the residual deformation and plastic deformation are small. The specimen is in the elastic stage. With an increase in horizontal displacement, the specimen begins to show irrecoverable plastic deformation, the area of the hysteresis loop gradually increases and the energy dissipation also increases gradually. Overall, the specimen is loaded in the negative direction with a higher load and a larger area of energy dissipation, which is due to the geometrical asymmetry of the T-shaped specimen under positive and negative loading.
The hysteresis curve can be further calculated to obtain the yield point, peak point, energy dissipation capacity, initial stiffness, ductility coefficient, etc., as shown in Table 2.

4. Numerical Simulation

4.1. Finite Element Models

The finite element model of the specimen TSCCW was established using the finite element software ABAQUS 2020. The dimensions of the finite element model were consistent with the test specimen. The finite element model is shown in Figure 7. The model contains the top beam, base, wall, rebars and steel frame. The top beam, base and wall were modeled using three-dimensional hexahedral solid elements (C3D8R). The reinforcement bars were modeled using two-node linear 3D truss elements (T3D2). The steel frames were modeled using S4R shell elements. The mesh convergence analysis was carried out before model calculation, and the mesh size was set to 50 mm under the premise of ensuring calculation accuracy and speed. There was no slip between the rebars and the concrete before specimen damage, so the interaction between the steel bars and the concrete was modeled as tied. Disengagement between the steel frame and the concrete occurred when the specimen was about to fail, so the interaction between the steel frame and the concrete was modeled as frictional contact.
Figure 8 illustrates the boundary constraints and loads applied to the specimen. Fixed constraints, i.e., U1 = U2 = U3 = UR1 = UR2 = UR3 = 0, were set on the base surface. Two reference points, RP1 and RP2, were set to couple with the top beam. The load application was set in two steps: the first step was to apply a vertical load at point RP1 to simulate axial pressure, and the second step was to apply a horizontal load at point RP2 to simulate the reciprocating load. The loading regime for horizontal displacement was consistent with the test.

4.2. Material Parameters

A concrete damage model (CDP) in ABAQUS 2020 is chosen for the constitutive relationship of concrete [30]. The CDP model can simulate the hysteretic behavior of the specimen well under reciprocating loads. The tensile and compressive damage factors in the CDP model illustrate the decrease in stiffness with damage accumulation.
A bilinear model is selected for the constitutive models of both the steel reinforcement and steel frame. The von Mises yield criterion was chosen for the yield criterion. The steel material property data are shown in Table 1.

4.3. Finite Element Model Verifications

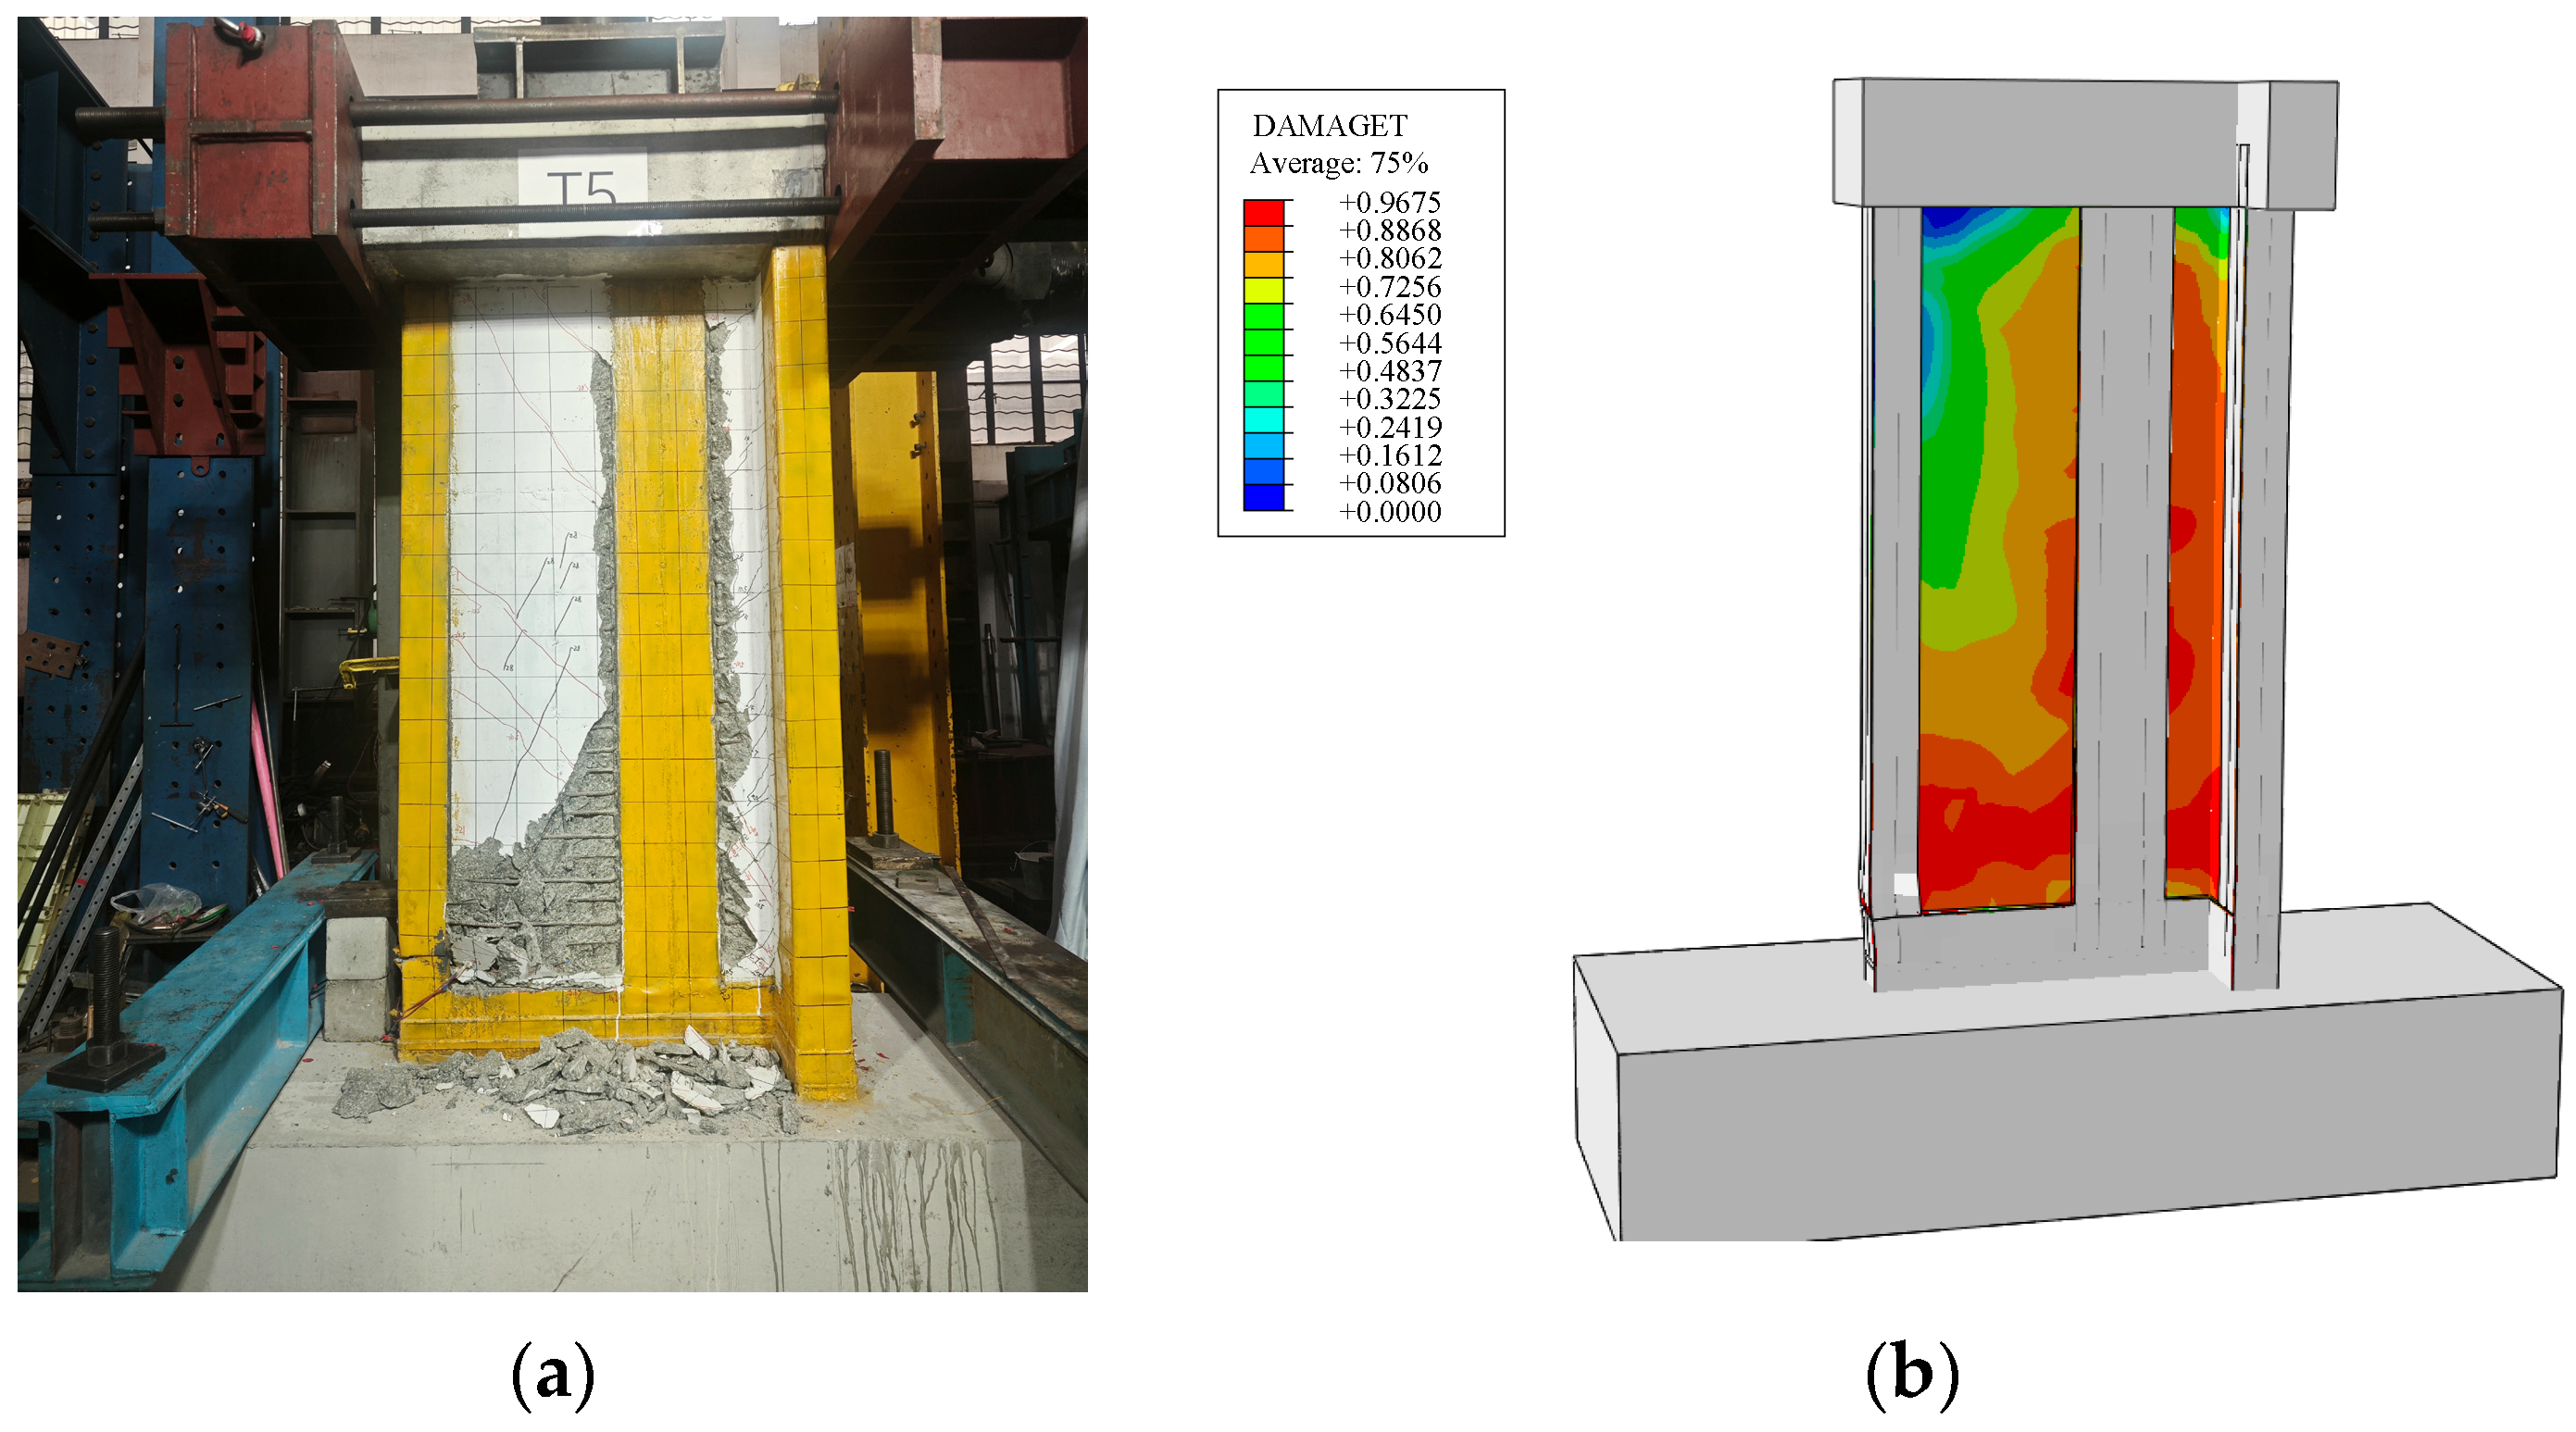
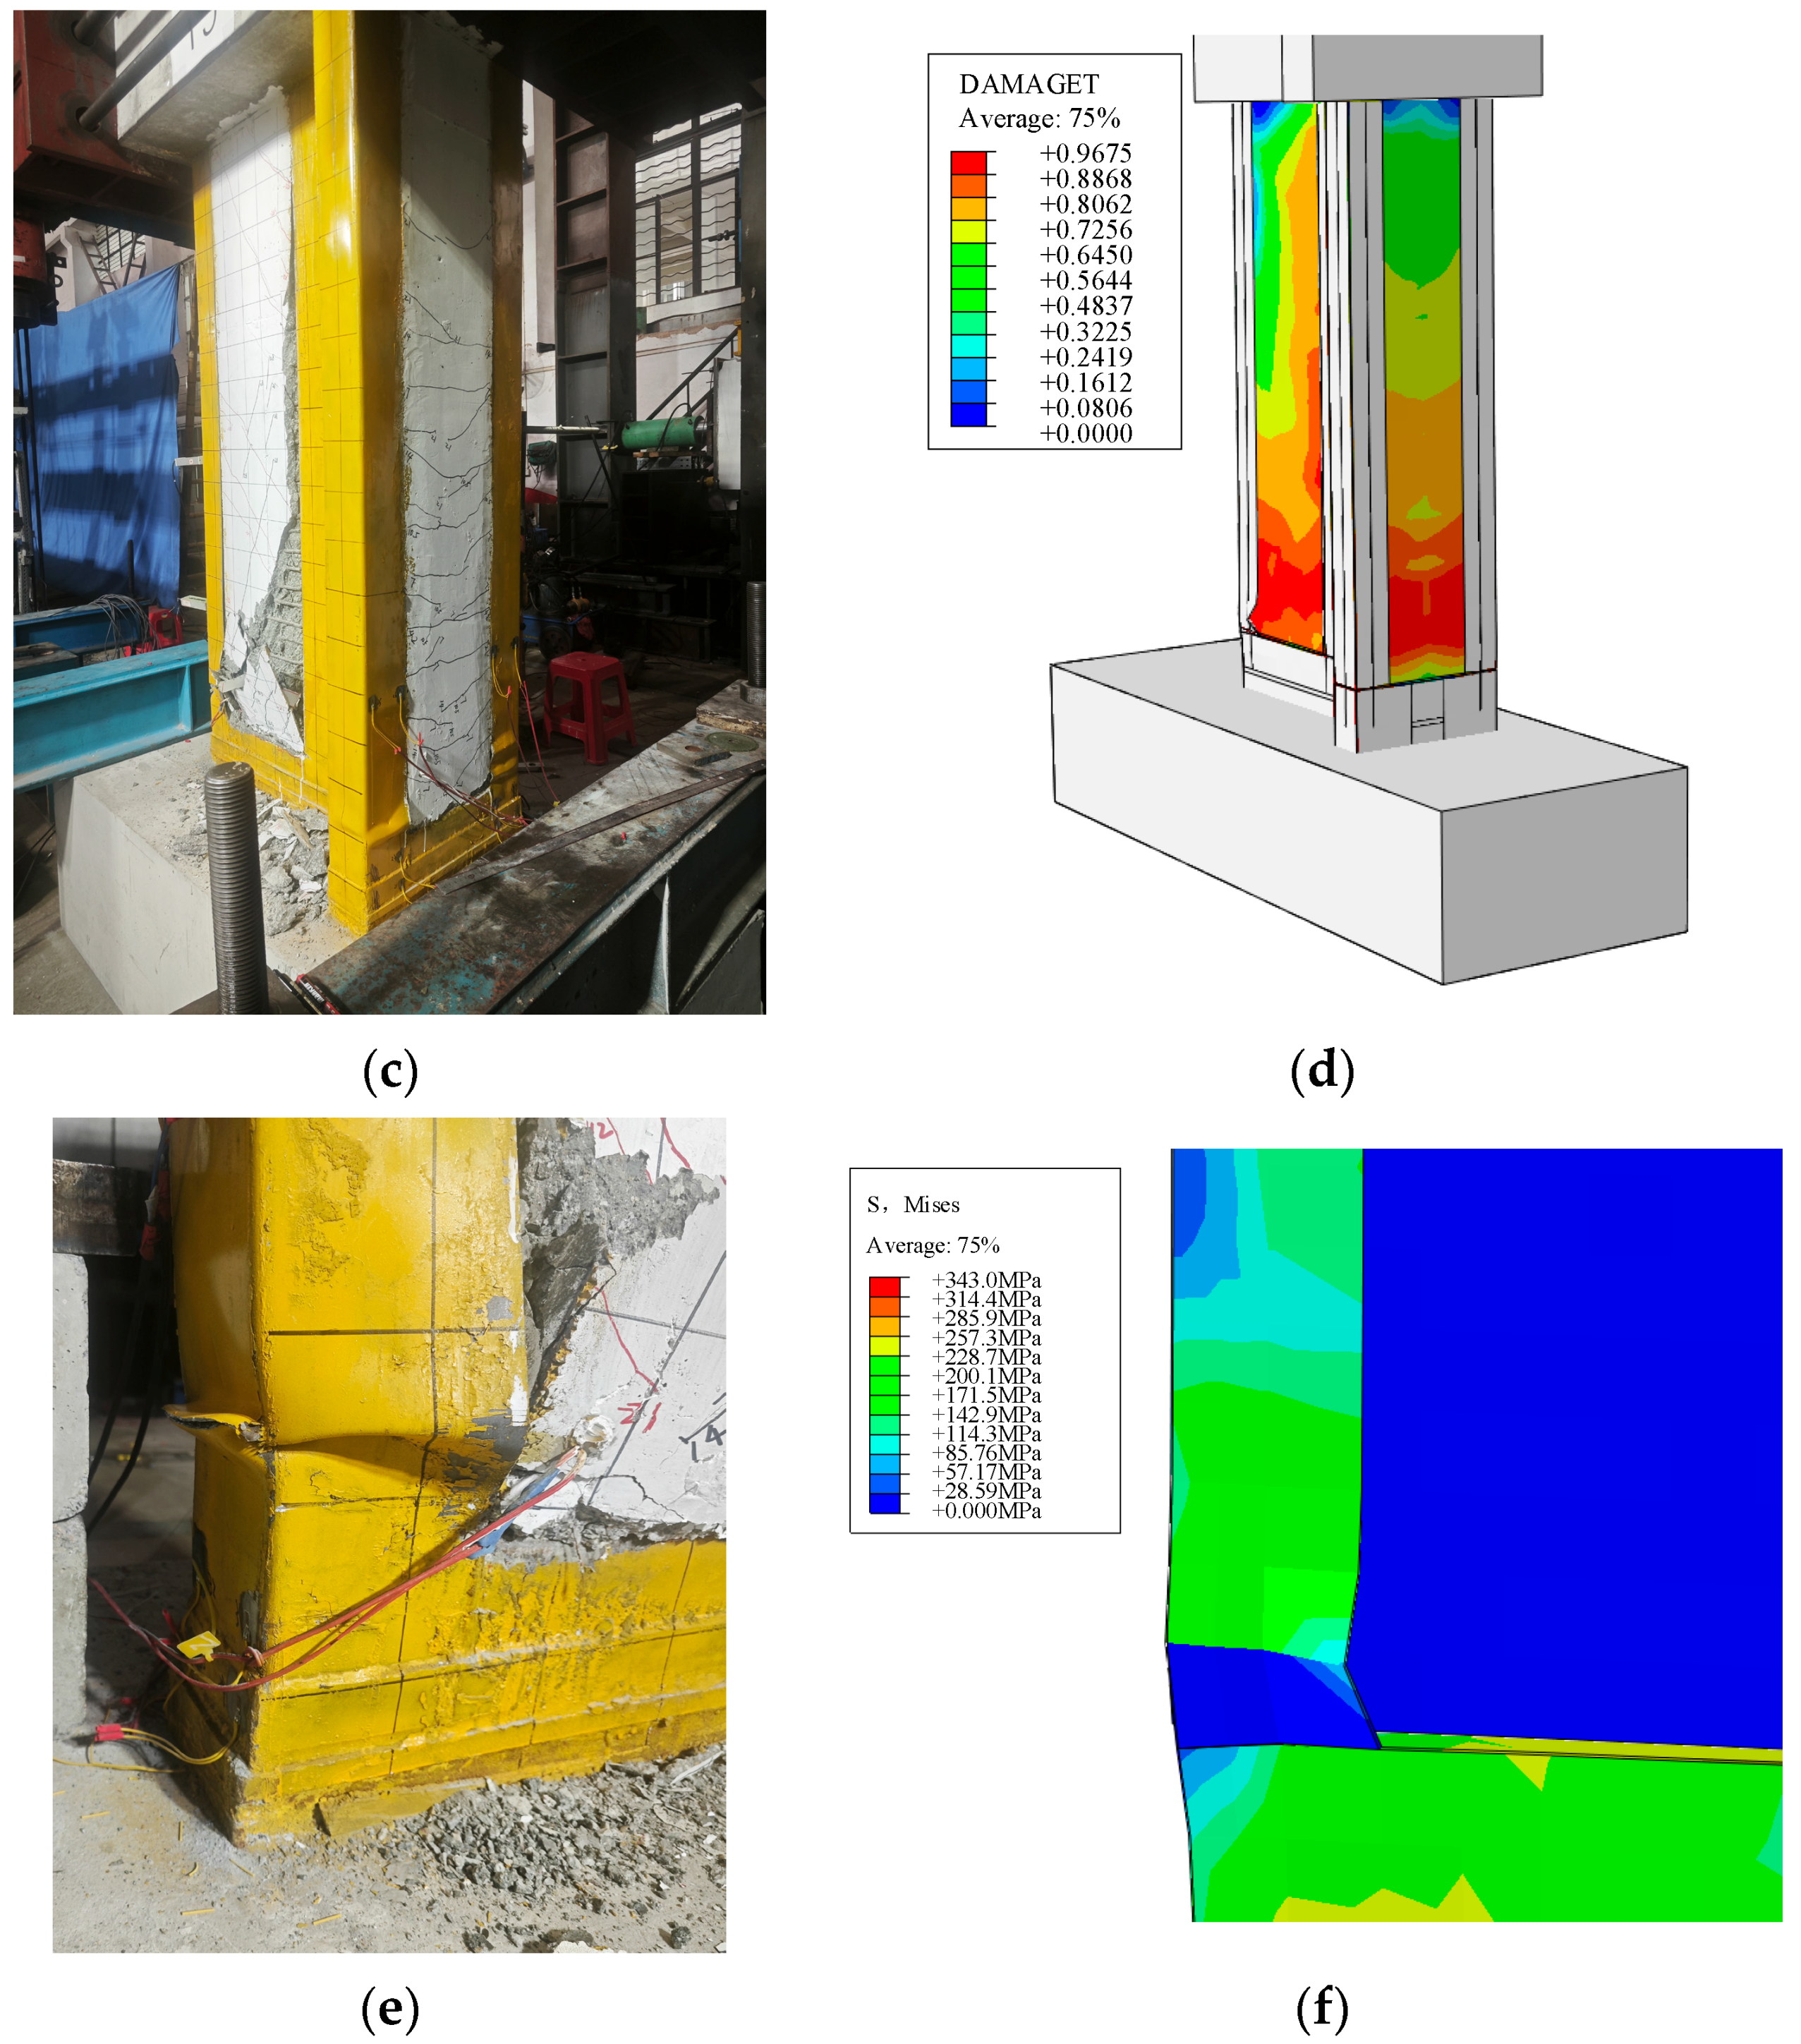
4.3.1. Comparison of Failure Behaviors

The failure behavior in the finite element analysis and experiment is shown in Figure 9. It can be seen that the crack location of the concrete is basically consistent with the distribution of the finite element damage area. The corners of the steel frame buckled significantly when the specimen failure occurred, and the finite element was able to simulate the buckled state of the steel frame. In conclusion, the finite element analysis can simulate the failure behavior from the experiment very well.

4.3.2. Comparison of Load–Deflection Behavior

To ensure the accuracy of the finite element model, the hysteresis curve for the extracted finite element analysis is shown in Figure 10 against that for the experiment. It can be seen that the finite element analysis accurately simulates the hysteretic behavior of the specimen. The yield load, peak load and initial stiffness data for the test and the finite element analysis are compared in Table 3. The errors for all the data are within 10%, which shows that the finite element analysis has good accuracy.

4.4. Parameter Settings

For a new type of steel–concrete composite shear wall, an in-depth study of its mechanical properties is necessary. The diameter of the reinforcement and the thickness of the C-shaped steel determine the steel content in the TSCCW and may change the seismic performance of the specimens. The axial compression ratio and the shear span ratio are important factors in determining the mechanical properties of shear walls, which are required to support horizontal and vertical loads. Also, changes in the concrete strength may lead to changes in the seismic performance of the TSCCW.
Therefore, different axial load ratios, shear span ratios, steel contents and axial load positions can change the mechanical properties of the TSCCW. This paper first verifies the correctness of the finite element model through experiments. Then, a parametric analysis study was carried out to investigate different axial load ratios, shear span ratios, steel contents, concrete strengths and axial load positions. The parameter settings are shown in Table 4.

5. Parametric Study

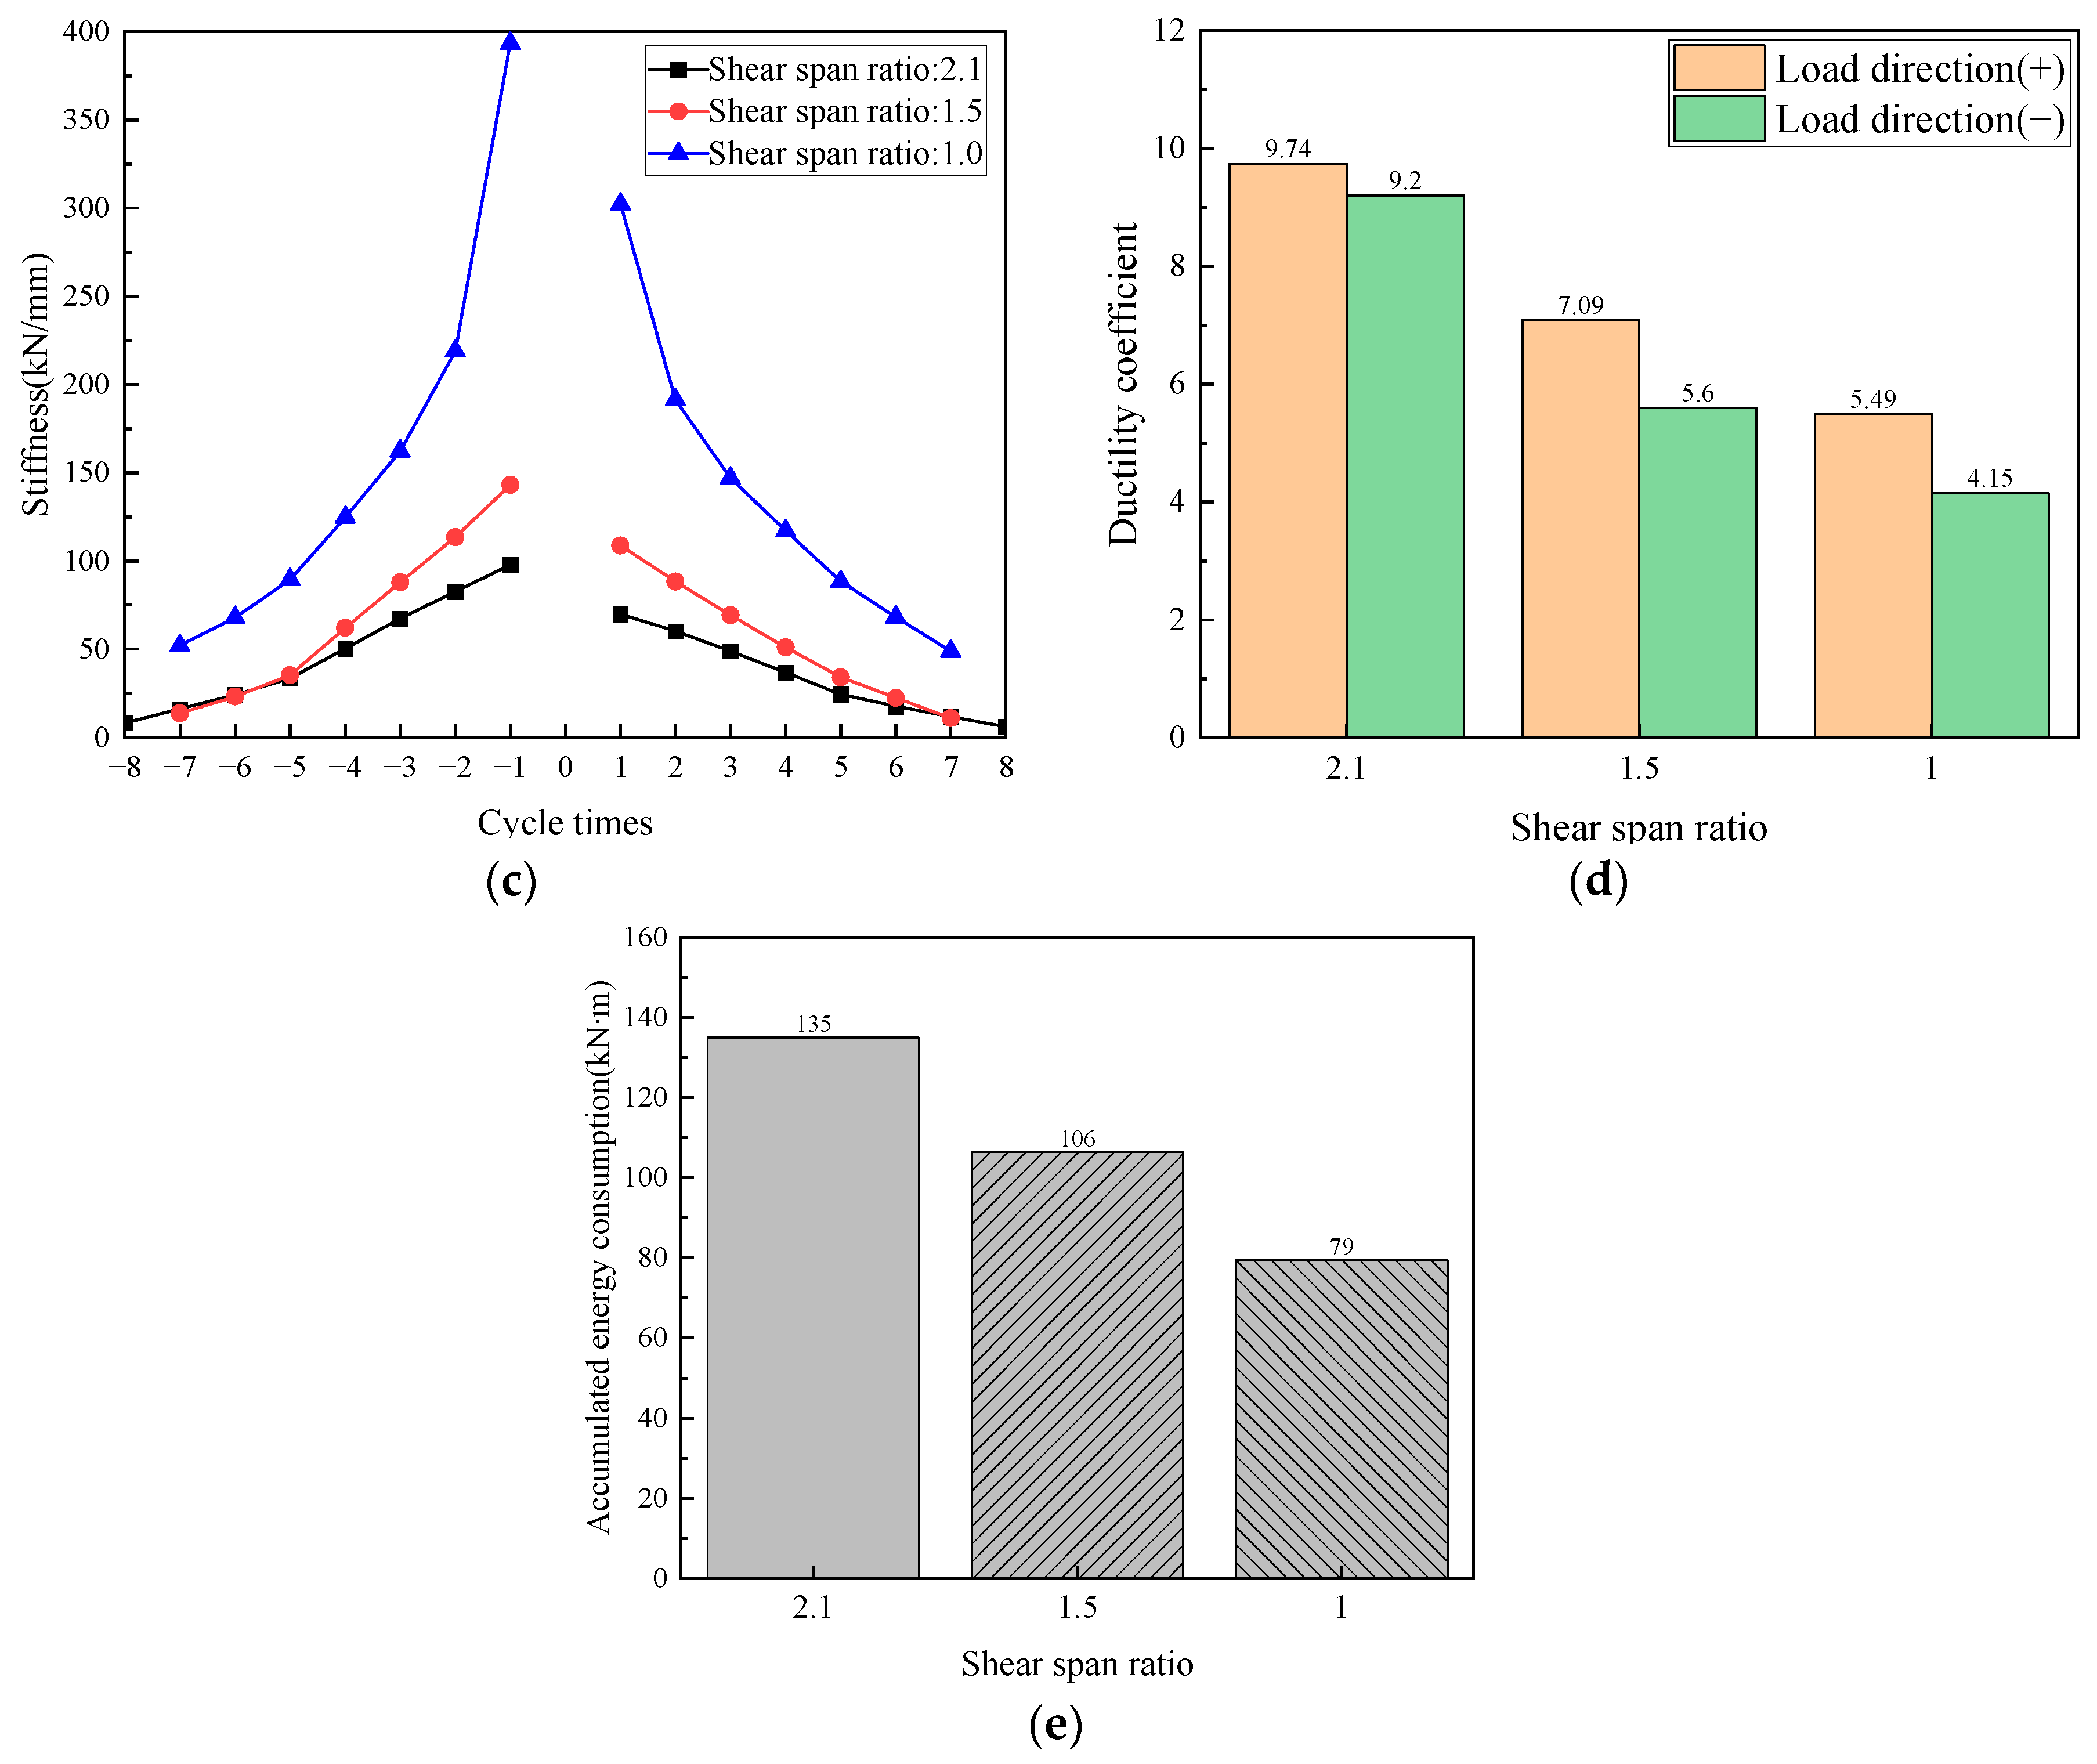
5.1. Effect of Shear Span Ratio

Three shear span ratios (2.1, 1.5, 1.0) were identified to study the effect of the shear span ratio on the seismic performance of the TSCCW. Figure 11 shows the effect of different shear span ratios on the results. It can be seen that as the shear span ratio decreases, the load carrying capacity and stiffness of the TSCCW increase significantly. When the shear span ratio decreases from 2.1 to 1.0, its positive and negative peak loads increase by 110% and 83%, respectively. Its positive and negative initial stiffness increased by 333% and 302%, respectively. However, reducing the shear span ratio will weaken the deformation capacity and energy dissipation capacity of the TSCCW. When the shear span ratio was reduced from 2.1 to 1.0, its ductility coefficients in the positive and negative directions decreased by 44% and 55%, respectively, and its cumulative energy consumption decreased by 41%.

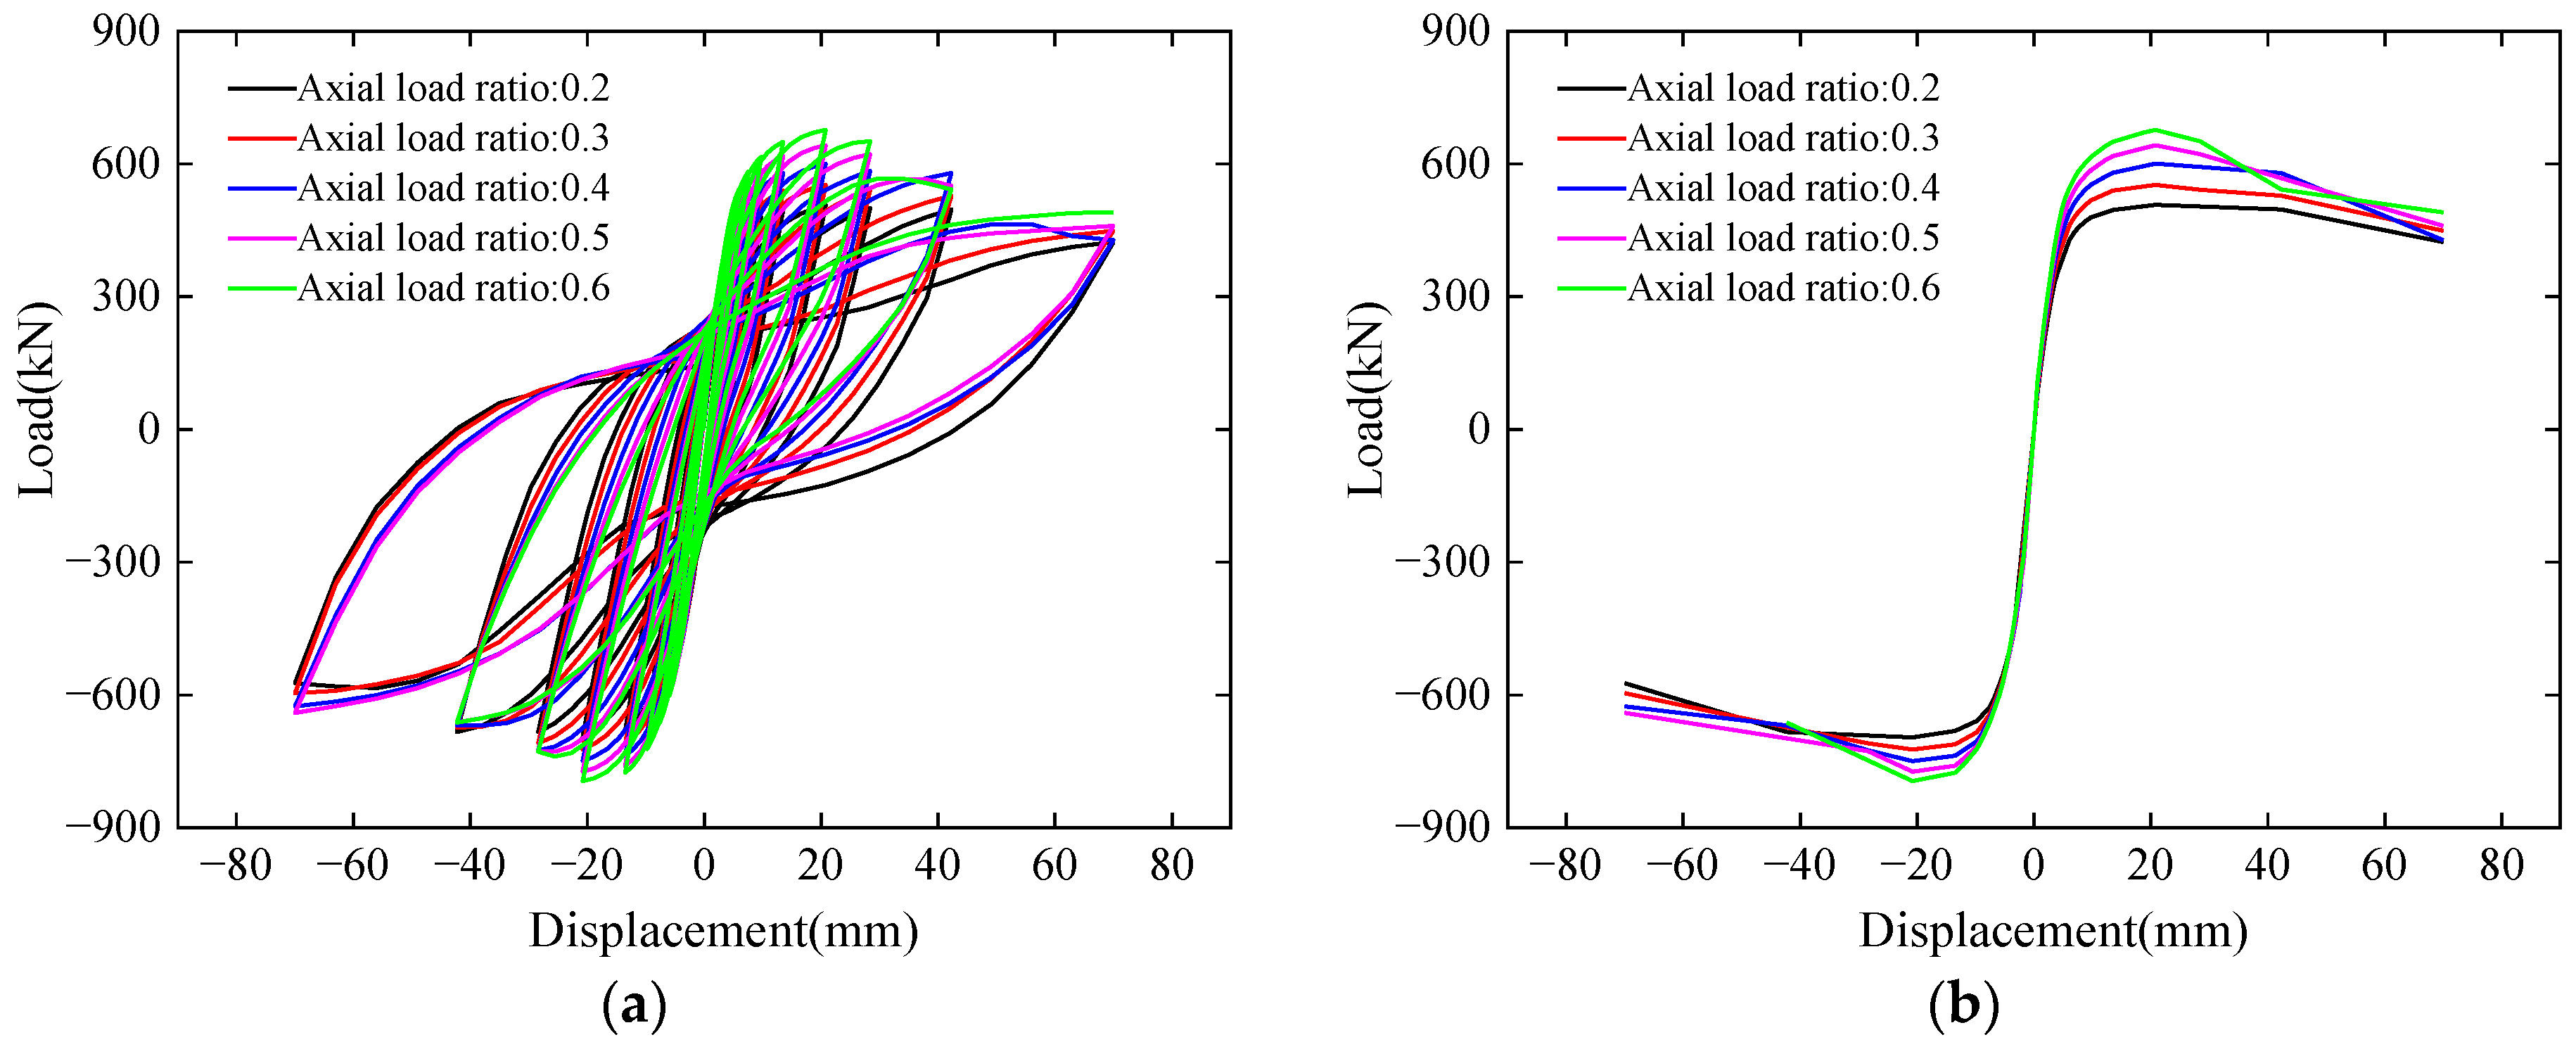
5.2. Effect of the Axial Load Ratio

Finite element models of the TSCCW with five axial load ratios of 0.2, 0.3, 0.6, 0.5 and 0.6 were developed for seismic performance studies. The results obtained from the calculation of each model are illustrated in Figure 12. The load carrying capacity and stiffness of the TSCCW increased with an increase in the axial load ratio. When the axial load ratio was increased from 0.2 to 0.6, the peak loads in the positive and negative directions of the TSCCW increased by 31% and 10%, respectively, and its initial stiffness in the positive and negative directions increased by 32% and 4%, respectively. Meanwhile, the ductility coefficient of the TSCCW increases and then decreases with an increasing axial load ratio, and the best deformability is achieved at an axial load ratio of 0.4. The cumulative energy consumption decreases slowly from an axial load ratio of 0.2 to 0.5, with only a 4% decrease in the axial load ratio from 0.2 to 0.5. However, the decrease increases to 42% when the axial pressure ratio reaches 0.6. Therefore, for the TSCCW, the axial load ratio can be increased appropriately, but the axial load ratio should not be too large. When the axial load ratio is 0.4, the TSCCW can obtain better performance.

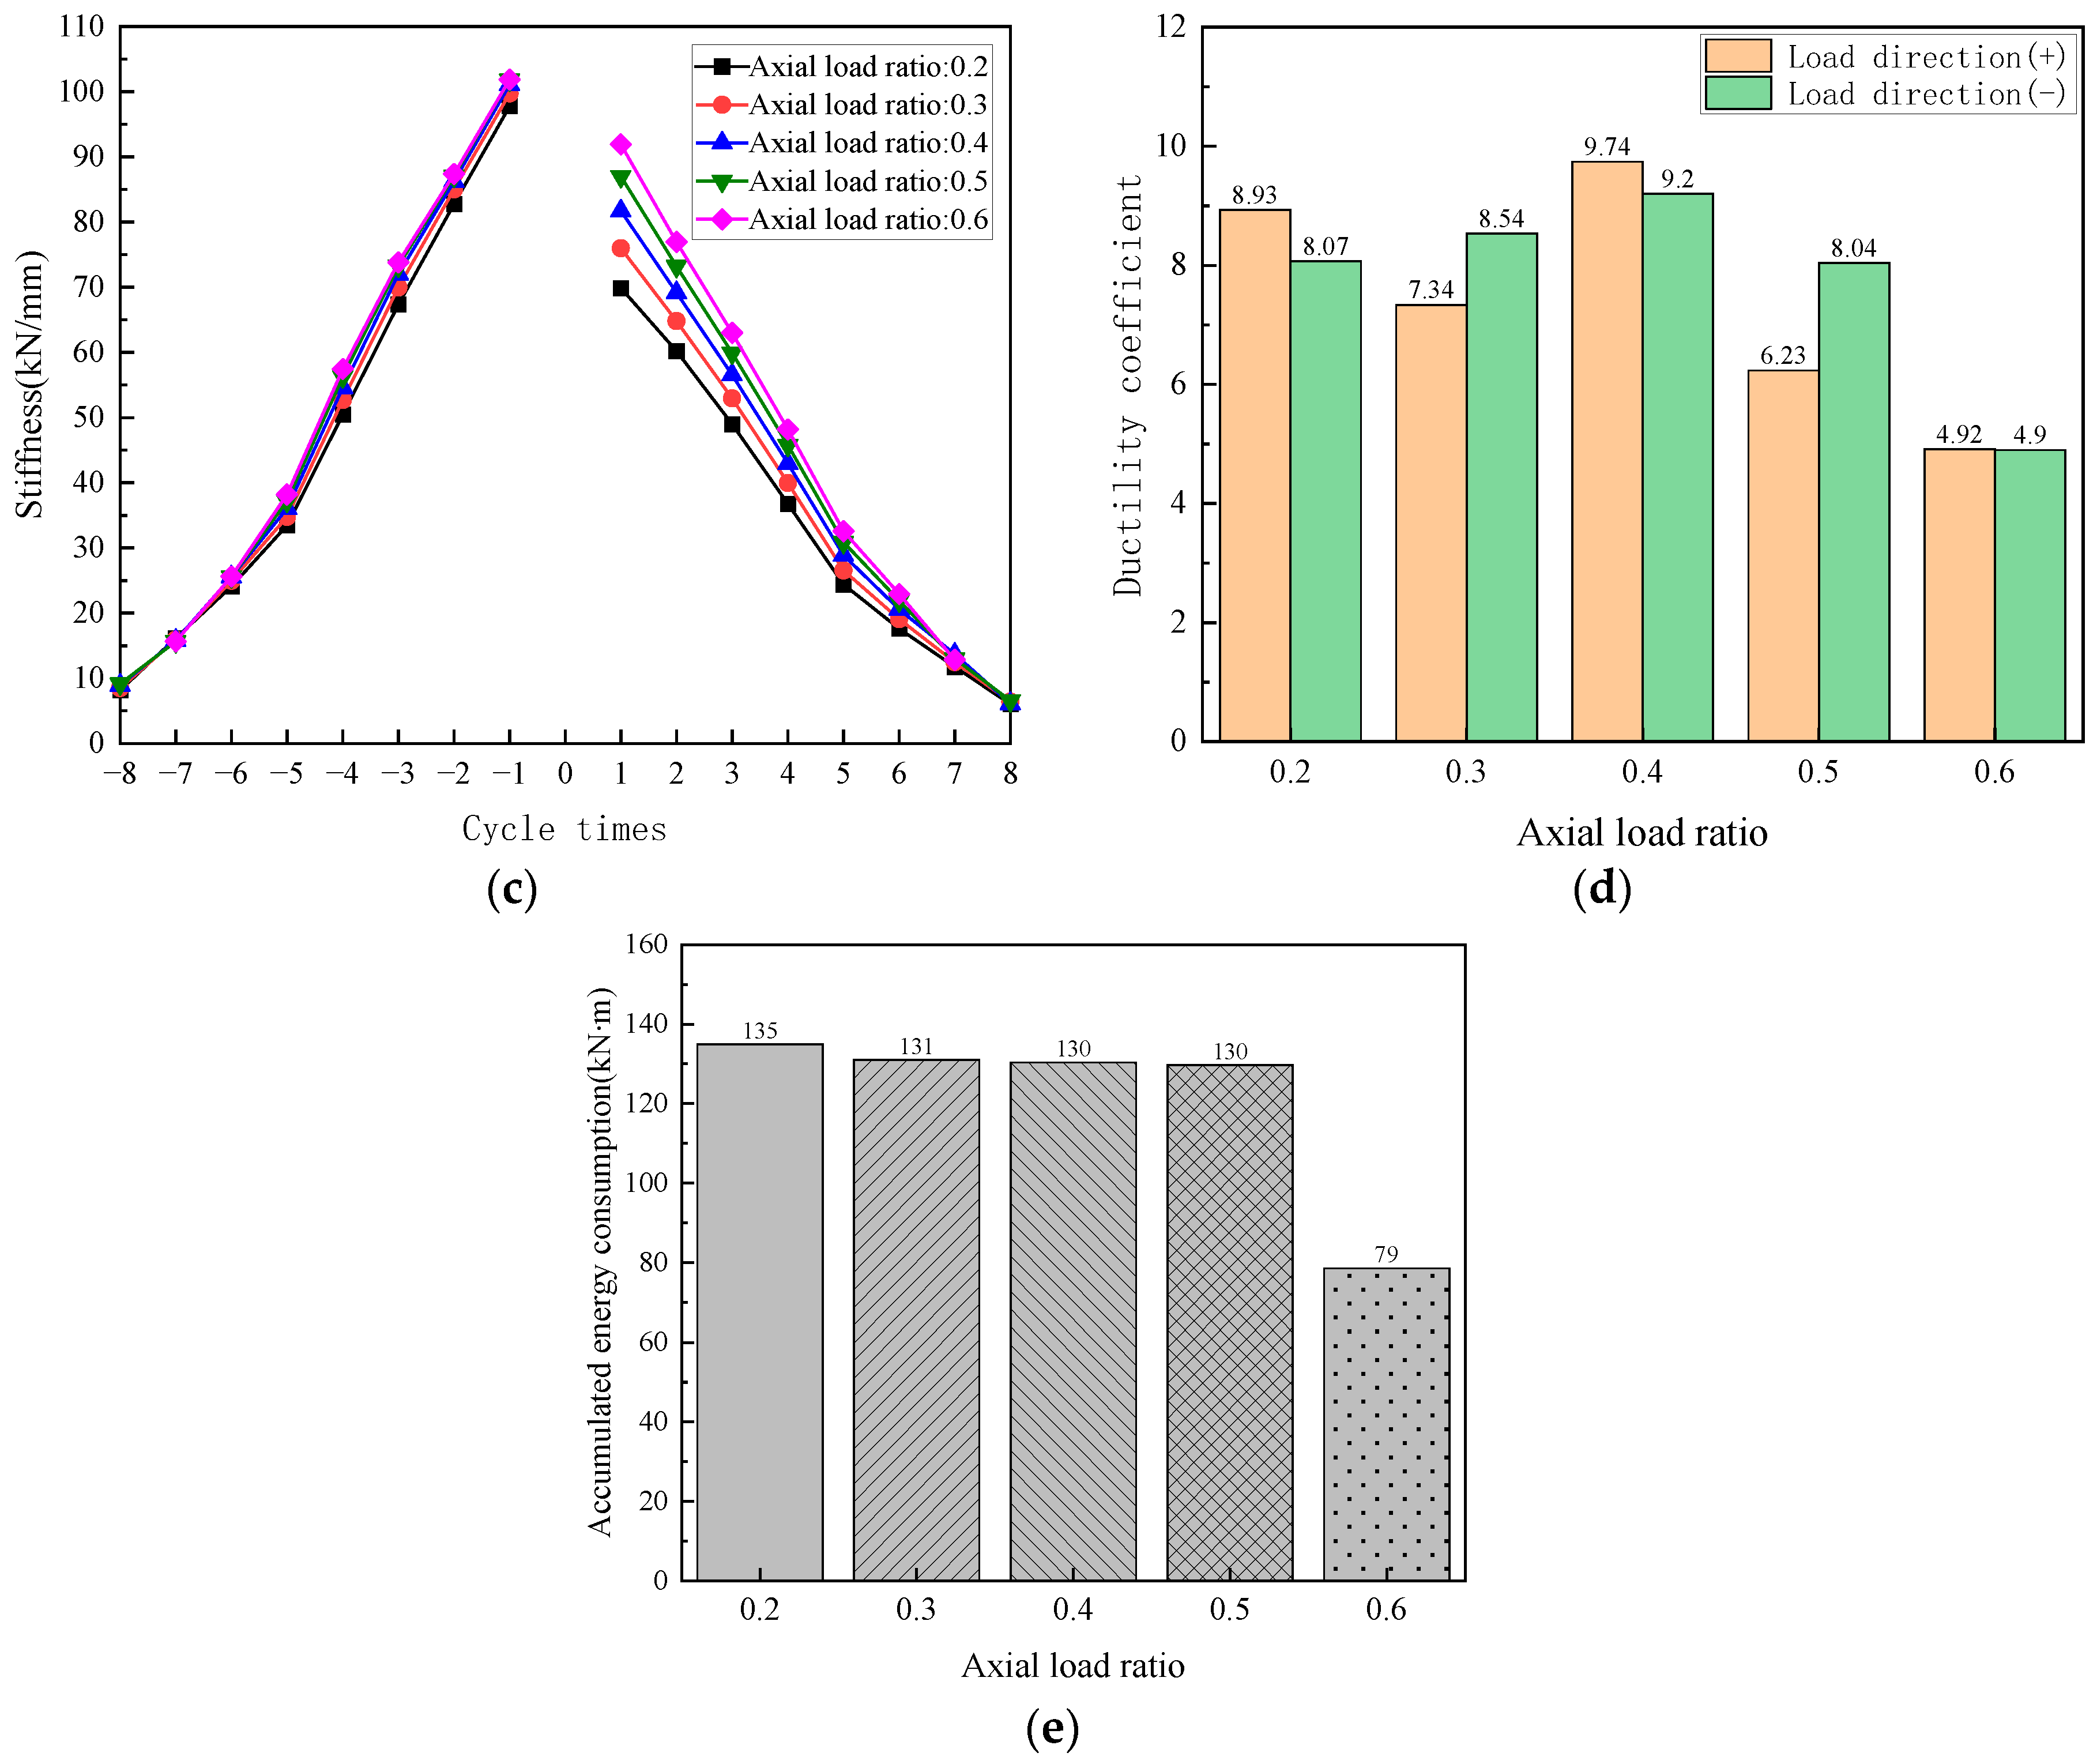
5.3. Effect of the Rebar Diameter

Changing the diameter of the reinforcement essentially changes the reinforcement ratio in the TSCCW. Five diameters of reinforcement, 4/6 mm, 6 mm, 6/8 mm, 8 m and 10 mm, were set for the longitudinal reinforcement and stirrup in the TSCCW model in this study. The results obtained are shown in Figure 13 and Figure 14. It can be seen that the load carrying capacity, deformation capacity and energy dissipation capacity of the TSCCW basically tend to increase with an increase in the reinforcement ratio, but the increase is small. When the longitudinal reinforcement diameter increases from 4/6 mm to 10 mm, the positive and negative peak loads increase by 5%, the positive and negative initial stiffness increases by less than 1%, the positive and negative ductility coefficients increase by 12% and 2%, respectively, and the cumulative energy dissipation increases by 8%. When the stirrup diameter was increased from 4/6 mm to 10 mm, the peak load in both the positive and negative directions increased by 2%, the initial stiffness in both the positive and negative directions increased by less than 1%, the ductility coefficients in the positive and negative directions increased by 16% and 11%, respectively, and the cumulative energy consumption increased by 5%.

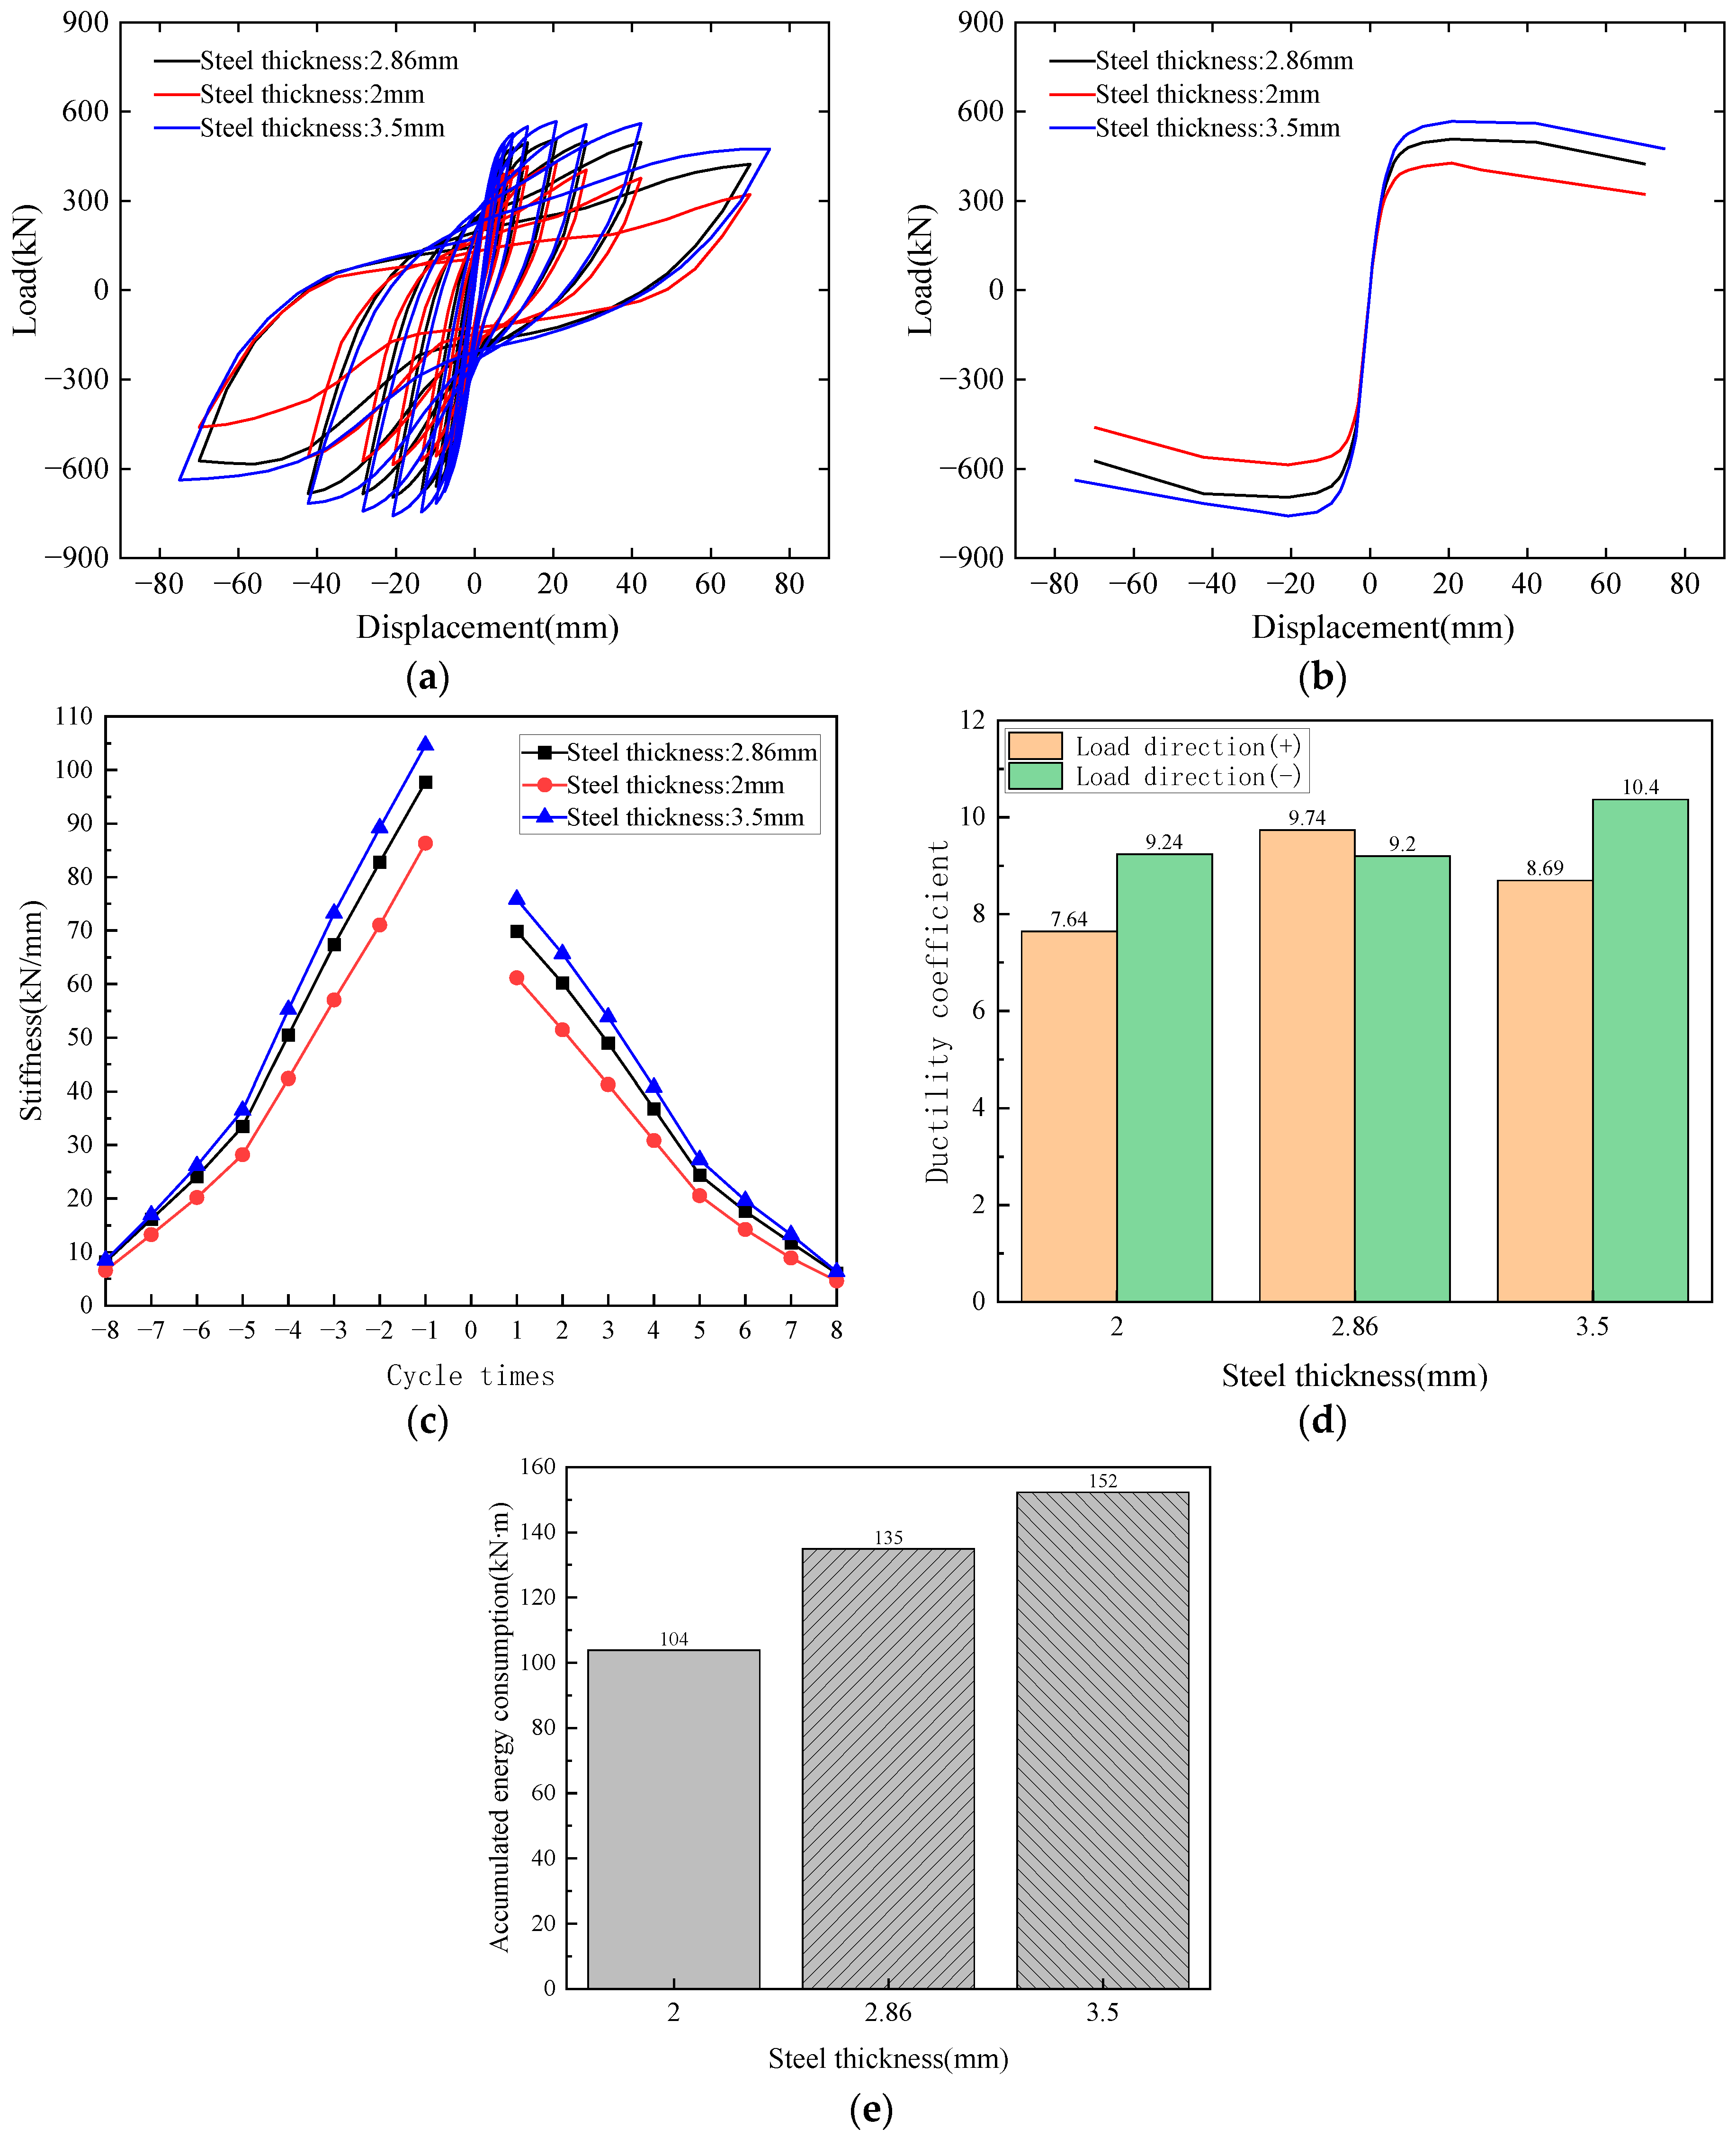
5.4. Effect of Steel Thickness

A parametric study was carried out on three thicknesses (2 mm, 2.86 mm and 3.5 mm) of the steel frame of the TSCCW. The obtained results are shown in Figure 15. It can be seen that increasing the steel thickness can effectively increase the load carrying capacity, stiffness, deformation capacity and energy dissipation capacity of the TSCCW. When the steel thickness is increased from 2 mm to 3.5 mm, the positive and negative peak loads are increased by 33% and 29%, the positive and negative initial stiffnesses are increased by 24% and 22%, the positive and negative ductility coefficients are increased by 27% and 7%, respectively, and the cumulative energy consumption is increased by 47%.

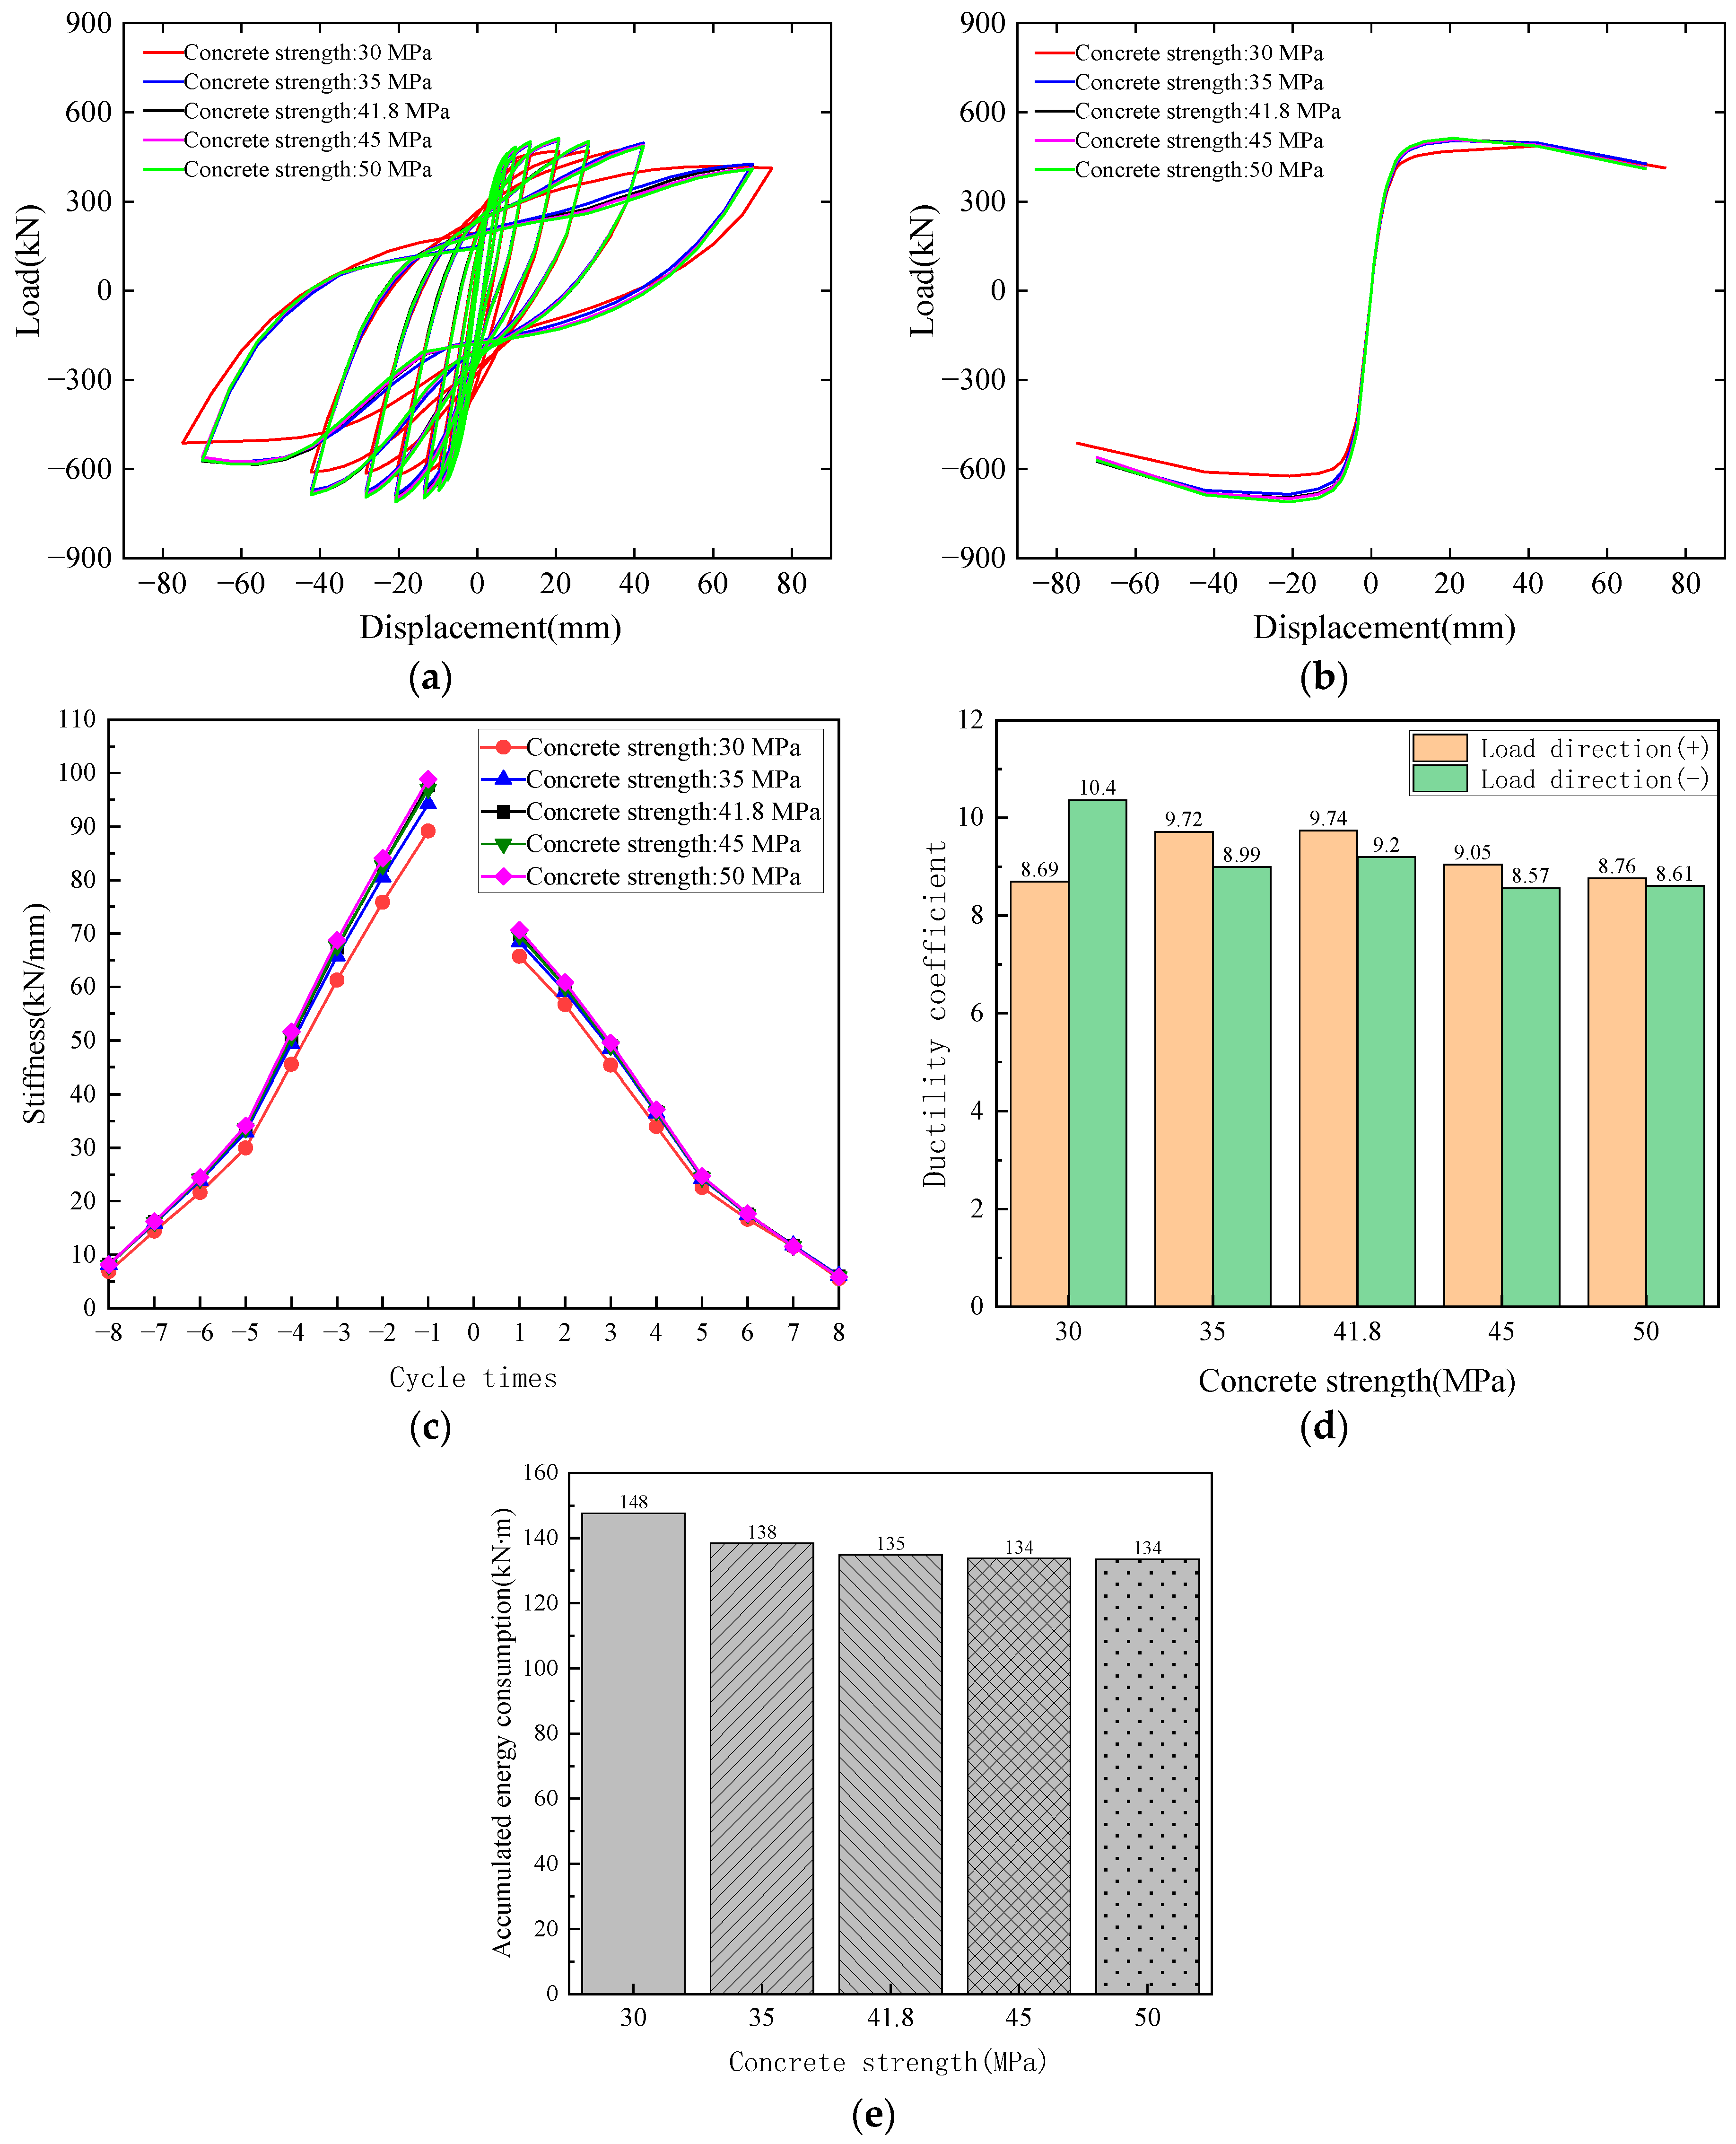
5.5. Effect of Concrete Strength Grade

A parametric study of the effect of the concrete strength on the seismic performance of the TSCCW was carried out. The results obtained are shown in Figure 16. It can be seen that an increase in the concrete grade generally increases the load carrying capacity and stiffness of the TSCCW but weakens its deformation capacity and energy dissipation capacity. However, the magnitude of the effects are not significant.

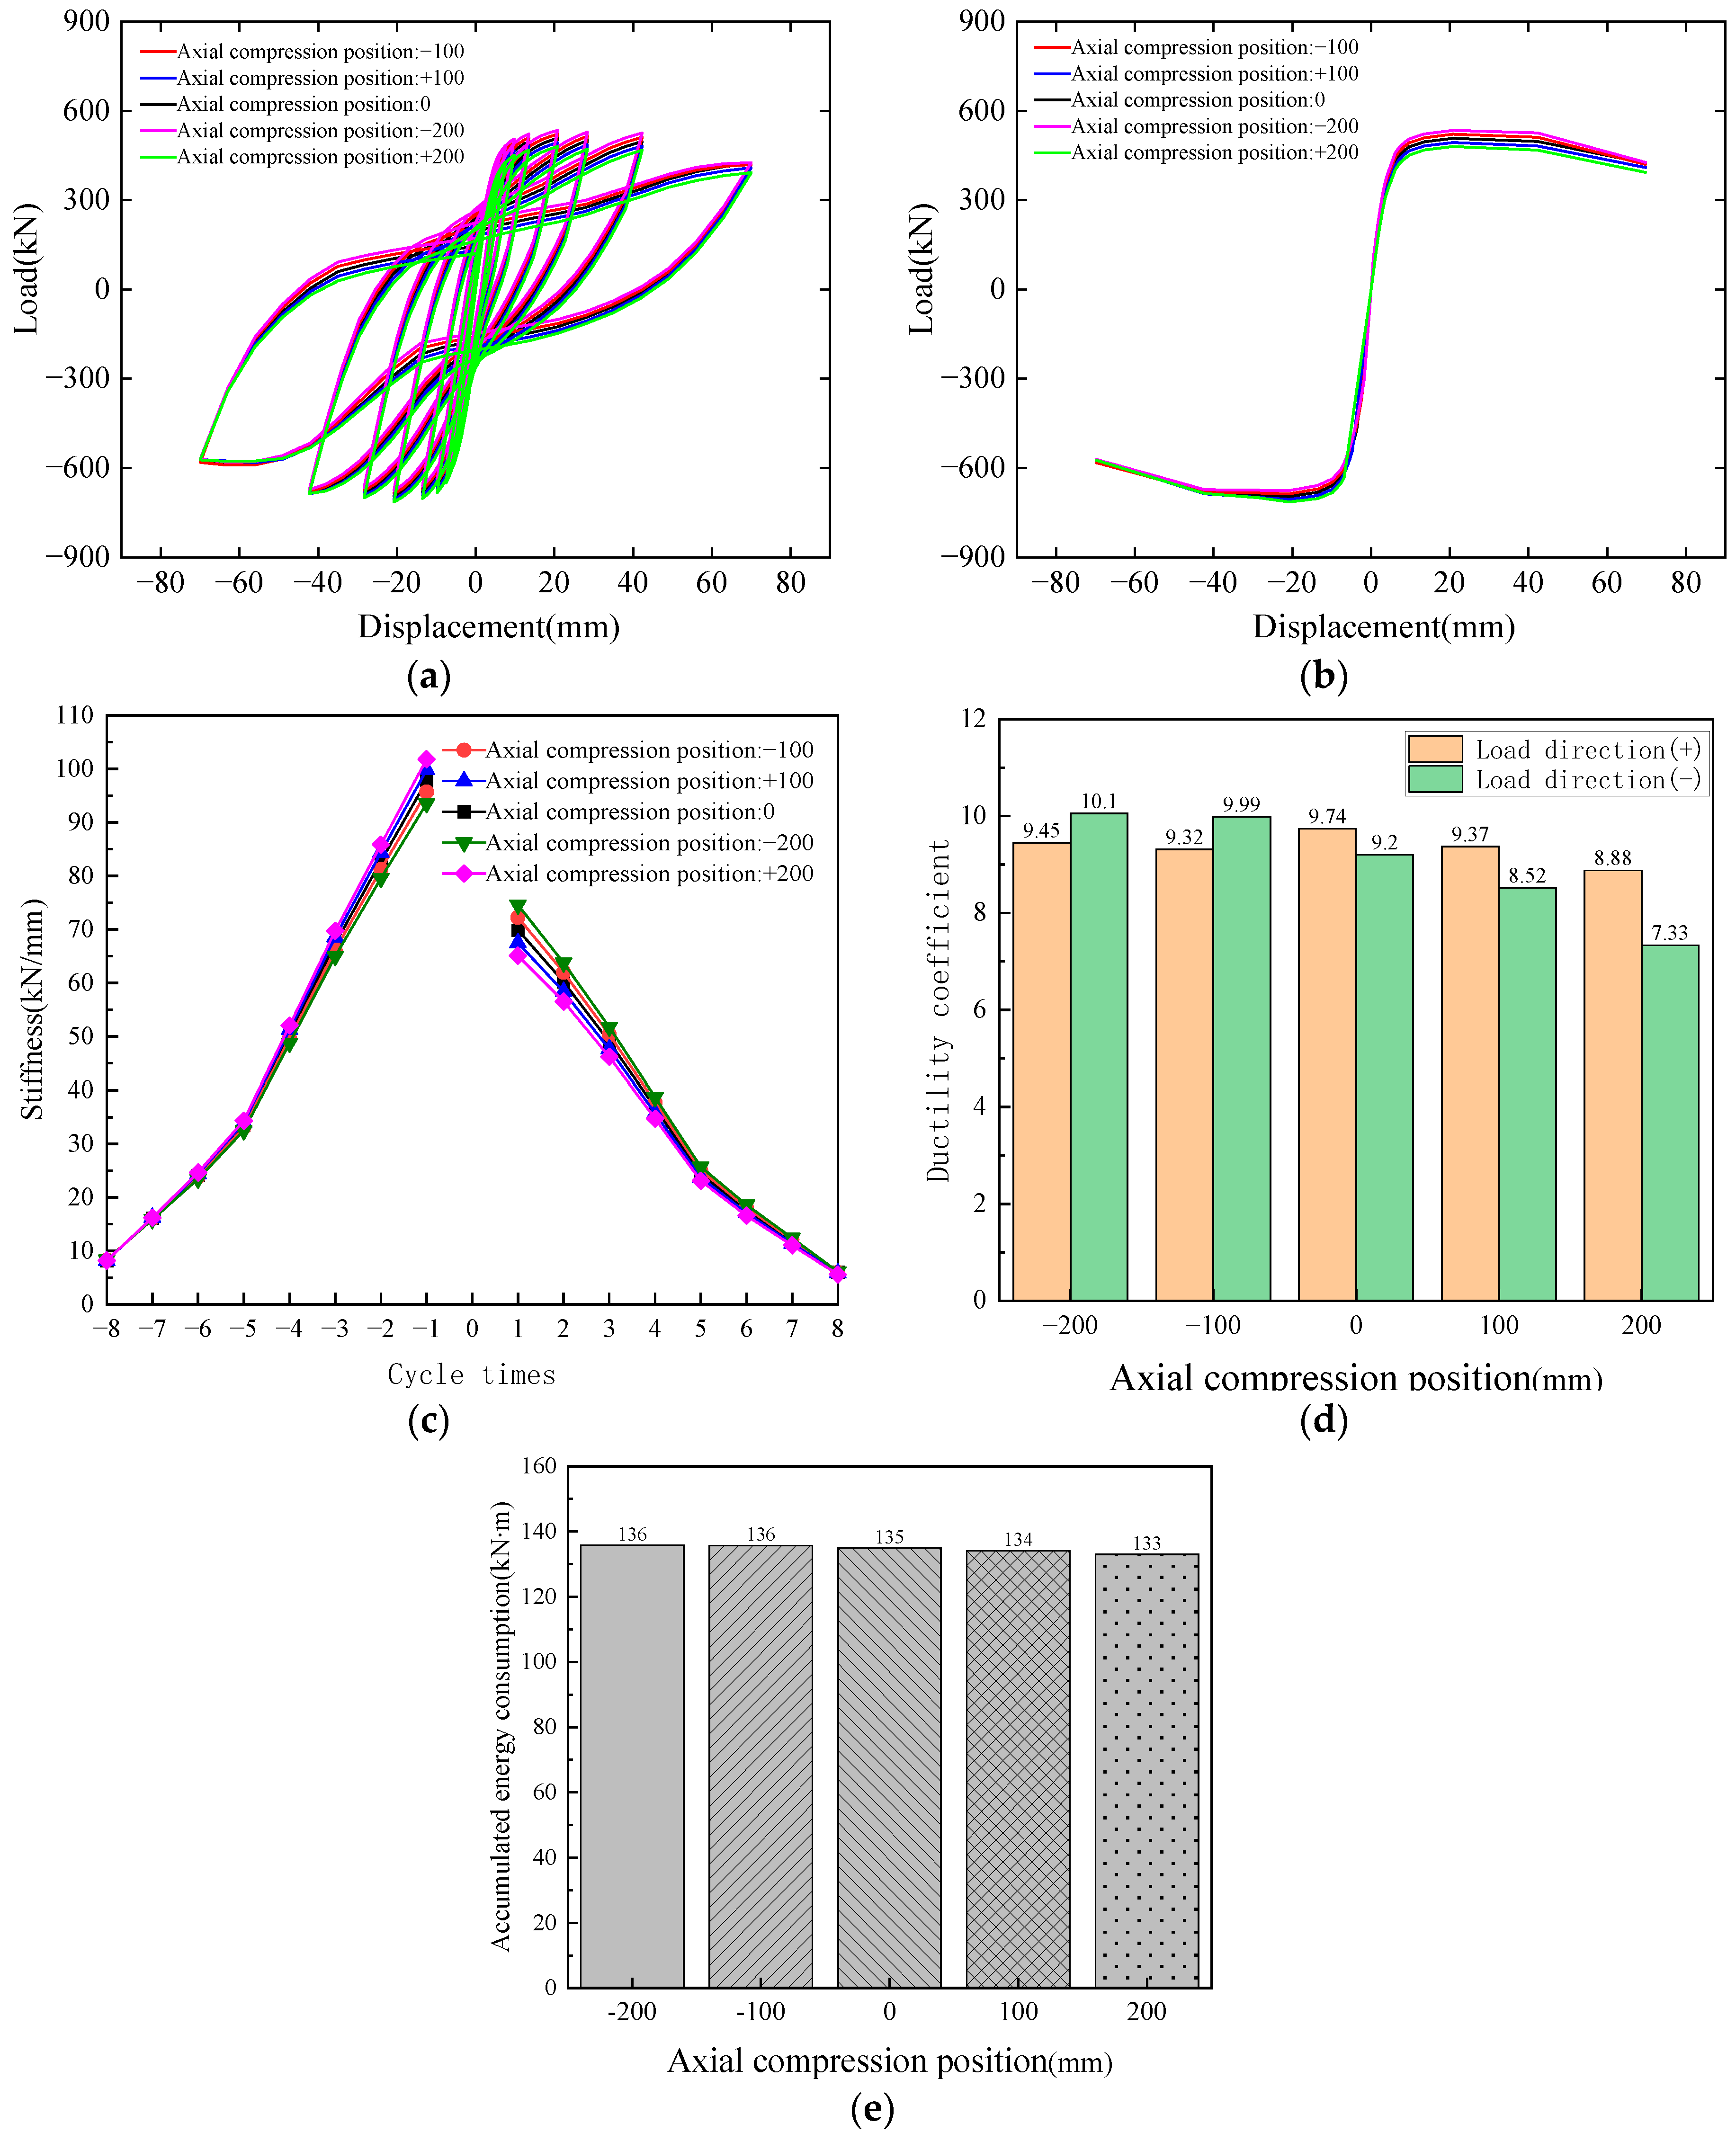
5.6. Effect of Axial Compression Position

The TSCCW is a T-shaped shear wall, and its vertical pressure is not necessarily at the axial position in the actual structure, which may affect the mechanical properties of the TSCCW when the axial pressure is offset. A total of five models are established to study the effect on seismic performance when the axial pressure position is 0 and is offset by 100 and 200 mm in the positive and negative directions, respectively. The obtained results are shown in Figure 17. It can be seen that when the axial pressure position is moved in the positive direction, the bearing capacity in the positive direction becomes smaller and the stiffness becomes smaller, but the bearing capacity and stiffness in the negative direction will increase. When the axial pressure position is moved in the negative direction, the load carrying capacity in the positive direction becomes smaller and the stiffness becomes larger, but the load carrying capacity and stiffness in the negative direction increase and decrease. However, the axial pressure position has little effect on the energy dissipation capacity of the TSCCW.

6. Conclusions

In this paper, an experimental study and numerical simulation of a novel TSCCW are carried out. The key parameters of the TSCCW are parametrically analyzed. The following conclusions can be drawn:
  • The experimental results show that the steel frame and RC wall deform synergistically when the TSCCW fails, and the steel frame surpasses the yield and provides energy dissipation for the TSCCW. Meanwhile, the TSCCW has a good deformation ability and energy dissipation ability, and its drift ratio reaches 1/30 rad when it fails.
  • A finite element model was established based on the test specimen. The finite element model agrees well with the test results. The maximum error of the key data is within 10%.
  • The parametric analysis revealed that changes in the diameter of reinforcement have a minimal impact on the seismic performance of the TSCCW, whereas variations in the shear span ratio significantly affect the seismic performance of the TSCCW. Reducing the shear span ratio will greatly increase the load carrying capacity and stiffness of the specimen, but at the same time, it will weaken the deformation and energy dissipation capacity of the TSCCW.
  • An increase in the axial load ratio increases the load carrying capacity and stiffness of the TSCCW. However, the deformation capacity increases first and then decreases. The axial load ratio can be increased appropriately, but it should not be too large. It is suggested that the TSCCW can obtain better performance when the axial pressure ratio is 0.4.
  • Increasing the steel thickness can improve the load carrying capacity, stiffness, deformation capacity and energy consumption capacity of the TSCCW to a certain extent.
  • When the axial pressure position moves in the positive direction, the positive load carrying capacity becomes smaller and the stiffness becomes smaller, but the negative load carrying capacity and stiffness will increase. The opposite is true when the axial pressure position moves in the negative direction.

Author Contributions

Methodology, X.M., Y.J. and X.W.; Software, Y.J.; Validation, L.L.; Data curation, L.L.; Writing—original draft, X.M. and N.K.; Writing—review & editing, X.W.; Visualization, N.K.; Supervision, Z.Y.; Funding acquisition, Z.Y. All authors have read and agreed to the published version of the manuscript.

Funding

This research received no external funding.

Data Availability Statement

The original contributions presented in the study are included in the article, further inquiries can be directed to the corresponding authors.

Conflicts of Interest

The authors declare no conflict of interest.

References

  1. Lu, X.; Yang, J. Seismic behavior of T-shaped steel reinforced concrete shear walls in tall buildings under cyclic loading. Struct. Des. Tall Spec. Build. 2015, 24, 141–157. [Google Scholar] [CrossRef]
  2. Qiao, W.-T.; Liu, H.-W.; Zhang, X.; Wang, D.; Tian, W.-Y. Experimental study on seismic behavior of dense-steel-column sandwich wall. J. Constr. Steel Res. 2022, 190, 107162. [Google Scholar] [CrossRef]
  3. Wang, W.; Yang, Q.; Deng, X.; Ou, Y.; Jiang, X. Experimental and numerical study on seismic behavior of special shaped steel truss and concrete composite shear wall. Eng. Struct. 2024, 300, 117237. [Google Scholar] [CrossRef]
  4. Gu, Q.; Zhao, D.; Li, J.; Peng, B.; Deng, Q.; Tian, S. Seismic performance of T-shaped precast concrete superposed shear walls with cast-in-place boundary columns and special boundary elements. J. Build. Eng. 2022, 45, 103503. [Google Scholar] [CrossRef]
  5. Ma, J.; Zhang, Z.; Li, B. Experimental Assessment of T-Shaped Reinforced Concrete Squat Walls. Aci Struct. J. 2018, 115, 621–634. [Google Scholar] [CrossRef]
  6. Zhang, P.-L.; Li, Q.-n. Cyclic loading test of T-shaped mid-rise shear wall. Struct. Des. Tall Spec. Build. 2013, 22, 759–769. [Google Scholar] [CrossRef]
  7. Ke, X.-j.; Qin, Y.; Chen, S.-j.; Li, N. Seismic performance and shear lag effect of T-shaped steel plate reinforced concrete composite shear wall. Eng. Struct. 2023, 289, 116303. [Google Scholar] [CrossRef]
  8. Guo, D.; Feng, H.; Li, Z.; Liu, J. Study on the Ductility of T-Shaped Short-Limb Shear Walls(I). Appl. Mech. Mater. 2012, 238, 631–634. [Google Scholar] [CrossRef]
  9. Wang, B.; Wu, M.-Z.; Zhang, L.-P.; Cai, W.-Z.; Shi, Q.-X. Seismic behavior and shear capacity of shear-dominated T-shaped RC walls under cyclic loading. Structures 2023, 55, 557–569. [Google Scholar] [CrossRef]
  10. Smyrou, E.; Sullivan, T.; Priestley, N.; Calvi, M. Sectional response of T-shaped RC walls. Bull. Earthq. Eng. 2013, 11, 999–1019. [Google Scholar] [CrossRef]
  11. Ni, X.; Lu, N. Cyclic Tests on T-shaped Concrete Walls Built with High-strength Reinforcement. J. Earthq. Eng. 2022, 26, 5721–5746. [Google Scholar] [CrossRef]
  12. Chen, Z.; Xu, J.; Chen, Y.; Su, Y. Seismic behavior of T-shaped steel reinforced high strength concrete short-limb shear walls under low cyclic reversed loading. Struct. Eng. Mech. 2016, 57, 681–701. [Google Scholar] [CrossRef]
  13. Thomsen, J.H.; Wallace, J.W. Displacement-based design of slender reinforced concrete structural walls-experimental verification. J. Struct. Eng. 2004, 130, 618–630. [Google Scholar] [CrossRef]
  14. Ji, X.; Liu, D.; Qian, J. Improved design of special boundary elements for T-shaped reinforced concrete walls. Earthq. Eng. Eng. Vib. 2017, 16, 83–95. [Google Scholar] [CrossRef]
  15. Brueggen, B.L.; French, C.E.; Sritharan, S. T-Shaped RC Structural Walls Subjected to Multidirectional Loading: Test Results and Design Recommendations. J. Struct. Eng. 2017, 143, 04017040. [Google Scholar] [CrossRef]
  16. Shen, S.-D.; Pan, P.; He, Z.-Z.; Xiao, G.-Q.; Ren, J.-Y. Experimental study and finite element analysis of T-shaped precast shear walls with H-shaped shear keys. Earthq. Eng. Struct. Dyn. 2022, 51, 1158–1179. [Google Scholar] [CrossRef]
  17. Liu, X.-H.; Zheng, S.-S.; Wang, W.; Liu, H.; Zheng, Y.; Zheng, H. Experimental study on the seismic behaviour of a corroded T-shaped RC shear wall. J. Build. Eng. 2023, 76, 107071. [Google Scholar] [CrossRef]
  18. Zhang, Z.; Li, B. Seismic Performance Assessment of Slender T-Shaped Reinforced Concrete Walls. J. Earthq. Eng. 2016, 20, 1342–1369. [Google Scholar] [CrossRef]
  19. Wang, B.; Wu, M.-Z.; Shi, Q.-X.; Cai, W.-Z. Effects of biaxial loading path on seismic behavior of T-shaped RC walls. Eng. Struct. 2022, 273, 115080. [Google Scholar] [CrossRef]
  20. Shu, X.-P.; Yan, S.; Li, Y.; Lu, B.-R. Strength design of T-shaped stainless steel core plate wall under axial compression. J. Constr. Steel Res. 2021, 186, 106891. [Google Scholar] [CrossRef]
  21. Lim, W.Y.; Hong, S.-G. Seismic Performance of T-Shaped PC Walls with Wet Cast Joint. J. Korea Concr. Inst. 2014, 26, 255–266. [Google Scholar] [CrossRef]
  22. Ji, X.; Sun, L.; Wang, S.; Kolozvari, K. Seismic behavior and modeling of T-shaped reinforced concrete walls under high axial force ratios. Earthq. Eng. Struct. Dyn. 2024, 53, 1085–1106. [Google Scholar] [CrossRef]
  23. Ni, X.; Cao, S.; Aoude, H. Seismic performance of concrete walls reinforced by high-strength bars: Cyclic loading test and numerical simulation. Can. J. Civ. Eng. 2021, 48, 1481–1495. [Google Scholar] [CrossRef]
  24. Cho, I.H.; Porter, K.A. Structure-Independent Parallel Platform for Nonlinear Analyses of General Real-Scale RC Structures under Cyclic Loading. J. Struct. Eng. 2014, 140, A4013001. [Google Scholar] [CrossRef]
  25. Kolozvari, K.; Gullu, M.F.; Orakcal, K. Finite Element Modeling of Reinforced Concrete Walls Under Uni- and Multi-Directional Loading Using Opensees. J. Earthq. Eng. 2022, 26, 6524–6547. [Google Scholar] [CrossRef]
  26. Eom, T.-S.; Nam, H.-S.; Kang, S.-M. Biaxial Interaction and Load Contour Method of Reinforced Concrete T-Shaped Structural Walls. Aci Struct. J. 2018, 115, 151–161. [Google Scholar] [CrossRef]
  27. GB/T 2975-2018; Steel and Steel Products-Location and Preparation of Samples and Test Pieces for Mechanical Testing. Standards Press of China: Beijing, China, 2018. (In Chinese)
  28. GB/T 50081-2019; Test Standards and Methods for Mechanical Properties of Normal Concrete. China Architecture and Building Press: Beijing, China, 2019. (In Chinese)
  29. JGJ 101-96; Specification of Testing Methods for Earthquake Resistant Building. China Construction Industry Press: Beijing, China, 1997. (In Chinese)
  30. Dassault Systèmes Simulia Corp. Abaqus 2019 Analysis User’s Manual; Dassault Systèmes Simulia Corp.: Providence, RI, USA, 2019. [Google Scholar]
Figure 1. Details of specimen TSCCW.
Buildings 14 02148 g001
Figure 2. Test setup.
Buildings 14 02148 g002
Figure 3. Loading process.
Buildings 14 02148 g003
Figure 4. Specimen area division.
Buildings 14 02148 g004
Figure 5. Failure process of specimen.
Buildings 14 02148 g005aBuildings 14 02148 g005b
Figure 6. Hysteresis and skeleton curves of specimen. (a) Hysteresis curve; (b) skeleton curve.
Buildings 14 02148 g006
Figure 7. Finite element model of TSCCW.
Buildings 14 02148 g007
Figure 8. Boundary and load conditions of the model.
Buildings 14 02148 g008
Figure 9. Comparison of failure behaviors (experimental vs. FEM). (a) experiment (Front view); (b) FEM (front view); (c) experiment (side view) (d) FEM (side view); (e) experiment (corner of steel frame); (f) FEM (corner of steel frame).
Buildings 14 02148 g009aBuildings 14 02148 g009b
Figure 10. Comparison of hysteresis curve between experiment and FEM.
Buildings 14 02148 g010
Figure 11. Effect of shear span ratio on mechanical properties of TSCCW. (a) Hysteresis curves; (b) skeleton curves; (c) stiffness degradation; (d) ductility coefficient; (e) accumulated energy consumption.
Buildings 14 02148 g011aBuildings 14 02148 g011b
Figure 12. Effect of axial load ratio on mechanical properties of TSCCW. (a) Hysteresis curves; (b) skeleton curves; (c) stiffness degradation; (d) ductility coefficient; (e) accumulated energy consumption.
Buildings 14 02148 g012aBuildings 14 02148 g012b
Figure 13. Effect of longitudinal rebar diameter on mechanical properties of TSCCW. (a) Hysteresis curves; (b) skeleton curves; (c) stiffness degradation; (d) ductility coefficient; (e) accumulated energy consumption.
Buildings 14 02148 g013
Figure 14. Effect of stirrup diameter on mechanical properties of TSCCW. (a) Hysteresis curves; (b) skeleton curves; (c) stiffness degradation; (d) ductility coefficient; (e) accumulated energy consumption.
Buildings 14 02148 g014
Figure 15. Effect of steel thickness on mechanical properties of TSCCW. (a) Hysteresis curves; (b) skeleton curves; (c) stiffness degradation; (d) ductility coefficient; (e) accumulated energy consumption.
Buildings 14 02148 g015
Figure 16. Effect of concrete strength grade on mechanical properties of TSCCW. (a) Hysteresis curves; (b) skeleton curves; (c) stiffness degradation; (d) ductility coefficient; (e) accumulated energy consumption.
Buildings 14 02148 g016
Figure 17. Effect of axial compression position on mechanical properties of TSCCW. (a) Hysteresis curves; (b) skeleton curves; (c) stiffness degradation; (d) ductility coefficient; (e) accumulated energy consumption.
Buildings 14 02148 g017
Table 1. Mechanical properties of steel.
Steel TypeThickness or Diameter
(mm)
Yield Strength
(MPa)
Ultimate Strength
(MPa)
Elastic Modulus
(MPa)
Steel plate (Q235)2.86279419201,125
Steel bar (HRB400)8416604193,587
Table 2. Experimental data.
SpecimenLoading DirectionAxial Load RatioYield PointPeak PointDuctility CoefficientInitial Stiffness
(kN/mm)
Displacement
(mm)
Load
(kN)
Displacement
(mm)
Load
(kN)
TSCCW(+)0.26.78438.7619.7492.419.6577.43
(−)7.13572.2226.8684.69.02102.1
Table 3. Summary of experimental and FEM results.
VerificationsLoading DirectionYield LoadPeak LoadInitial Stiffness
EXPFEMEXPFEMEXPFEM
Results(+)438.76 445.35 492.41 507.73 77.43 69.88
(−)572.22 615.44 684.60 696.17 102.10 97.76
Error:(EXP-FEM)/EXP(+)0.01 0.03 0.10
(−)0.08 0.02 0.04
Table 4. Determined parameters for numerical analysis.
ModelParameter
Shear Span RatioAxial Load RatioDiameter of Longitudinal Rebar/mmStirrup Diameter/mmThickness of Steel/mmConcrete Strength/MPaAxial Compression Position/mm
Original model2.10.2882.8641.80
1–21.5, 10.2862.8641.80
3–62.10.3, 0.4,
0.5, 0.6
862.8641.80
7–102.10.24/6, 6,
6/8, 10
62.8641.80
11–142.10.284/6, 6,
6/8, 10
2.8641.80
15–162.10.2862, 3.541.80
17–202.10.2862.8630, 35
45, 50
0
21–242.10.2862.8641.8−100, +100
−200, +200
Disclaimer/Publisher’s Note: The statements, opinions and data contained in all publications are solely those of the individual author(s) and contributor(s) and not of MDPI and/or the editor(s). MDPI and/or the editor(s) disclaim responsibility for any injury to people or property resulting from any ideas, methods, instructions or products referred to in the content.

