
Predicting Land Use Changes under Shared Socioeconomic Pathway–Representative Concentration Pathway Scenarios to Support Sustainable Planning in High-Density Urban Areas: A Case Study of Hangzhou, Southeastern China
 , , , and
Abstract
:1. Introduction
2. Study Area and Data
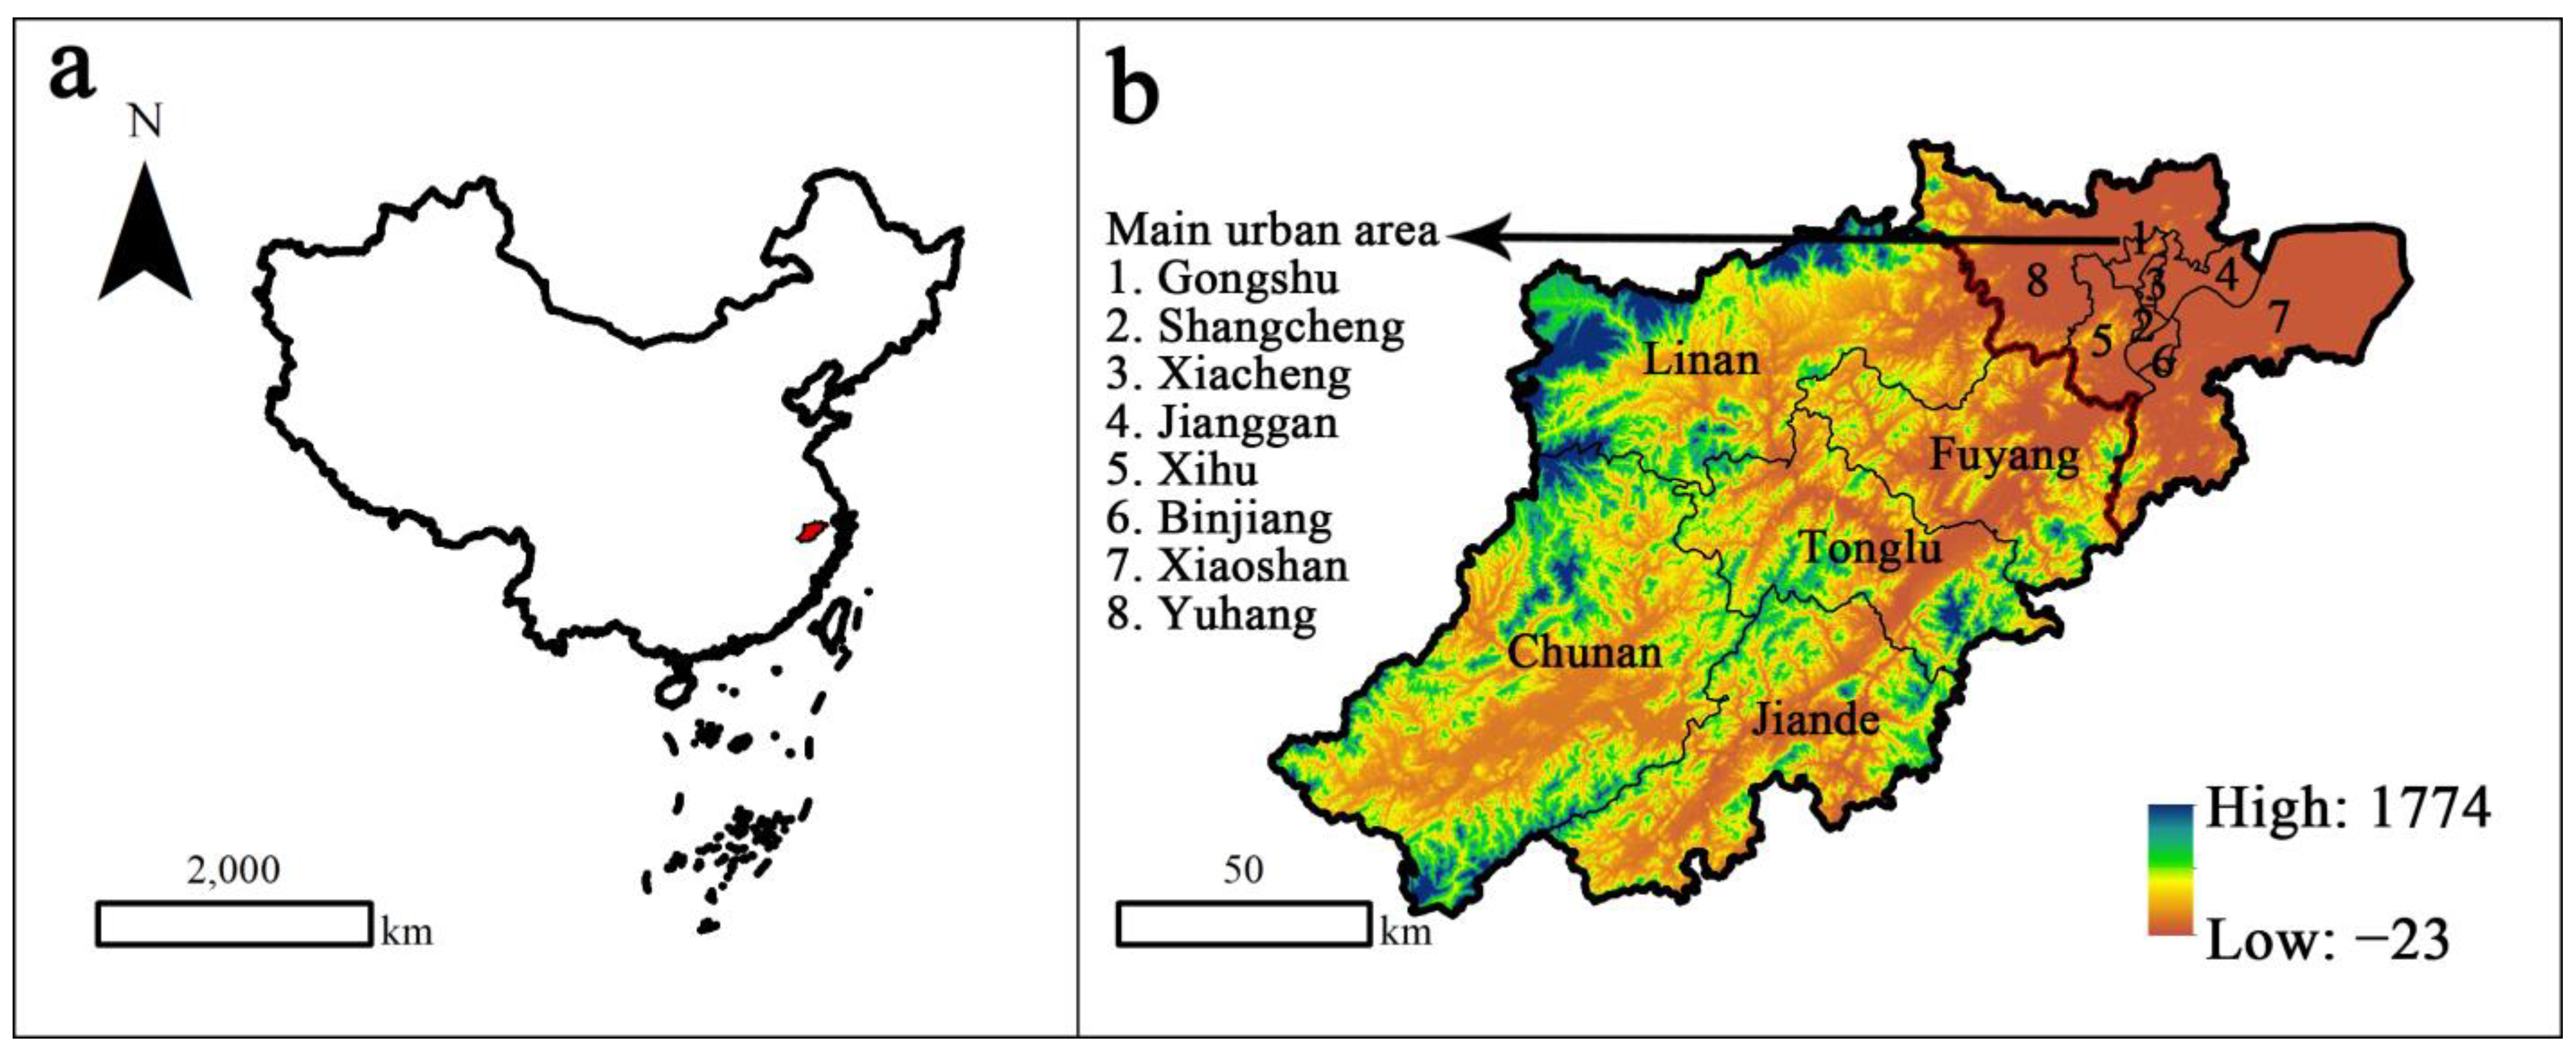
2.1. Study Area
2.2. Data
3. Methods
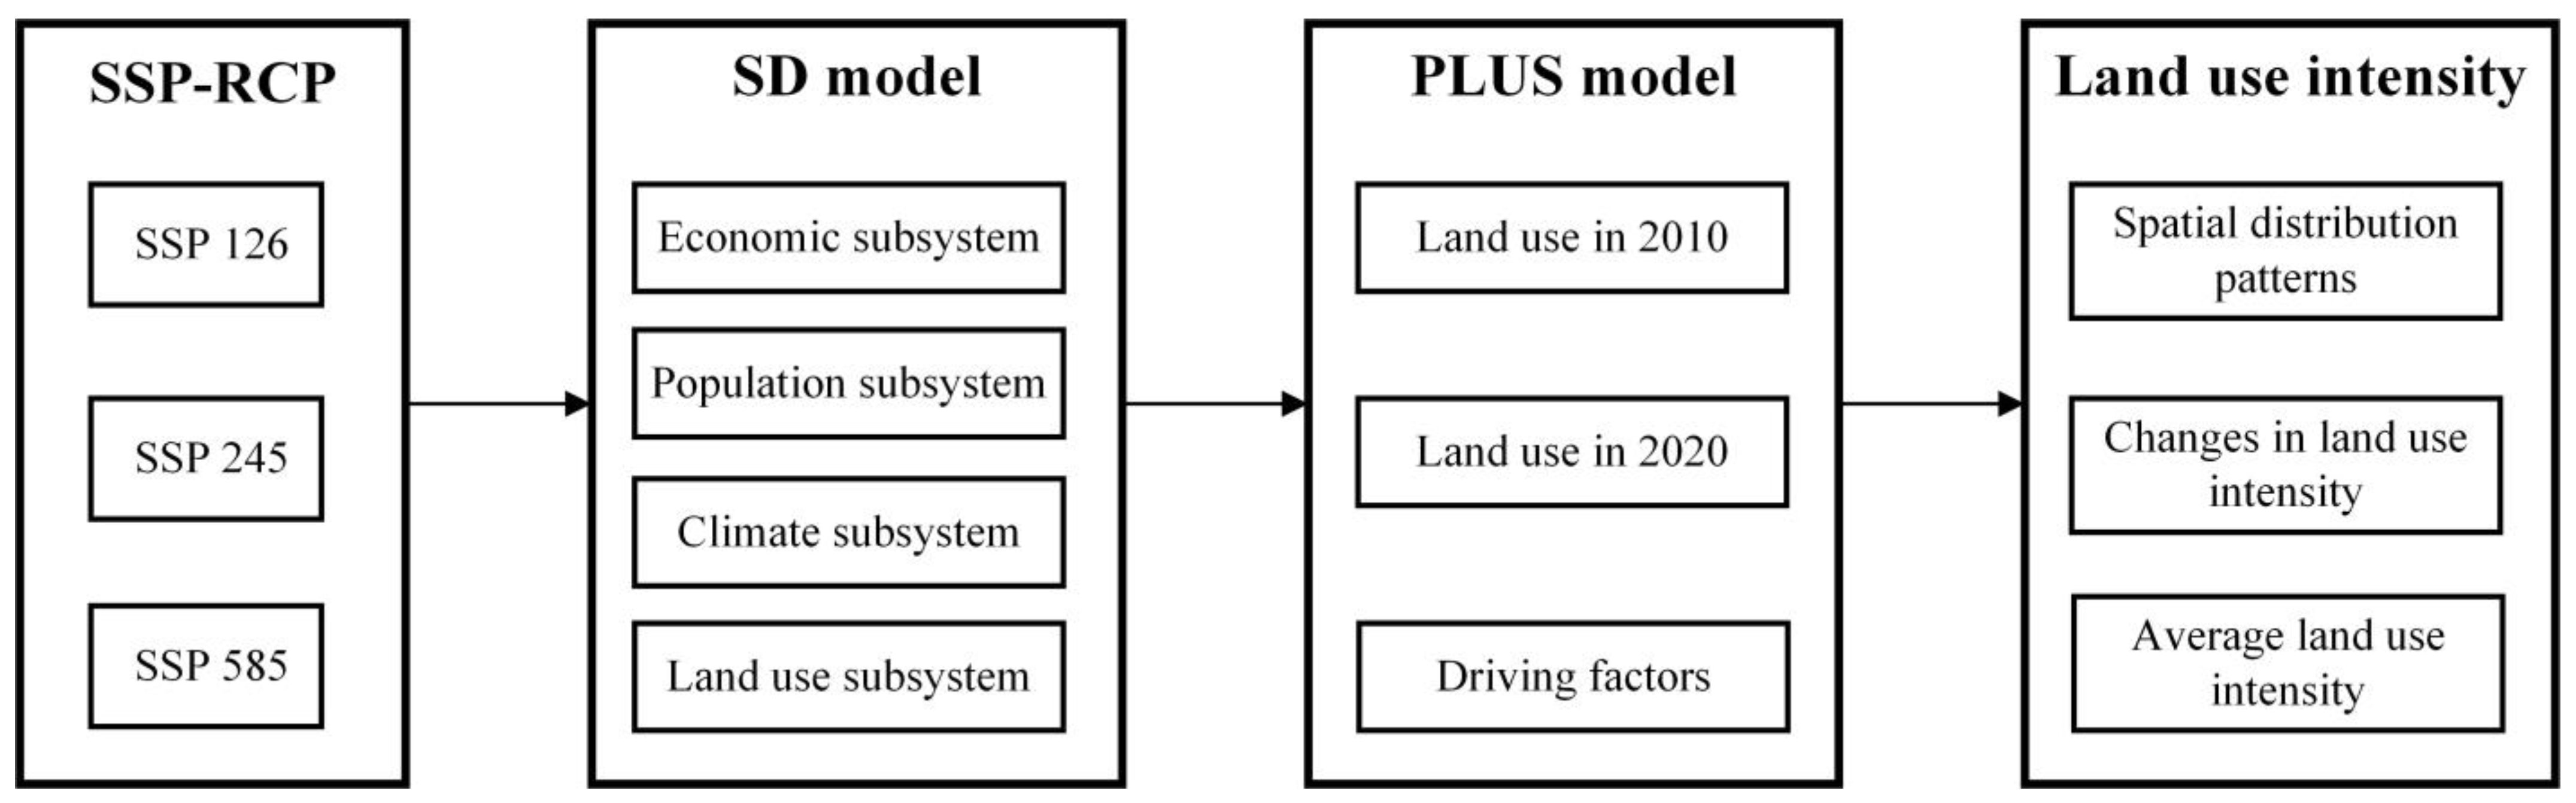
3.1. Research Framework
3.2. Simulation Scenario Setting
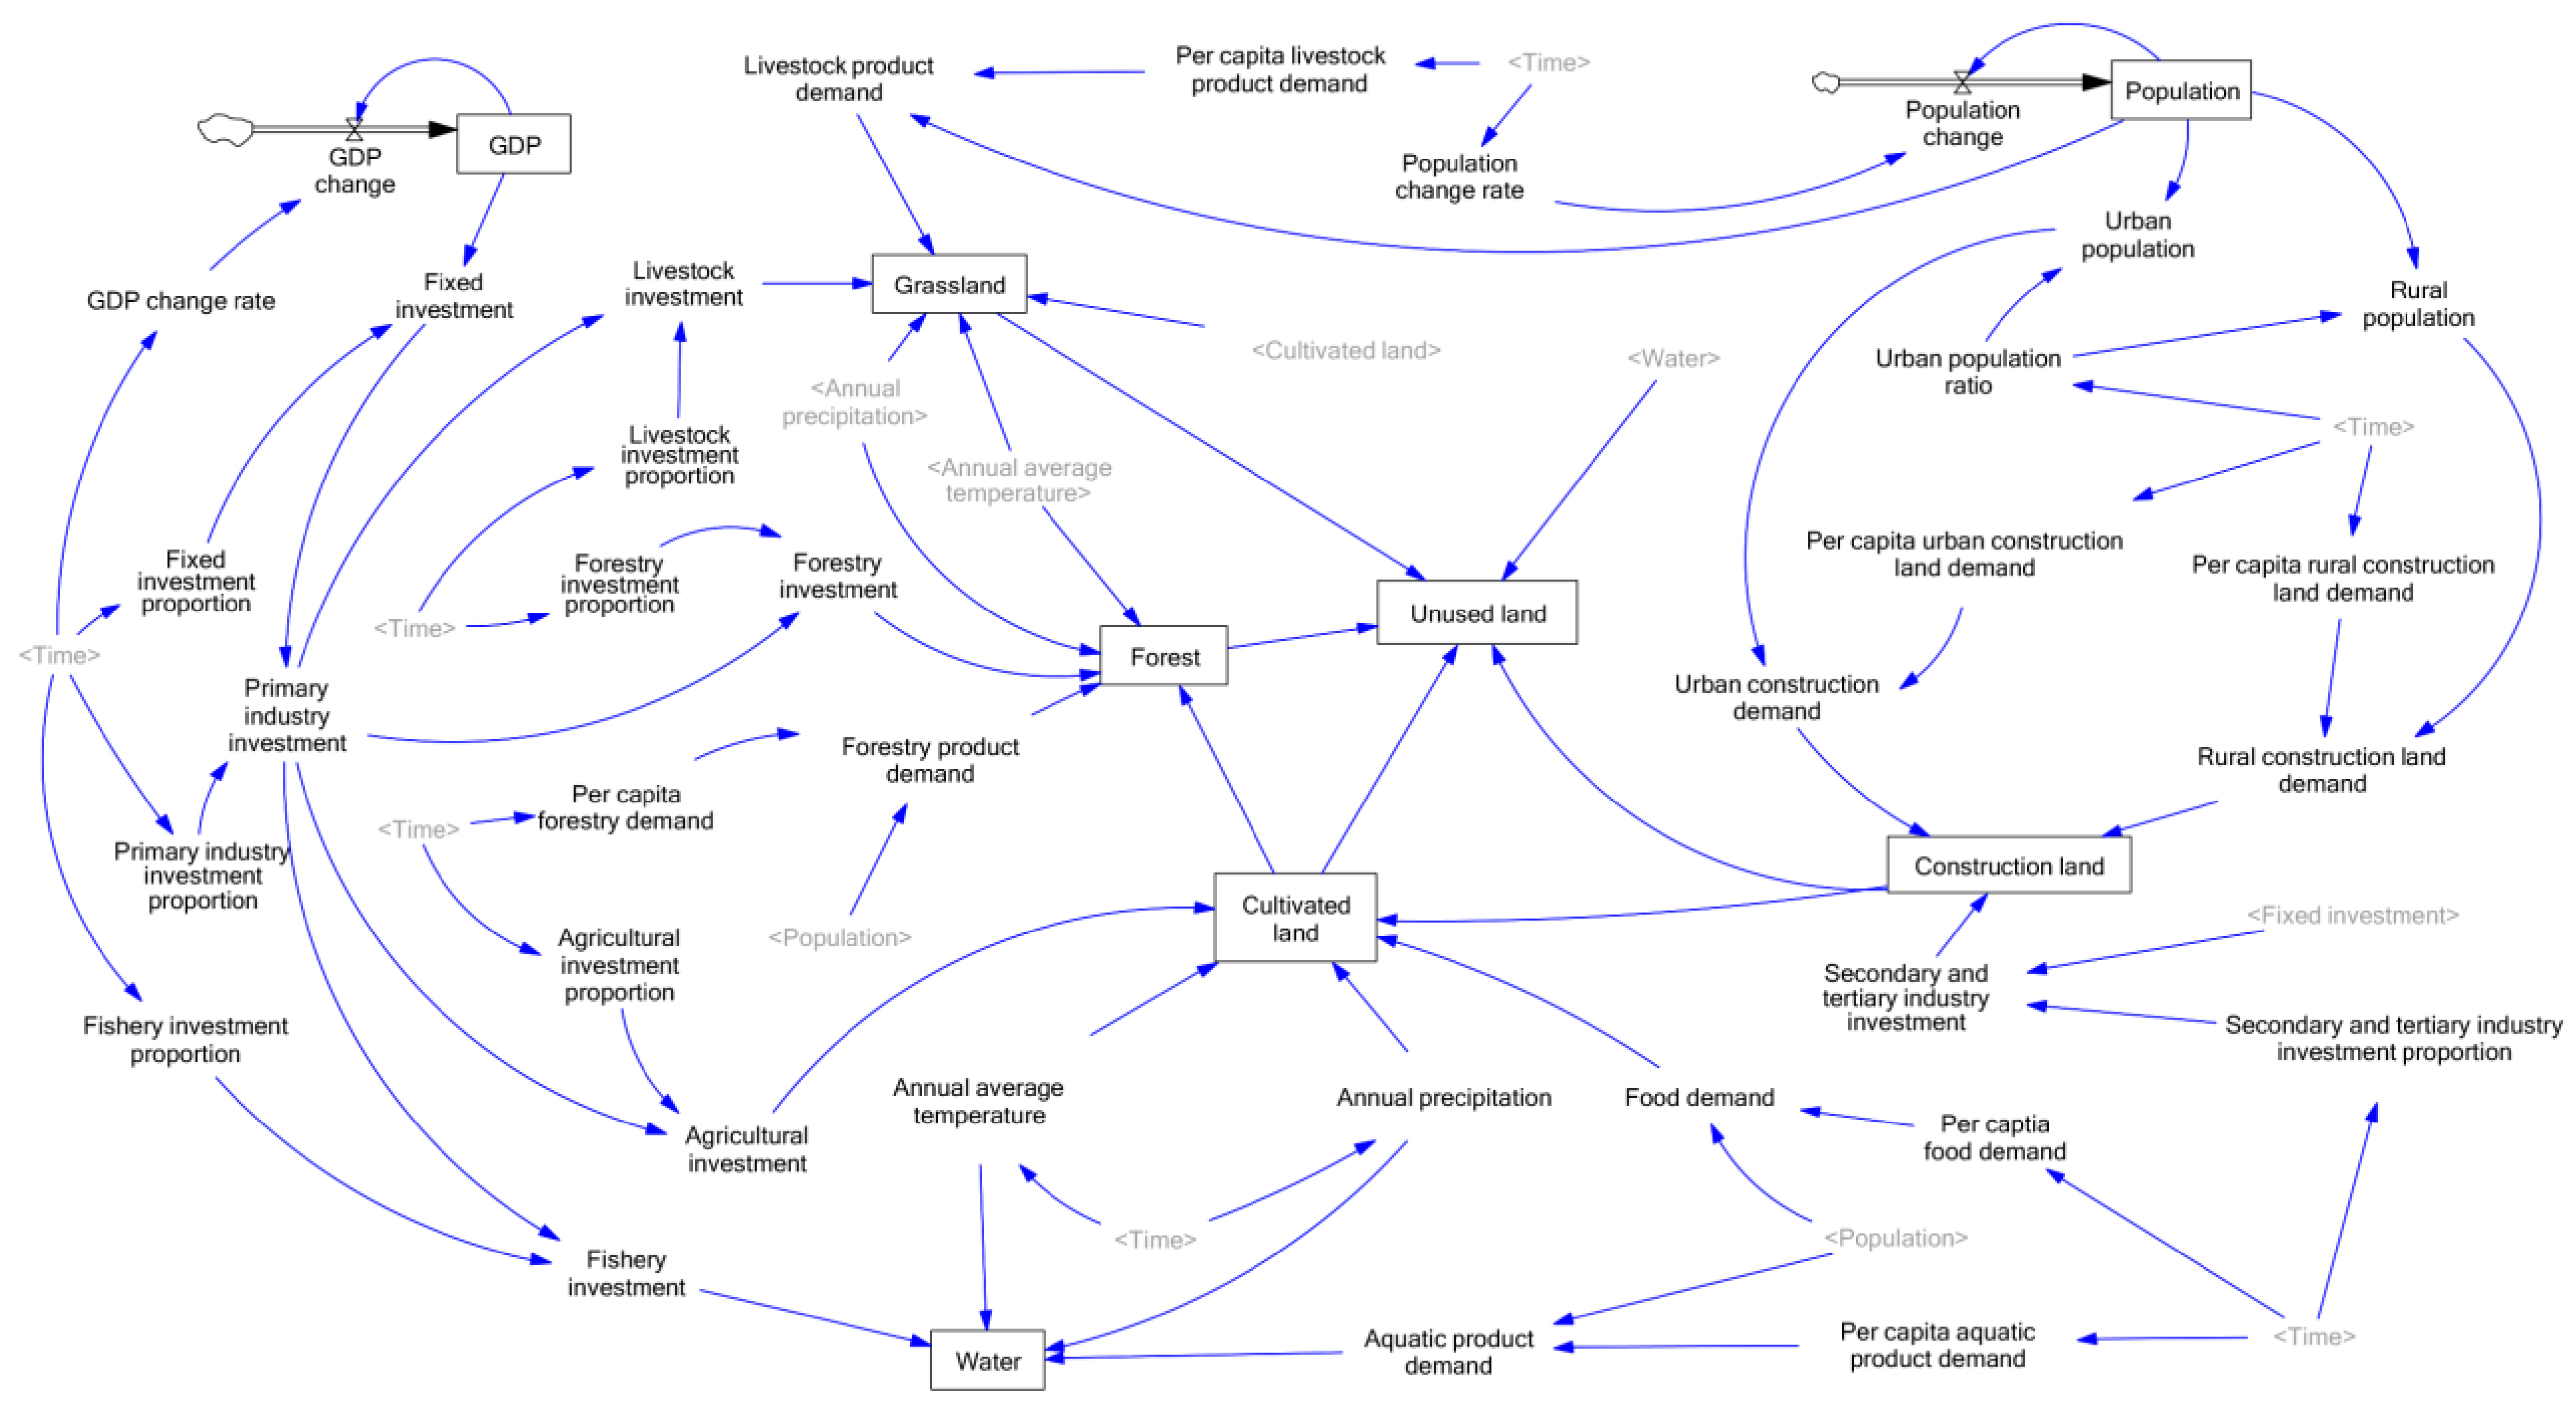
3.3. SD Model
3.4. PLUS Model
3.5. Land Use Intensity
4. Results
4.1. Future Land Use Demand in Hangzhou
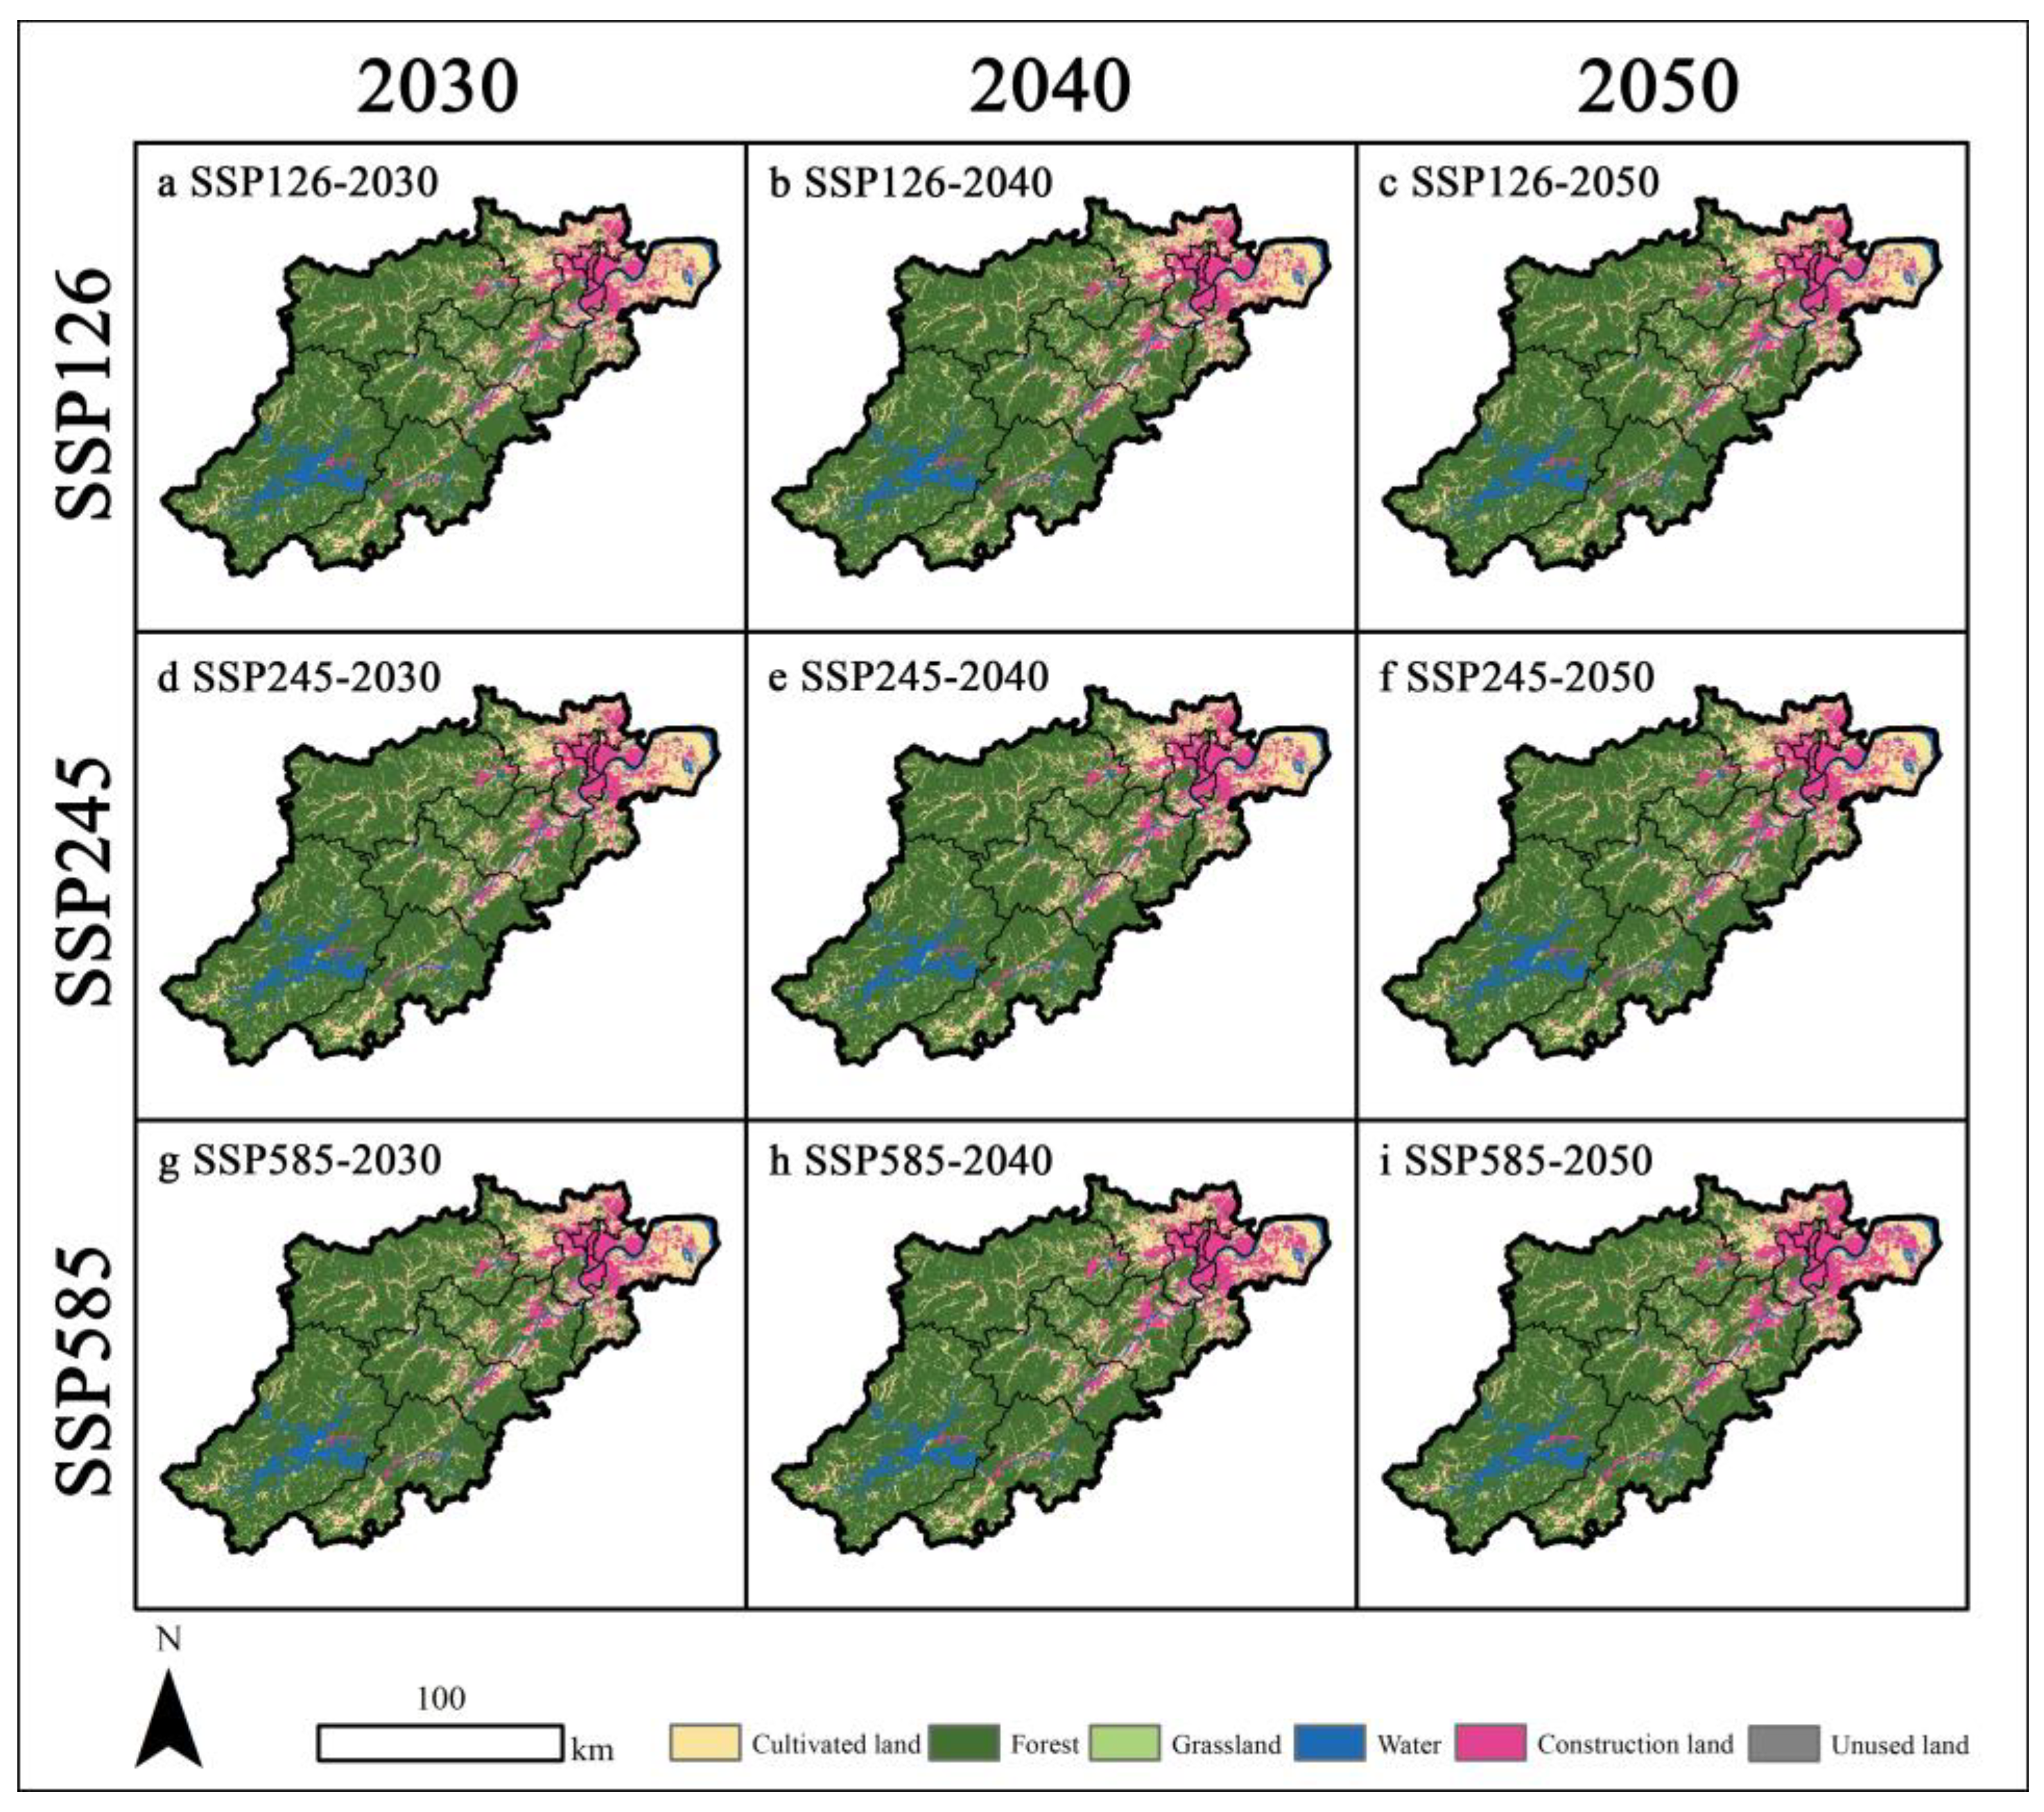
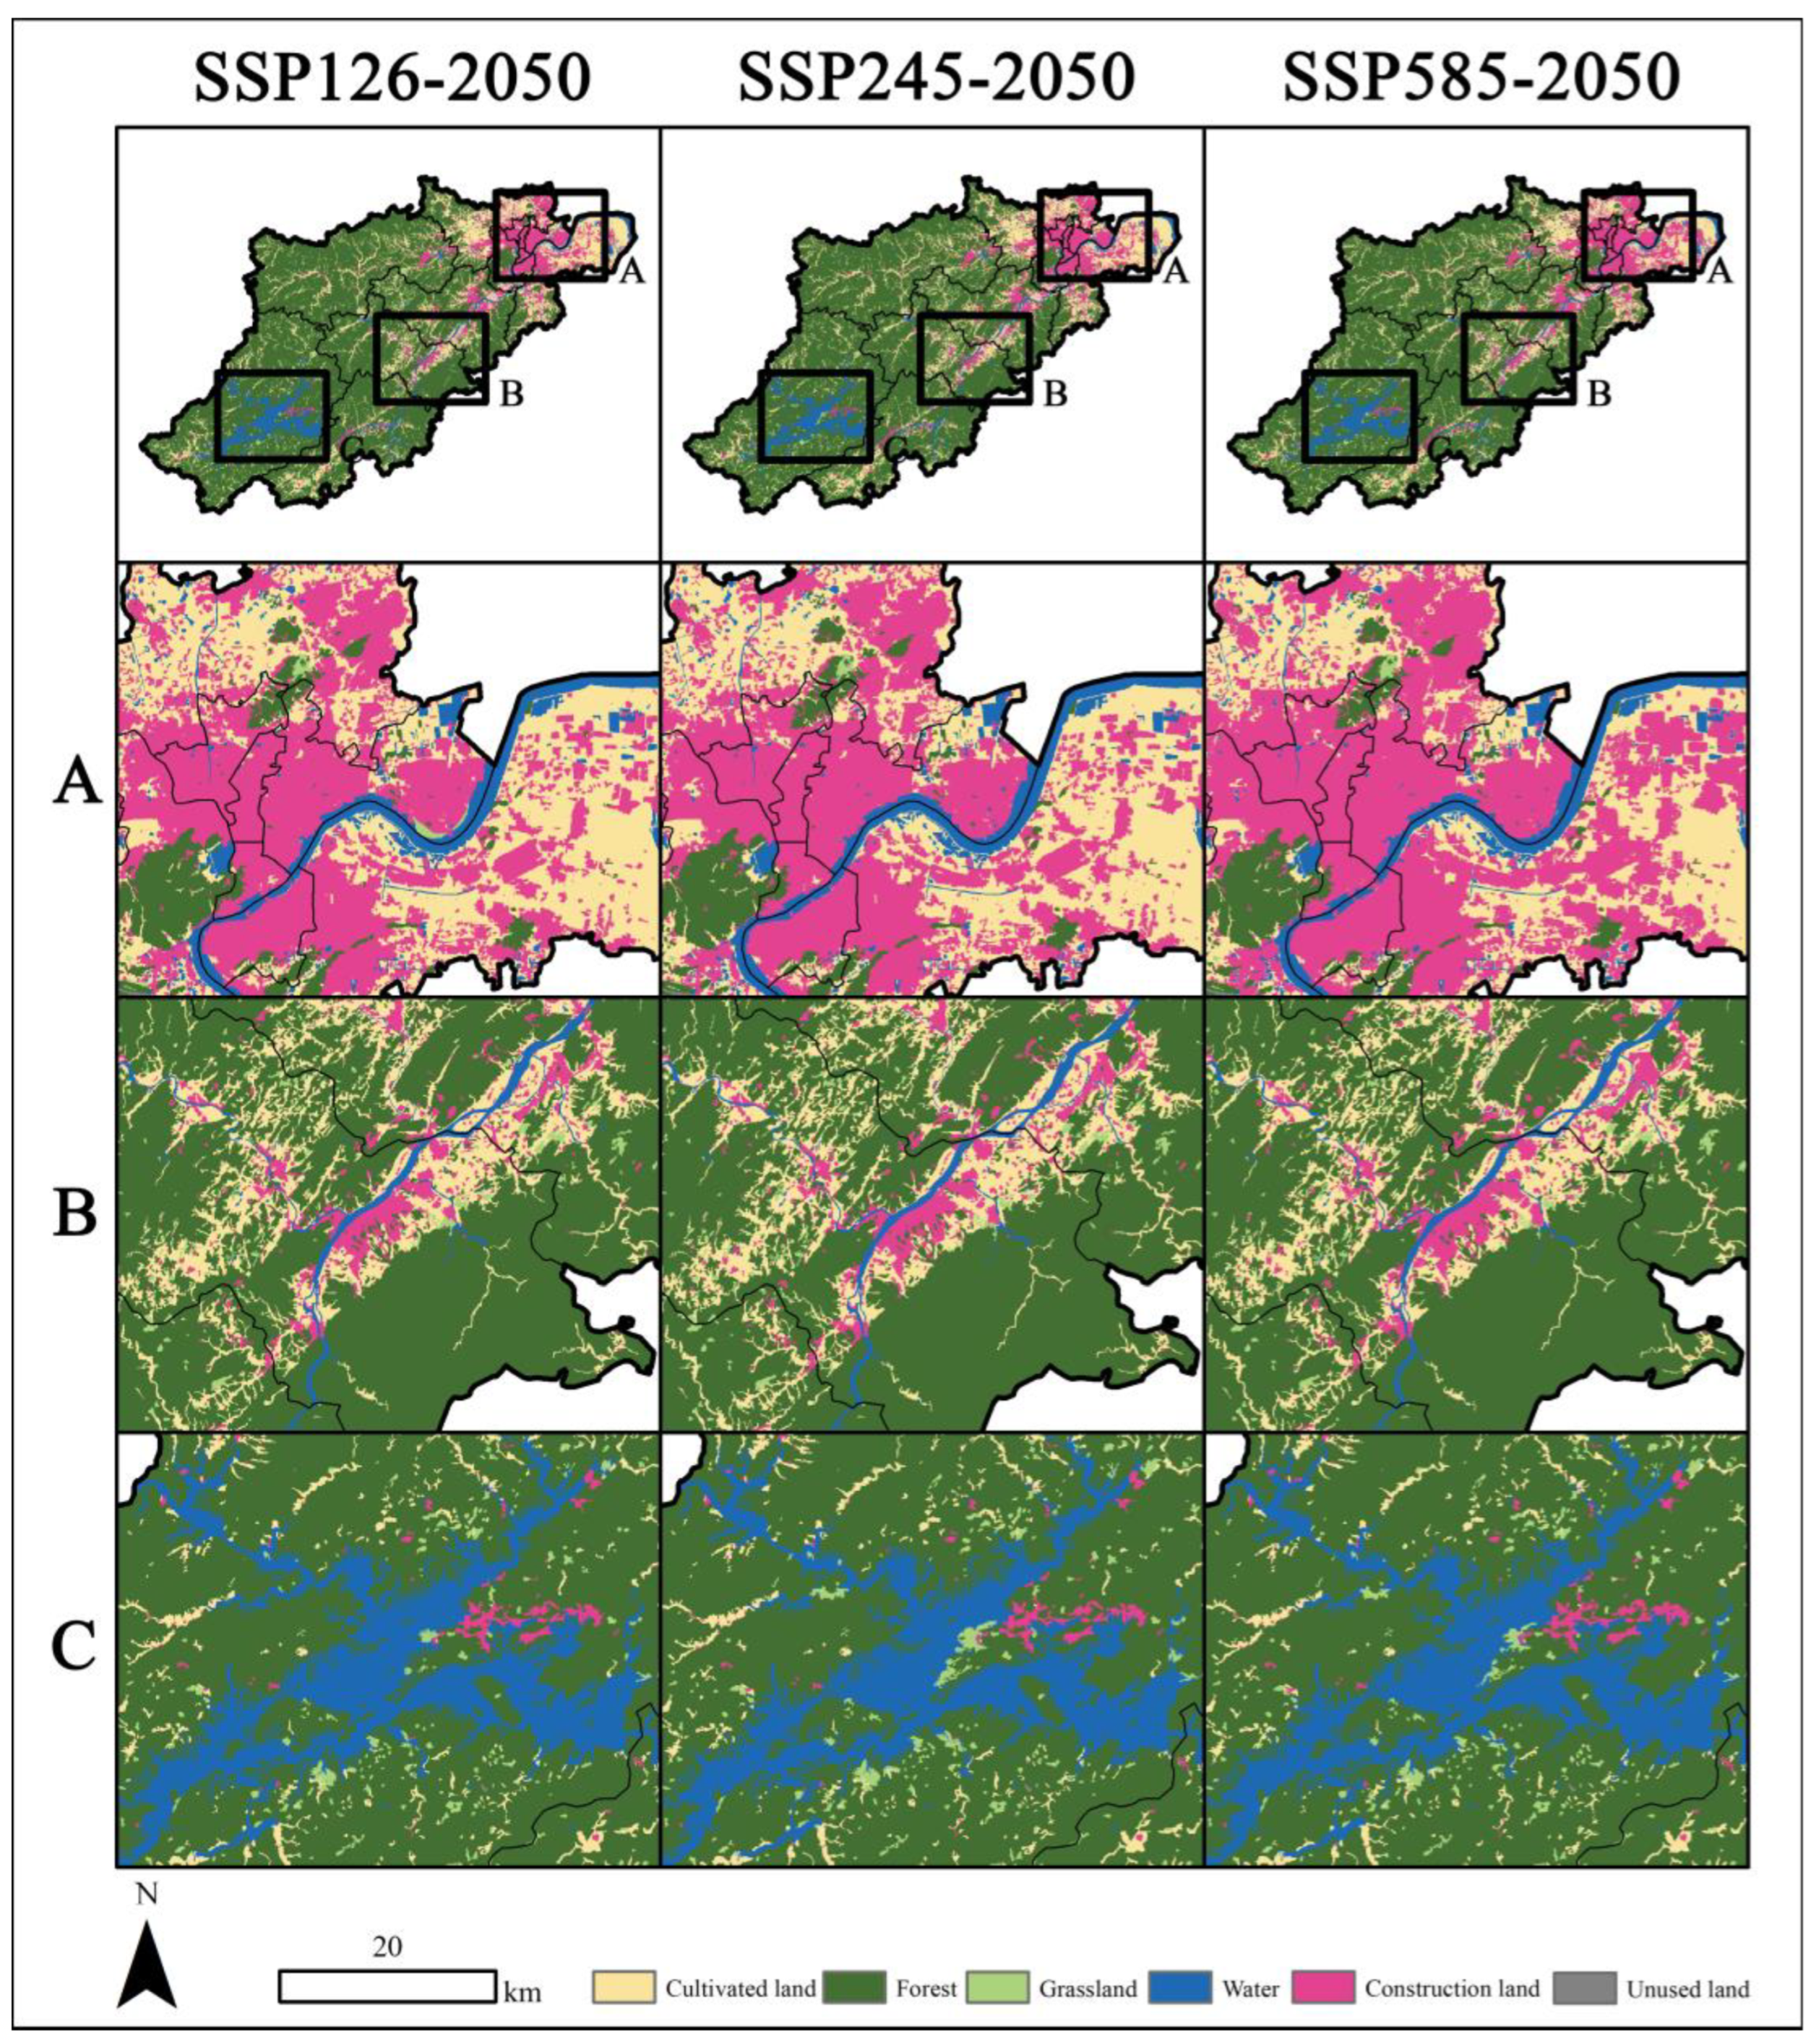
4.2. Future Land Use Spatial Distribution Patterns
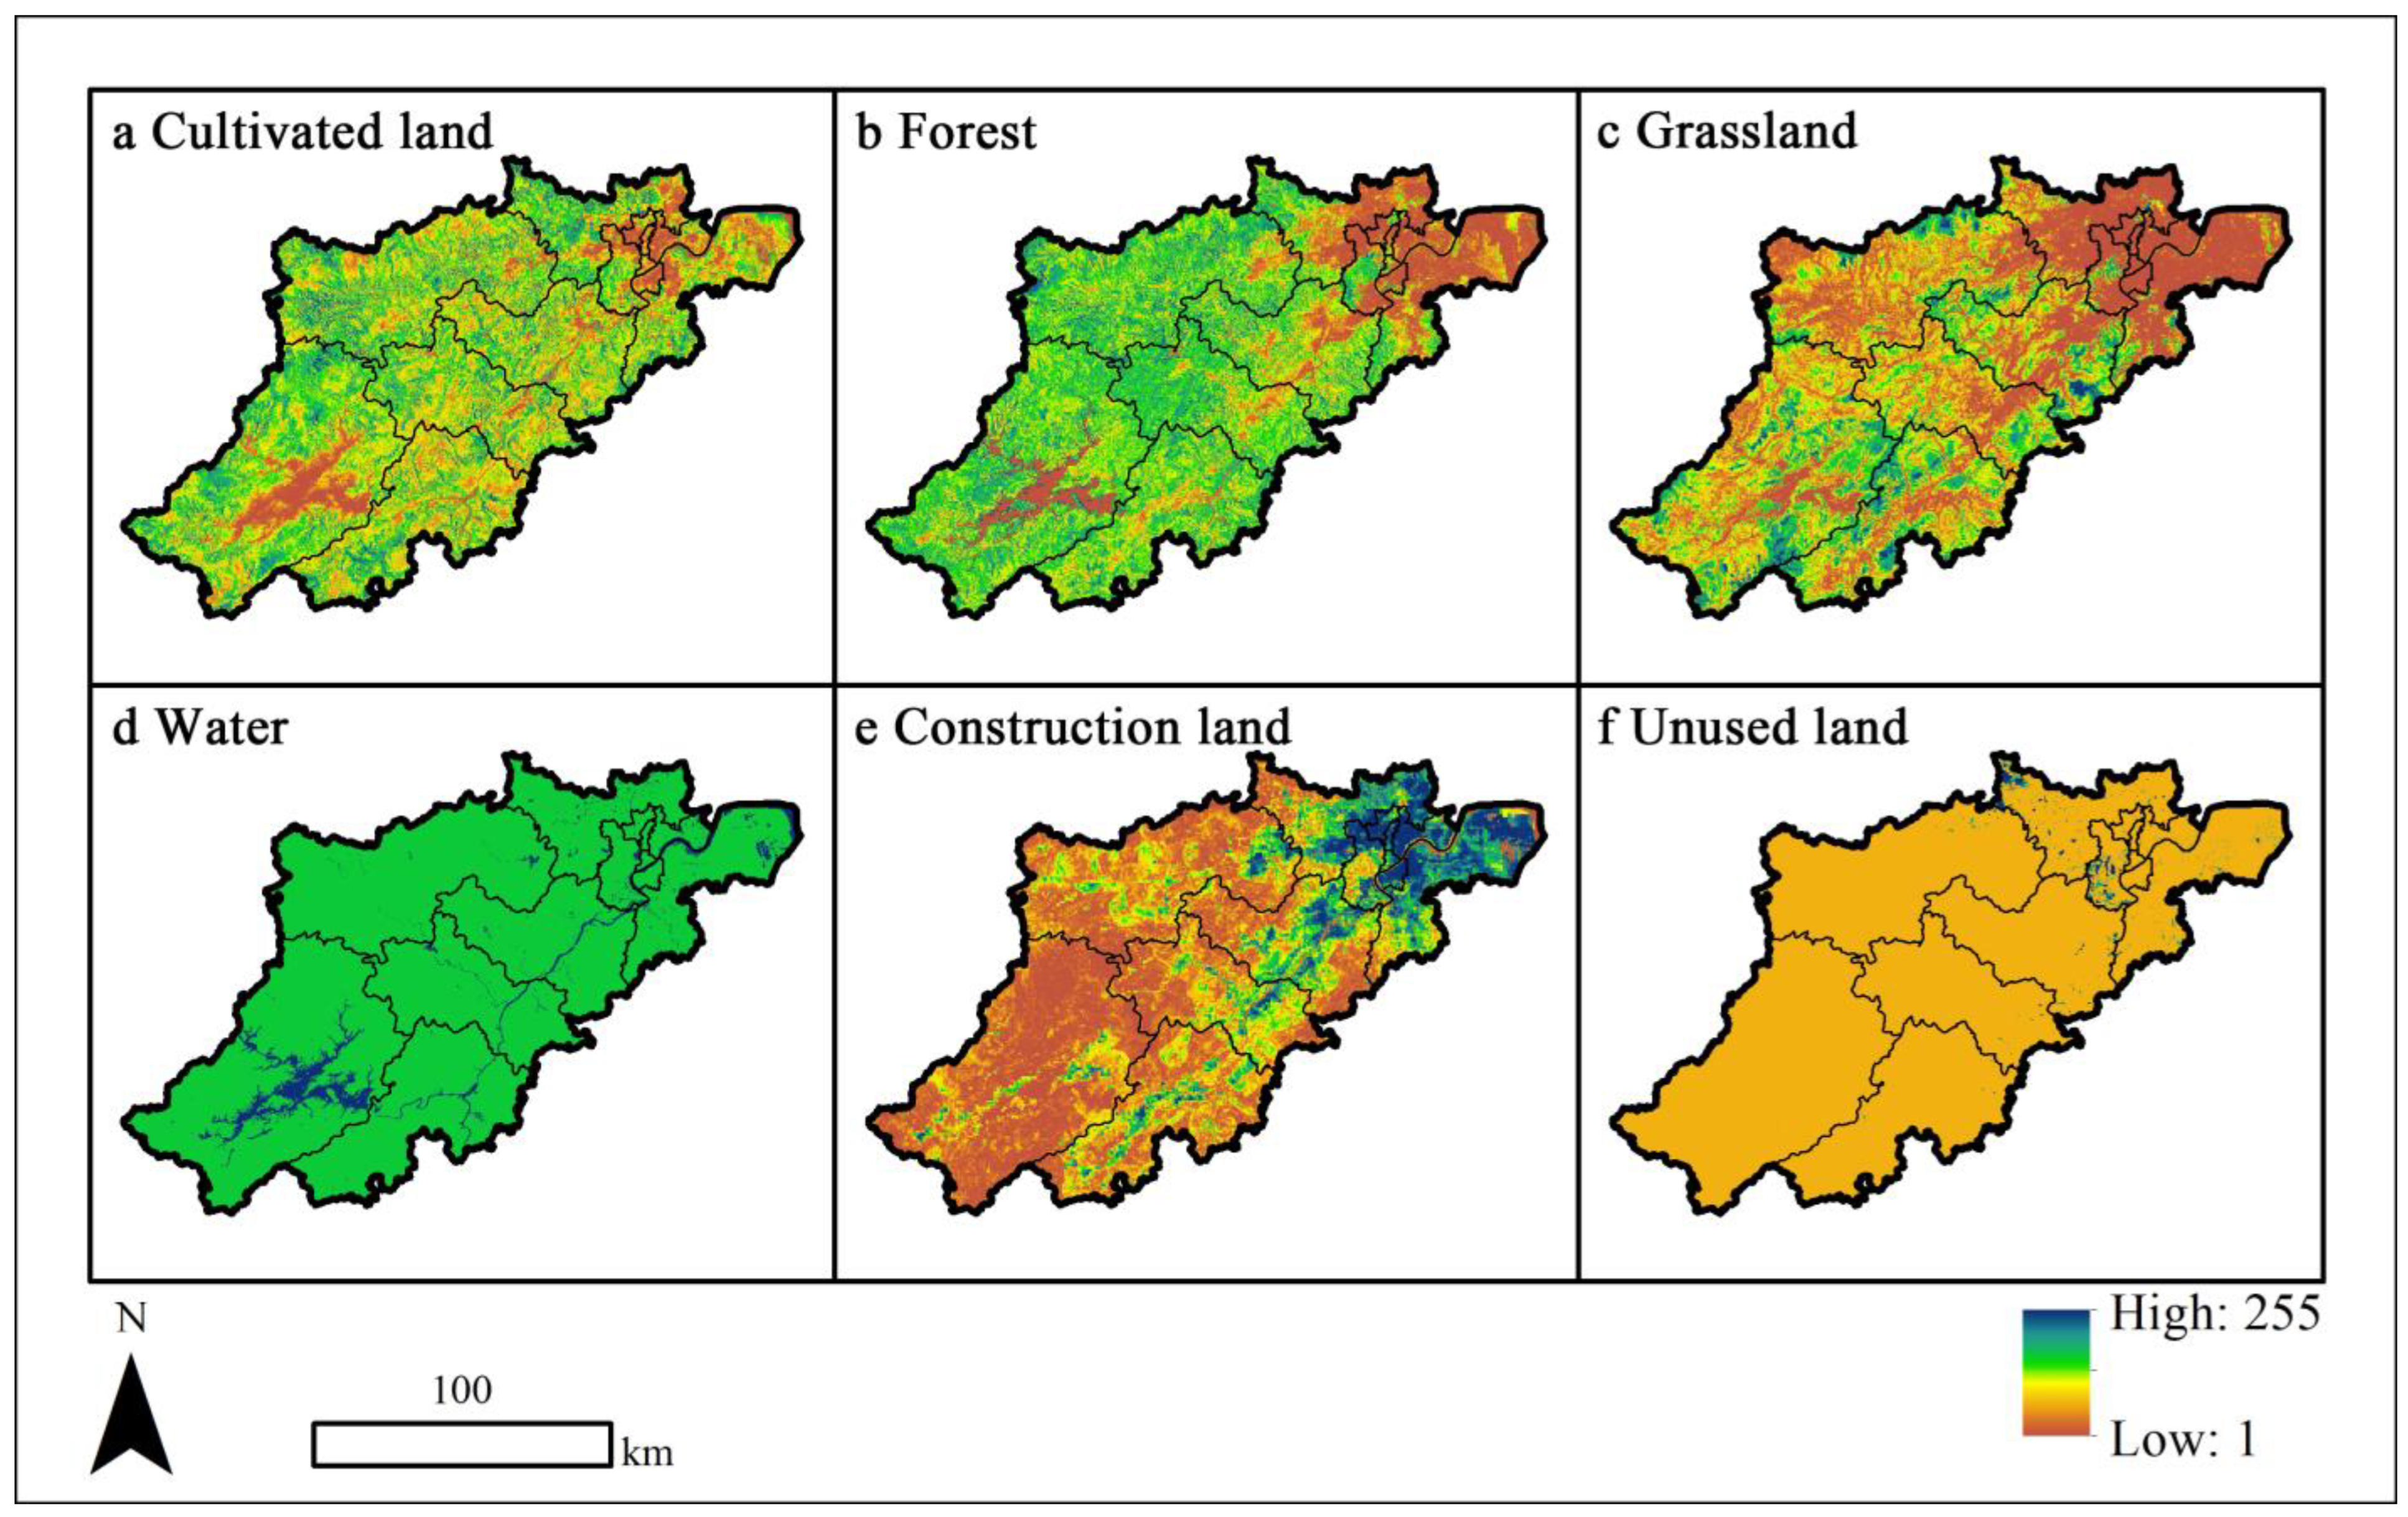
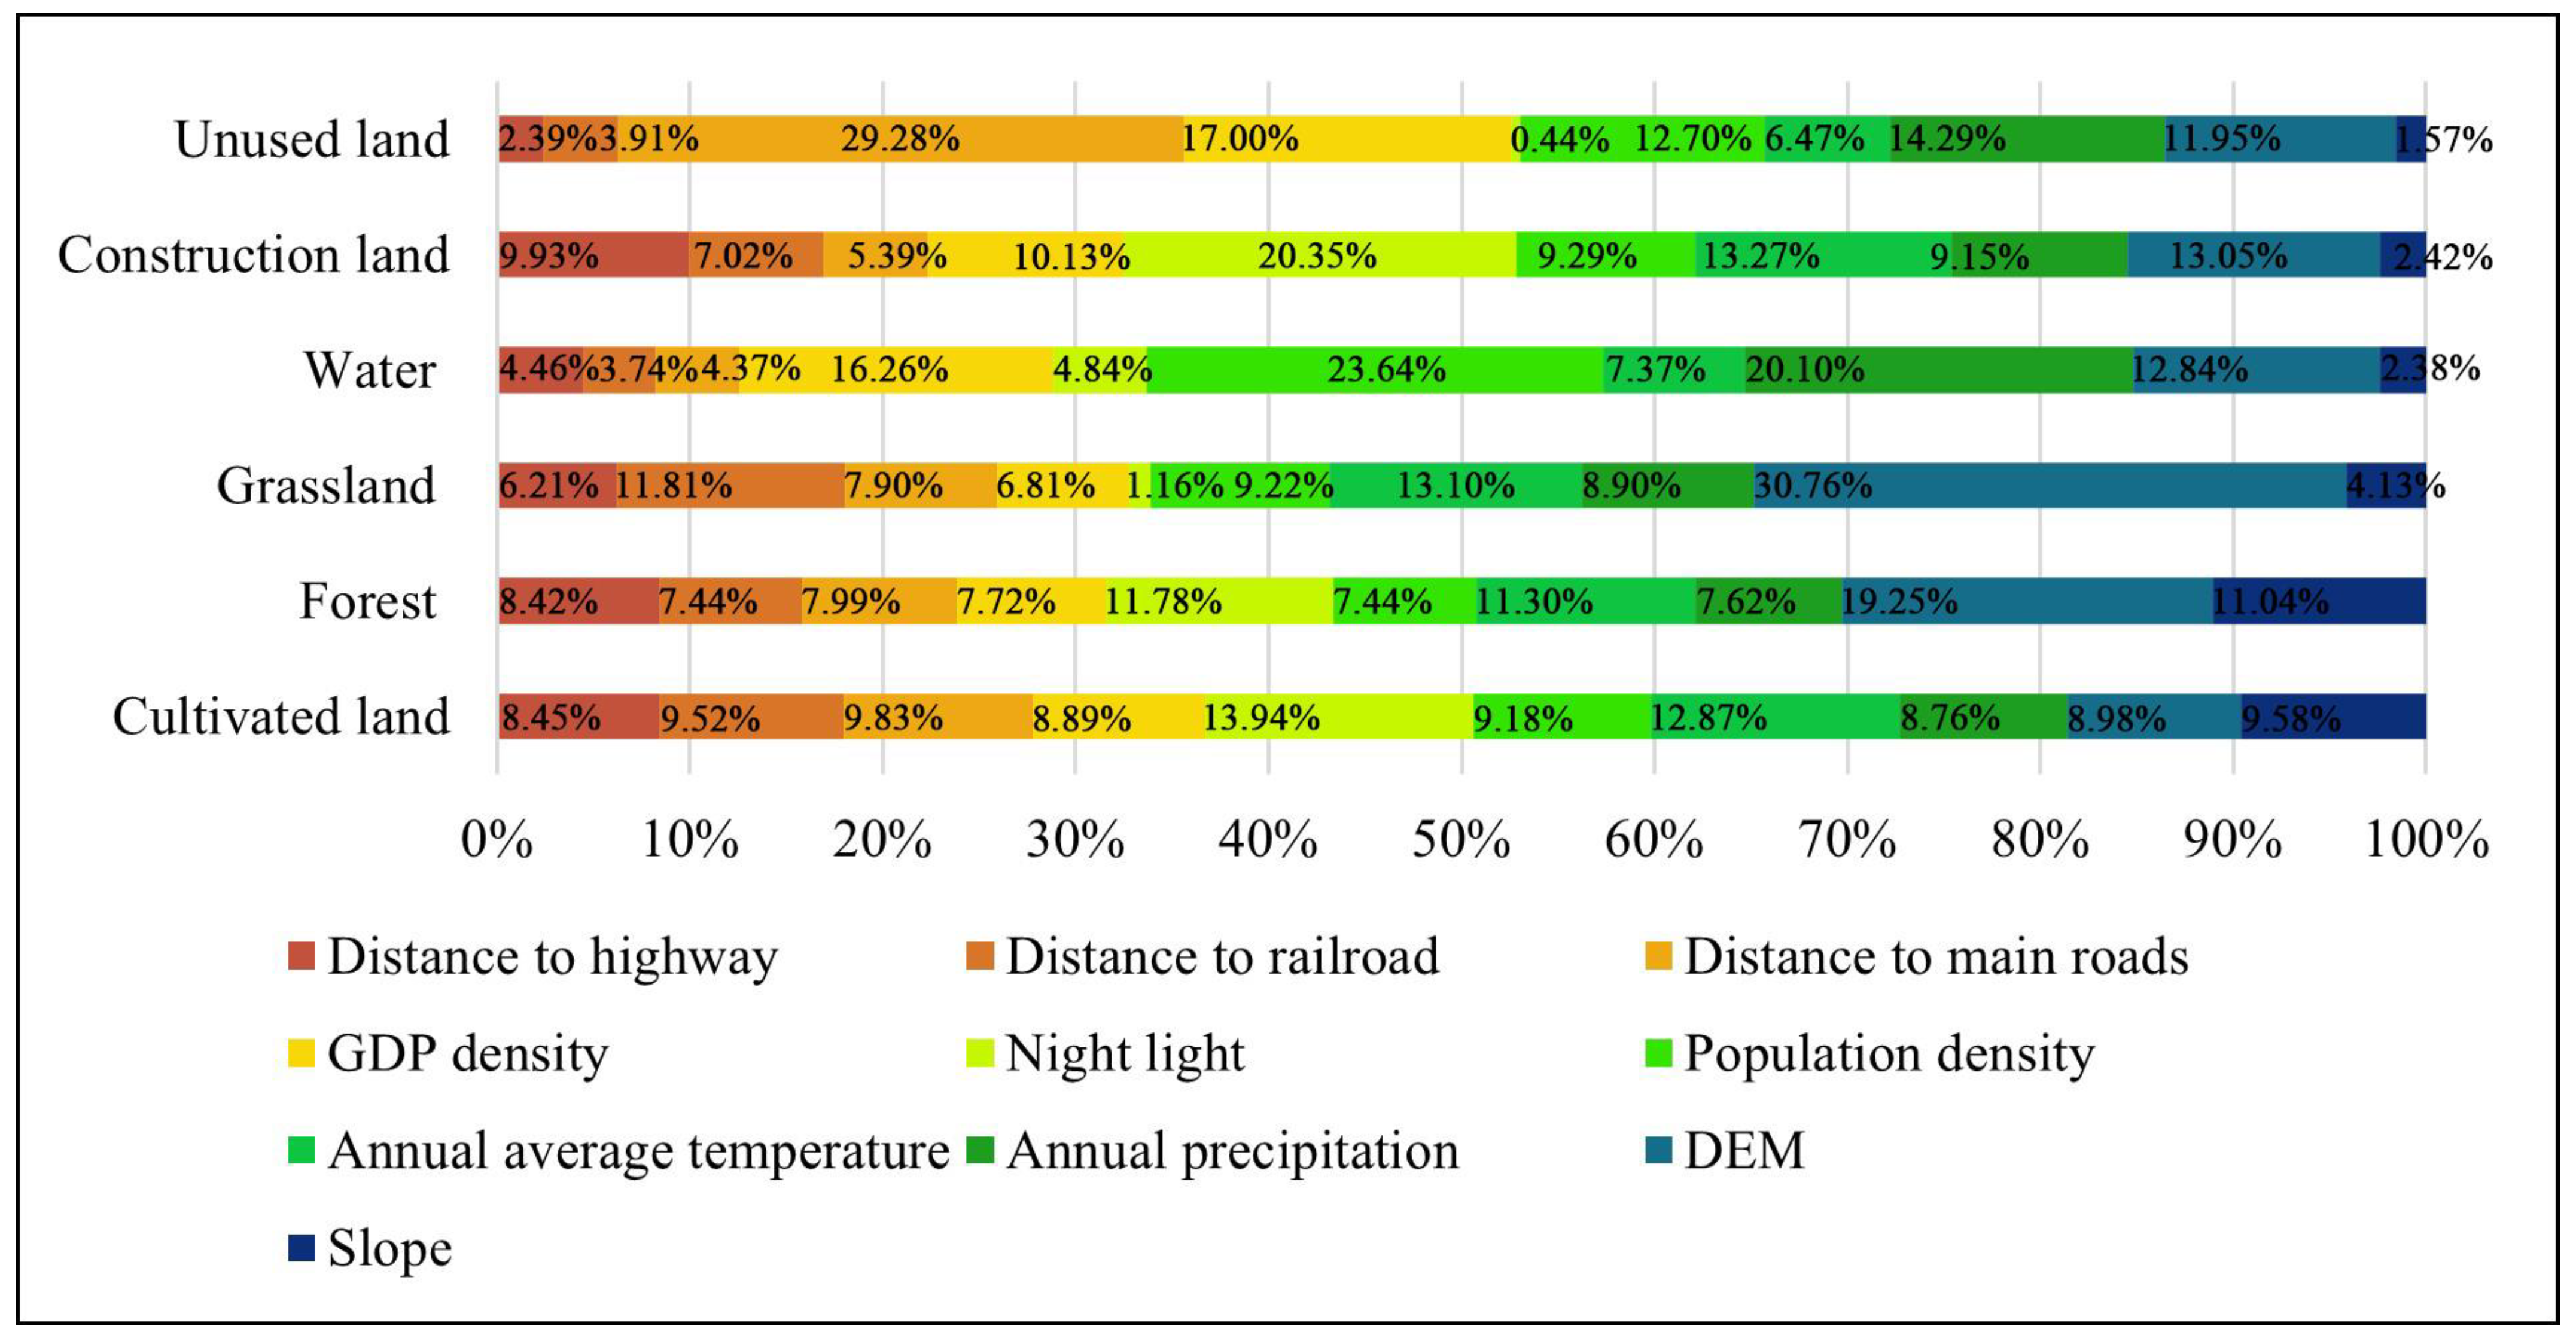
4.3. Drivers of Future Land Use Expansion
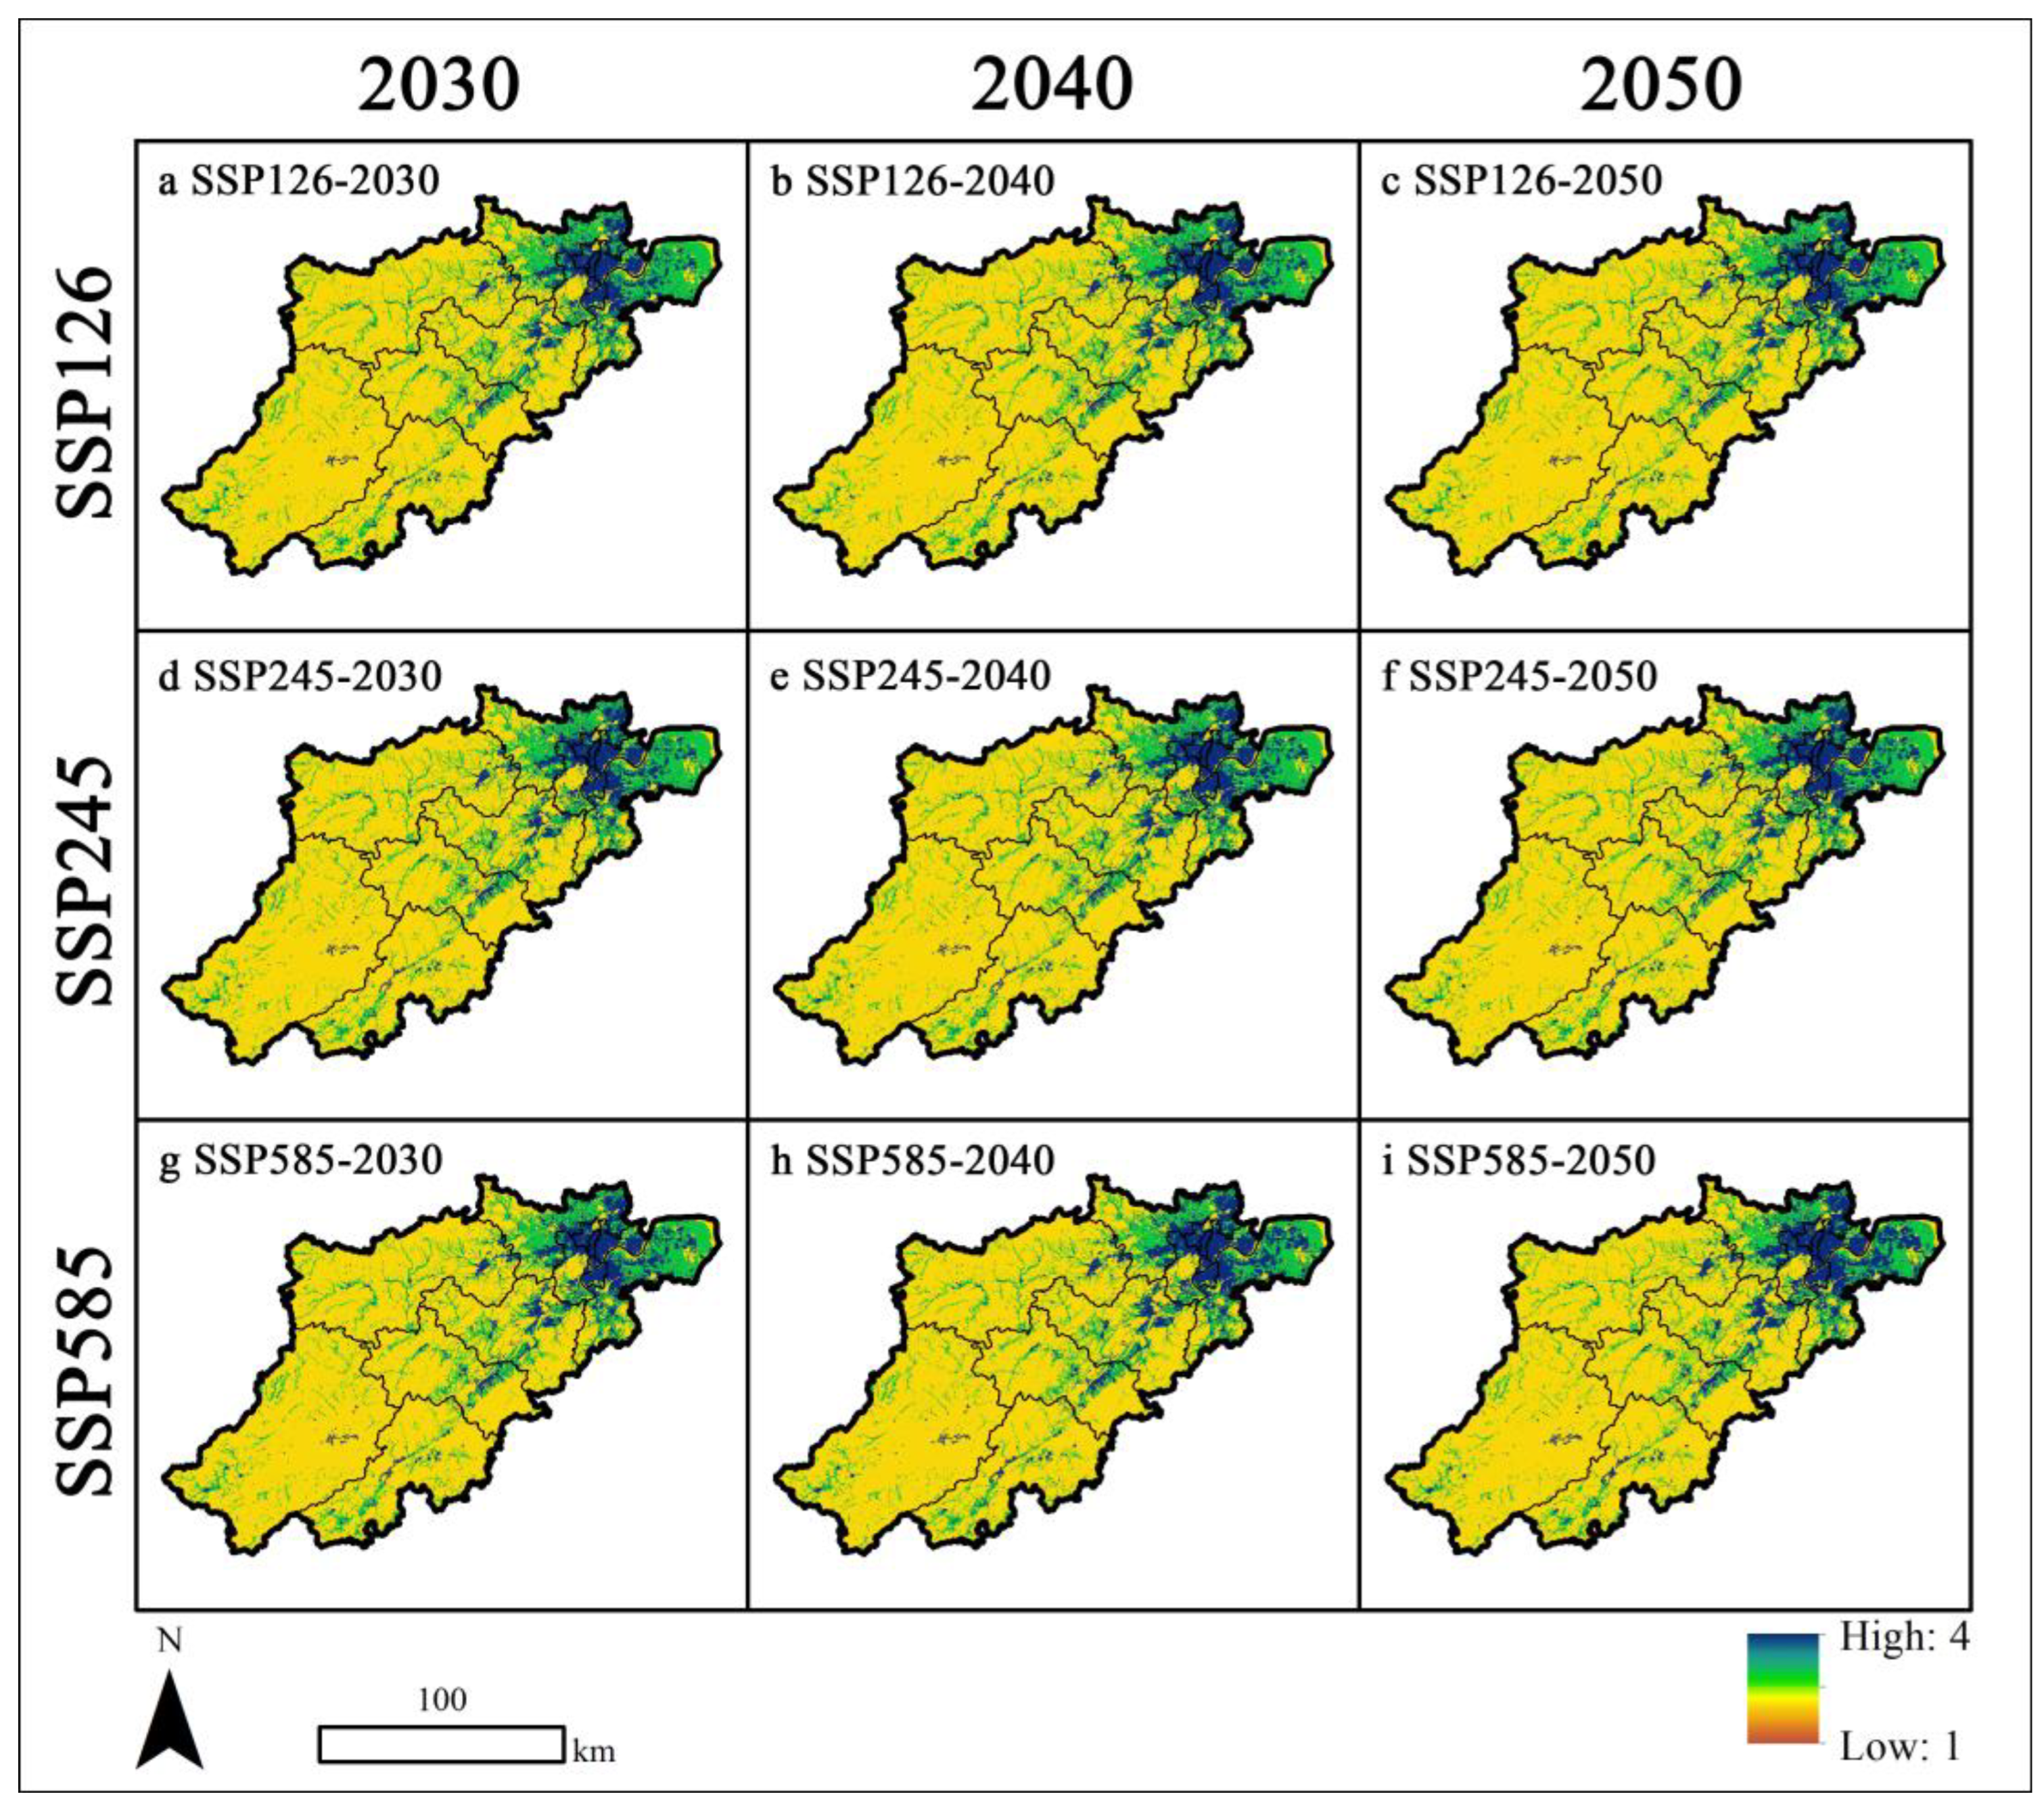
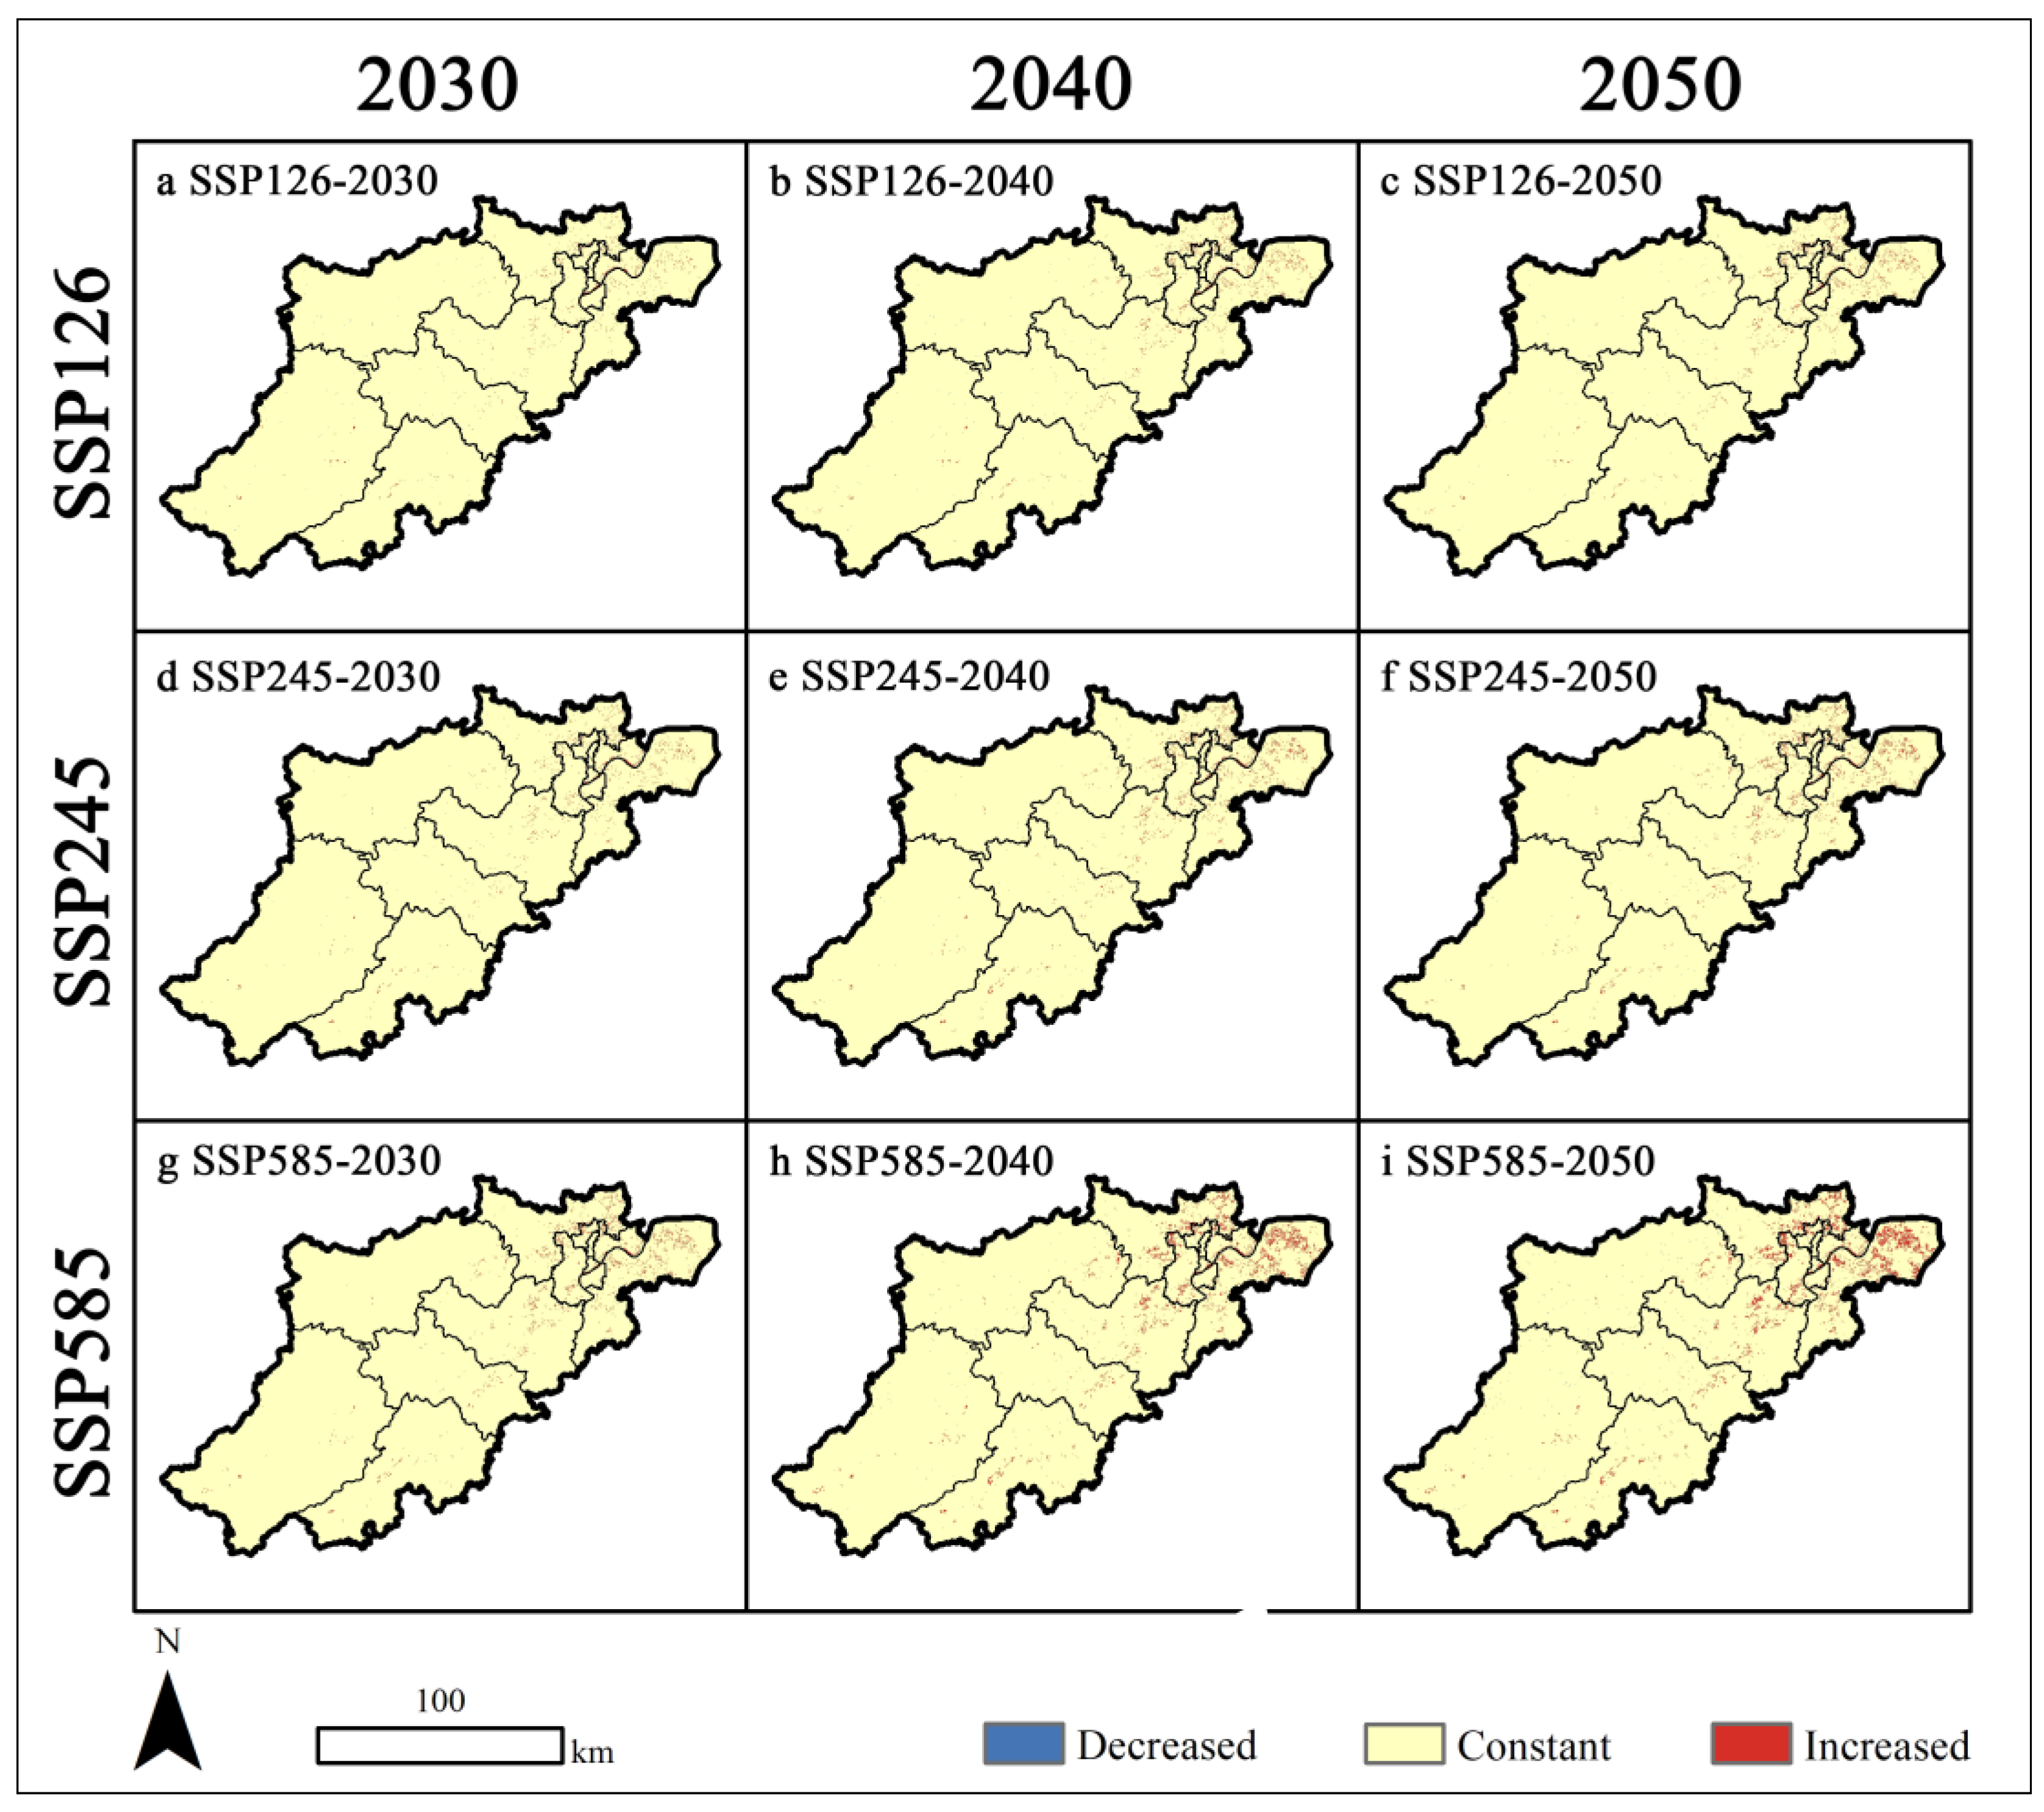
4.4. Changes in Future LUI
5. Discussion
5.1. Comprehensive Framework Based on the SD-PLUS Model
5.2. LUCC in High-Density Urban Areas under Climate Change and Rapid Urbanization
5.3. Identifying Changes in LUI to Support Sustainable Land Management
5.4. Limitations and Prospects
6. Conclusions
- (1)
- From 2020 and 2050, cultivated land, unused land, and water are projected to show a declining trend across all three scenarios, while construction land is predicted to exhibit an increasing trend. This indicates that urbanization in Hangzhou will continue, underscoring the crucial need to enhance the preservation of cultivated land and water for the city’s sustainable development.
- (2)
- The expansion of construction land is most pronounced under the SSP585 scenario, while it is the least under SSP126.
- (3)
- Night light has the largest impact on the expansion of cultivated land and construction land, at 13.94% and 20.35% respectively, highlighting the crucial role of human activities in the urbanization process.
- (4)
- The average LUI in central urban districts markedly surpasses that in the surrounding suburban areas, with Xiacheng having the highest LUI. Measures such as rooftop gardens and vertical greening could be implemented to enhance greenery in this area. Chun’an has the lowest average LUI and should continue to strengthen ecological protection.
Author Contributions
Funding
Informed Consent Statement
Data Availability Statement
Conflicts of Interest
References
- Wang, B.; He, W.; An, M.; Fang, X.; Ramsey, T.S. Natural Capital Accounting of Land Resources Based on Ecological Footprint and Ecosystem Services Value. Sci. Total Environ. 2024, 914, 170051. [Google Scholar] [CrossRef] [PubMed]
- Hong, W.; Li, F.; Li, M.; Zhang, F.; Tong, L.; Huang, Q. Toward a Sustainable Utilization of Land Resources in China: Problems, Policies, and Practices. AMBIO 2014, 43, 825–835. [Google Scholar] [CrossRef] [PubMed]
- Song, X.-P.; Hansen, M.C.; Stehman, S.V.; Potapov, P.V.; Tyukavina, A.; Vermote, E.F.; Townshend, J.R. Global Land Change from 1982 to 2016. Nature 2018, 560, 639–643. [Google Scholar] [CrossRef] [PubMed]
- Zhou, Y.; Li, X.; Liu, Y. Land Use Change and Driving Factors in Rural China during the Period 1995–2015. Land Use Policy 2020, 99, 105048. [Google Scholar] [CrossRef]
- Winkler, K.; Fuchs, R.; Rounsevell, M.; Herold, M. Global Land Use Changes Are Four Times Greater than Previously Estimated. Nat. Commun. 2021, 12, 2501. [Google Scholar] [CrossRef] [PubMed]
- Yi, Z.; Zhou, W.; Razzaq, A.; Yang, Y. Land Resource Management and Sustainable Development: Evidence from China’s Regional Data. Resour. Policy 2023, 84, 103732. [Google Scholar] [CrossRef]
- Zhou, J.-H.; Zhu, Y.-M.; He, L.; Song, H.-J.; Mu, B.-X.; Lyu, F. Recognizing and Managing Construction Land Reduction Barriers for Sustainable Land Use in China. Environ. Dev. Sustain. 2022, 24, 14074–14105. [Google Scholar] [CrossRef]
- Findell, K.L.; Berg, A.; Gentine, P.; Krasting, J.P.; Lintner, B.R.; Malyshev, S.; Santanello, J.A.; Shevliakova, E. The Impact of Anthropogenic Land Use and Land Cover Change on Regional Climate Extremes. Nat. Commun. 2017, 8, 989. [Google Scholar] [CrossRef]
- Nayak, S.; Mandal, M. Impact of Land Use and Land Cover Changes on Temperature Trends over India. Land Use Policy 2019, 89, 104238. [Google Scholar] [CrossRef]
- Lambin, E.F.; Meyfroidt, P. Global Land Use Change, Economic Globalization, and the Looming Land Scarcity. Proc. Natl. Acad. Sci. USA 2011, 108, 3465–3472. [Google Scholar] [CrossRef]
- Foley, J.A.; DeFries, R.; Asner, G.P.; Barford, C.; Bonan, G.; Carpenter, S.R.; Chapin, F.S.; Coe, M.T.; Daily, G.C.; Gibbs, H.K.; et al. Global Consequences of Land Use. Science 2005, 309, 570–574. [Google Scholar] [CrossRef] [PubMed]
- Liu, L.; Liu, C.; Sun, Z. A Survey of China’s Low-Carbon Application Practice—Opportunity Goes with Challenge. Renew. Sustain. Energy Rev. 2011, 15, 2895–2903. [Google Scholar] [CrossRef]
- Tian, W.; Liu, X.; Wang, K.; Bai, P.; Liu, C. Estimation of Reservoir Evaporation Losses for China. J. Hydrol. 2021, 596, 126142. [Google Scholar] [CrossRef]
- Song, W.; Deng, X. Land-Use/Land-Cover Change and Ecosystem Service Provision in China. Sci. Total Environ. 2017, 576, 705–719. [Google Scholar] [CrossRef]
- Chang, X.; Xing, Y.; Wang, J.; Yang, H.; Gong, W. Effects of Land Use and Cover Change (LUCC) on Terrestrial Carbon Stocks in China between 2000 and 2018. Resour. Conserv. Recycl. 2022, 182, 106333. [Google Scholar] [CrossRef]
- Meng, F.; Guo, J.; Guo, Z.; Lee, J.C.K.; Liu, G.; Wang, N. Urban Ecological Transition: The Practice of Ecological Civilization Construction in China. Sci. Total Environ. 2021, 755, 142633. [Google Scholar] [CrossRef]
- Hansen, M.H.; Li, H.; Svarverud, R. Ecological Civilization: Interpreting the Chinese Past, Projecting the Global Future. Glob. Environ. Chang. 2018, 53, 195–203. [Google Scholar] [CrossRef]
- Zhu, H.; Yue, J.; Wang, H. Will China’s Urbanization Support Its Carbon Peak Goal?—A Forecast Analysis Based on the Improved GCAM. Ecol. Indic. 2024, 163, 112072. [Google Scholar] [CrossRef]
- An, H.; Xiao, W.; Huang, J. Relationship of Construction Land Expansion and Ecological Environment Changes in the Three Gorges Reservoir Area of China. Ecol. Indic. 2023, 157, 111209. [Google Scholar] [CrossRef]
- Zhou, M.; Ma, Y.; Tu, J.; Wang, M. SDG-Oriented Multi-Scenario Sustainable Land-Use Simulation under the Background of Urban Expansion. Environ. Sci. Pollut. Res. 2022, 29, 72797–72818. [Google Scholar] [CrossRef]
- Fang, Z.; Ding, T.; Chen, J.; Xue, S.; Zhou, Q.; Wang, Y.; Wang, Y.; Huang, Z.; Yang, S. Impacts of Land Use/Land Cover Changes on Ecosystem Services in Ecologically Fragile Regions. Sci. Total Environ. 2022, 831, 154967. [Google Scholar] [CrossRef] [PubMed]
- Li, Z.-T.; Li, M.; Xia, B.-C. Spatio-Temporal Dynamics of Ecological Security Pattern of the Pearl River Delta Urban Agglomeration Based on LUCC Simulation. Ecol. Indic. 2020, 114, 106319. [Google Scholar] [CrossRef]
- Chen, G.; Li, X.; Liu, X. Global Land Projection Based on Plant Functional Types with a 1-Km Resolution under Socio-Climatic Scenarios. Sci. Data 2022, 9, 125. [Google Scholar] [CrossRef] [PubMed]
- Luo, M.; Hu, G.; Chen, G.; Liu, X.; Hou, H.; Li, X. 1 Km Land Use/Land Cover Change of China under Comprehensive Socioeconomic and Climate Scenarios for 2020–2100. Sci. Data 2022, 9, 110. [Google Scholar] [CrossRef] [PubMed]
- Zhang, S.; Shao, H.; Li, X.; Xian, W.; Shao, Q.; Yin, Z.; Lai, F.; Qi, J. Spatiotemporal Dynamics of Ecological Security Pattern of Urban Agglomerations in Yangtze River Delta Based on LUCC Simulation. Remote Sens. 2022, 14, 296. [Google Scholar] [CrossRef]
- Liu, P.; Hu, Y.; Jia, W. Land Use Optimization Research Based on FLUS Model and Ecosystem Services–Setting Jinan City as an Example. Urban Clim. 2021, 40, 100984. [Google Scholar] [CrossRef]
- Li, B.; Yang, Z.; Cai, Y.; Xie, Y.; Guo, H.; Wang, Y.; Zhang, P.; Li, B.; Jia, Q.; Huang, Y.; et al. Prediction and Valuation of Ecosystem Service Based on Land Use/Land Cover Change: A Case Study of the Pearl River Delta. Ecol. Eng. 2022, 179, 106612. [Google Scholar] [CrossRef]
- Han, S.; Jing, Y.; Liu, Y. Simulation of Land Use Landscape Pattern Evolution from a Multi-Scenario Simulation: A Case Study of Nansi Lake Basin in China. Environ. Monit. Assess. 2023, 195, 830. [Google Scholar] [CrossRef]
- Hu, Y.; Zheng, Y.; Zheng, X. Simulation of Land-Use Scenarios for Beijing Using CLUE-S and Markov Composite Models. Chin. Geogr. Sci. 2013, 23, 92–100. [Google Scholar] [CrossRef]
- Lin, S.; Wang, F. Simulation and analysis of land use scenarios in Guangzhou based on the PLUS model and traffic planning scenario. J. Agric. Resour. Environ. 2022, 40, 557–569. (In Chinese) [Google Scholar] [CrossRef]
- Liu, J.; Pei, X.; Yu, W.; Nan, J.; Fang, H.; Wang, K.; Jiao, J. How Much Carbon Storage Will Loss in a Desertification Area? Multiple Policy Scenario Analysis from Gansu Province. Sci. Total Environ. 2024, 913, 169668. [Google Scholar] [CrossRef] [PubMed]
- Zhao, Y.; Wang, M.; Lan, T.; Xu, Z.; Wu, J.; Liu, Q.; Peng, J. Distinguishing the Effects of Land Use Policies on Ecosystem Services and Their Trade-Offs Based on Multi-Scenario Simulations. Appl. Geogr. 2023, 151, 102864. [Google Scholar] [CrossRef]
- Doelman, J.C.; Stehfest, E.; Tabeau, A.; Van Meijl, H.; Lassaletta, L.; Gernaat, D.E.H.J.; Hermans, K.; Harmsen, M.; Daioglou, V.; Biemans, H.; et al. Exploring SSP Land-Use Dynamics Using the IMAGE Model: Regional and Gridded Scenarios of Land-Use Change and Land-Based Climate Change Mitigation. Glob. Environ. Chang. 2018, 48, 119–135. [Google Scholar] [CrossRef]
- Wang, Z.; Li, X.; Mao, Y.; Li, L.; Wang, X.; Lin, Q. Dynamic Simulation of Land Use Change and Assessment of Carbon Storage Based on Climate Change Scenarios at the City Level: A Case Study of Bortala, China. Ecol. Indic. 2022, 134, 108499. [Google Scholar] [CrossRef]
- Tian, L.; Tao, Y.; Fu, W.; Li, T.; Ren, F.; Li, M. Dynamic Simulation of Land Use/Cover Change and Assessment of Forest Ecosystem Carbon Storage under Climate Change Scenarios in Guangdong Province, China. Remote Sens. 2022, 14, 2330. [Google Scholar] [CrossRef]
- Li, M.; Luo, H.; Qin, Z.; Tong, Y. Spatial-Temporal Simulation of Carbon Storage Based on Land Use in Yangtze River Delta under SSP-RCP Scenarios. Land 2023, 12, 399. [Google Scholar] [CrossRef]
- Bai, T.; Fan, L.; Song, G.; Song, H.; Ru, X.; Wang, Y.; Zhang, H.; Min, R.; Wang, W. Effects of Land Use/Cover and Meteorological Changes on Regional Climate under Different SSP-RCP Scenarios: A Case Study in Zhengzhou, China. Remote Sens. 2023, 15, 2601. [Google Scholar] [CrossRef]
- Wu, J.; Luo, J.; Zhang, H.; Qin, S.; Yu, M. Projections of Land Use Change and Habitat Quality Assessment by Coupling Climate Change and Development Patterns. Sci. Total Environ. 2022, 847, 157491. [Google Scholar] [CrossRef]
- Gao, F.; Xin, X.; Song, J.; Li, X.; Zhang, L.; Zhang, Y.; Liu, J. Simulation of LUCC Dynamics and Estimation of Carbon Stock under Different SSP-RCP Scenarios in Heilongjiang Province. Land 2023, 12, 1665. [Google Scholar] [CrossRef]
- Li, Y.; Yao, S.; Jiang, H.; Wang, H.; Ran, Q.; Gao, X.; Ding, X.; Ge, D. Spatial-Temporal Evolution and Prediction of Carbon Storage: An Integrated Framework Based on the MOP–PLUS–InVEST Model and an Applied Case Study in Hangzhou, East China. Land 2022, 11, 2213. [Google Scholar] [CrossRef]
- Zhang, P.; Liu, L.; Yang, L.; Zhao, J.; Li, Y.; Qi, Y.; Ma, X.; Cao, L. Exploring the Response of Ecosystem Service Value to Land Use Changes under Multiple Scenarios Coupling a Mixed-Cell Cellular Automata Model and System Dynamics Model in Xi’an, China. Ecol. Indic. 2023, 147, 110009. [Google Scholar] [CrossRef]
- Huang, Z.; Li, X.; Du, H.; Mao, F.; Han, N.; Fan, W.; Xu, Y.; Luo, X. Simulating Future LUCC by Coupling Climate Change and Human Effects Based on Multi-Phase Remote Sensing Data. Remote Sens. 2022, 14, 1698. [Google Scholar] [CrossRef]
- Lu, Z.; Li, W.; Yue, R. Investigation of the Long-Term Supply–Demand Relationships of Ecosystem Services at Multiple Scales under SSP–RCP Scenarios to Promote Ecological Sustainability in China’s Largest City Cluster. Sustain. Cities Soc. 2024, 104, 105295. [Google Scholar] [CrossRef]
- Xu, W.; Xu, H.; Li, X.; Qiu, H.; Wang, Z. Ecosystem Services Response to Future Land Use/Cover Change (LUCC) under Multiple Scenarios: A Case Study of the Beijing-Tianjin-Hebei (BTH) Region, China. Technol. Forecast. Soc. Chang. 2024, 205, 123525. [Google Scholar] [CrossRef]
- Wang, X.-L.; Feng, A.-Q.; Hou, X.-Y.; Chao, Q.-C.; Song, B.-Y.; Liu, Y.-B.; Wang, Q.-G.; Xu, H.; Zhang, Y.-X.; Li, D.; et al. Compound Extreme Inundation Risk of Coastal Wetlands Caused by Climate Change and Anthropogenic Activities in the Yellow River Delta, China. Adv. Clim. Chang. Res. 2024, 15, 134–147. [Google Scholar] [CrossRef]
- Liang, X.; Liu, X.; Li, D.; Zhao, H.; Chen, G. Urban Growth Simulation by Incorporating Planning Policies into a CA-Based Future Land-Use Simulation Model. Int. J. Geogr. Inf. Sci. 2018, 32, 2294–2316. [Google Scholar] [CrossRef]
- Liu, D.; Zheng, X.; Wang, H. Land-Use Simulation and Decision-Support System (LandSDS): Seamlessly Integrating System Dynamics, Agent-Based Model, and Cellular Automata. Ecol. Model. 2020, 417, 108924. [Google Scholar] [CrossRef]
- Xu, J.; Renaud, F.G.; Barrett, B. Modelling Land System Evolution and Dynamics of Terrestrial Carbon Stocks in the Luanhe River Basin, China: A Scenario Analysis of Trade-Offs and Synergies between Sustainable Development Goals. Sustain. Sci. 2022, 17, 1323–1345. [Google Scholar] [CrossRef] [PubMed]
- Liang, X.; Liu, X.; Li, X.; Chen, Y.; Tian, H.; Yao, Y. Delineating Multi-Scenario Urban Growth Boundaries with a CA-Based FLUS Model and Morphological Method. Landsc. Urban Plan. 2018, 177, 47–63. [Google Scholar] [CrossRef]
- Gao, L.; Tao, F.; Liu, R.; Wang, Z.; Leng, H.; Zhou, T. Multi-Scenario Simulation and Ecological Risk Analysis of Land Use Based on the PLUS Model: A Case Study of Nanjing. Sustain. Cities Soc. 2022, 85, 104055. [Google Scholar] [CrossRef]
- Liang, X.; Guan, Q.; Clarke, K.C.; Liu, S.; Wang, B.; Yao, Y. Understanding the Drivers of Sustainable Land Expansion Using a Patch-Generating Land Use Simulation (PLUS) Model: A Case Study in Wuhan, China. Comput. Environ. Urban Syst. 2021, 85, 101569. [Google Scholar] [CrossRef]
- Nie, W.; Xu, B.; Yang, F.; Shi, Y.; Liu, B.; Wu, R.; Lin, W.; Pei, H.; Bao, Z. Simulating Future Land Use by Coupling Ecological Security Patterns and Multiple Scenarios. Sci. Total Environ. 2023, 859, 160262. [Google Scholar] [CrossRef] [PubMed]
- Wang, Y.; Li, M.; Jin, G. Optimizing Spatial Patterns of Ecosystem Services in the Chang-Ji-Tu Region (China) through Bayesian Belief Network and Multi-Scenario Land Use Simulation. Sci. Total Environ. 2024, 917, 170424. [Google Scholar] [CrossRef] [PubMed]
- Shi, X.; Wu, L.; Zheng, Y.; Zhang, X.; Wang, Y.; Chen, Q.; Sun, Z.; Nie, T. Dynamic Estimation of Mangrove Carbon Storage in Hainan Island Based on the InVEST-PLUS Model. Forests 2024, 15, 750. [Google Scholar] [CrossRef]
- Ma, Q.; Li, Y.; Xu, L. Identification of Green Infrastructure Networks Based on Ecosystem Services in a Rapidly Urbanizing Area. J. Clean. Prod. 2021, 300, 126945. [Google Scholar] [CrossRef]
- Li, Y.; Ma, Q.; Song, Y.; Han, H. Bringing Conservation Priorities into Urban Growth Simulation: An Integrated Model and Applied Case Study of Hangzhou, China. Resour. Conserv. Recycl. 2019, 140, 324–337. [Google Scholar] [CrossRef]
- WorldClim. Available online: https://worldclim.org/ (accessed on 8 June 2024).
- Wang, T.; Sun, F. Global Gridded GDP Data Set Consistent with the Shared Socioeconomic Pathways. Sci. Data 2022, 9, 221. [Google Scholar] [CrossRef] [PubMed]
- Chen, Y.; Guo, F.; Wang, J.; Cai, W.; Wang, C.; Wang, K. Provincial and Gridded Population Projection for China under Shared Socioeconomic Pathways from 2010 to 2100. Sci. Data 2020, 7, 83. [Google Scholar] [CrossRef] [PubMed]
- Cook, B.I.; Mankin, J.S.; Marvel, K.; Williams, A.P.; Smerdon, J.E.; Anchukaitis, K.J. Twenty-First Century Drought Projections in the CMIP6 Forcing Scenarios. Earth’s Future 2020, 8, e2019EF001461. [Google Scholar] [CrossRef]
- Eyring, V.; Bony, S.; Meehl, G.A.; Senior, C.A.; Stevens, B.; Stouffer, R.J.; Taylor, K.E. Overview of the Coupled Model Intercomparison Project Phase 6 (CMIP6) Experimental Design and Organization. Geosci. Model Dev. 2016, 9, 1937–1958. [Google Scholar] [CrossRef]
- O’Neill, B.C.; Tebaldi, C.; van Vuuren, D.P.; Eyring, V.; Friedlingstein, P.; Hurtt, G.; Knutti, R.; Kriegler, E.; Lamarque, J.-F.; Lowe, J.; et al. The Scenario Model Intercomparison Project (ScenarioMIP) for CMIP6. Geosci. Model Dev. 2016, 9, 3461–3482. [Google Scholar] [CrossRef]
- Li, J.; Chen, X.; Kurban, A.; Van de Voorde, T.; De Maeyer, P.; Zhang, C. Coupled SSPs-RCPs Scenarios to Project the Future Dynamic Variations of Water-Soil-Carbon-Biodiversity Services in Central Asia. Ecol. Indic. 2021, 129, 107936. [Google Scholar] [CrossRef]
- Cai, G.; Xiong, J.; Wen, L.; Weng, A.; Lin, Y.; Li, B. Predicting the Ecosystem Service Values and Constructing Ecological Security Patterns in Future Changing Land Use Patterns. Ecol. Indic. 2023, 154, 110787. [Google Scholar] [CrossRef]
- Gao, J.; Gong, J.; Li, Y.; Yang, J.; Liang, X. Ecological Network Assessment in Dynamic Landscapes: Multi-Scenario Simulation and Conservation Priority Analysis. Land Use Policy 2024, 139, 107059. [Google Scholar] [CrossRef]
- Tang, J.; Song, P.; Hu, X.; Chen, C.; Wei, B.; Zhao, S. Coupled Effects of Land Use and Climate Change on Water Supply in SSP–RCP Scenarios: A Case Study of the Ganjiang River Basin, China. Ecol. Indic. 2023, 154, 110745. [Google Scholar] [CrossRef]
- Huang, H.; Xue, J.; Feng, X.; Zhao, J.; Sun, H.; Hu, Y.; Ma, Y. Thriving Arid Oasis Urban Agglomerations: Optimizing Ecosystem Services Pattern under Future Climate Change Scenarios Using Dynamic Bayesian Network. J. Environ. Manag. 2024, 350, 119612. [Google Scholar] [CrossRef]
- Wang, Q.; Guan, Q.; Sun, Y.; Du, Q.; Xiao, X.; Luo, H.; Zhang, J.; Mi, J. Simulation of Future Land Use/Cover Change (LUCC) in Typical Watersheds of Arid Regions under Multiple Scenarios. J. Environ. Manag. 2023, 335, 117543. [Google Scholar] [CrossRef] [PubMed]
- Zhang, S.; Zhong, Q.; Cheng, D.; Xu, C.; Chang, Y.; Lin, Y.; Li, B. Landscape Ecological Risk Projection Based on the PLUS Model under the Localized Shared Socioeconomic Pathways in the Fujian Delta Region. Ecol. Indic. 2022, 136, 108642. [Google Scholar] [CrossRef]
- Xu, L.; Liu, X.; Tong, D.; Liu, Z.; Yin, L.; Zheng, W. Forecasting Urban Land Use Change Based on Cellular Automata and the PLUS Model. Land 2022, 11, 652. [Google Scholar] [CrossRef]
- Wang, J.; Zhang, J.; Xiong, N.; Liang, B.; Wang, Z.; Cressey, E.L. Spatial and Temporal Variation, Simulation and Prediction of Land Use in Ecological Conservation Area of Western Beijing. Remote Sens. 2022, 14, 1452. [Google Scholar] [CrossRef]
- Shi, Q.; Gu, C.-J.; Xiao, C. Multiple Scenarios Analysis on Land Use Simulation by Coupling Socioeconomic and Ecological Sustainability in Shanghai, China. Sustain. Cities Soc. 2023, 95, 104578. [Google Scholar] [CrossRef]
- He, Z.; Wang, X.; Liang, X.; Wu, L.; Yao, J. Integrating Spatiotemporal Co-Evolution Patterns of Land Types with Cellular Automata to Enhance the Reliability of Land Use Projections. Int. J. Geogr. Inf. Sci. 2024, 38, 956–980. [Google Scholar] [CrossRef]
- Jing, X.; Tian, G.; He, Y.; Wang, M. Spatial and Temporal Differentiation and Coupling Analysis of Land Use Change and Ecosystem Service Value in Jiangsu Province. Ecol. Indic. 2024, 163, 112076. [Google Scholar] [CrossRef]
- Li, Y.; Ding, X.; Yao, S.; Zhang, B.; Jiang, H.; Zhang, J.; Liu, X. Multiscale Ecological Zoning Management with Coupled Ecosystem Service Bundles and Supply–Demand Balance, the Case of Hangzhou, China. Land 2024, 13, 360. [Google Scholar] [CrossRef]
- Sun, Y.; Liu, S.; Dong, Y.; An, Y.; Shi, F.; Dong, S.; Liu, G. Spatio-Temporal Evolution Scenarios and the Coupling Analysis of Ecosystem Services with Land Use Change in China. Sci. Total Environ. 2019, 681, 211–225. [Google Scholar] [CrossRef] [PubMed]
- He, W.; Li, X.; Yang, J.; Ni, H.; Sang, X. How Land Use Functions Evolve in the Process of Rapid Urbanization: Evidence from Jiangsu Province, China. J. Clean. Prod. 2022, 380, 134877. [Google Scholar] [CrossRef]
- He, N.; Zhou, Y.; Wang, L.; Li, Q.; Zuo, Q.; Liu, J. Spatiotemporal Differentiation and the Coupling Analysis of Ecosystem Service Value with Land Use Change in Hubei Province, China. Ecol. Indic. 2022, 145, 109693. [Google Scholar] [CrossRef]
- Wang, H.; Wu, L.; Yue, Y.; Jin, Y.; Zhang, B. Impacts of Climate and Land Use Change on Terrestrial Carbon Storage: A Multi-Scenario Case Study in the Yellow River Basin (1992–2050). Sci. Total Environ. 2024, 930, 172557. [Google Scholar] [CrossRef]
- Li, P.; Yu, Y.; Wang, Z.; Zhang, F. Analysis of the External Attraction of Shanghai Urban Functions Based on the Travel Characteristics. Urban Inform. 2024, 3, 11. [Google Scholar] [CrossRef]
- Gu, X.; Tang, X.; Chen, T.; Liu, X. Predicting the Network Shift of Large Urban Agglomerations in China Using the Deep-Learning Gravity Model: A Perspective of Population Migration. Cities 2024, 145, 104680. [Google Scholar] [CrossRef]
- Levin, N.; Kyba, C.C.M.; Zhang, Q.; Sánchez de Miguel, A.; Román, M.O.; Li, X.; Portnov, B.A.; Molthan, A.L.; Jechow, A.; Miller, S.D.; et al. Remote Sensing of Night Lights: A Review and an Outlook for the Future. Remote Sens. Environ. 2020, 237, 111443. [Google Scholar] [CrossRef]
- Chen, Z.; Wei, Y.; Shi, K.; Zhao, Z.; Wang, C.; Wu, B.; Qiu, B.; Yu, B. The Potential of Nighttime Light Remote Sensing Data to Evaluate the Development of Digital Economy: A Case Study of China at the City Level. Comput. Environ. Urban Syst. 2022, 92, 101749. [Google Scholar] [CrossRef]
- Hou, H.; Zhou, B.-B.; Pei, F.; Hu, G.; Su, Z.; Zeng, Y.; Zhang, H.; Gao, Y.; Luo, M.; Li, X. Future Land Use/Land Cover Change Has Nontrivial and Potentially Dominant Impact on Global Gross Primary Productivity. Earth’s Future 2022, 10, e2021EF002628. [Google Scholar] [CrossRef]
- Yue, W.; Xia, H.; Liu, Y.; Xu, J.; Xiong, J. Assessing Ecological Conservation Redline from Element, Structure, and Function Dimensions: A Case of Zhejiang Province, China. Environ. Impact Assess. Rev. 2024, 106, 107485. [Google Scholar] [CrossRef]
- Zhou, T.; Yang, X.; Ke, X. Delimitation of Urban Growth Boundaries by Integratedly Incorporating Ecosystem Conservation, Cropland Protection and Urban Compactness. Ecol. Model. 2022, 468, 109963. [Google Scholar] [CrossRef]
- Pandey, A.K.; Pandey, M.; Tripathi, B.D. Air Pollution Tolerance Index of Climber Plant Species to Develop Vertical Greenery Systems in a Polluted Tropical City. Landsc. Urban Plan. 2015, 144, 119–127. [Google Scholar] [CrossRef]
- Yao, S.; Huang, G.; Chen, Z. Evaluation of Urban Flood Adaptability Based on the InVEST Model and GIS: A Case Study of New York City, USA. Nat. Hazards 2024, 024, 06632. [Google Scholar] [CrossRef]
- Serra, V.; Bianco, L.; Candelari, E.; Giordano, R.; Montacchini, E.; Tedesco, S.; Larcher, F.; Schiavi, A. A Novel Vertical Greenery Module System for Building Envelopes: The Results and Outcomes of a Multidisciplinary Research Project. Energy Build. 2017, 146, 333–352. [Google Scholar] [CrossRef]
- Xu, J.; Barrett, B.; Renaud, F.G. Ecosystem Services and Disservices in the Luanhe River Basin in China under Past, Current and Future Land Uses: Implications for the Sustainable Development Goals. Sustain. Sci. 2022, 17, 1347–1364. [Google Scholar] [CrossRef]
- Li, S.-Y.; Miao, L.-J.; Jiang, Z.-H.; Wang, G.-J.; Gnyawali, K.R.; Zhang, J.; Zhang, H.; Fang, K.; He, Y.; Li, C. Projected Drought Conditions in Northwest China with CMIP6 Models under Combined SSPs and RCPs for 2015–2099. Adv. Clim. Chang. Res. 2020, 11, 210–217. [Google Scholar] [CrossRef]
- Guo, H.; He, S.; Li, M.; Bao, A.; Chen, T.; Zheng, G.; De Maeyer, P. Future Changes of Drought Characteristics in Coupled Model Intercomparison Project Phase 6 Shared Socioeconomic Pathway Scenarios over Central Asia. Int. J. Climatol. 2022, 42, 3888–3908. [Google Scholar] [CrossRef]
- Wang, L.; Zhang, S.; Tang, L.; Lu, Y.; Liu, Y.; Liu, Y. Optimizing Distribution of Urban Land on the Basis of Urban Land Use Intensity at Prefectural City Scale in Mainland China. Land Use Policy 2022, 115, 106037. [Google Scholar] [CrossRef]


| Data | Year | Source |
|---|---|---|
| Land use data | 2000, 2005, 2010, 2015, 2020 | https://www.resdc.cn (accessed on 9 May 2024) |
| Historical GDP density | 2019 | |
| Historical population density | 2019 | |
| DEM | 2015 | https://www.gscloud.cn/ (accessed on 9 May 2024) |
| Annual average temperature | 2000–2020 | https://www.geodata.cn (accessed on 9 May 2024) |
| Annual precipitation | 2000–2020 | |
| Night light data | 2020 | |
| Socioeconomic data | 2000–2020 | https://tjj.hangzhou.gov.cn/ and http://tjj.zj.gov.cn/ (accessed on 9 May 2024) |
| Road data | 2020 | https://www.openstreetmap.org (accessed on 9 May 2024) |
| Future GDP density | 2020–2050 | [58] |
| Future population density | 2020–2050 | [59] |
| Future annual precipitation | 2020–2050 | https://worldclim.org/ (accessed on 9 May 2024) |
| Future annual average temperature | 2020–2050 |
| Main Equations | Unit |
|---|---|
| Population = INTEG (Population change, 701.70) | ten thousand |
| Population change = Population × Population change rate | |
| GDP = INTEG (GDP change, 1395.67) | hundred million |
| GDP change = GDP × GDP change rate | |
| Fixed investment = GDP × Fixed investment proportion × 10,000 | ten thousand |
| Primary industry investment = Fixed investment × Primary industry investment proportion | |
| Secondary and tertiary industry investment = Fixed investment × Secondary and tertiary industry investment proportion | |
| Livestock investment = Primary industry investment × Livestock investment proportion | |
| Forestry investment = Primary industry investment × Forestry investment proportion | |
| Fishery investment = Primary industry investment × Fishery investment proportion | |
| Agricultural investment = Primary industry investment × Agricultural investment proportion | |
| Urban population = Population × Urban population ratio | |
| Rural population = Population × (1 − Urban population ratio) | |
| Livestock product demand = Population × Per capita livestock product demand × 10 | t |
| Forestry product demand = Population × Per capita forestry demand × 10 | |
| Aquatic product demand = Population × Per capita aquatic product demand × 10 | |
| Food demand = Population × Per capita food demand × 10 | |
| Urban construction land demand = Urban population × Per capita urban construction land demand | m2 |
| Rural construction land demand = Rural population × Per capita rural construction land demand | |
| Cultivated land = 4,113,653,430.269395 − 47.6988228 × Agricultural investment − 0.704891286 × Construction land − 33.3134561 × Food demand + 15,868,922.3 × Annual average temperature + 15722.8946 × Annual precipitation | |
| Forest = 10,606,808,632.558468 + 0.26504743 × Cultivated land + 581,586.827 × Annual average temperature − 5629.89304 × Annual precipitation + 510.302416 × Forestry investment + 51.4650807 × Forestry product demand | |
| Grassland = 502,040,720.9347341 + 0.0847 × Cultivated land − 2,489,243.88 × Annual average temperature + 3082.81077 × Annual precipitation − 26.5026233 × Livestock investment − 3.68764249 × Livestock product demand | |
| Water = −30,982,590.42027104 − 418.865363 × Aquatic product demand −226.224045 × Fishery investment 18,513,262.7 × Annual average temperature − 15,452.7109 × Annual precipitation | |
| Construction land = −30,982,590.42027104 + 1.18422594 × Urban construction demand + 0.94929414 × Rural construction land demand − 0.00273347 × Secondary and tertiary industry investment | |
| Unused land = 16,858,054,800 − Construction land change − Grassland change − Forest change − Water change − Cultivated land change |
| Category | Driving Factors |
|---|---|
| Socioeconomic factors | Distance to highway |
| Distance to main roads | |
| Distance to railroad | |
| GDP density | |
| Night light | |
| Population density | |
| Climate factors | Annual average temperature |
| Annual precipitation | |
| Environmental factors | DEM |
| Slope |
| 2005 | 2010 | 2015 | 2020 | ||
|---|---|---|---|---|---|
| Cultivated land | Actual value (m2) | 3,242,344,500 | 3,197,394,000 | 3,033,113,400 | 2,903,287,500 |
| Simulated value (m2) | 3,266,580,000 | 3,178,470,000 | 3,050,200,000 | 2,901,610,000 | |
| Error rate | 0.75% | −0.59% | 0.56% | −0.06% | |
| Forest | Actual value (m2) | 11,489,677,200 | 11,459,440,800 | 11,459,448,900 | 11,412,761,400 |
| Simulated value (m2) | 11,491,500,000 | 11,469,400,000 | 11,456,200,000 | 11,417,800,000 | |
| Error rate | 0.02% | 0.09% | −0.03% | 0.04% | |
| Grassland | Actual value (m2) | 382,710,600 | 392,903,100 | 389,673,000 | 392,877,900 |
| Simulated value (m2) | 386,699,000 | 390,392,000 | 392,301,000 | 392,722,000 | |
| Error rate | 1.04% | −0.64% | 0.67% | −0.04% | |
| Water | Actual value (m2) | 962,687,700 | 885,378,600 | 882,504,000 | 881,885,700 |
| Simulated value (m2) | 937,958,000 | 904,677,000 | 864,375,000 | 867,438,000 | |
| Error rate | −2.57% | 2.18% | −2.05% | −1.64% | |
| Construction land | Actual value (m2) | 774,451,800 | 916,713,000 | 1,087,271,100 | 1,261,166,400 |
| Simulated value (m2) | 775,904,000 | 916,645,000 | 1,086,000,000 | 1,263,170,000 | |
| Error rate | 0.19% | −0.01% | −0.12% | 0.16% | |
| Unused land | Actual value (m2) | 6,183,000 | 6,225,300 | 6,044,400 | 6,075,900 |
| Simulated value (m2) | 5,863,560 | 6,036,450 | 5,719,400 | 6,113,900 | |
| Error rate | −5.17% | −3.03% | −5.38% | 0.63% |
| 2030 | 2040 | 2050 | ||||||||
|---|---|---|---|---|---|---|---|---|---|---|
| SSP126 | SSP245 | SSP585 | SSP126 | SSP245 | SSP585 | SSP126 | SSP245 | SSP585 | ||
| Cultivated land | Area (km2) | 2849.63 | 2829.42 | 2778.32 | 2803.94 | 2784.01 | 2648.15 | 2796.07 | 2759.22 | 2553.05 |
| Proportion | 16.90% | 16.79% | 16.48% | 16.63% | 16.52% | 15.71% | 16.59% | 16.37% | 15.14% | |
| Forest | Area (km2) | 11,419.24 | 11,415.14 | 11,407.29 | 11,415.21 | 11,411.68 | 11,392.56 | 11,416.79 | 11,408.88 | 11,382.77 |
| Proportion | 67.74% | 67.71% | 67.67% | 67.72% | 67.69% | 67.58% | 67.72% | 67.68% | 67.52% | |
| Grassland | Area (km2) | 393.79 | 393.95 | 394.35 | 394.35 | 394.36 | 395.69 | 394.19 | 394.35 | 396.36 |
| Proportion | 2.34% | 2.34% | 2.34% | 2.34% | 2.34% | 2.35% | 2.34% | 2.34% | 2.35% | |
| Water | Area (km2) | 857.41 | 856.84 | 853.22 | 849.72 | 850.59 | 836.75 | 848.96 | 850.09 | 826.97 |
| Proportion | 5.09% | 5.08% | 5.06% | 5.04% | 5.05% | 4.96% | 5.04% | 5.04% | 4.91% | |
| Construction land | Area (km2) | 1332.15 | 1356.88 | 1419.12 | 1389.21 | 1411.83 | 1579.60 | 1396.49 | 1439.96 | 1693.92 |
| Proportion | 7.90% | 8.05% | 8.42% | 8.24% | 8.37% | 9.37% | 8.28% | 8.54% | 10.05% | |
| Unused land | Area (km2) | 5.82 | 5.82 | 5.75 | 5.63 | 5.59 | 5.31 | 5.56 | 5.54 | 4.99 |
| Proportion | 0.03% | 0.03% | 0.03% | 0.03% | 0.03% | 0.03% | 0.03% | 0.03% | 0.03% | |
| Total land | Area (km2) | 16,858.04 | 16,858.04 | 16,858.04 | 16,858.04 | 16,858.04 | 16,858.04 | 16,858.04 | 16,858.04 | 16,858.04 |
| Proportion | 100.00% | 100.00% | 100.00% | 100.00% | 100.00% | 100.00% | 100.00% | 100.00% | 100.00% | |
| 2030 | 2040 | 2050 | |||||||
|---|---|---|---|---|---|---|---|---|---|
| SSP126 | SSP245 | SSP585 | SSP126 | SSP245 | SSP585 | SSP126 | SSP245 | SSP585 | |
| Gongshu | 3.5881 | 3.6015 | 3.6289 | 3.6103 | 3.6260 | 3.6623 | 3.6134 | 3.6349 | 3.6784 |
| Shangcheng | 3.5031 | 3.4259 | 3.4313 | 3.5083 | 3.4640 | 3.5291 | 3.5094 | 3.4676 | 3.5329 |
| Xiacheng | 3.9586 | 3.9626 | 3.9690 | 3.9665 | 3.9683 | 3.9714 | 3.9671 | 3.9695 | 3.9746 |
| Jianggan | 3.4659 | 3.4763 | 3.4908 | 3.4771 | 3.4902 | 3.5288 | 3.4786 | 3.4950 | 3.5412 |
| Xihu | 2.8116 | 2.8154 | 2.8312 | 2.8232 | 2.8293 | 2.8713 | 2.8252 | 2.8366 | 2.8924 |
| Binjiang | 3.4992 | 3.4715 | 3.4832 | 3.5047 | 3.4848 | 3.5243 | 3.5056 | 3.4877 | 3.5312 |
| Xiaoshan | 2.9185 | 2.9242 | 2.9403 | 2.9307 | 2.9380 | 2.9906 | 2.9330 | 2.9460 | 3.0271 |
| Yuhang | 2.8241 | 2.8292 | 2.8415 | 2.8338 | 2.8396 | 2.8664 | 2.8355 | 2.8451 | 2.8831 |
| Fuyang | 2.3455 | 2.3479 | 2.3535 | 2.3484 | 2.3525 | 2.3658 | 2.3488 | 2.3547 | 2.3745 |
| Linan | 2.1658 | 2.1667 | 2.1683 | 2.1662 | 2.1678 | 2.1715 | 2.1662 | 2.1683 | 2.1733 |
| Tonglu | 2.2197 | 2.2212 | 2.2229 | 2.2203 | 2.2226 | 2.2263 | 2.2204 | 2.2231 | 2.2279 |
| Chun’an | 2.0882 | 2.0879 | 2.0885 | 2.0882 | 2.0883 | 2.0902 | 2.0882 | 2.0885 | 2.0907 |
| Jiande | 2.1712 | 2.1738 | 2.1755 | 2.1714 | 2.1761 | 2.1820 | 2.1715 | 2.1766 | 2.1846 |
| Hangzhou | 2.3267 | 2.3294 | 2.3299 | 2.3285 | 2.3323 | 2.3341 | 2.3328 | 2.3442 | 2.3510 |
Disclaimer/Publisher’s Note: The statements, opinions and data contained in all publications are solely those of the individual author(s) and contributor(s) and not of MDPI and/or the editor(s). MDPI and/or the editor(s) disclaim responsibility for any injury to people or property resulting from any ideas, methods, instructions or products referred to in the content. |
© 2024 by the authors. Licensee MDPI, Basel, Switzerland. This article is an open access article distributed under the terms and conditions of the Creative Commons Attribution (CC BY) license (https://creativecommons.org/licenses/by/4.0/).
Share and Cite
Yao, S.; Li, Y.; Jiang, H.; Wang, X.; Ran, Q.; Ding, X.; Wang, H.; Ding, A. Predicting Land Use Changes under Shared Socioeconomic Pathway–Representative Concentration Pathway Scenarios to Support Sustainable Planning in High-Density Urban Areas: A Case Study of Hangzhou, Southeastern China. Buildings 2024, 14, 2165. https://doi.org/10.3390/buildings14072165
Yao S, Li Y, Jiang H, Wang X, Ran Q, Ding X, Wang H, Ding A. Predicting Land Use Changes under Shared Socioeconomic Pathway–Representative Concentration Pathway Scenarios to Support Sustainable Planning in High-Density Urban Areas: A Case Study of Hangzhou, Southeastern China. Buildings. 2024; 14(7):2165. https://doi.org/10.3390/buildings14072165
Chicago/Turabian StyleYao, Song, Yonghua Li, Hezhou Jiang, Xiaohan Wang, Qinchuan Ran, Xinyi Ding, Huarong Wang, and Anqi Ding. 2024. "Predicting Land Use Changes under Shared Socioeconomic Pathway–Representative Concentration Pathway Scenarios to Support Sustainable Planning in High-Density Urban Areas: A Case Study of Hangzhou, Southeastern China" Buildings 14, no. 7: 2165. https://doi.org/10.3390/buildings14072165