Article

Intelligent Identification of Surrounding Rock Grades Based on a Self-Developed Rock Drilling Test System

1
Qingdao Metro Line 6 Co., Ltd., Qingdao 266427, China
2
Geotechnical and Structural Engineering Research Center, Shandong University, Jinan 250061, China
3
Shandong Transportation Institute, Jinan 250031, China
4
China Railway First Bureau Group Fifth Engineering Co., Ltd., Baoji 721000, China
*
Author to whom correspondence should be addressed.
Buildings 2024, 14(7), 2176; https://doi.org/10.3390/buildings14072176
Submission received: 15 May 2024 / Revised: 10 June 2024 / Accepted: 2 July 2024 / Published: 15 July 2024

Abstract

:
The classification of surrounding rock is crucial for formulating safe tunnel construction plans and support measures. However, the complex geological environment of tunnels presents a challenge in obtaining accurate drilling parameters for rock mass classification. This paper presents the development of a rock drilling testing system, which includes a propulsion speed acquisition system, oil pressure acquisition system, air pressure acquisition system, and an automatic data acquisition system. This system enables real-time, high-precision automatic collection and storage of parameters such as propulsion speed, with data collected twice per second for each parameter. Leveraging the Qingdao Metro Line 6 as a case study, we conducted rock mass drilling and constructed a rock mass classification database. By employing kernel density estimation and Pearson correlation analysis, we quantified the correlation between rock mass classification and the drilling parameters. The results indicated that relying on a single drilling parameter is insufficient for accurately determining rock mass classification. Both impact pressure and rotational pressure showed the strongest correlation with rock mass classification, each with a correlation coefficient below −0.8 (indicating a strong negative correlation). Outlier values of drilling parameters were excluded using the interval method. Based on the remaining data, we established an intelligent rock mass classification model using the random forest algorithm. This model demonstrated good accuracy and generalization performance, with an average accuracy exceeding 0.9. The proposed rock drilling testing system, combined with the intelligent rock mass classification model, forms an integrated system for the intelligent identification of rock mass grades. This system has significant implications for the intelligent and safe construction of drill-and-blast tunnels.

1. Introduction

Drilling and blasting method has high flexibility in tunnel construction, can adapt to complex rock types and geological structures, and is widely used [1,2]. The classification of surrounding rocks is essential for tunnel excavation using the drilling and blasting method, as it provides insights into the rock’s strength, deformation characteristics, and stability at the tunnel face. Accurate classification can significantly mitigate the risk of geological hazards such as water and mud inflow, collapses, and rock bursts during excavation. Currently, the most common classification methods for surrounding rocks are the Q system [3,4], Rock Mass Rating (RMR) [5,6,7], and Basic Quality (BQ) systems [8,9,10]. These methods generally require obtaining rock cores through drilling and assessing rock quality indicators like uniaxial compressive strength through laboratory tests. However, accurate assessments depend heavily on expertise and engineering experience; without this, evaluations might be biased.
With advances in artificial intelligence, using machine learning for rapid classification has become a new direction for rock classification [11,12]. Neural networks have performed well in predicting RMR values, taking physical and mechanical parameters such as density, compressive strength, and RQD as inputs. Zheng et al. [13] utilized the least squares support vector machine (LSSVM) to express the implicit relationship between classification indicators and rock mass grades. They established a rock mass classification model using geological forecasting and rock mass strength rebound results as classification indicators. Jalalifar et al. [14] utilized parameters like uniaxial compressive strength, RQD, joints, and groundwater conditions as inputs to develop an intelligent classification model based on a neuro-fuzzy method. Hasegawa et al. [15] explored the applicability of artificial neural networks for classifying rock masses in mountainous tunnels, achieving improved classification accuracy using geophysical datasets (seismic velocity and resistivity). Bressan et al. [16] constructed various intelligent classification models, including multilayer perceptron and random forest models, based on geophysical data and compared their performance differences.
When there is an intrinsic relationship between input and output indicators and a sufficient number of samples are available, machine learning algorithms can continuously optimize classification boundaries through automated analysis and iterative learning. These algorithms have proven to be highly effective in rock mass classification [17,18]. They tend to outperform traditional statistical methods in highly nonlinear problems, with better performance and higher computational efficiency. However, the input parameters for these models are typically obtained through field or laboratory testing, which can be inefficient.
Since drill rigs are in direct contact with rocks during core extraction, parameters such as thrust and torque are indicative of rock quality. Numerous scholars have investigated this relationship to enhance our understanding and application of these parameters in rock quality assessment. Tan et al. [19] utilized the discrete element method (DEM) to simulate the rock-breaking process of drilling rigs. Their findings revealed a strong correlation between the average drilling rate, vibration acceleration, vibration frequency, and the surrounding rock grade. These results were validated through experimental tests conducted at a tunnel site. Torno et al. [20] studied the feasibility of using drilling parameters to predict RMR values and established a fuzzy logic model for predicting geomechanical properties. Mostofi et al. [21] developed a rock strength prediction model based on drilling rate, rotation speed, bit weight, and torque, finding that worn drill bits often overestimate rock strength. Kalantari et al. [22] used limit equilibrium principles, considering factors like contact friction, fracture zones, and drill bit geometry during rotary drilling, to create a theoretical model for estimating rock strength parameters, later validating its accuracy through standard tests. Kalantari et al. [23] found that strength parameters like internal friction angle and cohesion can be estimated from drilling data alone, unaffected by drill bit wear. Lakshminarayana et al. [24] built a mathematical model for estimating rock mechanical properties using drilling variables (thrust, torque, vibration parameters) and acoustic parameters from rotary drilling. They estimated the uniaxial compressive and tensile strengths of sedimentary rocks, noting an estimated error of about 10% through experiments.
This study analyzed the operating principles of drill rigs and identified four drilling parameters closely related to rock quality. Based on this analysis, a rock drilling testing system was developed to efficiently collect these parameters in real time. Using data from Qingdao Metro Line 6, a surrounding rock grade database was constructed, and the correlation between rock grades and the four parameters was quantitatively analyzed. Finally, an intelligent classification model based on the random forest algorithm was built, showing excellent performance. These findings provide a solid foundation for intelligent tunneling and information-based monitoring and management.

2. Development of the Rock Drilling Testing System

2.1. Working Performance of the Down-the-Hole Drill Rig

This study uses the SK150 crawler-mounted surface down-the-hole (DTH) drill rig manufactured by Hubei Shoukai Machinery Co., Ltd. (The company is located in Huangshi City, Hubei Province, China) for drilling operations, as shown in Figure 1. The primary task of the SK150 DTH drill rig is impact drilling, which is accomplished by a hammer. In this study, a threaded bit designed for hydraulic jumbos is used, and the drilling holes are 95 mm in diameter.
The main technical specifications of the SK150 crawler-mounted surface down-the-hole drill rig are shown in Table 1.
By analyzing existing studies [12] and the principles and processes of surrounding rock drilling, it was determined that the four drilling parameters most closely correlated with the surrounding rock grade are propulsion speed, impact pressure, rotary pressure, and propulsion pressure. A detailed explanation of each parameter is as follows:
(1)
Propulsion speed: This measures the drilling speed of the drill bit under various pressures. While multiple factors affect the propulsion speed, it generally reflects the rock mass’s strength and integrity. In general, the speed decreases with increasing rock hardness or integrity.
(2)
Impact pressure: This is the air pressure transferred from the compressor to the hammer in the down-the-hole drilling rig during impact drilling. As the main factor in breaking surrounding rock, impact pressure increases with rock hardness. Additionally, more impact pressure is required for intact rock masses of the same hardness, as they need more force to fracture. Therefore, as rock integrity improves, the average impact pressure required also increases.
(3)
Rotary pressure: This is the oil pressure in the hydraulic cylinder during rotary motion. After the impact, some of the rock mass may remain partially fractured. Under the rotary mechanism, the drill bit rotates, changing its angle to fully crush the rock. Due to the positive correlation between shear and uniaxial compressive strength, rotary pressure rises with increased rock hardness. Also, more intact rock masses require higher rotary pressure, as more rock needs to be cut during rotation.
(4)
Propulsion pressure: This is the oil pressure in the hydraulic cylinder during forward movement. Propulsion pressure ensures the drill bit remains in close contact with the rock. Higher propulsion pressure is needed to maintain this contact when rock strength is higher. More intact rock masses also require higher propulsion pressure because they generate stronger reverse impact pressures, increasing the propulsion force required. Therefore, as rock hardness or integrity increases, so too does the propulsion pressure.

2.2. Development of the Rock Drilling Testing System

The SK150 crawler-mounted surface down-the-hole drill rig used in this study does not have an automatic data recording system for drilling parameters. Instead, the rotary, propulsion, and impact pressures are displayed separately on the hydraulic and air pressure gauges, as shown in Figure 2.
To automatically collect a large volume of drilling parameters, sensors are strategically placed at various locations on the rig. They can record multiple parameters, including the four main drilling parameters: impact pressure, rotary pressure, propulsion pressure, and propulsion speed. Table 2 lists the sensors and their respective measurement methods for each of these parameters.

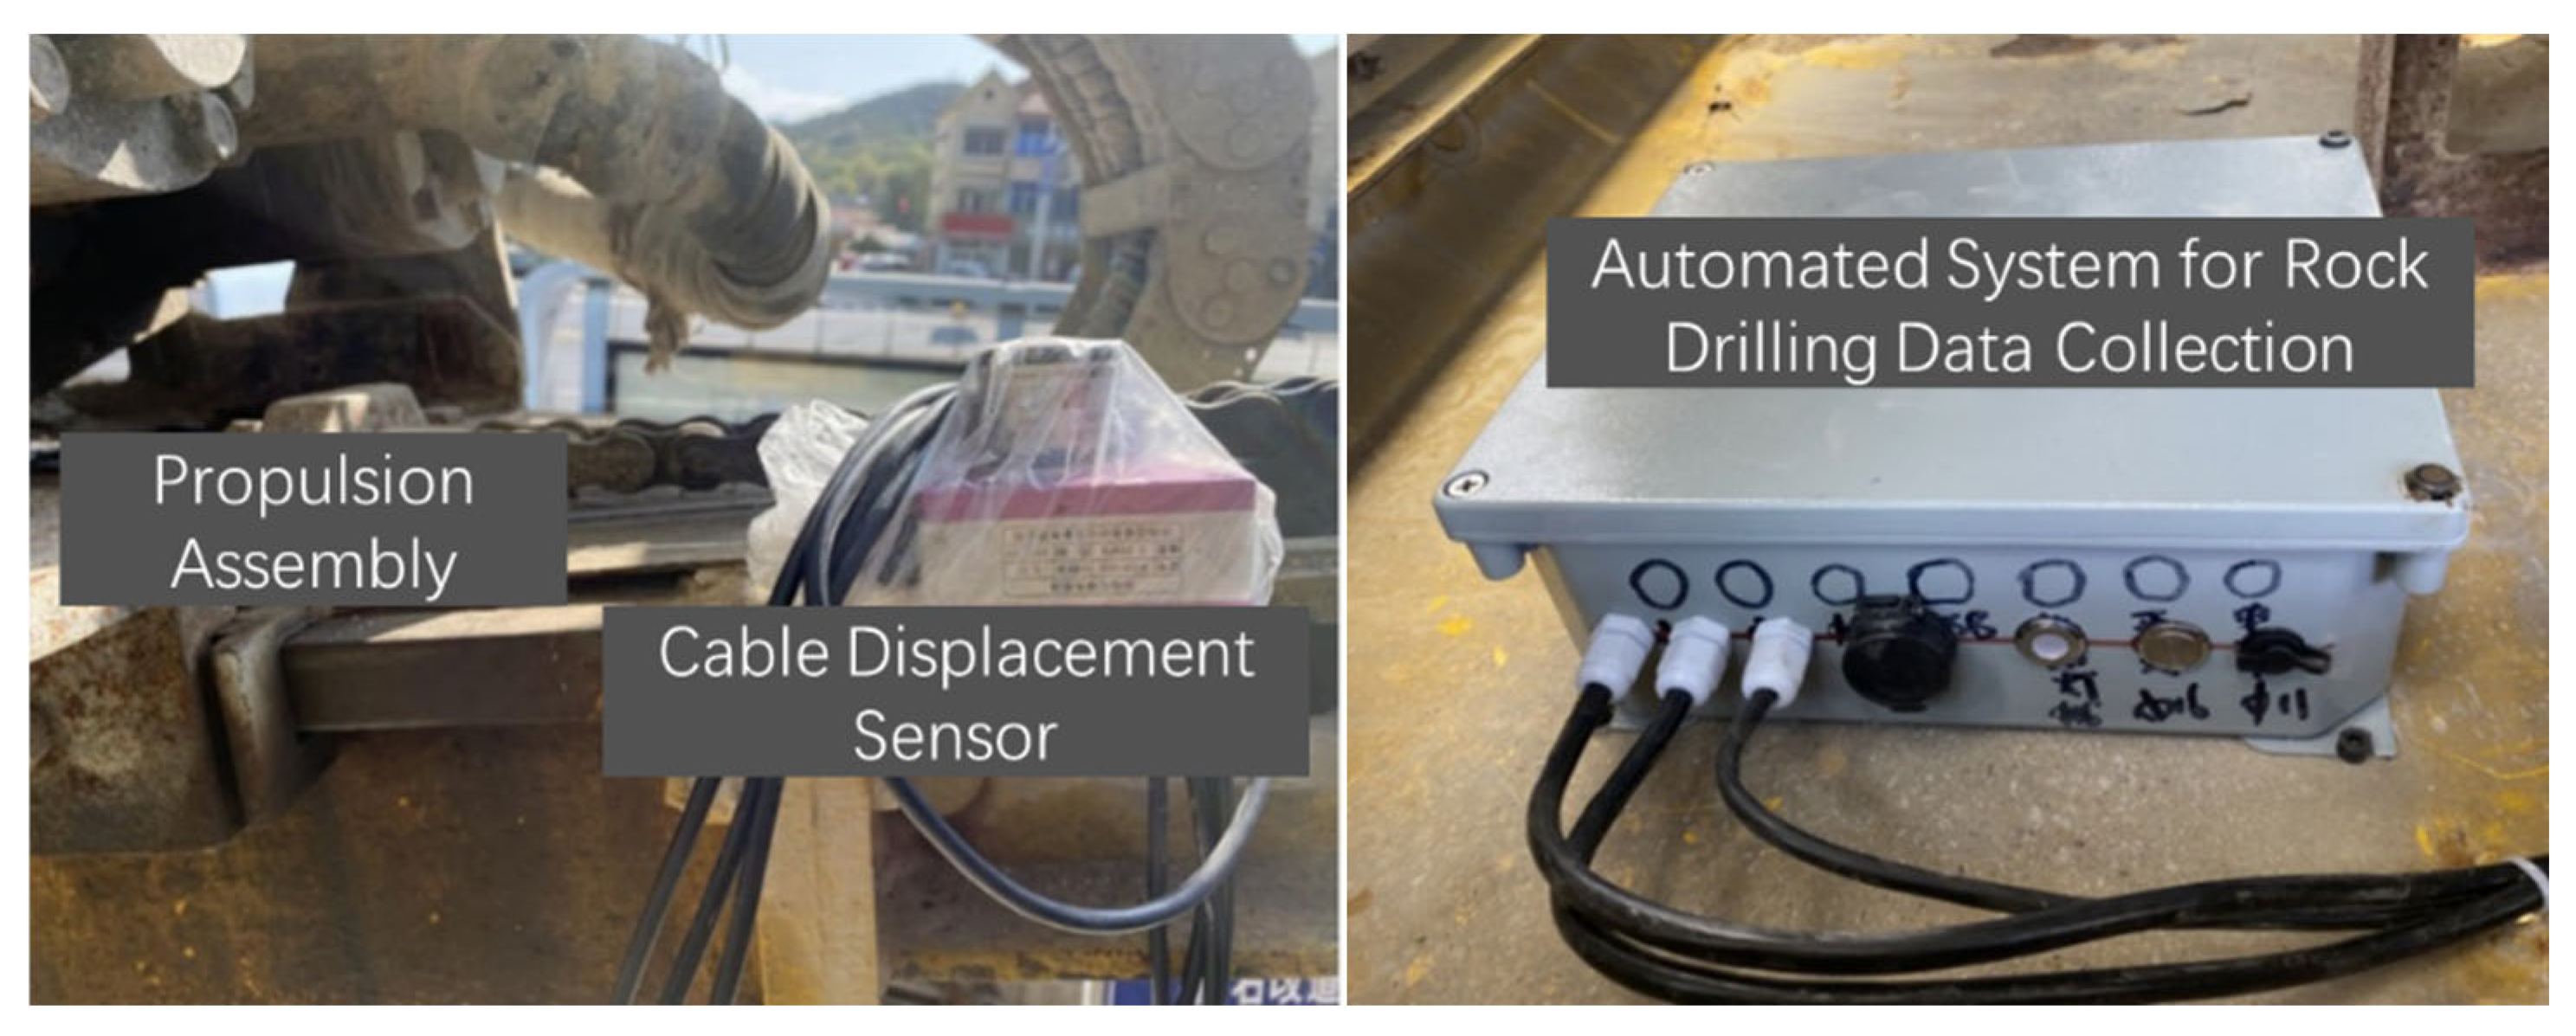
2.2.1. Propulsion Speed Acquisition System

The schematic diagram of the propulsion speed acquisition system is shown in Figure 3.
The actual setup of the propulsion speed acquisition system is shown in Figure 4. The displacement sensor’s draw wire is fixed to the rear of the propulsion cylinder in the down-the-hole drill rig assembly. During drilling operations, the drill bit is positioned against the rock surface, and the hammer begins to move forward. The draw-wire displacement sensor records the relative displacement of the propulsion assembly every 0.5 s, storing the data in the automatic rock drilling data collection system. This process allows us to determine the drilling speed of the down-the-hole drill rig.
In this study, an MT200-3500 draw-wire displacement sensor was used to collect displacement data. Its fully enclosed design ensures strong anti-interference capabilities, making it effective in harsh environments like underground spaces with moisture, dripping water, and high vibration. Table 3 provides the detailed specifications of this sensor.

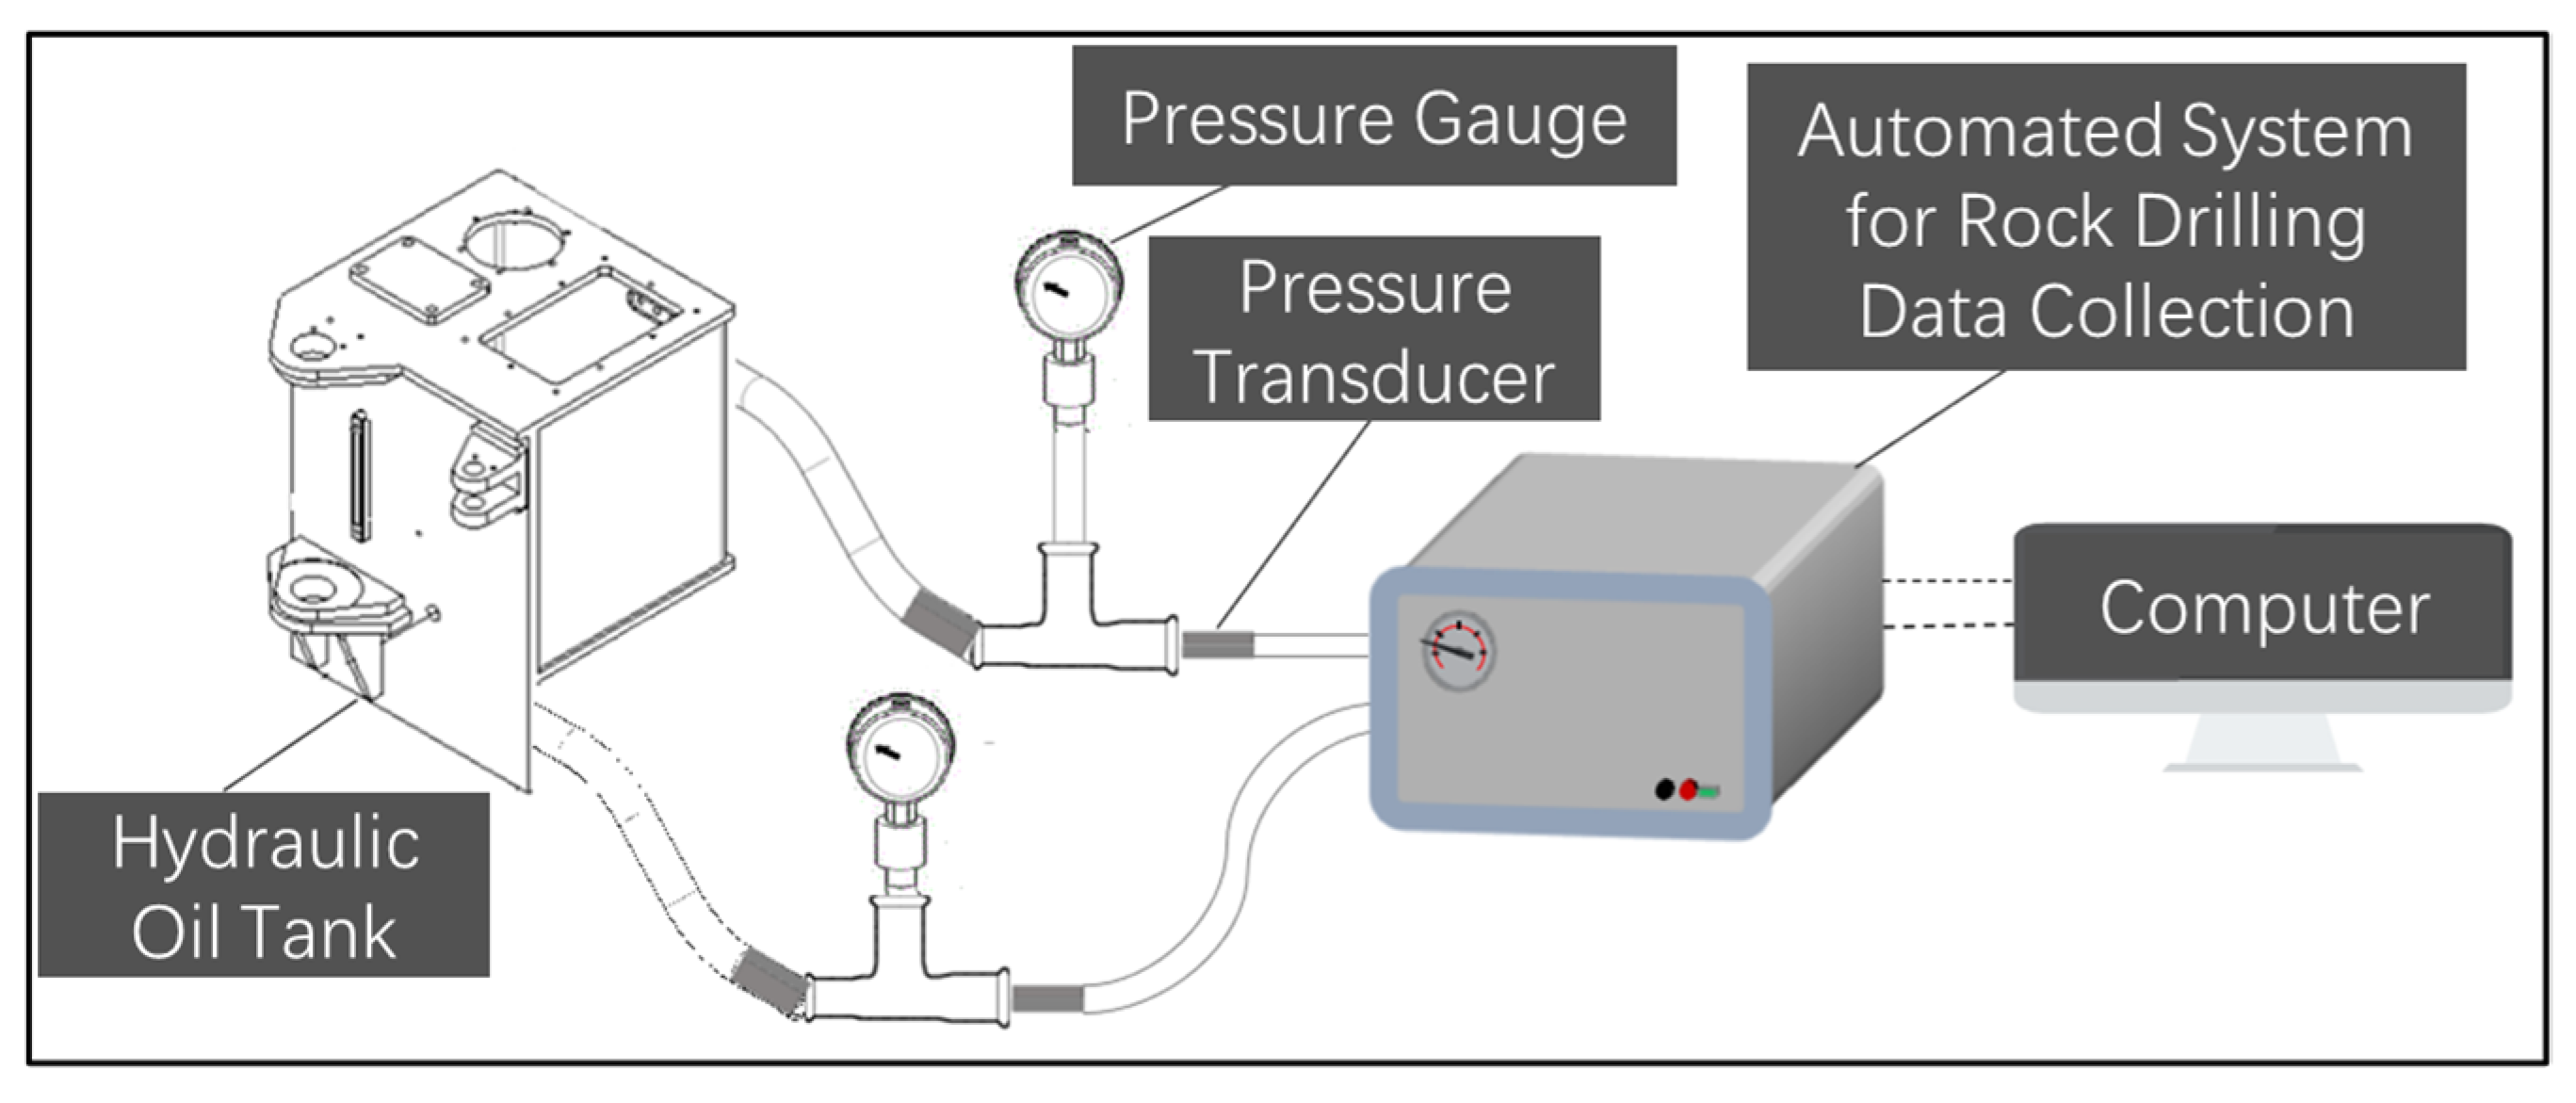
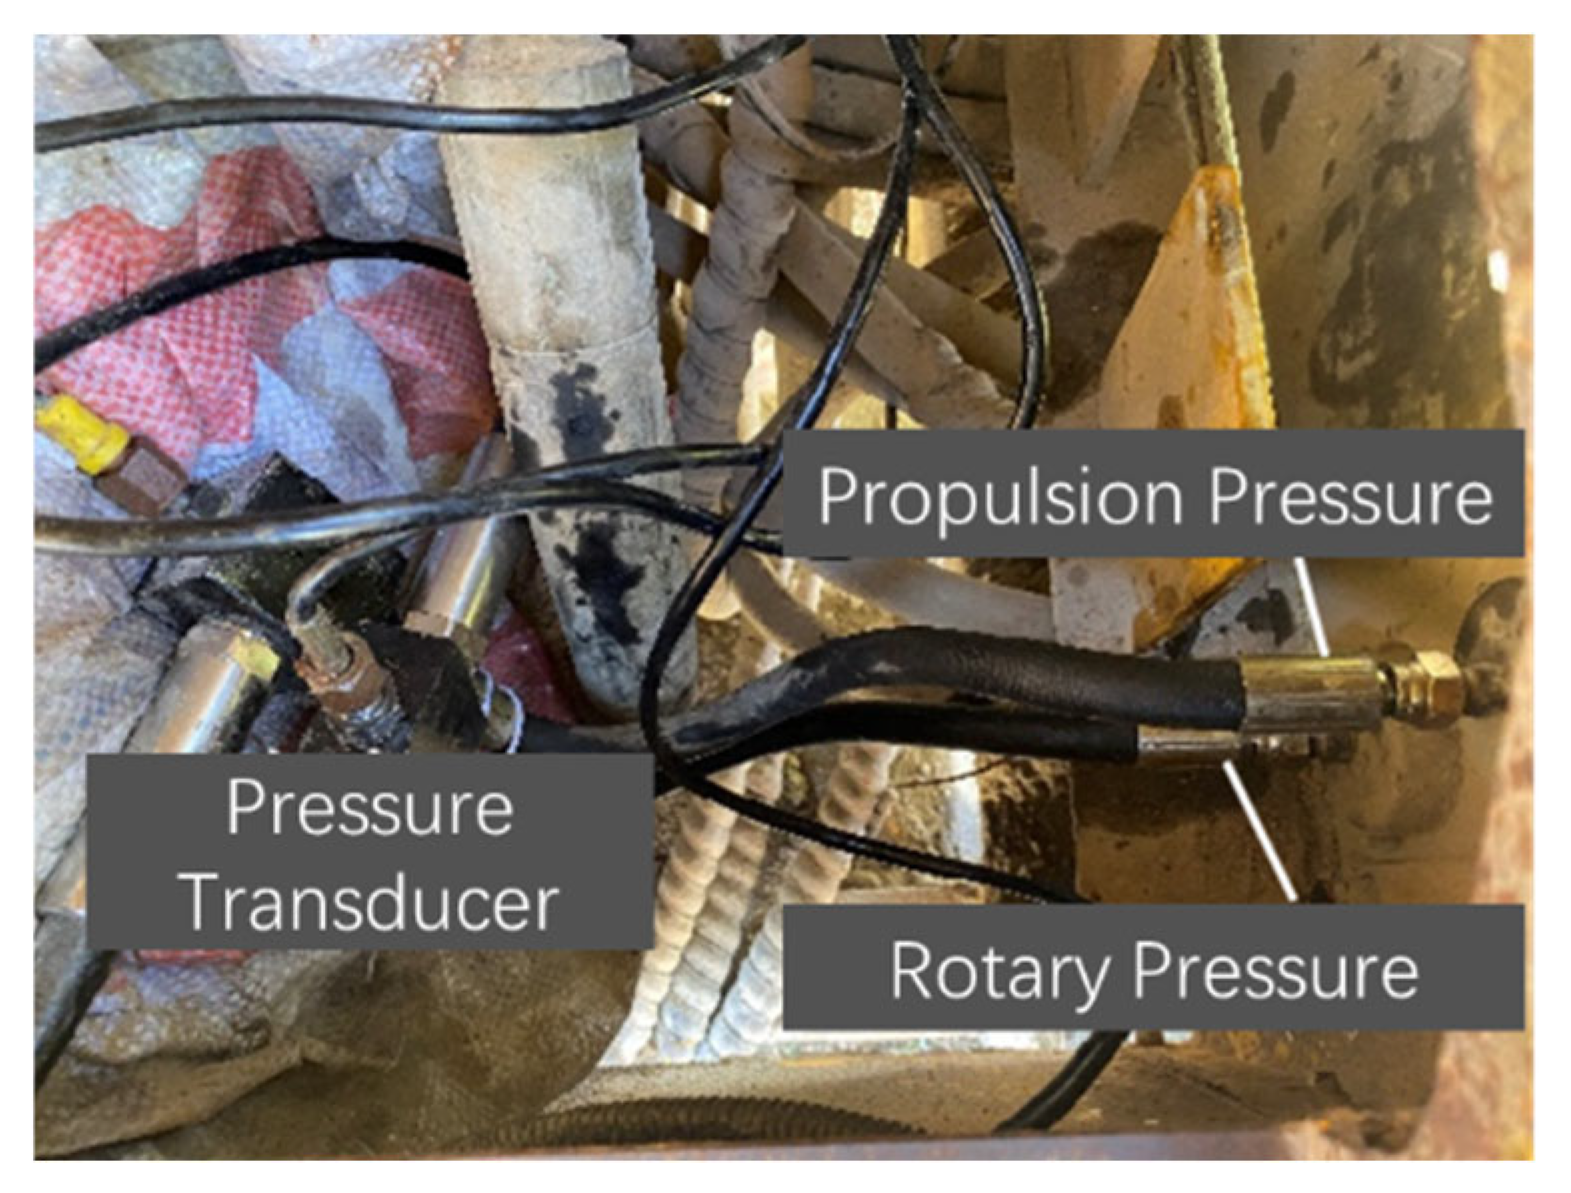
2.2.2. Hydraulic Pressure Acquisition System

The SK150 down-the-hole drill rig is equipped with a dashboard displaying propulsion and rotary pressures, but it lacks automatic real-time recording functionality. To address this, the rig was modified internally. The schematic diagram of the hydraulic pressure acquisition system is shown in Figure 5, and the actual setup is illustrated in Figure 6. The YC-131 pressure transmitter is installed in the hydraulic pipeline behind the pressure gauge. The transmitter outputs two lines: one connects to the dashboard displaying propulsion and rotary pressures, and the other connects to the automatic rock drilling data acquisition system for real-time pressure recording.
In this study, the specifications of the YC-131 pressure transmitter are outlined in Table 4. This pressure transmitter uses imported circuitry based on American BB integrated chips. It features an advanced diaphragm isolation technology with imported diffused silicon pressure-sensitive elements. Its compact structure, convenient installation, lightning protection, anti-interference, vibration resistance, high stability, rapid response, and high accuracy make it an excellent choice.

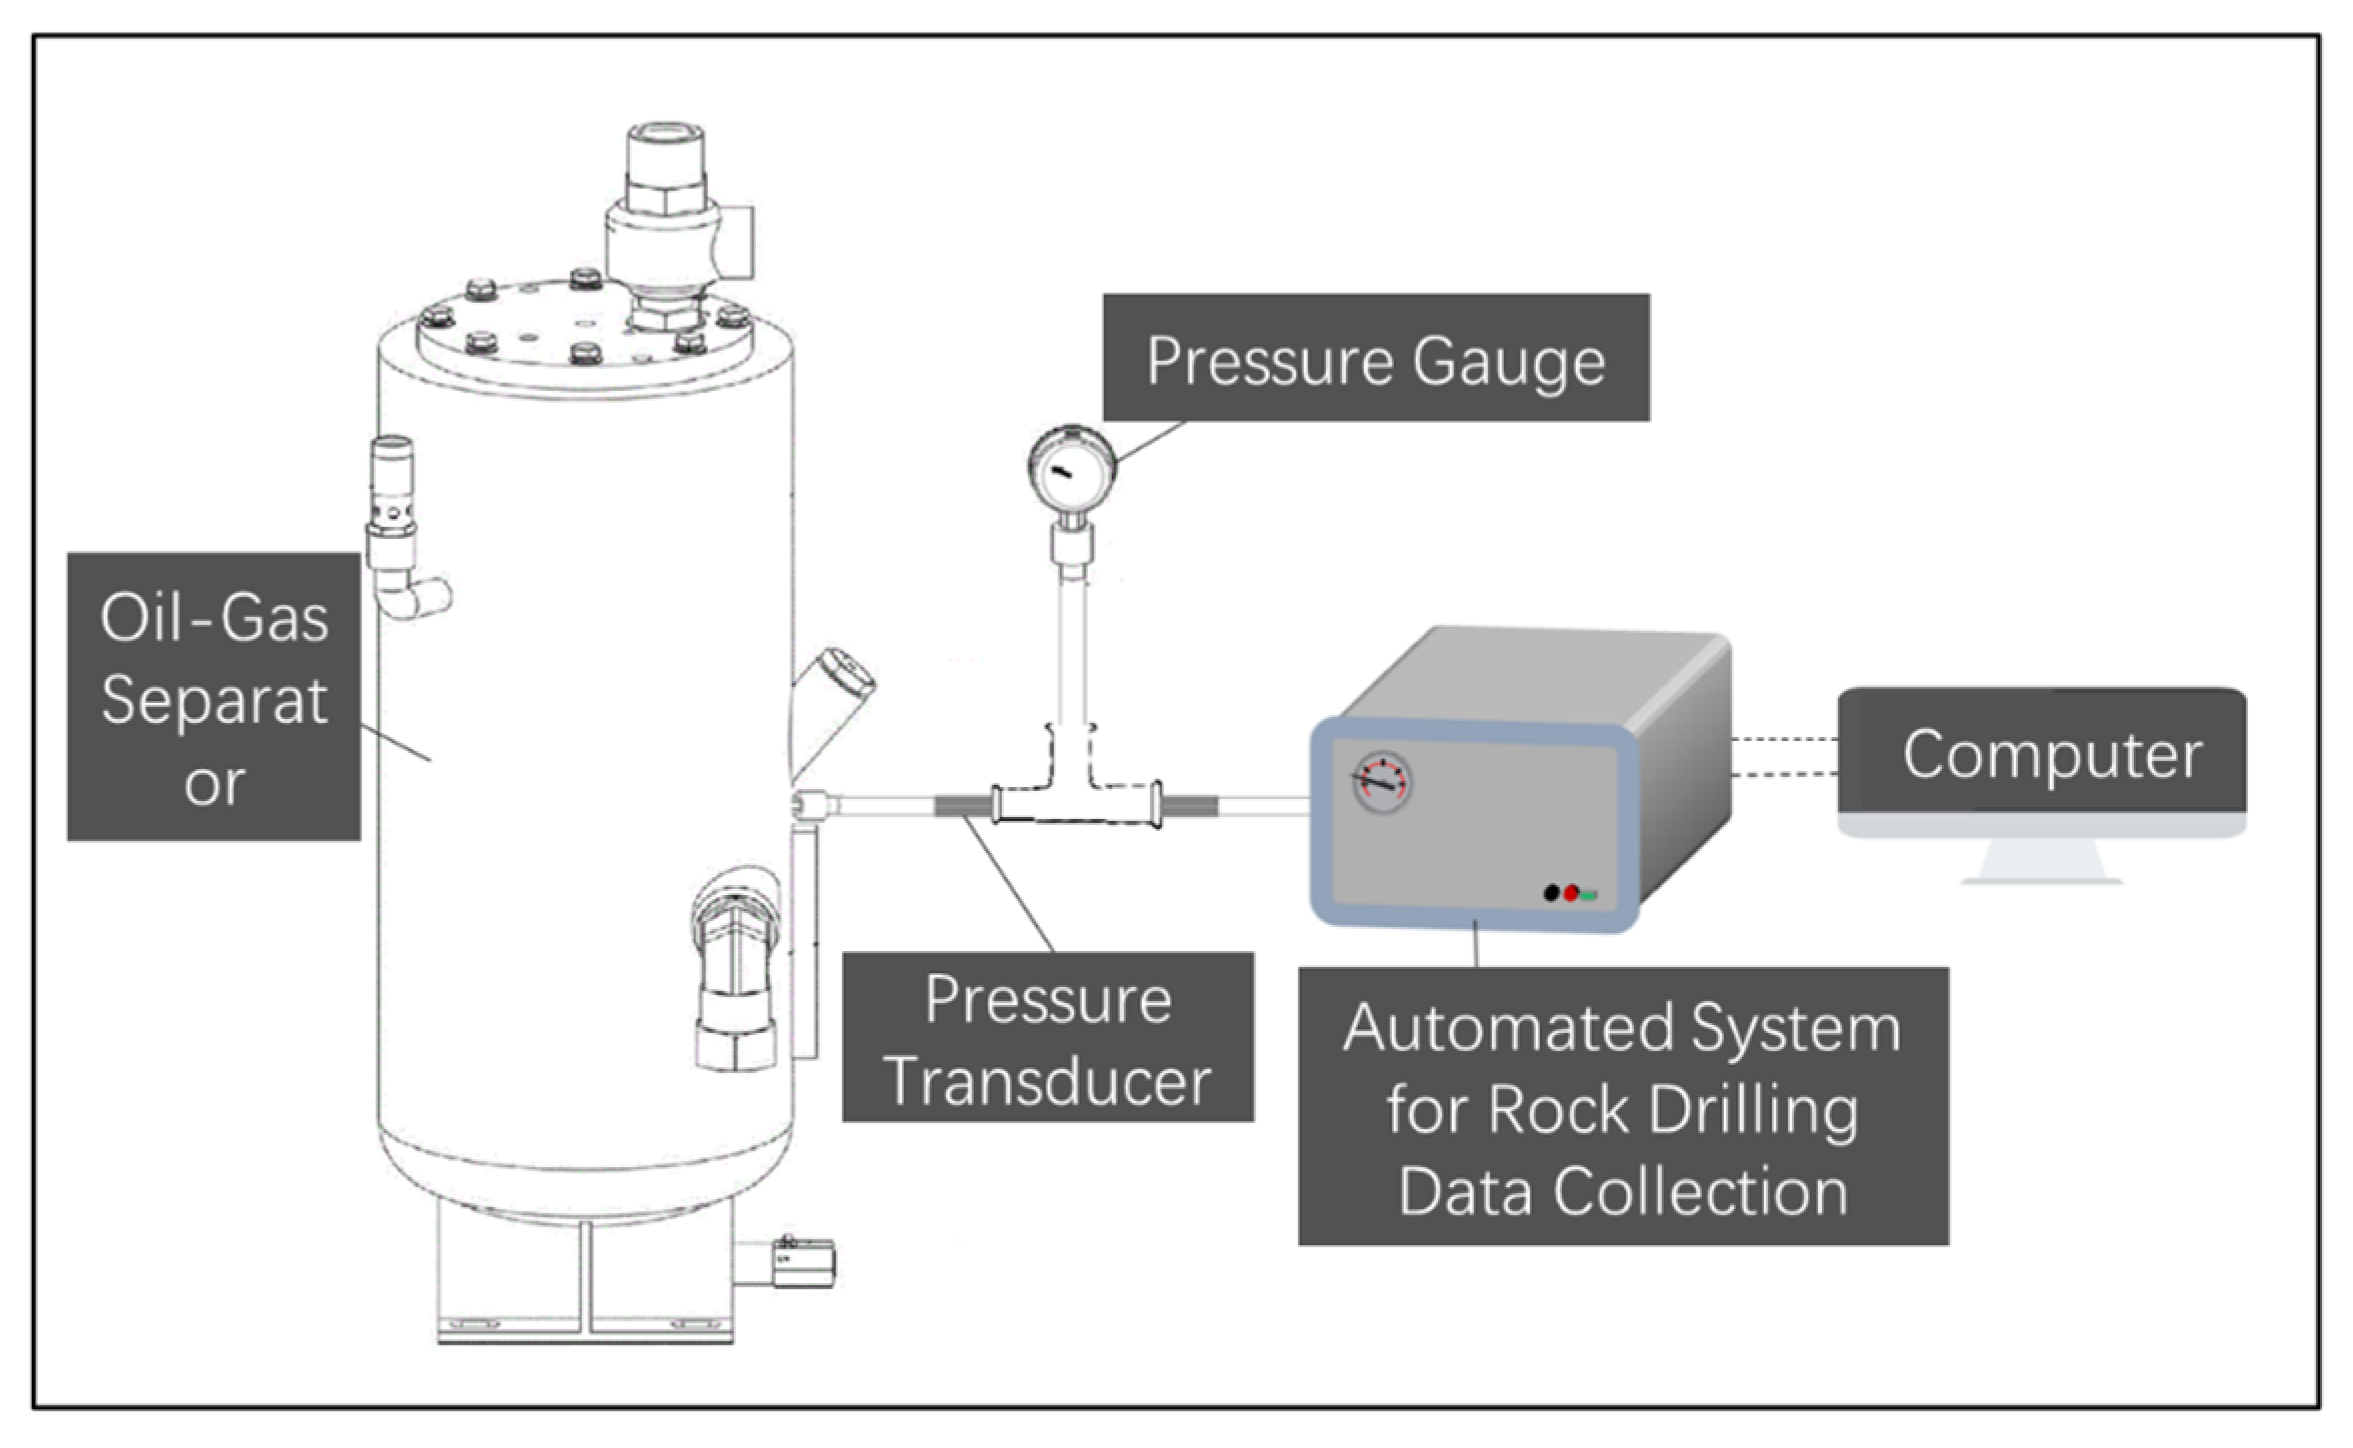
2.2.3. Air Pressure Acquisition System

During operation, the SK150 drill rig receives its impact pressure from a Kaishan brand screw compressor (KSDY-15/17), which has a dashboard displaying impact pressure but lacks real-time automatic recording capabilities. To address this, the compressor was modified, and the schematic diagram of the air pressure acquisition system is shown in Figure 7, with the actual setup in Figure 8. The YC-131 pressure transmitter was installed at the connection between the pressure gauge and air pipe. The transmitter outputs two lines: one to the impact pressure display dashboard, and the other to the automatic rock drilling data collection system for real-time impact pressure recording.

2.2.4. Automatic Data Acquisition System

The automatic rock drilling data acquisition system is based on the STM32F103RCT6 microcontroller. The ADC chip used for the hydraulic data collection is CS1237, a high-precision, low-power analog-to-digital conversion chip. For storage, the system uses a W25Q256 flash chip, providing 32 MB of storage space. The encoder section uses the AM26C32 chip, and data are collected twice per second. Once the buffer reaches 512 bytes, the data are saved.
The data acquisition and storage system includes the following components: ① and ② are ADC collection interfaces, ③ is the encoder interface, and ④ is the USB interface, as shown in Figure 9.
The primary function of the ADC (analog-to-digital converter) is to convert digital signals to analog signals, and it is mainly used for data conversion in data acquisition. The ADC chip used in this study, CS1237, is a high-precision, low-power ADC with a differential input channel, built-in temperature sensor, and high-precision oscillator. The ADC data output rate in normal mode can be selected at 10 Hz, 40 Hz, 640 Hz, or 1.28 kHz, with 10 Hz being the default. The CS1237 includes an internal crystal oscillator, integrated temperature sensor, power-down function, and a 2-wire SPI interface with a maximum speed of 1.1 MHz.
The encoder section of this study uses the AM26C32 chip, which collects data twice per second. When the buffer reaches 512 bytes, data are saved. The AM26C32 is a quadruple differential line receiver designed for balanced or unbalanced digital data transmission. The enable function is common to all four receivers and provides a choice of active-high or active-low input. The status output allows direct connection to bus-organized systems. Its failsafe design ensures that if the input is open, the output is always high. The main specifications of the AM26C32 are presented in Table 5.
In this study, the data storage uses the W25Q256 flash chip, providing 32 MB of storage. Compared to conventional NAND flash memory, it has slower erase speeds and smaller capacity, but it offers faster read speeds, a lower probability of bad blocks, and improved security. These characteristics make it suitable for this research environment, which involves vibrations. The main technical specifications are presented in Table 6.

3. Data Collection and Correlation Analysis

3.1. Data Collection

At the Qingdao Metro Line 6 underground excavation station near the Qingdao Medical West Campus, drilling parameters were collected using the rock drilling testing system. This paper employs the Basic Quality (BQ) classification method to categorize the surrounding rock masses. The BQ method, known for its high accuracy, classifies the rock masses through a comprehensive analysis of the saturated uniaxial compressive strength and the rock mass integrity index. The BQ method comprises two steps:
(1) Calculate the basic quality index (BQ value) using Equation (1).
B Q = 100 + 3 R c + 250 K v
In the formula, BQ represents the Basic Quality Index of the rock mass, Rc is the uniaxial saturated compressive strength of the rock, and Kv is the rock mass integrity index, which is the square of the ratio of the elastic longitudinal wave velocities in the rock mass and rock.
When using Equation (1), the following constraints should be observed:
  • When Rc > 90 Kv + 30, Rc should be set to 90 Kv + 30 and Kv should be substituted into the equation to calculate the BQ value.
  • When Kv > 0.04 Rc + 0.4, Kv should be set to 0.04 Rc + 0.4 and Rc should be substituted into the equation to calculate the BQ value.
(2) Based on the BQ value and the qualitative characteristics of the basic quality of the rock mass, the rock mass grade is determined according to Table 7.
This study conducted uniaxial saturated compressive strength tests and rock mass wave velocity tests, as shown in Figure 10 and Figure 11. The final results indicate that the rock mass grades in the drilling test area range from II to V.
To ensure the accuracy of machine learning training results, we selected approximately the same amount of data for each of the three surrounding rock grades from the samples collected to build the database relating drilling parameters to surrounding rock grades. The database contains a total of 436 rock mass classification samples. The drilling parameters and sample sizes for each rock mass grade are shown in Table 8.

3.2. Correlation Analysis

To investigate the relationship between drilling parameters and surrounding rock grades, we studied the direction (positive or negative) and magnitude of the correlation coefficients for each drilling parameter. Based on the drilling parameter and surrounding rock grade database, kernel density estimation (KDE) plots were drawn to visualize the relationships between propulsion speed, impact pressure, rotary pressure, propulsion pressure, and surrounding rock grades, as shown in Figure 12.
From Figure 12, it is evident that:
(1)
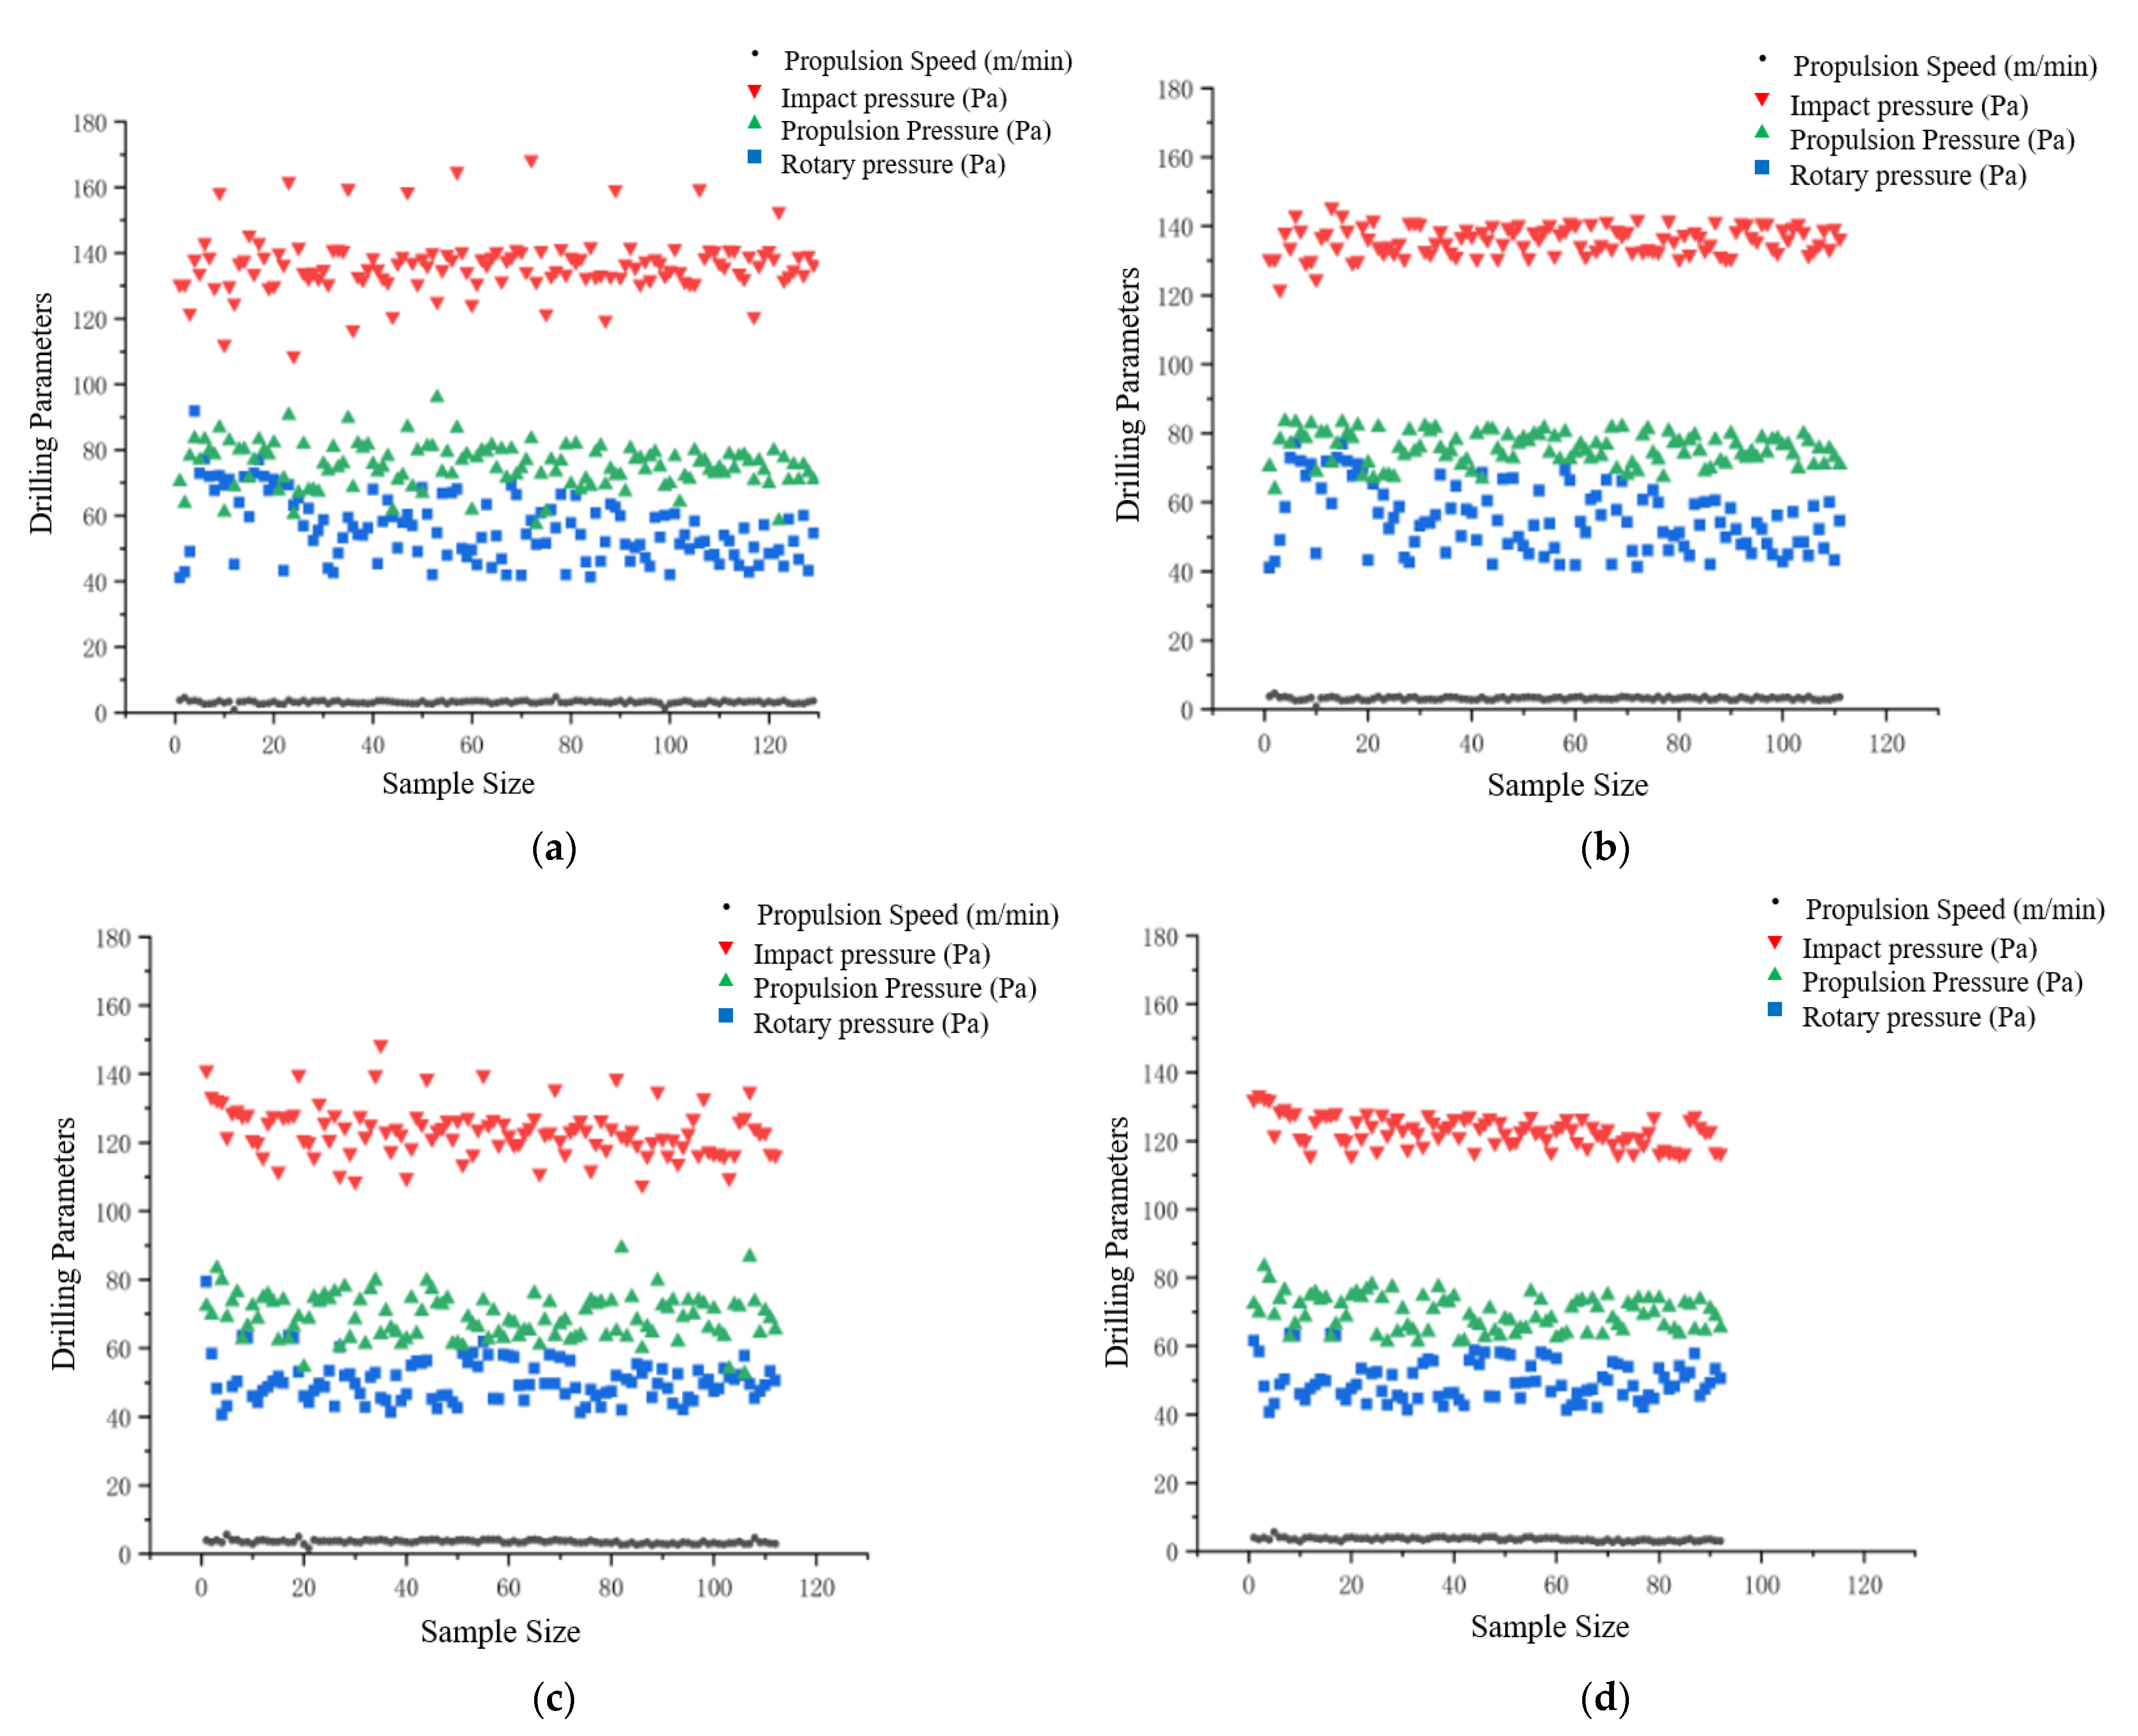
For any drilling parameter, each surrounding rock classification corresponds to a specific distribution range, indicating a correlation between drilling parameters and surrounding rock grades. However, there is significant overlap in the distribution ranges of drilling parameters for different surrounding rock classifications, making it challenging to accurately identify the grade using a single parameter alone.
(2)
Comparing the density distribution of different drilling parameters with surrounding rock classifications reveals a monotonic change in the distribution ranges of propulsion speed, impact pressure, rotary pressure, and propulsion pressure as the surrounding rock grade increases.
According to the empirical method for normal distribution testing, if the ratio of the sample median to the arithmetic mean is between 0.9 and 1.1, and the arithmetic mean is greater than three times the standard deviation, the sample can be considered to follow a normal distribution. Based on the rock mass grade sample database, calculations show that all four drilling parameters meet the empirical method criteria, indicating that the samples follow a normal distribution. Pearson correlation analysis was used to quantify the correlation between the drilling parameters and rock mass grades, with the rock mass grade represented by the BQ value. The formula for calculating the Pearson correlation coefficient is shown in Equation (2). The correlation coefficient ranges between −1 and 1, with −1 and 1 indicating complete negative correlation and complete positive correlation, respectively. The greater the absolute value of the correlation coefficient, the higher the linear correlation between the variables.
ρ = C ov x ,   y σ x σ y = i = 1 n ( x i x ¯ ) ( y i y ¯ ) i = 1 n ( x i x ¯ ) 2 i = 1 n ( y i y ¯ ) 2
In the formula, ρ represents the correlation coefficient, Cov denotes the covariance, and σ signifies the standard deviation.
The heat map showing the correlation between drilling parameters and surrounding rock classification is presented in Figure 13. Key observations include the following:
(1)
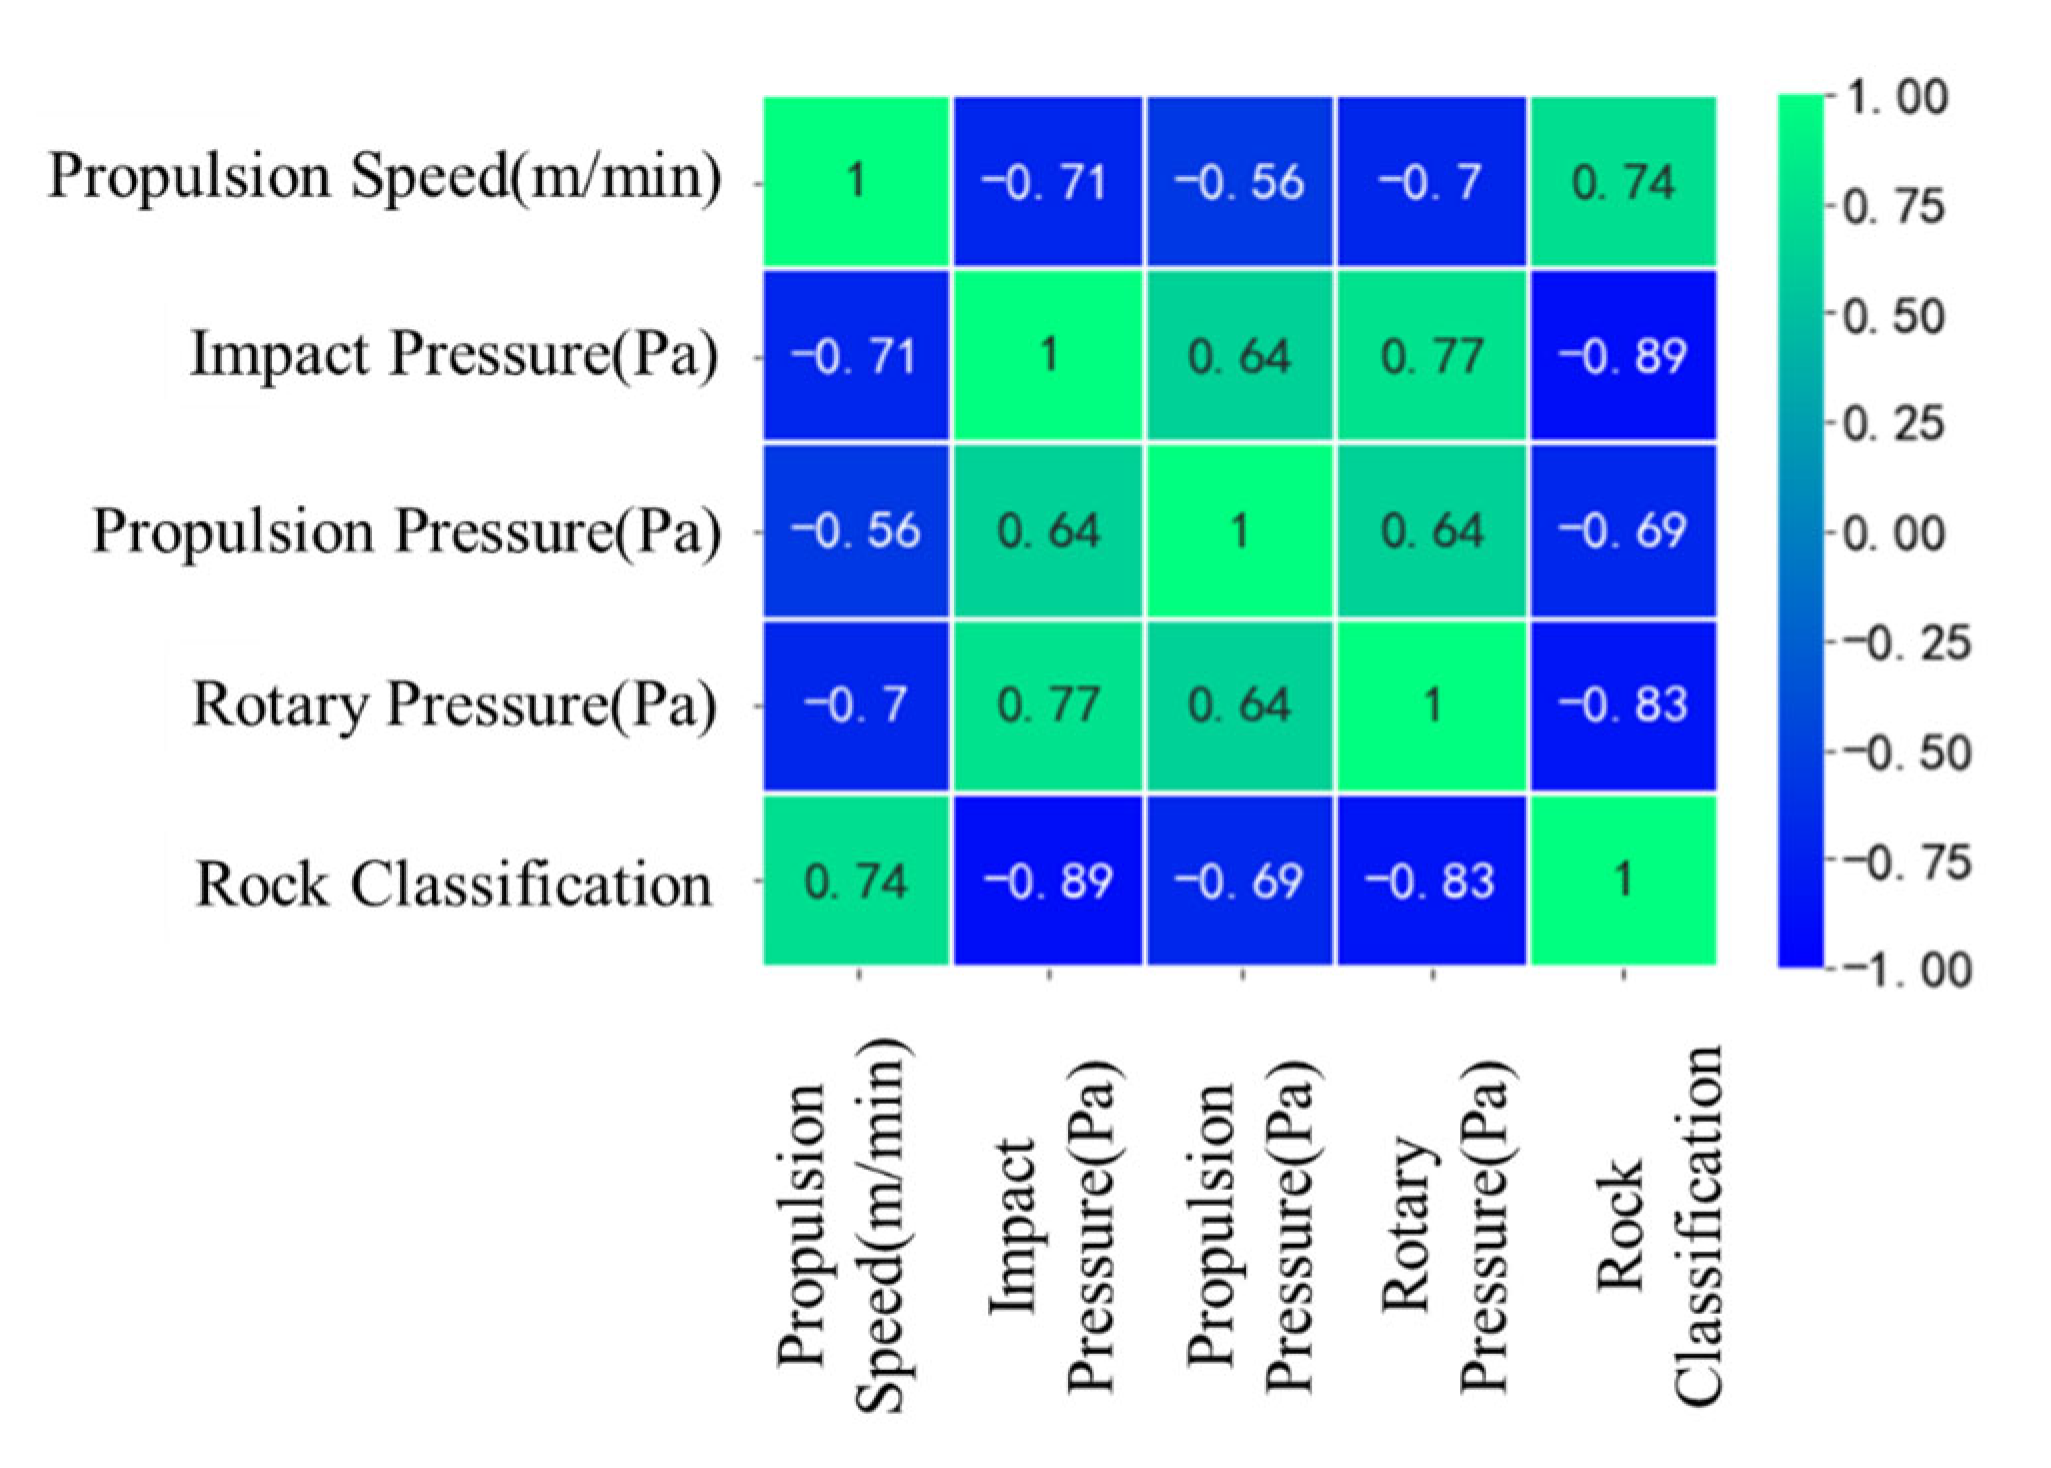
The absolute values of the correlation coefficients (ρ) for the four drilling parameters with the surrounding rock classification are all greater than 0.6, indicating a strong correlation between these parameters and rock classification.
(2)
Propulsion speed shows a positive correlation with surrounding rock classification, whereas impact pressure, propulsion pressure, and rotary pressure all display a negative correlation.
(3)
The absolute value of the correlation coefficient is highest between impact pressure and surrounding rock classification, suggesting the strongest correlation. It is followed by rotary pressure (−0.83), propulsion speed (0.74), and propulsion pressure (−0.69).

4. Data Preprocessing

4.1. Removing Outliers

Due to human and other factors, the collected drilling parameters often contain some outliers. The presence of outliers hinders building a model that reflects general patterns, so the standard deviation and mean interval method are used to eliminate these data anomalies.
From the parameter correlation analysis, impact pressure and rotary pressure show the strongest correlation with surrounding rock classification, so the samples are primarily filtered based on these two parameters.
The data for different rock classifications are processed in batches. Let α2 and β2 represent the mean and standard deviation of impact pressure for Grade 2 surrounding rock data, respectively. Similarly, for Grade 3 surrounding rock data, let α3 and β3 denote the mean and standard deviation of impact pressure. The corresponding values for Grade 4 and Grade 5 surrounding rocks are α4, β4, and α5, β5, respectively.
For rotary pressure, let γ2 and δ2 denote the mean and standard deviation for Grade 2 surrounding rock data, γ3 and δ3 for Grade 3, γ4 and δ4 for Grade 4, and γ5 and δ5 for Grade 5.
Samples are filtered based on these metrics, with the sample ranges shown in Table 9.
After removing outliers, the statistical patterns of the four drilling parameters—propulsion speed, impact pressure, propulsion pressure, and rotary pressure—are presented for each rock classification in the sample library. The data are summarized in Table 10.
A total of 371 ideal samples were obtained, including 64 samples for Grade 2 surrounding rock, 104 samples for Grade 3, 111 samples for Grade 4, and 92 samples for Grade 5. Figure 14 illustrates that after removing redundant data, the degree of data dispersion across different surrounding rock grades has significantly reduced. The samples in each rock classification are more concentrated and less dispersed than before filtering.

4.2. Data Standardization and Dataset Division

In the original dataset, the features have different units and scales. Discrepancies in these scales and initial values can cause certain features to overshadow others in their influence on surrounding rock classification. Therefore, standardization is employed to process the drilling parameters. The standardization formula is shown in Equation (3). Subsequently, the standardized samples are divided into training and testing datasets with a 7:3 ratio.
X = x m e a n σ
In the formula, X represents the standardized parameter, x is the parameter before standardization, mean is the mean value, and σ denotes the standard deviation.

5. Intelligent Rock Classification

5.1. Random Forest

The random forest algorithm model was first proposed in 2001 by Leo Breiman and Adele Cutler. This ensemble algorithm is based on decision trees and bagging techniques. Random forest offers good generalization performance and fast processing speeds. The core principles are as follows:
(1)
Random sampling: Using the bootstrap method, it repeatedly samples n samples with replacement from the original training data to form a bootstrap sample set.
(2)
Decision tree construction: For each bootstrap sample set, a subset of features is randomly selected to build a decision tree. This random selection ensures that each tree is different and aims to improve the model’s generalization ability.
(3)
Decision tree integration: Once a sufficient number of decision trees are built, each tree provides a classification result for new input data. The random forest algorithm aggregates these results through a voting mechanism to determine the final classification.
In the random forest model, a subset of attributes is randomly selected from the attribute set of each base decision tree node. The best attribute is then chosen to perform the split. Its core algorithm, the decision tree, minimizes entropy using conditional entropy and information gain to achieve the optimal structure. Given the engineering context of this paper, the workflow for intelligent surrounding rock classification using the random forest model is illustrated in Figure 15.

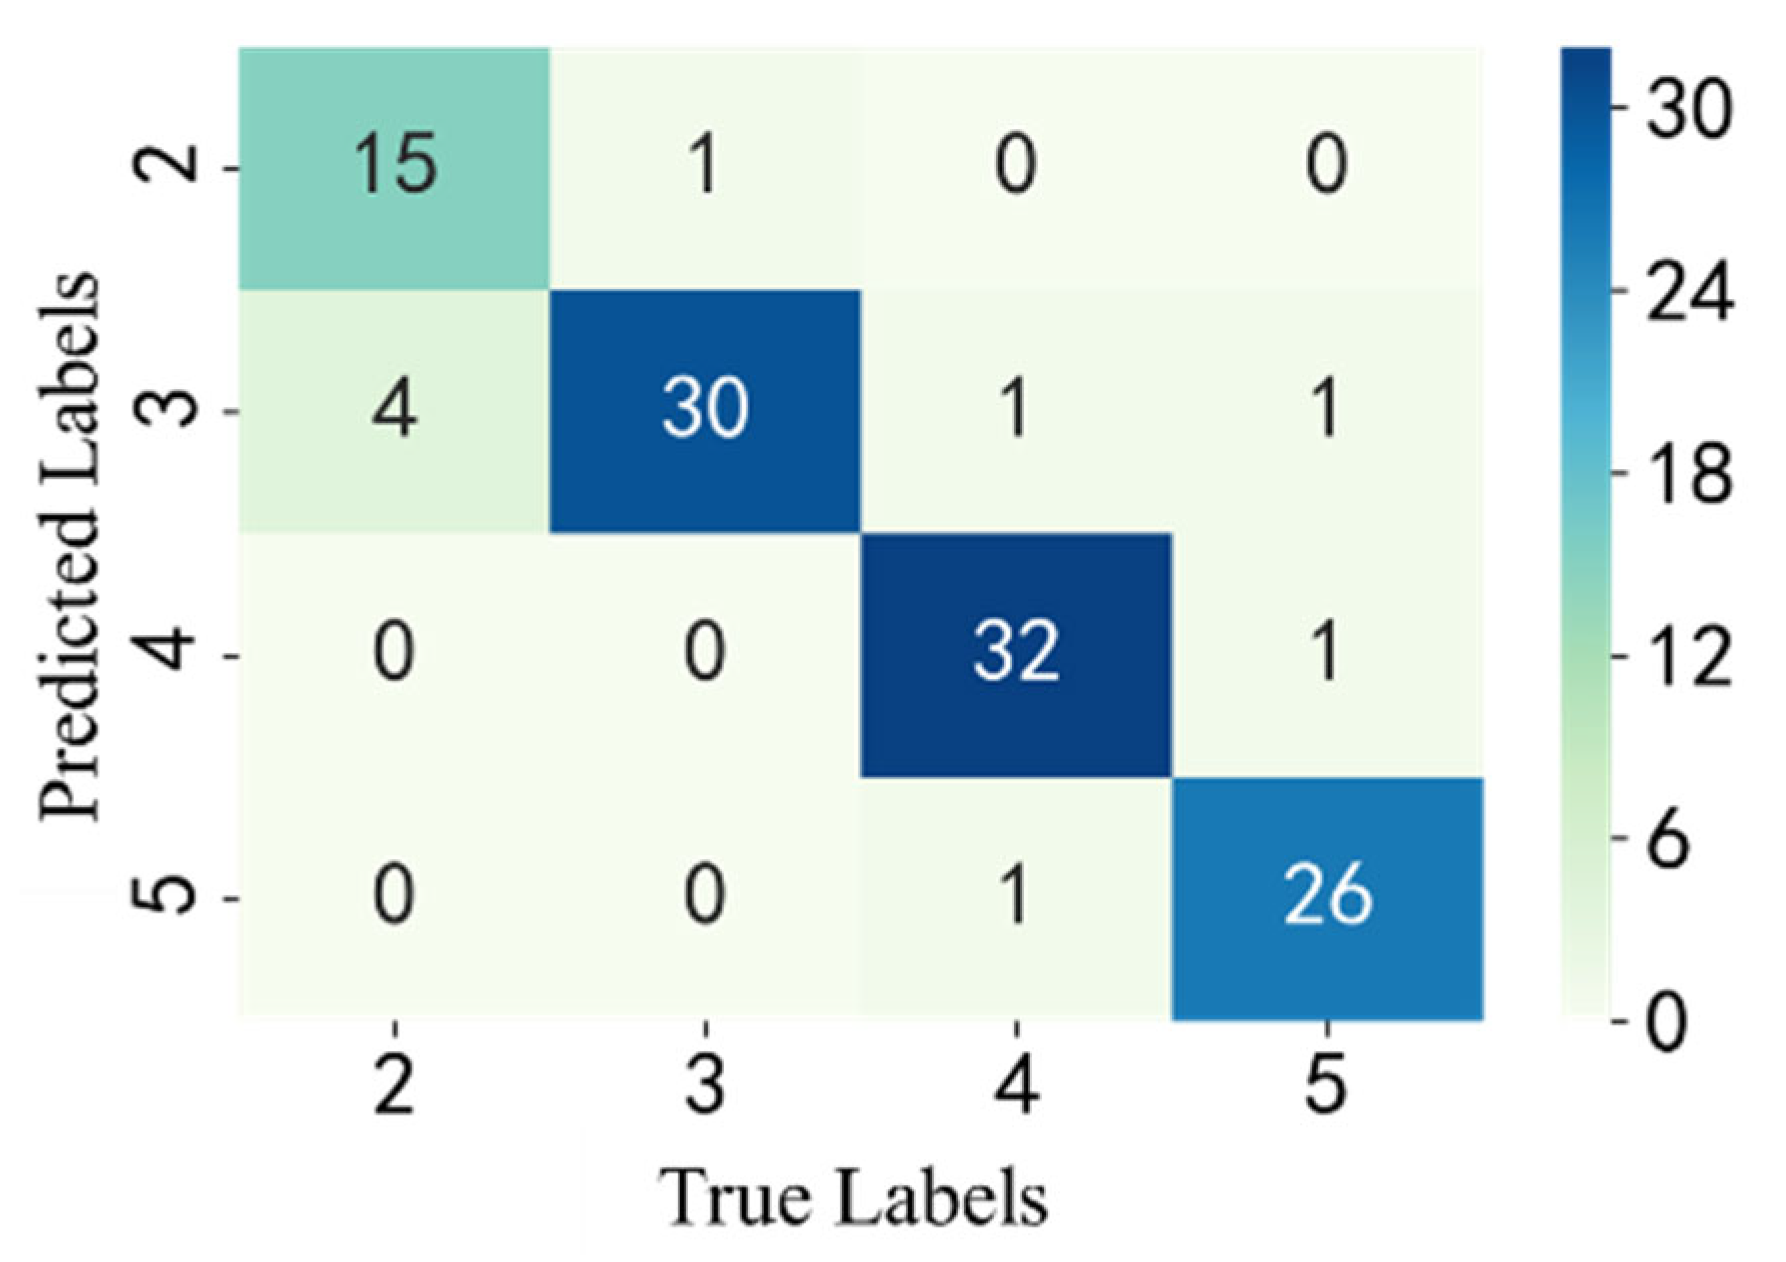
5.2. Rock Mass Classification Results

The confusion matrix for the random forest on the test set samples is shown in Figure 16. There are 19 samples of secondary-grade rock mass in the test set, of which 15 were correctly predicted, while 4 were misclassified as tertiary grade. For the tertiary-grade rock mass, 31 samples were tested, of which 30 were correctly predicted, while 1 was classified as secondary grade. For the quaternary-grade rock mass, 34 samples were tested, with 32 correctly classified, 1 misclassified as tertiary grade, and 1 as quinary grade. Lastly, the quinary-grade rock mass had 28 samples, of which 26 were correctly classified, while 1 was misclassified as tertiary grade and another as quaternary grade.
In this paper, precision, recall, and F1 score are used to evaluate the random forest model for rock mass classification. The formula for precision is shown in Equation (4), the formula for recall is given in Equation (5), and the formula for the F1 score is presented in Equation (6).
Pr e c i s i o n = T P T P + F P
TP (true positive): The sample is positive, and the prediction is also positive, which means that the positive class is correctly predicted. FP (false positive): The sample is negative, but the prediction is positive, indicating a misclassification of the negative class. FN (false negative): The sample is positive, but the prediction is negative, indicating a misclassification of the positive class.
Re c a l l = T P T P + F N
F 1 = 2 P r e c i s i o n × R e c a l l P r e c i s i o n + R e c a l l
The evaluation results are shown in Table 11. The average precision for rock mass classification is 0.93, with each grade having a precision exceeding 0.8. This indicates that the random forest model not only has high accuracy in identifying positive classes but also maintains high stability. The average recall for rock mass classification is 0.91, demonstrating that the model has a high coverage rate for positive samples, meaning relatively few false negatives. An average F1 score of 0.92 indicates that the model achieves a good balance between precision and completeness. Overall, the random forest classification model performs well in classifying rock mass grades.

6. Conclusions

This paper focuses on the efficient classification of rock mass grades during tunnel excavation using the drill and blast method. Based on the development of a down-the-hole drilling rig, a rock drilling testing system capable of real-time acquisition of drilling parameters was developed. Using the obtained drilling parameters, an intelligent rock mass classification model was established. This study contributes to the efficient interoperability between data acquisition technologies and model methodologies in rock mass classification. The specific results are as follows:
(1)
With displacement sensors and pressure transmitters as core components, a feed speed acquisition system, an oil pressure acquisition system, and an air pressure acquisition system were developed. Using an ADC (analog-to-digital converter), an encoder, and a flash storage chip, an automatic data acquisition system was developed. This system can collect data twice per second and has the advantages of high precision, low power consumption, and high stability. Together, these four systems form the rock drilling testing system, enabling the down-the-hole drilling rig to automatically collect and store impact pressure, rotation pressure, feed pressure, and feed speed in real time during the drilling process. This greatly improves the efficiency and accuracy of data acquisition.
(2)
By analyzing kernel density plots and Pearson correlation heatmaps between drilling parameters and rock mass grades, it was found that a single drilling parameter is insufficient for determining rock mass grades. The rock mass grade has a strong positive correlation with feed speed and a strong negative correlation with impact pressure, feed pressure, and rotation pressure. Specifically, the correlation with impact pressure and rotation pressure is strongly negative, with correlation coefficients both exceeding 0.8.
(3)
Outliers were removed using an interval method, and the dataset was standardized, effectively improving model robustness. The random forest model used in this study has excellent rock mass classification performance, with precision, recall, and F1 scores all exceeding 0.9. Classification performance across rock mass grades is fairly balanced, and the model demonstrates good generalizability.
(4)
The rock drilling test system efficiently acquires drilling parameters, and the random forest model can accurately classify rock mass grades based on these parameters. Combining the two forms an intelligent tunnel rock mass classification system, which plays a critical role in determining tunnel excavation plans and quality evaluation. This system can effectively promote the transition and upgrade of tunnel construction processes from traditional operations to intelligent ones.

7. Discussion

The geological environment at engineering sites is often complex, and it may not always be feasible to obtain a comprehensive dataset. Enhancing the applicability of rock mass classification models to other engineering projects remains a significant challenge. This paper suggests the following approaches to provide insights for developing more generalized models.
The first is to develop comprehensive models with stronger generalization ability, such as the voting method. Ensemble voting methods offer a significant advantage for enhancing the practical application and universality of our classification algorithm. By combining the predictions of multiple models, ensemble voting can improve overall classification accuracy and robustness. This method leverages the strengths of different models, mitigating the impact of individual model biases and errors. Furthermore, ensemble voting is particularly effective in adapting to diverse geological conditions, ensuring reliable performance across various environments.
The second is transfer learning. Transfer learning presents a valuable approach for enhancing the practical application and universality of our classification algorithm. By leveraging pretrained models on large, diverse geological datasets, transfer learning can significantly improve the adaptability and performance of the algorithm in various real-world conditions. The process involves pretraining on a comprehensive source dataset and fine-tuning the model with specific target datasets, enabling efficient and robust classification across different geological environments.
With the rapid development of artificial intelligence, new classification algorithms and techniques will continue to emerge. Improving the engineering practicality of rock mass classification models will remain a key development trend in the future.

Author Contributions

Q.L.: Methodology, writing—original draft. J.Y.: Data curation, supervision. H.L. (Hongzhao Li): Resources, investigation. P.Z.: Supervision, investigation. Y.L.: Validation, data curation. L.L.: Project administration, software. S.Y.: Formal analysis, writing—review and editing. H.L. (Haitao Liu): Supervision, project administration. All authors have read and agreed to the published version of the manuscript.

Funding

This research was funded by the National Key R&D Program of China (grant numbers: 2021YFB2600800).

Data Availability Statement

The data that support the findings of this study are available from the corresponding author upon reasonable request.

Conflicts of Interest

Author Quanwei Liu, Peiyuan Zhang, Linsheng Liu and Shoujie Ye are employed by the Qingdao Metro Line 6 Co., Ltd. Author Haitao Liu is employed by the China Railway First Bureau Group Fifth Engineering Co., Ltd. The remaining authors declare that the research was conducted in the absence of any commercial or financial relationships that could be construed as a potential conflict of interest.

References

  1. Kumar, P.; Mohammadi, H.; Chopra, R.; Kumar Tyagi, S.; Kumar Pandey, S. A Newly Developed Blasting Cut in Tunnels; Application of “Combined Method” in Small to Medium-Sized Tunnels. Tunn. Undergr. Space Technol. 2023, 142, 105426. [Google Scholar] [CrossRef]
  2. Wang, M.; Zhao, S.; Tong, J.; Wang, Z.; Yao, M.; Li, J.; Yi, W. Intelligent Classification Model of Surrounding Rock of Tunnel Using Drilling and Blasting Method. Undergr. Space 2021, 6, 539–550. [Google Scholar] [CrossRef]
  3. Barton, N. Some New Q-Value Correlations to Assist in Site Characterisation and Tunnel Design. Int. J. Rock Mech. Min. Sci. 2002, 39, 185–216. [Google Scholar] [CrossRef]
  4. Jiang, F.; He, P.; Wang, G.; Zheng, C.; Xiao, Z.; Wu, Y.; Lv, Z. Q-Method Optimization of Tunnel Surrounding Rock Classification by Fuzzy Reasoning Model and Support Vector Machine. Soft Comput. 2022, 26, 7545–7558. [Google Scholar] [CrossRef]
  5. Somodi, G.; Bar, N.; Kovács, L.; Arrieta, M.; Török, Á.; Vásárhelyi, B. Study of Rock Mass Rating (RMR) and Geological Strength Index (GSI) Correlations in Granite, Siltstone, Sandstone and Quartzite Rock Masses. Appl. Sci. 2021, 11, 3351. [Google Scholar] [CrossRef]
  6. Zhang, Q.; Huang, X.; Zhu, H.; Li, J. Quantitative Assessments of the Correlations between Rock Mass Rating (RMR) and Geological Strength Index (GSI). Tunn. Undergr. Space Technol. 2019, 83, 73–81. [Google Scholar] [CrossRef]
  7. Jiang, W.; Wang, Y.; Yang, J.; Zhang, Z. Surrounding Rock Quality Evaluation and Application Development for Highway Tunnel Based on Engineering Applicability. Bull. Eng. Geol. Environ. 2023, 82, 115. [Google Scholar] [CrossRef]
  8. Qiu, D.; Fu, K.; Xue, Y.; Tao, Y.; Kong, F.; Bai, C. TBM Tunnel Surrounding Rock Classification Method and Real-Time Identification Model Based on Tunneling Performance. Int. J. Geomech. 2022, 22, 04022070. [Google Scholar] [CrossRef]
  9. Liu, Q.; Liu, J.; Pan, Y.; Kong, X.; Hong, K. A Case Study of TBM Performance Prediction Using a Chinese Rock Mass Classification System—Hydropower Classification (HC) Method. Tunn. Undergr. Space Technol. 2017, 65, 140–154. [Google Scholar] [CrossRef]
  10. Xie, H.T. Bayesian Network Based Expert System for Tunnel Surrounding Rockmass Classification. Appl. Mech. Mater. 2013, 482, 248–251. [Google Scholar] [CrossRef]
  11. Niu, G.; He, X.; Xu, H.; Dai, S. Development of Rock Classification Systems: A Comprehensive Review with Emphasis on Artificial Intelligence Techniques. Eng 2024, 5, 217–245. [Google Scholar] [CrossRef]
  12. Zhao, S.; Wang, M.; Yi, W.; Yang, D.; Tong, J. Intelligent Classification of Surrounding Rock of Tunnel Based on 10 Machine Learning Algorithms. Appl. Sci. 2022, 12, 2656. [Google Scholar] [CrossRef]
  13. Zheng, S.; Jiang, A.N.; Yang, X.R.; Luo, G.C. A New Reliability Rock Mass Classification Method Based on Least Squares Support Vector Machine Optimized by Bacterial Foraging Optimization Algorithm. Adv. Civ. Eng. 2020, 2020, 1–13. [Google Scholar] [CrossRef]
  14. Jalalifar, H.; Mojedifar, S.; Sahebi, A.A.; Nezamabadi-pour, H. Application of the Adaptive Neuro-Fuzzy Inference System for Prediction of a Rock Engineering Classification System. Comput. Geotech. 2011, 38, 783–790. [Google Scholar] [CrossRef]
  15. Hasegawa, N.; Hasegawa, S.; Kitaoka, T.; Ohtsu, H. Applicability of Neural Network in Rock Classification of Mountain Tunnel. Mater. Trans. 2019, 60, 758–764. [Google Scholar] [CrossRef]
  16. Bressan, T.S.; Kehl De Souza, M.; Girelli, T.J.; Junior, F.C. Evaluation of Machine Learning Methods for Lithology Classification Using Geophysical Data. Comput. Geosci. 2020, 139, 104475. [Google Scholar] [CrossRef]
  17. Liu, X.; Wang, H.; Jing, H.; Shao, A.; Wang, L. Research on Intelligent Identification of Rock Types Based on Faster R-CNN Method. IEEE Access 2020, 8, 21804–21812. [Google Scholar] [CrossRef]
  18. Song, S.; Xu, G.; Bao, L.; Xie, Y.; Lu, W.; Liu, H.; Wang, W. Classifying the Surrounding Rock of Tunnel Face Using Machine Learning. Front. Earth Sci. 2023, 10, 1052117. [Google Scholar] [CrossRef]
  19. Tan, F.; You, M.; Zuo, C.; Jiao, Y.-Y.; Tian, H. Simulation of Rock-Breaking Process by Drilling Machine and Dynamic Classification of Surrounding Rocks. Rock Mech. Rock Eng. 2022, 55, 423–437. [Google Scholar] [CrossRef]
  20. Torno, S.; Toraño, J.; Menéndez, M.; Gent, M.; Velasco, J. Mathematical and fuzzy logic models in prediction of geological and geomechanical properties of rock mass by excavation data on underground works. J. Civ. Eng. Manag. 2011, 17, 197–206. [Google Scholar] [CrossRef]
  21. Mostofi, M.; Rasouli, V.; Mawuli, E. An Estimation of Rock Strength Using a Drilling Performance Model: A Case Study in Blacktip Field, Australia. Rock Mech. Rock Eng. 2011, 44, 305–316. [Google Scholar] [CrossRef]
  22. Kalantari, S.; Hashemolhosseini, H.; Baghbanan, A. Estimating Rock Strength Parameters Using Drilling Data. Int. J. Rock Mech. Min. Sci. 2018, 104, 45–52. [Google Scholar] [CrossRef]
  23. Kalantari, S.; Baghbanan, A.; Hashemalhosseini, H. An Analytical Model for Estimating Rock Strength Parameters from Small-Scale Drilling Data. J. Rock Mech. Geotech. Eng. 2019, 11, 135–145. [Google Scholar] [CrossRef]
  24. Lakshminarayana, C.R.; Tripathi, A.K.; Pal, S.K. Prediction of Mechanical Properties of Sedimentary Type Rocks Using Rotary Drilling Parameters. Geotech. Geol. Eng. 2020, 38, 4863–4876. [Google Scholar] [CrossRef]
Figure 1. The SK150 crawler-mounted down-the-hole (DTH) drill rig.
Buildings 14 02176 g001
Figure 2. Hydraulic and air pressure gauges of the down-the-hole drill rig.
Buildings 14 02176 g002
Figure 3. Schematic diagram of the propulsion speed acquisition system.
Buildings 14 02176 g003
Figure 4. Actual setup of the propulsion speed acquisition system.
Buildings 14 02176 g004
Figure 5. Schematic diagram of the hydraulic pressure acquisition system.
Buildings 14 02176 g005
Figure 6. Actual setup of the hydraulic pressure acquisition system.
Buildings 14 02176 g006
Figure 7. Schematic diagram of the air pressure acquisition system.
Buildings 14 02176 g007
Figure 8. Actual setup of the air pressure acquisition system.
Buildings 14 02176 g008
Figure 9. Data acquisition and storage system.
Buildings 14 02176 g009
Figure 10. Uniaxial saturated compressive strength test of rock.
Buildings 14 02176 g010
Figure 11. Rock mass wave velocity test.
Buildings 14 02176 g011
Figure 12. Core density map of drilling parameters and surrounding rock classification: (a) Impact pressure; (b) rotary pressure; (c) propulsion speed; (d) propulsion pressure.
Buildings 14 02176 g012
Figure 13. Heat map of drilling parameters and surrounding rock classification.
Buildings 14 02176 g013
Figure 14. Scatter plot of drilling parameters database before and after filtering: (a) Grade 4 surrounding rock before filtering; (b) Grade 4 surrounding rock after filtering; (c) Grade 5 surrounding rock before filtering; (d) Grade 5 surrounding rock after filtering.
Buildings 14 02176 g014
Figure 15. Flowchart of intelligent rock mass classification based on random forest.
Buildings 14 02176 g015
Figure 16. Confusion matrix of the random forest.
Buildings 14 02176 g016
Table 1. Key technical specifications of the SK150 down-the-hole drill rig.
ParameterValue
Rock Hardnessf = 6~18
Borehole Diameter90~146 mm
Borehole Depth30 m
Lowest Horizontal Hole500 mm
Highest Horizontal Hole3200 mm
Travel Speed2.5 km/h
Climbing Gradient30°
Gradient for Trailing Compressor15°
Rotation Speed0~170 r/min
Rotation Torque2960 Nm
Compensation Length900 mm
Operating Pressure0.7~1.7 MPa
Air Consumption9~14 m3/min
Minimum Ground Clearance472 mm
Propulsion Beam TiltTilt down 105°, up 13°
Propulsion Beam SwingRight 5°, Left 90° (or Right 90°, Left 5°)
Boom Tilt AngleUp 49°, Down 25°
Boom Swing Angle (Horizontal Boom)Left 27°, Right 29°
Dimensions (Transport State) L × W × H6500 × 2110 × 2400 mm
Diesel Tank Capacity85 L
Hydraulic Oil Tank Capacity188 L
Total Weight5.95 t
Table 2. Measurement methods for drilling parameters.
No.Drilling ParameterSensorMeasurement Method
1Propulsion SpeedDisplacement SensorAfter drilling begins, data are collected twice per second. Every 512 bytes of data are stored once the buffer is full. The displacement measured by the sensor is divided by time to obtain the propulsion speed.
2Impact PressureAir Pressure SensorUsing a 141.5H-141.5A tee fitting, the air pressure sensor is connected to the tee and data are transferred through a high-pressure oil pipe to a custom data acquisition and storage system.
3Rotary PressureHydraulic Pressure SensorUsing a 141.5H-141.5A tee fitting, the hydraulic pressure sensor is connected to the tee, and data are transferred through a high-pressure oil pipe to the custom data acquisition and storage system.
4Propulsion PressureHydraulic Pressure SensorUsing a 141.5H-141.5A tee fitting, the hydraulic pressure sensor is connected to the tee, and data are transferred through a high-pressure oil pipe to the custom data acquisition and storage system.
Table 3. Specifications of the displacement sensor.
ParameterValue
Signal OutputDigital (pulse) signal
Measurement Range0–3500 mm
Signal TypeDifferential, open circuit, push–pull, voltage, RS485/232
Resolution0.01/0.02/0.05 (selectable)
Linearity Accuracy0.05% FS
Repeatability0.01%
Maximum Speed1000 mm/s
Wire RopeHigh-flex imported plastic-coated steel wire
Pull Force at Cable Outlet5 N
Service Life2 million cycles
Operating Voltage5 V, 5–24 V, 10–30 V
Operating Temperature−25–75 °C
Protection RatingIP54 (standard), IP65 (optional)
Housing MaterialImported aluminum alloy, anti-static, nonconductive
Table 4. Specifications of the pressure transmitter.
ParameterSpecification
Pressure TypeGauge pressure, negative pressure, absolute pressure
MaterialCore: 316 stainless steel; Shell: 316 stainless steel
Output Signal4–20 mA, 0–5 VDC, 0–10 VDC, 1–5 VDC
Ambient Temperature−40 to 85 °C
Overload Capacity200% FS
Vibration Resistance25 g (20–2000 Hz)
Response Frequency≤500 Hz
Measuring Range0–30 MPa
Accuracy0.5%
Power Supply24 V DC
Output4–20 mA
Table 5. Specifications of the AM26C32.
Technical ParameterParameter Value
DC Voltage4.50 V (min)
Supply Current15 mA
Operating Temperature (Max/Min)70 °C/0 °C
Supply Voltage (Max/Min)5.5 V/4.5 V
Table 6. Technical specifications of the W25Q256 chip.
Parameter NameSpecification
Mounting StyleSMD/SMT
PackageWSON-8
Maximum Frequency133 MHz
Interface TypeSPI
Data Bus Width8-bit
Supply Voltage (Max/Min)1.95 V/1.7 V
Operating Temperature (Max/Min)85 °C/−40 °C
Table 7. BQ method rock mass classification table.
Rock Mass GradeQualitative Characteristics of Rock Mass QualityBQ Value
IHard rock, intact rock mass.>550
IIHard rock, relatively intact rock mass;
Moderately hard rock, intact rock mass.
550~451
IIIHard rock, moderately fractured rock mass;
Moderately hard rock, relatively intact rock mass;
Moderately soft rock, intact rock mass.
450~351
IVHard rock, fractured rock mass;
Moderately hard rock, moderately fractured to fractured rock mass;
Moderately soft rock, relatively intact to moderately fractured rock mass;
Soft rock, intact to relatively intact rock mass.
350~251
VModerately soft rock, fractured rock mass;
Soft rock, moderately fractured to fractured rock mass;
All extremely soft rocks and all extremely fractured rocks.
≤250
Table 8. Surrounding rock classification database.
Propulsion Speed (m/min)Impact Pressure (Pa)Propulsion Pressure (Pa)Rotary Pressure (Pa)Rock ClassificationSample Size
0.91135.0887.1199.37Grade 276
1.04137.9576.3391.12
1.37133.8877.0294.15
0.96153.2574.2695.04
1.41144.3463.3884.12Grade 3119
1.62143.3662.1581.56
1.89147.8670.1295.14
1.64151.7770.0396.58
2.32143.1277.3383.22Grade 4129
2.14138.8672.1279.86
2.35129.4367.7278.58
2.18138.8972.2379.81
3.28124.2949.3965.11Grade 5112
3.31127.0954.1575.93
2.61122.5549.6168.11
2.88122.9258.1373.42
Table 9. Sample selection range table.
Rock ClassificationDrilling ParameterSelection Range
Grade 2Impact Pressure[α2 − β2, α2 + β2]
Rotary Pressure[γ2 − δ2, γ2 + δ2]
Grade 3Impact Pressure[α3 − β3, α3 + β3]
Rotary Pressure[γ3 − δ3, γ3 + δ3]
Grade 4Impact Pressure[α4 − β4, α4 + β4]
Rotary Pressure[γ4 − δ4, γ4 + δ4]
Grade 5Impact Pressure[α5 − β5, α5 + β5]
Rotary Pressure[γ5 − δ5, γ5 + δ5]
Table 10. Statistical table of drilling parameters database before and after filtering.
Rock ClassificationTime PointStatisticImpact Pressure (Pa)Rotary Pressure (Pa)Sample Size
Grade 2Before FilteringMean145.1497.3276
Standard Deviation14.287.36
After FilteringMean144.4394.9564
Standard Deviation11.376.09
Grade 3Before FilteringMean144.0792.08119
Standard Deviation12.7511.66
After FilteringMean147.8595.38104
Standard Deviation6.178.44
Grade 4Before FilteringMean136.4475.16129
Standard Deviation8.926.50
After FilteringMean135.9075.52111
Standard Deviation4.164.53
Grade 5Before FilteringMean123.3369.18112
Standard Deviation7.346.39
After FilteringMean123.0269.4892
Standard Deviation4.614.97
Table 11. Results of random forest evaluation.
Rock Mass GradePrecisionRecallF1 Score
Grade 20.940.790.86
Grade 30.830.970.90
Grade 40.970.940.96
Grade 50.960.930.95
Average Accuracy0.930.910.92
Disclaimer/Publisher’s Note: The statements, opinions and data contained in all publications are solely those of the individual author(s) and contributor(s) and not of MDPI and/or the editor(s). MDPI and/or the editor(s) disclaim responsibility for any injury to people or property resulting from any ideas, methods, instructions or products referred to in the content.

