Abstract
With the increasing demand for medical checkups, problems such as overcrowding and confusion in the public spaces of physical examination centers are becoming prominent. This seriously affects the efficiency of medical checkups and the satisfaction of patients. Because of the lack of reference norms and standards, spatial resources are allocated blindly in physical examination centers. Therefore, the reasonable prediction of demands for space and the allocation of areas for public space are problems we need to explore. This study aims to establish a foundation for spatial resource allocation by analyzing the relationship between area allocation and volume of medical checkups and spatial comfort. The objective is to balance service quality and construction costs in physical examination centers. Utilizing AnyLogic, this research simulates pedestrian flow characteristics during peak hours based on empirical data. Additionally, it provides statistics on and analysis of such areas in 30 physical examination centers. The findings reveal that the average per capita allocation of public space ranges from 6.90 to 7.10 m2. The functional relationship between the area of public space (y) and the total area (x) is y = 0.3649x − 57.096. This paper also proposes a relationship between the waiting space and the daily volume of medical checkups according to two comfort levels. The percentages of waiting space in public space ranges from 10% to 12.5% (comfort level) and 7% to 10% (general comfort level). This research provides architects with a specific and operable foundation for space planning, enhancing the standardization and scientification of physical examination center construction. Furthermore, the methodology used in this study proves valuable for future analyses of the interrelationships among functional units in medical buildings. It can also be applied during the postuse evaluation phase, enabling continuous assessment and iterative improvement in the design.
1. Introduction
As public awareness of disease prevention improves, people are realizing that routine health checkups can detect diseases at an earlier and more treatable stage, thereby greatly reducing associated risks [1]. According to the World Health Organization, nearly one-third of all diseases are now detected through regular health checkups. Health management has, thus, become a crucial need for individuals [2]. At the same time, it has become a key consideration for public health policymakers [3]. Governments worldwide have given more support to the health industry [4]. In 2022, China issued the “Notice on Printing and Distributing the National Health Plan for the 14th Five-Year Plan”, emphasizing the vigorous development of health checkups and health risk assessment services [5]. Several factors have driven substantial growth in the health checkup market [6], with China’s market size increasing by approximately 10.7% in 2022 compared to 2021 [7]. Among various health checkup institutions, comprehensive hospital physical examination centers, which are dedicated departments within hospitals, are particularly noteworthy. Equipped with advanced technology and professional staff, these centers provide comprehensive services to the public and hold a major market share [8]. The percentage of visits to hospital physical examination centers in 2020 was 82.36%. As the demand for medical checkups increases, construction and enhancement of these institutions, alongside improvements in patient experience, are becoming particularly important. The research underscores that escalating volumes of medical examinations have exacerbated issues such as congestion and disorder in public spaces within these centers. An unreasonably sized space leads to negative emotions, such as waiting anxiety, in patients [9], and this also seriously affects order and efficiency [10]. Areas of public space encompass all open areas, comprising waiting areas and passageways, that patients navigate and in which they queue. Waiting space areas are those in which patients wait, providing seating and other amenities. Insufficient public space leads to congestion, while excessive space results in wasted resources and increased operational costs due to the “half-day population peak” phenomenon [11]. Existing construction guidelines for physical examination centers often stipulate a minimum value for floor space, such as the requirement of at least 400 square meters under the “Interim Provisions on the Management of Health CheckUps” [12]. However, there are no guidelines on the share of each functional zone’s area. Because of the lack of quantitative indicators, all kinds of new or renovated physical examination centers are faced with the challenge of scientifically and rationally allocating spatial resources. The scientific control of public space indicators has become an urgent issue in their planning.
Therefore, this study aims to scientifically quantify public space indicators using AnyLogic simulation and statistical analysis of sample data. This study focuses on three research objects related to the indicators of public space areas in physical examination centers. Firstly, an AnyLogic simulation experiment was performed to model the pedestrian flow and queue dynamics in public spaces during peak hours. Secondly, statistical and regression analyses of the sample data were conducted to quantify the functional relationship between area of the public space and total area. Subsequently, integrating peak-hour pedestrian flow enabled the determination of per capita public space requirements. Thirdly, the number of people queueing during peak hours was transformed into the “waiting seat index” to assess the proportion of waiting space within public areas and its impact on the overall allocation of space. Following a presentation of the methodology, the key findings, limitations, and future research are outlined. This research can assist architects in effectively adjusting and controlling area allocation, balancing spatial comfort with resource allocation efficiency. Achieving such a balance is crucial for the design and operation of health examination centers [13]. Additionally, the use of simulation and data analysis methods is expected to facilitate scientific decision making regarding the spatial configuration of various medical facilities in the future.
2. Literature Review
2.1. Study of Public Spaces in Medical Buildings
At present, the phenomenon of crowded public spaces in various medical institutions is becoming increasingly prominent. Several factors affect patient satisfaction with medical checkups, including efficiency and waiting time. However, the physical environment significantly impacts satisfaction and the competitiveness of physical examination centers [8]. Patients often experience anxiety and stress when visiting hospitals, making them more sensitive to their overall experience. Public spaces can either alleviate or exacerbate these feelings, influencing patient trust in healthcare providers [14]. Thus, the waiting experience greatly influences patients’ perceptions of the quality of healthcare they receive [15]. Many researchers are dedicated to studying and optimizing these spaces to improve their functionality and comfort, ultimately providing patients with a better experience. Some scholars have studied the factors affecting the comfort and satisfaction of public spaces in healthcare organizations. For example, LaVela concluded that good signage, adequate seating, and uncrowded space are important features for improving patients’ perception of the care environment [16]. Xuan et al. found that the size of the waiting area, seating, and visual arts are significant physical environment elements [17]. Prugsiganont examined the underlying issues of overcrowding and compared the spatial experience in non-clinical areas of public hospitals, offering methods to optimize hospital waiting areas [18]. Zraati explored the choice of environmental colors in hospital public spaces and their impact on the patient waiting experience, showing that using warm colors to decorate waiting rooms can increase patients’ waiting patience and reduce agitation [19]. Some scholars have studied how to rationalize the layout of public spaces and waiting areas to improve space utilization efficiency and comfort. For instance, Jafarifiroozabadi et al. utilized VR to simulate different user scenarios to understand patients’ preferences for waiting room design, providing actionable information and methods to support layout and design [20]. Using an evidence-based approach, Yi et al. developed a design strategy for the public space of a pediatric outpatient clinic based on the following four dimensions: functional layout, flow organization, supporting facilities, and environmental details [21]. Other scholars have investigated how to provide psychological and emotional support through the environmental design of public spaces to alleviate patients’ waiting anxiety. For example, Xia et al. integrated art installations into the public space of a pediatric outpatient clinic and demonstrated that these installations could improve the overall healthcare waiting experience [22]. A few scholars have quantified public space area indicators. For example, Luo in “Modern Hospital Architectural Design” (2010) proposed that the number of people in the outpatient waiting hall during peak hours should be 15% to 20% of the outpatient volume, with the per capita area being 1.2–1.5 m2 per person for adults and 1.5–1.8 m2 per person for children [23]. However, the number of outpatient visits to medical institutions has dramatically increased in recent years [24], significantly changing the number of people in public spaces. Wang et al. used simulation methods to analyze the peak number of people in the internal medicine outpatient clinic hall, correcting the ratio of the number of people in the hall at the peak time to 9.2–25.3%, and proposed the use of the “number of seats in the waiting room” instead of “per capita area” for predicting the waiting space area under different comfort needs [25]. However, the behavioral patterns of people in physical examination centers differ from those in general outpatient departments. General outpatients are usually diagnosed and treated for specific health problems, involving a single entry and exit from a single clinic. In contrast, physical examination centers include multiple departments such as internal medicine, surgery, gynecology and obstetrics, ophthalmology, otorhinolaryngology, stomatology, medical imaging, and medical testing [12]. The Expert Consensus on Basic Items for Health Checkups mentions three main categories of compulsory items: clinical examination, laboratory examination, and auxiliary instrument examination [26]. Therefore, patients need to choose appropriate medical checkup items based on their health conditions and the professional guidance of doctors, requiring multiple entries and exits from different clinics (Figure 1). In addition, because of the characteristics of physical examination centers with concentrated peak flows, the applicability of the above indicators needs to be tested. Through reviewing the relevant literature, it is known that the current research on the public space of physical examination centers focuses on the qualitative analysis of design elements such as spatial layout and flow, such as the discussion of architectural space design strategies for healthcare institutions under the updating of medical technology [27], the analysis of spatial design strategies for healthcare institutions under the update of medical technology [26], the analysis of spatial types and composition of physical examination centers of different scales [28], and the study of the relationship between the internal space of health checkup centers and public space through typology and evolutionary space system [29]. However, there is a lack of literature and standards for controlling the size indicators of physical examination centers.
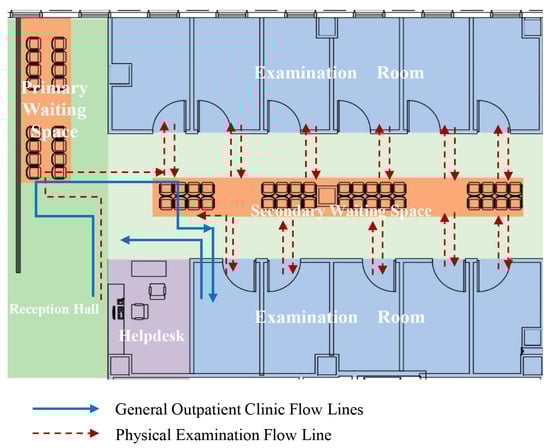
Figure 1.
Flow lines for physical examinations and general outpatient visits.
In summary, optimizing the public space environment can effectively improve the patients’ perception of waiting time and spatial comfort, thereby improving the overall quality of medical services. However, most of the current research focuses on qualitative analyses of public space design elements from the perspective of environmental behavioral psychology. There is relatively limited research on quantifying public space demands and addressing space crowding issues through reasonable area indicators. This gap is particularly evident in physical examination centers, which are high-intensity hospital departments. The lack of quantitative research on design indexes for these centers results in numerous challenges during new construction or renovation projects. Therefore, it is necessary to study the public space indexes to provide architects with a solid basis for planning.
2.2. Determination of Medical Space Needs and Area Indicators
The area of various types of spaces in healthcare buildings directly affects the patient experience and the efficiency of healthcare services. To reasonably determine space requirements and area indicators, researchers have proposed and applied various methods. Some scholars have determined the area requirements on the basis of statistical analysis of relevant space areas in multiple samples, combined with medical building design standards. For example, Hang et al. explored the ratio of each functional unit of the outpatient department based on the area index data from actual construction projects, applying the basic principles of statistical regression analysis, which provided intuitive quantitative parameters for design [30]. Some scholars have also adjusted and optimized the space by collecting feedback on patient satisfaction with the space. For example, Yurtgün et al. used a morphological card technique to analyze wards and take spatial readings of design elements that affect space perception. The information collected helped to determine the preference level for elements such as form size in pediatric ward design [31]. However, this method relies to some extent on the subjective experience of the patient and also requires ongoing feedback and adjustment. Other scholars have used simulation and modeling tools to conduct foot traffic or space capacity analysis to determine space needs and area metrics. For example, Paul J et al. used a simulation program to determine the number of patients that must be accommodated in a recovery room in a hospital with a specific number of operating rooms, allowing for further determination of recovery room size [32].
2.3. Application of Simulation to Healthcare
Simulation methods can analyze and optimize spatial demand more comprehensively and accurately, providing a scientific basis and decision-making support. Modeling is an essential portion of most basic choice-making methods [33]. Among these methods, the AnyLogic platform provides a powerful tool for studying and optimizing healthcare building space with its high-precision simulation, visualization, and scalability advantages. AnyLogic is currently used for process optimization in outpatient departments. For example, Bohui et al. developed a discrete-event simulation model to evaluate the operational performance of a clinic, improving patient flow and reducing wait times [34]. Anthony et al. modeled the process of accurately describing a patient’s journey from emergency department entry to discharge, resulting in programs and strategies to improve hospital patient flow and reduce emergency department wait times [35]. Secondly, AnyLogic has also been applied to optimize the layout of some hospital departments. For example, Kevin et al. divided the operating room into multiple zones and analyzed the frequency and duration of movement from the starting point to the destination. Through a discrete event simulation model based on the intelligentsia, it was investigated how the size of the operating room and the layout of the operating room equipment affected the movement of the surgical staff and the total number of contacts during the procedure [36]. Bednar analyzed the spatial layout of an outpatient care facility and adjusted it accordingly using metrics such as staff utilization, staff walking distances, and patient wait times to improve the characteristics of each functional room [37]. Studies have also used simulation tools for healthcare resource allocation and staff scheduling. For example, Kevin et al. used simulation models to test various staffing policies within anesthesiology departments to help hospital administrators adjust medical staffing on the basis of population prevalence rates [38]. Chen et al. used simulation to address appointment scheduling and exam room assignment to balance radiographers’ workloads and maintain high equipment utilization [39]. The above literature demonstrates case studies of AnyLogic in different healthcare scenarios such as emergency rooms, operating rooms, outpatient departments, and inpatient wards, showing its wide range of applications and potential. However, there is a gap in the current research on using simulation models to study their internal spatial problems in physical examination centers. Current research on improving congestion in the public space of medical buildings by simulation methods mostly focuses on optimizing the patient consultation process and medical equipment resource allocation, aiming to reduce queuing through the improvement in consultation efficiency [40]. For instance, improvements in patient flow in outpatient internal medicine departments are achieved through intelligent agent modeling [41], and workflows and efficiency in physical examination centers are optimized [42]. Emergency department simulation models are established to shorten patient consultation times and evaluate and optimize emergency department designs [43]. However, there is a lack of more comprehensive research on utilizing the rational design of the physical environment to ensure patient waiting comfort and improve the perception of waiting time [44]. Therefore, this paper chooses AnyLogic to conduct experiments and tries to establish simulation models of physical examination centers to simulate the characteristics of its internal human flow. This is used as the basis to quantify the space requirements and explore the space area index.
2.4. Example Sample Data Statistics and Analysis
Hospital design requires consideration of multiple factors to optimize its functional and operational performance. Statistical and regression analysis of example data can reveal the relationship between design parameters and building performance. Some existing studies have utilized this approach to explore the impact of hospital design on patient care and hospital operations. Boussabaine et al. investigated the impact of bed occupancy on health facility operating costs by performing regression statistical analyses on empirical data from 19 short-care acute and long-term care hospital facilities in France. The study obtained the relationship between bed occupancy and operating costs for acute care hospital facilities in France [45]. Deng et al. selected three typical floor plan layout types for hospital ward buildings. The relationship between building energy consumption, floor plan layout, and building size was quantified using linear and nonlinear regression, confirming that the layout and size of the ward building significantly affect nursing unit rounds’ efficiency and building energy efficiency [46]. Gómez-Chaparro et al. analyzed eight Spanish hospitals with similar architectural characteristics. Variables such as the number of maintenance incidents, operation times, costs generated, and user complaints were studied and quantified. Equations were found to estimate the average annual maintenance costs of hospitals based on the number of hospitalizations per year and useful floor space [47]. Some design empirical values can be summarized by statistical analysis of example samples. This helps to improve design efficiency and management. Therefore, this paper tries to explore the public space area index through this method, aiming to provide a basis for its preplanning by exploring the design empirical index.
3. Methodology
The framework of this study is shown below (Figure 2). First, the model is established on the basis of the plan and configuration of nine physical examination centers, adhering to standard examination procedures and items. The model is validated to output the daily medical checkup volume and public space flow. Secondly, statistics on the area indexes of 30 physical examination centers are compiled. Comparative and linear regression analyses are employed to establish the relationship between the area of public space and total size. The per capita area index of public space is derived by integrating the peak-hour number of people output from the simulation. Finally, two comfort levels are defined on the basis of the queue dynamics. Methods for calculating waiting space areas under these comfort levels are developed, along with their respective proportions within public spaces.
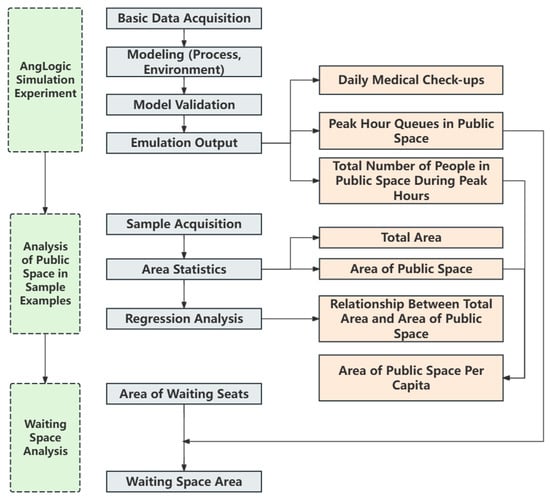
Figure 2.
Research framework.
3.1. AnyLogic-Based Simulation Experiments
3.1.1. AnyLogic Simulation Methods
In the simulation of physical examination centers, selecting an appropriate model is crucial for accurately capturing pedestrian flow dynamics and optimizing the service flow. Common microscopic pedestrian simulation models include utility-based models, gravitational models, social force models, intelligent agent models, and queue network models. Given the intricate nature of pedestrian behavior and self-organization within physical examination centers, simulation models must effectively capture these complexities. Social force models and intelligent agent models are widely utilized for simulating pedestrian flow and optimizing resource allocation. However, intelligent agent models require substantial computational resources and time when applied to complex systems. Physical examination centers are more suitable for simulation using the social force model to accurately capture the phenomenon of self-organization of people flow and interaction behaviors. Following a comparative evaluation of software, this study selected AnyLogic 8.5 as the platform for model development and research. AnyLogic is a virtual prototyping environment simulation software [48] which consists of an environment model and a behavioral flow module [49]. It can be modeled using flowcharts, state charts, operation diagrams, and other visual languages [50], thus helping to create complex but easy-to-handle system models. The pedestrian simulation module is on the basis of the social force model [51]. The continuity of the model allows it to accurately describe the forces at various levels, yielding results closely aligned with the real situation [52]. Simulation is increasingly used to assist design decisions in healthcare space research [53]. Li et al. used AnyLogic to construct a simulation model to explore options for maximizing the efficiency of magnetic resonance examinations in medical centers [54]. Stojkovikj et al. developed a generalized simulation model for the emergency department to analyze the path of a patient from entry to the emergency room to discharge [55]. In this study, simulation tools are used to analyze various metrics of foot traffic in physical examination centers, serving as a basis for the quantitative analysis of public spaces (Figure 3).
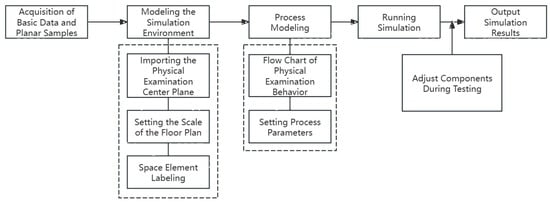
Figure 3.
Simulation process of physical examination centers.
3.1.2. Basic Data Collection and Setting
To accurately simulate medical examination behaviors, it is essential to obtain the parameters for the examination process and duration to parameterize the model. There is no significant difference in the routine physical examination process and examination methods among different physical examination centers. To facilitate research, this study presents the physical examination items currently utilized in most comprehensive hospital physical examination centers as design references. It uses a standardized set of physical examination items and procedures for simulated analysis [56] (Figure 4).
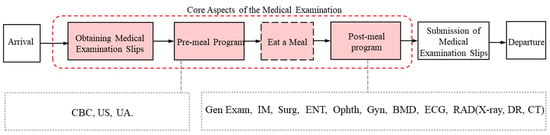
Figure 4.
Schematic diagram of the physical examination process.
The standard examination items include Complete Blood Count, Urinalysis, Height and Weight Measurement, Blood Pressure, Internal Medicine Examination, Surgical Examination, Ophthalmology, Otolaryngology, Gynecology, Electrocardiogram, Bone Density Test, Ultrasonography, and Radiographic Imaging (X-ray, DR, and CT). The sequence of physical examination items typically depends on whether fasting is required. For example, because blood tests require patients to be fasting, they are typically scheduled at the beginning of the physical examination process. In the latter half of the examination, the examinee’s emotions and heart rate tend to stabilize, which facilitates procedures such as electrocardiograms and radiographic imaging. These procedures often occur towards the end of the examination process [28]. The spatial arrangement of examination items also follows the sequence of the process.
The duration of identical examinations and the distribution of daily patient flow at different physical examination centers show relatively minor differences. In this study, the data of the First Hospital of Peking University serve as the standard reference. The time taken by 10 randomly selected examinees is measured and averaged to obtain the length of the examination for each item (Table 1). Additionally, appointments are randomly sampled over two weekday mornings and one weekend morning between 7:00 a.m. and 11:00 a.m. Hourly appointment counts are averaged to determine the average number of examinees arriving during each period and their respective proportions (Table 2). Official information provided the average daily outpatient volume at the First Hospital of Peking University.

Table 1.
The current configuration of the physical examination centers of the First Hospital of Peking University and the duration of each examination.
Table 2.
Average number and percentage of arrivals of physical examinees by time period.
3.1.3. Modeling
- (1)
- Premise Assumptions: In order to reduce unnecessary interference and make the model more effective in similar use cases, assumptions need to be made to reduce complexity [2]. It is assumed that physical examinations proceed in sequential order on the basis of the assigned numbers. The checkup process is conducted by the standard flow, ignoring the case of queue jumping. The simulation does not account for sudden influxes of people during group physical examinations. The dining session and the corresponding time are not incorporated into the modeling system. The upper limit for the number of individuals entering the examination system is set to ensure that all examinations conclude by 12:00 noon, excluding the situation that a large number of patients remain in the system during non-operating hours. Considering average walking speeds and pedestrian size, the contact tolerance is set at 0.3 m [59], so that physical examinees do not feel crowded or collision when moving.
- (2)
- Process Modeling: Utilize modules such as PedSource (generation source), PedService (service reception), PedSink (elimination source), and others from the pedestrian library in AnyLogic to establish a process model of physical examination [60] (Figure 5). Experimental parameters for each logic module are configured and documented (Table 3). Each physical examination item in the model corresponds to actual sample configurations, following the standard sequence and content of physical examinations. Since an ultrasound examination needs to be performed under the condition of self-sensing bladder filling, there are two possible sequences for the examination. The order of routine urine sampling is adjusted accordingly. To enhance realism, the model incorporates two different examination triage situations for physical examinees.
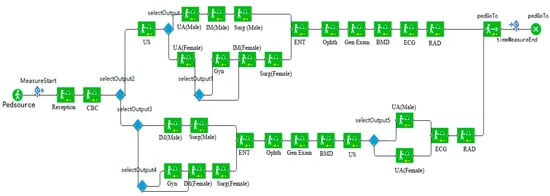 Figure 5. AnyLogic physical examination process model diagram.
Table 3. Logic modules and parameter settings.
Figure 5. AnyLogic physical examination process model diagram.
Table 3. Logic modules and parameter settings.
- (3)
- Environment Modeling: Import the floor plans of nine physical examination centers of different scales under the level of conventional equipment configurations into AnyLogic (Figure 6). The space marking module in the pedestrian library is utilized to delineate the boundaries of each area, including entrances and the extent of public spaces [52]. The open spaces such as traffic areas and waiting spaces in the floor plan are jointly counted as public spaces in the simulation. The examination service points of each item in the standard process are placed in the corresponding rooms. The examination module with parameters is associated with each examination service point one by one [61]. Rooms not designated for standard physical examination procedures are excluded from the simulation environment and processes.
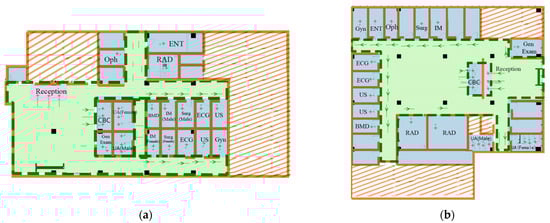
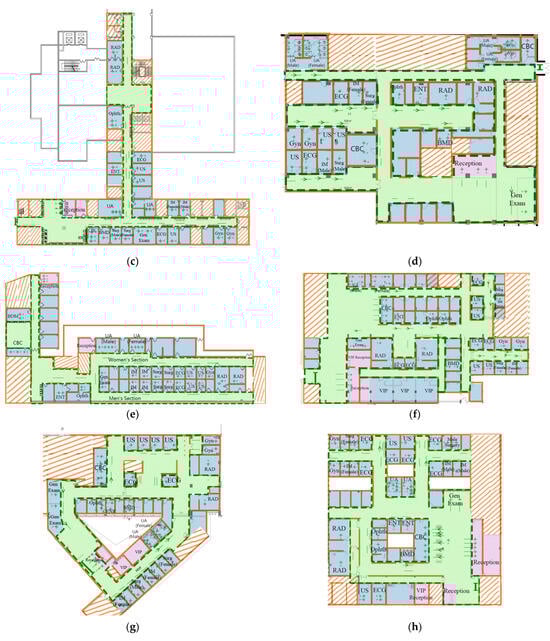
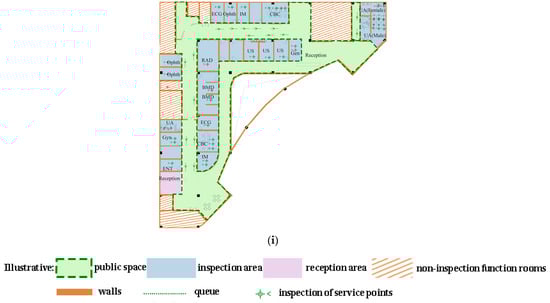 Figure 6. Environmental simulation model diagrams for the sample of physical examination centers. (a) Sample 1 (970 m2), (b) Sample 2 (1040 m2), (c) Sample 3 (1350 m2), (d) Sample 4 (1390 m2), (e) Sample 5 (1450 m2), (f) Sample 6 (2100 m2), (g) Sample 7 (1820 m2), (h) Sample 8 (2580 m2), (i) Sample 9 (two floors, total 4290 m2).
- (4)
- Model Validation: Run the sample model of Peking University First Hospital Physical Examination Center (Sample 3) (Figure 7). Subsequently, the reasonableness and credibility of the model are validated by comparing the differences between the model output data and actual review data [62]. The simulation results show that 150 individuals completed medical examinations between 7:00 a.m. and 12:00 noon (Figure 8). It is roughly in line with the average daily count of 160 physical examinations observed in the actual research data. This consistency suggests that the model is reliable.
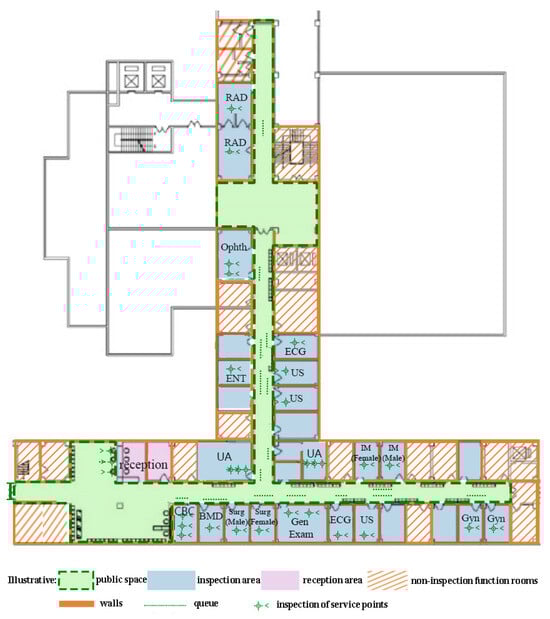 Figure 7. Environmental simulation model of the physical examination center of Peking University First Hospital.
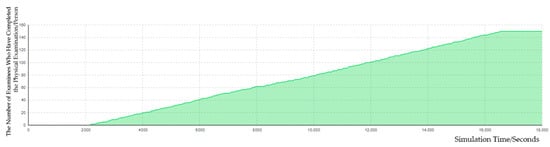 Figure 8. Daily physical examination volume of Peking University First Hospital Physical Examination Center.
- (5)
- Model Operation and Data Output: Running the sample models of all physical examination centers to obtain daily examination volumes, the total occupancy of public spaces, and the number of people in queues. Specifically, the count of individuals in public spaces encompasses all physical examinees during transit and while waiting in line for their examinations. Queue sizes in public spaces denote the number of examinees waiting in line when examination capacities are maximized. To enhance accuracy, each sample is simulated five times.
3.2. Statistical Analysis of Case Data
This study collected 30 physical examination center samples. A mathematical model for the area share of public space was established by counting and fitting the area indicators. The per capita area index of public space was then derived by integrating the simulation data. Additionally, the plane samples were also the basis for space simulation.
3.2.1. Sample Acquisition
Sample Selection: The samples cover large, medium, and small physical examination centers, with sizes ranging from 600 to 4300 m2. In addition to existing operational centers, newly constructed or yet-to-be-built hospitals were preferentially selected to ensure the timeliness of the sample data. To account for varying medical resource demands and population structures, the samples were drawn from cities of various levels. This comprehensive selection approach reflects the differences in spatial resource allocation among physical examination centers with different service levels and construction periods [63]. It makes the analysis results more comprehensive and applicable [64].
The sample collection methods were as follows:
- (1)
- Field Measurements and Data Collection: Floor plan data were obtained through field measurements or from the hospital management. This includes the layout and dimensions of different functional areas of physical examination centers.
- (2)
- Acquisition of Architectural Design Documents: CAD drawings of physical examination centers were obtained from relevant design units that have not yet been constructed.
Drawing Process: Using AutoCAD 2023 to draw floor plans of the physical examination centers based on measured data or architectural design documents. During this process, key public spaces, waiting areas, circulation areas, and other relevant features were annotated to facilitate subsequent area measurements and the establishment of simulation models.
3.2.2. Area Statistical Analysis
Exclusion of Outliers: Floor plans were organized to exclude possible drawing errors or inaccurate measurement data, ensuring the reliability and accuracy of the analysis data.
Area Measurement: Important areas such as public spaces and waiting areas were marked and divided in CAD drawings. Area calculation tools in CAD software or manual measurement were used to determine the area of each region.
The analyses of area indicators were as follows:
- (1)
- Descriptive Statistics: Descriptive analysis was used to assess the collected information [65]. Large amounts of regional data were classified, organized, and described to understand their essential characteristics and distribution. This type of analysis, called descriptive statistics, is used to present data in tabular, graphical, and numerical form.
- (2)
- Regression Analysis: This study described the relationship between independent and dependent variables by establishing a mathematical model. After establishing the regression equation, its correlation coefficient was utilized to determine its applicability.
4. Results
4.1. Peak-Hour Pedestrian Traffic and Line-Ups in Public Spaces
The daily medical checkup volume, the number of people in the public spaces, and the number of people in the queue outputted by the simulation are shown below (Figure 9).
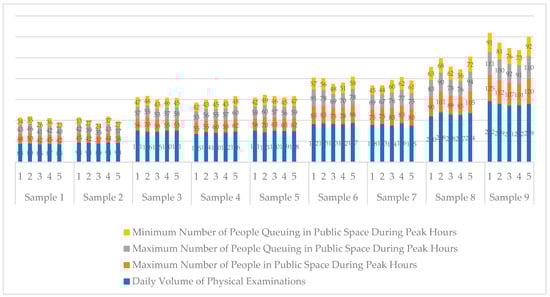
Figure 9.
The daily volume of physical examinations, the maximum number of people in public spaces during peak hours, and the maximum and minimum number of people in the queue during peak hours in the simulation samples of physical examination centers.
A comparison of results reveals three typical stages in the changes in the number of people in public spaces and those queuing. Taking the simulation experiment of Sample 3 (Peking University First Hospital) as an example (Figure 10), the first stage is approximately from 7:00 (0 s) to 8:55 (7000 s), where the number of people rapidly increases. The second stage lasts from about 8:55 (7000 s) to 10:20 (12,000 s), characterized by a consistently high number of people with fluctuations. The third stage is approximately from 10:20 (12,000 s) to 12:00 (18,000 s), where the number of people rapidly decreases. The second phase is defined as the peak hour [25].
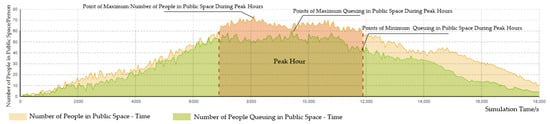
Figure 10.
Number of people in public spaces and people queuing up at the Peking University First Hospital Physical examination centers during peak hours.
The peak-hour maximum number of people in public spaces is compared to the daily volume of physical examinations to determine the percentage of people present during peak hours. Analysis reveals that this percentage ranges from approximately 38% to 50%, representing an increase compared to the 9.2% to 25.3% observed in internal medicine outpatient clinics [25]. Separate fittings of the daily volume of physical examinations (x) are conducted with the maximum (y1) and minimum (y2) values of people queuing during peak hours (Figure 11). Both show strong linear correlations, with the functional relationships being y1 = 0.3247x + 11.279 and y2 = 0.2704x + 5.2813.
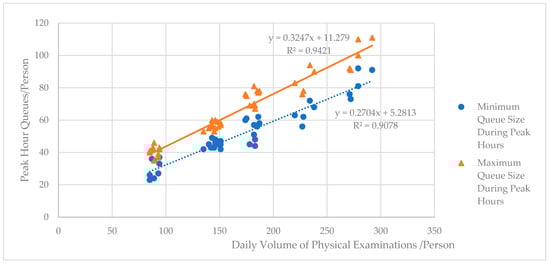
Figure 11.
Relationship between the number of people queuing up at the physical examination centers during peak hours and the daily volume of physical examinations.
4.2. Area Analysis of Public Space
The reasonableness of the public space area directly affects the comfort of physical examinations and operational costs. According to research on public areas, the peak times for medical checkups are typically from 9:00 to 10:30 AM, when the public space is most crowded. If the public space can accommodate the maximum number of customers during these peak hours, ensuring that most patients have enough seats and space to move around, then the area is optimally set. Conversely, if the number of customers far exceeds the design capacity during peak periods, leading to crowded spaces or unscientific design of the flow line, the area is insufficient. If the actual number of customers is far below the design capacity, resulting in underused space and low utilization of public facilities, the area is overestimated. By statistically analyzing the area of public spaces in each sample and their total area, it was found that the proportion of public space area generally ranged from 25% to 35% (Figure 12). In some individual physical examination centers, the proportion of public space areas exceeded 40%. These centers are often positioned as high-end facilities with a high level of overall comfort. Regression analysis between public space area (y) and total area (x) reveals a strong linear relationship with an R2 value of 0.9095. The two correspond to a functional relationship of y = 0.3649x − 57.096 (Figure 13). The areas calculated using the formula are compared with the actual areas of public spaces in the samples, and the error between the two is generally within 7.5% (Table 4), which indicates that the above functional relationship is rational. Architects can utilize the proportion and functional formula to accurately calculate public space areas on the basis of predefined scales for physical examination centers.
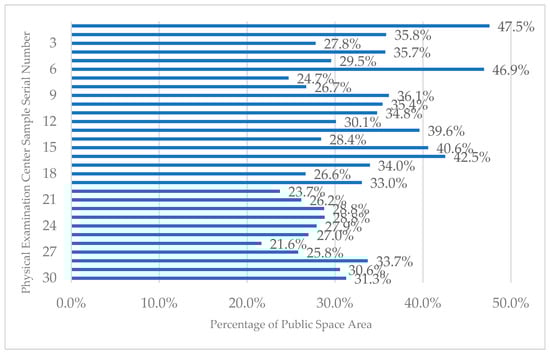
Figure 12.
Percentage of public space area in physical examination centers.
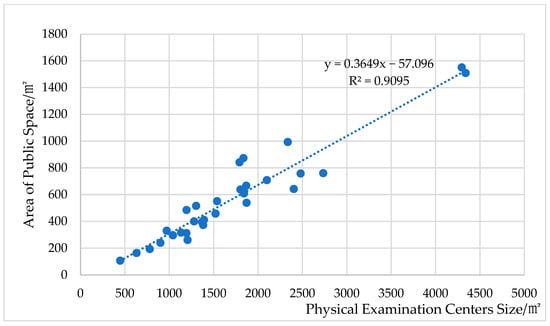
Figure 13.
Relationship between the area of public space and the size of the physical examination centers.
Table 4.
Comparison of actual and measured data for the validation sample.
The per capita area of public space at maximum flow can be determined by correlating the public space area of the simulation experiment sample with the peak-hour maximum number of people. Analysis shows that the per capita area of public space in physical examination centers is generally between 6.90 and 7.10 m2/person. Some high-end physical examination centers can reach more than 8.3 m2/person (Figure 14). On the basis of the per capita area indicator, during the early planning of physical examination centers, the public space area can be predicted by combining the expected volume of physical examinations and the proportion of people in public space during peak hours.
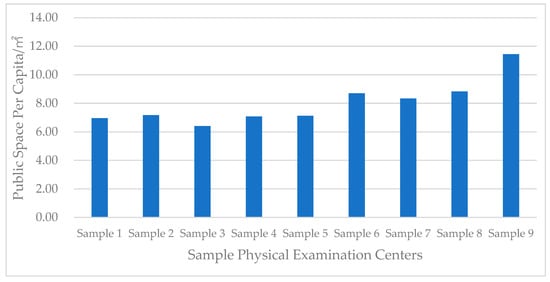
Figure 14.
Area per capita of public space in physical examination centers.
4.3. Area Analysis of Waiting Space in Public Space
The public space of the physical examination centers mainly includes the passage space and the waiting space for patients (Figure 15). The waiting time of patients accounts for about 2/3 of the entire consultation, so the reasonable configuration of the waiting space will directly affect the comfort of the physical examination process [20]. The waiting space area can be predicted on the basis of the number of waiting seats, ensuring comfort during peak hours and facilitating the optimized design of public spaces.
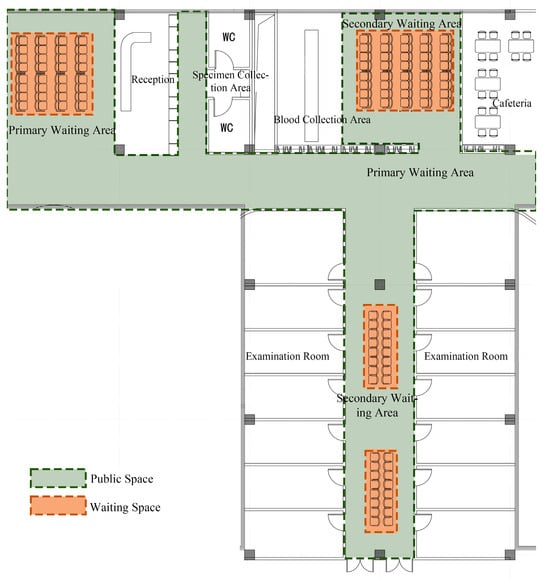
Figure 15.
Relationship between public space and waiting space in the physical examination centers.
Using the maximum and minimum values of the queue size during peak hours allows for defining the required number of seats at two comfort levels. At the “comfortable” level, where seats equal the peak-hour maximum queue, all examinees’ waiting needs are met continuously. At the “general comfort” level, seats match the minimum peak-hour queue, satisfying most examinees’ waiting requirements throughout the day. By correlating the number of waiting seats with the seating area index, the necessary waiting area can be calculated. There are no specific standards for seat dimensions in hospital waiting areas as stipulated in codes such as the General Hospital Building Design Code [66]. At present, the typical dimensions of waiting chairs in hospital waiting areas are mostly 60 cm (length) × 65 cm (width) (Figure 16), with an approximate 5 cm interval between chairs. The net distance between the front and back rows of seats is mostly around 80 cm [67], ensuring adequate seating without obstructing passage or compromising patient comfort. Therefore, the area occupied by each seat is approximately 0.94 m2. Referring to the relationship between daily examination volume and peak-hour queue size outlined earlier (Figure 8), coupled with seat area considerations, the functional relationship between the daily physical examination volume (x) and the area of the waiting space (y) is y = 0.3052x + 10.603 (comfort level) and y = 0.2537x + 5.0574 (general comfort level) (Figure 17). According to the above formula, the waiting space area of the nine physical examination center simulation samples can be calculated. A comparison with public space areas shows that waiting space proportions are about 10% to 12.5% for comfort level and 7% to 10% for general comfort level (Figure 18). Different-scale Physical Examination Centers can adjust the waiting space area on the basis of their service level and positioning, ensuring fine-tuned public space design.
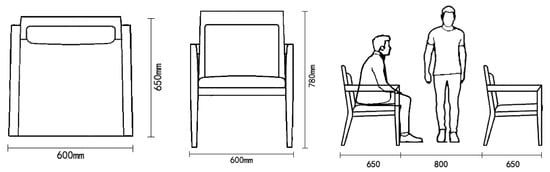
Figure 16.
Dimensions of conventional waiting seats.
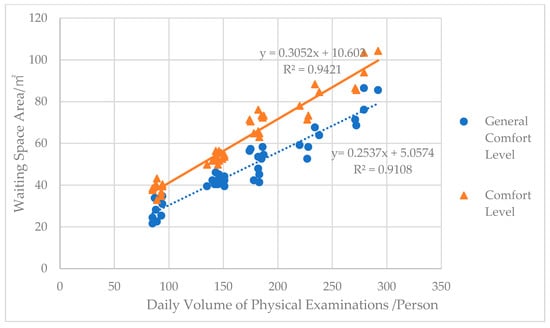
Figure 17.
Relationship between waiting space area and daily physical examination volume in physical examination centers.
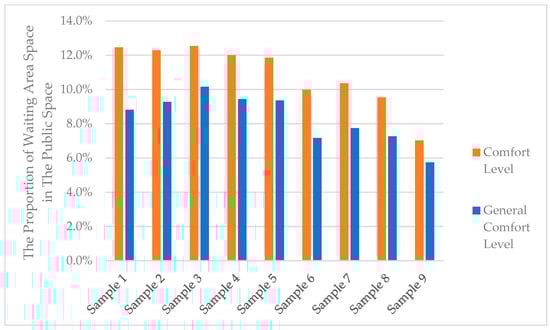
Figure 18.
Percentage of waiting space area in the public space of the physical examination centers.
5. Discussion
5.1. Key Findings
This study explores and quantitatively analyzes the public space area indexes of physical examination centers in comprehensive hospitals using the AnyLogic simulation platform. Recommendations for public space and waiting area sizes can be derived from predetermined total area or daily examination volumes. The main conclusions are as follows (Figure 19):
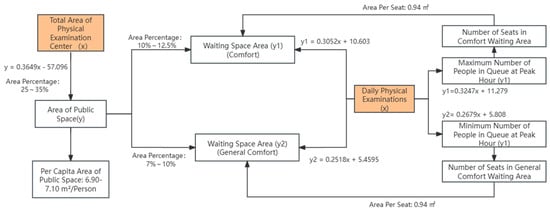
Figure 19.
Conclusions of the quantitative analysis.
- (1)
- Peak-Hour Patient Flow: The proportion of people in public spaces during peak hours at the physical examination centers ranges from 38% to 50%. The maximum (y1) and minimum (y2) values of the number of people in the queue during peak hours, as a function of the daily physical examination volume (x), are y1 = 0.3247x + 11.279 and y2 = 0.2679x + 5.808, respectively.
- (2)
- Public Space Area Ratio: The area of public space accounts for about 25% to 35% of the total area. The functional relationship between the area of public space (y) and the total area (x) is y = 0.3649x − 57.096. The per capita area of public space is approximately 6.90 to 7.10 m2 per person.
- (3)
- Waiting Space Area Ratio and Comfort Level: By converting the number of people in public spaces during peak hours into the number of seats in the waiting area, two comfort levels for waiting space can be defined. The equations, as functions of the daily physical examination volume (x) and the area of the waiting space (y), are y = 0.3052x + 10.603 (comfort level) and y = 0.2518x + 5.4595 (general comfort level). The area share of waiting space in the public space is 10% to 12.5% (comfort level) and 7% to 10% (general comfort level).
5.2. Research Contribution and Significance
These indicators can provide a basis for the fine-tuned configuration of the public spaces in physical examination centers, aiding in controlling area scale and adjusting the proportion of functional rooms. This enables scientific decision making in the allocation of spatial resources. Meanwhile, integrating AnyLogic simulation technology with statistical analysis of sample data fills the gap in existing research on the quantitative analysis of public space area indicators. It provides new insights and methods for similar studies. The simulation model developed in this study not only provides data support for determining the public space area during the preliminary planning stage but also aids in simulating and analyzing functional areas during detailed design phases, including the layout of access spaces and interrelationships among functional units. When the physical examination center is operational, the simulation model can also be used to evaluate the effectiveness of the public space. By analyzing indicators such as people flow, waiting times, and space congestion, the actual effectiveness of the design scheme can be assessed, providing a basis for subsequent design improvements.
5.3. Limitations and Future Research
This study focuses on the public space situation during peak hours, but public space utilization during off-peak hours and its impact on the overall space configuration has not been explored for the time being. In order to simplify the simulation model, some assumptions were made in the study, potentially overlooking practical complexities, such as the unpredictable behavior of medical examinees. Future studies should incorporate additional dimensions, such as off-peak hour analysis and complex behavior simulation. Moreover, expanding the diversity of data sources could enhance the model’s generalizability and reliability. With the above improvements and extensions, the research findings will be able to guide the design and management of public spaces more comprehensively and accurately.
6. Conclusions
This study investigates the public space area indicators of physical examination centers in comprehensive hospitals. It emphasizes the critical role of reasonable spatial arrangement in enhancing overall functionality and user experience. Through simulation analysis, this paper examines fluctuations in the total number of people in public spaces and the queue during peak hours. The findings reveal a robust linear correlation between peak-hour foot traffic in public spaces and daily physical examination volumes. The simulation results under this dynamic condition became the basis for predicting space demand. Secondly, through statistical analysis and regression modeling, the study identifies the relationship between public space size and the overall scale of the examination center. It further integrates simulation results to derive per capita public space area indicators. Additionally, the research delves into waiting areas within public spaces, defining the area proportions for two comfort levels based on seating requirements. These conclusions provide architects with specific metrics to optimize spatial resource allocation, ensuring a balance between service quality and construction costs. Moreover, they promote standardization and efficiency in medical building design. The approach combining simulation tools and empirical data proves effective in validating theoretical models according to real-world conditions, thereby enhancing the scientific basis of spatial planning. In the future, the application scope of this research method can be extended to optimize the space configuration of various medical places. At the same time, the public space configuration can be dynamically optimized according to real-time data to adapt to the changing demand for physical examination in different time periods and seasons. It can also be combined with psychology and behavioral science to further study the psychological and behavioral responses of patients in different spatial environments and further optimize the design of public space.
Author Contributions
Conceptualization, methodology, software, validation, formal analysis, investigation, resources, data curation, writing—original draft preparation, Y.D.; Conceptualization, methodology, writing—review and editing, supervision, and funding acquisition: Y.C. All authors have read and agreed to the published version of the manuscript.
Funding
This research was supported by The Ministry of education of Humanities and Social Science project (No.22YJAZH050): Research on the Construction of Sustainable Emergency Habitat Space System and Design Methods and Beijing Jiaotong University Horizontal Project of Social Sciences (No. A24SK00020): Big Data Management System Project for Medical Building Space.
Data Availability Statement
The materials and the data that support the findings of this study are available from the corresponding author.
Conflicts of Interest
The authors declare no conflicts of interest.
References
- Durojaiye, O. Health screening: Is it always worth doing. Internet J. Epidemiol. 2009, 7. Available online: http://ispub.com/IJE/7/1/3995 (accessed on 17 May 2020).
- Djanatliev, A.; German, R. Large scale healthcare modeling by hybrid simulation techniques using AnyLogic. In Proceedings of the 6th International ICST Conference on Simulation Tools and Techniques, Cannes, France, 5–7 March 2013; pp. 248–257. [Google Scholar]
- Rotondo, F.; Giovanelli, L.; Fadda, N.; Ezza, A. A methodology to design a performance management system in preventive care. BMC Health Serv. Res. 2018, 18, 1002. [Google Scholar] [CrossRef] [PubMed]
- Zhang, X. The Progress on the Problems and Solutions of Hospital Health Examination Centers. Front. Med. Sci. Res. 2024, 6, 23–27. [Google Scholar]
- The State Council of the People's Republic of China. Circular of the General Office of the State Council on the Issuance of the 14th Five-Year National Health Plan. 2022; pp. 17–31. Available online: https://www.gov.cn/zhengce/content/2022-05/20/content_5691424.htm (accessed on 20 May 2022).
- Yang, X. Some Experience about the Design of Hospital Medical Center. Constr. Des. Proj. 2011, 50–51. [Google Scholar]
- Puhua, C.R. Annual Research and Consultation Report of Panorama survey and Investment strategy on China industry; China Industrial Research Institute: Shenzhen, China, 2022. [Google Scholar]
- Kim, Y.; Chae, B.; Hwang, B. The effect of physical environments in the comprehensive health examination center on medical service value, satisfaction and switching barrier. J. Serv. Res. Stud. 2019, 9, 63–80. [Google Scholar]
- Fadyl, J.K.; Cunningham, H.; Nakarada-Kordic, I.; Reay, S.; Waters, T.; Waterworth, K.; Gibson, B.E. Settled and unsettling: Design and flows of affect in a hospital waiting area. Des. Health 2020, 4, 63–81. [Google Scholar] [CrossRef]
- Bahadori, M.; Teymourzadeh, E.; Ravangard, R.; Raadabadi, M. Factors affecting the overcrowding in outpatient healthcare. J. Educ. Health Promot. 2017, 6, 21. [Google Scholar]
- Luo, X. The Research on Design of Physical Exam Department in General Hospital. Master’s Thesis, Chongqing University, Chongqing, China, 2013. [Google Scholar]
- Circular of the Ministry of Health on the Issuance of the Interim Provisions on the Management of Health Check-Ups; Bull Ministry of Health of the People’s Republic of China: Beijing, China, 2009; pp. 31–33.
- Zhou, Y.; Sun, Y.; Xu, Y.; Yuan, H. Study on value-based design of healthcare facilities: Based on review of the literature in the USA and Japan. Front. Public Health 2022, 10, 883241. [Google Scholar] [CrossRef] [PubMed]
- Steele, J.R.; Jones, A.K.; Clarke, R.K.; Shoemaker, S. Health care delivery meets hospitality: A pilot study in radiology. J. Am. Coll. Radiol. 2015, 12, 587–593. [Google Scholar] [CrossRef]
- Arneill, A.B.; Devlin, A.S. Perceived quality of care: The influence of the waiting room environment. J. Environ. Psychol. 2002, 22, 345–360. [Google Scholar] [CrossRef]
- LaVela, S.L.; Etingen, B.; Hill, J.N.; Miskevics, S. Patient perceptions of the environment of care in which their healthcare is delivered. Health Environ. Res. Des. J. 2016, 9, 31–46. [Google Scholar] [CrossRef]
- Xuan, X.; Li, Z.; Chen, X.; Cao, Y.; Feng, Z. Study of the physical environment of waiting areas and its effects on patient satisfaction, experience, perceived waiting time, and behavior in China. Health Environ. Res. Des. J. 2021, 14, 108–123. [Google Scholar] [CrossRef] [PubMed]
- Prugsiganont, S. Waiting Space: Exploring Public Hospital Non-Clinical Areas through a User-Focused Design Approach. Ph.D. Thesis, Technical University of Denmark, Kongens Lyngby, Denmark, 2020. [Google Scholar]
- Zraati, P. Color consideration for waiting areas in Hospitals. In ICoRD’13: Global Product Development; Springer: New Delhi, India, 2013; pp. 1369–1379. [Google Scholar]
- Jafarifiroozabadi, R.; Joseph, A.; Joshi, R.; Wingler, D. Evaluating care partner preferences for seating in an outpatient surgery waiting area using virtual reality. Health Environ. Res. Des. J. 2021, 14, 210–223. [Google Scholar] [CrossRef] [PubMed]
- Qi, Y.; Yan, Y.; Lau, S.S.; Tao, Y. Evidence-based design for waiting space environment of pediatric clinics—Three hospitals in Shenzhen as case studies. Int. J. Environ. Res. Public Health 2021, 18, 11804. [Google Scholar] [CrossRef] [PubMed]
- Xia, Y.; Ramli, S.H.B.; Binti Zainudin, Z. The Development of Art Design for Waiting Area of Pediatric: Analysis from the Perspective of Quality Waiting and Art Installation. Int. J. Acad. Res. Bus. Soc. Sci. 2023, 13. [Google Scholar]
- Luo, Y. Modern Hospital Building Design; China Architecture Publishing & Media Co.: Beijing, China, 2001. [Google Scholar]
- National Health Commission of the People’ Repubilc of China. China Health Statistics Yearbook; Peking Union Medical College Press: Beijing, China, 2020; p. 128.
- Wang, B.; Mo, X. Research on the Waiting Area Index of Internal Medicine Clinic of General Hospital Based on AnyLogic Simulation. Archit. J./Jian Zhu Xue Bao 2021, 42–46. [Google Scholar]
- Expert Consensus—Consensus on Basic Programs for Health Checkups in China. Chin. Fam. Med. 2014, 17, 2032.
- Vickery, C.G.; Nyberg, G.; Whiteaker, D. Modern Clinic Design: Strategies for an Era of Change; John Wiley & Sons: Hoboken, NJ, USA, 2015. [Google Scholar]
- Choi, K. A Study on the Architectural Planning of the Space and Area Composition of Health Examination Center in Regional Public Hospitals. J. Korea Inst. Healthc. Archit. 2022, 28, 23–30. [Google Scholar]
- Song, S.-E.; Kim, S.-T. A Study on the Spatial Configuration of Type of Health Examination Center. Korean Inst. Inter. Des. J. 2012, 21, 399–410. [Google Scholar]
- Yu, H.; Wang, S.; Wang, J. Quantitative Research on the Factors of Outpatient Space Area in General Hospital. In Proceedings of the Industrial Buildings Symposium 2021, Beijing, China, 11 September 2021; p. 6. [Google Scholar]
- Yurtgün, H.Ö. Pediatrik Hasta Odalarında Mekân Algısına Etki Eden Bileşenlerin Çocukların Uygun Tedavi Ortamı Tercihlerine Etkilerine Yönelik Tasarım Önerisi. 2023. Available online: http://hdl.handle.net/20.500.12498/6050 (accessed on 15 May 2024).
- Kwak, N.K.; Kuzdrall, P.J.; Schmitz, H.H. Simulating the use of space in a hospital surgical suite. Simulation 1975, 25, 147–151. [Google Scholar] [CrossRef]
- Memon, I.A.; Kalwar, S.; Sahito, N.; Talpur, M.A.H.; Chandio, I.A.; Napiah, M.; Tayyeb, H. Mode choice modeling to shift car travelers towards park and ride service in the city centre of Karachi. Sustainability 2021, 13, 5638. [Google Scholar] [CrossRef]
- Liang, B.; Turkcan, A.; Ceyhan, M.E.; Stuart, K. Improvement of chemotherapy patient flow and scheduling in an outpatient oncology clinic. Int. J. Prod. Res. 2015, 53, 7177–7190. [Google Scholar] [CrossRef]
- Clissold, A.; Filar, J.; Mackay, M.; Qin, S.; Ward, D. Simulating hospital patient flow for insight and improvement. In Proceedings of the 8th Australasian Workshop on Health Informatics and Knowledge Management (HIKM 2015), Sydney, Australia, 27–30 January 2015; pp. 27–30. [Google Scholar]
- Taaffe, K.; Ferrand, Y.B.; Khoshkenar, A.; Fredendall, L.; San, D.; Rosopa, P.; Joseph, A. Operating room design using agent-based simulation to reduce room obstructions. Health Care Manag. Sci. 2023, 26, 261–278. [Google Scholar] [CrossRef] [PubMed]
- Bednar, G. Spatial Arrangements in Surgery Centers and Clinics: A Simulation Approach. 2014. Available online: https://hdl.handle.net/10365/31301 (accessed on 21 September 2019).
- Prabhu, V.G.; Taaffe, K.; Caglayan, C.; Isik, T.; Song, Y.; Hand, W. Team based, risk adjusted staffing during a pandemic: An agent based approach. In Proceedings of the 2020 Winter Simulation Conference (WSC), Orlando, FL, USA, 14–18 December 2020; pp. 747–758. [Google Scholar]
- Chen, P.-S.; Chen, G.Y.-H.; Liu, L.-W.; Zheng, C.-P.; Huang, W.-T. Using simulation optimization to solve patient appointment scheduling and examination room assignment problems for patients undergoing ultrasound examination. Healthcare 2022, 10, 164. [Google Scholar] [CrossRef] [PubMed]
- He, Q.; Huo, J.; Pan, Y. The optimization model for the service process of stomatology department via DES simulation. Cogent Bus. Manag. 2020, 7, 1786313. [Google Scholar] [CrossRef]
- Ortiz, M.A.; López-Meza, P. Using computer simulation to improve patient flow at an outpatient internal medicine department. In Proceedings of the Ubiquitous Computing and Ambient Intelligence: 10th International Conference, UCAmI 2016, San Bartolomé de Tirajana, Gran Canaria, Spain, 29 November–2 December 2016; Proceedings, Part I 10. pp. 294–299. [Google Scholar]
- Kim, S. A Study on the Optimization of the Accommodation Number at Health Examination Center using Agent Based Modeling. Int. J. Hybrid Inf. Technol. 2018, 11, 1–6. [Google Scholar] [CrossRef]
- Rofaeel, I.W.T. Emergency Department Design Evaluation and Optimization Using Discrete Event Simulation. Master’s Thesis, American University in Cairo, New Cairo, Egypt, 2012. [Google Scholar]
- Liao, E.N.; Chehab, L.Z.; Ossmann, M.; Alpers, B.; Patel, D.; Sammann, A. Using Architectural Mapping to Understand Behavior and Space Utilization in a Surgical Waiting Room of a Safety Net Hospital. Int. J. Environ. Res. Public Health 2022, 19, 13870. [Google Scholar] [CrossRef] [PubMed]
- Boussabaine, H.; Sliteen, S.; Catarina, O. The impact of hospital bed use on healthcare facilities operational costs: The French perspective. Facilities 2012, 30, 40–55. [Google Scholar] [CrossRef]
- Deng, Q.; Jiao, C.; Wang, G.; Song, X.; Zang, J. A Study on the Layout of Hospital Ward Buildings in Cold Regions of China Based on the Efficiency of Nurse Rounds. Buildings 2023, 13, 1399. [Google Scholar] [CrossRef]
- Gómez-Chaparro, M.; García-Sanz-Calcedo, J.; Aunión-Villa, J. Maintenance in hospitals with less than 200 beds: Efficiency indicators. Build. Res. Inf. 2020, 48, 526–537. [Google Scholar] [CrossRef]
- Possik, J.; Gorecki, S.; Asgary, A.; Solis, A.O.; Zacharewicz, G.; Tofighi, M.; Shafiee, M.A.; Merchant, A.A.; Aarabi, M.; Guimaraes, A. A distributed simulation approach to integrate anylogic and unity for virtual reality applications: Case of COVID-19 modelling and training in a dialysis unit. In Proceedings of the 2021 IEEE/ACM 25th International Symposium on Distributed Simulation and Real Time Applications (DS-RT), Valencia, Spain, 27–29 September 2021; pp. 1–7. [Google Scholar]
- Khoshkenar, A.; Taaffe, K.; Muhs, M.; Fredendall, L.; Ferrand, Y.; Joseph, A.; San, D. Simulation-based design and traffic flow improvements in the operating room. In Proceedings of the 2017 Winter Simulation Conference (WSC), Las Vegas, NV, USA, 3–6 December 2017; pp. 2975–2983. [Google Scholar]
- Yang, Y.; Li, J.; Zhao, Q. Study on passenger flow simulation in urban subway station based on anylogic. J. Softw. 2014, 9, 140–146. [Google Scholar]
- Zou, H.; Xia, H.; Yuan, J. Anylogic-based model prediction analysis of the impact of social distance obedience behavior on the spread of epidemics. In Proceedings of the 2nd International Symposium on Artificial Intelligence for Medicine Sciences, Beijing, China, 29–31 October 2021; pp. 545–550. [Google Scholar]
- Wang, C.; Zhu, C.; Xiao, K.; Tang, Y.; Zhen, H. Visualization of Emergency Evacuation Physical Behavior under Multi-Agent Decision-Making. Appl. Sci. 2023, 13, 5509. [Google Scholar] [CrossRef]
- Bayramzadeh, S.; Joseph, A.; Allison, D.; Shultz, J.; Abernathy, J.; Group, R.O.S. Using an integrative mock-up simulation approach for evidence-based evaluation of operating room design prototypes. Appl. Ergon. 2018, 70, 288–299. [Google Scholar] [CrossRef] [PubMed]
- Lee, L.-H.; Ou, Y.-Y.; Cheng, Y.-T.; Sun, Y.-C.; Wu, H.-M.; Guo, W. Using a Hybrid Simulation Model to Maximize Patient Throughput of Magnetic Resonance Imaging in a Medical Center. In Proceedings of the SIMULTECH, Prague, Czech Republic, 29–31 July 2019; pp. 309–316. [Google Scholar]
- Stojkovikj, N.; Lazarova, L.K.; Ristovska, V.D.; Kukuseva, M.; Ilievska, A.S. Analysis, modeling, and simulation of emergency department. Math. Model. 2022, 6, 96–99. [Google Scholar]
- Qi, H. Research on Architectural Design of Large-Scale General Hospital Physical Examination Center—Take Beijing as an Example. Master’s Thesis, Beijing University of Civil Engineering and Architecture, Beijing, China, 2020. [Google Scholar]
- Xu, M. Research on Physical Examination Center of Queuing System Simulation and Optimization. Bachelor’s Degree, Guangdong University of Technology, Guangzhou, China, 2022. [Google Scholar]
- Liu, D. Research on Customer Appointment and Sequence Scheduling of Health Examination Organization Based on Meta-Heuristic Algorithm. Bachelor’s Degree, Shanghai Jiao Tong University, Shanghai, China, 2022. [Google Scholar]
- Cao, S. Analysis and Modeling on Passengers Traffice Characteristics for Urban Rail Transit. Ph.D. Thesis, Beijing Jiaotong University, Beijing, China, 2009. [Google Scholar]
- Li, J.; Jiao, C.; Li, Y.; Zhao, N.; Hao, S.; Wu, K.; Ma, S. Research on Integrated Passenger Transport Hub Service Facilities Capacity Based on AnyLogic Simulation. In Proceedings of the CICTP 2020, Xi’an, China, 14–16 August 2020; pp. 3063–3074. [Google Scholar]
- Niu, C.; Wang, W.; Guo, H.; Li, K. Emergency Evacuation Simulation Study Based on Improved YOLOv5s and Anylogic. Appl. Sci. 2023, 13, 5812. [Google Scholar] [CrossRef]
- Cao, X.; Ding, Z. Management of municipal construction waste transportation by integrating ABM and GIS Model: A case study of Shenzhen. In Proceedings of the 25th International Symposium on Advancement of Construction Management and Real Estate, Wuhan, China, 28–30 November 2021; pp. 235–253. [Google Scholar]
- Yang, Y. Architectural Programming Based Research on Quantification of Medical Function Space and Group Decision in Large General Hospital. Bachelor’s Degree, Southeast University, Nanjing, China, 2020. [Google Scholar]
- Liu, Y.; Chen, L.; Xu, Y.; Yang, J. Exhibition Space Circulation in Museums from the Perspective of Pedestrian Simulation. Buildings 2024, 14, 847. [Google Scholar] [CrossRef]
- Khahro, S.H.; Talpur, M.A.H.; Bhellar, M.G.; Das, G.; Shaikh, H.; Sultan, B. GIS-based sustainable accessibility mapping of urban parks: Evidence from the second largest settlement of Sindh, Pakistan. Sustainability 2023, 15, 6228. [Google Scholar] [CrossRef]
- Li, Z. Research on the Influence of the Built Space Environment of Waiting Area on Patients Based on Evidence-Based Design. Bachelor’s Degree, Hefei University of Technology, Hefei, China, 2019. [Google Scholar]
- Hong, H. Evacuation Simulation and Layout Optimization of Outpatient Hall Based on Cellular Automata Model. Bachelor’s Degree, Southwest Jiaotong University, Chengdu, China, 2022. [Google Scholar]


Disclaimer/Publisher’s Note: The statements, opinions and data contained in all publications are solely those of the individual author(s) and contributor(s) and not of MDPI and/or the editor(s). MDPI and/or the editor(s) disclaim responsibility for any injury to people or property resulting from any ideas, methods, instructions or products referred to in the content. |
© 2024 by the authors. Licensee MDPI, Basel, Switzerland. This article is an open access article distributed under the terms and conditions of the Creative Commons Attribution (CC BY) license (https://creativecommons.org/licenses/by/4.0/).