1. Introduction
In the current discussion on climate change mitigation, the growing concern over China’s rising carbon emissions has become the focus of attention for scholars around the world [
1,
2]. Against this background, China has proposed a “dual carbon target”. As one of the three major carbon-emitting industries in China [
3], the key role of the construction industry in China’s carbon emission reduction pattern has attracted attention because of its significant contribution to China’s overall carbon emissions [
4,
5].
Despite China’s concerted efforts to reduce carbon emissions at the national level, the subtle differences inherent in the dynamics of carbon emissions across provinces are gradually being noticed [
6], and this is an essential challenge on the road to future carbon reductions, especially in the construction industry [
7,
8]. Therefore, the need to seek equity and decoupling carbon emissions from China’s construction industry (CECCI) in provincial-level laddering emission reduction strategies is becoming increasingly prominent. This emphasizes the need to control carbon emissions and ensure equity and effectiveness in distributing emission reduction efforts among the different provinces in China [
9]. The primary objective of this study is to reveal the spatiotemporal changes in the Carbon Emission Control Index (CECCI) and the carbon emissions of the construction industry (CECI) across 30 provinces. Based on this, we further examine the interprovincial equity and decoupling status of CECI in different regions and provinces, and we finally propose targeted policy recommendations.
As a crucial part of China’s carbon reduction pathway, there is abundant research on carbon emissions in the construction industry at the national, provincial, and industrial levels. Li [
10] mapped out the development path of China’s construction industry, examining future carbon reduction pathways and expected peak emissions. Xiao [
11] investigated the evolution of carbon emissions in China’s construction industry from the perspective of industrial transformation. Huo [
4] further examined the peak status at the provincial level based on integrated assessment models. Their studies focused on the macro-development trends of CECI.
In recent years, the theme of carbon emission equity and regional equality has received considerable attention because it plays a critical role in shaping sustainable development strategies in response to China’s climate demands [
12]. Relevant research indicates that regional emission inequalities will further increase social costs [
13]. Lu [
14] examined the impact of fiscal policies on the fairness and efficiency of CECI in the United States, concluding that about half of the carbon costs were passed on to consumers. Zhang [
15] and Fang [
16] explored the CECI quotas in China and investigated regional low-carbon development pathways. Shi [
17] found that the division of emission reduction responsibilities is not solely based on regional economic measurements; both developed and underdeveloped areas may bear more reduction responsibilities. Carbon emission equity has gradually become a key factor in policy formulation and strategy implementation [
17]. However, relevant studies suggest that China’s current interprovincial emission reduction targets have not fully considered the principle of equity [
18]. To further promote the fairness and efficiency of interprovincial CECI, it is imperative to gain a more detailed understanding of the CECI situation in each province.
Moreover, decoupling in the construction industry implies better a balancing of economic development and environmental pollution. The effectiveness of decoupling efforts in the construction sector depends on several nuanced factors, including resource availability [
19], economic development level [
9], policy frameworks [
9,
17], and regional differences caused by climate change [
20,
21]. Although the overall goal is to reduce carbon emissions, achieving decoupling and phased peaks in the construction industry requires navigating a complex socioeconomic landscape [
19].
Interprovincial equity is a multifaceted concept encompassing fairness, justice, and peace in distributing benefits and burdens among regions within a nation-state [
22,
23]. In the context of CECI decoupling, differences in resource endowments, infrastructure development, and socioeconomic conditions among provinces introduce complexities that require a nuanced understanding of interprovincial equity dynamics [
21]. Moreover, policy interventions promoting decoupling may inadvertently exacerbate existing regional disparities [
24,
25], highlighting the need to integrate equity considerations into mitigation strategies.
Based on the a forementioned studies, this research meticulously examines the interprovincial differences and decoupling status of CECI across 30 Chinese provinces from 2010 to 2020. It identifies the correlations and clustering regions of interprovincial CECI and proposes effective policy recommendations. The main marginal contribution is the clearer and more specific identification of the spatiotemporal changes in CECI and the examination of clustering in different provinces. This not only benefits but also enriches the regional studies of CECI.
The follow-up of this study is structured as follows: the methodology and data are provided in
Section 2, and
Section 3 presents the empirical analysis, which analyzes intra- and inter-regional CECI inequality by kernel density analysis, Moran’s index analysis, and Dagum’s Gini coefficient for CECI in 30 provinces and then examines the decoupling in each province.
Section 4 is the discussion, and
Section 5 demonstrates the main conclusions of this study and suggests some countermeasures.
3. Analysis of Results
3.1. Analysis of the Spatial and Temporal Evolution of Carbon Emissions between Provinces
Based on the CBEED data, it can be seen that the CECCI grew from 1518.81 million tons in 2010 to 2155.11 million tons in 2020, an increase of 636.28 million tons in ten years, with an average annual growth rate of 1.76%. In addition, the regional distribution of carbon emissions from China’s construction industry was mapped based on the CBEED data, as shown in
Figure 2.
Figure 2a–c show the regional distribution of the CECCI, and in general, the CECCI of the different provinces all showed a trend of high in the east and low in the west and more significant growth.
Regionally, the eastern Bohai Rim region and the Pearl River Delta region have long been regions with high carbon emissions. The “Bohai Economic Rim” and “Binhai New Area” plans have led to the rapid development of the construction industry in Liaoning, Tianjin, Hebei, and Shandong. As the “third pole” of China’s economic growth, the Bohai Economic Circle ensures China’s political and economic stability, indicating that the carbon emissions of a province or even a region are closely related to political and economic planning.
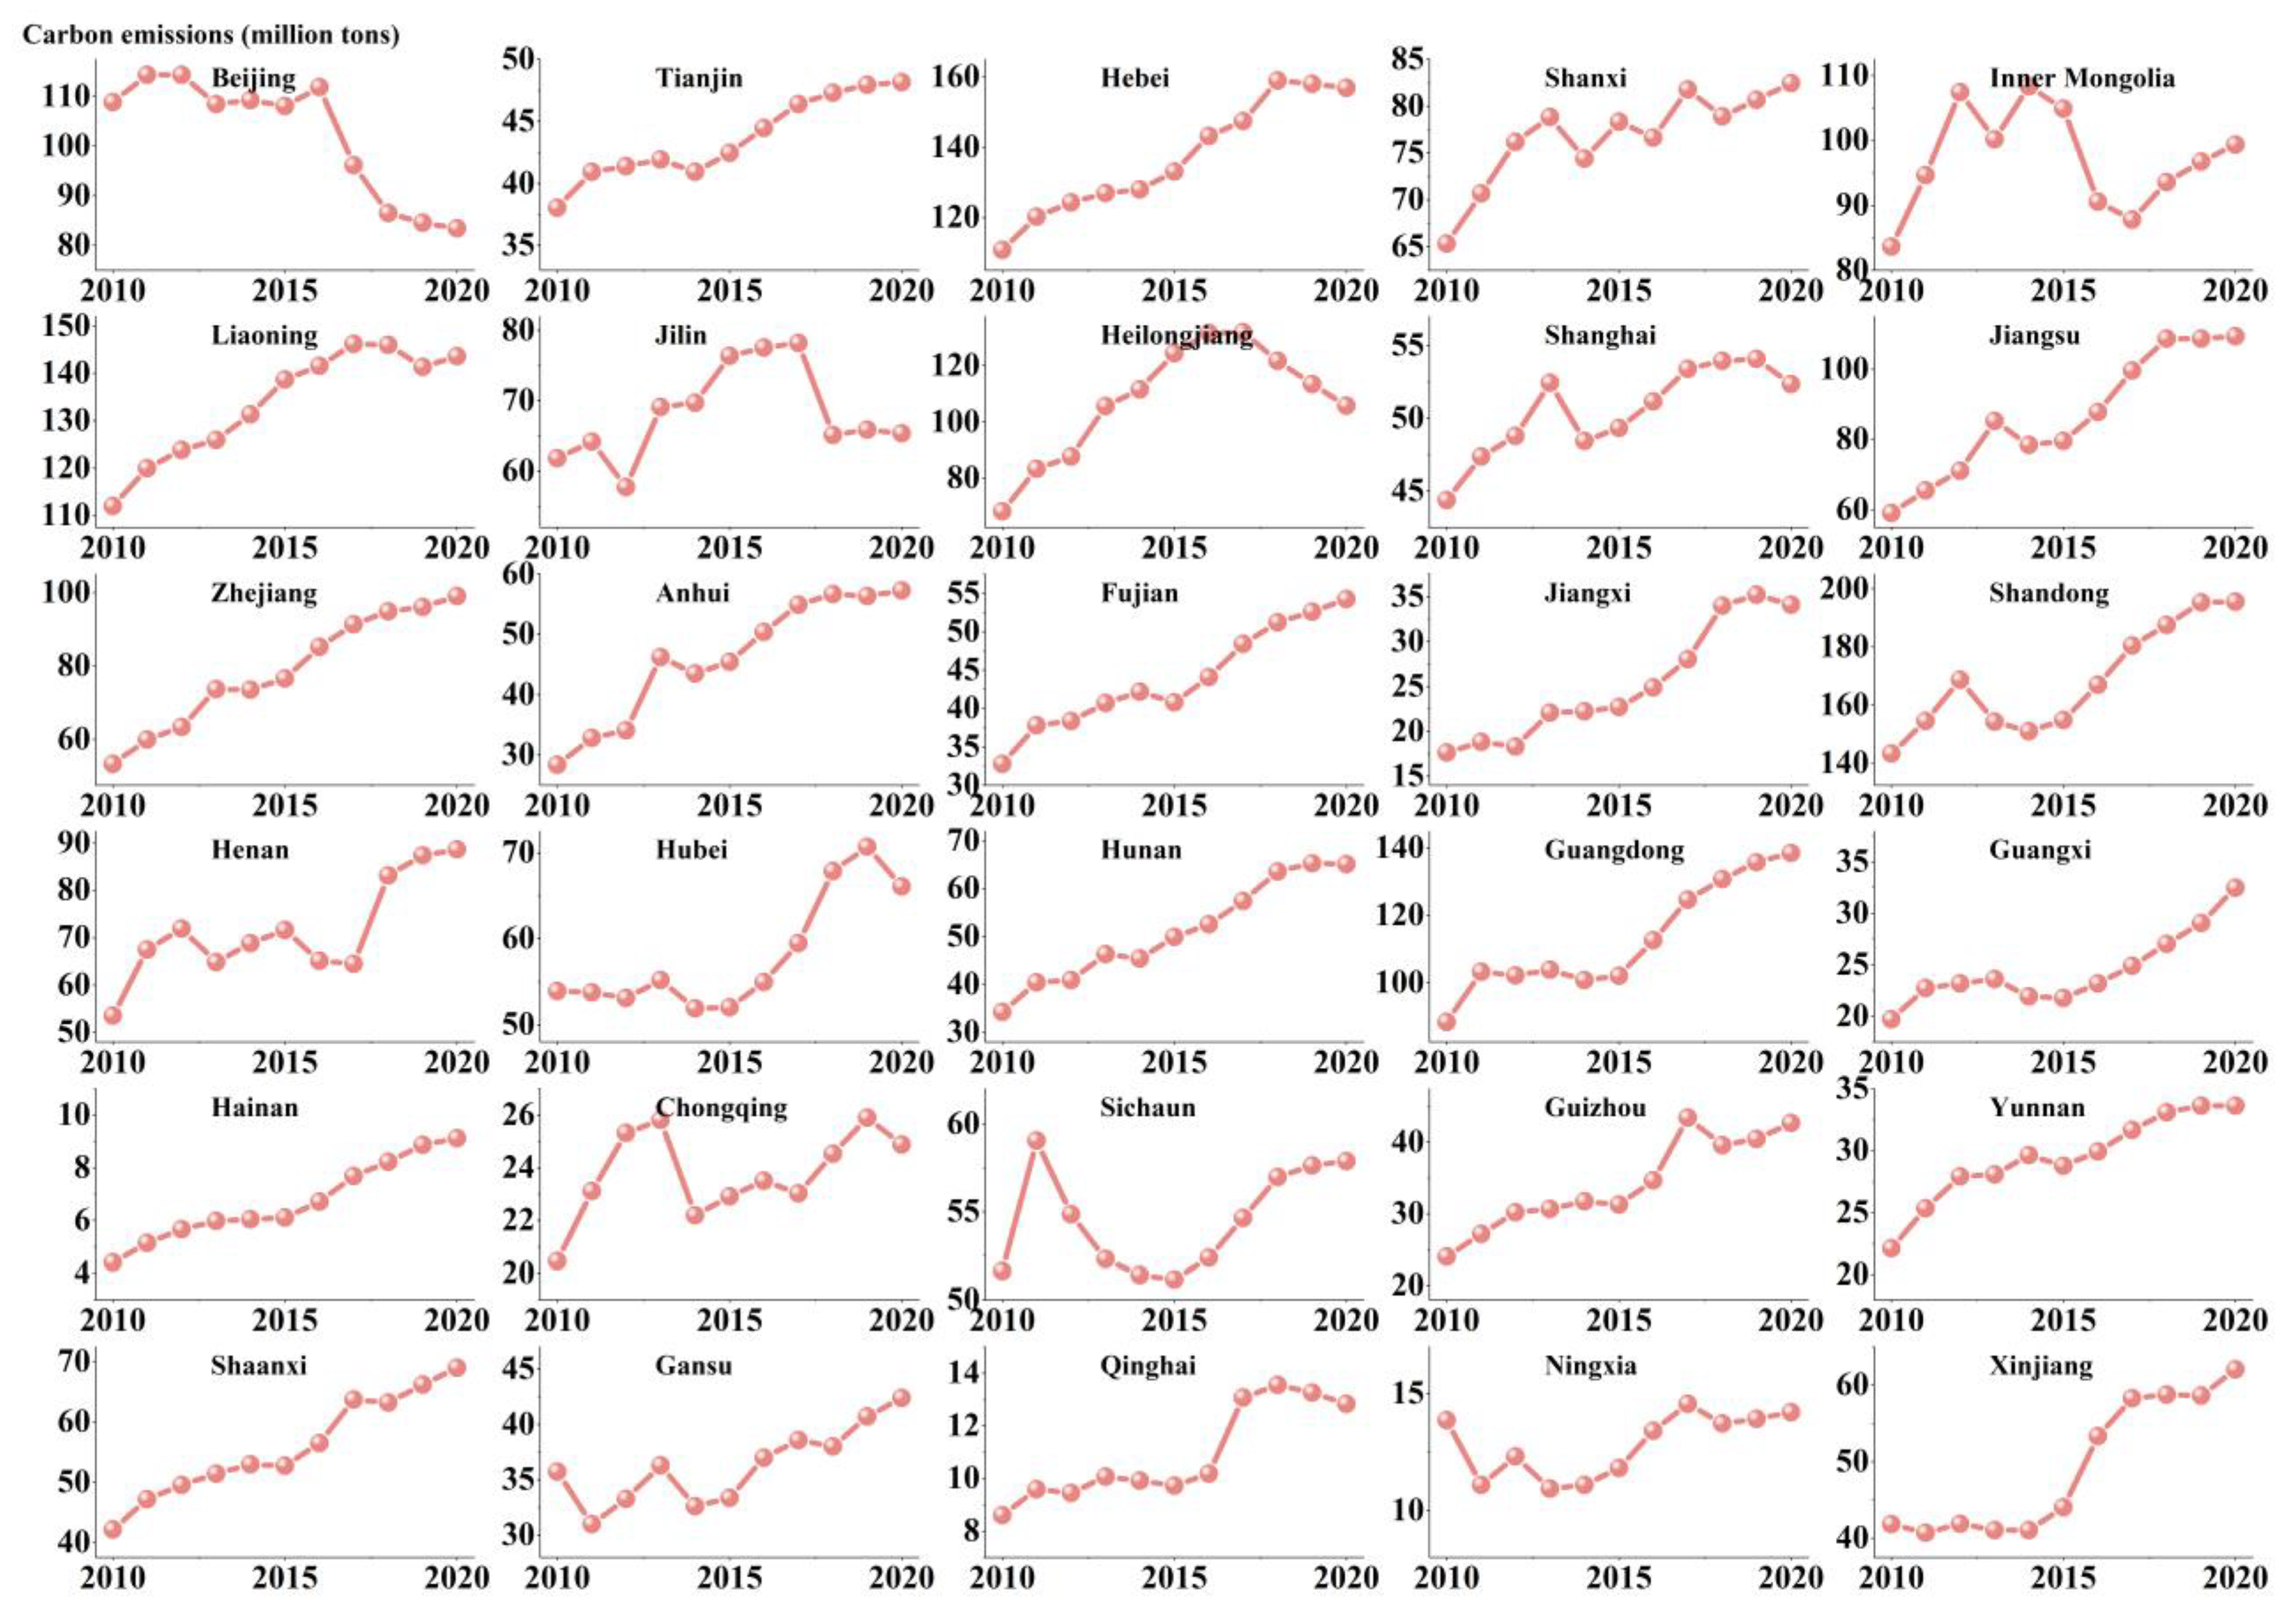
Combined with the analysis in
Figure 3, it can be seen that only Beijing showed a relatively smooth and significant downward trend in CECI, decreasing from 108.85 million tons in 2010 to 83.41 million tons in 2020, and it is the only province in the country where its CECI decreased at an average annual rate of 1.32%. This is closely related to the functional positioning of different provinces. Beijing, as the political and economic center of China, plays more of an administrative role and has gradually started to promote the large-scale relocation of factories and construction out of the city as early as the end of the last century. In addition, Shandong Province’s CECI was close to 200 million tons in 2020, accounting for about 10% of the country’s CECI in that year, while Hebei and Liaoning ranked second and third with about 7.3% and 6.7%, respectively. Heilongjiang’s CECI reached about 130 megatons near 2015 and showed a significant downward trend for a long period of time subsequently, and it has been judged to have basically achieved a carbon peak according to international experience [
4].
In addition, the CECI values of the central provinces showed a relatively smooth growth trend and were basically in the medium carbon emissions region, while the CECI values of the western provinces were mostly in the medium–low and low carbon emissions regions. The forms of CECI in Sichuan, Hubei, Hunan, and Chongqing were basically consistent. Hainan was the province with the lowest CECI in China, with only 8.87 million tons in 2020, but its average growth rate from year to year was the highest in the country, reaching 3.70%, which is closely related to the vigorous development of tourism service industry in Hainan Province. Qinghai and Ningxia are poor provinces in the west of China, with their CECI ranking second and third last in China, which is related to the large population outflow and economic development of these two provinces. The GDP values of these two provinces in 2020 were RMB 30.06 billion and RMB 39.21 billion, respectively, which only account for 0.3% of the national GDP. In addition, as China’s westernmost province, Xinjiang enjoys abundant policy support, and the large-scale construction of new infrastructure has led to new momentum in Xinjiang’s development. Between 2015 and 2020, Xinjiang’s CECI showed a rapid upward trend, with an average annual growth rate of up to 7.09%, and construction in Xinjiang is fast and furious.
From
Figure 2d–f, the per capita CECI of the 30 provinces can be seen. Regionally, the per capita CECI of the 30 provinces as a whole showed a distribution form of high in the north and low in the south [
42]. The per capita CECI of Inner Mongolia, Heilongjiang, Jilin, and Liaoning have been in the medium–high carbon emissions region for a long period of time, which may be closely related to the energy structure and population mobility in these regions. On the other hand, most of the southern provinces were located in medium or low–middle-level carbon emission regions, which are often accompanied by population inflow and carbon emission limitations with certain growth trends [
43], so the total CECI may be in the medium–high level, but the per capita CECI was low again.
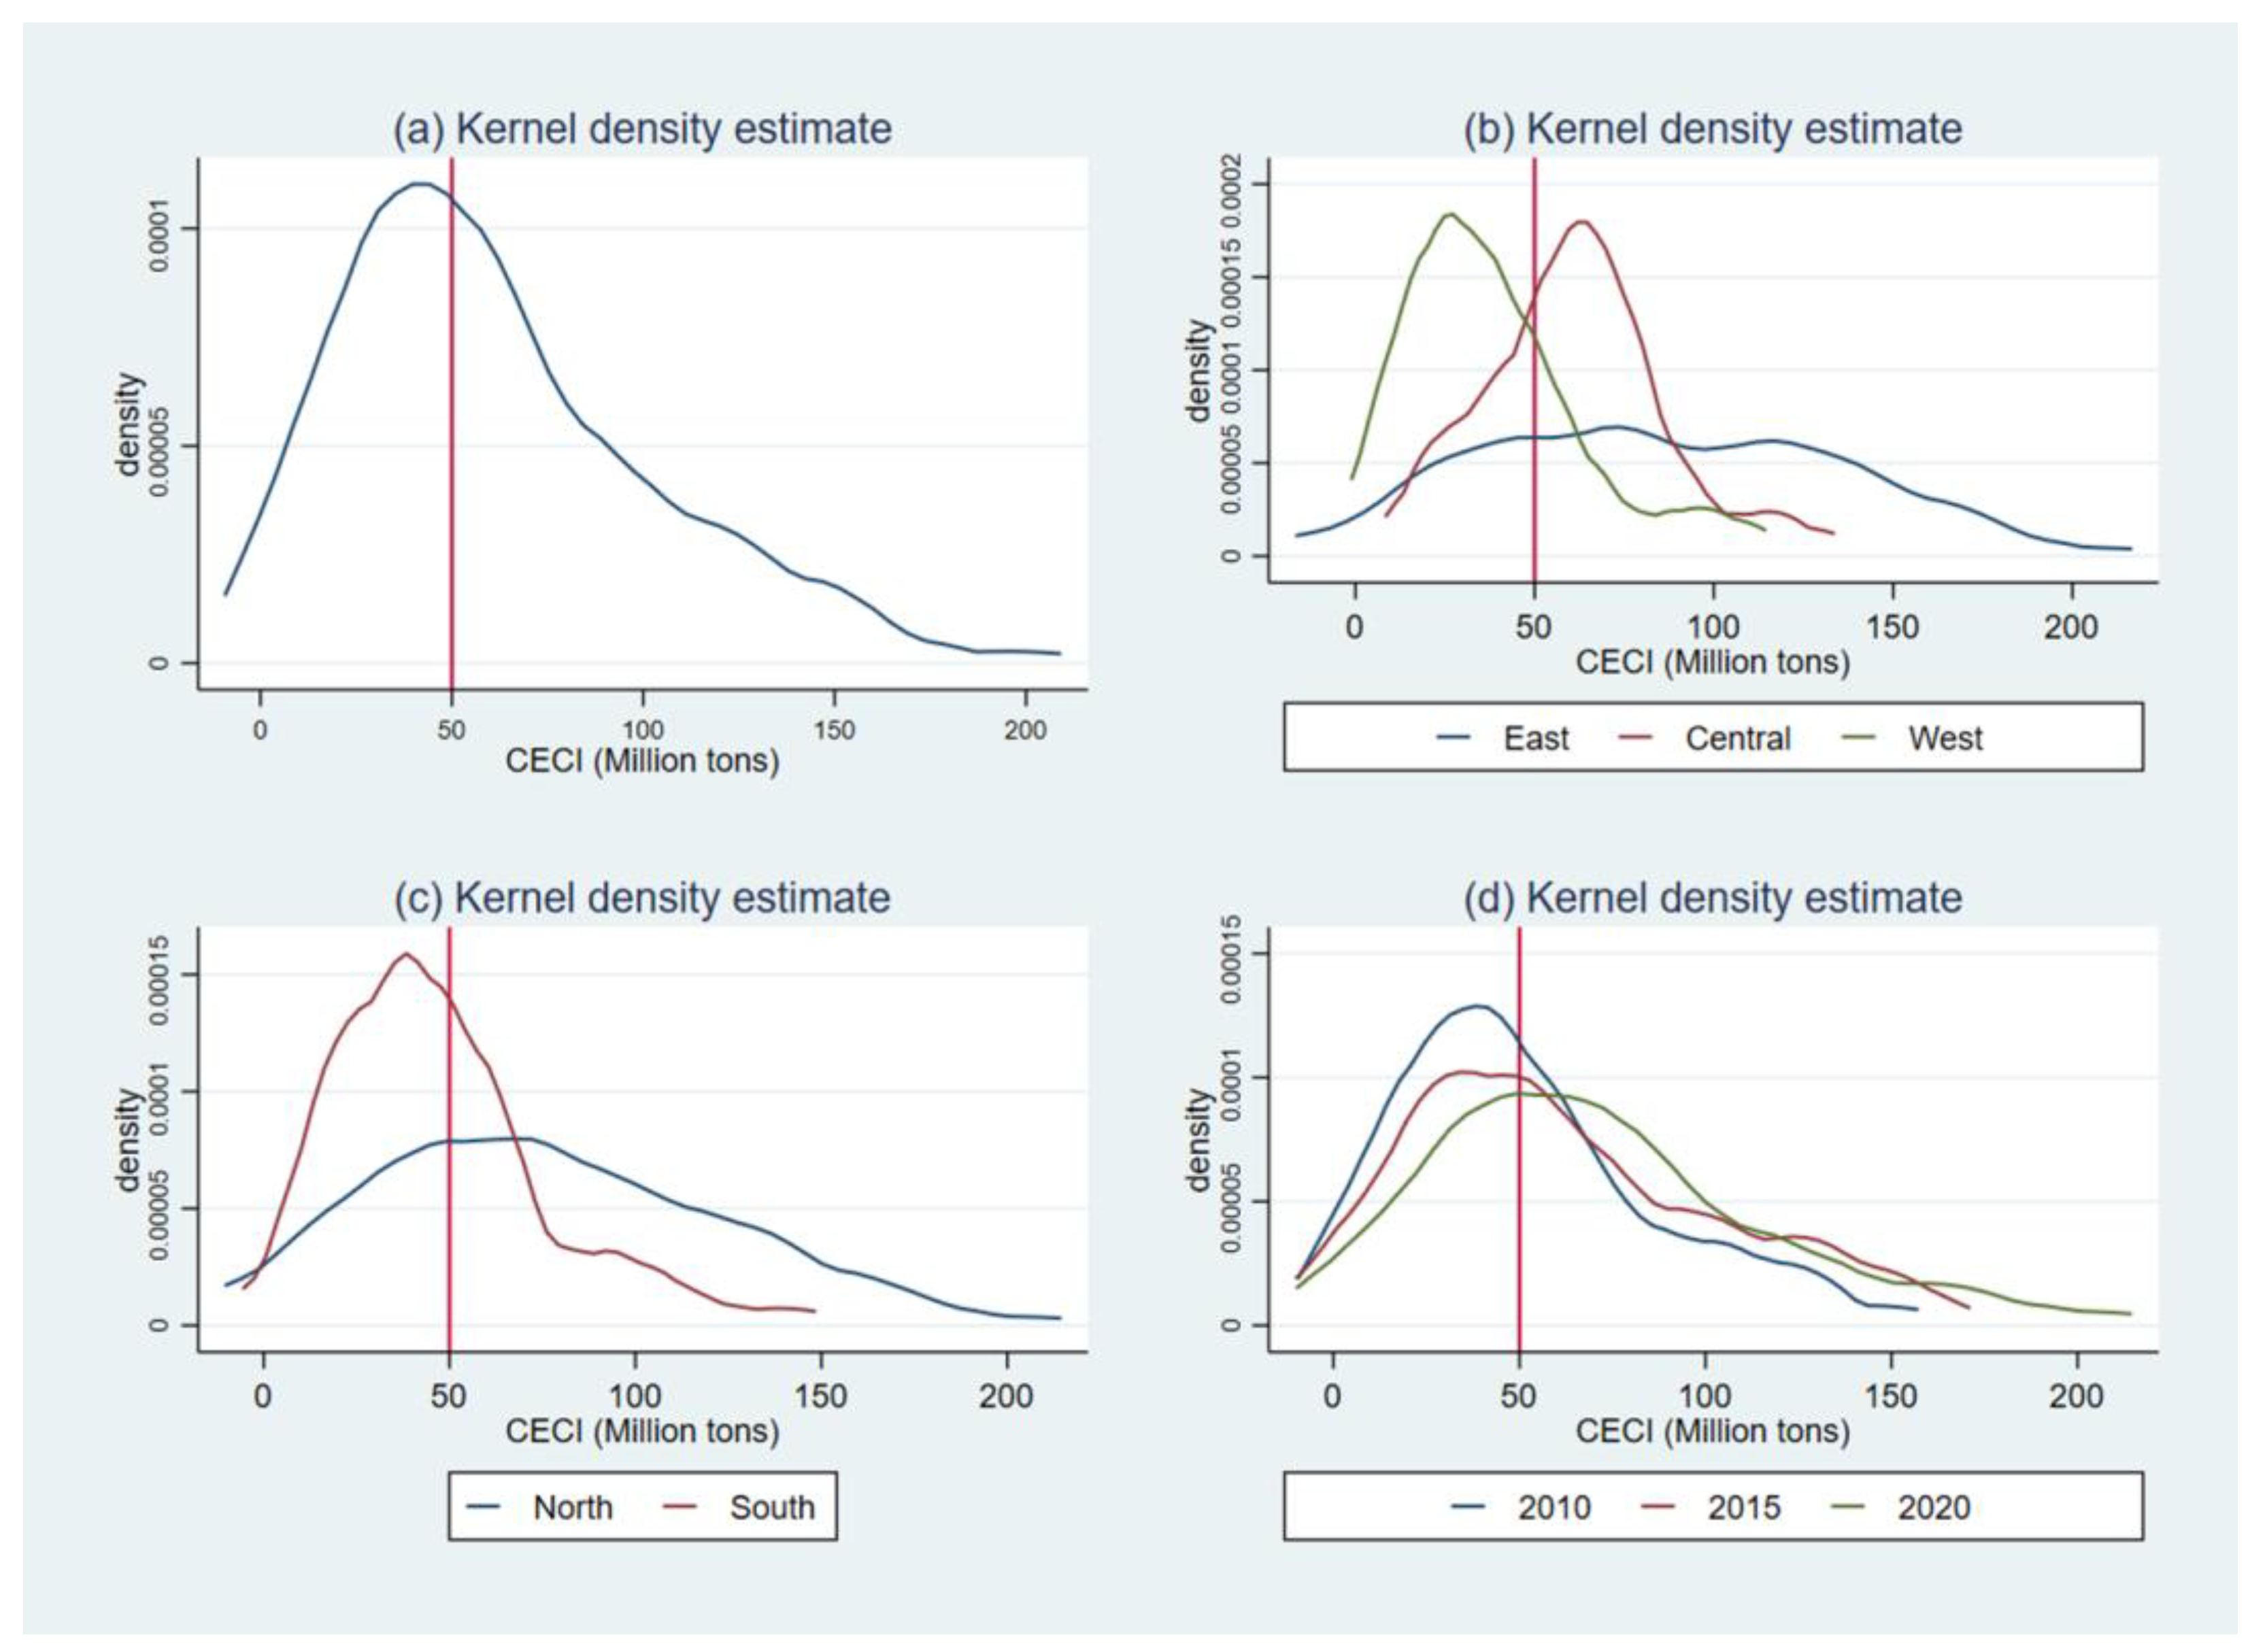
3.2. Kernel Density Analysis
In order to further clarify the direct regional differences in and the dynamic change characteristics of the CECI in the 30 provinces across the country, this study examined the CECI values by region and year, and the results are shown in
Figure 4.
From
Figure 4a, it can be observed that between 2010 and 2020, the CECI values of the 30 provinces nationwide mostly clustered around 50 million tons of CECI, with the differences becoming more significant over time. Further regional kernel density analysis is shown in
Figure 4b,c. From
Figure 4b, it is evident that the kernel density peaks for the central and western provinces were higher, with their CECI values mainly concentrated at 30 million tons and 60 million tons, respectively. The kernel density distribution for the eastern provinces was relatively flat. This indicates that the degree of CECI differences in the central and western provinces gradually decreased, while the differences in the eastern provinces were larger, with a more pronounced polarization. Ni [
44] reached the same conclusion through kernel density curve analysis. This may be related to more balanced regional cooperation in the construction industry. Additionally, Chen and Bi [
45] used the coefficient of variation and kernel density analysis to reflect the uniformity and clustering of the spatial distribution CECI. Their findings indicate that the CECI values in the central and southwestern regions showed a declining trend, whereas it has increased in the Yangtze River Delta region. This further highlights the need to consider the implementation of carbon emission trading and energy-saving measures in different regions. Furthermore, from
Figure 4c, it can be seen that the southern provinces had high peaks in the kernel density curves, and the CECI value was concentrated around 45 million tons, while the northern provinces had gentle kernel density curves, with the wave peaks to the left. This indicates that the degree of CECI variation in the northern provinces was much larger than in the southern provinces.
In terms of years, as shown in
Figure 4d, the peak of the CECI kernel density curve for the 30 provinces in China was the narrowest and the highest in 2010, concentrated around 45 million tons. Then, the wave’s peak in the following years gradually decreased and shifted to the right. The peak of the wave in 2020 was concentrated around 55 million tons. This indicates that the CECI values of China’s 30 provinces are increasing yearly, and the differences between regions are gradually widening over time, consistent with the findings of Li [
46].
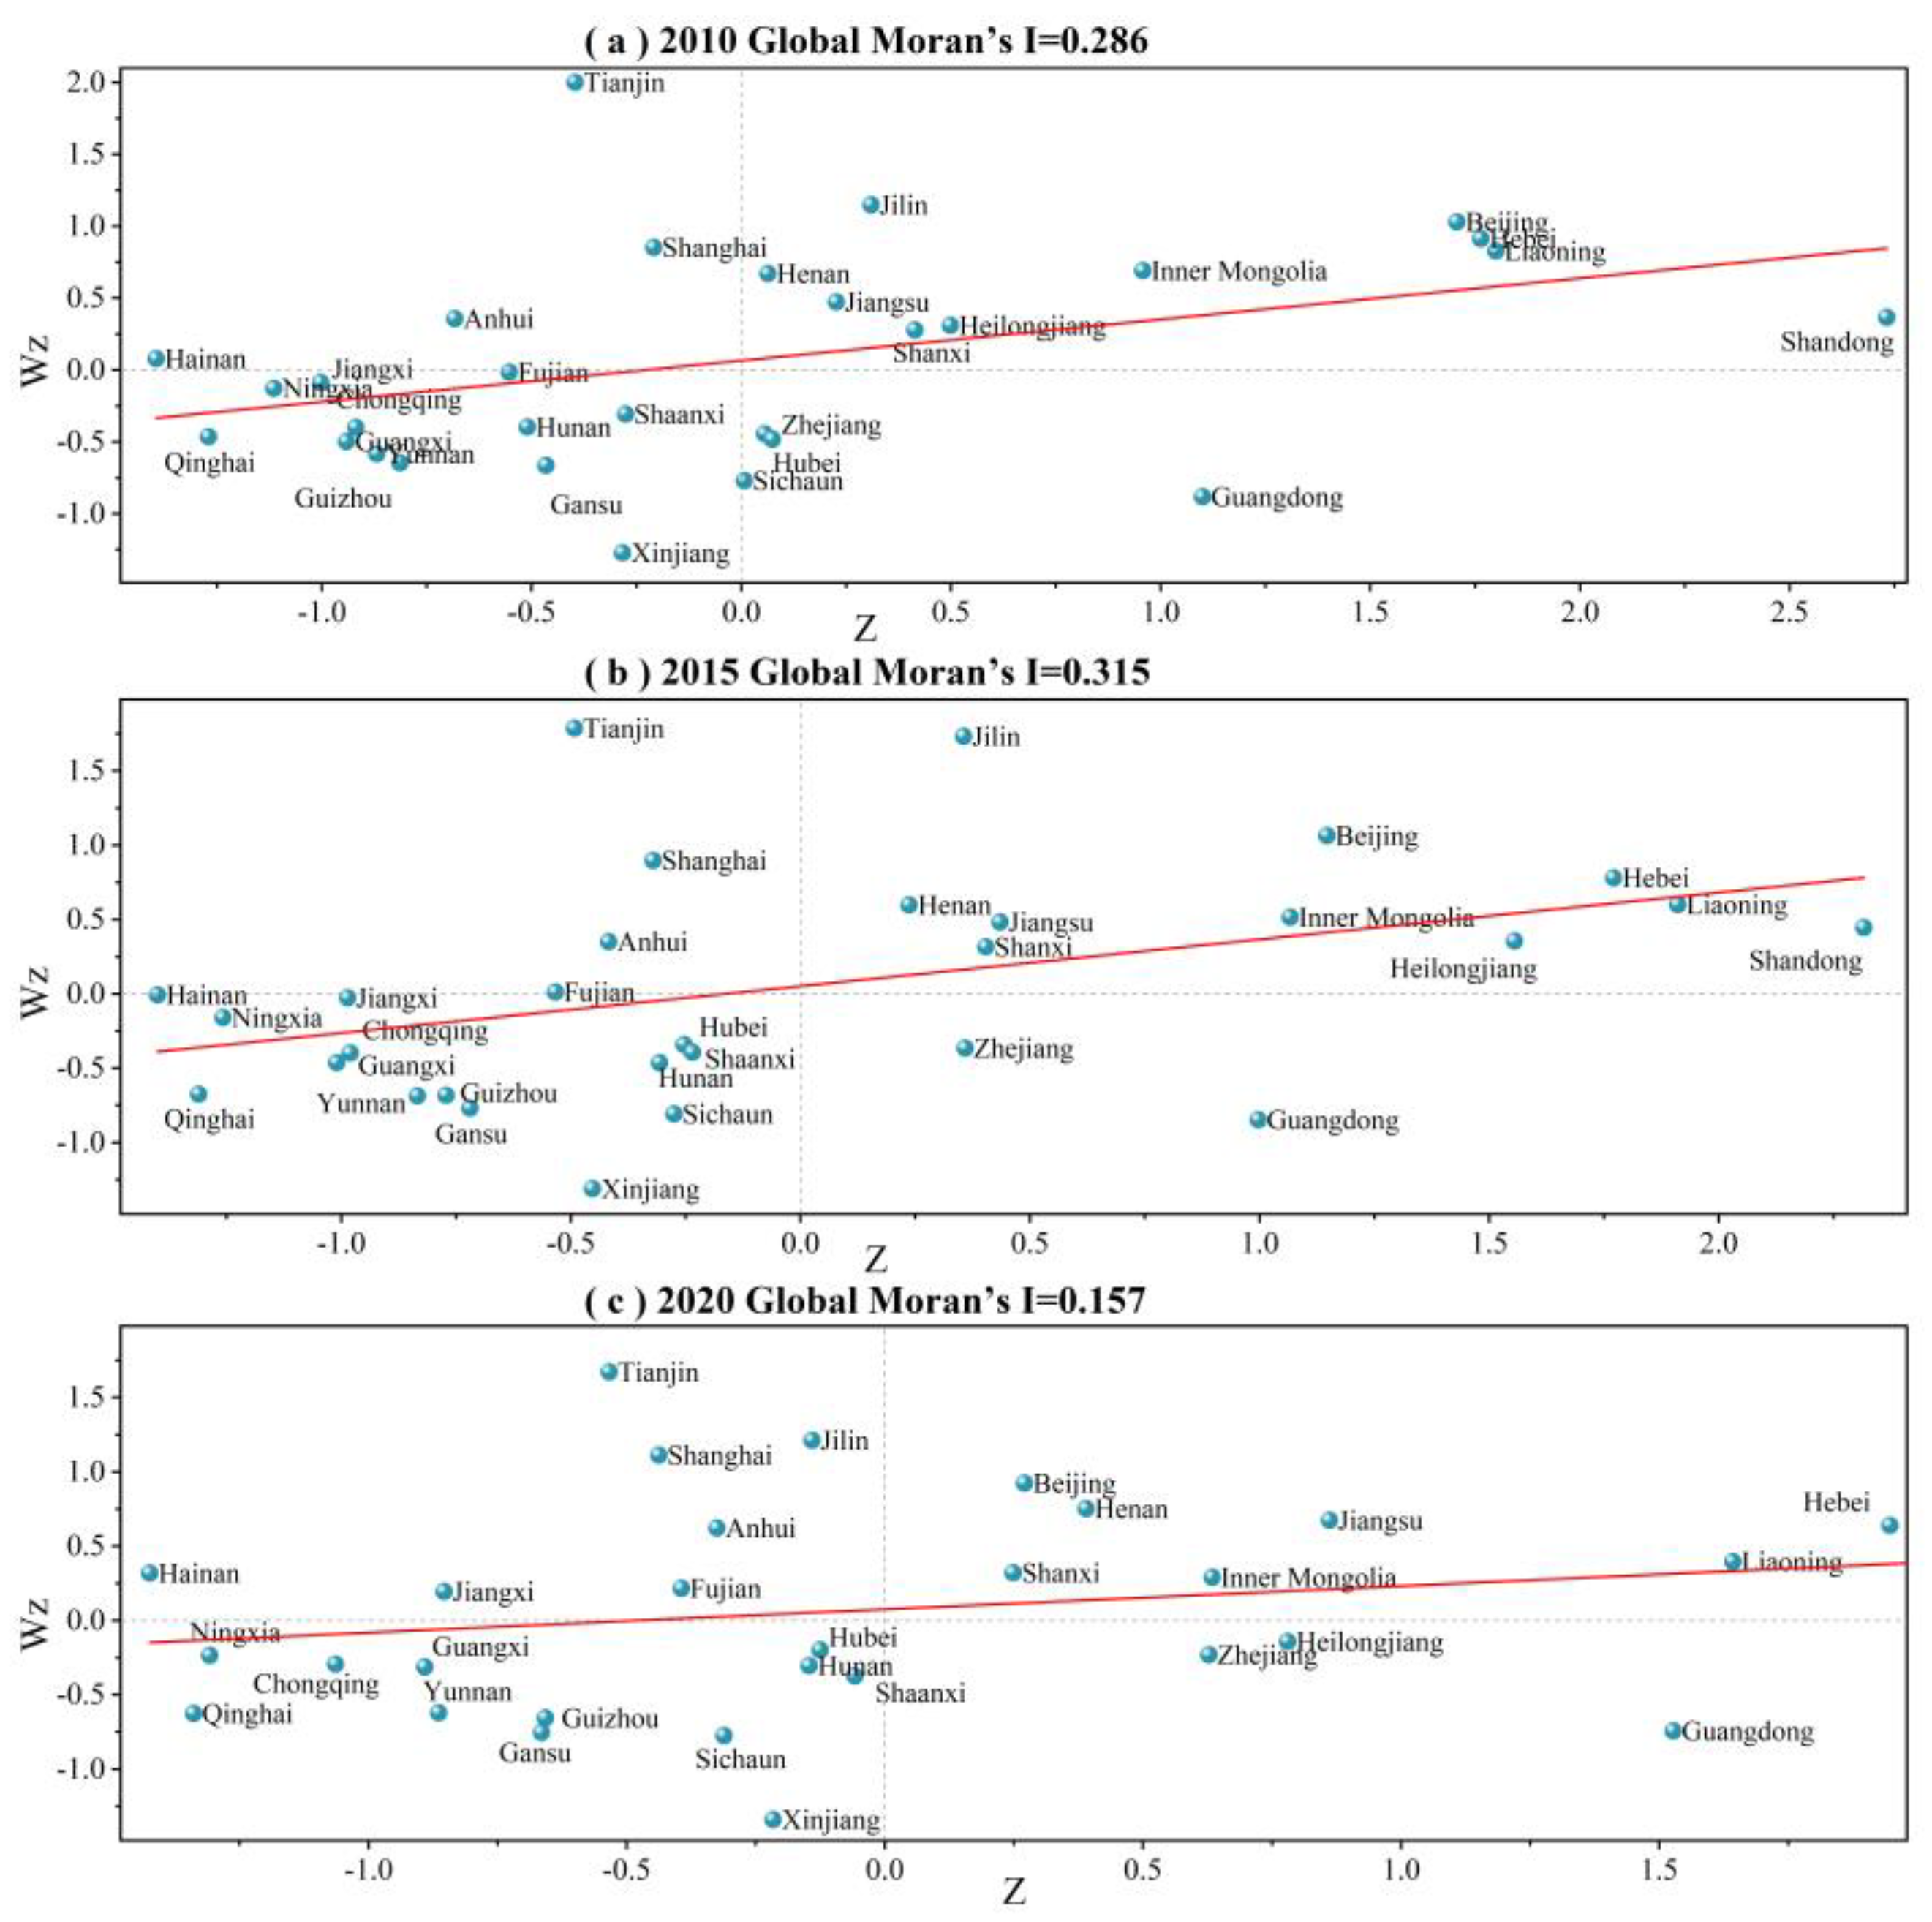
3.3. Spatial Autocorrelation Analysis
Based on the interprovincial CECI analysis and kernel density analysis, the global autocorrelation and local spatial autocorrelation of interprovincial CECI in space were further examined.
Table 2 demonstrates the national global Moran index from 2010 to 2020, and the results show that China’s CECI, except for 2020, exhibited significant positive spatial correlation characteristics, i.e., provinces with larger carbon emissions tended to be adjacent to each other, and the provinces may have certain carbon spillover problems, and provinces with small carbon emissions also tended to be adjacent to each other. The overall aggregation trend rose from 2010 to 2015, after which it showed a downward trend, with the aggregation effect changing from weak to strong and then weakening. It can be seen that the linkage between the interprovincial CECI values was increasingly strong between 2010 and 2015, but after 2015, these trends began weakening, and the aggregation phenomenon was no longer so obvious. This may be related to the development plans of different provinces. In addition, this aggregation effect was no longer significant in 2020, which is closely related to the decay of the national form of economic development in that year.
To further examine the local spatial correlation of CECI among the provinces, a Moran’s I scatter plot for key years is plotted as shown in
Figure 5. The year 2010 was dominated by clusters of “high observations–high lags” (HH) and “low observations–low lags” (LL), indicating that provinces with high CECI values were clustered together in this period. This suggests that provinces with high CECI values were clustered together and that provinces with low CECI values were clustered together during this period. Among them, the HH cluster mainly contained cities from the three northeastern provinces and some eastern coastal cities, which is in line with reality. As China’s old industrial bases, these three northeastern provinces have driven the construction industry to flourish during the process of economic development, and the policy support for the revitalization of the northeast has led to the gradual growth in the CECI in the region. The LL cluster mainly contained western provinces.
The year 2015 was dominated by HH and LL clusters. However, the correlation between some provinces and neighboring provinces fluctuated. The Wz value of Tianjin declined significantly relative to 2010, suggesting that the CECI values of Tianjin’s neighboring provinces showed a decreasing trend between 2010 and 2015, which is consistent with the results in
Section 3.1. In addition, the provinces of Hubei and Sichuan switched from “high observed value–low lagged value” (HL) to LL clustering, which indicates that the construction industry in the neighboring provinces of Hubei and Sichuan showed a rapid development trend between 2010 and 2015, resulting in a rapid growth in CECI. The 2020 Moran index decreased sharply, the clustering effect decreased, and many provinces changed to “high observed value–low lagged value” (HL). In 2020, the Moran index decreased sharply, the clustering effect declined, and many provinces shifted to “low observed value–high lagged value” (LH) clusters. This suggests that the economic downturn in 2020 had a severe impact on most of the provinces outside of the few provinces with the strongest economic development, resulting in a slowdown in construction development clustering.
3.4. Dagum Gini Coefficient Analysis
This study divided China’s 30 provinces into north–south regions and eastern, central, and western regions. It examined the inequality and variability in CECI in these regions through the Dagum Gini coefficient subregion.
As can be seen from
Figure 6a,b, the overall Gini coefficients of the eastern, central, western, and north–south regions fluctuated between 0.363 and 0.334 during 2010–2020, showing a certain downward trend. This suggests that inequality in CECI is high and gradually decreasing in the eastern, central, and western provinces and in the north–south region. However, the specifics of each region need to be analyzed in light of the other indicators described below.
As shown in
Figure 6a, the inter-group Gini coefficients (Gb), intra-group Gini coefficients (Gw), and hypervariable-density Gini coefficients (Gt) for the eastern, central, and western regions remained between 0.175–0.185, 0.093–0.104, and 0.063–0.083, respectively, with Gw and Gt showing a downward trend but with Gb not showing the same trend. The contribution is shown in
Figure 6c, with Gb showing a significant upward trend from 49.63% to about 53%. Gw remained largely flat, with some decline in the intermediate years, and then picked up again in subsequent years. Gt showed a significant downward trend from 21.87% to about 19%. This shows that Gb is the main source of the overall Gini coefficient, with large differences in CECI between the different subregions but smaller differences in CECI within the different subregions, and it shows that the decrease in Gt year by year also indicated a gradual decline in the degree of disparity and inequality between the different subregions.
The differences in CECI between the northern and southern regions are shown in
Figure 6b,d, and the comparison shows that the CECI differences between the northern and southern regional provinces and the eastern, central, and western regions were not too similar. The Gb of the north–south region fluctuated between 0.141 and 0.092, and the contribution rate decreased from 39.35% in 2010 to 27.39% in 2020, with an overall decreasing trend. This indicates that the differences between the subgroups in the northern and southern regions are becoming smaller yearly. Gt and the contribution rate increased year by year from 0.059 and 16.42% in 2010 to 0.086 and 52.69% in 2020, respectively, suggesting that the differences and inequalities between the northern and southern regions are increasing yearly.
Figure 6e,f show the inter-group Gini coefficients (Gb) and intra-group Gini coefficients (Gw) for each of the subgroups of the eastern, central, western, and north–south regions, respectively. From
Figure 6e, it can be seen that the Gb of the eastern and western provinces was basically balanced, and the inter-group differences were much larger than those of the central and western provinces, the central and eastern provinces, and the provinces in the northern and southern regions. The Gb of the western–central provinces showed large fluctuations, increasing from 2010 to 2015 and decreasing from 2015 to 2020. This indicates that the differences between the western–central provinces increased and decreased. The Gb of the central and eastern provinces has basically remained balanced since its decline in 2012, which suggests that the differences in the central and eastern provinces have levelled off after narrowing. In addition, the Gb of the north–south region lay between the eastern–western and central–western provinces and declined yearly amidst fluctuations.
The intra-group differences between the eastern, central, western, northern, and southern provinces can be seen in
Figure 6f. The graph more visually demonstrates that the CECI inequality within the northern provinces was much greater than in the southern provinces. The differences within the eastern provinces were not significant, with Gw remaining flat. The CECI inequality within the western provinces showed large fluctuations in growth from 2010–2015 and a significant downward trend and stabilization from 2015, which indicates that the CECI inequality within the western provinces was severe at the early stage and then gradually slowed down and maintained a relatively stable trend in the long term. The CECI inequality within the central provinces was more volatile, showing a significant fluctuating growth trend from 2010 to 2015 and a very significant decrease since 2015. This indicates that the CECI inequality within the central provinces was first profound and then slowed down and has been on a slowing-down trend for an extended period, indicating that the trend and volume of CECI emissions within the central provinces are better controlled.
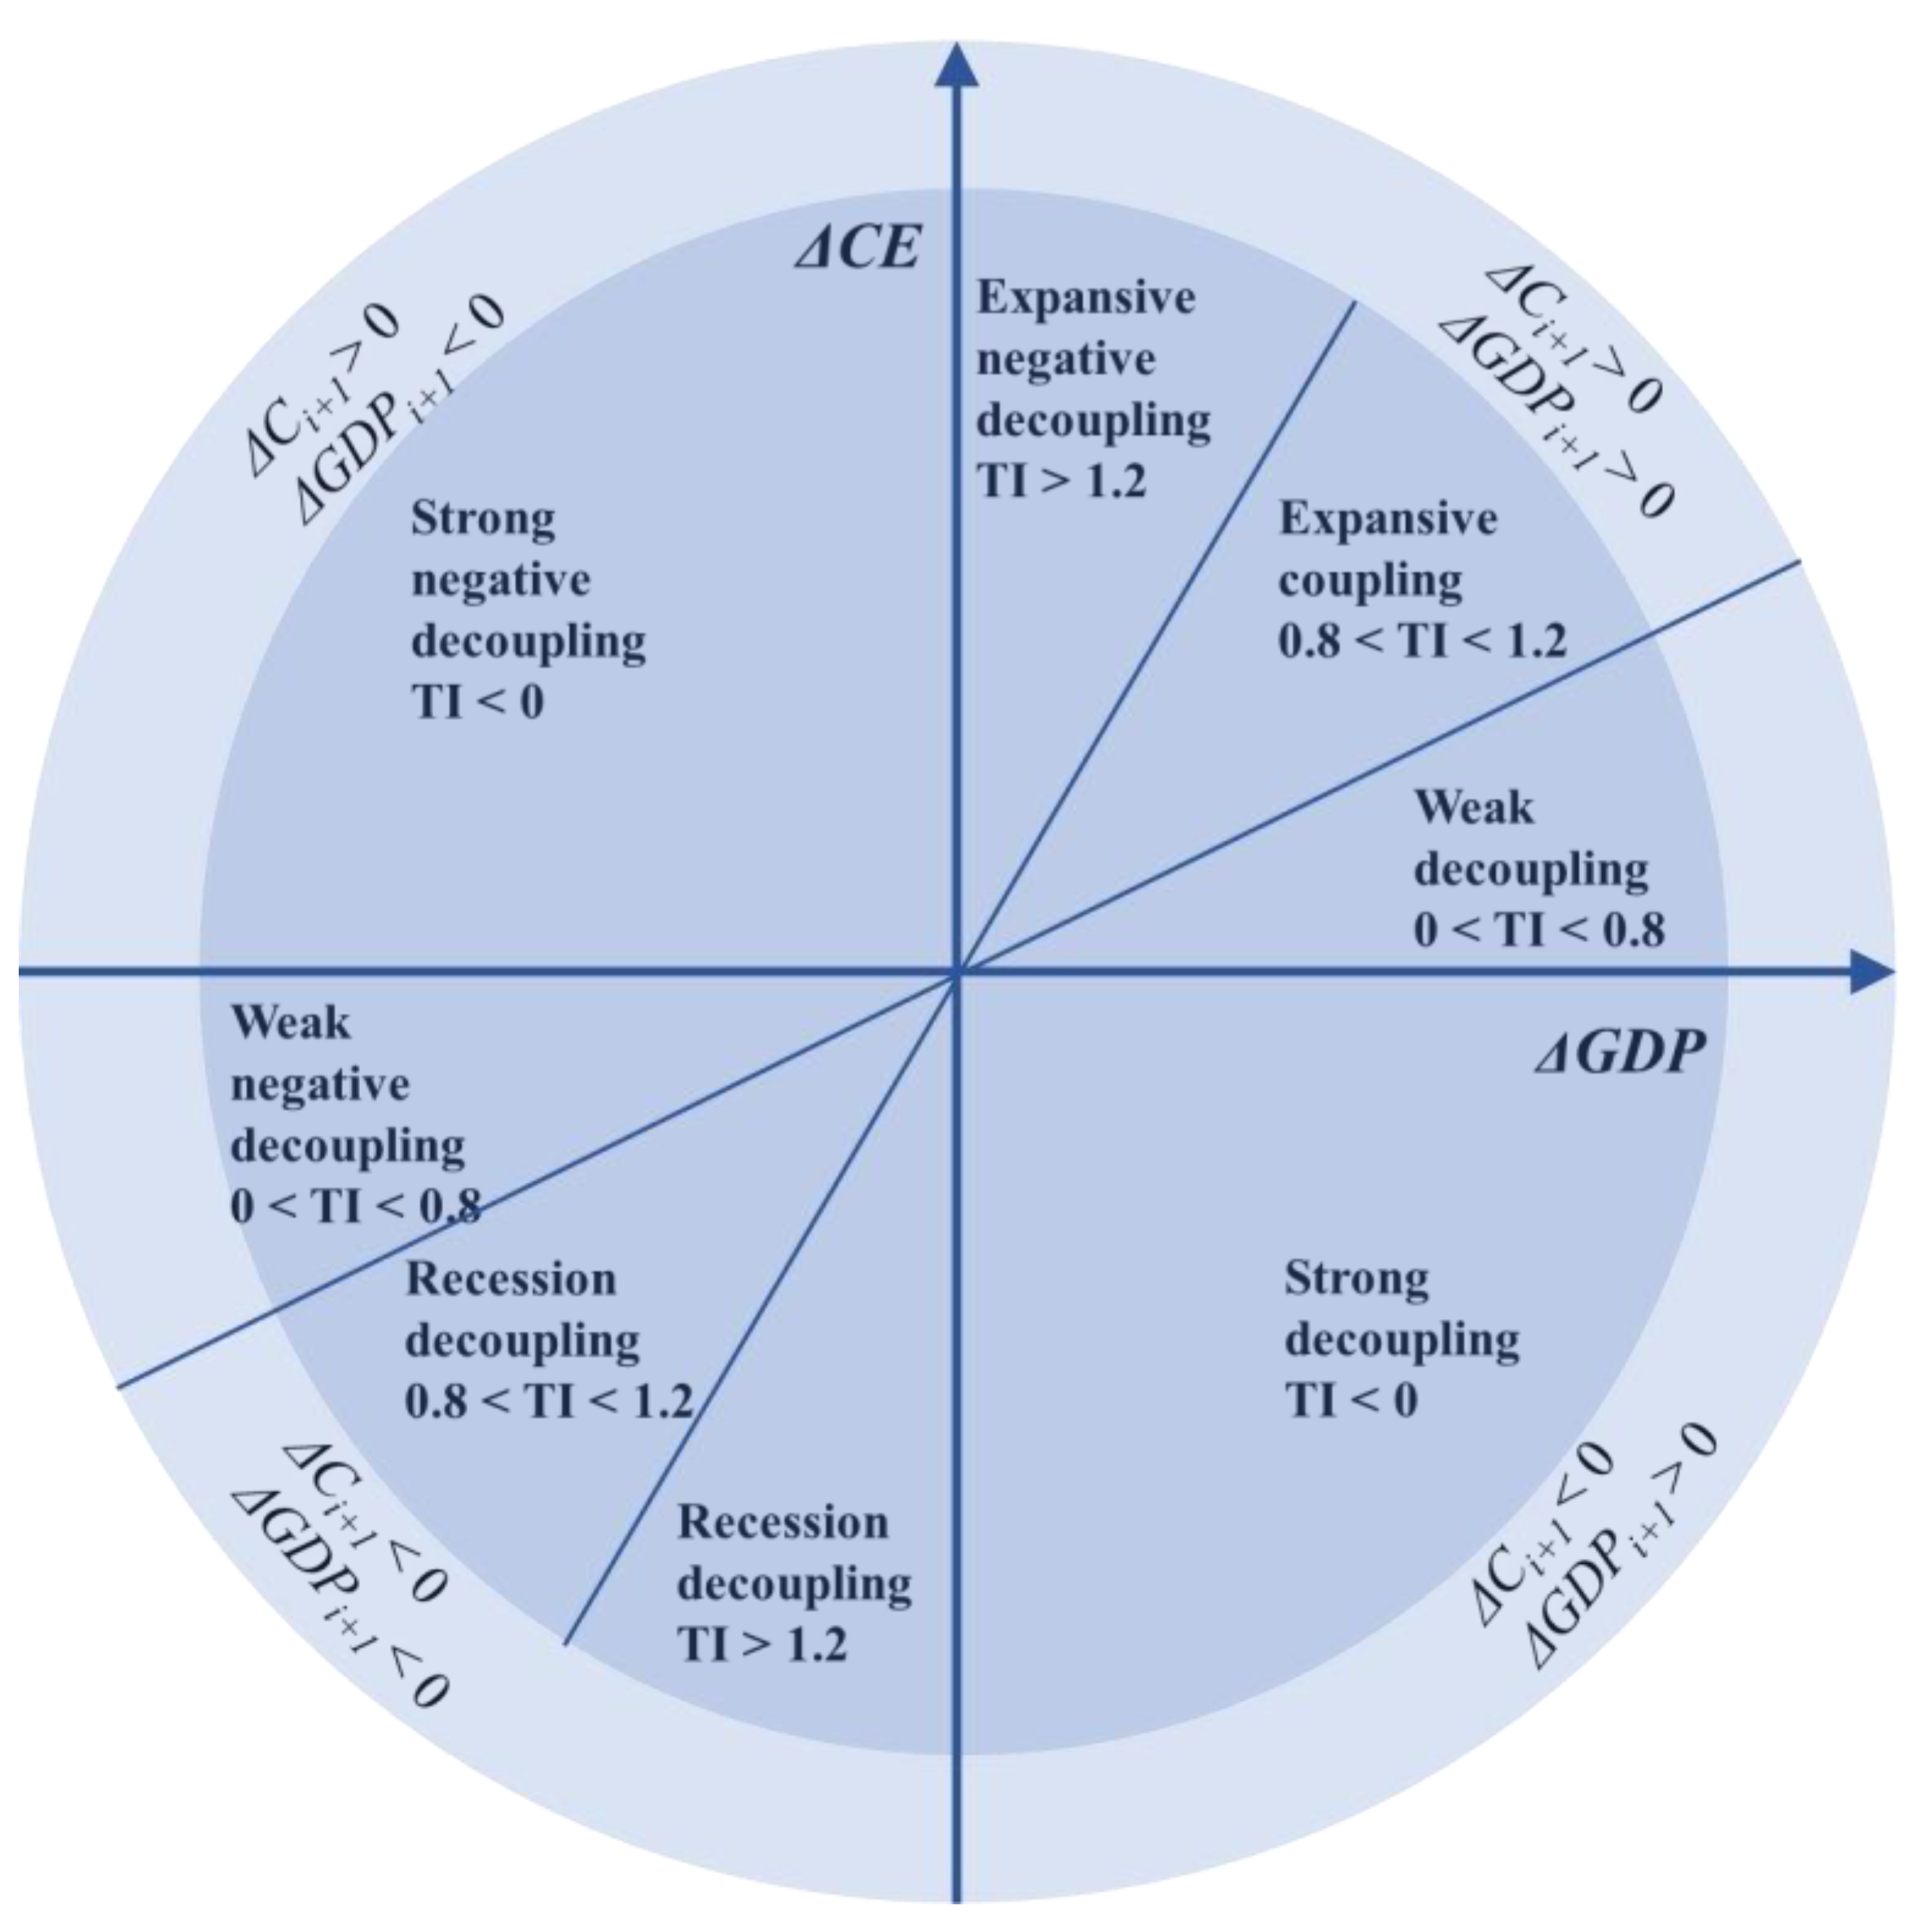
3.5. CECI Decoupling Analysis
This study analyzed the decoupling of CECI for the 30 provinces over the period 2010–2020. The bottom end of the vertical axis in
Figure 7 indicates the best decoupling, and the top end indicates the worst decoupling.
From
Figure 7, it can be seen that the CECI decoupling situation varied greatly among the 30 provinces. Taken together, the best-performing provinces in terms of CECI decoupling were Sichuan, Yunnan, and Beijing, whose CECI values have been in states of strong decoupling (SD) and weak decoupling (WD) for a long period and whose levels of economic growth were close to and higher than the CECI level.
The provinces with better decoupling situations were Shanghai, Fujian, and Guangdong, which have had CECI values in states of SD and WD for a long time and occasionally in a state of recession decoupling (RD). This indicates that their economies have been growing for an extended period and that the CECI level is decreasing or lower than the level of economic growth. The economic growth situation is relatively better than the CECI situation, although it has occasionally been in the RD state.
The provinces with poor decoupling were mainly Tianjin, Liaoning, Inner Mongolia, Jilin, and Heilongjiang, which were often in a state of recession decoupling (RC) and expansive negative decoupling (END) or even in a state of strong negative decoupling (SND), which indicates that the economic growth level of these provinces cannot catch up with the growth level of CECI. The environmental protection situation is not optimistic. Among them, the decoupling deterioration was more severe in Tianjin and Liaoning.
Shandong Province, as the province with the highest CECI in China, performed better in terms of environmental protection in the early years, but the decoupling situation has deteriorated significantly in recent years. In addition, the decoupling situation in the provinces of Guangxi, Guizhou, Hainan, Gansu, and Qinghai was similar to that of Shandong, with good decoupling due to protection, fast economic growth, or low CECI emissions in the early years and a deterioration in the later years due to lower economic growth or higher CECI growth. These provinces need to pay more attention to existing industrial structural issues to avoid deepening the “anti-decoupling” problem.
4. Discussion
Research data indicate that large-scale CECI was concentrated in the eastern Bohai Rim region, the Binhai New Area, and the Pearl River Delta region. This concentration is attributed to regional industrial agglomeration and population mobility [
43,
47]. The Bohai Rim Economic Zone and Binhai New Area, as emerging economic zones, have experienced rapid economic growth, leading to a diverse industrial structure that requires substantial support from the construction industry. Furthermore, in the Pearl River Delta region, Guangdong Province alone had a GDP of RMB 11 trillion in 2020, accounting for 10% of the national GDP. The significant population movement and industrial concentration in this region have spurred the development of the construction industry, thereby limiting its emission reduction potential.
The kernel density, Moran’s I index, and Dagum’s Gini coefficient analyses further examined the regional differences and inequalities in China’s CECI. The degree of CECI differences in the northern provinces was much greater than in the southern provinces, which correlates with the significant migration of population and housing construction from north to south during the “13th Five-Year Plan” period [
48]. Moreover, northern cities have a more uniform energy consumption structure, predominantly relying on coal, whereas southern cities have a more diverse, economical, and cleaner energy mix, significantly affecting CECI.
Additionally, from an eastern–central–western perspective, except for the central provinces, other regions exhibited significant internal inequality. Some studies suggest that population redistribution within regions can lead to an approximately 16% increase in carbon emissions [
49]. Therefore, population migration inevitably brings about changes in regional energy consumption structures and habits, promoting continuous growth in CECI. This finding is consistent with the conclusions of Long [
49].
Similarly, CECI exhibits regional clustering and spillover effects, as provinces with higher levels of construction industry development can drive the development of surrounding provinces. However, intra-group differences are also influenced by geographical location, climate variations, and other factors. Even among provinces in the western region, there were significant intra-group inequalities in CECI [
50]. For example, comparing Sichuan and Guizhou, although they are in the same region, there are considerable differences in their economic development levels and infrastructure [
51]. This further highlights the importance of not only promoting regional coordination and cooperation but also assisting provinces with resource endowments that lack economic development strength. Comparing Sichuan with Gansu and Qinghai reveals that the latter two are typical northern cold cities with vastly different energy consumption structures compared to Sichuan. Despite being western cities, their climatic conditions also contribute to their CECI inequalities [
21], as they may span multiple climate zones. Inter-regional differences are also influenced by macro-level policies such as the Western Development Strategy and the Rise of Central China Plan [
33].
There were significant regional differences in the decoupling statuses of the different provinces [
52,
53]. Differentiated emission reduction targets and effective measures should be implemented according to the actual situation in each region and province. Provinces such as Heilongjiang, Liaoning, Tianjin, and Inner Mongolia should further promote energy structure transformation. In contrast, cities like Shanghai, Fujian, and Guangdong, due to their dense urban development, experience fluctuations in their decoupling status because of reduced economic activity in the construction industry. These regions should better regulate existing buildings and utilize current structures for industrial planning and adjustment while controlling new construction to avoid unnecessary material waste. Sichuan and Beijing, due to their geographical locations and unique urban functions, have weakened construction industry development. Beyond these specific urban functions, some less-developed provinces still face significant emission reduction pressures and should be provided with financial and policy support to prevent large-scale shutdowns during peak electricity demand periods, such as in summer. In tourism-oriented provinces, local tourism development should be strongly supported to fully utilize existing buildings, thereby generating higher economic benefits alongside carbon emissions. For example, Yunnan, known as the “Kingdom of Plants”, has maintained good decoupling due to its slower economic development and strong emphasis on environmental protection.
Additionally, provinces such as Shandong, Gansu, and Guizhou, which initially had good decoupling statuses but later experienced worsened conditions due to lower economic growth or increased environmental pollution, need to further reduce their carbon emission intensity and improve their carbon production efficiency. Protecting existing environmental achievements is crucial in preventing a “rebound” in decoupling. Research indicates that reducing energy intensity and improving labor efficiency alone are insufficient in significantly lowering CECI in these provinces [
54], highlighting their considerable potential for future carbon emissions reductions.
5. Conclusions and Shortcomings
This study examined the interprovincial equity and decoupling status of CECI across 30 provinces in China, further enriching research outcomes in this field and providing new conclusions and perspectives for subsequent national and regional CECI studies. Without considering policy-level impacts, similar methodologies can be extended to other industries at the international, national, and provincial levels. This study yielded the following conclusions:
- (1)
The CECI values of the 30 provinces as a whole showed a growing trend, with the main growth areas in CECI being the eastern Bohai Rim region and the Pearl River Delta region, with average annual growth rates of 1.50% and 2.27%, respectively. Heilongjiang has realized a CECI carbon peak, and the per capita CECI of Inner Mongolia, Jilin, and Liaoning has been in the middle–high carbon emission region for a long time.
- (2)
The CECI differences among the 30 provinces are gradually increasing. The CECI differences between the central and the western regions were greater than those in the eastern regions. However, the degree of inequality within them was lower, and the degree of inequality within the western provinces was the greatest. In terms of inter-group differences, inequality was greatest between the eastern and western regions and the least between the central and western regions. CECI inequality in the northern and southern regions has been decreasing yearly, with greater inequality within the northern provinces than in the southern provinces. CECI was predominantly high with high aggregation in the northeastern provinces and predominantly low with low aggregation in the western provinces.
- (3)
CECI decoupling was better in Sichuan, Yunnan, and Beijing, followed by Shanghai, Fujian, and Guangdong, while the provinces with worse decoupling were mainly Tianjin, Liaoning, Inner Mongolia, Jilin, and Heilongjiang. The decoupling situation in Shandong, Guangxi, Guizhou, Hainan, Chongqing, Gansu, and Qinghai was mainly characterized by a good decoupling situation in the early stages and a gradual deterioration in the later stages.
Although some useful findings were identified in this study, it still has some shortcomings. For example, in this study, CECI decoupling in the 30 provinces was examined using year-by-year data, but China’s policy plans are often named “five-year plans”, such as the 12th Five-Year Plan, 13th Five-Year Plan, etc. Further research will examine CECI decoupling in these planning intervals to determine the extent to which policy implementation can be circumvented. This will help in better overcoming the errors that may arise from the lag in policy implementation and examine the actual effects of these policies within the planning intervals. In addition, this study only examined the equity and decoupling of interprovincial CECI, but there are some differences between urban and rural areas, so further research should focus on the equity and decoupling of urban and rural interprovincial CECI.


