Article

Cyclic Behavior of Partially Prefabricated Steel Shape-Reinforced Concrete Composite Shear Walls: Experiments and Finite Element Analysis

1
School of Civil Engineering, Xi’an University of Architecture & Technology, Xi’an 710055, China
2
Key Laboratory of Structural Engineering and Earthquake Resistance, Ministry of Education, Xi’an University of Architecture and Technology, Xi’an 710055, China
3
China Qiyuan Engineering Corporation, Xi’an 710018, China
*
Author to whom correspondence should be addressed.
Buildings 2024, 14(7), 2208; https://doi.org/10.3390/buildings14072208
Submission received: 23 May 2024 / Revised: 30 June 2024 / Accepted: 16 July 2024 / Published: 17 July 2024
(This article belongs to the Special Issue High-Performance Composite Construction: Materials and Components)

Abstract

:
Due to the higher lateral stiffness, load-carrying, and energy dissipation capacities compared with traditional reinforced concrete (R.C.) shear walls, steel shape-reinforced concrete (SRC) shear walls, in which steel profiles are encased in the boundary elements, have been widely applied in high-rise buildings. In order to simplify the on-site construction procedure, this paper proposes a novel partially prefabricated steel shape-reinforced concrete (PPSRC) shear wall using throat connectors. Based on the pseudo-static tests of two large-scale specimens, the effect of construction methods (prefabricated or cast in place) on the cyclic behavior of PPSRC shear walls was investigated by the hysteretic loops, skeleton curves, stiffness degradation, energy dissipation, and deformation decomposition. The test results indicated that PPSRC shear walls could exhibit a comparative cyclic response with the cast-in-place SRC shear walls, and the proposed throat connectors could effectively transfer the stress of the longitudinal reinforcements. Finally, a macro-modeling of PPSRC shear walls based on the multi-layer shell elements in OpenSees 3.3.0 was established and validated by the test results, and the parametric analysis of the axial compression, steel ratio, and concrete strength of prefabricated and cast-in-place parts was then conducted.

1. Introduction

Reinforced concrete (R.C.) shear walls are widely applied to resist the seismic actions imposed on buildings because of the high lateral strength and stiffness. In R.C. shear walls, the flexural reinforcements are typically concentrated at the wall edges, referred to as boundary elements. These boundary elements bear the primary tension and compression forces that arise from lateral loads caused by wind or an earthquake; therefore, a large number of longitudinal rebar exist at the wall boundary together with dense ties that are used to confine the core concrete and to avoid the buckling of longitudinal reinforcements, which creates substantial congestion and complicates the on-site construction [1,2]. In engineering practices, an alternative construction approach is to replace some longitudinal rebar with steel shapes, which is commonly referred to as steel–concrete composite boundary element (e.g., concrete-filled steel tube, CFST; steel shape-reinforced concrete, SRC; concrete-encased steel, CES) [3,4,5,6,7,8,9]. For CFST boundaries, the steel tubes may be exposed to a hazardous environment, leading to corrosion or extra cost of coatings; in contrast, the steel profiles in SRC or CES boundaries are protected by the surrounding concrete encasement, leading to favorable fire and corrosion resistance [10].
SRC, in which a steel profile is encased in an R.C. section, has been widely applied in high-rise buildings due to the higher lateral stiffness, load-carrying, and energy dissipation capacities as compared to traditional R.C. [11,12,13]. Until now, numerous research studies have been conducted to explore the lateral behavior of R.C. shear walls with SRC boundaries (referred to as “SRC shear walls” hereafter), and the test results show that the maximum strength, lateral rigidity, and deformation ductility can be further improved when SRC is employed as boundary elements in traditional R.C. shear walls [14]. For example, Liao et al. [14] and Ma et al. [15] conducted the cyclic test of I-shaped SRC shear walls with conventional and high-strength concrete, and the test results showed that the employment of steel profiles led to more robust hysteretic loops and higher load-carrying capacity than traditional R.C. shear walls. Based on SRC shear walls, Ji et al. [16] applied steel braces in wall panels, significantly increasing shear stiffness and load-carrying capacity. In addition, Ke et al. [17] introduced H-shaped steel and flat steel plates into T-shaped R.C. shear walls, and the results of the quasi-static lateral loading test indicated that the ductility and energy dissipation capacity could be further increased.
Although the SRC boundaries can improve the structural performance of R.C. shear walls, the on-site construction of SRC shear walls is complex because both the construction procedures of R.C. and steel structures are involved. In this case, the prefabricated concrete (P.C.), in which structural members are produced in a manufacturing facility, transported to the structure site, and erected and connected in place, becomes an alternative manner to facilitate the on-site construction [18,19,20]. In P.C. construction, the connection between the different prefabricated parts is the critical region, where the damage will be concentrated, and many connectors have been applied to ensure structural integrity (e.g., grout-filled sleeves connection, flange connection, dowel connection, unbonded post-tensioned connection, etc.) [21]. However, most of the connectors mentioned before are adopted for rebar connecting (small cross-section), which cannot be applied in the link of large-dimensional steel profiles. To solve this problem, Zhou et al. [22] proposed a novel prefabricated concrete-encased CFST composite wall with twin steel tube connections in which the two adjacent wall panels were connected using radial bolts in the concrete-encased CFST boundaries; Wu et al. [23] put forward an innovative prefabricated composite shear walls with CFST boundaries, in which the two adjacent wall panels were connected using special grout-filled sleeves for steel tube; Fu et al. [24] proposed a novel connection for SRC shear walls using steel plates and high-strength connecting bolts; and Guan et al. [25] put forward a prefabricated double-skin composite wall with encased circular CFST boundaries, in which the CFST boundaries were connected by welding and cast-in-place concrete was needed in the connection region. For the connections mentioned above, cyclic test results indicated that all these connections were reliable under seismic loading, and the connection region was kept intact after the test.
The connecting of SRC boundaries is more challenging because of the shape of the steel profile. Unlike the smooth steel tube in CFST boundaries, if H-shaped steel is applied in SRC boundaries, both the flanges and the web must be connected to transfer the normal stress. In this case, it seems only welding or bolting is appropriate to guarantee the stress transfer; however, the on-site welding usually cannot meet the strict quality requirement, while the on-site bolting also needs high-quality installation [21]. In order to facilitate the on-site construction of SRC shear walls, this paper proposes a novel partially prefabricated steel shape-reinforced concrete (PPSRC) shear wall using throat connectors. As shown in Figure 1a, the steel shapes in the boundary elements are first elected to locate the wall panels; then, the wall panel with hollow cores at the two edges is placed through the steel shapes; finally, the hollow cores will be filled using cast-in-place concrete to form the entire composite shear wall. As depicted in Figure 1b, the throat connector has variable cross-sections; therefore, the cast-in-place concrete can be locked in the throat connector to avoid slippage between the prefabricated and cast-in-place concrete. Meanwhile, studs are welded at the steel web to enhance the bonding strength between the steel shape and cast-in-place concrete. In this case, the steel-shaped, prefabricated, and cast-in-place concrete can be effectively bonded together to transfer the tensile stress in the boundaries. As for the shear stress transfer at the connection region, the steel shape can be regarded as dowels to avoid the horizontal slip between the adjacent wall panels.
This paper aims to explore the cyclic behavior of the proposed PPSRC shear walls. Based on the pseudo-static tests of one large-scale PPSRC specimen and one cast-in-place specimen, the effect of the construction method on the cyclic behavior of PPSRC shear walls was investigated by the hysteretic loops, skeleton curves, stiffness degradation, energy dissipation, and deformation decomposition. Finally, a macro-modeling of PPSRC shear walls based on the multi-layer shell elements in OpenSees was established and validated by the test results.

2. Experimental Program
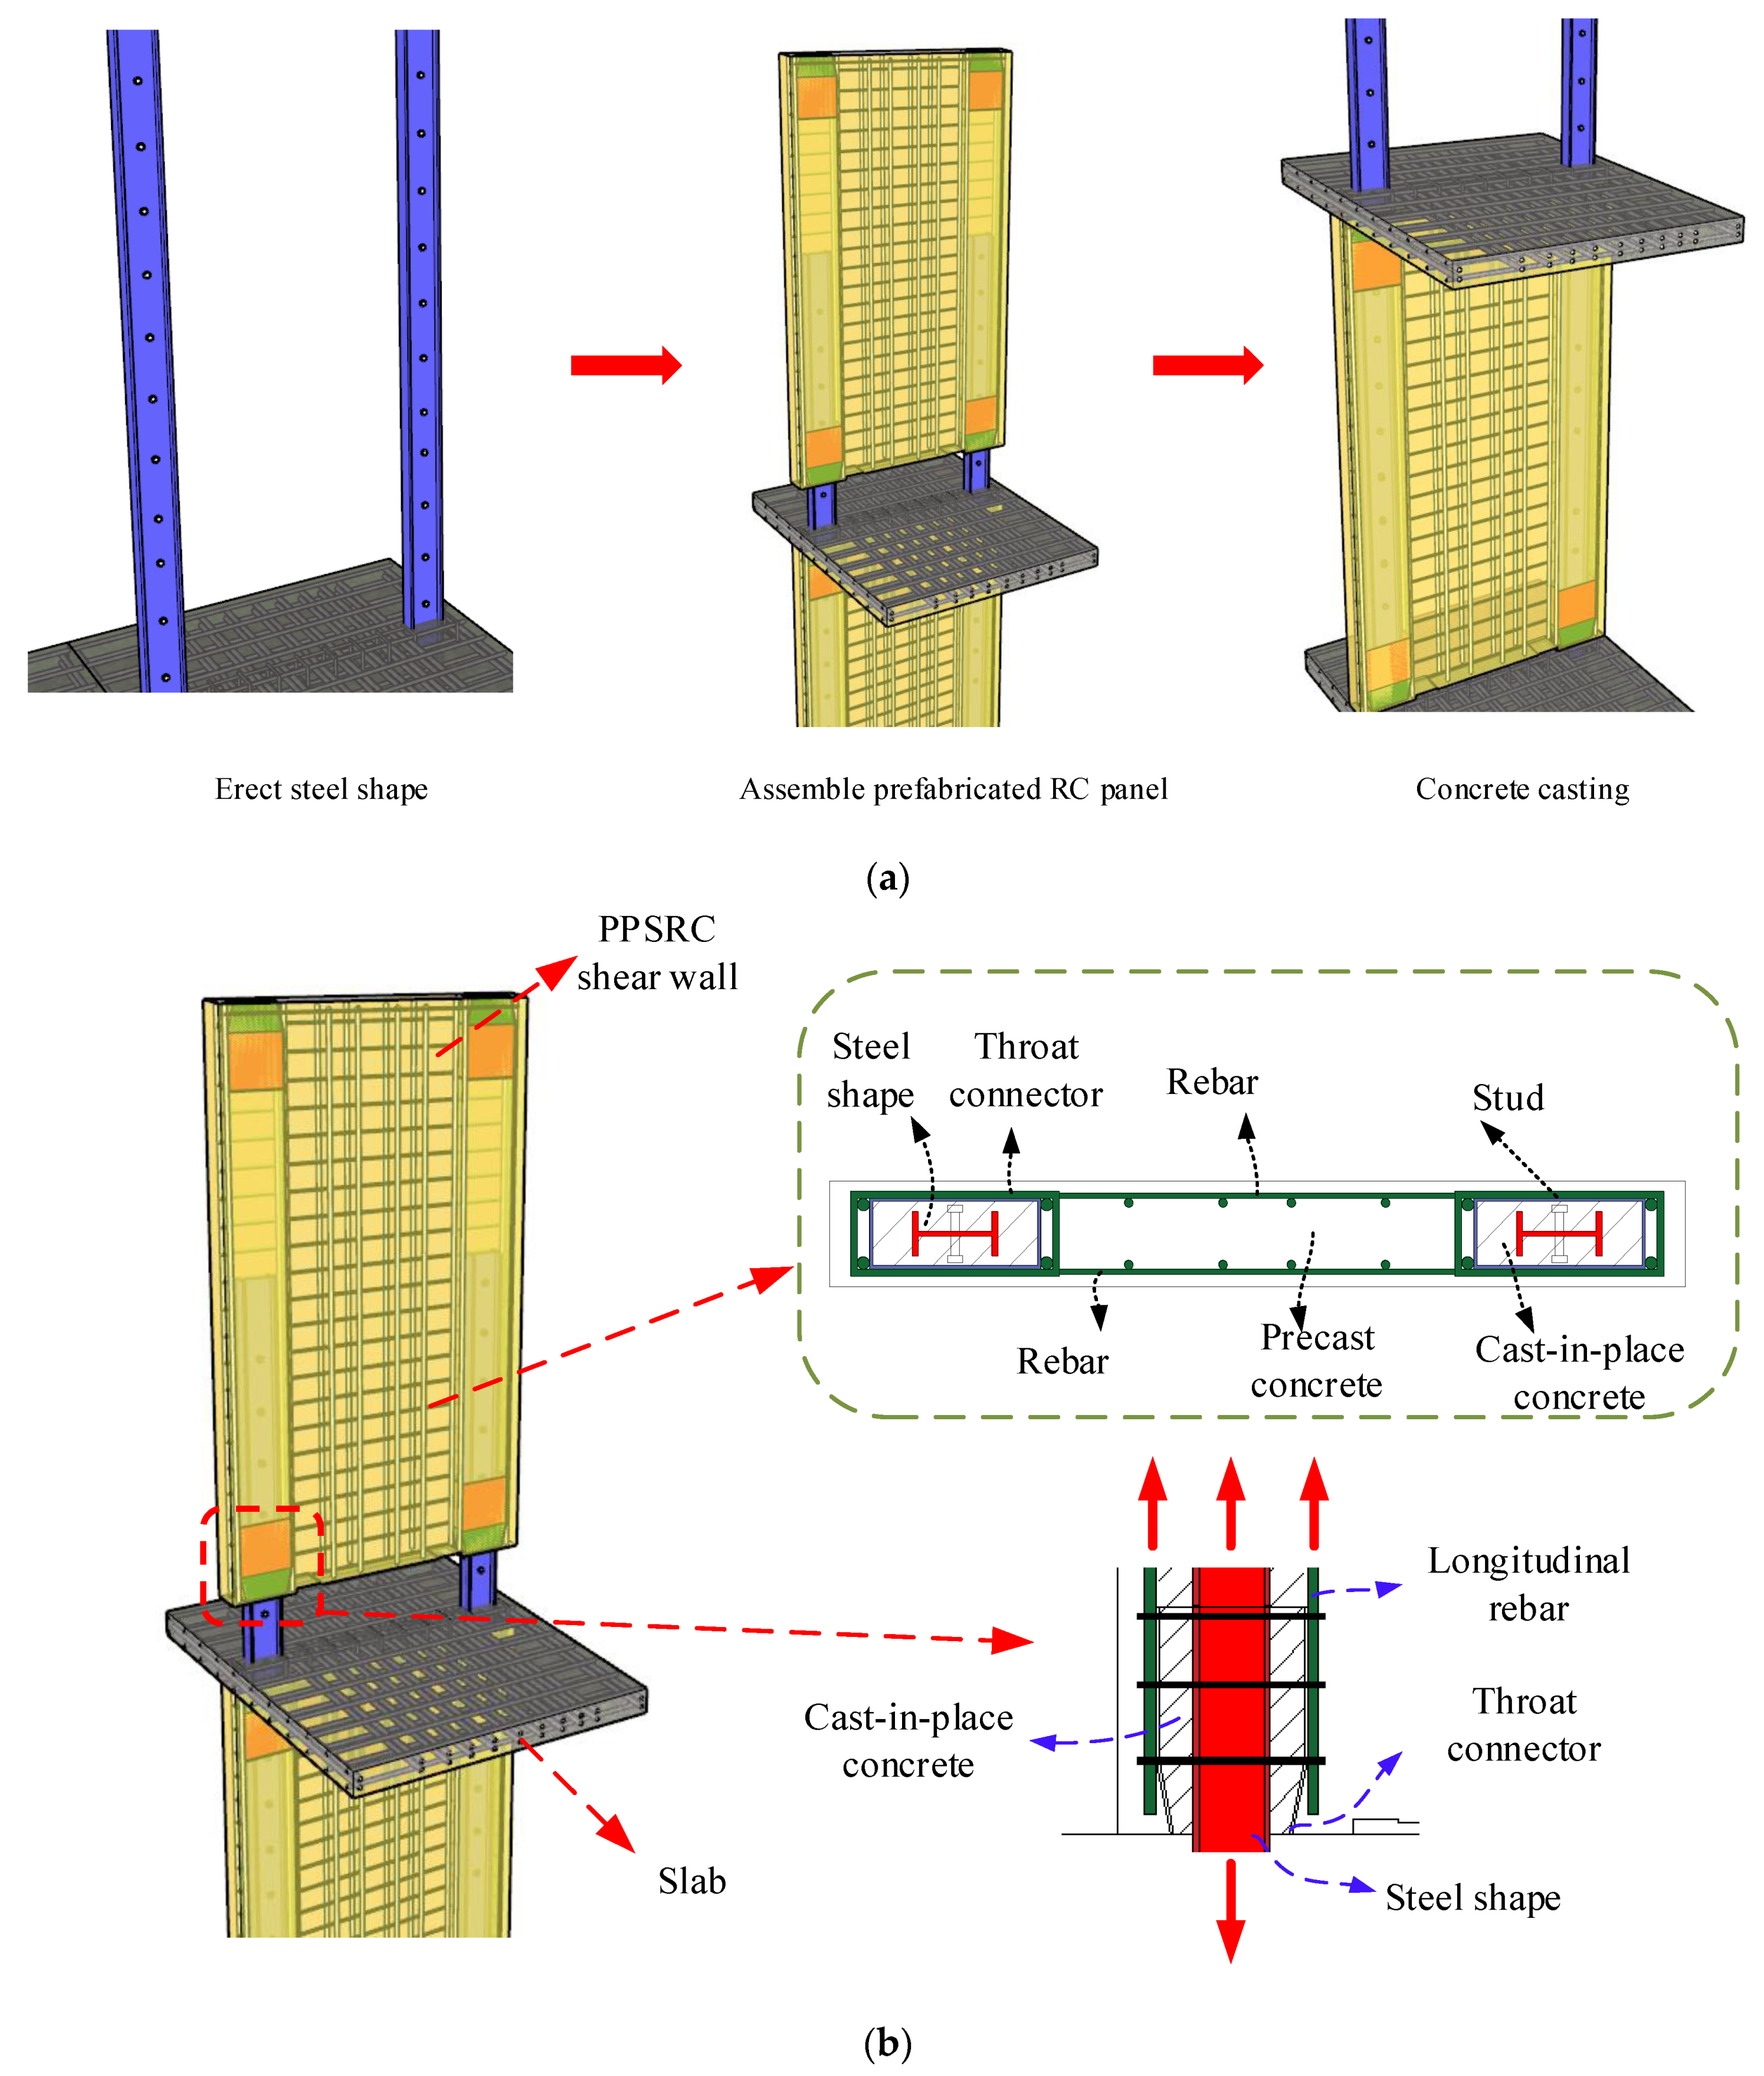
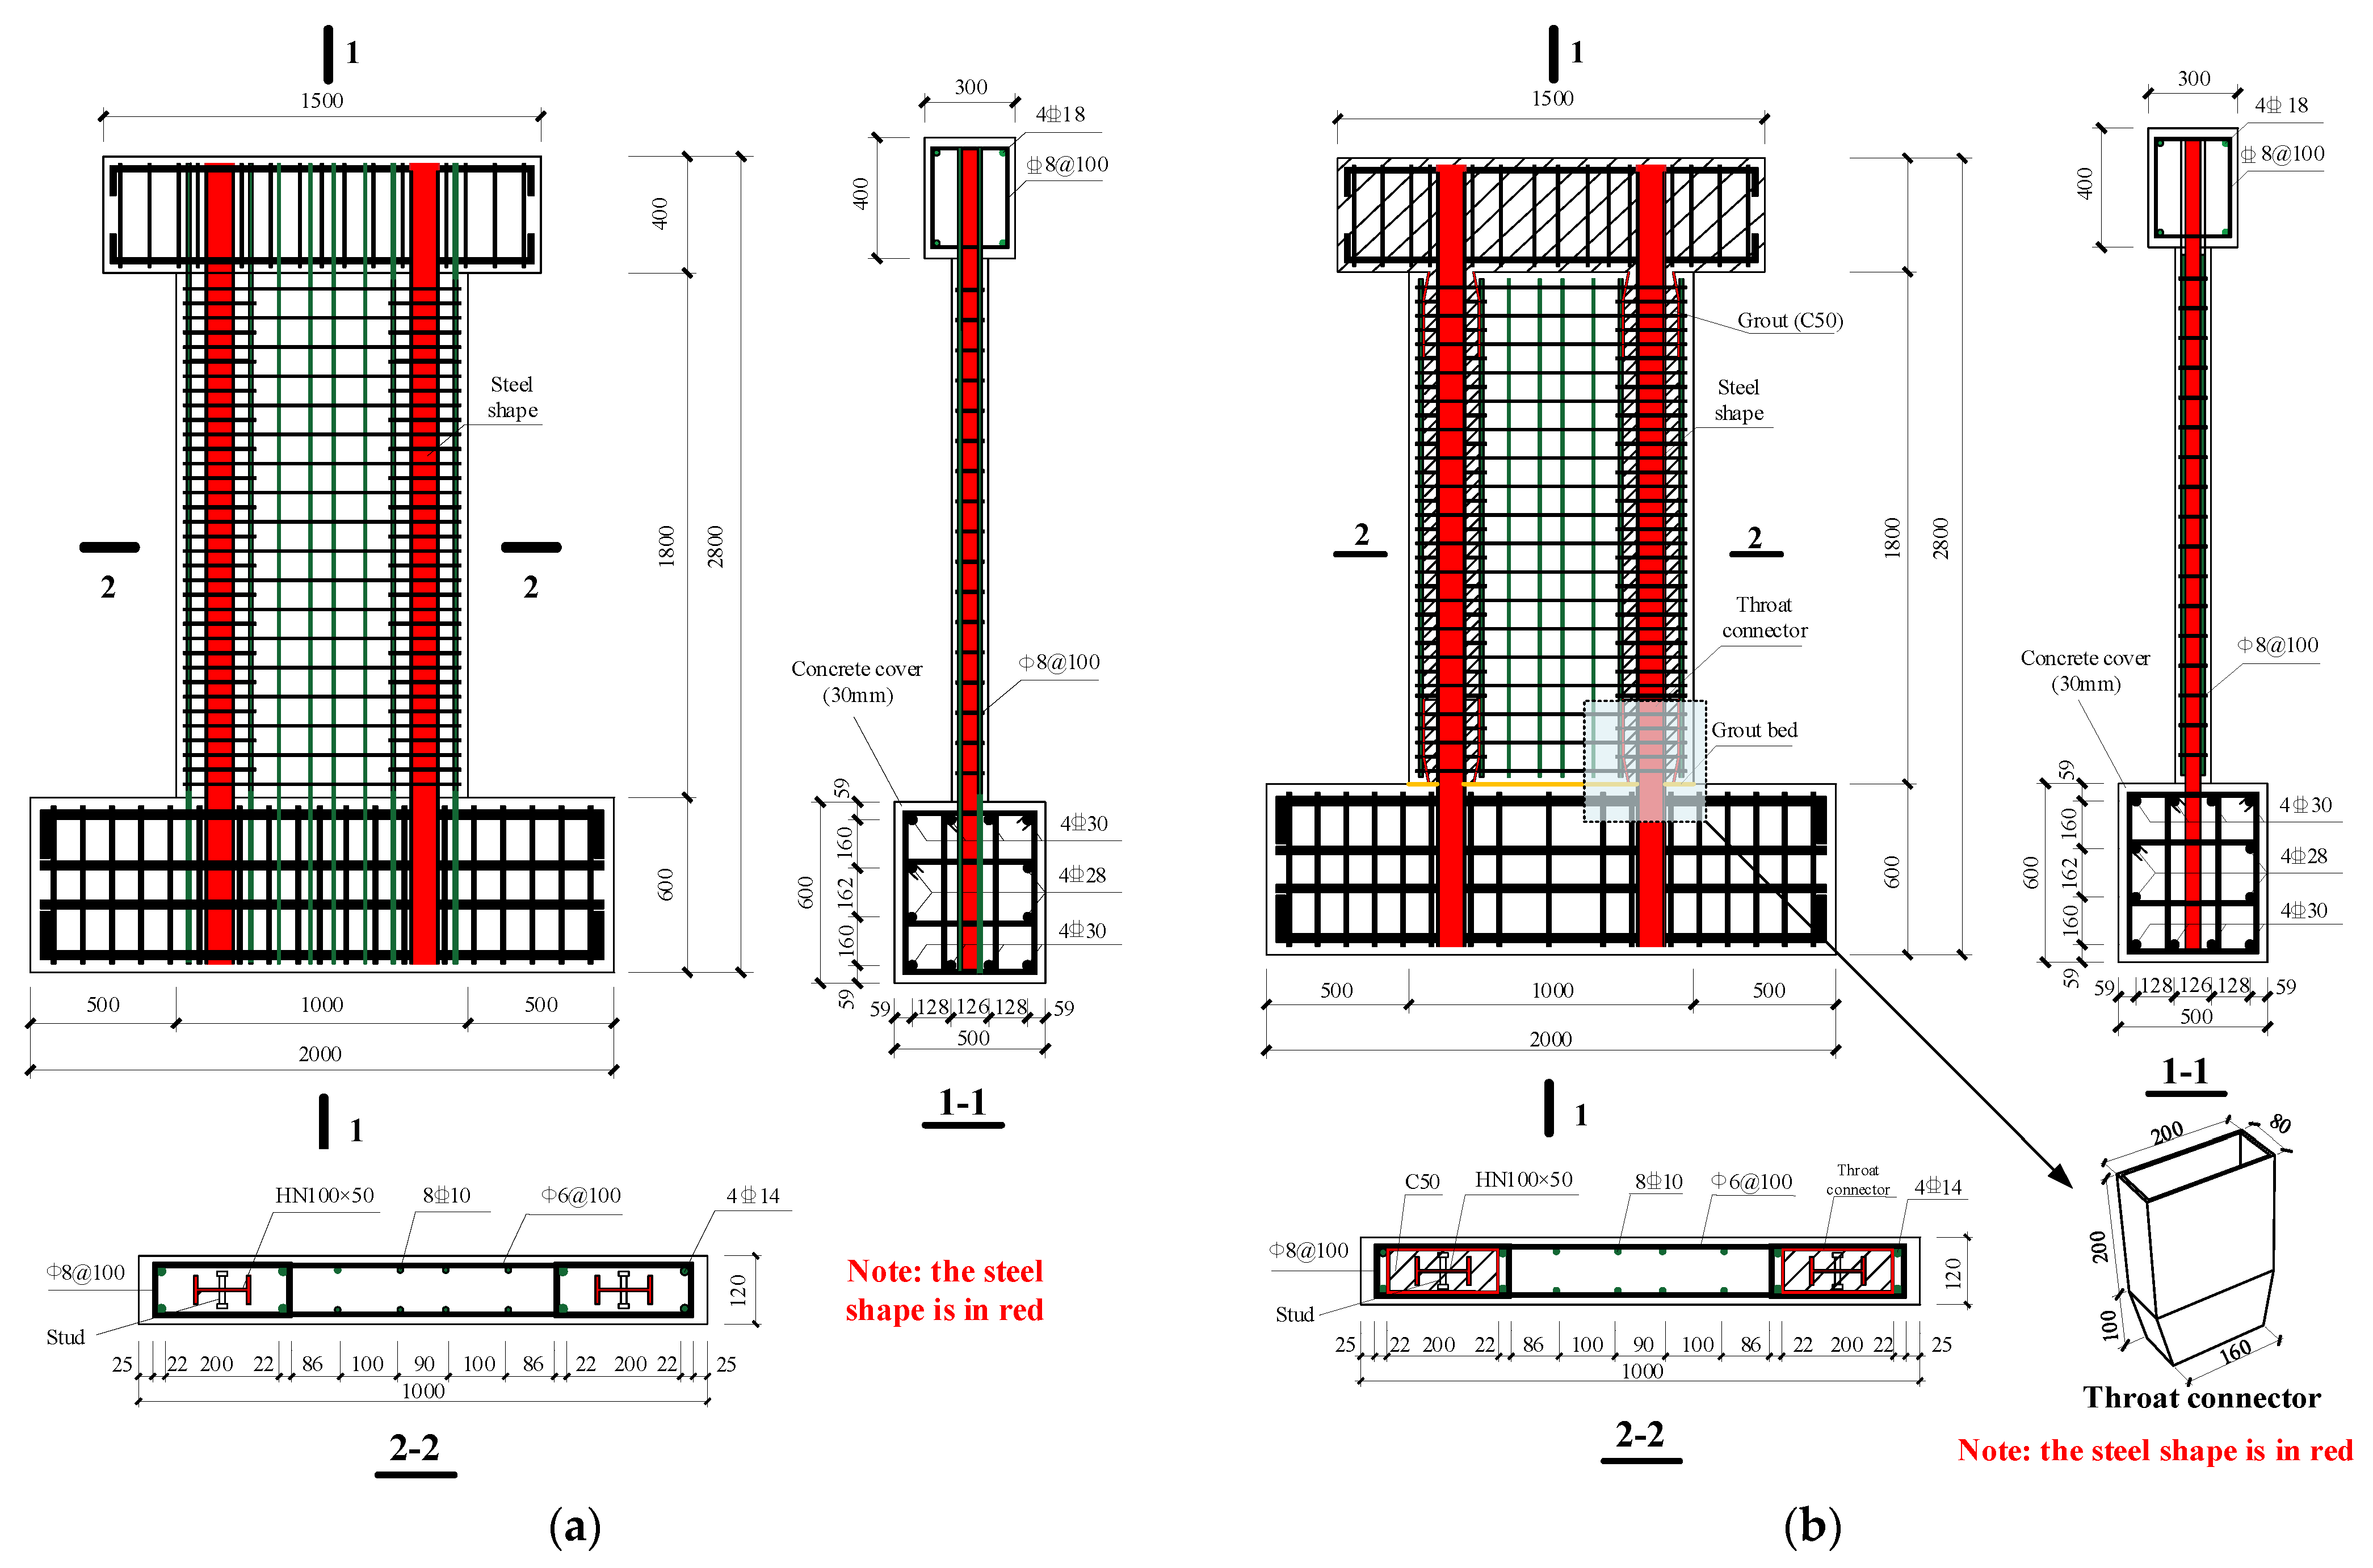
2.1. Test Specimens

Two I-shaped wall specimens with an aspect ratio of 2.0 (length × height = 1000 mm × 2000 mm) were prepared for testing. The shear walls were designed according to the prototype of a high-rise building in Xi’an, PRC, and the dimensions were scaled to 1/2 to match the maximum capacity of the test devices. The cross-sectional dimensions of each wall were 1000 mm by 120 mm, with the reversed cyclic loading applied 2000 mm from the end of the 2500 mm by 500 mm by 600 mm thick foundation block. Table 1 and Figure 2 show the principal design parameters of the specimens: the control specimen R-1 (fully cast in place) and PPSRC specimen S-1. Owing to the loading limitation of the test machine, the specimen was designed as a one-half scale of the prototype structure, and the test parameter is the construction method (cast in place or prefabricated).
The axial compression ratio of all the specimens was 0.35, which is defined as n = N0/Nu, where N0 is the applied load at the panel top, and Nu is the axial capacity of the wall panel, which can be determined per the Chinese code JGJ 138-2016 [26]. The longitudinal reinforcements in the wall panel included eight D14 bars in the boundary elements and eight D10 rebars in the unconfined regions (wall panel). For the transverse reinforcements, stirrups of D6 bars spaced at 100 mm were arranged in the horizontal direction of the wall panels; additional stirrups of D8 bars were set in the boundary elements with a spacing of 100 mm for the closer stirrup regions. It should be noted that all the longitudinal reinforcements were of the grade of HRB 400 per Chinese standards, and the transverse reinforcements were HPB 300. Dense reinforcements were applied in the top and bottom loading stubs to avoid local failure, and the detailed configuration can be found in Figure 2.
As shown in Figure 2a, R-1 is the control specimen whose construction procedure followed the traditional SRC construction. S-1 is the PPSRC shear wall, as shown in Figure 2b. In addition, the throat connectors used in the boundary elements in S-1 were welded by eight steel plates, and the longitudinal rebar was also connected to the throat connector by welding.
The construction process of PPSRC shear walls is illustrated in Figure 3, and the construction of S-1 was employed here in detail: the two steel shapes in the boundaries were first located and erected; secondly, the reinforcement skeleton in the wall panel was assembled, and the longitudinal rebar in boundaries was welded on the top and bottom throat connectors; thirdly, the foam formwork was installed between the top and bottom throat connectors to form the channel for final assembly, and concrete was cast to form the hollow R.C. wall panel; then, the well-cured wall panel was placed on the grout bedding on the bottom stub, while the erected steel shapes passed through the hollow cores in the R.C. wall panel; finally, the hollow cores in the boundary elements were filled using grout to ensure the structural integrity.

2.2. Materials

Grade Q355 steel was used for the steel shape in this experiment, and Grades HRB400 and HPB300 steel were applied as reinforcements. The yield strength fy and the ultimate strength fu of steel materials was obtained by tensile tests, and the results related to steel properties are given in Table 2. The concrete used in the shear walls was a ready-mix concrete class of C50, and three concrete cubes (150 mm × 150 mm × 150 mm) per Chinese standards were cast and cured under the same conditions as the specimens for each concrete batch. The average cubic compressive strengths (fcu) obtained from the coupon tests were 51.68 MPa and 41.17 MPa for the prefabricated and cast-in-place parts.

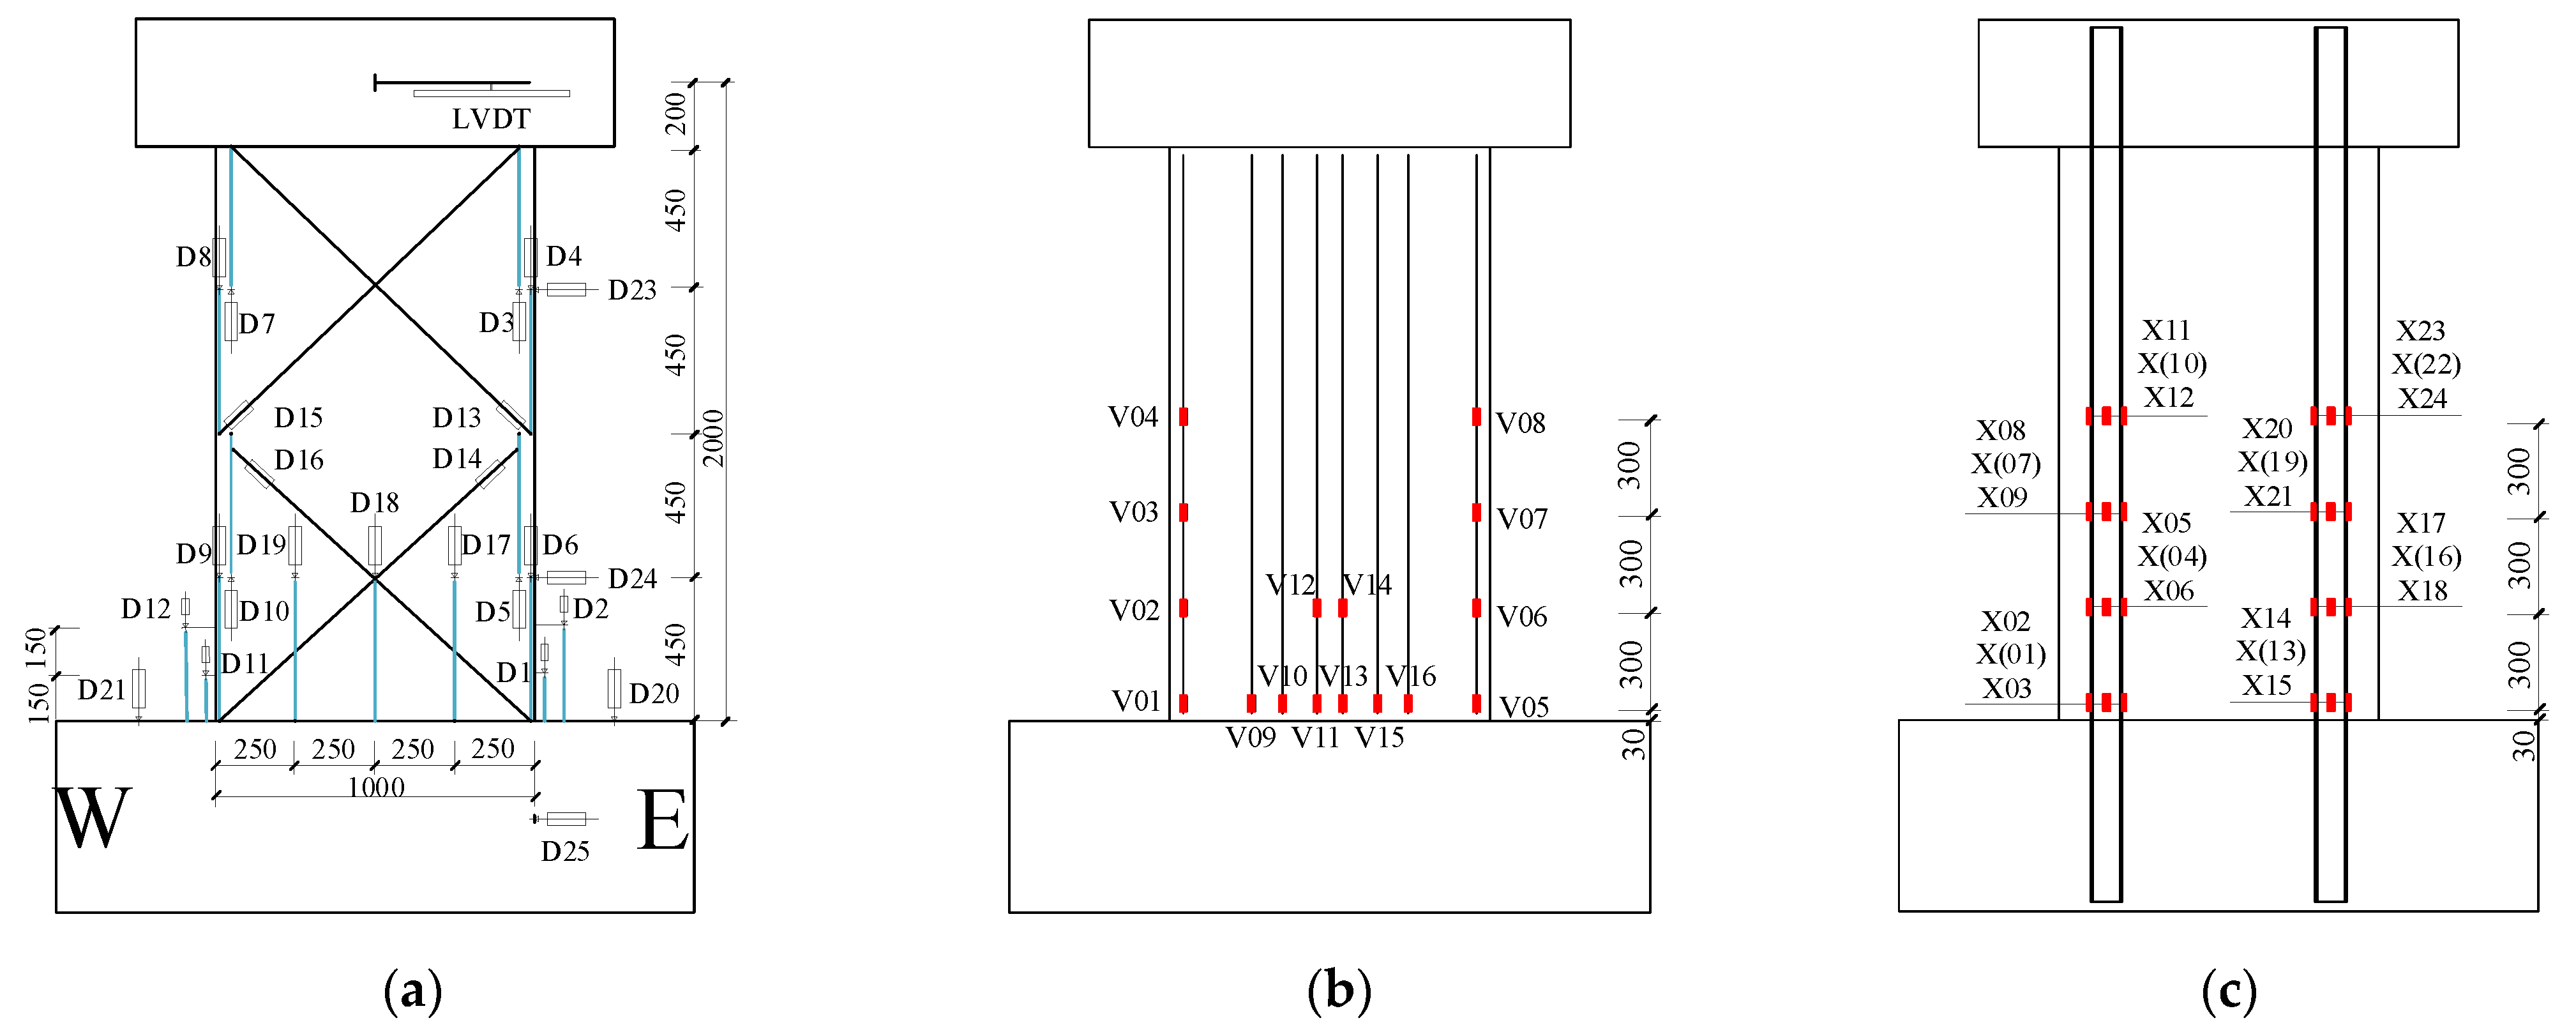
2.3. Test Device and Loading Protocol

All the specimens were tested under quasi-static cyclic loading, and the tests were performed under constant axial compression and reversible lateral loads. As shown in Figure 4a, the test specimens were anchored into the strong floor using two rigid steel beams and anchor bolts. The MTS electro-hydraulic servo actuator mounted on the top of the loading beam was used to apply the lateral load. In contrast, the axial compression was applied using a hydraulic jack fixed on a sliding track of the rigid beam to ensure the horizontal movement of the specimen during loading.
During the test process, the axial load was first gradually applied to the wall top until the designed axial compression was reached and maintained at a constant value throughout the loading process. As indicated in Figure 4b, the lateral cyclic loading protocol (the combined force–displacement control) suggested by the Chinese code JGJ/T 101-2015 [27] was adopted and applied to the specimens by the actuator. In detail, an increment of 40 kN was performed during the force-control mode, and each level cycled once until the specimen yield; then, an increment of Δy was performed during displacement-control mode when the predicted yielding strength was reached (i.e., the tensile flange of the steel shape in the boundary element yielded), and each level was repeated thrice. The test terminated when the lateral load declined lower than 85% of the experienced maximum load or the specimens could not bear the applied axial compression.
As shown in Figure 5a, the lateral displacement at the loading point was measured using a linear variable differential transformer (LVDT), and the applied lateral load was recorded by the built-in sensor of the hydraulic actuator; meanwhile, the axial compression of the test specimens was monitored using a load cell that was placed on the top stub. In addition, a total of 12 LVDTs were adapted to determine the curvature and shear deflection of the wall panel, and the strains of the longitudinal reinforcements and steel shape were recorded using strain foils, whose layouts can be found in Figure 5b,c.

3. Results and Discussions

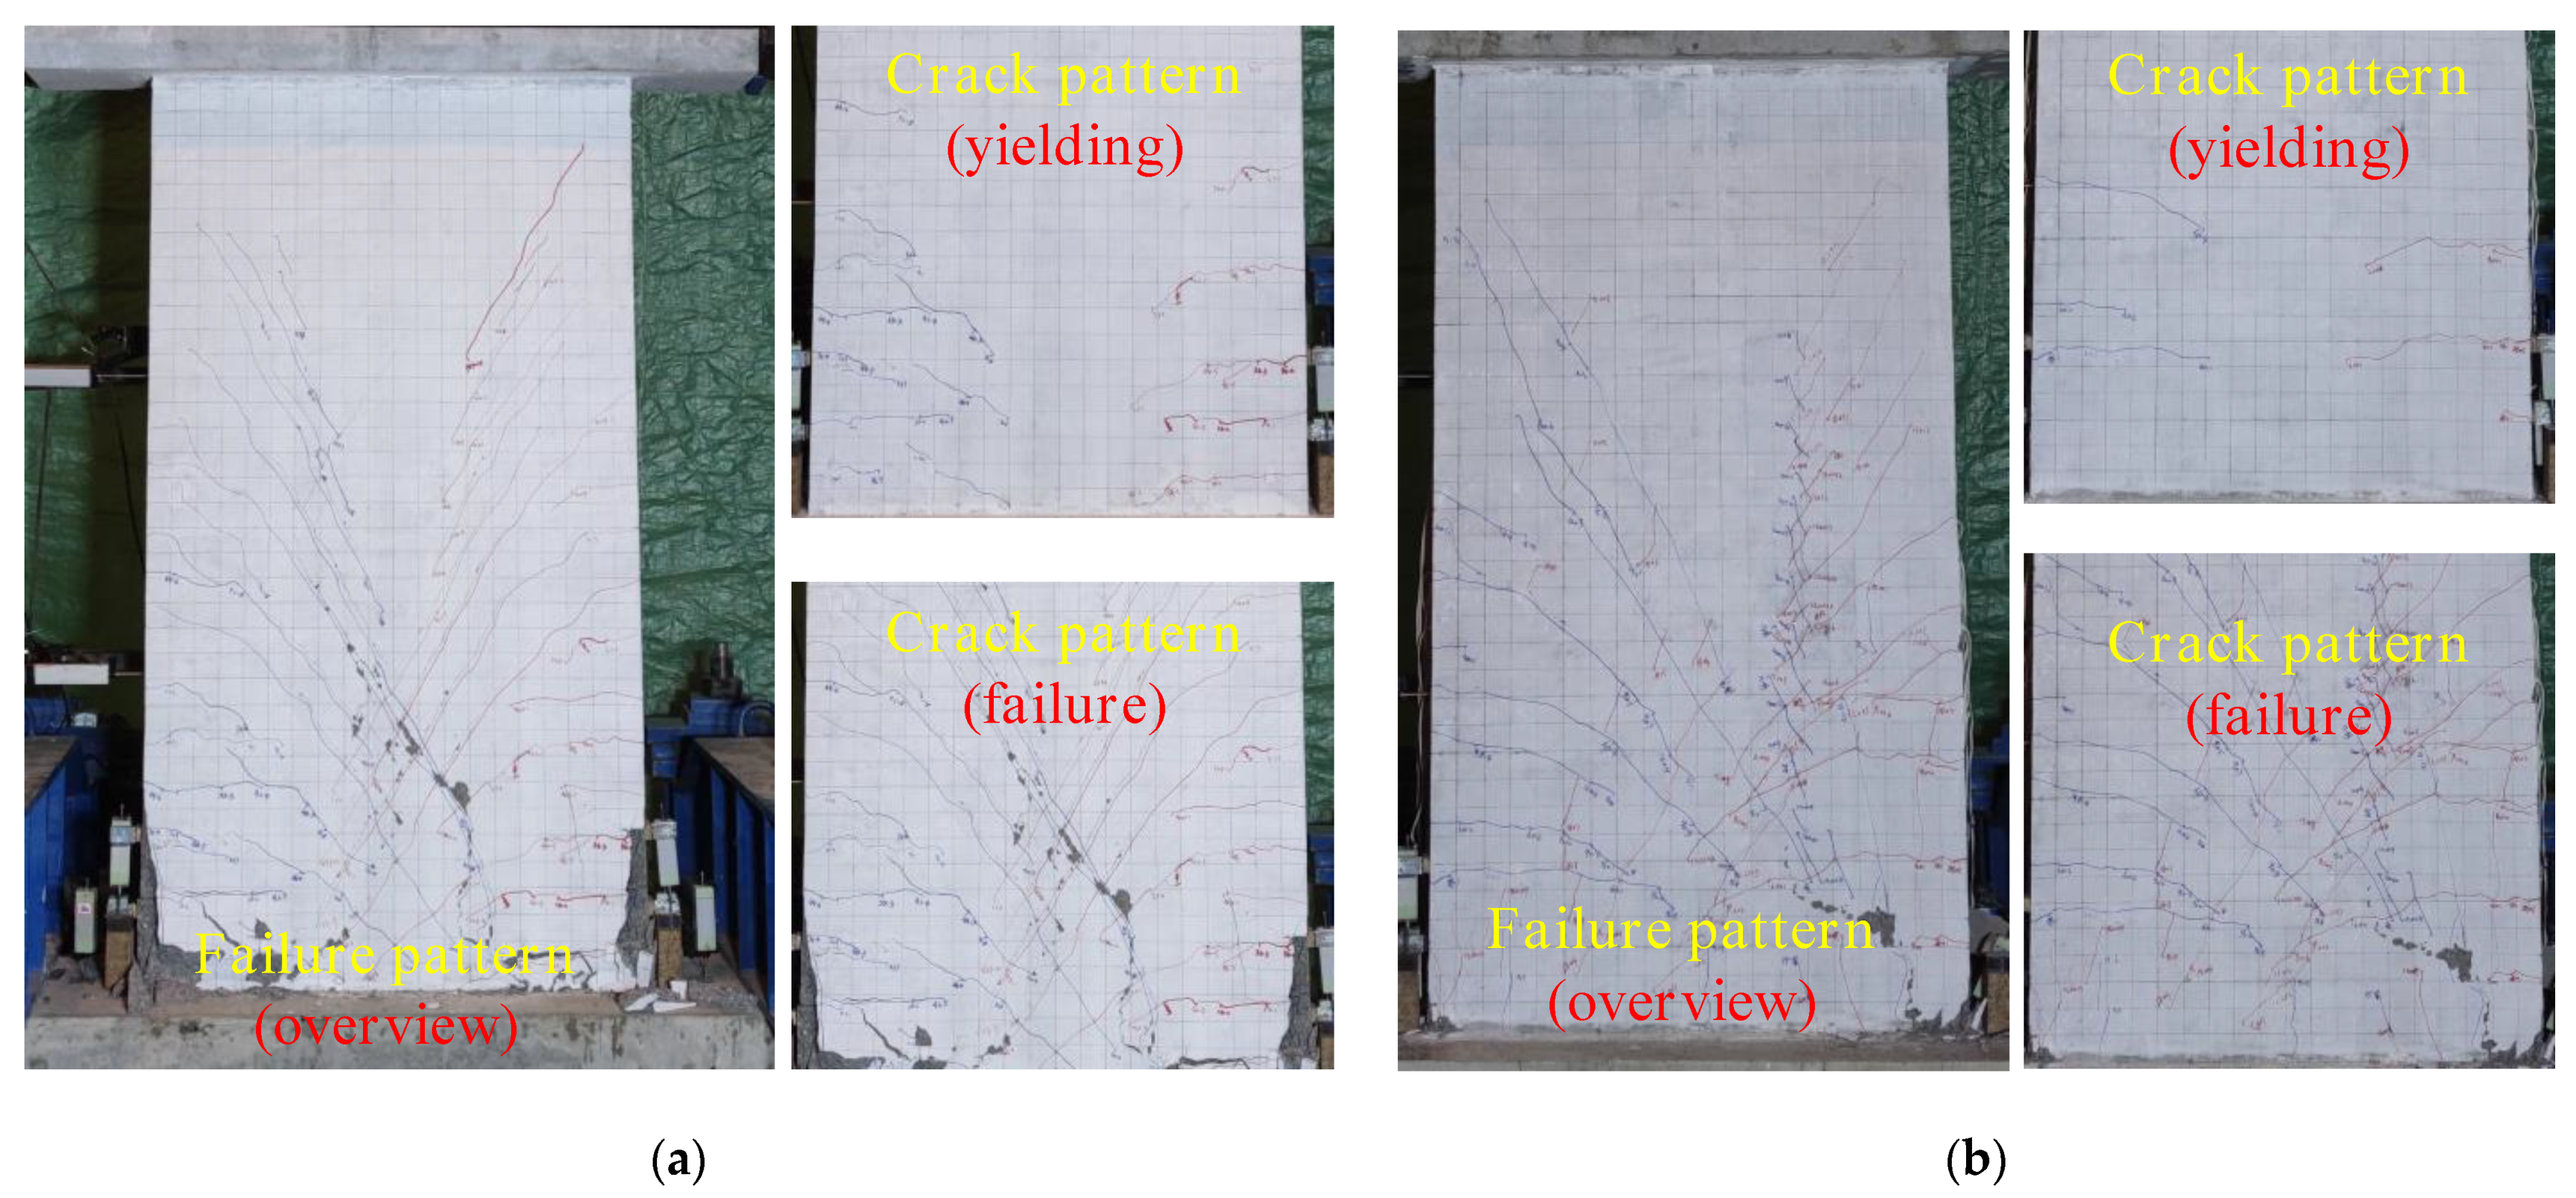
3.1. Failure Patterns

Based on Figure 6, the following section describes the experimental behavior and observed damage of each wall specimen based on visible damage, i.e., concrete cracking, crushing, spalling, steel buckling, etc.
R-1: R-1 is the reference specimen. The specimen remained elastic at the beginning of the lateral loading, and no visible crack could be observed on the wall panel. The first horizontal crack appeared at the load of 280 kN (drift ratio of 0.16%) on the west wall toe, and the first shear crack was captured at the load of 460 kN (drift ratio of 0.35%). With the lateral load increasing, the second batch of cracks was observed and gradually propagated from the edge to the middle of the wall panel. Vertical splitting at the base of the R-1 was observed at 0.7% drift, and severe concrete spalling occurred at 1.1% drift. After that, the lateral strength of the wall degraded substantially, and the failure pattern can be found in Figure 6a. It should be noted that the gauge readings on the steel flanges and rebar in the boundary element exceeded the yield strain before the peak load was reached; therefore, R-1 failed in typical flexure–shear failure in terms of the strain records and the diagonal crack patterns.
S-1: S-1 is the PPSRC specimen, and the panel reinforcements were not anchored in the bottom stub. Before the corresponding yield loads were reached, S-1 exhibited similar cyclic behavior and crack patterns compared with the cast-in-place specimen R-1. The new batch of cracks appeared with the continuous increase in the lateral load, and the transverse cracks propagated diagonally. Finally, the concrete at the wall toes was crushed and spalled, accompanied by severe lateral load degradation, indicating the failure of the specimen. As shown in Figure 6b, unlike the crack patterns of R-1, it should be noted that numerous short diagonal cracks were observed in S-1 near the hollow cores at approximately 0.6% drift. These diagonal cracks developed rapidly into X-shaped cross-crack bands due to load reversal, which can be attributed to the stress concentration at the varied cross-sections. After the test, S-1 was broken to explore the inner damage, and the steel shape in boundary elements was kept intact without any local buckling, indicating that the throat connector with the inner grout could effectively confine the steel profile.

3.2. Hysteretic Loops

Figure 7 shows the measured hysteresis curves for all shear walls, where P is the measured lateral load, and Δ denotes the lateral displacement at the loading point. The key points are defined as follows: the cracking point refers to the point when the initial crack was observed; the yielding point is determined based on the dissipated energy [28]; and the peak point denotes the point when the maximum lateral load was achieved. In addition, the test was terminated when the lateral load was reduced to 85% of the experienced maximum load; therefore, the ultimate point corresponded to the last loading level.
As shown in Figure 7, the hysteretic loops of all the specimens show spindle shapes without pinching, indicating that the steel shape, prefabricated, and cast-in-place concrete could behave in compatibility without slippage. In the initial stage, the unloading/reloading paths were linear with small residual deformation, and the loops became robust as the drift ratio increased. In general, the initial stiffness, cracking load, yielding load, and peak load of all the specimens were similar, indicating that the PPSRC specimen could exhibit comparative cyclic behavior with the cast-in-place specimen.
The main test results are recorded in Table 3, and the envelope of the hysteretic loop is the skeleton curve. As shown in Figure 7, in the early loading stage, the lateral load and corresponding displacement exhibited a linear response; then, the slope of the skeleton curves decreased gradually because of the crack propagation; after the peak load was achieved, the lateral load declined drastically, and the specimens failed in concrete crushing and spalling. The difference in the peak load among the test specimens is around 5%, indicating that the construction method (prefabricated or cast-in-place) cannot affect the load-carrying capacity of SRC shear walls. In addition, it should be noted that only the steel shape was employed to transfer the stress between the stub and wall panel in the PPSRC shear wall (S-1). In contrast, both longitudinal rebar and steel shape were anchored in the bottom stub in the traditional SRC shear wall (R-1). It indicated that the steel shape in the boundary elements was reliable in resisting the shear force and tensile stress, and it could facilitate the on-site construction of SRC shear walls.
As mentioned before, the displacement of the yielding point Δy is determined based on the dissipated energy, whose detailed calculation can be found in Ref. [28], and the displacement of the ultimate point Δu can be obtained from the last loading cycle. Here, the displacement ductility ratio μ is defined as μ = Δuy, and the displacement ductility ratios for R-1 and S-1 are 2.14 and 2.03, respectively. It should be noted that displacement ductility ratios for R-1 and S-1 are higher than 2.0 and lower than 3.0, which can meet the moderate ductility demand according to ASCE/SEI 41-17 [29]. Although the tested specimens could not reach the high ductility demand (μ ≥ 3.0), the deformability of SRC shear walls can be enhanced by increasing the tie ratio and steel ratio in boundary elements or decreasing the axial compression ratio, which is similar to the methods that can improve the deformability of traditional R.C. shear walls [29]. In this paper, the first aim is to explore the effect of different construction methods on the cyclic behavior of SRC shear walls, and the test results show that all the test specimens had comparative deformability, and the ductility and strength of PPSRC shear walls can be further improved by the means mentioned above.
To conclude, the values of the drifts at the cracking, yielding, and maximum strength points of the PPSRC specimen were 1.4 mrad, 5.0 mrad, and 8.3 mrad, respectively. In China, the seismic design of buildings is distinguished into two stages, namely, the serviceability limit state and the ultimate limit state. The former one (allowable elastic interstorey drift of 1 mrad) is checked to control damage under frequent earthquakes, and the latter one (allowable plastic drift ratio of 8.3 mrad) is checked for the collapse under rare earthquakes (corresponding to an earthquake exceedance probability of 2–3% in a 50-year period) [30]. The test results show that the deformability at the cracking point and peak strength point of the PPSRC shear wall could meet the code requirements. Therefore, the PPSRC specimen could achieve a performance equivalent to a cast-in-place wall.

3.3. Stiffness Degradation and Energy Dissipation

The secant stiffness degradation that characterized the specimen behavior is shown in Figure 8, where Ki and Δ are the average secant stiffness value and lateral displacement at the ith cycle of positive and negative directions. Generally, the trend of the stiffness degradation process was similar for all the specimens, namely, the process started from a fast degradation (crack appearance) and ended with a stable degradation (crack propagation), with a drift of 0.2% as the boundary. As indicated by Figure 8, the construction method did not obviously affect the stiffness degradation of SRC shear walls.
The dissipated hysteretic energy of the specimen can be obtained by calculating the area enclosed by the hysteretic curve, and the hysteretic damping factor ζeq is a normalized factor to evaluate the energy dissipation capacity, whose definition is depicted in Figure 9a. Generally, after the specimens yielded, ζeq slightly increased with the increase in the lateral deformations of each specimen, and the ratios of all the specimens nearly matched each other. In theory, ζeq should be zero during the elastic stage because ζeq only evaluates the performance of plastic energy dissipation; however, the measured hysteretic damping factors of R-1 and S-1 are nonzero from the beginning of the test. The reason is that the area of the recorded hysteretic loops is nonzero prior to the concrete cracking because of the “fake” deflection, which is caused by the initial imperfection or device flaws; therefore, the hysteretic damping ratios in Figure 9a are presented from the lateral displacement of 3 mm to 21 mm, which shows the plastic energy dissipation after the cracking load point.
Figure 9b shows the accumulative energy dissipation of the specimens, and the cumulative energy dissipation is defined as the sum of the energy dissipation in all the displacement levels. As shown in Figure 9b, during the elastic stage, all the specimens had nearly the same small energy dissipation. Afterward, the energy dissipation increased nonlinearly with the horizontal displacement. At the ultimate displacement level, the difference in the cumulative energy dissipation between R-1 and S-1 was 8.9%, indicating that apparently, the construction methods could not affect the cyclic behavior.

3.4. Deformation Components

The overall lateral displacement Δ of a cantilever wall is defined as the sum of flexural (Δf), shear (Δs), and sliding (Δbs) deformations, as follows: Δ = Δf + Δs + Δbs. In the present study, the relative contributions of flexural, shear, and sliding deformation components to the total lateral displacement of the walls are estimated using the displacement sensors installed on the walls (refer to Figure 5). The flexural contribution Δf is calculated using the method detailed in Ref. [31], in which Δf is estimated from the average rotation of each deformation panel; then, the shear contribution Δs is determined using the measurement of diagonal LVDTs within each deformation panel, considering simple geometric considerations; finally, the sliding contribution Δbs can be obtained by Δ − Δf − Δs.
Figure 10 shows the different deformation contributions to the overall lateral displacement. As indicated by Figure 10, the average flexural contribution was approximately 50% for both walls throughout the entire protocol, indicating that the failure modes of the test specimens were flexure-dominant. Meanwhile, the percent of Δbs in R-1 was clearly lower than that in the PPSRC shear walls, indicating that the steel shape in the throat connectors exhibited more slip than in the cast-in-place wall. It is reasonable in P.C. members because only reinforcements are connected at the joint, and the stress concentration leads to more deformation. In addition, the shear contribution Δs was not dominant in all the test specimens, which agreed with the test observations that the width of diagonal cracks was limited and the plastic hinge caused by flexure action formed near the wall base.

4. FE Analysis

4.1. Model Details

The multi-layer shell element was adopted for modeling the test specimens in OpenSees [32]. As illustrated in Figure 11, in the multi-layer shell element, the concrete cover and inside concrete were represented by several concrete layers, and the distributed reinforcements were represented by the smeared rebar layers in vertical and horizontal directions, respectively; meanwhile, the longitudinal rebars in the boundary elements were modeled with truss elements, and they were coupled with the surrounding shell elements by coupling the degrees of freedom (DOFs) at the coincident nodes. In PPSRC shear walls, there are steel shapes in the two boundary elements in which the steel flanges significantly contribute to the global flexural strength and the steel web to the global shear strength. In the established model that aimed to simulate the flexure-dominant failure, the two steel flanges were simplified using two truss elements, and the contribution of the steel web was neglected to enhance the calculation efficiency. It is acceptable because the moment of inertia of the thin web is apparently less than that of the steel flange, and the simplification will lead to conservative results when predicting flexural strength. In addition, there were two different concrete in the cross-section of the PPSRC shear walls, namely, the prefabricated concrete and the cast-in-place concrete in the hollow cores; therefore, the weighed concrete strength, as shown in Equation (1), based on the cross-sectional area was applied here to consider the difference in concrete. This simplification has been validated when predicting the flexural strength of PPSRC beams and columns [33,34]; therefore, the weighed concrete strength can also be applied here to consider the difference in the two concrete parts.
f c , com = A 1 A 1 + A 2 f c 1 + A 2 A 1 + A 2 f c 2
where fc,com is the weighed concrete strength (in compression or in tension); A1 and A2 are the cross-sectional areas of the prefabricated and cast-in-place concrete, respectively; and fc1 and fc2 are the strength of the prefabricated and cast-in-place concrete, respectively.
In the established FE model, the Giuffré-Menegotto-Pinto model [35], namely, the Steel02 material model in OpenSees, was adopted to represent the uniaxial stress–strain relationship of the steel reinforcement in truss elements, and the strain-hardening ratio after yielding was assumed to be 1%. As for the concrete property, the constitutive model for concrete proposed in this research was based on the concept of damage mechanics and the smeared crack model, whose detailed definition can be found in Ref. [32], and the uniaxial stress–strain relationship of concrete applied the Kent-Park model [36], namely, the Concrete02 material model in OpenSees.

4.2. Model Validation and Parametric Study

As shown in Figure 7, the modeled hysteretic curves, including the initial stiffness, maximum strength, and post-peak load behavior, closely matched the test results, indicating that the numerical model could effectively reflect the cyclic responses of PPSRC shear walls. As shown in Figure 12 and Table 4, five parameters are employed here to validate the proposed model, namely, the predicted maximum load (Pm), the predicted load when the specimen failed (Pu), the lateral displacement corresponding to the maximum load (Δm), the predicted hysteretic damping ratio when the peak load is reached (ξm), and the predicted hysteretic damping ratio when the test terminated (ξu). The first three parameters can evaluate whether the tested and simulated skeleton curves match each other, and the other two parameters can evaluate the agreement of the robustness between the simulated and tested hysteretic loops. As recorded in Table 4, the ratios of Pms/Pm, Pus/Pu, Δmsm, ξms/ξm, and ξus/ξu are 0.91, 0.93, 1.23, 1.06, and 0.97 for R-1 and 0.86, 1.00, 1.08, 0.86, and 0.79 for S-1, indicating that both the stiffness, load-carrying capacity, load degradation, and the energy-dissipation capacity of PPSRC shear walls can be well captured by the proposed model, and the proposed model is qualified to be applied to conduct further parametric research.
A parametric analysis was conducted with S-1 as the base case to assess the effects of axial compression, steel ratio in boundary elements, concrete strengths of prefabricated and cast-in-place parts, the ratio of steel bars in boundary elements, and loading conditions. Figure 13a evaluates the effect of the axial compression ratio on the cyclic behavior of PPSRC shear walls. The numerical results indicated that the peak load increased with the increase in the applied axial compression (the peak load increased by 5.6% when the axial compression ratios were from 0.3 to 0.5); however, more severe load degradation could be found in the samples with higher axial compression. Figure 13b evaluates the effect of steel ratio on the cyclic behavior of PPSRC shear walls; generally, the higher steel ratio in boundary elements led to higher initial stiffness and peak loads (the peak load increased by 25.8% when the steel ratios were from 2.4% to 6.6%), indicating that the cyclic performance could be effectively enhanced by increasing the dimension of the steel shape. Figure 13c,d explore the effect of concrete strength on the cyclic behavior of PPSRC shear walls; in general, the concrete strengths of the prefabricated and cast-in-place parts both contributed to the initial stiffness and maximum strength because the peak load increased by 12.7% when the prefabricated concrete strength grades are from C60 to C80, and the peak load increased by 5.0% when the prefabricated concrete strength grades are from C50 to C70. Nevertheless, the brittle characteristic of high-strength concrete led to sharp load degradation after the peak load point. Figure 13e evaluates the effect of rebar ratio on the cyclic behavior of PPSRC shear walls and obtains similar conclusions to those of the increase in steel ratios. Figure 13f investigates the behavior under different loading conditions (cyclic loading and monotonic loading), and the results show that the load reversal could cause significant concrete damage within the boundary elements and wall panels, leading to lower load-carrying capacities and a more brittle failure.

5. Conclusions

This paper conducted quasi-static tests on a novel composite shear wall. Two specimens were tested to investigate the effect of construction methods. Based on the experimental results, a numerical model was developed and validated to consider the influences of axial compression, steel ratio, and concrete strength of prefabricated and cast-in-place parts. The main conclusions are summarized as follows:
(1)
All the specimens failed in typical flexure–shear failure characterized by the concrete spalling at the wall toes and the diagonal crack patterns on the wall panel. After the test, the PPSRC specimen was broken to explore the inner damage, and the steel shape in boundary elements was kept intact without any local buckling, indicating that the throat connector with the inner grout could effectively confine the steel profile.
(2)
The hysteretic loops of all the specimens show spindle shapes without pinching, indicating that the steel shape, prefabricated, and cast-in-place concrete could behave in compatibility without slippage. In general, the initial stiffness, cracking load, yielding load, and peak load of all the specimens were similar, indicating that the PPSRC specimen could exhibit comparative cyclic behavior with the cast-in-place specimen.
(3)
The values of the drifts at cracking, yielding, and maximum strength points of the PPSRC specimen were 1.4 mrad, 5.0 mrad, and 8.3 mrad, respectively. It is worth noting that the drift at the peak strength point could meet the Chinese code requirements for areas with rare earthquakes. Therefore, the PPSRC shear walls could achieve a performance equivalent to a cast-in-place wall and exhibit good deformation capability.
(4)
The established FE model based on multi-layer shell elements could effectively reflect the cyclic responses of SRC and PPSRC shear walls. The parametric study shows that the higher axial compression, steel ratio, rebar ratio, and concrete strength led to higher initial stiffness and maximum strength; however, the higher axial compression and the brittle characteristic of high-strength concrete also led to sharp load degradation during the post-peak load stage.
(5)
This paper explored the cyclic behavior of proposed PPSRC shear walls using experimental and numerical research; however, the lack of a design method limits the real-world application of PPSRC shear walls. In the future, the strength predictions and case studies should be conducted to strengthen the practical relevance of the research.

Author Contributions

Conceptualization, Y.Y.; methodology, Y.Y.; validation, Y.X. and Y.L.; formal analysis, Q.X.; investigation, Q.X.; data curation, Y.X. and Y.L.; writing—original draft preparation, Y.Y.; writing—review and editing, Y.X.; visualization, Q.X.; supervision, Y.X.; project administration, Y.Y.; funding acquisition, Y.Y. All authors have read and agreed to the published version of the manuscript.

Funding

The authors express their sincere appreciation for the financial support received from the Key R&D Program of Shaanxi Province (2024SF-YBXM-651).

Data Availability Statement

The data presented in this study are available upon request from the corresponding author.

Conflicts of Interest

Author Yaping Liu was employed by the company China Qiyuan Engineering Corporation. The remaining authors declare that the research was conducted in the absence of any commercial or financial relationships that could be construed as a potential conflict of interest.

References

  1. Massone, L.M.; Sayre, B.L.; Wallace, J.W. Load-Deformation Responses of Slender Structural Steel Reinforced Concrete Walls. Eng. Struct. 2017, 140, 77–88. [Google Scholar] [CrossRef]
  2. Jafari, A.; Beheshti, M.; Shahmansouri, A.A.; Bengar, H.A. Cyclic Response and Damage Status of Coupled and Hybrid-Coupled Shear Walls. Structures 2024, 61, 106010. [Google Scholar] [CrossRef]
  3. Zhang, L.; Han, X.; Chen, X.; Ji, J. Experimental Study on the Seismic Behavior of Squat SRC Shear Walls with High Axial Load Ratio. Buildings 2022, 12, 1238. [Google Scholar] [CrossRef]
  4. Wang, W.; Song, J.; Hou, M.; Liu, G.; Wang, W. Experimental Study and Numerical Simulation of Replaceable Corrugated Steel Plate-Concrete Composite Shear Walls. Soil. Dyn. Earthq. Eng. 2019, 127, 105827. [Google Scholar] [CrossRef]
  5. Kisa, M.H.; Yuksel, S.B.; Caglar, N. Experimental Study on Hysteric Behavior of Composite Shear Walls with Steel Sheets. J. Build. Eng. 2021, 33, 101570. [Google Scholar] [CrossRef]
  6. Benam, M.B.; Azar, B.F.; Veladi, H. Experimental and Numerical Analyses of Seismic Behavior of Concrete Shear Wall with Opening Accompanied by Steel Frame and Eccentric Encased Steel Braces. Eng. Struct. 2022, 256, 113989. [Google Scholar] [CrossRef]
  7. Zhang, J.; Li, X.; Cao, W.; Yu, C. Seismic Behavior of Composite Shear Walls Incorporating High-Strength Materials and CFST Boundary Elements. Eng. Struct. 2020, 220, 110994. [Google Scholar] [CrossRef]
  8. Ke, X.; Li, N.; Tang, Z. Seismic Behavior of Steel Plate Concrete Composite Shear Walls with PEC Columns and WRGs. Eng. Struct. 2023, 277, 115412. [Google Scholar] [CrossRef]
  9. Zhou, J.; Fang, X.; Jiang, Y. Cyclic Behavior of Concrete-Encased High-Strength Concrete-Filled Steel Tube Composite Walls: An Experiment. Struct. Concr. 2021, 22, 691–708. [Google Scholar] [CrossRef]
  10. Chen, Z.; Xu, J.; Chen, Y.; Su, Y. Seismic Behavior of T-Shaped Steel Reinforced High Strength Concrete Short-Limb Shear Walls under Low Cyclic Reversed Loading. Struct. Eng. Mech. 2016, 57, 681–701. [Google Scholar] [CrossRef]
  11. Yang, Y.; Xue, Y.; Yu, Y.; Gao, F. Experimental Study on Seismic Performance of Partially Precast Steel Reinforced Concrete Columns. Eng. Struct. 2018, 175, 63–75. [Google Scholar] [CrossRef]
  12. Xue, Y.; Yang, Y.; Yu, Y. Cyclic Behavior of Partially Precast Steel Reinforced Concrete Short Columns: Experiment and Theoretical Analysis. Eng. Struct. 2019, 199, 109658. [Google Scholar] [CrossRef]
  13. Xue, Y.; Chen, Y.; Shang, C.; Yang, Y.; Yu, Y. Maximum Shear Strength of Concrete-Encased Steel Composite Beams: A novel Strength Model and FE. Verification. Eng. Struct. 2023, 291, 116490. [Google Scholar] [CrossRef]
  14. Liao, F.Y.; Han, L.H.; Tao, Z. Performance of Reinforced Concrete Shear Walls with Steel Reinforced Concrete Boundary Columns. Eng. Struct. 2012, 44, 186–209. [Google Scholar] [CrossRef]
  15. Ma, K.Z.; Ma, Y.D.; Liang, X.W. Seismic Behavior of Steel Reinforced High-Strength Concrete Composite Walls. J. Earthq. Eng. 2020, 24, 1290–1310. [Google Scholar] [CrossRef]
  16. Ji, X.; Leong, T.; Qian, J.; Qi, W.; Wang, W. Cyclic Shear Behavior of Composite Walls with Encased Steel Braces. Eng. Struct. 2016, 127, 117–128. [Google Scholar] [CrossRef]
  17. Ke, X.; Qin, Y.; Chen, S.; Li, N. Seismic Performance and Shear Lag Effect of T-shaped Steel Plate Reinforced Concrete Composite Shear Wall. Eng. Struct. 2023, 289, 116303. [Google Scholar] [CrossRef]
  18. Xu, G.; Wang, Z.; Wu, B.; Bursi, O.S.; Tan, X.; Yang, Q.; Wen, L. Seismic Performance of Precast Shear Wall with Sleeves Connection based on Experimental and Numerical Studies. Eng. Struct. 2017, 150, 346–358. [Google Scholar] [CrossRef]
  19. Smith, B.J.; Kurama, Y.C.; McGinnis, M.J. Behavior of Precast Concrete Shear Walls for Seismic Regions: Comparison of Hybrid and Emulative Specimens. J. Struct. Eng. 2013, 139, 1917–1927. [Google Scholar] [CrossRef]
  20. Li, W.; Gao, H.; Xiang, R.; Du, Y. Experimental Study of Seismic Performance of Precast Shear Wall with A New Bolt-Plate Connection Joint. Structures 2021, 34, 3818–3833. [Google Scholar] [CrossRef]
  21. Kurama, Y.C.; Sritharan, S.; Fleischman, R.B.; Restrepo, J.; Henry, R.S.; Cleland, N.M.; Ghosh, S.K.; Bonelli, P. Seismic-resistant precast concrete structures: State of the art. J. Struct. Eng. 2018, 144, 03118001. [Google Scholar] [CrossRef]
  22. Zhou, J.; Li, P.; Guo, N. Seismic Performance Assessment of A Precast Concrete-Encased CFST Composite Wall with Twin Steel Tube Connections. Eng. Struct. 2020, 207, 110240. [Google Scholar] [CrossRef]
  23. Wu, L.; Tian, Y.; Su, Y.; Chen, H. Seismic Performance of Precast Composite Shear Walls Reinforced by Concrete-Filled Steel Tubes. Eng. Struct. 2018, 162, 72–83. [Google Scholar] [CrossRef]
  24. Fu, Y.; Fan, G.; Tao, L.; Yang, Y.; Wang, J. Seismic Behavior of Prefabricated Steel Reinforced Concrete Shear Walls with New Type Connection Mode. Structures 2022, 37, 483–503. [Google Scholar] [CrossRef]
  25. Guan, D.; Li, S.; Yang, S.; Liu, J.; Guo, Z.; Wang, Y. Seismic Performance Study on A Precast Double-Skin Composite Wall with Circular CFSTs. J. Constr. Steel Res. 2023, 200, 107677. [Google Scholar] [CrossRef]
  26. JGJ 138-2016; Code for Design of Composite Structures. China Architecture & Building Press: Beijing, China, 2016.
  27. JGJ/T 101-2015; Specification for Seismic Test of Buildings. China Architecture & Building Press: Beijing, China, 2015.
  28. Feng, P.; Qiang, H.; Ye, L. Discussion and Definition on Yield Points of Materials, Members and Structures. Eng. Mech. 2017, 34, 36–46. [Google Scholar]
  29. ASCE/SEI 41-17; Seismic Evaluation and Retrofit of Existing Buildings. American Society of Civil Engineers: Reston, VA, USA, 2017.
  30. GB 50011-2010; Code for Seismic Design of Buildings. China Architecture & Building Press: Beijing, China, 2010.
  31. Faraone, G.; Hutchinson, T.C.; Piccinin, R.; Silva, J.F. Seismic Performance of Varying Aspect Ratio Full-Scale Concrete Walls. ACI Struct. J. 2022, 119, 19–34. [Google Scholar]
  32. Lu, X.; Xie, L.; Guan, H.; Huang, Y.; Lu, X. A Shear Wall Element for Nonlinear Seismic Analysis of Super-Tall Buildings using OpenSees. Finite Elem. Anal. Des. 2015, 98, 14–25. [Google Scholar] [CrossRef]
  33. Yang, Y.; Xue, Y.; Yu, Y.; Shao, Y.; Ma, N.; Guo, Y.; Yang, Y. Experimental Research on Mechanical Performance of Partially Precast Steel Reinforced Concrete Beams. China Civ. Eng. J. 2018, 51, 1–9+19. [Google Scholar]
  34. Xue, Y.; Yang, Y.; Yu, Y. Pseudostatic Testing for Load-Carrying Capacity of Precast Concrete-Encased Steel Composite Columns. J. Build. Eng. 2020, 29, 101189. [Google Scholar] [CrossRef]
  35. Menegotto, M. Method of Analysis for Cyclically Loaded R.C. Plane Frames Including Changes in Geometry and Non-Elastic Behavior of Elements under Combined Normal Force and Bending. In Proceedings of the IABSE Symposium on Resistance and Ultimate Deformability of Structures Acted on by Well Defined Repeated Loads, Lisbon, Portugal, 13–14 September 1973. [Google Scholar]
  36. Scott, B.D.; Park, R.; Priestley, M.J.N. Stress-Strain Behavior of Concrete Confined by Overlapping Hoops at Low and High Strain Rates. ACI Struct. J. 1982, 79, 13–27. [Google Scholar]
Figure 1. (a) Construction process of PPSRC shear walls; (b) detailed configuration of PPSRC shear walls.
Buildings 14 02208 g001
Figure 2. (a) Design details of R-1; (b) design details of S-1.
Buildings 14 02208 g002
Figure 3. Construction procedure of PPSRC shear walls.
Buildings 14 02208 g003
Figure 4. (a) Test device; (b) loading protocol.
Buildings 14 02208 g004
Figure 5. (a) LVDTs; (b) strain gauges at rebar skeleton; (c) strain gauges at steel shape.
Buildings 14 02208 g005
Figure 6. (a) Failure patterns of R-1; (b) failure patterns of S-1.
Buildings 14 02208 g006
Figure 7. (a) Hysteretic loop of R-1; (b) hysteretic loop of S-1.
Buildings 14 02208 g007
Figure 8. Stiffness degradation.
Buildings 14 02208 g008
Figure 9. (a) Hysteretic damping ratio; (b) accumulative energy dissipation.
Buildings 14 02208 g009
Figure 10. (a) Deformation of R-1; (b) deformation of S-1.
Buildings 14 02208 g010
Figure 11. Model configuration.
Buildings 14 02208 g011
Figure 12. (a) Comparison between tested and calculated results of R-1; (b) comparison between tested and calculated results of S-1.
Buildings 14 02208 g012
Figure 13. (a) Axial load; (b) steel ratio; (c) strength of prefabricated concrete; (d) strength of cast-in-place concrete; (e) ratio of longitudinal rebar in boundaries; (f) loading conditions.
Buildings 14 02208 g013
Table 1. Test parameters.
I.D.TypeAspect RationSteel ShapeRebar Connecting
R-1CIP2.00.35HN100 × 50 × 5 × 7Y
S-1P2.00.35HN100 × 50 × 5 × 7N
Note: “n” denotes the test axial compression ratio; “CIP” denotes cast-in-place specimen; “P” denotes prefabricated specimen; “Y” denotes the panel rebar is connected; “N” denotes that the panel rebar is unconnected; “HN100 × 50 × 5 × 7” denotes that the width and thickness of the steel flange are 50 mm × 7 mm, and the height and thickness of the steel web are 100 mm × 5 mm, respectively.
Table 2. Material properties.
SteelGraded or t/mmfy/MPafu/MPaδ/%Es/MPa
RebarHPB3006453.21602.2521.832.10 × 105
HRB4008462.12627.1817.262.05 × 105
HRB40010476.62642.4718.622.10 × 105
HRB40014439.87593.9328.732.00 × 105
Steel shapeQ3555458.02543.5015.232.06 × 105
Q3557433.40575.4515.102.05 × 105
Throat connectorQ3554477.23532.2815.882.05 × 105
Note: d denotes the diameter of rebar; t denotes the thickness of the steel plate; fy denotes the yielding strength; fu denotes the ultimate strength; δ denotes elongation; Es denotes the modulus of elasticity of steel.
Table 3. Test results.
Specimen
ID
Loading DirectionPcr
/kN
Δcr
/mm
θcrPy
/kN
Δy
/mm
θyPm
/kN
Δm
/mm
θmPu
/kN
Δu
/mm
θu
R-1Push280.003.130.16%525.919.950.50%621.1114.180.71%541.5521.431.07%
Pull300.003.220.16%522.839.040.45%612.3612.330.62%520.5119.150.96%
AVG290.003.180.16%524.379.490.47%616.7313.250.66%531.0320.291.01%
S-1Push260.002.630.13%564.0610.800.54%660.6917.970.90%561.5924.691.23%
Pull280.003.000.15%544.8110.010.50%633.6515.030.75%538.6017.680.88%
AVG270.002.820.14%554.4310.410.52%647.1716.500.83%550.0921.191.06%
Note: Pcr, Δcr, and θcr are the cracking load, displacement, and drift ratio; Py, Δy, and θy are the yielding load, displacement, and drift ratio; Pm, Δm, and θm are the maximum load, displacement, and drift ratio; Pu, Δu, and θu are the failure load, displacement, and drift ratio.
Table 4. Comparisons between tested and numerical results.
IDPms
/kN
Pm
/kN
Pms/PmPus
/kN
Pu
/kN
Pus/PuΔms
/mm
Δm
/mm
Δmsmξms
/%
ξm
/%
ξms/ξmξus
/%
ξu
/%
ξus/ξu
R-1560.08616.730.91503.47541.550.9316.3213.251.235.345.061.0616.0816.630.97
S-1559.79647.170.86549.10550.091.0017.8016.501.085.646.560.867.559.560.79
Note: Pms is the simulated peak load; Pus is the simulated load when the specimen failed; Δms is the simulated displacement when the peak load is reached; ξms is the simulated hysteretic damping ratio when the peak load reached; ξm is the tested hysteretic damping ratio when the peak load reached; ξus is the simulated hysteretic damping ratio when the specimen failed; ξu is the tested hysteretic damping ratio when the specimen failed.
Disclaimer/Publisher’s Note: The statements, opinions and data contained in all publications are solely those of the individual author(s) and contributor(s) and not of MDPI and/or the editor(s). MDPI and/or the editor(s) disclaim responsibility for any injury to people or property resulting from any ideas, methods, instructions or products referred to in the content.

