Abstract
Basements are integral to contemporary building design, serving as foundational structures with diverse functions in residential and commercial constructions. The utilization of wood as a natural, economical, and CO2 storage material for basement construction significantly influences the future of construction, necessitating established concepts to guarantee sustainability, and foremost, avoid possible damages induced by moisture intrusion. This paper explores the hygrothermal performance of a wooden basement when subjected to severe indoor and outdoor climates and in the absence of pressuring groundwater. Using both 1D and 2D numerical simulations, this study conducts risk analyses for several cases to evaluate how the wooden basement behaves under critical conditions, such as moisture accumulation in the assembly due to air convection through a gap in the insulation layer, air leakage through the waterproofing membrane, and high-vapor pressure caused by the high moisture load in the indoor space. The thresholds are determined for the initial wood moisture and indoor relative humidity, under which supports are given for the use of wooden elements in the basement structures, exhibiting satisfactory performance and avoiding wood decay in the construction. Additionally, the impact of the waterproofing membrane on avoiding wood decay in the assembly is highlighted.
1. Introduction
A common structure type that has been used in both residential and public buildings is the basement, which serves as a partition between the indoor atmosphere and the encompassing soil. In the past, due to the cool summer and mild winter conditions, basements held significant value for the storage of food, supplies, and other perishable goods. However, the function and design of basements have considerably evolved in recent years. Today, with population growth and advancements in construction techniques, there is a growing interest in utilizing basement spaces much like the rest of the household.
Several aspects, including structural integrity, energy efficiency, moisture distribution, and waterproofing, should be considered when investigating a building intended as a living space [1]. Particularly in a basement structure, the latter two aspects need to be evaluated to detect signs of moisture infiltration and assess the effectiveness of waterproofing measures to prevent moisture damage and mold growth. These assessments are parts of hygrothermal analysis and strongly depend on the layers used in the structure. Among different materials, concrete has been a popular choice for basement construction due to its durability, load-bearing capacity, and moisture resistance [2]. Nevertheless, the substantial carbon footprint associated with concrete poses a significant environmental concern [3,4]. To address this issue, it is imperative to seek alternatives that are sustainable and environmentally friendly. Among the available options, wood emerges as a promising choice due to its renewability, low carbon footprint, environmental sustainability, and aesthetic appeal. Wooden structures offer versatility and superior insulation properties, making them well-suited for various applications, including basement construction. Despite these advantages, however, designing and constructing wooden basements present unique challenges such as moisture accumulation, which can lead to decay, mold growth, and compromised structural integrity [5].
Several studies have investigated both the thermal and hygrothermal performances of concrete basements [6,7,8,9]. A summary of the literature reviewed in these fields is provided in Table 1 and the most recent publications are described in the following. Fedorik et al. [10] numerically simulated the hygrothermal performance of concrete basement walls built in different decades. The results showed that using capillary-active materials to enable inward drying is an effective solution for retrofitting, but only a limited thickness of interior insulation should be applied, as resistance to vapor diffusion and capillary transport increases with material thickness. In a comprehensive study, Asphaug et al. [11] identified ten key challenges that should be included in national moisture control strategies for habitable basements in cold-climate countries in Western regions. The study’s findings revealed that the ten key challenges are emphasized differently in the five cold-climate countries, although having notable similarities in recommendations. In another extensive review, Asphaug et al. [12] summarized the latest state-of-the-art methodologies to specify exterior hygrothermal boundary conditions for the hygrothermal simulation of below-grade basement structures. The review highlighted the lack of thorough validation of hygrothermal simulations and the inadequacy of current hygrothermal simulation tools to replicate real-world hygrothermal conditions in basement envelopes accurately. Asphaug et al. [13] conducted laboratory experiments to investigate how the permeability of thermal insulation and the position of the dimpled membrane within the assembly affects the outward drying process of concrete walls. The outcomes of the study revealed that the concrete’s ability to transport moisture to the drying surface was more important than the vapor permeability of the insulation and the membrane position. In another study, Asphaug et al. [14] used numerical simulations to investigate the use of vapor-permeable thermal insulation and the impact of air gaps behind dimple membranes on the outward drying of concrete basement walls. The findings showed that in addition to the position of the membrane, the interior relative humidity (RH) is influenced by both the thickness of insulation used in the wall assembly and the characteristics of the concrete.
On the one hand, the literature review reveals that among the research works that have investigated the hygrothermal performance of concrete basements, there is a lack of thorough investigation of hygrothermal simulations validated with measurements. On the other hand, by reviewing the literature, one can realize that almost all publications have focused on the hygrothermal analysis of concrete basements and the challenges related to wooden basements have not been addressed in previous studies. The only article that has comprehensively investigated this subject is the recent paper published by Rahiminejad et al. [15], in which the long-term performance of a wooden basement is examined using in-field measurements and numerical simulations. However, the performance analysis of wooden basements under critical conditions is not thoroughly included in that paper. The main objective of this article is to provide a complete set of analyses on the understanding of how the wooden element in the basement reacts to critical conditions that may occur during the operation of the building. To achieve this objective, numerical models are employed to assess the performance of a wooden basement in a reference building in long-term exposure to vulnerable circumstances. Particularly, the probability of wood decay is explored assuming different parameters and various indoor conditions.

Table 1.
Summary of the literature reviewed for hygrothermal analysis of basements.
Table 1.
Summary of the literature reviewed for hygrothermal analysis of basements.
| Author | Load-Bearing Material Used in the Basement | Main Objective | Main Outcome |
|---|---|---|---|
| Maref et al. (2001) [16] | Concrete | Analysis of the thermal resistance of exterior basement insulation systems by developing a three-dimensional numerical model verified using experimental measurements. | The utilization of the 3D model demonstrated an improved ability to evaluate the long-term thermal resistance of the insulation systems employed in the research. |
| Swinton et al. (2006) [17] | Concrete | Study of the actual thermal performance of two concrete basement walls. | The thermal performance remained consistently stable, with either equivalent or improved performance observed in the second heating season. |
| Emery et al. (2007) [18] | Concrete | Comparison of the insulated and non-insulated basements through a series of measurements. | A modest amount of insulation could lead to a significant reduction in annual heat loss, approximately by 50%. |
| Künzel et al. (2008) [6] | Concrete | Investigation of the moisture dynamics of concrete cellar walls with interior insulation. | Internal drying potential increases notably when using a moisture-adaptive vapor barrier. |
| Straube (2009) [7] | Concrete | Study of the hygrothermal performance of concrete basement walls with different interior insulation systems. | There was a discrepancy between simulations and measurements, possibly due to factors such as air leakage, vapor diffusion, and other variables. |
| Saber et al. (2012) [19] | Concrete | Study of the thermal response of basement wall systems with low-emissivity material and furred airspace. | The wall with a furred-airspace assembly could yield energy savings of approximately 17% in comparison with walls lacking the furred airspaces. |
| Pallin (2013) [8] | Concrete | Hygrothermal simulations of a concrete basement wall with a focus on investigating the impacts of outward drying. | If there is a favorable drying condition, only a minimal amount of precipitation would penetrate the insulation or drainage board. |
| Goldberg and Harmon (2015) [9] | Masonry block | Evaluation of the hygrothermal performance of retrofitted hollow masonry block foundations with thermal insulation in cold-climate conditions. | The differences in wall temperature between the measured and simulated data decreased with increasing distance from the foundation slab. |
| Fedorik et al. (2019) [10] | Concrete | Simulation of the hygrothermal conditions inside three concrete basement walls built in different decades. | Using capillary-active materials to enable inward drying is an effective solution for retrofitting. |
| Asphaug et al. (2020) [11] | Concrete | Identification of ten key challenges essential for inclusion in national moisture control strategies for habitable basements in cold-climate Western regions. | The ten key challenges are emphasized differently across the five cold-climate countries despite notable similarities in recommendations. |
| Saaly et al. (2020) [20] | Concrete | Study of the effects of freeze-thaw cycles on the heat transfer properties of a concrete basement. | Adding insulation layers to the basement walls and floor slab resulted in a significant reduction of approximately 60% in energy loss. |
| Asphaug et al. (2021) [12] | Concrete | Review of the latest state-of-the-art methodologies to specify exterior hygrothermal boundary conditions for hygrothermal simulation of below-grade basement structures. | The review highlighted the lack of thorough validation of hygrothermal simulations and the inadequacy of hygrothermal simulation tools to replicate real-world hygrothermal conditions in basement envelopes accurately. |
| Asphaug et al. (2022a) [13] | Concrete | Experiments study to see the impact of the permeability of thermal insulation and the position of the dimpled membrane on the outward drying process of concrete walls. | The concrete’s ability to transport moisture to the drying surface was more important than the vapor permeability of the insulation and the membrane position. |
| Asphaug et al. (2022b) [14] | Concrete | Numerical simulations to evaluate the use of vapor-permeable thermal insulation and the impact of air gaps behind dimple membranes on the outward drying of concrete basement walls | In addition to the position of the membrane, the interior relative humidity (RH) is influenced by both the thickness of insulation used in the wall assembly and the characteristics of the concrete. |
| Rahiminejad et al. (2024) [15] | Wood | Long-term performance analysis of a wooden basement using in-field measurements and numerical simulations. | The applicability and reliability of long-term use of wooden elements in the basement structure. |
2. Methodology
2.1. Reference Building
2.1.1. Layout
The exterior of the wooden building taken as the reference building in this research is shown in Figure 1a. By using wood for all structural components, a total of 222 tons of CO2 emissions were avoided, with the basement alone accounting for a reduction of 126 tons. In addition to its environmental benefits, the use of wood significantly shortened the construction timeframe, nearly halving the duration compared to conventional methods. The basement of the building is made of cross-laminated timber (CLT) panels and extruded polystyrene (XPS) insulation layers (Figure 1b). A thin layer of a vapor-tight membrane consisting of ethylene-propylene-diene monomers (EPDM) separates the XPS and CLT layers. A key challenge was ensuring the wood in the basement tolerates critical indoor conditions. To address this, the structurally necessary layers in the wall and floor were carefully modeled, and various critical scenarios are considered in this research.
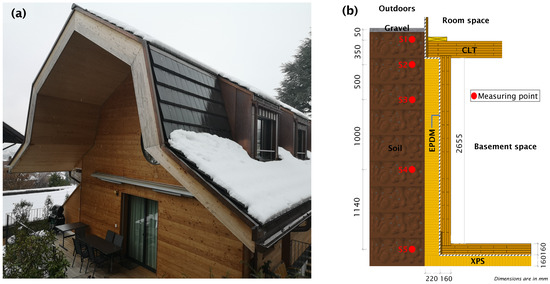
Figure 1.
Reference building used for hygrothermal performance analysis of the wooden basement: (a) Outside view; and (b) schematic of the layers used in the basement with the sensor locations.
2.1.2. Data Monitored
Detailed descriptions of the measuring campaign and model validation were provided by Rahiminejad et al. [15] and are not repeated here. The temperature and relative humidity measured at different depths of the soil are shown in Figure 2a,b. The weather data collected from the weather station close to the reference building are plotted in Figure 2c,d [21].
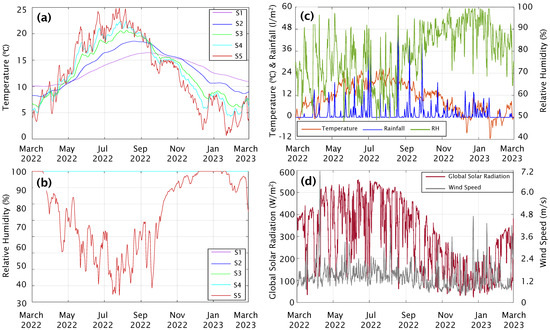
Figure 2.
Collected data used for numerical simulations: (a) Temperature measured in the soil; (b) relative humidity measured in the soil; (c) outdoor temperature, relative humidity, and rainfall; (d) solar radiation and wind speed (see Figure 1 for abbreviations in the legends).
2.2. Research Procedure
The steps of the conducted research are schematically summarized in Figure 3. The first three steps have already been elaborated in the paper by Rahiminejad et al. [15]. After monitoring the hygrothermal performance of the basement in the reference building, the numerical model of the basement was generated and validated against the measured data. The long-term performance of the structure under typical conditions was then analyzed using the numerical model.
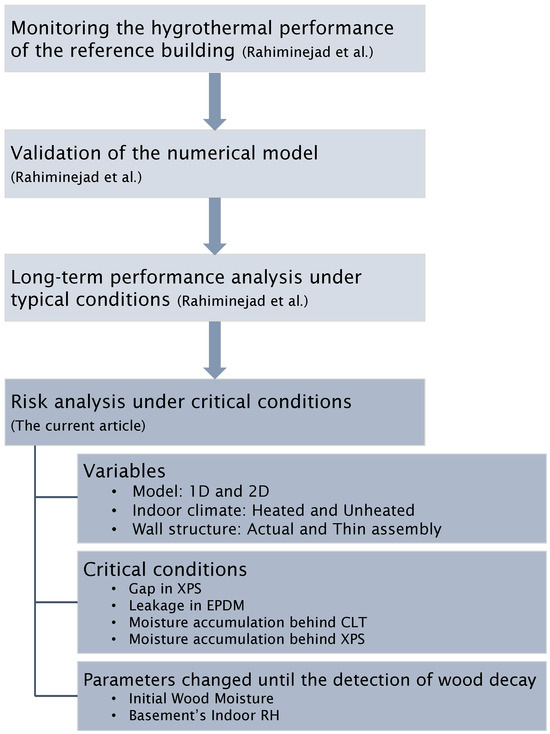
Figure 3.
Flowchart of the research procedure.
In the next step, which is the content of the present paper, risk analysis is performed under critical conditions by utilizing both 1D and 2D simulations. The former method is used to conservatively evaluate the system under critical circumstances. The latter method is employed to pragmatically model the system closer to the real conditions. Risk analyses are conducted by subjecting the models to heated and unheated basements with different indoor conditions. Two wall structures are assumed, one with the actual thickness of XPS layers and the other with the XPS thickness reduced until the U-value of the assembly meets the maximum value permitted by the Swiss Standard SIA 380/1:2016 [22]. Accordingly, the two wall assemblies are named hereafter the “Actual Assembly” and “Thin Assembly”, respectively. Two parameters, i.e., the initial wood moisture (IWM) in the CLT layer and the basement’s indoor RH, are changed to find the threshold at which the structure fails in terms of decay in the cold side of the wooden element.
2.3. Assessment Criterion
The performance of wooden components in the basement is assessed according to the guidelines provided by the International Association for Science and Technology of Building Maintenance and Monuments Preservation (WTA) for evaluating humidity in timber constructions. The construction is evaluated concerning wood-destroying fungi following the WTA standards for solid wood products (WTA 6-8-2016) [23] (Zirkelbach [24]). The standard expresses that the average daily relative humidity of the air within the most critical 10 mm of the product should not surpass 95% at 0 °C and 86% at 30 °C. Accordingly, a thickness of 10 mm on the exterior side of the CLT elements in the basement is selected, and the timely evolution of pore air relative humidity versus temperature is checked for the entire duration of the simulations. It should be noted that all other assessment criteria, including numerical quality of the results, total moisture content, material layer-by-layer moisture content, runoff water, and mold growth on the interior side of the assembly, have been thoroughly investigated by Rahiminejad et al. [15]. Therefore, the analysis of these criteria is not elaborated on in this article.
2.4. Scenarios Simulated
2.4.1. One-Dimensional Model
The flowchart of the procedure followed for the 1D risk analysis is illustrated in Figure 4. As mentioned by Kukk et al. [25], the most critical locations in a CLT assembly are structural joints where water is absorbed in the longitudinal fiber direction from the cut edge of the panel, and moisture content can increase by up to 30%. Therefore, the initial wood moisture of CLT layers in the basements with both heated and unheated indoor spaces is set to start from 30%. Sinusoidal curves in the heated space and constant values in the unheated space are assumed for both indoor temperature and relative humidity. The details of the profiles used for the parameters will be described in Section One-Dimensional Model (described in Section 2.6.2). After conducting the simulation, the possibility of wood decay in the CLT element is assessed. In the event of decay, the initial wood moisture is subsequently reduced, and the simulation is then repeated with the updated initial wood moisture. If wood decay does not occur, the initial wood moisture remains fixed. As the next step, the mean indoor RH in the heated space, along with the constant RH value in the unheated space, is increased. The simulations are then executed using these elevated RH values until wood decay occurs in the assembly. In the event of decay, the preceding mean RH in the heated space or the constant RH in the unheated space is maintained, and the loop of simulations concludes. Therefore, as a result of this procedure, the maximum initial wood moisture in the CLT and the maximum indoor relative humidity that prevents wood decay in the basement are determined.
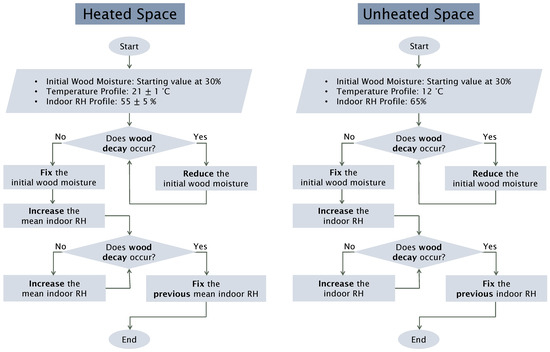
Figure 4.
Flowchart of the procedure followed for the 1D risk analysis.
It should be noted that the reason to intentionally increase indoor RH is to create a counteracting pressure against the high vapor pressure deriving from the soil, and consequently, make a critical situation for the basement by hindering the structure to dry out inwards. This scenario mimics conditions found in basements with elevated moisture content due to factors such as poor ventilation, insufficient dehumidification, or the practice of drying laundry indoors.
As mentioned in Section 2.2, two wall structures are assumed for the basement, i.e., Actual Assembly and Thin Assembly. The thickness of the XPS layer in the Actual Assembly is 220 mm, while in the Thin Assembly, it is reduced to 90 mm for a basement with a heated space and 55 mm for a basement with an unheated space. The values for the wall structures with a Thin Assembly are determined based on the maximum U-value established by the Swiss Standard SIA 380/1:2016 [22]. According to the norm, the maximum accepted U-value of the elements in the building envelope for heated basements is 0.25 W/m2·K. For unheated basements, the standard stipulates an adjustment of the U-value based on indoor temperature, with a 5% increase for a unit temperature difference. Taking the reference indoor temperature as 20 °C (SIA 380/1:2016 [22]) and assuming an indoor temperature of 12 °C for the unheated basement (see Section One-Dimensional Model (described in Section 2.6.2)), the corresponding U-value of the construction in the unheated basement becomes equal to 0.35 W/m2·K.
After identifying the two wall structures, various scenarios are considered for the 1D risk analysis. The descriptions of the ten scenarios defined for the Actual Assembly and the four scenarios specified for the Thin Assembly are provided in Figure 5. Considering limitations in a 1D model, the presence of a gap in the XPS and/or the presence of a leakage in the EPDM membrane are modeled in the Actual Assembly by eliminating the corresponding material from the geometry. The inevitable fine leaks that remain in the walls may cause a convective transport of moisture in the interior air to the cold sides of the structure (Künzel [26]). Moreover, moisture accumulation could occur on the cold sides of the layers due to the precipitation penetrating the soil and transmitting through possible leakages in the layers. Therefore, the models incorporate the occurrence of moisture accumulation both due to the air convection from indoors with a high moisture load seeping through cracks in the CLT/EPDM/XPS, and/or moisture transmission from the soil towards the interior parts of the assembly. These phenomena are represented in the models by changing the position of the moisture source in different cases. It is important to note that these scenarios are designed to replicate worst-case conditions in the basement, and their real-world occurrence is not typically expected, especially if the wall structure is properly constructed in terms of the water tightness of the layers. Accordingly, the scenarios in Figure 5a are designed so that the probability of the case occurrence decreases as the case number increases.
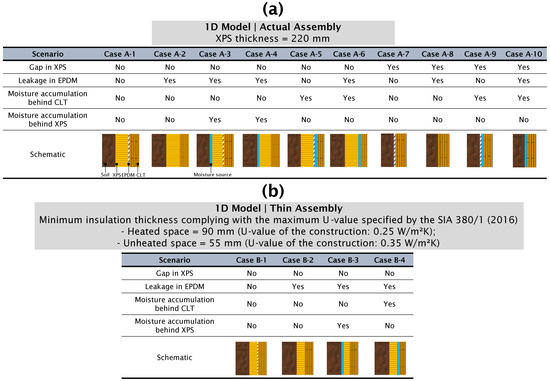
Figure 5.
Description of the cases used for the 1D risk analysis: (a) Actual Assembly and (b) Thin Assembly.
A similar approach is followed for the wall structure with a Thin Assembly (Figure 5b). In this case, however, the presence of a gap in the XPS is not considered since it is assumed that the wall always benefits from the minimum thickness of the insulation material. Moreover, except for Case-B1, which serves as the reference case, it is assumed that the EPDM membrane always has a leakage; therefore, that layer is not modeled in the remaining cases analyzed for the Thin Assembly.
2.4.2. Two-Dimensional Model
In reality, there exist multiple gaps between the XPS panels which are created during the installation process. Depending on the workman’s execution, the thickness of the gaps may vary from less than 1 mm to more than 5 mm. While 1D simulations offer an overview of the system’s performance, it is essential to consider that the wall is not uniformly pristine or entirely compromised. In other words, it is not accurate to assume that the structure is either completely filled with insulation or is entirely devoid of gaps in the XPS, cracks in the CLT, or leaks in the EPDM membrane. Instead, the reality involves localized airspaces or minor leaks in specific areas of the structure. Therefore, to further analyze the impact of these small gaps on the hygrothermal performance of the assembly, a 2D model is needed that takes into account the diffusion and convection of moisture in both horizontal and vertical directions.
In total, eight cases are defined for the 2D risk analysis in the basement with the Actual Assembly and the Thin Assembly as described in Figure 6b,c. The scenarios for the 2D risk analysis are wisely defined based on the results of the 1D risk analysis (see Section 3.1 and Section 3.2). Accordingly, only heated space is evaluated for 2D analysis since, based on the 1D simulation results, the unheated space did not show a failure in the system under the conditions applied (see Section 3). Moreover, since the distance between the cutoff planes in the XPS layer is large enough compared to the thickness of the gaps (with a ratio of more than 10 times), no physical interaction is expected between the gaps distributed vertically, i.e., the impact of one gap on the other is negligible; therefore, only one gap is modeled in this part of the study that is positioned in the middle height of the XPS. As shown in Figure 6a, two cases are assumed for the material in the gap; it is either filled with the soil or with the sealed air. The gap filled with the soil corresponds to a conservative condition where it is assumed that the soil has thoroughly penetrated the gap, while the gap filled with the sealed air represents a condition closer to reality. However, since the pressure from the soil might push it to enter the gap, the actual condition is expected to be roughly between the two cases. To investigate the impact of the gap size on the results, four values, including 1, 2, 4, and 5 mm for the gap filled with the soil, are considered. For the gap filled with the sealed air, however, only one size of 5 mm is assumed to compare the results with the corresponding case in which the gap is filled with the soil. The mean indoor RH is also changed from 55% to 80% for the model with a 5 mm gap. For the other cases, the mean indoor RH is set to 80%.
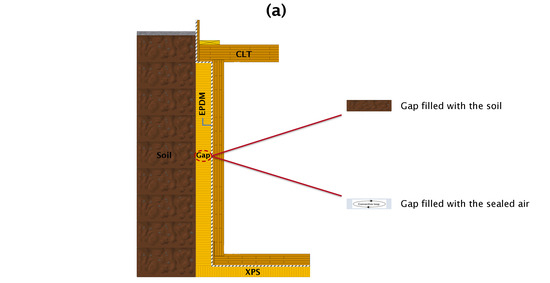
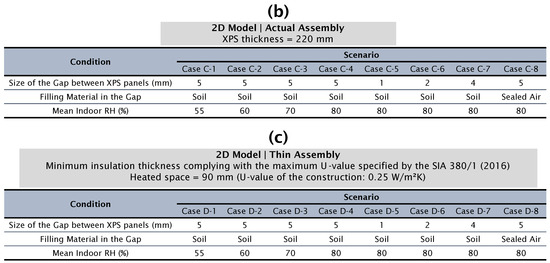
Figure 6.
(a) Schematic of the model used for the 2D risk analysis; (b) description of the cases with Actual Assembly; and (c) description of the cases with Thin Assembly.
2.5. Model Preparation
The transient coupled heat and moisture transfer in the building assembly is modeled using WUFI® Pro 6.7 and WUFI® 2D 4.4 developed by Künzel [27] and validated for different building types [28,29]. The software uses finite volume or finite difference methods to discretize these coupled PDEs and solve them numerically. The computational domain (e.g., a wall assembly) is divided into small control volumes, and the equations are solved iteratively to simulate the transient heat and moisture transport.
2.5.1. Geometry and Mesh Generation
An overview of the geometry generated in WUFI® 2D for the basement in the reference building is illustrated in Figure 7. The entire model is presented in Figure 7a. The depth of the soil is extended in the model to apply a proper boundary condition on its lower surface (will be discussed in Section Two-Dimensional Model (described in Section 2.6.2)). A closer look to the layers modeled for the basement is provided in Figure 7b. A part of the model used for the 1D simulations in WUFI® Pro is indicated in Figure 7c. In WUFI®, the mesh can be adjusted in terms of its granularity, which refers to the level of detail in the simulation. Meshes can be described as coarse, medium, and fine. The choice between a coarse or fine mesh depends on the specific requirements of the simulation, including the level of detail needed, the complexity of the geometry, and the available computational resources. Fine meshes are typically used for more precise simulations, especially around the interface between materials with different hygric properties, whereas coarse meshes might be sufficient for preliminary analyses or less complex problems. As shown in Figure 7d, a fine mesh is generated for the model to achieve a high level of accuracy and adequate reliability for numerical calculations.
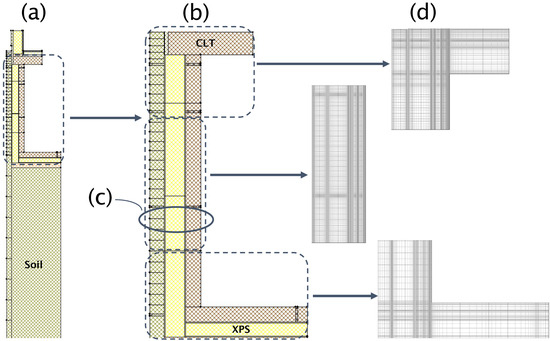
Figure 7.
(a) Entire geometry of the 2D model generated in WUFI® 2D; (b) geometry of the basement; (c) part of the geometry used for the 1D simulations; and (d) grids generated for different parts of the geometry.
2.5.2. Material Properties
A summary of the hygrothermal parameters considered for the layers used for simulations is provided in Table 2. The characteristics of the CLT, XPS, and EPDM layers are taken based on the datasheet information provided by the manufacturers [30,31,32]. The material assigned for the soil is based on the information from the onsite geological analysis [33].
Table 2.
Summary of hygrothermal properties of the main materials used for numerical simulations.
The μ-values of the CLT used in the reference building are obtained by assuming a linear correlation between the density of the CLT used in the reference building and the Stora Enso CLT as the original material provided by the WUFI® program [34,35]. The values are listed in Table 3.
Table 3.
Water vapor diffusion resistance factors (μ-value) of the CLT used in the reference building.
The water content of the CLT in kg/m3 in the hygroscopic region is calculated by multiplying the wood moisture by the dry density of the material [36,37]. The values available in the WUFI® database are used for the CLT water content in the capillary region (Table 4).
Table 4.
Water contents of the CLT used in the reference building.
2.6. Simulation Setup
2.6.1. Initial Conditions
The starting temperature is set to 20 °C. The initial RH for soil segments neighboring the wall and floor sections is configured at 99% [38]. As was explained in Section 2.4.1, the initial wood moisture for CLT in the 1D risk analysis starts from 30% and decreases to the value when wood decay occurs on the cold side of the CLT element. Considering the results of the 1D simulations (see Section 3.1 and Section 3.2), the initial wood moisture is kept constant, equal to 20% for all 2D cases.
2.6.2. Boundary Conditions
One-Dimensional Model
The schematic of the boundary conditions used in the 1D model is illustrated in Figure 8. The adiabatic boundary condition is considered for the upper and lower surfaces. The values of measured temperature and RH at a depth between 1000 and 1140 mm (see Figure 1) are used as the boundary conditions on the left side of the model. Regarding the basement’s indoor space, two possibilities are considered: either a heated space or an unheated space. As shown in Figure 8, in the heated space, sinusoidal curves are assumed for both temperature and RH of the air in the basement, while in the unheated space, a constant value is considered for both parameters. In the heated space, the mean value of RH starts from 55% and increases up to the value that wood decay occurs (see Section 2.4.1). The starting mean value of RH in the heated space (55%) represents the high moisture load in living indoor spaces [39,40]. The indoor temperature in all scenarios simulating the heated space follows a sinusoidal curve with a mean value of 21 °C and amplitude of 1 °C. For the unheated space, the starting constant values of RH and temperature are assumed equal to 65% and 12 °C, respectively. The values considered for the unheated space assume a basement with a higher U-value in the wall structure adjacent to the soil compared to the ceiling assembly in the vicinity of the room space, which consequently is further affected by the outdoor temperature than the temperature in the room space [41]. Similar to the heated space, while keeping the temperature value unchanged, the constant value of RH increases until the sign of wood decay is seen. To model moisture accumulation on the cold sides of the CLT or XPS, a moisture source is placed on the cold sides behind the CLT or XPS. A weak degree of airtightness of the building is assumed with an envelope infiltration equal to 5 m3/(m2·h) [26].
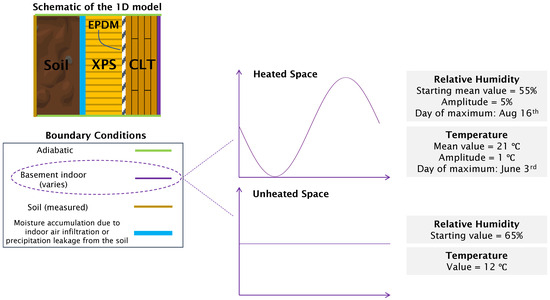
Figure 8.
Schematic of the boundary conditions applied for risk analysis using the 1D model.
Two-Dimensional Model
The boundary conditions used in the 2D model are presented in Figure 9. As mentioned in Section 2.4.2, in this part, only heated space with the indoor conditions specified in Figure 8 is considered. For the vertical surface exposed to the outdoor climate, the heat transfer coefficient equal to 17 W/m2K is considered which includes long-wave radiation parts (i.e., external wall), the short-wave radiation absorptivity of 0.6 (i.e., gray medium hue DIN 4108-3:2014 [42]), and a standard value of 0.2 for the ground short-wave reflectivity. On the ground surface, the heat transfer coefficient of 19 W/m2K is applied with a short-wave radiation absorptivity of 0.5 (i.e., generic model) and a standard value of 0.2 for the ground short-wave reflectivity. The soil beneath the floor section is extended downwards to properly apply a constant temperature at that depth [43,44]. A high value is considered for the heat transfer coefficient of the soil surfaces which represents a basement assembly (WUFI® manual). As described in Section 2.4.2, to model the gaps between the XPS panels, two possibilities are assumed: gaps filled with the soil or with sealed air. For the former, the soil with similar properties used for the layer adjacent to the XPS is placed in the gap. For the latter, the sealed air is assumed in the gap with effective hygrothermal properties as explained in the Appendix A.
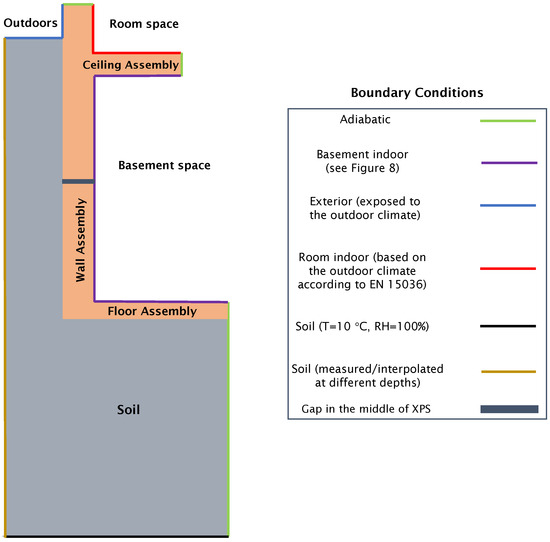
Figure 9.
Schematics of the boundary conditions applied for risk analysis using the 2D model considering the presence of a gap in the middle of XPS (see Figure 1 for dimensions).
2.7. Computational Parameters
The simulations start on the first day of October, which is usually the most critical case since the component absorbs moisture in the following winter months before possible drying occurs in spring. The calculation period depends on when the construction reaches its dynamic equilibrium. For the risk analysis in 2D, a period of 6 years was sufficient, and based on the results, the dynamic equilibrium was reached. For the risk analysis in 1D simulations, however, the period of simulations is extended to 9 years to ensure the quasi-steady behavior of the results. The time step is set to 3600 s. The default settings in the software are used for other computational parameters.
3. Results
The results of the risk analysis are provided in this section. First, the simulations performed in 1D for the Actual Assembly are discussed. Thereafter, the evaluations carried out for the 1D model of the Thin Assembly are presented. In the last two parts, the performance of the 2D model with an Actual Assembly and a Thin Assembly under critical conditions are analyzed. The plots in this section present the wood decay assessment in the structure under different conditions specified in Section 2.4. Accordingly, the profiles of temperature vs. pore air relative humidity during the entire duration of the simulation are plotted, starting from the first year with a green color and ending in the final year with a black color. To avoid over-cluttered plots, the results of the scenarios with no specific information are skipped to be presented in the figures.
3.1. One-Dimensional Model with Actual Assembly
3.1.1. Heated Space
As described in Section 2.4.1, 10 cases are defined for risk analysis of the basement with an Actual Assembly. The plots in Figure 10 show the results for individual cases. The initial wood moisture applied to the CLT element starts at 30% and is reduced until the profile of the pore air relative humidity in the material as a function of the temperature surpasses the limiting moisture WTA curve (see Section 2.3). Based on the results, the maximum initial wood moisture for Cases A-1 to A-6, in which there is no gap in the XPS (the insulation layer is included in the model), is equal to 20%. In these cases, the CLT element dries out over the period of simulations, and wood decay does not occur. The plots also reveal that the presence of a moisture source on the cold sides of the CLT and XPS has a negligible impact on the drying potential of the wooden material. Moreover, the results indicate a difference in the ending value of the pore air relative humidity of the CLT between the cases with and without EPDM membrane, e.g., Case A-1 and Case A-2, in which the former dries out to a slightly lower value. If a gap is present in the XPS and there is no leakage in the EPDM membrane, the maximum initial wood moisture at which wood decay does not occur in the structure decreases to 15%, as can be seen from the graphs of Case A-7 and Case A-9. Under this condition, the plots show increasing trends in the profiles, although they do not reach the limiting curves. As shown in the plots of Case A-8 and Case A-10, in the event of a leakage in the waterproofing membrane in a wall assembly without an insulation layer, the structure is not able to resist the wood decay even at lower initial wood moisture in the CLT. In these cases, the pore air relative humidity increases over time and exceeds the limiting curve after 9 years. Therefore, removing the EPDM layer from the assembly with no insulation layer would cause wood decay with a high probability, even under the condition that dry CLT layers are installed at the construction stage.
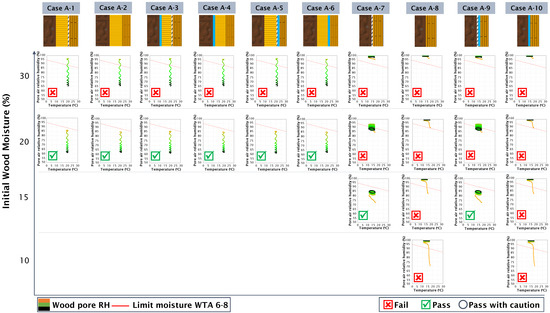
Figure 10.
Risks of wood decay based on the initial wood moisture for the 1D Actual Assembly with a heated space (the mean indoor RH is 55%).
In the next step, based on the fixed values of the initial wood moisture in the CLT obtained in the previous part for each case, the mean indoor RH gradually increases to determine its maximum value until a sign of wood decay is seen in the assembly. Therefore, as indicated at the bottom of the plots in Figure 11, the initial wood moisture is set to 20% for Cases A-1 to A-6, and 15% for Cases A-7 and A-9. According to the results in Figure 11, the mean indoor RH can reach up to 80%, corresponding to the absolute humidity of 14.6 g/m3 in the structures of Case A-1 to Case A-6 while no decay in the CLT element happens. In the event of removing the insulation layer from the assembly, i.e., the presence of a gap in the XPS, and assuming that there is no leakage in the EPDM membrane, the results of Case A-7 and Case A-9 in Figure 11 reveal that the mean indoor RH that provides a safe condition with no wood decay in the CLT is 55% while increasing the RH value to 60% might still work with caution of reaching the limiting curve towards the end of the simulation period. In these cases, the counteracting vapor pressure from indoors against the vapor pressure from the soil is not damped in the structure, and consequently, the CLT does not dry out, and the pore air relative humidity continuously increases over the duration of the simulations.
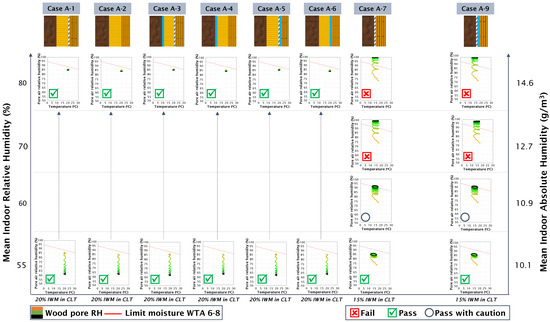
Figure 11.
Risks of wood decay based on the mean indoor relative humidity for the 1D Actual Assembly with a heated space.
3.1.2. Unheated Space
The results of the 1D risk analysis for an Actual Assembly with an unheated space are presented in Figure 12. Based on the plots, except for the assemblies with a gap in the XPS and a leakage in the EPDM, i.e., Case A-8 and Case A-10, the structures in all other cases do not show signs of wood decay with 20% of initial wood moisture in the CLT. Comparing structures with no insulation layer and no leakage in the waterproofing membrane (i.e., Case A-7 and Case A-9) in the heated space and unheated space, the results show that the upper limit of the initial wood moisture in the latter space increases from 15% to 20%. However, as can be seen in the plots of Case A-8 and Case A-10, in the event of a leakage in the EPDM membrane, the structure fails in terms of wood decay even at low initial moisture content in the CLT. This behavior is similar to the corresponding cases in the basement with a heated space, which confirms the necessity of installing the EPDM membrane in the assembly, particularly in the vicinity of the regions with the lack of insulation materials.
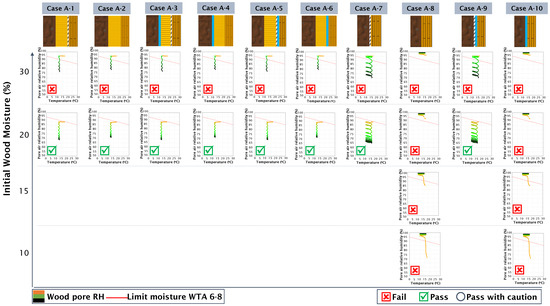
Figure 12.
Risks of wood decay based on the initial wood moisture for the 1D Actual Assembly with an unheated space (the indoor RH is 65%).
Considering an initial wood moisture of 20% in the CLT for all cases, further risk analysis is performed by increasing the relative humidity of the indoor space. As described in Section One-Dimensional Model (described in Section 2.6.2), the values of the indoor RH for the unheated space are kept constant over the duration of the simulations. According to the results provided in Figure 13, the CLT in all cases dries out even at high indoor RH equal to 85%, corresponding to an absolute humidity of 9 g/m3. In contrast to the heated space, where the pore air relative humidity in the CLT layer in Case A-7 and Case A-9 showed an increasing trend, the plots in Figure 13 reveal that the wooden element in the unheated space dries out over the duration of the simulation. This, alternatively, means that the basement, even with no insulation layer, but having an unheated space, can resist a higher initial moisture content in the wooden material compared to the heated space. The reason is attributed to the combination of the indoor temperature and indoor RH that creates a lower moisture content in the indoor air of the unheated space compared to the heated space, which, consequently, reduces the indoor vapor pressure, and, therefore, provides an opportunity for the component to dry out inwards. As a result, less indoor vapor pressure counteracts the vapor pressure derived from the soil; thus, the structure experiences a lower resistance to release its moisture. Therefore, the unheated space shows a higher potential for keeping the wooden basement dry under critical conditions compared to the heated space if no air exchange is assumed.
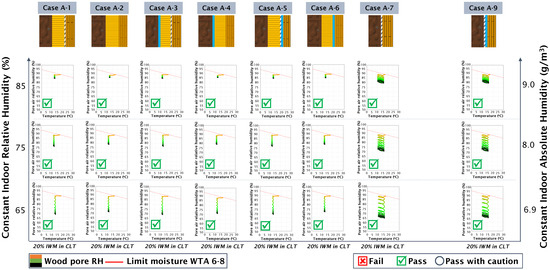
Figure 13.
Risks of wood decay based on the constant indoor relative humidity for the 1D Actual Assembly with an unheated space.
3.2. One-Dimensional Model with Thin Assembly
3.2.1. Heated Space
The results of the risk analysis for the Thin Assembly having a heated space with a mean RH of 55% are illustrated in Figure 14. The plots show that with an initial wood moisture of 20%, all structures dry out over the duration of the simulations, and wood decay does not occur in the CLT of any cases, despite that the profile in the structure of Case B-1 starts from values that marginally exceed the limiting curve. By reducing the initial wood moisture to 15%, the profiles evolve with a larger distance from the limiting curve, and therefore, the assembly becomes safer in terms of wood decay. Comparing the structures with and without the EPDM membrane, i.e., Case B-1 and Case B-2, a slight difference in the profiles can be observed. A closer look at the plots reveals a higher value at the starting point and a lower value at the ending point of the pore air relative humidity in Case B-1 compared to Case B-2. The reason is attributed to the presence of the waterproofing membrane in the assembly of Case B-1, which creates a resistance to the moisture transport from the CLT layer towards the XPS layer. In other words, the high moisture accumulated in the CLT at the beginning of the simulation cannot be released to its left-hand side when the EPDM membrane exists in the geometry. However, by excluding this material from the model in Case B-2, the moisture finds an additional way at the beginning of the simulation to transport towards the exterior of the structure. Therefore, the starting point of the profile in Case B-1 becomes higher than that in Case B-2. As the simulation approaches its end, since the EPDM membrane acts as a resistive barrier to the moisture transported inwards from the soil, the structure in Case B-1 dries out to a lower pore air relative humidity compared to Case B-2. Comparing the outcomes of analogous scenarios having the Thin Assembly depicted in Figure 14 with those having the Actual Assembly illustrated in Figure 10, one can see that the graphs in the former assembly exhibit a slight upward shift when contrasted with the latter structure. This difference arises from the thinner insulation layer in the Thin Assembly, leading to a diminished resistance to moisture from the soil compared to the Actual Assembly.
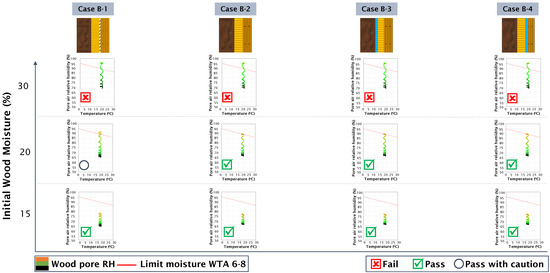
Figure 14.
Risks of wood decay based on the initial wood moisture for the 1D Thin Assembly with a heated space (the mean indoor RH is 55%).
By fixing the initial wood moisture at 20%, the risk of wood decay is further analyzed for the Thin Assembly with a heated space in which the indoor relative humidity gradually increases. The results are presented in Figure 15. The plots show that although the CLT dries out over time in all cases, there are some signs of wood decay in the structure of Case B-1, particularly at indoor relative humidity higher than 70%. In the structures of Case B-2 to Case B-4, however, wood decay is not expected to occur in the basement with indoor relative humidity up to 70%. However, increasing the indoor RH causes a high risk of wood decay for these assemblies. In the next step, the initial wood moisture is fixed at 15% for all cases, and the mean indoor relative humidity is gradually increased up to 80%. According to the plots in Figure 16, wood decay does not occur in any of the structures when the mean indoor RH is 70%, and the profiles reach close to the limiting curve if the mean indoor RH is 80%. Moreover, the results reveal that the CLT does not dry out over time when the mean indoor RH is 70% or higher. This contrasts with the results shown in Figure 11 for similar cases with the Actual Assembly (i.e., Case A-1, Case A-2, Case A-4, and Case A-6), where the CLT released its moisture towards the end of the simulations. The reason is attributed to the thinner insulation material used in the Thin Assembly compared to the Actual Assembly, which reduces the resistance to the moisture transported from the soil and, consequently, does not allow the CLT to dry out.
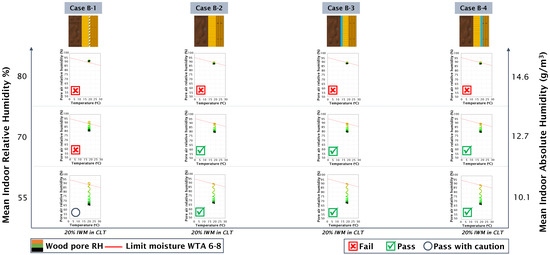
Figure 15.
Risks of wood decay based on the mean indoor relative humidity for the 1D Thin Assembly with a heated space (IWM in CLT is 20%).
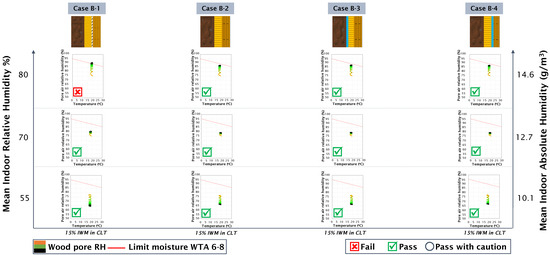
Figure 16.
Risks of wood decay based on the mean indoor relative humidity for the 1D Thin Assembly with a heated space (IWM in CLT is 15%).
3.2.2. Unheated Space
The analysis for the structures with the Thin Assembly having an unheated space with the indoor RH at 65% is shown in Figure 17. The results show that the CLT with an initial wood moisture of 20% in all cases dries out over time, and the risk of wood decay is not a concern. The smaller thickness of the insulation layer in the Thin Assembly compared to the Actual Assembly causes a higher pore air relative humidity in the CLT, as seen in the profiles of the corresponding cases in Figure 12 and Figure 17. The results also show a negligible difference in the behavior of the structures with a moisture source behind the CLT or XPS layers.
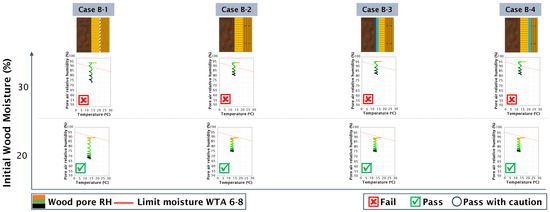
Figure 17.
Risks of wood decay based on the initial wood moisture for the 1D Thin Assembly with an unheated space (the indoor RH is 65%).
By fixing the initial wood moisture of CLT at 20%, further analysis is performed on the basements with a Thin Assembly while increasing the indoor relative humidity. According to the results presented in Figure 18, the CLT element releases its moisture even at high indoor RH values up to 85%, equivalent to an absolute relative humidity of 9 g/m3. The results show that wood decay does not occur in any of the cases examined. The plots also reveal that the CLT in the unheated space dries out over the duration of the simulation in all cases, while the pore air relative humidity of the CLT in the heated space showed an increasing trend once the mean indoor RH raised to 70% (see Figure 16). As mentioned for the Actual Assembly, the higher absolute indoor relative humidity (and consequently the higher vapor pressure) in the heated space compared to the unheated space is the main reason for this observation.
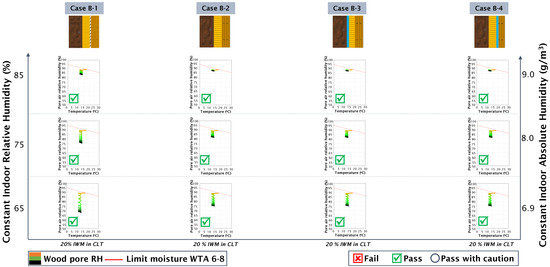
Figure 18.
Risks of wood decay based on the constant indoor relative humidity for the 1D Thin Assembly with an unheated space.
3.3. Two-Dimensional Model with Actual Assembly
The results of the 1D risk analysis presented in the previous sections revealed that wood decay occurs in the CLT layer in all cases if the initial wood moisture is set to 30%. Therefore, for the 2D risk analysis, the initial wood moisture in the CLT is fixed at 20%, which is the threshold for most of the cases in the 1D models. Moreover, findings from the 1D risk analysis shed light on the fact that 2D simulations are not necessary for unheated basements since the system worked properly under severe conditions and the wood could dry out over time (see Figure 13). This is different from the heated basements, where according to the 1D analysis, the CLT layer was not able to dry out in Case A-7 and Case A-9, in which a gap was present in the insulation material (see Figure 11). Therefore, for the 2D risk analysis, a model of a basement with a heated space including a gap in the middle of the XPS layer was generated to further examine the problem. It should be noted that the EPDM membrane is included in the 2D model since the 1D risk analysis highlighted its necessity for the hygrothermal performance of the basement with a heated space, particularly in the vicinity of the gap within the insulation layer (see the results of Case A-8 and Case A-10 in Figure 11). In this section, the results for the 2D models of the Actual Assembly are provided and the plots of the wood decay assessment are illustrated in Figure 19. The evaluations are carried out for the outermost regions of the CLT layer having 10 mm thickness assuming different heights including the entire wall, close to the gap (±15 mm), and the gap size.
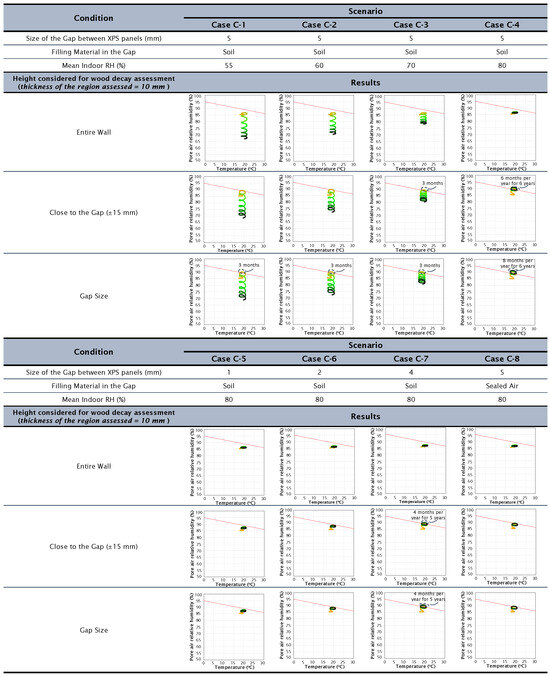
Figure 19.
Risks of wood decay for the 2D risk analysis in the Actual Assembly.
According to the results, the profiles do not surpass the limiting curves in any of the cases when the regions with the entire height of the CLT element are assessed. As shown in the graphs of Case C-1 to Case C-3, the CLT layer in all regions dries out if the mean indoor RH is lower than 70%. By increasing the mean indoor RH to 80%, the counteracting vapor pressure against the pressure driven from the soil becomes higher, and consequently, the pore air relative humidity increases and the CLT cannot release its moisture over time. The plots in Figure 19 show that the profiles in the regions close to the gap are shifted upward compared to the regions with the entire height of the wall. This is due to becoming nearer to the gap filled with the soil or with the sealed air. Considering the basement in Case C-3, the profile of the pore air relative humidity in the regions close to the gap and with the height of the gap size slightly exceeds the limiting curve at the beginning of the simulation for 3 months, but afterward, it dries out over time. The same results can be observed in the plots of Case C-1 and Case C-2 when the region with the gap size is considered. Increasing the mean indoor RH in Case C-4, however, significantly raises the period of surpassing the limiting curves in the regions close to the gap and the gap size. According to the results, the pore air relative humidity values become above the limiting curve for up to 8 months per each year of simulation (6 years). Despite the small size of the regions assessed, this observation means that moisture accumulates in those regions and the CLT does not dry out over time.
The impact of the change in the size of the gap on the results is investigated in Case C-5 to Case C-7. The plots show a negligible difference when regions with the height of the entire wall are compared. In the regions closer to the gap and the gap size, as expected, the bigger the gap size is, the higher the profile is shifted in the plots. If the gap size reaches 4 mm, the results show exceeding values than the limiting curve with a period of 4 months that repeats for the last 5 years of simulation. Therefore, the results imply that wood decay does not happen in the entire assembly if the size of the gaps in the XPS is smaller than 4 mm. Even if gaps with bigger sizes of up to 5 mm exist in the insulation layer, wood decay may only happen in the regions very close to the gap, which could be disregarded compared to the entire height of the assembly.
As the last variable, the material in the 5 mm gap is changed from the soil to the sealed air. The same indoor condition as Case C-4 is applied in Case C-8 to compare the results of these two cases. In contrast to the gap filled with the soil, the plots of Case C-8 show that the profiles do not exceed the limiting curves in any of the regions assessed. The lower moisture content in the sealed air compared to the soil is the main reason for this observation. The actual condition, however, is supposed to lie between Case C-4 and Case C-8, in which the gap is partially filled with the soil and partially filled with the sealed air.
3.4. Two-Dimensional Model with Thin Assembly
This section presents the results of the 2D risk analysis for the basement with the Thin Assembly having a heated space. Similar scenarios to the basement with the Actual Assembly are investigated in this section, and the results are illustrated in Figure 20. Based on the plots, the wood decay is not expected to occur in the entire height of the CLT of the Thin Assembly if the mean indoor RH does not exceed 70%. Although the graphs for the regions with the entire height of the wall (first rows in Figure 19) show that the CLT in the basement having the mean indoor RH of 70% or lower dries out over time, one can see that the pore air relative humidity surpasses the limiting curve if the regions with a height of ±15 mm close to the gap (second rows in Figure 19) or with the height equal to the gap size (third rows in Figure 19) are considered. Considering the basements with the indoor RH values of 55% and 60% in the latter regions, the profiles are beyond the limiting curve for a period of 6 months for 2 years; however, after that, the profiles continue downwards. However, for the basement with the indoor RH of 70%, the regions close to the gap and with the gap size may experience wood decay for a longer time, up to some consecutive years. By increasing the indoor RH to 80%, the results demonstrate that the CLT is not able to release its moisture over time, and the probability of wood decay becomes higher, even in the region with the entire height of the wall. The same results can be observed for Case D-5 to Case D-8. Therefore, the maximum threshold of the mean indoor RH to avoid the wood decay in a basement with the Thin Assembly is 70% if the CLT layers are installed with the initial wood moisture of 20%. By reducing the initial wood moisture to 15%, a higher threshold for the mean indoor RH of up to 80% could be expected, as elaborated in Section 3.2.
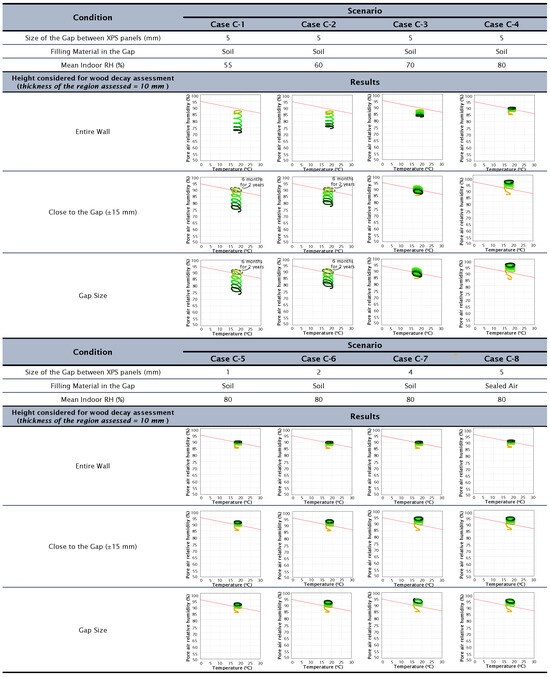
Figure 20.
Risks of wood decay for the 2D risk analysis in the Thin Assembly.
4. Discussion
Building upon the findings presented in earlier parts, one can establish thresholds for the highest initial wood moisture and the maximum indoor relative humidity in basements with heated or unheated spaces. The thresholds provided in Figure 21 are defined for various cases outlined in the 1D risk analysis, ensuring that wood decay is unlikely to happen in structures with the Actual Assembly. According to Figure 21, although there are differences in the upper limits of the values between a heated and an unheated space, as long as the EPDM membrane is present in the structure, the wooden element has a chance to dry out, even under the condition of having no XPS layer in the assembly. A similar observation is reported for a concrete basement by Künzel et al. [6], where the authors indicated that there is a potential for internal drying to occur when a moisture-adaptive vapor barrier is employed. However, removing the EPDM from the structure without any insulation layer results in wood decay in the CLT. In the case of including the insulation material in the basement, eliminating the waterproofing membrane does not have a significant impact on the thresholds obtained for the initial wood moisture and maximum indoor RH. Alternatively, this implies that a localized leakage in the EPDM membrane poses no issue for the assembly if there is an insulation layer nearby.
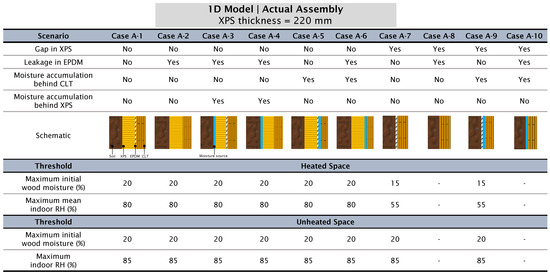
Figure 21.
Thresholds of the initial wood moisture and indoor relative humidity for the 1D risk analysis in the Actual Assembly.
The summary of the upper limits obtained for the initial wood moisture and the indoor relative humidity to avoid wood decay in a basement with the Thin Assembly is provided in Figure 22. According to the thresholds indicated, the values vary in Cases B-1 to B-4 when they are compared in a heated space, while there are no differences between the cases in an unheated space. Comparing the findings for the basement having the Thin Assembly shown in Figure 22 with the basement having the Actual Assembly presented in Figure 21 reveals that, generally, the latter structure has higher upper limits (particularly in the heated space), which alternatively means that it is more resistive against moisture accumulation and possible wood decay in the CLT. Therefore, as expected, the greater thickness of the insulation material effectively boosts the hygrothermal performance of the wooden basement. This is in agreement with the conclusions of the research performed by Fedorik et al. [10], in which the exterior thermal insulation for basement walls is found as the most durable and effective solution for concrete basements. Based on the results, both the properties of the wood layer and the extent of insulation determine the threshold of the maximum indoor RH. Similar conclusions about concrete basements were drawn by Asphaug et al. [11] and Asphaug et al. [12].
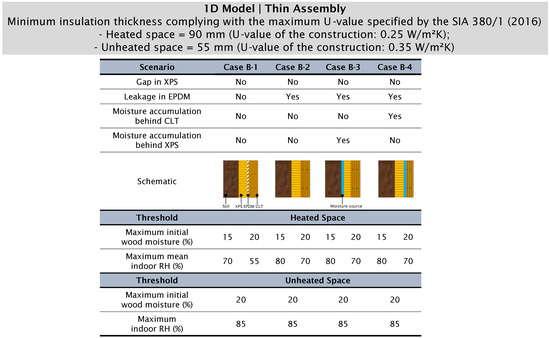
Figure 22.
Thresholds of the initial wood moisture and indoor relative humidity for the 1D risk analysis in the Thin Assembly.
The numerical simulations conducted in this study revealed that a well-designed wooden basement constructed with CLT elements, when combined with appropriate insulation and a waterproofing membrane, can effectively resist moisture accumulation in the assembly. This contributes to creating a dry basement environment, addressing concerns regarding moisture accumulation. The study demonstrated that the basement under investigation exhibits satisfactory long-term hygrothermal performance without concerns for wood decay. The 1D risk analysis showed that with the presence of the EPDM membrane within the structure, there remains a possibility for the wooden element to dry out, even in the absence of an XPS layer in the assembly. This was further proved in the 2D risk analysis, where under severe conditions, the penetration of the soil through a gap in the XPS only affected a small region around the gap size. Moreover, the results indicated that by decreasing the insulation thickness to the minimum level required to meet Swiss standards, the wooden basement can still withstand critical conditions.
Despite many scenarios examined in this study, it is crucial to investigate various aspects considering the basement’s intended use, such as occupant comfort, which was not explored in this research but warrants future consideration. Regarding simulation setups, the orientation of outdoor-exposed surfaces matches the actual construction face, with negligible influence from the above-grade portion due to its small height. However, in cases where the above-grade portion has a larger surface area exposed to the outdoors, careful wall orientation selection is necessary, especially in buildings with low soil levels, to ensure structural endurance under severe conditions. Despite meticulous measurement, uncertainties and variations in production processes may still affect simulation accuracy. Further research is needed to evaluate resilience under extreme climates. It should be highlighted that the studied basement was not affected by groundwater pressure, underlining the need for analysis considering water table levels and soil water flow in such cases.
5. Conclusions
The hygrothermal performance of a wooden basement under critical conditions was analyzed in this study. Assuming the absence of pressuring groundwater in the construction, different scenarios were examined, and possible severe conditions that may occur in the real-world operation of the wooden basement were applied to the system. Some parameters were changed, including the dimensions of the numerical model, use of heating equipment in the basement’s space, and the thickness of the insulation layer, and the chance of wood decay in the CLT element was investigated as the assessment criterion. Accordingly, the thresholds for the initial wood moisture and indoor relative humidity in which wood decay does not occur in the CLT element were determined for different scenarios. The findings indicate that wood decay is improbable in most instances when the initial wood moisture remains below 20%. Moreover, even with indoor relative humidity levels averaging up to 80%, wood decay is rare in a heated basement with temperatures below 21 °C. However, in an unheated basement with a temperature of 12 °C, maintaining indoor relative humidity below 85% becomes crucial to prevent wood decay. It should be noted that altering the purpose of a wooden basement, such as converting it from a living space to a parking garage, may yield different observations and needs to be analyzed in future studies.
Author Contributions
Conceptualization, C.R. and K.G.W.; methodology, M.R. and K.G.W.; software, M.R. and A.B.; validation, M.R.; formal analysis, M.R., A.B. and K.G.W.; investigation, M.R., A.B. and K.G.W.; resources, C.R.; data curation, M.R. and A.B.; writing—original draft preparation, M.R.; writing—review and editing, M.R. and K.G.W.; visualization, M.R. and A.B.; supervision, K.G.W.; project administration, C.R.; funding acquisition, C.R. All authors have read and agreed to the published version of the manuscript.
Funding
This project was funded by the Swiss Innovation Agency (Grant No. 53402.1 IP-EE).
Data Availability Statement
Derived data supporting the findings of this study are available from the corresponding author on request.
Acknowledgments
The authors would like to acknowledge the industrial partners for their collaborations during the project.
Conflicts of Interest
The authors confirm compliance with the submission declaration; no specific permissions need to be obtained for the elaboration of the manuscript.
Appendix A. Effective Hygrothermal Properties of Air in an Unventilated Air Layer
In addition to heat conduction, heat can also transfer through air layers via convection and radiation. Similarly, beyond water vapor diffusion, water vapor can be transferred through air layers by convection. According to the user manual of the WUFI® software (WUFI® 2D 4.4), it is primarily designed for solid materials, permitting solely the consideration of heat conduction and water vapor diffusion, excluding liquid transport, which is not pertinent in this context. Nevertheless, incorporating additional transport phenomena is feasible by adjusting the heat conductivity and diffusion resistance. This ensures that the calculation yields accurate heat and vapor flows. The method is grounded in considerations that apply to non-ventilated air layers. The relative influences of heat conduction, convection, and radiation hinge on factors such as the thickness and orientation of the air layer, the characteristics of the two surfaces, and the temperature. In building physics, the dependency on temperature can be disregarded and it is sufficient to differentiate between metallic and non-metallic surfaces. Therefore, considering air layers bounded with non-metallic surfaces, one can establish a heat resistance (e.g., derived from measurements), denoted as , which is exclusively dependent on the air layer thickness and encompasses all transport phenomena. Additionally, for WUFI®, the effective heat conductivity needs to be selected in a manner that ensures the determined heat resistance aligns with the specified air layer thickness. The heat resistance of an air layer with the desired thickness, orientation (vertical, horizontal), and surfaces (metallic, non-metallic) can be found in relevant standards such as ISO 6946:2017 [45]. Opting for non-metallic surfaces is appropriate here, considering their prevalence in building components. By assuming an arbitrary thickness , representing the thickness of the air layer when incorporated into WUFI®‘s component assembly, the equivalent thermal conductivity of the air layer can be obtained using Equation (A1), where is the effective thickness of the layer, in this case, equal to 220 mm, and is equal to 0.18 m2·K/W for a horizontal heat flow in an unventilated air layer with that thickness (ISO 6946:2017 [45]). Therefore, the effective heat conductivity becomes equal to 1.22 W/m·K.
As water vapor diffusion and convective water vapor transport share analogous mechanisms with heat conductivity and convective heat transport, the coefficients governing vapor transport can be deduced from the coefficients for heat transport through the utilization of similarity relations. The water vapor diffusion flux density (kg/m2·s) can be determined using Equation (A2), where (m2/s) is the concentration-related diffusion coefficient in air, c (kg/m3) is water vapor concentration, (-) is the effective water vapor diffusion resistance factor, and S (m3/s2·Pa) is water vapor diffusion resistance.
Considering that is approximately equal to 0.09 m2/s (Schirmer [46]), and S is the ratio of the thermal resistance of the unventilated air layers bounded by metallic surfaces (m2·K/W) divided by 3.5 (Illig [47]), one can calculate the effective water vapor diffusion resistance factor using Equation (A3).
Therefore, by assuming the value of 0.35 m2·K/W for (Gösele and Schüle [48]), the effective water vapor diffusion resistance factor becomes equal to 0.041. It should be noted that for the effective water vapor diffusion resistance factor, the heat resistance of air layers between metallic surfaces (i.e., without radiation exchange) is used since the intention is to estimate the vapor diffusion resistance while there is no transport mechanism analogous to radiation involved, which is in contrast to the above case of heat transport.
References
- Goto, Y.; Wakili, K.G.; Frank, T.; Stahl, T.; Ostermeyer, Y.; Ando, N.; Wallbaum, H. Heat and moisture balance simulation of a building with vapor-open envelope system for subtropical regions. Build. Simul. 2012, 5, 301–314. [Google Scholar] [CrossRef]
- Ueno, K. Hygrothermal Behavior of Interior Basement Insulation; University of Waterloo: Waterloo, ON, Canada, 2007. [Google Scholar]
- Allwood, J.; Azevedo, J.; Clare, A.; Cleaver, C.; Cullen, J.; Dunant, C.; Fellin, T.; Hawkins, W.; Horrocks, I.; Horton, P.; et al. Absolute Zero: Delivering the UK’s Climate Change Commitment with Incremental Changes to Today’s Technologies; University of Cambridge: Cambridge, UK, 2019. [Google Scholar]
- Olsson, J.A.; Miller, S.A.; Alexander, M.G. Near-term pathways for decarbonizing global concrete production. Nat. Commun. 2023, 14, 4574. [Google Scholar] [CrossRef] [PubMed]
- Zabel, R.A.; Morrell, J.J. (Eds.) Wood Microbiology, 2nd ed.; Elsevier: Amsterdam, The Netherlands, 2020. [Google Scholar]
- Künzel, H.M.; Zirkelbach, D.; Bludau, C. Feuchteverhalten von Kellerwänden mit Innendämmung. Z. Für Wärmeschutz Kälteschutz Schallschutz Brandschutz 2008, 60, 17–24. [Google Scholar]
- Straube, J. Field Monitoring Hygrothermal Modeling Basement Insulation; Research Report 0906; Building Science Press: Westford, MA, USA, 2009. [Google Scholar]
- Pallin, S. Risk Assessment of Hygrothermal Performance: Building Envelope Retrofit; Chalmers University of Technology: Göteborg, Sweden, 2013. [Google Scholar]
- Goldberg, L.F.; Harmon, A.C. Cold Climate Foundation Retrofit Experimental Hygrothermal Performance: Cloquet Residential Research Facility Laboratory Results; National Renewable Energy Laboratory: Golden, CO, USA, 2015; 248p. [Google Scholar]
- Fedorik, F.; Heiskanen, R.; Laukkarinen, A.; Vinha, J. Impacts of multiple refurbishment strategies on hygrothermal behaviour of basement walls. J. Build. Eng. 2019, 26, 100902. [Google Scholar] [CrossRef]
- Asphaug, S.K.; Kvande, T.; Time, B.; Peuhkuri, R.H.; Kalamees, T.; Johansson, P.; Berardi, U.; Lohne, J. Moisture control strategies of habitable basements in cold climates. Build. Environ. 2020, 169, 106572. [Google Scholar] [CrossRef]
- Asphaug, S.K.; Time, B.; Kvande, T. Hygrothermal simulations of thermally insulated basement envelopes—Importance of boundary conditions below grade. Build. Environ. 2021, 199, 107920. [Google Scholar] [CrossRef]
- Asphaug, S.; Hjermann, I.; Time, B.; Kvande, T. Monitoring outward drying of externally insulated basement walls: A laboratory experiment. Build. Environ. 2022, 217, 109097. [Google Scholar] [CrossRef]
- Asphaug, S.K.; Andenæs, E.; Geving, S.; Time, B.; Kvande, T. Moisture-resilient performance of concrete basement walls: Numerical simulations of the effect of outward drying. Build. Environ. 2022, 222, 109393. [Google Scholar] [CrossRef]
- Rahiminejad, M.; Raeber, V.; Wakili, K.G.; Geyer, C.; Zoelig, S.; Renfer, C. Wooden basement; Hygrothermal performance analysis using in-field measurements and numerical simulations. Build. Environ. 2024, 256, 111475. [Google Scholar] [CrossRef]
- Maref, W.; Swinton, M.C.; Kumaran, M.K.; Bomberg, M.T. Three-dimensional analysis of thermal resistance of exterior basement insulation systems (EIBS). Build. Environ. 2001, 36, 407–419. [Google Scholar] [CrossRef][Green Version]
- Swinton, M.C.; Maref, W.; Bomberg, M.T.; Kumaran, M.K.; Normandin, N. In situ performance evaluation of spray polyurethane foam in the exterior insulation basement system (EIBS). Build. Environ. 2006, 41, 1872–1880. [Google Scholar] [CrossRef]
- Emery, A.F.; Heerwagen, D.R.; Kippenhan, C.J.; Steele, D.E. Measured and predicted thermal performance of a residential basement. HVACR Res. 2007, 13, 39–57. [Google Scholar] [CrossRef]
- Saber, H.H.; Maref, W.; Swinton, M.C. Thermal response of basement wall systems with low-emissivity material and furred airspace. J. Build. Phys. 2012, 35, 353–371. [Google Scholar] [CrossRef]
- Saaly, M.; Bobko, K.; Maghoul, P.; Kavgic, M.; Holländer, H. Energy performance of below-grade envelope of an institutional building in cold regions. J. Build. Eng. 2020, 27, 100911. [Google Scholar] [CrossRef]
- MeteoSwiss; Federal Office of Meteorology and Climatology, IDAWEB Portal. Available online: https://gate.meteoswiss.ch/idaweb/login.do (accessed on 27 September 2021).
- SIA 380/1; Heizwärmebedarf. Swiss Society of Engineers and Architects: Zürich, Switzerland, 2016.
- Kehl, D. (Ed.) Feuchtetechnische Bewertung von Holzbauteilen—Vereinfachte Nachweise und Simulation; WTA-Merkblatt 6-8; Frauenhofer IRB Verlag: Stuttgart, Germany, 2016. [Google Scholar]
- Zirkelbach, D. Hygrothermische Simulation—Anwendungsmöglichkeiten für Planer und Sachverständige; ISK 2013-12; Internationale Baufach—Und Sachverständigentagung Ausbau und Fassade: Regensburg, Germany, 2013. [Google Scholar]
- Kukk, V.; Kaljula, L.; Kers, J.; Kalamees, T. Designing highly insulated cross-laminated timber external walls in terms of hygrothermal performance: Field measurements and simulations. Build. Environ. 2022, 212, 108805. [Google Scholar] [CrossRef]
- Künzel, H.M. Modelling air leakage in hygrothermal envelope simulation. In Proceedings of the Building Enclosure Science & Technology (BEST3) Conference, Atlanta, GA, USA, 2 April 2012. [Google Scholar]
- Künzel, H.M. Simultaneous Heat and Moisture Transport in Building Components: One-and Two-Dimensional Calculation Using Simple Parameters; IRB-Verlag: Stuttgart, Germany, 1995; ISBN 3-8167-4103-7. [Google Scholar]
- McClung, R.; Ge, H.; Straube, J.; Wang, J. Hygrothermal performance of cross-laminated timber wall assemblies with built-in moisture: Field measurements and simulations. Build. Environ. 2014, 71, 95–110. [Google Scholar] [CrossRef]
- Lepage, R.; Finch, G. Moisture uptake testing for CLT floor panels in a tall wood building in Vancouver. In Proceedings of the 15th Canadian Conference on Building Science and Technology, Vancouver, BC, Canada, 6–8 November 2017. [Google Scholar]
- Schilliger Holz AG. Environmental Product Declaration as per ISO 14025 and EN 15804. Available online: https://www.schilliger.ch/wp-content/uploads/2020/09/2020.06.23-_-EPD-cross-laminated-timber-GFP-English-_-02.09.2020.pdf (accessed on 1 October 2020).
- Swisspor AG. Available online: https://www.swisspor.com/ch-de/swissporxps (accessed on 1 October 2023).
- Contec, A.G. Available online: https://www.contec.ch/de/Downloads?category=35 (accessed on 1 October 2023).
- H-GEOL AG. Geotechnical Preliminary Study; Demolition, Conversion, and Elevation of the Greenhouses. 2020. Available online: https://www.abageol.ch/ (accessed on 14 May 2024).
- Sonderegger, W.; Niemz, P. Thermal conductivity and water vapour transmission properties of wood-based materials. Eur. J. Wood Wood Prod. 2009, 67, 313–321. [Google Scholar] [CrossRef]
- Bader, H.; Niemz, P.; Sonderegger, W. Untersuchungen zum Einfluss des Plattenaufbaus auf ausgewählte Eigenschaften von Massivholzplatten. Holz Als Roh- Werkst. 2007, 65, 173–181. [Google Scholar] [CrossRef][Green Version]
- Bonifacio, S. Messungen und Simulation des Wassertransportes in Holzbauteilen; Bern University of Applied Sciences: Bern, Switzerland, 2020. [Google Scholar]
- EN ISO 12572; Hygrothermal Performance of Building Materials and Products—Determination of Water Vapour Transmission Properties—Cup Method. International Organization for Standardization (ISO): Geneva, Switzerland, 2016.
- EN 15026; Hygrothermal Performance of Building Components and Building Elements—Assessment of Moisture Transfer by Numerical Simulation. European Committee for Standardization (CEN): Brussels, Belgium, 2007.
- Künzel, H.M. Bedeutung von Klimabedingungen und Diffusionseigenschaften für die Feuchtesicherheit voll gedämmter Altbaudächer. In Bauphysik. Berichte aus Forschung und Praxis. Festschrift zum 60; Hauser, G., Ed.; Geburtstag von Karl Gertis Fraunhofer IRB Verlag: Stuttgart, Germany, 1998. [Google Scholar]
- Künzel, H.M. Raumluftfeuchte in Wohngebäuden—Randbedingung für die Feuchteschutzbeurteilung. Wksb—Zeitschrift für Wärmeschutz, Kälteschutz, Schallschutz. Brandschutz 2006, 51, 31–34. [Google Scholar]
- EN ISO 13370; Thermal Performance of Buildings-Heat Transfer via the Ground-Calculation Methods. International Organization for Standardization (ISO): Geneva, Switzerland, 2017.
- DIN 4108-3; Wärmeschutz und Energie-Einsparung in Gebäuden. Teil 3: Klimabedingter Feuchteschutz—Anforderungen, Berechnungsverfahren und Hinweise für Planung und Ausführung. Beuth Verlag: Berlin, Germany, 2014.
- EN ISO 10211; Thermal Bridges in Building Construction—Heat Flows and Surface Temperatures—Detailed Calculations. International Organization for Standardization (ISO): Geneva, Switzerland, 2017.
- Zürcher, C.; Frank, T. Bauphysik: Bau & Energie, 5th ed.; vdf Hochschulverlag AG: Zürich, Switzland, 2018. [Google Scholar]
- EN ISO 6946; Building Components and Building Elements, Thermal Resistance and Thermal Transmittance. Calculation Methods. International Organization for Standardization (ISO): Geneva, Switzerland, 2017.
- Schirmer, R. Die Diffusionszahl von Wasserdampf-Luft-Gemischen und die Verdampfungsgeschwindigkeit, Beiheft VDI-Zeitschrift. Verfahrenstechnik 1938, 6, 170–177. [Google Scholar]
- Illig, W. Die Größe der Wasserdampfübergangszahl bei Diffusionsvorgängen in Wänden von Wohnungen, Stallungen und Kühlräumen. Gesundheitsingenieur 1952, 73, 124–127. [Google Scholar]
- Gösele, K.; Schüle, W. Schall·Wärme·Feuchte; Bauverlag: Gütersloh, Germany, 1989. [Google Scholar]


Disclaimer/Publisher’s Note: The statements, opinions and data contained in all publications are solely those of the individual author(s) and contributor(s) and not of MDPI and/or the editor(s). MDPI and/or the editor(s) disclaim responsibility for any injury to people or property resulting from any ideas, methods, instructions or products referred to in the content. |
© 2024 by the authors. Licensee MDPI, Basel, Switzerland. This article is an open access article distributed under the terms and conditions of the Creative Commons Attribution (CC BY) license (https://creativecommons.org/licenses/by/4.0/).