Article

Seismic Response and Collapse Analysis of a Transmission Tower Structure: Assessing the Impact of the Damage Accumulation Effect

1
School of Civil Engineering, Liaoning Technical University, Fuxin 123000, China
2
Xinjiang Institute of Engineering, Urumqi 830000, China
3
China Electronics System Engineering No. 2 Construction Co., Ltd., Beijing 214135, China
*
Author to whom correspondence should be addressed.
Buildings 2024, 14(7), 2243; https://doi.org/10.3390/buildings14072243
Submission received: 5 June 2024 / Revised: 4 July 2024 / Accepted: 16 July 2024 / Published: 21 July 2024
(This article belongs to the Special Issue Seismic Performance and Durability of Engineering Structures)

Abstract

:
This paper delves into the impact of the damage accumulation effect, which leads to the degradation of material strength and stiffness, on the seismic resistance of transmission towers. Building upon the elastic–plastic finite element theory, a mixed hardening constitutive model is derived for circular steel tubes, standard elements in transmission towers, incorporating the damage accumulation effect. A user material subroutine, UMAT, is created within the LS–DYNA framework. The program’s validity and reliability are established through axial constant–amplitude loading tests on single steel tubes. The subroutine is employed to conduct the incremental dynamic analysis (IDA) of an individual transmission tower and to contrast it with the structure utilizing the Plastic Kinematic material model, assessing the discrepancies in tower top displacements and segment damage indices (SDIs) at both macroscopic and microscopic scales. The results shows that the Plastic Kinematic model inflates the seismic performance of the transmission tower. When considering the damage accumulation effect in structural failure, the damage index of the members increases, leading to a reduction in both the structural strength and stiffness. The dynamic response in the plastic phase becomes more pronounced, and the onset of structural failure is accelerated. Consequently, structural analysis under seismic conditions should account for the damage accumulation process. Through the delineation of member and segment damage, the extent of damage to transmission tower segments can be quantitatively assessed. Subsequently, the ultimate load–bearing capacity and the most vulnerable location of the transmission tower can be ascertained. Finally, this paper provides a detailed analysis of the transmission tower collapse process under seismic action and summarizes the mechanism of collapse for the structure.

1. Introduction

Ultra–high voltage (UHV) power transmission lines, praised for their high transmission efficiency, extensive reach, operational flexibility, and robust security, have come to be known as the “Electric Silk Road”, connecting China’s northwestern frontiers with its eastern seaboard. This infrastructure robustly underpins the strategic initiative of “Coal from the Air, Electricity to All of China” for Xinjiang, China, facilitating the region’s development and ensuring a stable energy supply across the nation. However, situated in the heart of the Eurasian continent, within the seismically active Tibetan Plateau region, Xinjiang’s unique geological structure endows its seismic activity with a character of high intensity and frequency. Concurrently, the construction investment in UHV transmission technology demands substantial investment; hence, ensuring its safety under seismic events is of crucial economic value and profound social significance. The transmission tower structures, integral to power transmission lines, frequently exhibit dynamic responses in the nonlinear plastic phase when subjected to intense seismic activity. Researchers from various countries have yielded rich and substantial findings in this domain. Albermani et al. [1,2] employed beam elements in finite element analysis to simplify the transmission tower model, investigating a nonlinear analytical method that simulates the dynamic response of transmission towers and accurately predicts structural failure. And this methodology was validated through full–scale testing. Park et al. [3] carried out different nonlinear analyses of the seismic capacity of the transmission tower and obtained the collapse probability of the transmission tower structure under different ground motion intensities, considering the uncertainty of the material and the randomness of the input ground motion type. Meek et al. [4,5] utilized a spatial steel frame model to conduct a dynamic response analysis of transmission towers, deriving the element stiffness matrix based on the consideration of initial stresses and geometric nonlinearities. The comparison between experimental data and numerical simulation results showed a high degree of consistency. Rao et al. [6] analyzed the causes of the collapse of transmission towers in the prototype tests, modeled and examined various types of transmission tower structures using finite element analysis program NE–NASTRAN, and investigated the effects of “K”– and “X”–type bracing configurations on structural response. The results highlighted the necessity of nonlinear analysis for the study of bearing capacity, design defects, and the stability of transmission towers. Li et al. [7] conducted a nonlinear buckling analysis of a transmission tower up to a height of 75.9 m using ANSYS 14.0 and, in conjunction with the incremental dynamic analysis (IDA), employed the Budiansky–Roth criterion and the displacement equality criterion to study the dynamic stability of the transmission tower. Tian et al. [8,9] investigated the mechanical behavior of steel components that constitute transmission towers and established a nonlinear constitutive model that accounts for damage accumulation and failure criteria. Utilizing this constitutive model, they conducted research on the dynamic response and collapse process of transmission tower structures, analyzing the collapse mechanism, damage distribution, and vulnerable locations.
Currently, the majority of research in the field of seismic resistance of transmission towers focuses on the ideal elastic–plastic constitutive relationship. However, in actual situations, seismic data statistics indicate that strong mainshocks often trigger a series of smaller–magnitude but numerous aftershocks [10]. For instance, following the 7.1 magnitude earthquake in Wuqia County, Xinjiang, China, earlier this year, a total of 1104 aftershocks were recorded within less than two days. The occurrence of consecutive earthquakes in a short period can lead to the propagation of internal microcracks in materials, causing a continuous accumulation of initial damage. This results in irreversible plastic deformation, with a consequent reduction in strength and stiffness, ultimately leading to a diminished ultimate load–bearing capacity of the structure prior to collapse [11]. To accurately obtain the response of structures under seismic action, it is imperative to establish a foundation on precise material constitutive models.
In response to the aforementioned issues, this paper employs an explicit integration algorithm as the foundation, utilizing a mixed hardening constitutive model that accounts for the cumulative effect of material damage. A user material subroutine (UMAT) tailored for spatial beam elements in the finite element software LS–DYNA R13.0.0 has been developed. Additionally, the subroutine incorporates a feature to dynamically remove elements that fail and can no longer carry load in real time. Based on member damage, the subroutine defines segment damage and conducts an incremental dynamic analysis of a transmission tower to study its seismic damage characteristics and damage accumulation simulation under frequent seismic actions. Simultaneously, the process of member failure, segment displacement angles, and the displacement response at the tower top are analyzed, revealing the tower’s vulnerable sections. Ultimately, this study investigates the influence of the damage accumulation effect on the collapse and failure mechanism of transmission towers.

2. Methodology

An appropriate material constitutive model is fundamental for ensuring the accuracy of finite element analysis results. Upon entering the yield phase, steel undergoes hardening phenomena as a result of crystallographic slip reorganization. Commonly employed hardening models include isotropic hardening, kinematic hardening, and mixed hardening. Isotropic hardening involves a uniform expansion of the initial yield surface without any translation. However, for the metallic materials constituting transmission towers, isotropic hardening alone struggles to accurately depict the change in the position of the yield surface resulting from metal work hardening. The kinematic hardening model, which takes into account the Bauschinger effect in metals, assumes that the yield surface undergoes rigid translation in the direction of plastic deformation during loading. This model is suitable for most metals subjected to small–strain alternating loads. Upon yielding, metals may exhibit an excessive shift in compressive yield strength due to the Bauschinger effect, which is not realistic for materials subjected to large–strain cyclic loading. Hence, a mixed hardening criterion that transitions between two hardening rules is adopted, allowing for the yield surface to expand uniformly while also undergoing positional shifts. This approach accommodates varying degrees of the Bauschinger effect. Hence, a mixed hardening criterion that transitions between the two hardening rules was adopted, allowing for the yield surface to expand uniformly while also undergoing positional shifts. This approach accommodates varying degrees of the Bauschinger effect [12,13] and effectively simulates the dynamic behavior of thin–walled circular steel tube members under seismic reciprocal loading.

2.1. Mixed Hardening Elastic–Plastic Constitutive Modeling

On the basis of the initial yield criterion (von Mises), the concept of mixed hardening is incorporated by introducing an isotropic hardening coefficient β as a weighting factor. The modified von Mises yield criterion [14] thus becomes:
f σ ̿ = 3 2 s i j α i j s i j α i j σ y = 0 σ y ε ¯ p = 1 β σ 0 + β Y ε ¯ p
where s i j is the deviatoric stress tensor, s i j = σ i j 1 / 3 σ k k . σ i j is the Cauchy stress tensor, and 1 / 3 σ k k represents the hydrostatic pressure. α i j is the back stress tensor, which represents the translation of the center of the yield surface. σ y is the yield strength, and ε ¯ p is the equivalent plastic strain. σ y ε ¯ p is the sum function of the yield strength and equivalent plastic strain, representing the expansion of the yield surface. Furthermore, Y ε ¯ p = ε ¯ p n .
In the kinematic hardening criterion, the back stress tensor α i j is used to represent the shifting center of the subsequent yield surface, and its value indicates the effect of micro–residual stresses [15]. For the back stress tensor α i j , Prager’s hardening rule is used to derive the following equation:
α i j t + t = α i j t + 2 3 1 β E p γ Q ̿
E p = d Y ε ¯ p d ε ¯ p = n β ε ¯ p n 1
where Q ̿ is the unit tensor along the exterior normal of the yield surface. γ denotes the variable factor, which is correlated with the stress–strain state. E p is the plastic modulus.
In classical plasticity theory, assuming the material’s plastic behavior follows the orthogonality principle, the unit tensor Q ̿ can be deduced as follows:
Q ̿ = 3 2 s i j t + t α i j σ y
The variable factor γ is determined by the consistency condition as follows:
γ = 1 2 G 1 + E p 3 G × s i j t + t α i j s i j t + t α i j 2 3 σ y

2.2. Damage Evolution

Steel and other ductile materials subjected to seismic action often exhibit various forms of internal defects or microdamage, which manifest microcracks or micropores. These defects progressively accumulate under the action of material deformation, ultimately leading to failure and fracture. In order to more accurately simulate the nonlinear seismic response of a member or structure under seismic action, this work employs a plastic damage model based on damage mechanics proposed by Bonora et al. [16], which accounts for the damage accumulation effect on the development of internal micropores within the material.
f D = 1 2 Y S 0 2 S 0 1 D D c r D α 1 α ε ¯ p 2 + n n
D = α D c r D 0 1 α ln ε c r ε t h f σ k k σ e q D c r D α 1 α ε ¯ p ε ¯ p
where f D is the damage dissipation potential function, Y is the variable associated with damage. α is the damage parameter, and S 0 is the material parameter, taken as 0.5. D c r ,   D ,     and   D 0 donate the critical damage value, damage increment, and initial damage value, respectively. ε c r is the critical strain corresponding to the critical damage value, and ε t h is the threshold strain at which damage initiation occurs. f ( σ k k / σ e q ) is the triaxial stress factor, which reflects the influence of the triaxial stress ratio.
f σ k k σ e q = 2 3 1 + v + 3 1 2 v σ k k σ e q 2
where v is the Poisson’s ratio and σ e q is the von Mises equivalent stress.
The influence of damage effects on the degradation of steel’s strength and stiffness can be described by the damage variable D [17,18]:
σ D = 1 D σ y
E D = 1 D E
where σ D denotes the damage yield strength of the steel. E D is the damage elastic modulus of the steel. σ y can be determined by Equation (1), and the damage accumulation value D can be determined by Equations (7) and (8).

2.3. Definition of the Segment Damage Index (SDI)

The process of structural collapse and failure under seismic action is inherently a process of damage occurrence and accumulation. Considering the transmission tower as a structural system consisting of multiple segments stacked from top to bottom, the overall damage index can be determined by the maximum damage value across all segments. Furthermore, the failure of any individual segment has the potential to lead to the collapse and failure of the entire structure.
Elevating the assessment of damage from the member level to the segment level deepens the understanding of the vulnerable locations and collapse mechanisms of transmission towers. In this work, the segment damage index (SDI) is adopted to quantify the damage of transmission tower segments, and the damage value for each element is defined as follows:
d i j e = 1 E E 0
D i j = max d i j e
By utilizing the weighted factor method, the calculation of the SDI takes into account that members with more severe damage contribute more significantly to the overall structural damage of the segment [19]. The SDI is therefore defined as:
S D I i = j = 1 n λ i j D i j j = 1 n λ i j
where d i j e is the damage index of the element within the i t h member of the j t h segment, where E ,   E 0 are the equivalent elastic modulus and the initial elastic modulus, respectively. D i j denotes the damage index of the member, which is determined by taking the maximum damage value among the elements within the member. λ i j is the member importance factor, with its value set as λ i j = D i j , indicating that the more severely damaged a member is, the greater its contribution to the overall damage of the segment.
To evaluate the safety of transmission tower structures following an earthquake, we referred to the classification of the seismic damage levels in building structures proposed by international scholars and, in conjunction with the damage model presented in this work, categorized the inter–segment damage of transmission towers into five levels according to the damage index, as shown in Table 1.

3. Numerical Implementation of the Constitutive Model

The general finite element software, LS–DYNA, boosts powerful explicit nonlinear dynamic analysis capabilities and provides users a platform for secondary development of materials. Users can utilize this platform, along with the “*user_defined_material_model” option, to input relevant parameters and thereby implement a custom constitutive model. By utilizing the dynamic link library LS–DYNA.LIB provided by LSTC for user–defined material development, along with a user–written material subroutine, compilation and application can be achieved using the Intel Fortran compiler. Once the user has successfully compiled the new solver, the newly generated solver is used to replace the original solver for the solution process. The core of the user material subroutine consists of the stress update algorithm for elements and the element failure criteria algorithm.

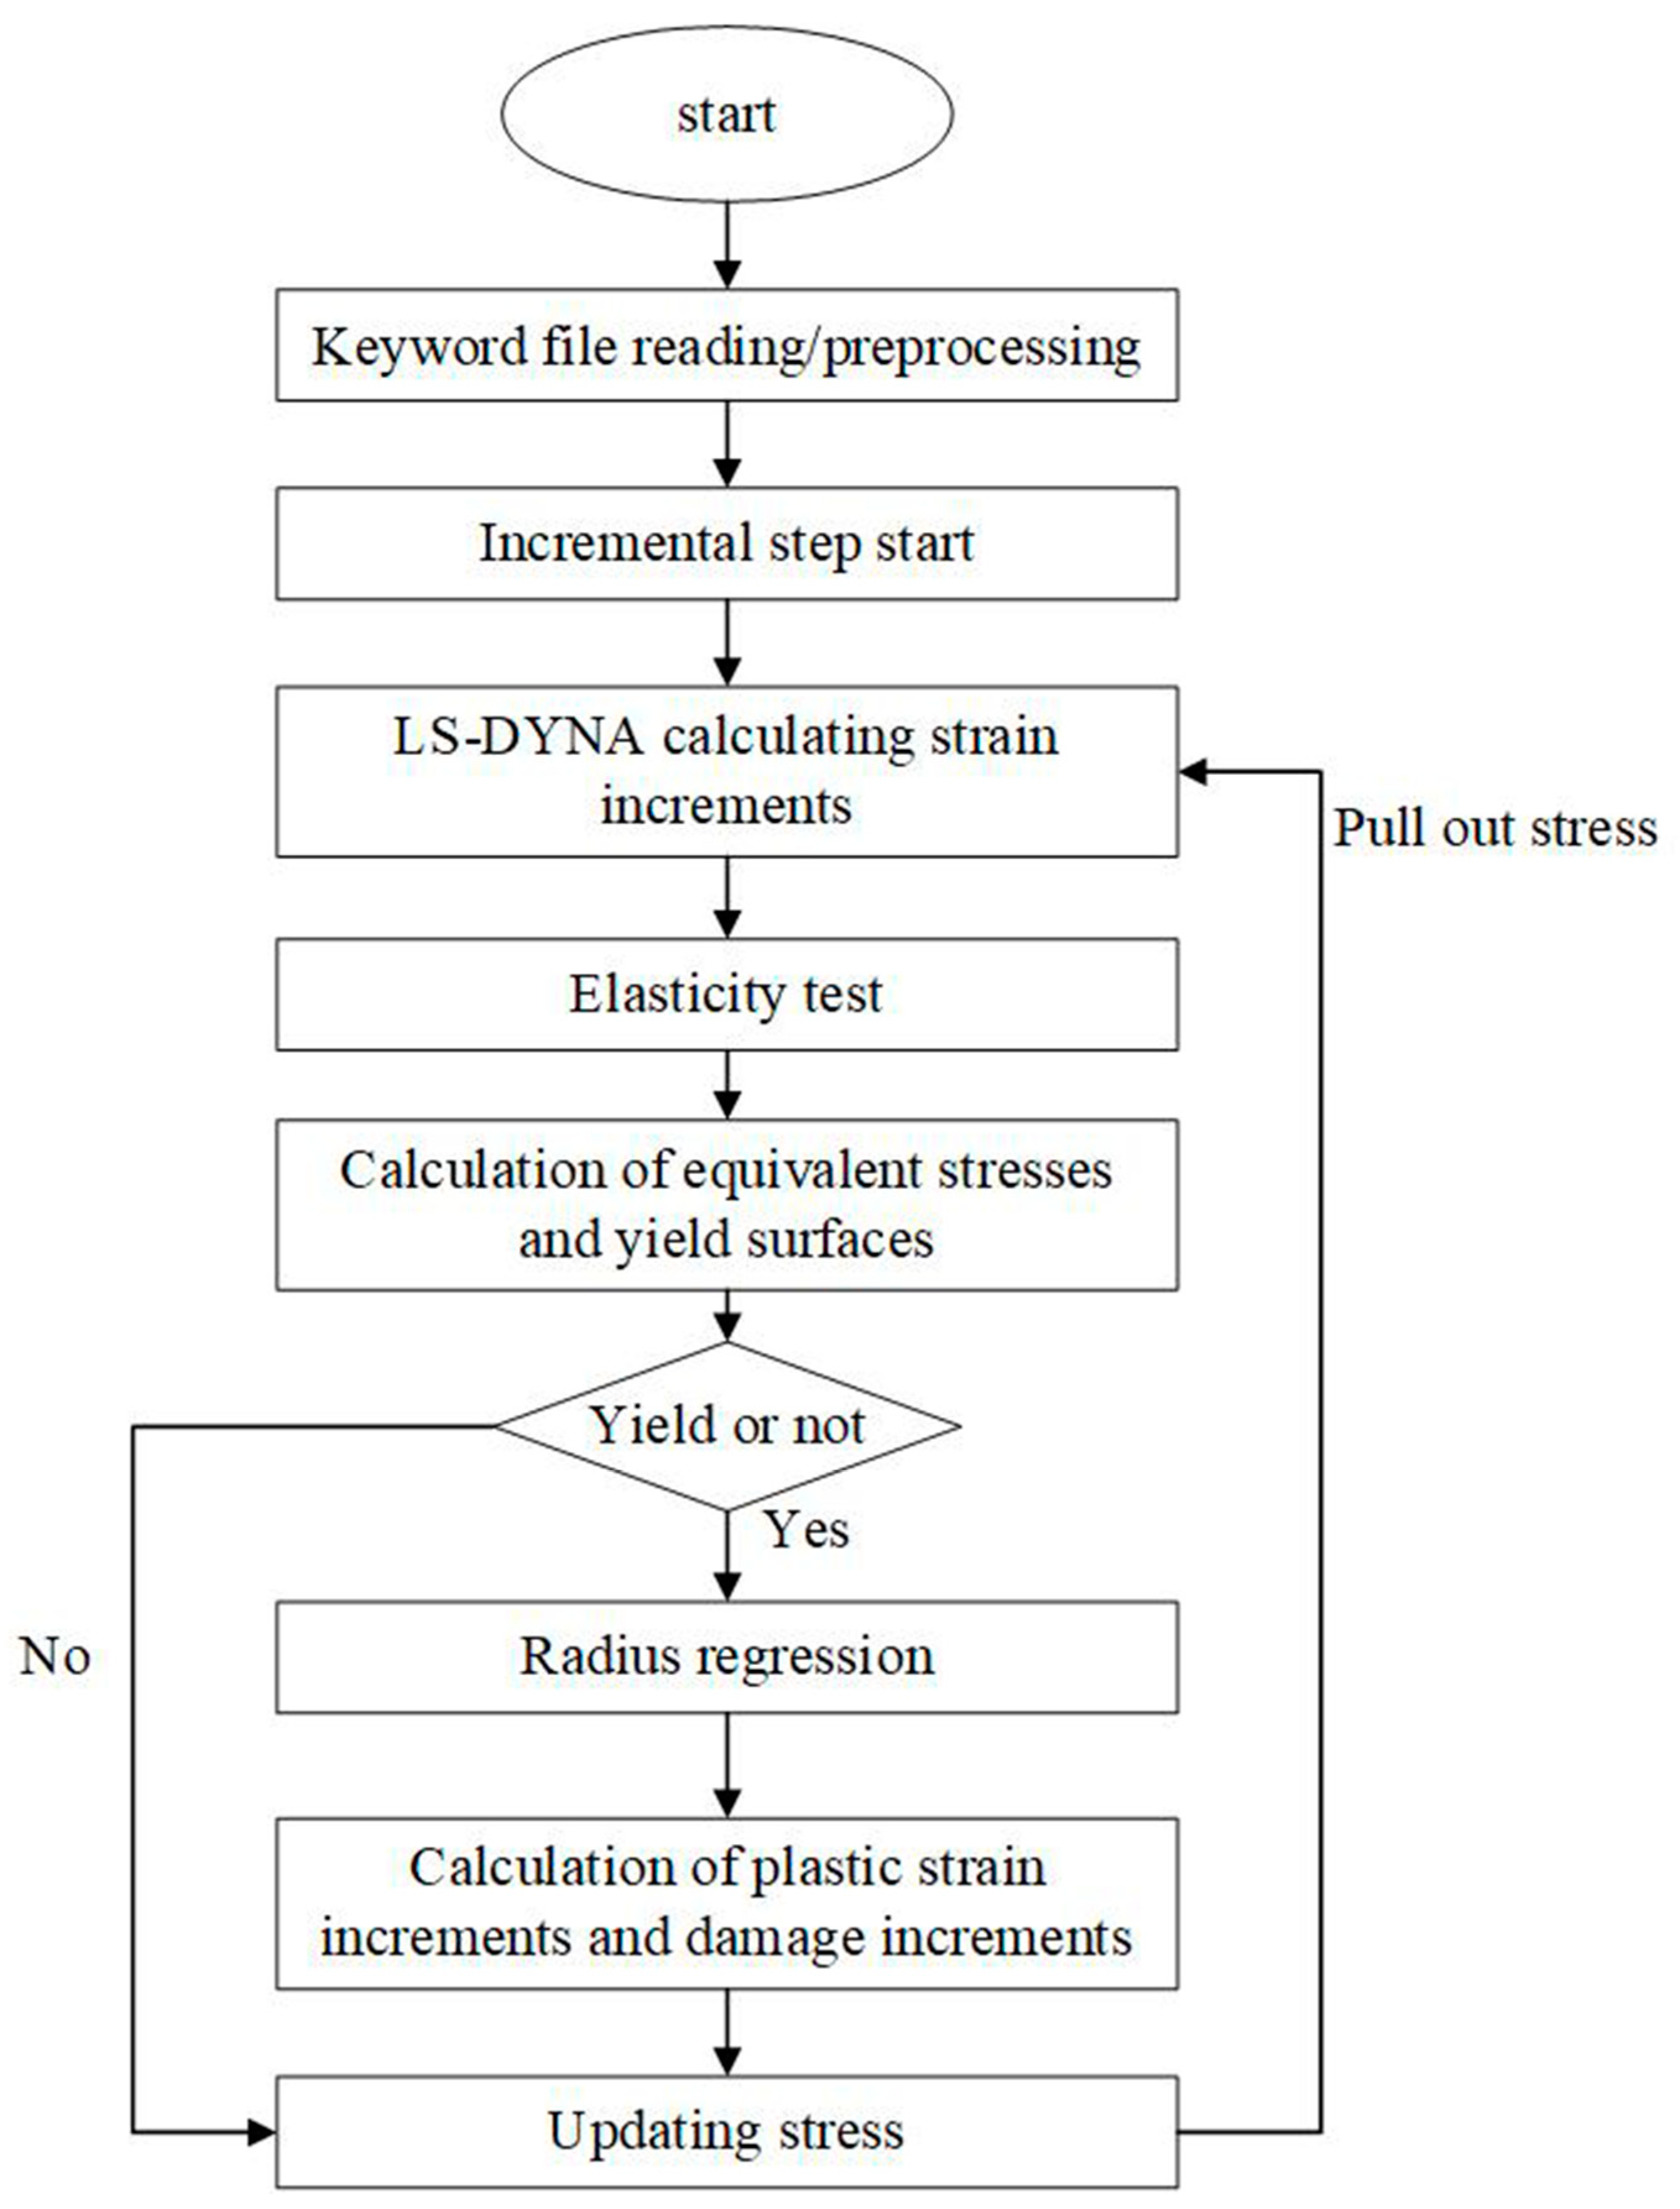
3.1. Stress–Updating Algorithm

The core challenge of the constitutive algorithm is determining how to derive stress increments from strain increments. The stress update is carried out using the radial return method, which is based on the following fundamental principle:
Assuming that the stress at the initial moment is located at point A on the plastic yield surface, the trial stress state at the new moment (for example, point B or C) is calculated by assuming elastic deformation of the cross–section. If the trial stress is inside the yield surface (at point B), it indicates that the next microstrain process is elastic unloading and point B is the true stress point. If the trial stress is outside the yield surface (at point C), it indicates that the next microstrain process is plastic loading. The final stress state is achieved by plastic correction, which involves moving the stress point from C back along the normal to the yield surface until it reaches point D on the yield surface (Figure 1).
For the deviatoric stress increment in the elastic phase, it can be determined according to the generalized Hooke’s law as follows:
d s i j = 2 G d ε i j e
The deviatoric stress increment for the trial calculations are obtained:
s i j t + t = s i j t + d s i j
Once the elastic stresses are calculated, the von Mises yield criterion is employed to determine whether the material has yielded. If f < 0 , the material is either in the elastic region or undergoing unloading. If f 0 , the material has entered the plastic phase, and the equivalent plastic strain increment is calculated using the following equation:
d ε ¯ p = 2 3 γ
Calculate the new yield surface after modification:
s i j n e w t + t = s i j t + t 2 μ ε p = s i j t + t 2 G γ Q
Update the equivalent plastic strain:
ε ¯ p t + t = ε ¯ p t + d ε ¯ p
Update damage variables:
D t + t = D t + d D

3.2. Failure Strain Criterion

During simulation, the failure strain is defined as the criterion for element failure. When the equivalent plastic strain reaches the failure strain, the element is deemed failed and is automatically removed from the structure. The failure strain criterion is a single–parameter damage criterion, which can be described as follows:
I s F a i l = d ε ¯ p ε ¯ p
where ε ¯ p represents the ultimate plastic strain of the material. If I s F a i l = 0 , the element is intact. If I s F a i l 1 , the element is considered failed.
The basic call relationship and flow chart of the damage material subroutine in LS–DYNA are illustrated in Figure 2.

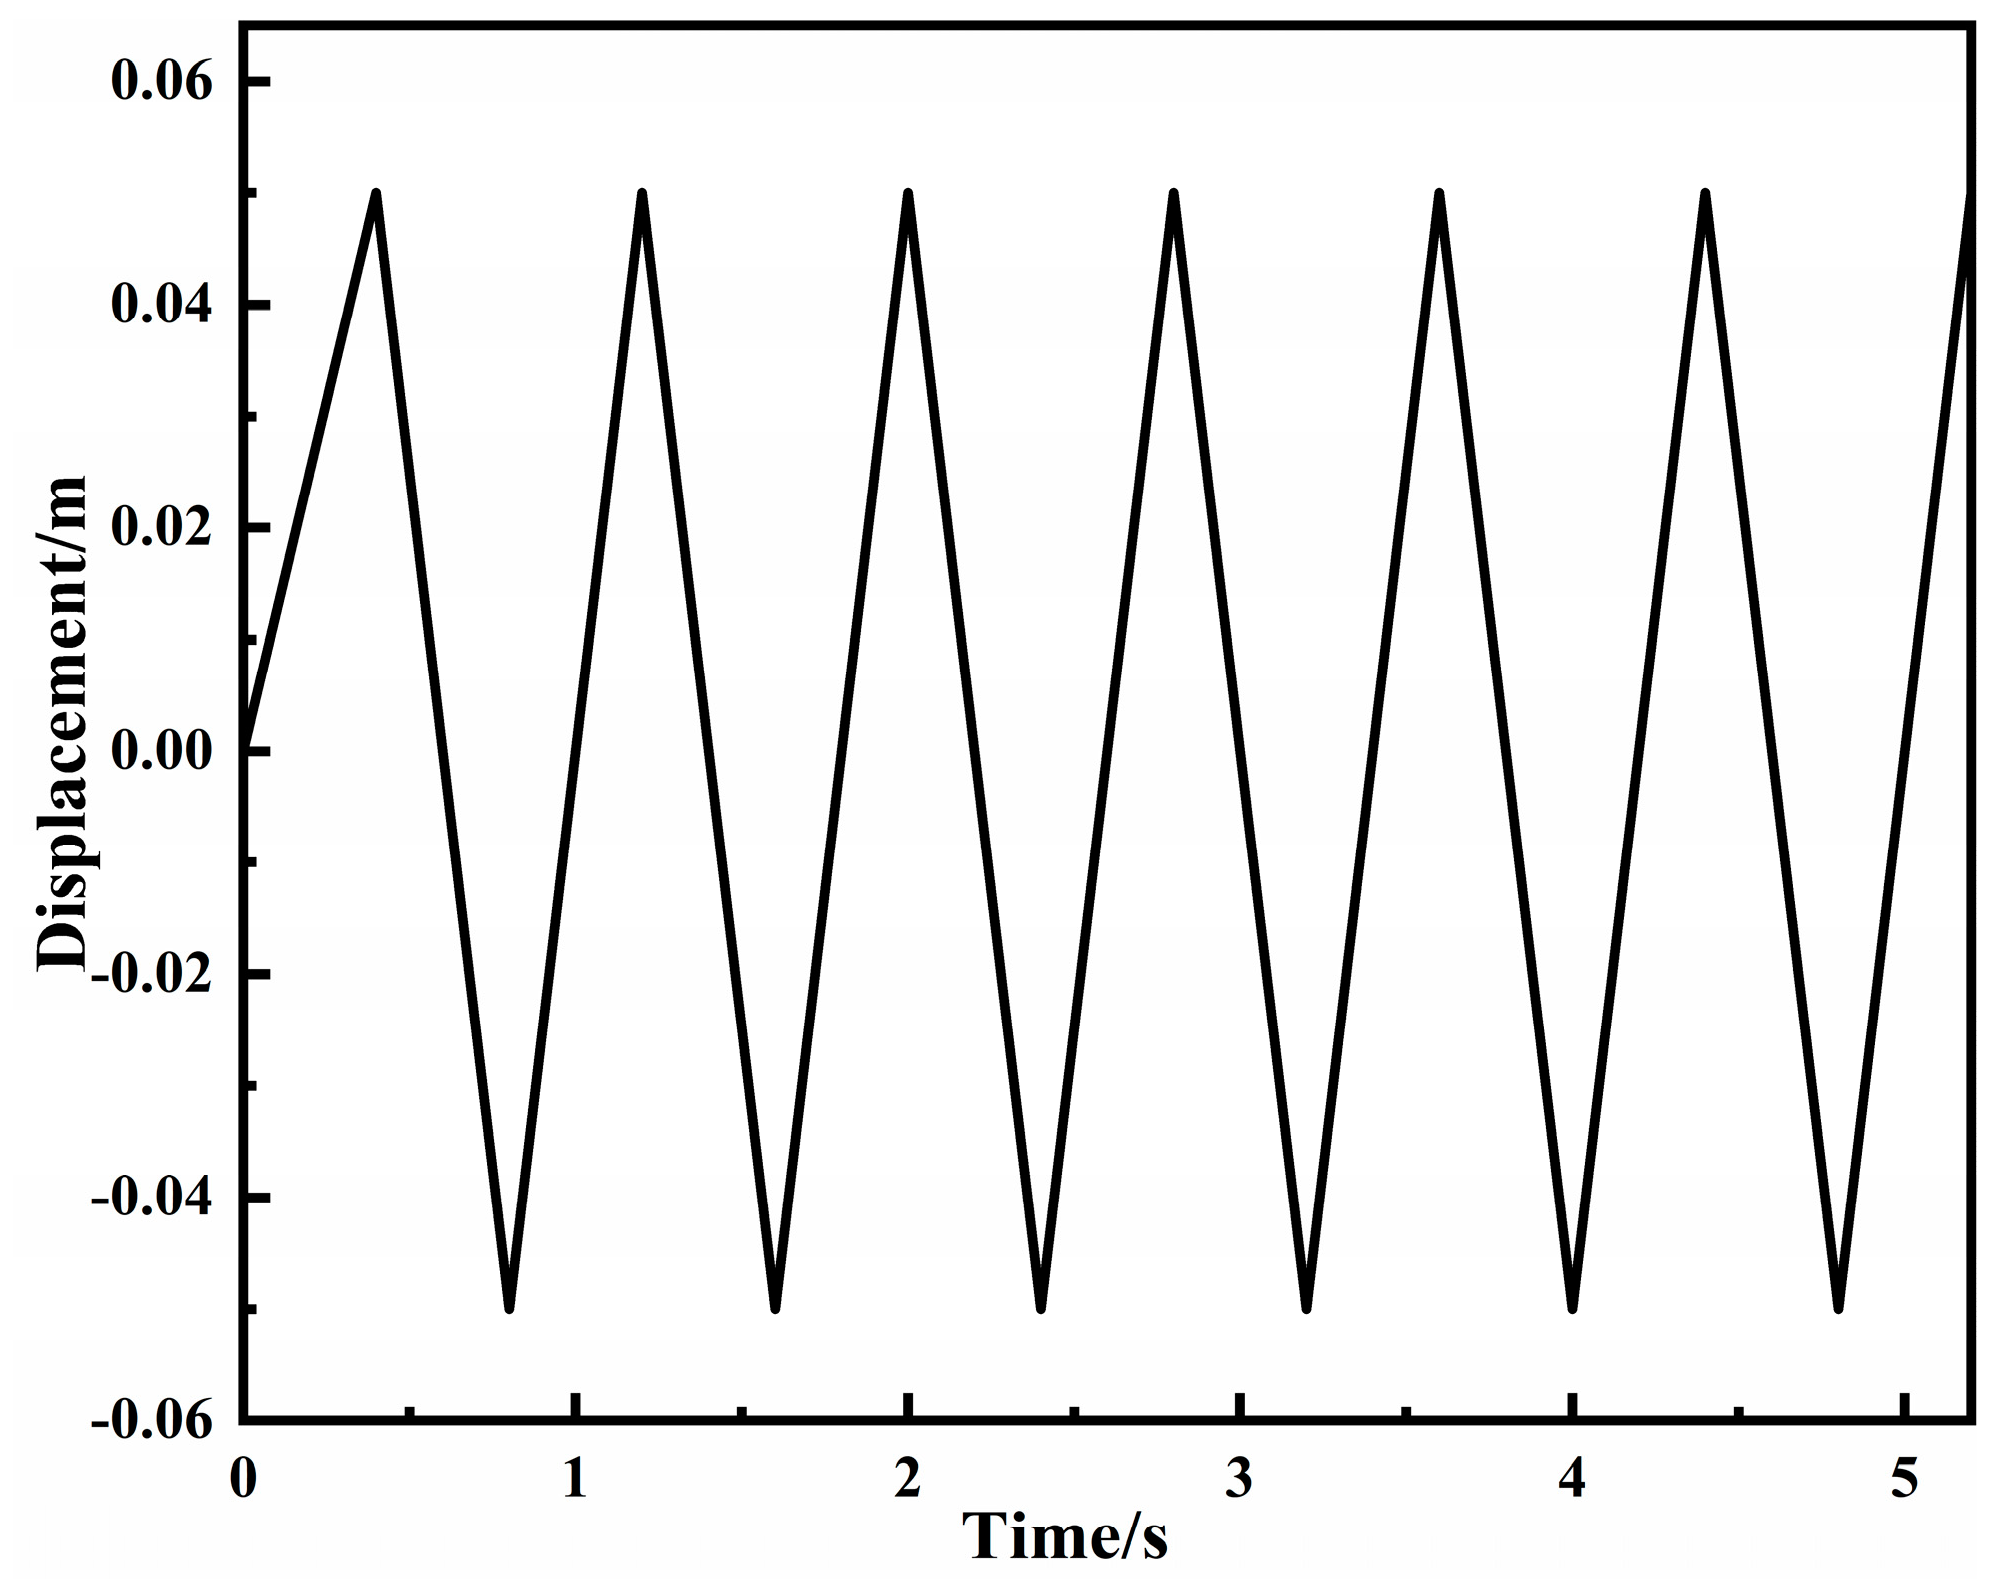
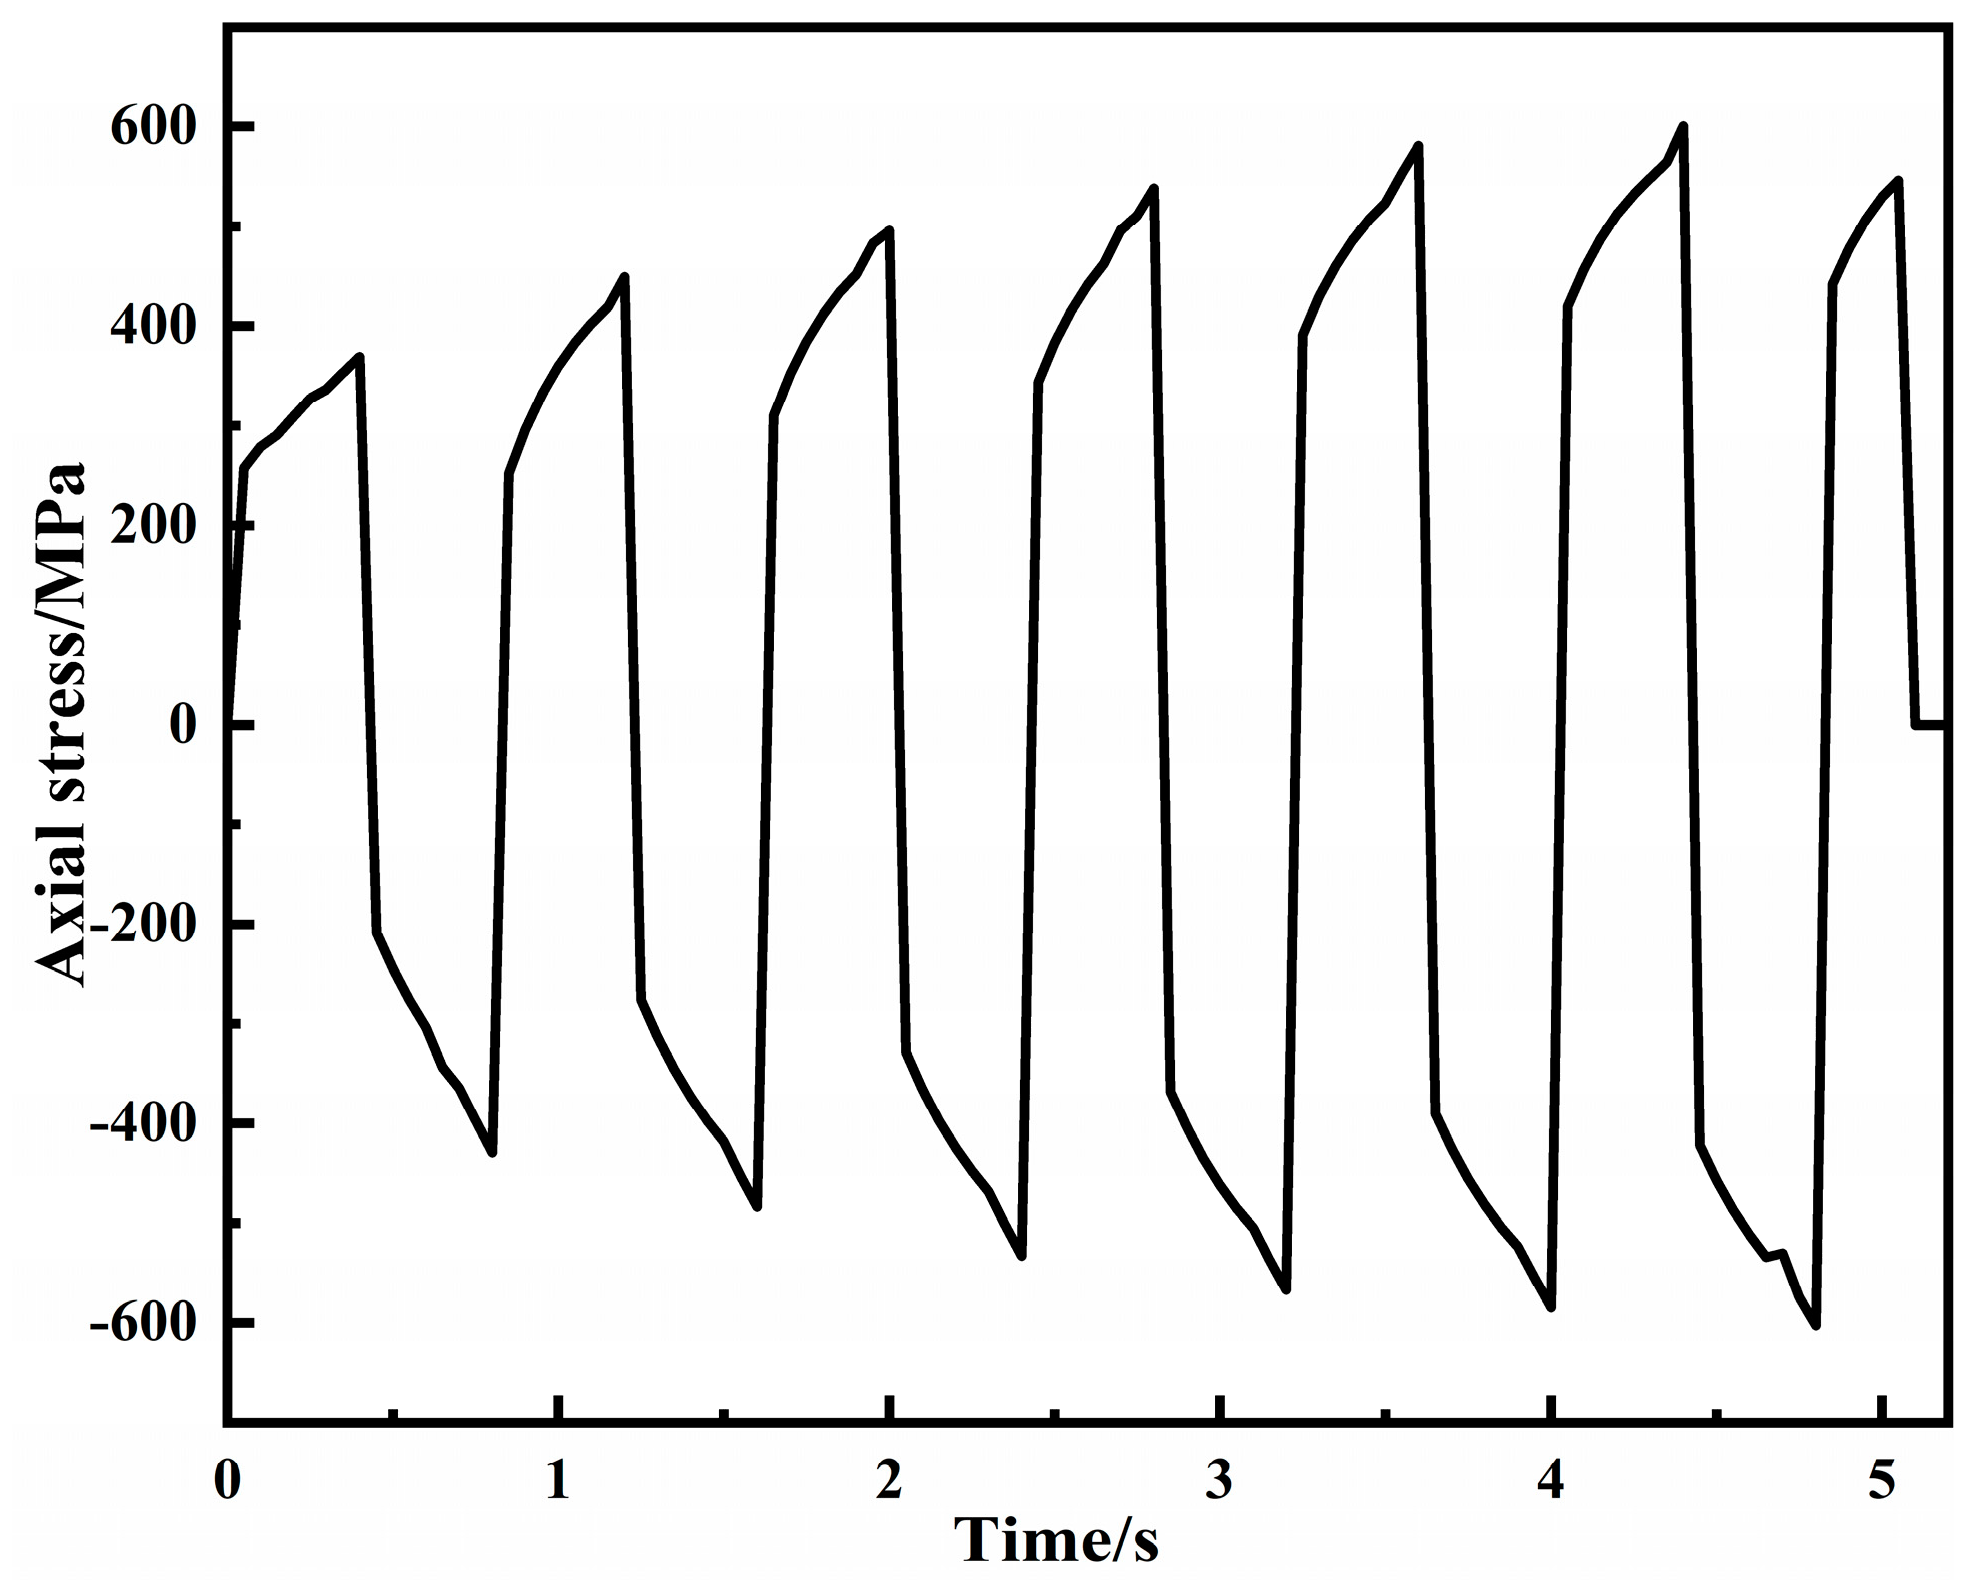
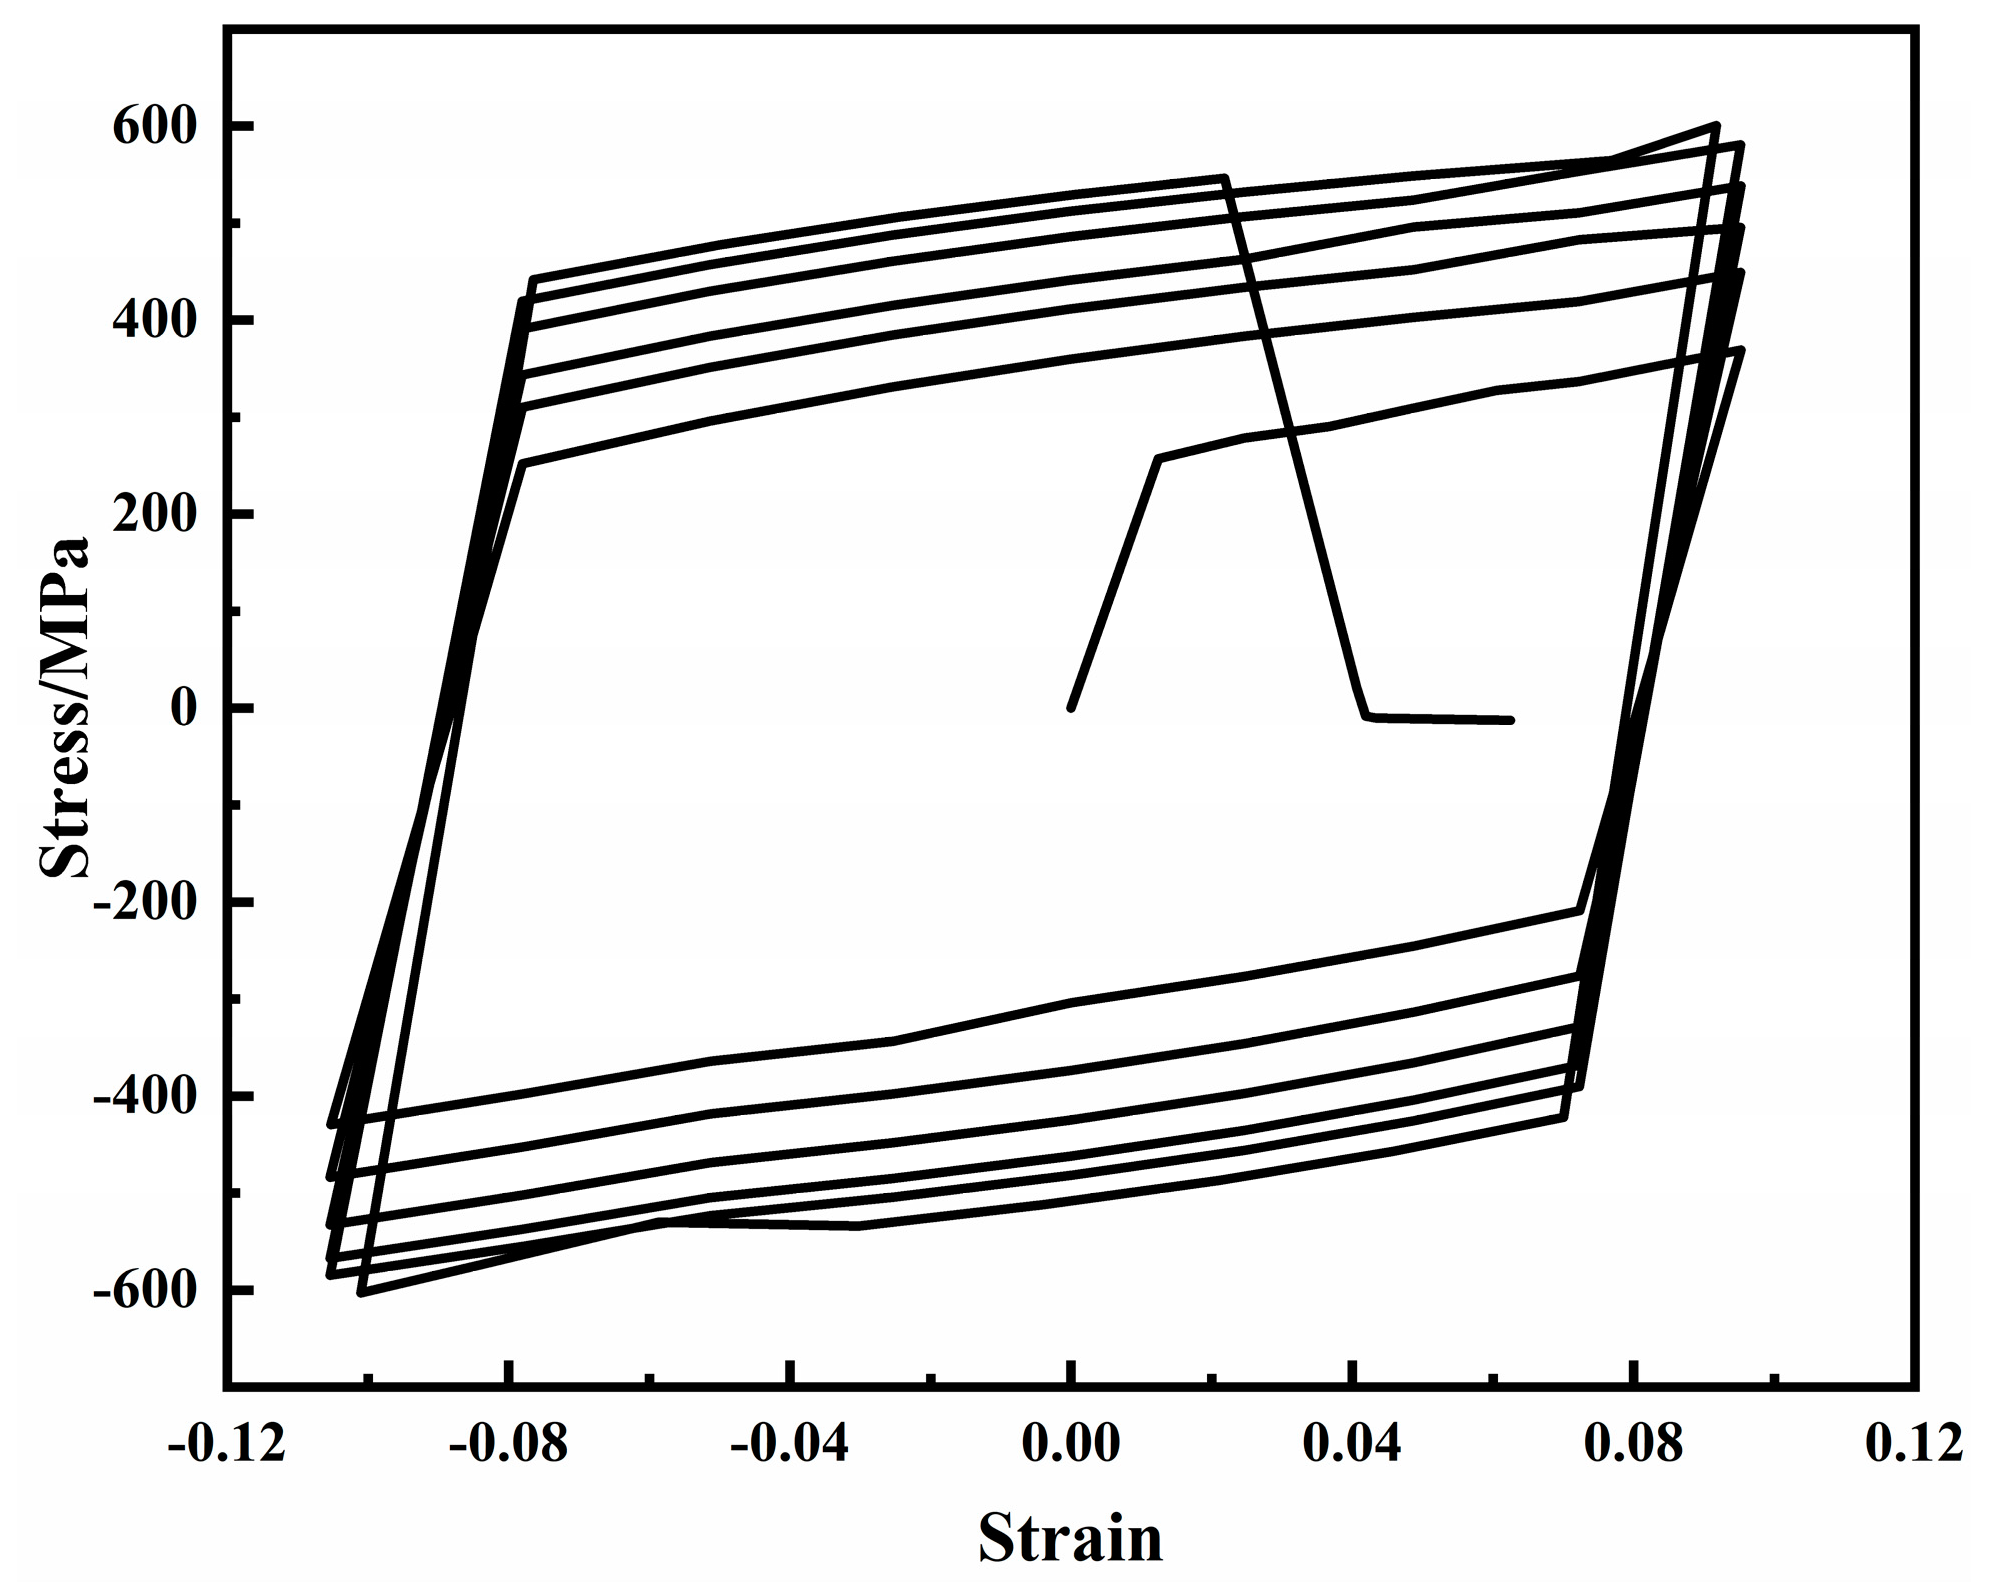
3.3. Subroutine Validation

A circular steel tube (Φ140 × 5) was used to validate the developed model. The material properties of the steel are as follows: elastic modulus E 0 = 206   G P a , yield strength f y = 248   M P a , and length L = 1 m. One end of the structure is fixed, and a reciprocating displacement load is applied to the other end in the z–direction. The loading system is shown in Figure 3, and the material parameters are listed in Table 2.
As seen from the axial stress time–history curve, at 0.05 s, the material reaches its yield strength of 248 MPa for the first time and enters the plastic phase, where damage begins to occur. At 5.2 s, the material’s bearing capacity drops to 0, indicating material failure, whilst the damage index reaches a failure value of 1.0 (Figure 4, Figure 5 and Figure 6).

3.4. Verification of Structural Examples

Due to the substantial number of beam elements in the transmission tower structure and the considerable computational demands of dynamic analysis, it is essential to ascertain the correctness of the subroutine during overall calculations. To this end, both the self–developed subroutine and the Plastic Kinematic constitutive model inherent to the finite element software were employed to compute the finite element model presented in Section 4.1. During computation, the subroutine was configured with a critical damage value of Dcr set to zero, effectively disregarding material damage, and a mixed hardening coefficient of β set to zero, signifying kinematic hardening, which aligns with the Plastic Kinematic constitutive model within the program. The EL Centro seismic wave was selected for bidirectional input, and analyses were conducted at peak ground acceleration (PGA) levels of 0.6 g and 1.0 g, corresponding to the structure’s initial entry into plasticity and advanced plastic development, respectively.
Figure 7 and Figure 8 present comparative time–history curves of the lateral displacement at the apex of the transmission tower and the axial stress in a specific diagonal member under two distinct PGA scenarios. As depicted in the figures, when PGA is 0.6 g, both the displacement time–history curve of the node and the axial stress exhibit a favorable agreement. At PGA = 1.0 g, while the overall trend of the node displacement time–history curve aligns well and the stress response trends are essentially consistent, there is some error in the higher stress regions, which is confined to isolated time points. Thus, it can be concluded that the developed material subroutine possesses high accuracy and can be utilized for the collapse analysis of transmission tower structures under seismic conditions.

4. Simulation and Analysis of the Collapse of the Transmission Tower

4.1. Establishment of a Computational Analysis Model

In this study, a 1000 kV transmission tower from the transmission network system in Xinjiang, China, was used as the research background, and the relevant design information is presented in Table 3. The total height of the tower structure is 101.4 m, with a nominal height of 86.4 m and base width of 16.84 m. It is divided into eight segments, with the base forming the first segment and the top frame located at the eighth segment. The main members of the tower utilize Q345 circular steel tubes, while the diagonal and auxiliary members are constructed from Q235 circular steel tubes. The sectional dimensions and material parameters of the members are distributed across the eight segments of the tower, as depicted in Figure 9. A three–dimensional finite element model of the transmission tower is established using the Beam 161 element in ANSYS/LS–DYNA. Each member is discretized into a single element, and the model is assumed to be fixedly connected to the ground for analysis, as depicted in Figure 10.
A three–dimensional finite element model of the transmission tower was constructed using the Beam 161 element in ANSYS/LS–DYNA, with each component being divided into a single element and rigid connections being applied at the joints of the members. The finite element model comprises 3792 beam elements and 1248 nodes. To simplify the model, the flanges and bolts were omitted during the modeling process, which somewhat reduces the overall weight of the tower. Consequently, this may lead to a slight discrepancy between the stiffness of the finite element model and the actual physical structure. Additionally, considering that the collapse of structures under seismic action is influenced by a multitude of factors, such as foundation conditions, sand liquefaction, and soil–structure interactions, systematically accounting for all these factors is highly challenging. Simultaneously, the focus of this work was to develop a custom material model that accounts for cumulative damage effects within LS–DYNA and analyze the influence of these effects on the collapse mechanism of transmission towers. Consequently, in this study, it was assumed that the foundation of the transmission tower is firmly anchored to the ground in order to simplify the complexity of the problem.
An incremental dynamic analysis of a single transmission tower was conducted using the EL Centro wave, gradually increasing the amplitude of the seismic motion. The input was applied along the longitudinal (along the transmission line), transverse (perpendicular to the transmission line), and vertical directions of the transmission tower at the ratios of 1.00:0.85:0.65. The macroscopic and microscopic characteristic indices of the structure are recorded at each acceleration amplitude until the structure collapses under seismic action.

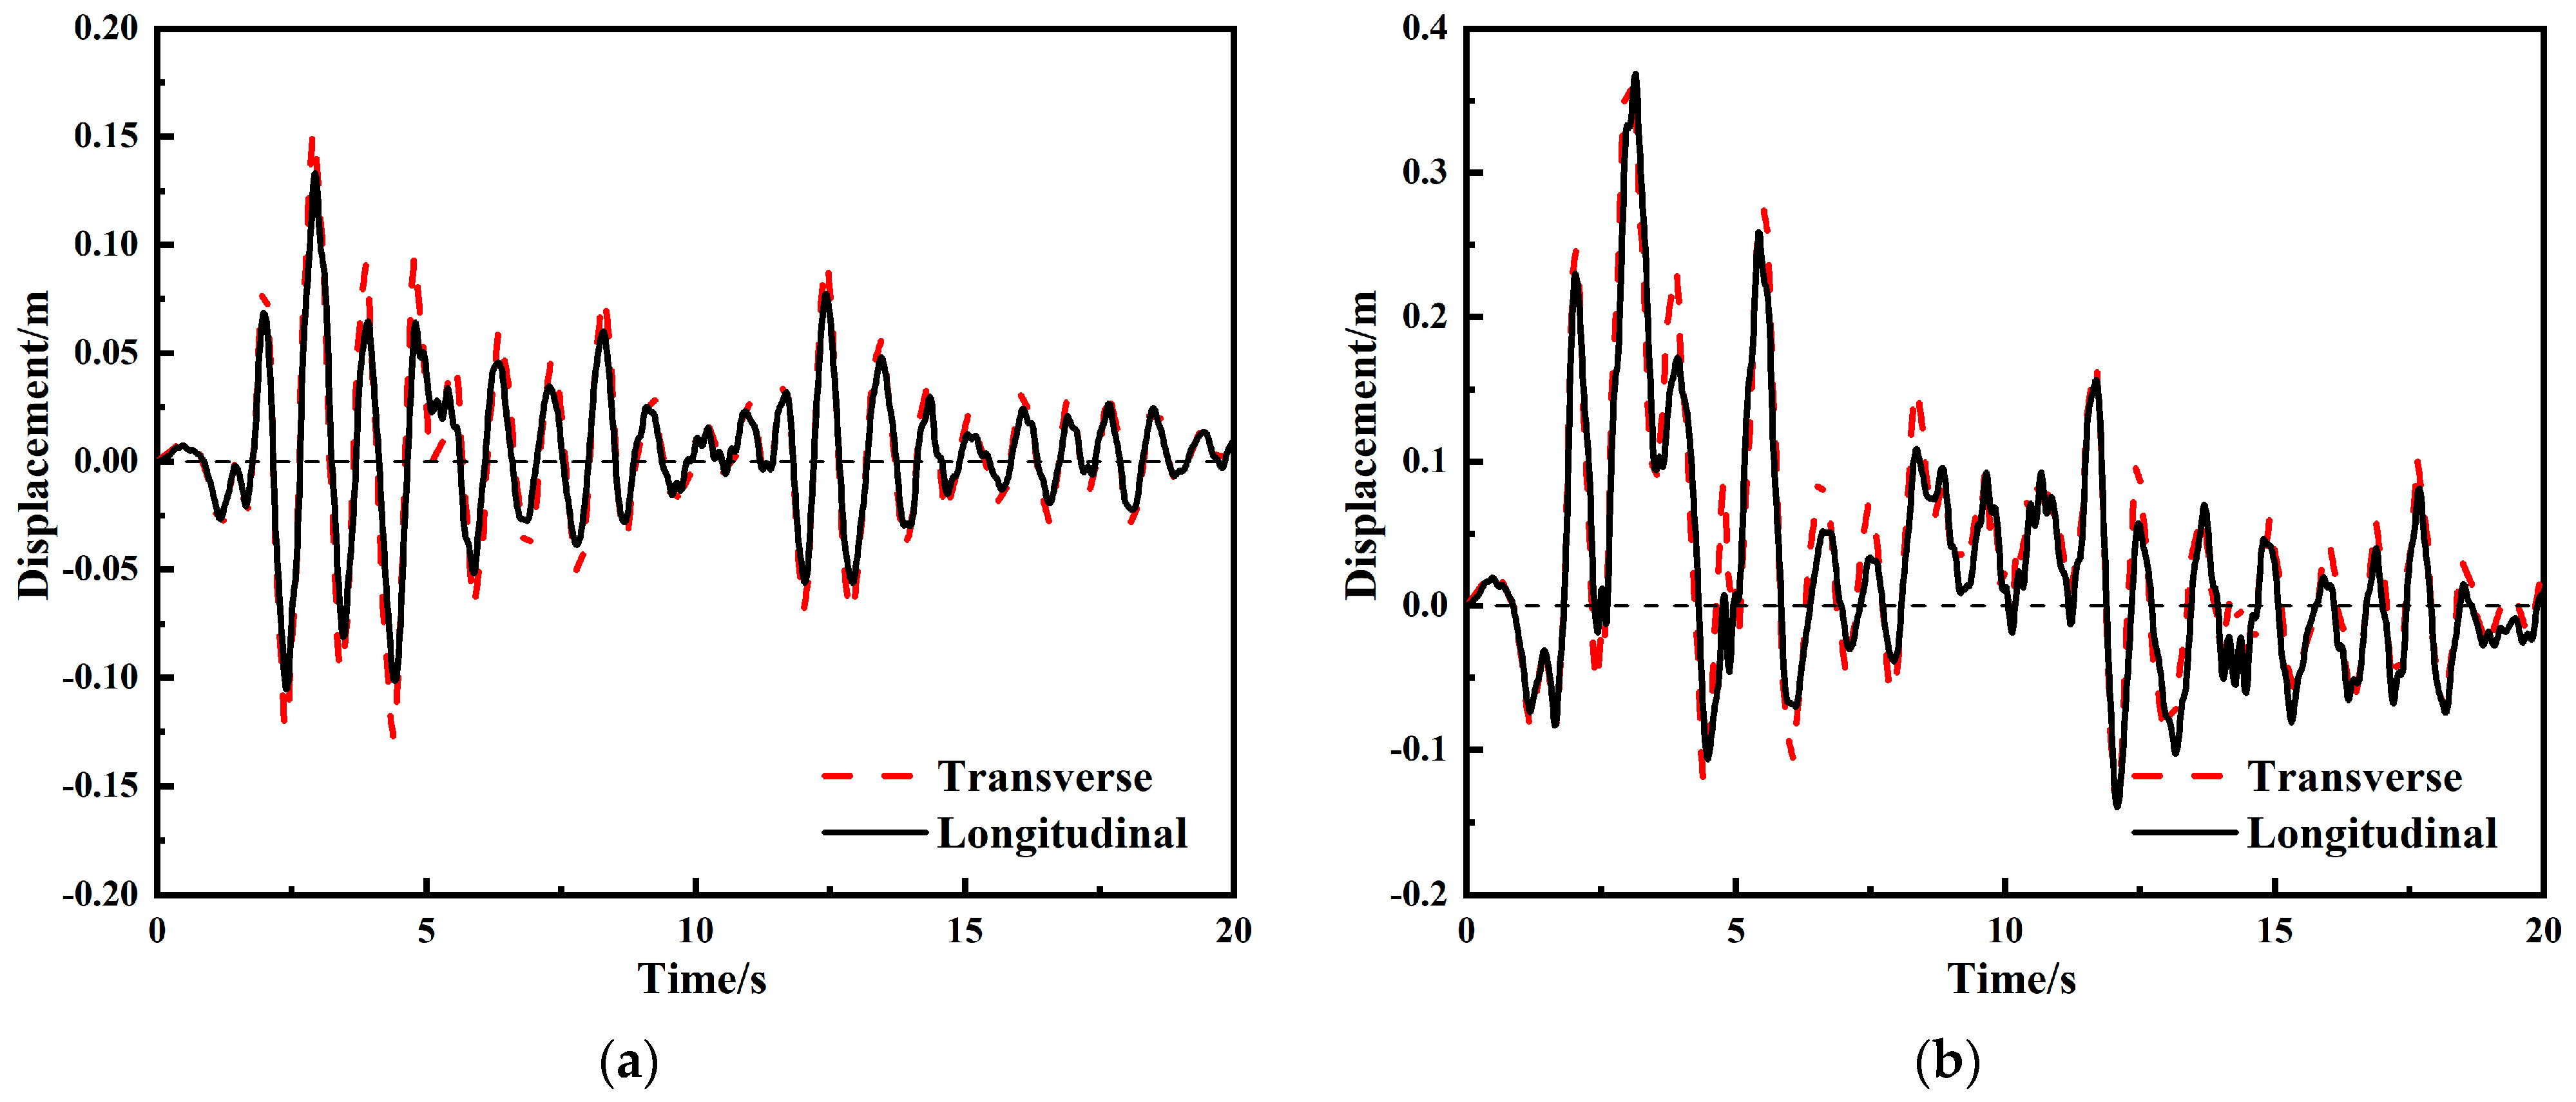
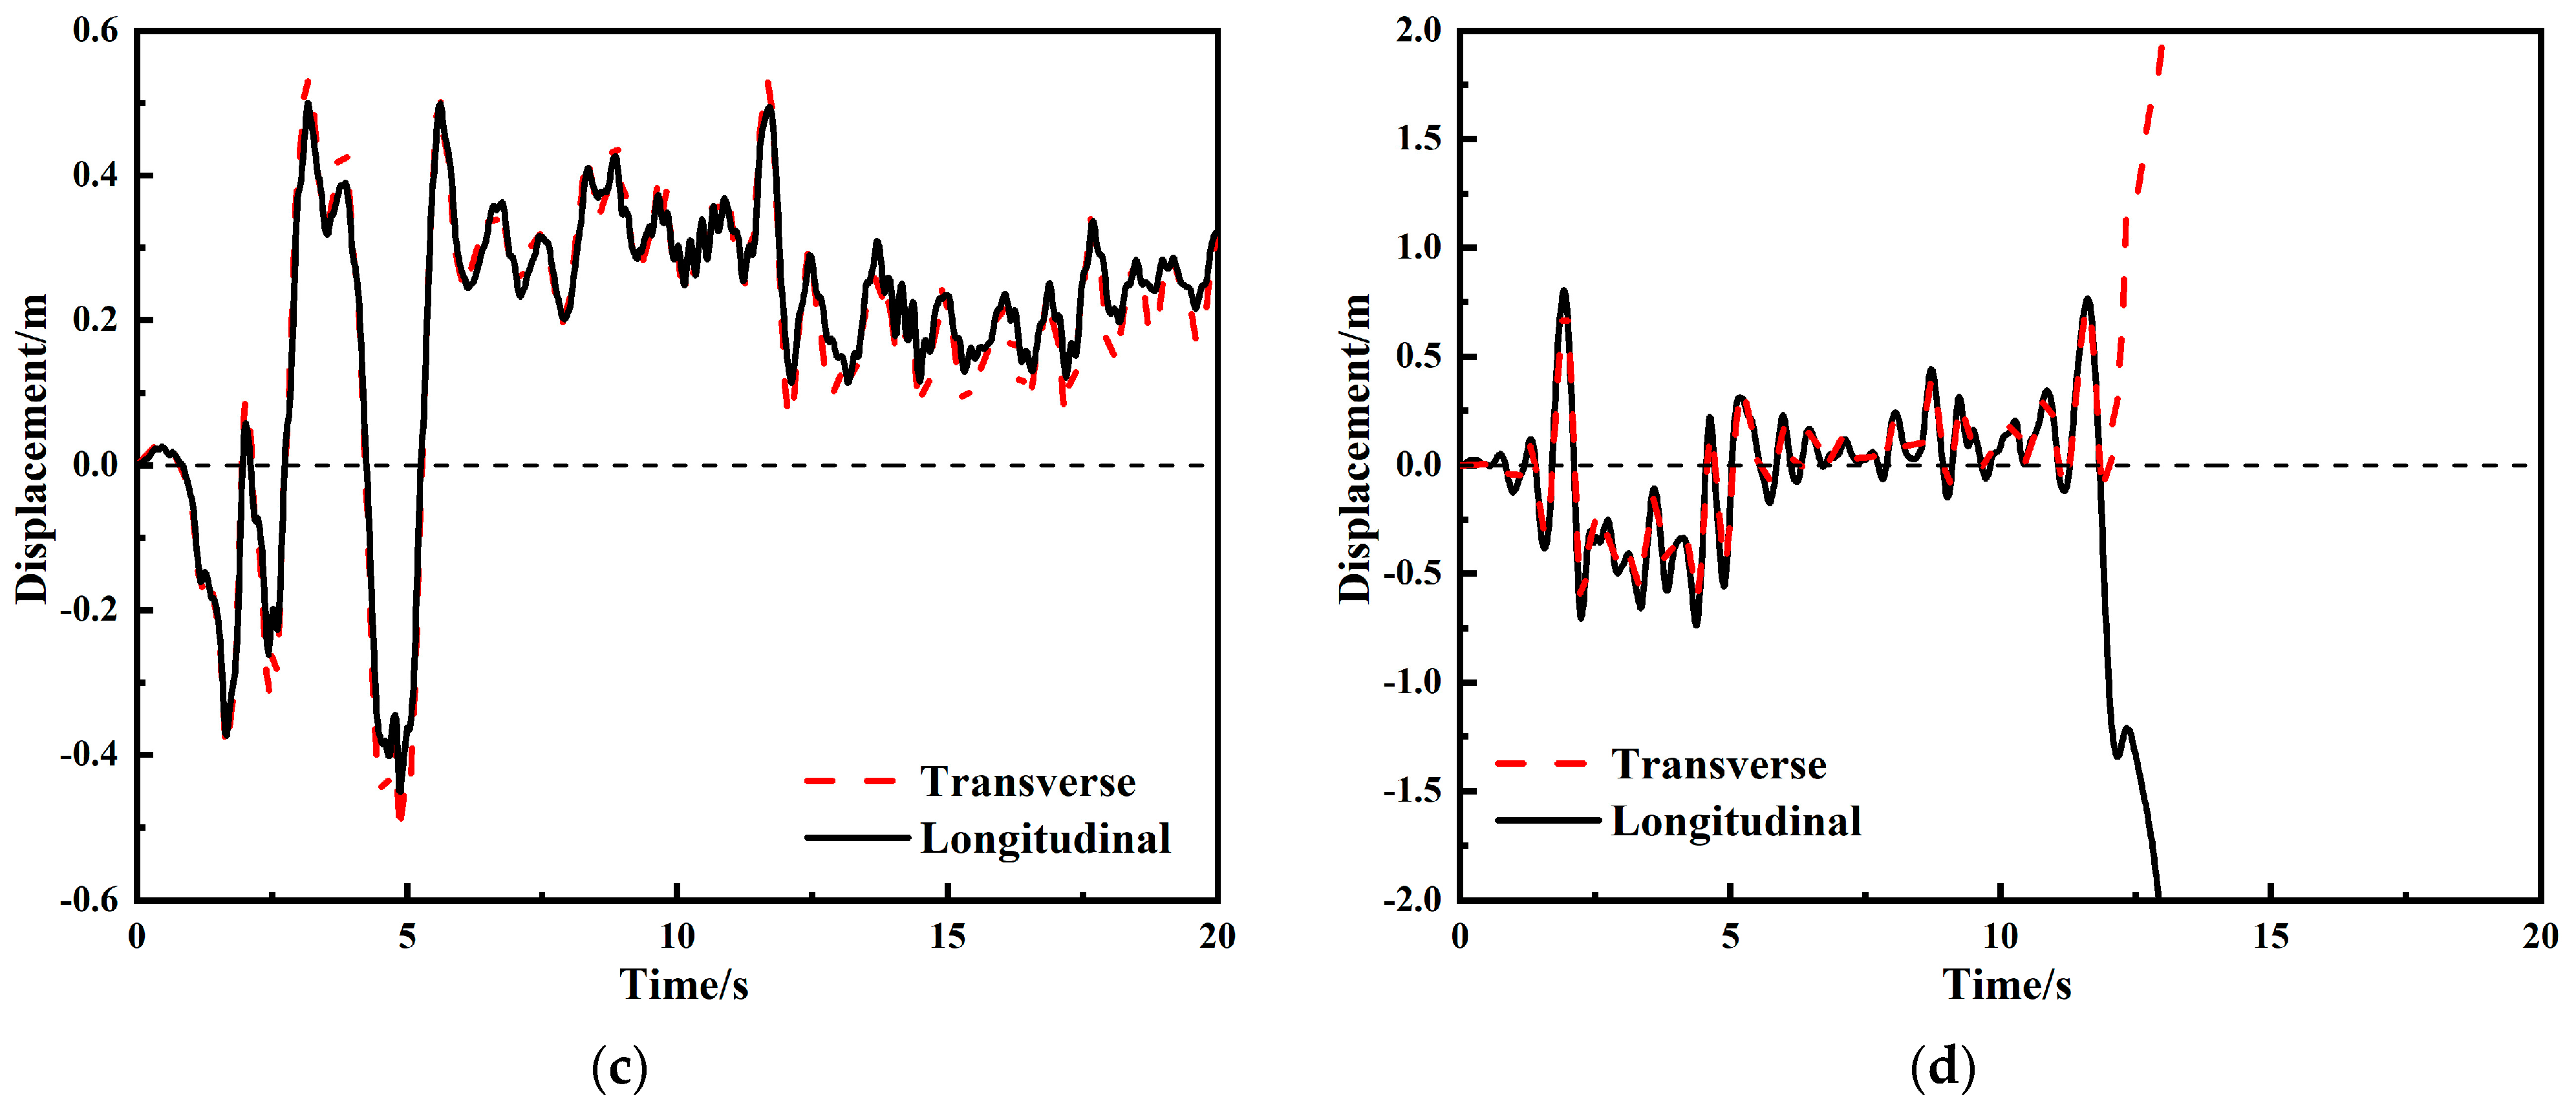
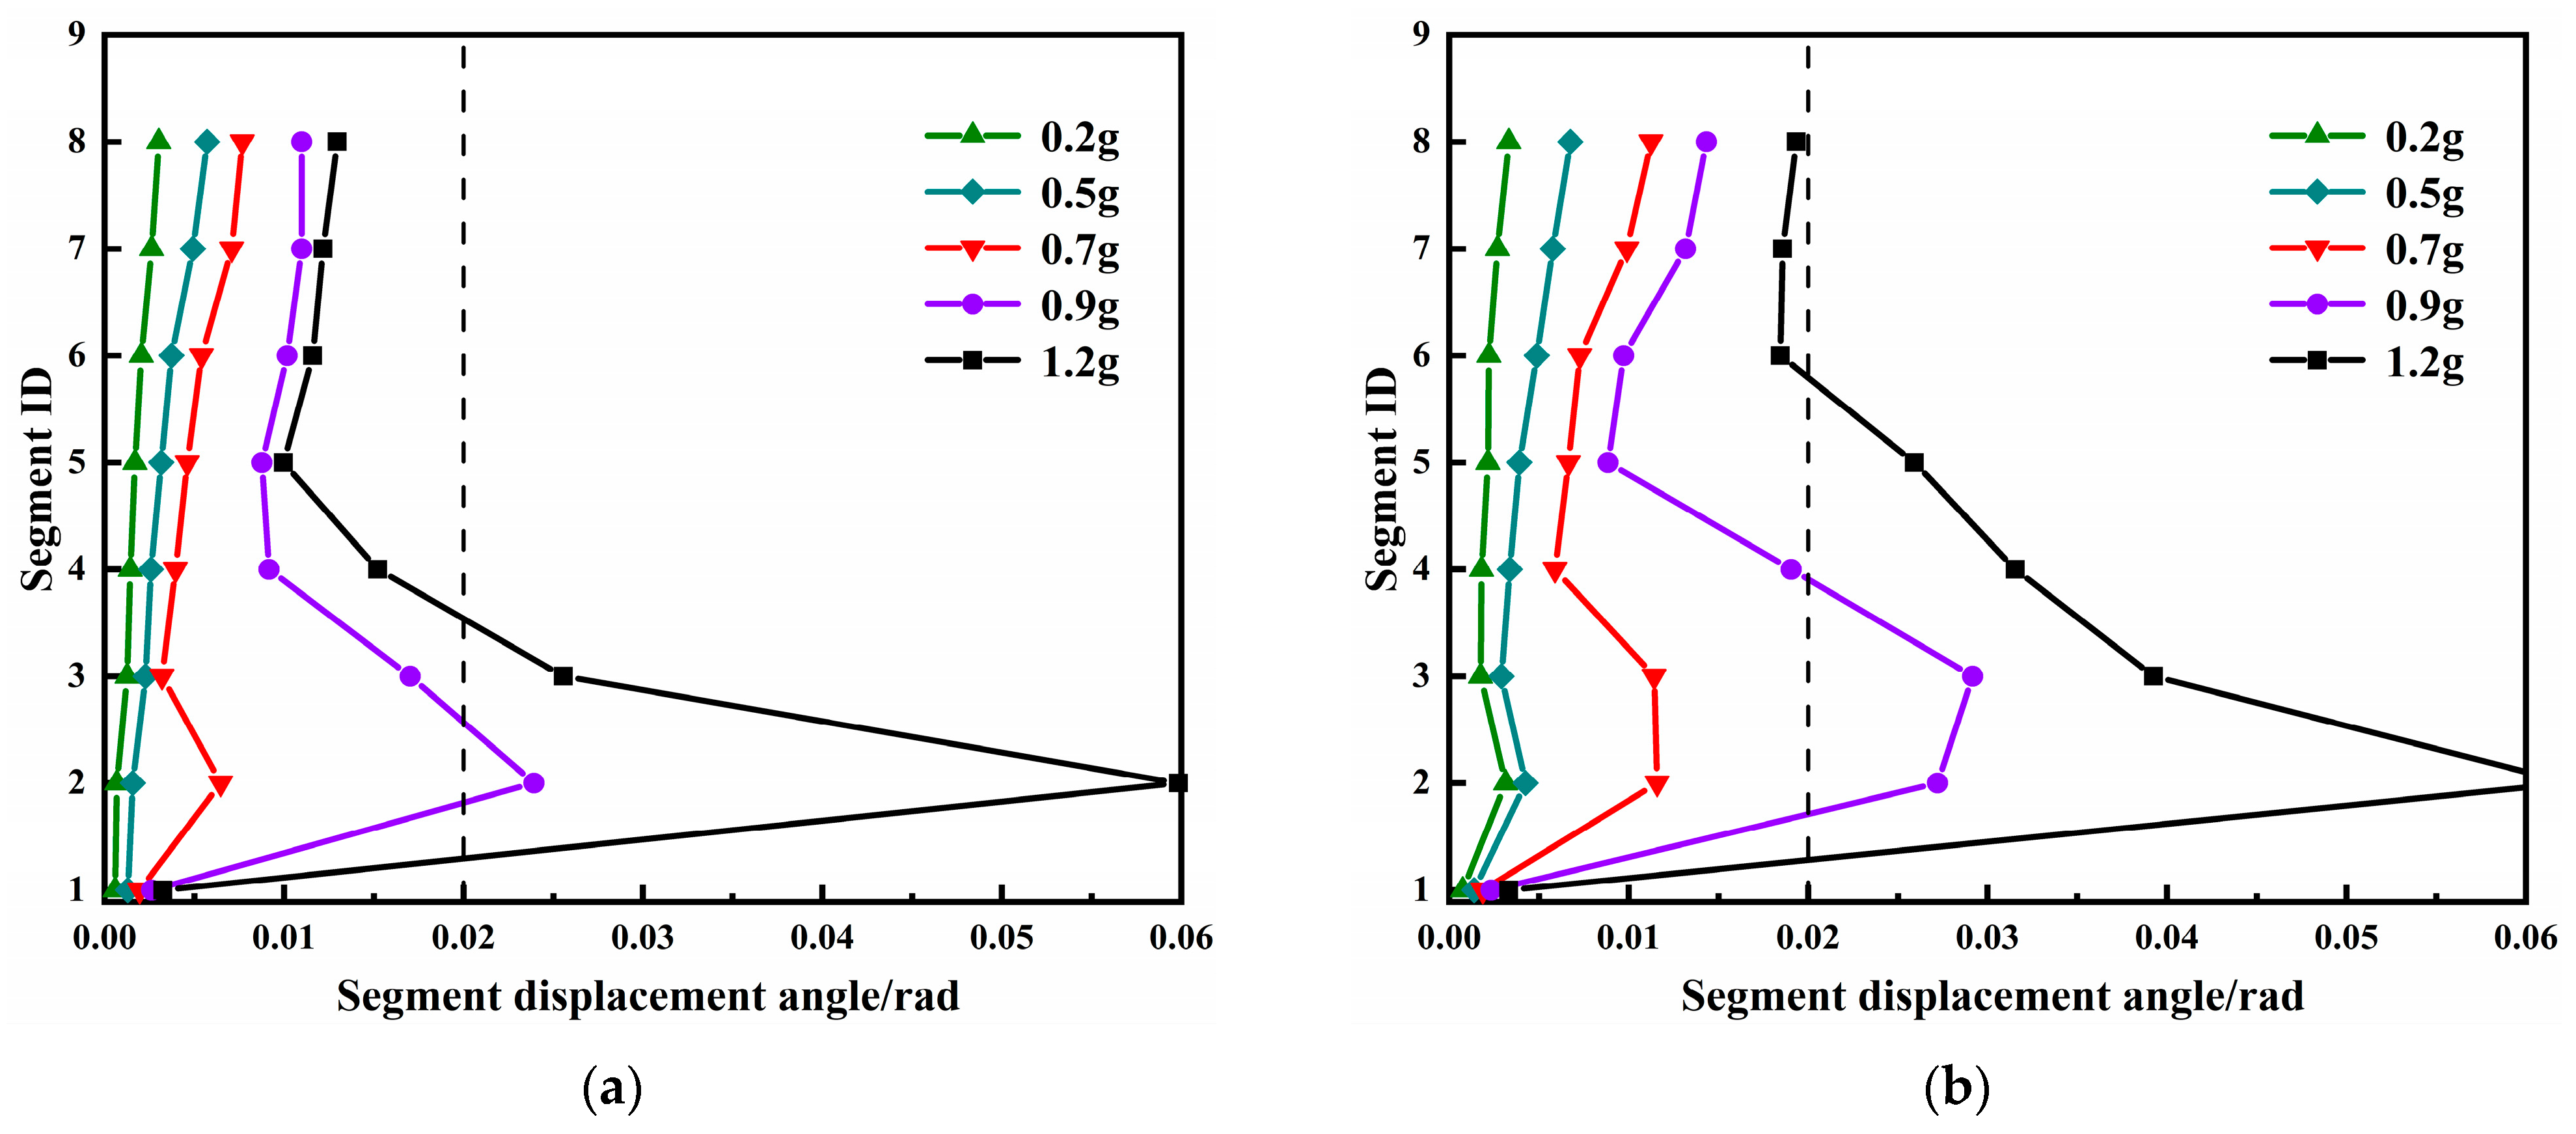
4.2. Dynamic Response Index Analysis

The time–history curve of tower top displacements and the curve of the segment displacement angle of the transmission tower versus the tower height under different peak ground acceleration are shown in Figure 11 and Figure 12. And the segment damage index of transmission tower and the maximum segment displacement angle under different PGAs are shown in Table 4. The figures clearly indicate that the peak displacements of the tower top in the longitudinal and transverse directions increase with the intensification of the seismic action. When the PGA is relatively small, due to the amplification effect of the tall structure, the segment displacement angle exhibits a positive correlation with the height of the segment. As the PGA approaches the critical peak acceleration for collapse, the segmental displacement angle of the transmission tower exhibits a significant mutation between the second and third segments, with particularly notable deformation in the second segment. This indicates that the second segment is the most vulnerable location of the transmission tower.
When PGA = 0.2 g, the maximum segment displacement angle was 0.00332, corresponding to an SDI of 0, indicating that the transmission tower structure is essentially intact under seismic action at this point. At PGA = 0.5 g, the peak displacement of the tower top in the longitudinal and transverse directions exhibited slight oscillations around the equilibrium position, as shown in Figure 11a. The maximum segmental displacement angle was 0.00676, corresponding to an SDI of 0.24486. Comparing this damage index with the range specified in the damage index table, it is evident that the transmission tower had experienced minor damage at this stage. When PGA = 0.7 g, the peak displacements of the tower top in the longitudinal and transverse directions, as depicted in Figure 11b, were 0.363 m and 0.368 m, respectively, and the displacements still oscillate around the equilibrium position. The maximum segmental displacement angle at this time was 0.00676, corresponding to an SDI of 0.52634. According to Table 1, the transmission tower had suffered medium damage. At PGA = 0.9 g, the maximum segment displacement angle of the transmission tower reached 0.02918, exceeding the allowable limit of 1/50 of elastic–plastic story drift ratio specified in China’s seismic design codes for tall steel structures. In Figure 11c, the longitudinal and transverse displacement of the tower top also significantly increased after reaching the peak acceleration of the respective seismic wave (at 2.1 s). They reached their maximum values and then oscillated above and below the equilibrium position, indicating that the deformation had not reached the critical condition for structural failure and collapse. At that point, the SDI at this time was 0.72615. According to the seismic damage levels defined in this study, the transmission tower has already suffered serious damage. When PGA = 1.2 g, the time–history curve of the tower top displacement tended towards infinity over time, and the SDI exceeded 0.8, indicating that the structure collapsed and failed duration of the seismic ground motion.

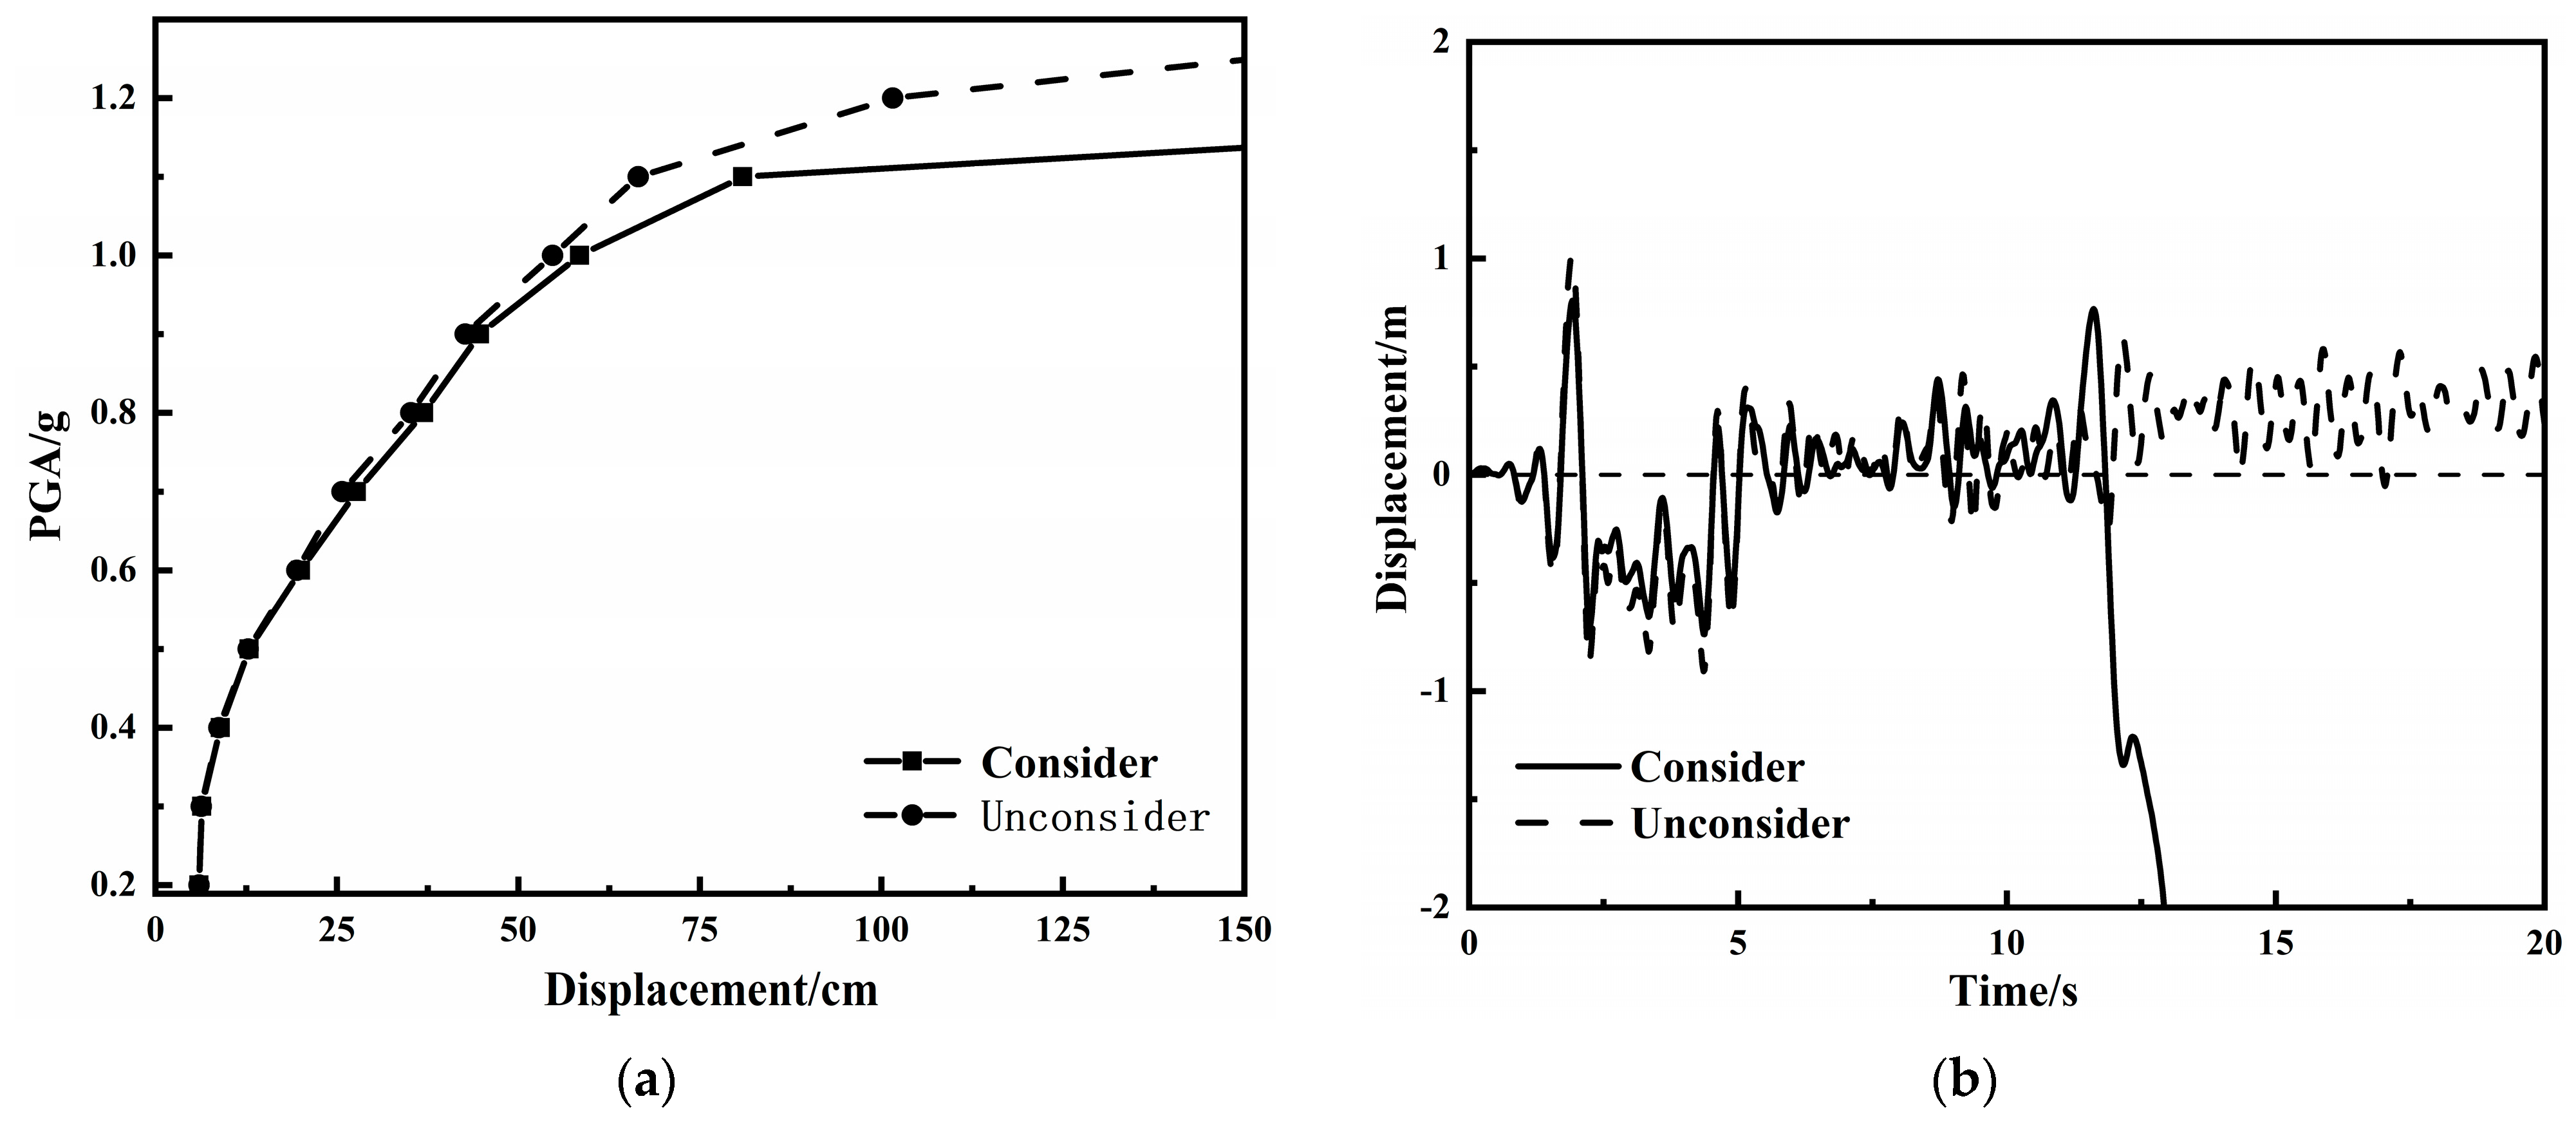
4.3. Mechanism of Transmission Tower Collapse Considering the Influence of the Cumulative Effect

Figure 13a presents the maximum longitudinal displacement of the tower top, with and without considering cumulative damage, as the seismic intensity varies. Figure 13b shows the longitudinal displacement time–history curves of the tower top for both scenarios at PGA = 1.2 g. As indicated by Figure 13a, prior to a PGA of 0.6 g, the tower top displacement response with and without considering the damage accumulation effect was essentially identical and shows little change. This suggests that the structure is predominantly in the elastic phase during this period. As the PGA continued to increase up to 1.0 g, the overall structural stiffness decreased, which led to the further development of plastic deformation and a noticeable acceleration in the displacement response. However, during this period, the impact of damage on the structure was not significant, as plastic deformation was not fully developed. Consequently, the difference in the maximum tower top displacement between the two scenarios was minimal. Beyond the PGA of 1.0 g, the damage effects gradually increased, and the plastic deformation became fully developed in both depth and width, resulting in an increasing difference in the maximum displacement of the tower top. This phenomenon can be attributed to the fact that, when the damage accumulation process is taken into account, the material’s elastic modulus and strength decrease continuously as seismic loading persists, leading to a reduction in the stiffness of the members. This, in turn, leads to a decrease in the overall structural stiffness, causing the displacement response to become more intense. By examining Figure 13b, it can be observed that, at PGA = 1.2 g, structures considering damage accumulation exhibited vibration dispersion, whereas the PK structure maintained a convergent state. This observation serves to illustrate that the PK material model may overestimate the seismic performance of the transmission tower, and the impact of material damage accumulation cannot be disregarded.
Figure 14 shows the time–history curves of the damage development in member 956 (the position of the member is shown in Figure 7) and the second segment at PGA = 0.7 g. It can be seen that the damage development of member 956 and the second segment exhibit the same damage trend, regardless of whether the damage accumulation effect is considered or not. The extent of damage is zero until the seismic wave reaches its peak acceleration, at which point the structure is in an elastic phase. Subsequently, the damage to the member and segment increases abruptly. With the continuous input of ground motions, the damage accumulates gradually, leading to progressive and irreversible structural damage.
Furthermore, both the member and the entire segment experience a significant increase in the damage index when the damage accumulation effect is considered, with a maximum increase of approximately 58%. The damage levels of both the member and the segment shift from a minor to medium damage. It can be observed that considering the damage accumulation process of material allows for a more accurate characterization of stiffness degradation and the potential collapse of the structure. Furthermore, the failure destruction of the structure under seismic action is more consistent with engineering reality.

4.4. Analysis of the Transmission Tower Collapse Mechanism

Figure 15 illustrates the overall collapse process of the transmission tower. Prior to 2.1 s, the structure exhibited minimal damage, with each member sustaining only negligible damage. This indicates that the structure was in the elastic working stage, primarily characterized by horizontal swaying. With the continuous input of ground motions, the structure entered the plastic damage stage at 2.1 s. The initial damage then began in a diagonal member within the second segment, and subsequently, the connected members also sustained damaged. As IDA continued, damage to the member accumulated, and damage also began to appear at the tower legs. When t = 5.46 s, a diagonal member 964 in the second segment reached a damage value of 1.0. The corresponding axial force and strain time–history curves are shown in Figure 16.
From the diagram, it is evident that when member 964 fails, its axial force decreases swiftly towards zero. Simultaneously, there is a steep rise in strain. This phenomenon is attributed to the persistent overloading, which causes buckling and instability in the member. Consequently, its load–bearing capacity dramatically decreases, prompting a redistribution of internal forces within the transmission tower. The internal forces in the adjacent members to the failed member increased rapidly, with several members near the failed one succumbing sequentially from 5.46 s to 9.81 s; however, the structure did not undergo significant deformation during this time.
As the seismic motion persistently exerted its load, a multitude of diagonal and auxiliary members within the second segment underwent failure and collapse, leading to the disruption of the structure’s force transmission pathways. As a result, the ongoing redistribution of internal forces progressively compromised the integrity and coherence of the connections between segments. Ultimately, at t = 10.01 s, a significant number of members in the tower legs and between the second and third segments buckled and became unstable, resulting in pronounced local deformation and damage to the transmission tower. Furthermore, as illustrated in Figure 11d, the substantial deformation of the tower top displacement at this critical point suggests that the transmission tower collapsed under the compounded stress of seismic activity and vertical loading.
Figure 17 shows the time–history for the development of segment damage in the transmission tower leading up to collapse. Note that the figure only illustrates the evolution of the front three segments, as the other segments are essentially in a largely intact state during the seismic action. It can be seen that the damage index of the second segment is consistently greater than the other segments throughout the time–history. The occurrence of damage in the first and third segments occurs later than in the second segment. During the period of peak ground acceleration, the damage values surge rapidly, with the rate of increase gradually stabilizing. When t = 9 s, the damage index of the second segment first exceeded the defined collapse index of 0.8, resulting in the loss of the structural load–bearing capacity. The damage values of other segments also increased rapidly, as the failure of the second segment caused a rapid progression of damage in the adjacent segments, leading to the successive failure of the other segments.
From the above analysis process, it is clear that the seismic collapse of the transmission tower can be attributed to the sequential failure of numerous diagonal, auxiliary, and main members in the second segment, which ultimately compromised the structural force transmission mechanism. And the simulated transmission tower structure experienced collapse and destruction at 10.01 s, which did not coincide with the peak of the seismic acceleration. The collapse mechanism can be summarized as follows: Under seismic action, the members that constitute the transmission tower accumulate damage, resulting in irreversible damage. This leads to a continuous degradation of the structural load–bearing capacity and disruption of the load transfer path, culminating in collapse and destruction at the structure’s most vulnerable point.

5. Conclusions

This work considered the damage accumulation constitutive model, with a circular steel tube serving as the research object. The user subroutine of mixed hardening material applicable to the beam element was developed based on the finite element program LS–DYNA. Using this subroutine, an incremental dynamic analysis of a transmission tower under seismic action was conducted. Finally, the investigation focused on the influence of damage accumulation on the collapse mechanism of transmission towers subjected to seismic action. The following conclusions are drawn:
(1). Mixed hardening elastic–plastic constitutive equations applicable to circular steel tube were derived, the Bonora plastic damage model was introduced, the material subroutine UMAT applicable to the LS–DYNA spatial beam element was written, and the accuracy of the subroutine was verified;
(2). During the elastic phase, the damage accumulation effect does not significantly impact the dynamic response of the transmission tower. However, as the tower enters the plastic phase under seismic action, the cumulative damage incrementally increases the displacement at the tower top. When the PGA reaches 0.8 g, the tower top displacement increases by 10.21%. At a PGA of 1.2 g, the tower top displacement, with the damage accumulation effect taken into account, exceeds the displacement without considering this effect by more than double. In contrast to the Plastic Kinematic material model, the dynamic ultimate load–bearing capacity of the structure, factoring in the cumulative damage, exhibits a reduction of 16.24%. Considering the influence of the damage accumulation effect in seismic design enhances the reliability of transmission towers, a consideration that holds profound practical significance for the disaster prevention and mitigation efforts of these structures;
(3). The collapse mechanism of the transmission tower under the action of three–directional El Centro seismic waves is as follows: continuous damage accumulation leads to buckling failure of members in the structure’s weak points, disrupting the force transmission paths and ultimately resulting in collapse, rather than collapse occurring at the peak of ground motion acceleration. Accounting for the cumulative damage effects elevates the degree of damage by one level, causing the transmission tower to collapse prematurely, while the overall impact on the structure’s failure mode remains relatively insignificant.

Author Contributions

Conceptualization, H.L.; Funding acquisition, H.L.; Methodology, H.L.; Software, P.N.; Validation, Y.W.; Formal analysis, P.N. and S.H.; Investigation, Y.W.; Data curation, Y.W.; Writing—original draft preparation, P.N. and S.H.; Writing—review and editing, P.N. and Y.W. All authors have read and agreed to the published version of the manuscript.

Funding

This research was supported by the Key Research and Development Project of Xinjiang Uygur Autonomous Region of China, Project Number: 2023B01023.

Data Availability Statement

The data presented in this study are available on request from the corresponding author.

Conflicts of Interest

Author Siyu Han was employed by the company China Electronics System Engineering No. 2 Construction Co., Ltd. The remaining authors declare that the research was conducted in the absence of any commercial or financial relationships that could be construed as a potential conflict of interest.

References

  1. Alminhana, F.; Mason, M.; Albermani, F. A compact nonlinear dynamic analysis technique for transmission line cascades. Eng. Struct. 2018, 158, 164–174. [Google Scholar] [CrossRef]
  2. Albermani, F.; Kitipornchai, S.; Chan, R. Failure analysis of transmission towers. Eng. Fail. Anal. 2009, 16, 1922–1928. [Google Scholar] [CrossRef]
  3. Park, H.S.; Choi, B.H.; Kim, J.J.; Lee, T.H. Seismic performance evaluation of high voltage transmission towers in South Korea. Ksce. J. Civ. Eng. 2016, 20, 2499–2505. [Google Scholar] [CrossRef]
  4. Meek, J.L.; Lin, W.J. Geometric and material nonlinear analysis of thin-walled beam-columns. J. Struct. Eng. 1990, 116, 1473–1490. [Google Scholar] [CrossRef]
  5. Meek, J.L.; Loganathan, S. Geometric and material non-linear behaviour of beam-columns. Comput. Struct. 1990, 34, 87–100. [Google Scholar] [CrossRef]
  6. Rao, N.P.; Knight, G.M.S.; Mohan, S.J.; Lakshmanan, N. Studies on failure of transmission line towers in testing. Eng. Struct. 2012, 35, 55–70. [Google Scholar]
  7. Li, Q.W.; Li, H.N. Study on dynamic stability of transmission tower structures. J. Disa Prev. Mitig Eng. 2008, 28, 202–207. (In Chinese) [Google Scholar]
  8. Tian, L.; Ma, R.S.; Li, H.N.; Wang, Y. Progressive collapse of power transmission tower-line system under extremely strong earthquake excitations. Int. J. Struct. Stab. Dy. 2016, 16, 1550030. [Google Scholar] [CrossRef]
  9. Tian, L.; Pan, H.Y.; Ma, R.S.; Qiu, C.X. Collapse simulations of a long span transmission tower-line system subjected to near-fault ground motions. Earthq. Struct. 2017, 13, 211–220. [Google Scholar]
  10. Shin, M.; Kim, B. Effects of frequency contents of aftershock ground motions on reinforced concrete (RC) bridge columns. Soil. Dyn. Earthq. Eng. 2017, 97, 48–59. [Google Scholar] [CrossRef]
  11. Zhi, X.D.; Fan, F.; Shen, S.Z. Application of material damage cumulation in reticulated shells under severe earthquakes. J. Harbin. Inst. Tech. (in Chinese). 2008, 40, 169–173. [Google Scholar]
  12. Prager, W. A new method of analyzing stresses and strains in work-hardening plastic solids. J. Appl. Mech. 1956, 23, 493–496. [Google Scholar] [CrossRef]
  13. Axelsson, K.; Samuelsson, A. Finite element analysis of elastic–plastic materials displaying mixed hardening. Int. J. Numer. Meth. Eng. 1979, 14, 211–225. [Google Scholar] [CrossRef]
  14. Huang, K.Z.; Huang, Y.G. Solid-Constitutive Relations; Tsinghua University Press: Beijing, China, 1999; pp. 14–27. [Google Scholar]
  15. Chen, L.S.; Zhao, X.H. Theory of matter with elastic range and definition of backstress. Appl. Math. Mech. 1999, 50, 452–459. [Google Scholar]
  16. Bonora, N.; Gentile, D.; Pirondi, A.; Newaz, G. Ductile damage evolution under triaxial state of stress: Theory and experiments. Int. J. Plasticity. 2005, 21, 981–1007. [Google Scholar] [CrossRef]
  17. Li, Z.X.; Lu, Y.; Xu, L.H.; Ding, Y. Nonlinear seismic damage control of steel-concrete hybrid structure using MR dampers. China. Civ. Eng. J. 2013, 46, 38–45. (In Chinese) [Google Scholar]
  18. Shen, Z.Y.; Dong, B. An experiment-based cumulative damage mechanics moUdel of steel under cyclic loading. Adv. Struct. Eng. 1997, 1, 39–46. [Google Scholar] [CrossRef]
  19. Park, Y.J.; Ang, A.H.S. Mechanistic seismic damage model for reinforced concrete. J. Struct. Eng. 1985, 111, 722–739. [Google Scholar] [CrossRef]
  20. Park, Y.J.; Ang, A.H.S.; Wen, Y.K. Seismic damage analysis of reinforced concrete buildings. J. Struct. Eng. 1985, 111, 740–757. [Google Scholar] [CrossRef]
  21. Ou, J.P.; Niu, D.T.; Wang, G.Y. Fuzzy dynamic reliability analysis and design of nonlinear seismic steel structures. J. Harbin Archit. 1991, 24, 9–20. [Google Scholar]
Figure 1. Stress update diagram.
Buildings 14 02243 g001
Figure 2. Flow chart of the usermat.
Buildings 14 02243 g002
Figure 3. Loading system.
Buildings 14 02243 g003
Figure 4. Axial stress time–history curve.
Buildings 14 02243 g004
Figure 5. Stress–Strain relationship curve.
Buildings 14 02243 g005
Figure 6. The process of damage development.
Buildings 14 02243 g006
Figure 7. Algorithmic comparison curve for PGA = 0.6 g. (a) Time–history curves of tower top displacements; (b) time–history curves of axial stress.
Buildings 14 02243 g007
Figure 8. Algorithmic comparison curve for PGA = 1.0 g. (a) Time–history curves of tower top displacements; (b) time–history curves of axial stress.
Buildings 14 02243 g008
Figure 9. Transmission tower size and member distribution information.
Buildings 14 02243 g009
Figure 10. FE model of the transmission tower.
Buildings 14 02243 g010
Figure 11. Time–history curves of tower top displacements under different PGAs. (a) PGA = 0.5 g; (b) PGA = 0.7 g; (c) PGA = 0.9 g; (d) PGA = 1.2 g.
Buildings 14 02243 g011aBuildings 14 02243 g011b
Figure 12. Deformation distributions of the transmission tower along structural height. (a) Transverse; (b) longitudinal.
Buildings 14 02243 g012
Figure 13. Tower top displacement. (a) Maximum displacement—PGA; (b) time–history curve of tower top displacement (PGA = 1.2 g).
Buildings 14 02243 g013
Figure 14. Member and segment damage development process (PGA = 0.7 g). (a) Member damage index; (b) segment damage index.
Buildings 14 02243 g014
Figure 15. Collapse process of a transmission tower structure.
Buildings 14 02243 g015
Figure 16. Axial force and strain time–history curves of the member. (a) Axial force time–history curve; (b) strain time–history curve.
Buildings 14 02243 g016
Figure 17. Process of segment damage development (PGA = 1.2 g).
Buildings 14 02243 g017
Table 1. Range of the damage index corresponding to different seismic damage levels.
Damage DegreeBasically IntactMinor DamageMedium DamageSerious DamageCollapse
Park [20]0~0.40.4~1.0≥1.0
Ou [21]0~0.10.1~0.250.25~0.450.45~0.65≥0.9
This paper0~0.20.2~0.40.4~0.60.6~0.8≥0.8
Table 2. Values of material constitutive model parameters.
σ y /MPa E 0 /MPa v ε ¯ p ε t h ε c r D c r D 0 α β
248 2.06 × 10 9 0.30.750.21.00.100.190.5
Table 3. Design information.
Defense IntensitySeismic Subgroup Site TypeSeismic GradeImportance Factor
8 (0.2 g)Group IIType IIGrade 21.0
Table 4. Segment damage index and segment displacement angle under different PGAs.
PGA0.2 g0.5 g0.7 g0.9 g1.2 g
SDI00.244860.526340.726150.82147
Transverse0.003020.005720.007670.023930.05985
Longitudinal0.003320.006760.011240.029180.06244
Disclaimer/Publisher’s Note: The statements, opinions and data contained in all publications are solely those of the individual author(s) and contributor(s) and not of MDPI and/or the editor(s). MDPI and/or the editor(s) disclaim responsibility for any injury to people or property resulting from any ideas, methods, instructions or products referred to in the content.

